Embed Size (px)
Citation preview

Research ArticleA Joint Optimization Model considering the Product Userrsquos RiskPreference for Supply System Disruption
Yang Song 12 Yan-Qiu Liu1 Qi Sun 34 Ming-Fei Chen 5 and Hai-Tao Xu 6
1School of Management Shenyang University of Technology Shenyang China2School of Economics and Management Liaoning Finance Vocational College Shenyang China3Antai College of Economics amp Management Shanghai Jiao Tong University Shanghai China4Zhejiang Ribon Intelligent Equipment Co Ltd Jiaxing China5SLZY(Shenyang) Hi-tech Co Ltd Shenyang China6Department of Electrical Engineering and Computer Science Cleveland State University Cleveland USA
Correspondence should be addressed to Yang Song fiona-syoutlookcom
Received 10 April 2021 Revised 28 September 2021 Accepted 23 October 2021 Published 12 November 2021
Academic Editor Mohammad Fattahi
Copyright copy 2021 Yang Song et al is is an open access article distributed under the Creative Commons Attribution Licensewhich permits unrestricted use distribution and reproduction in any medium provided the original work is properly cited
Logistics distribution is the terminal link that connects the manufacturer and product user and determines the efficiency of themanufacturerrsquos service erefore the disruption risk of the joint system is an essential factor affecting the product user ex-perience In this paper while considering the product userrsquos supply disruption risk preference (PUSDRP) a biobjective integernonlinear programming (INLP) model with subjective cost-utility is proposed to solve the manufacturerrsquos combined locationrouting inventory problem (CLRIP) According to the userrsquos time satisfaction requirement a routing change selection framework(RCSF) is designed based on the bounded rational behavior of the user Additionally the Lagrange Relaxation and ModifiedGenetic Algorithm (LR-MGA) is proposed e LR method relaxes the model and the MGA finds a compromise solution eexperimental results show that the biobjective cost-utility model proposed in this paper is effective and efficient e RCSF basedon user behavior is superior to the traditional expected utility theory model e compromise solution provides a better solutionfor the manufacturer order allocation delivery combinatorial optimization problem e compromise solution not only reducesthe manufacturerrsquos total operating cost but also improves the userrsquos subjective utility To improve the stability of cooperationbetween manufacturers and users the behavior decision-making method urges manufacturers to consider product usersrsquo supplydisruption risk preferences (PUSDRPs) in attempting to optimize economic benefits for the long term is paper uses behaviordecision-making methods to expand the ideas of the CLRIP joint system
1 Introduction
11 Background Many countries were hindered by theglobal COVID-19 pandemic Uncertainty leads to supplydisruption and cost increases thus further burdening theglobal supply chain e fourth wave Delta variant hascaused a backlog of orders and transportation delays inmany regions thereby creating new obstacles to the recoveryof the global supply chain e global circulation of rawmaterials parts and consumer goods is also threatenedFurther emergencies such as the natural disasters in Chinaand Germany in 2021 and the network attacks against majorports in South Africa led to more serious supply chain
disruptions and pushed the global supply chain to collapseAccording to the prediction of medical experts at home andabroad the end of the epidemic is basically impossible thisautumn Currently many countries and regions in the worldare facing a high risk of imported cases Countries havestrengthened epidemic prevention and control measuresincluding border controls curfews closures and strictcontrols of personnel flow thereby further stagnating in-ternational trade and disrupting the global supply chain
Supply chain disruption may lead to short-term oper-ation damage and enterprise profit decline which may leadto a sharp decline in market share or even the bankruptcy ofenterprises thereby irreparably damaging the long-term
HindawiMathematical Problems in EngineeringVolume 2021 Article ID 5081753 18 pageshttpsdoiorg10115520215081753
performance of enterprises [1ndash3] erefore the uncertainoptimization of supply chain networks has practical sig-nificance for enterprises
As the CLRIP integrates three levels namely strategymilitary and operation the CLRIP has been widely used tosolve the problem of supply chain integration optimization[4ndash7] Enterprises need more coordinated system networkswhen facing disruption and hope to resist disruption reducecosts and improve efficiency by optimizing strategies [8ndash10]erefore the joint optimization of location routing andinventory in discrete networks has become a hotspot forscholars and managers [11 12]
12Motivations First before COVID-19 supply chains hadnever been similarly tested in modern history Since thebeginning of 2020 port closures or delays have occurred inmany parts of the world and frequent extreme weather andchip and labor shortages have disrupted global supply chainsand affected industries rsquoOne shiprsquo is difficult to obtain andDHL predicts that global supply chain disruption maycontinue until 2022 Scholars and decision-makers hope torespond quickly to disruptions and reduce losses ereforemore attention is given to the uncertain optimization ofdiscrete networks It is hoped that the research results of thispaper can curb the further disruption of the supply chainand provide a reference for enterprises to make anti-disruption decisions
Second because of the epidemic KFC had no chickensto fry in 2021 Behind this are the shortages of slaughter-house workers and chicken stock caused by the shortage ofthe poultry supply throughout the year and the globalsupply chain is deeply affected
ird uncertain factors such as supply disruption haveaffected the experience of product users Product users alsopay more attention to alternative options when choosingproducts e bounded rationality and subjective behaviorof product users in uncertain environments is risk prefer-ence Consumersrsquo risk attitude affects the integrated opti-mization of enterprise location routing and inventoryerefore this paper attempts to use quantitative methods tomeasure risk preferences to help manufacturers find acompromise solution between minimizing economic in-vestment costs and maximizing product user utility
Finally product users want to obtain maximum satisfactionfrom products Manufacturers expect to obtain maximumbenefits from the investment Participants know that invest-ment is risky and are faced with balancing risks and benefitsHow should manufacturers and consumers make decisionse utility is the equilibrium point of the relationship betweenrisk and benefit and is the equilibrium index of risk and benefiterefore this paper uses a utility function to analyze productusersrsquo risk preferences to help manufacturers use the benefits ofa product user routing change selection framework to absorb orreduce the loss caused by disruption
13 Contribution First this paper finds that interruptionsand product usersrsquo risk preferences importantly affect theuncertainty optimization of discrete networks is paper
contributes to the cost-utility biobjective integer nonlinearprogramming model to accurately describe the integratedlocation routing inventory optimization problem in discretenetworks and quantify the subjective risk preference ofproduct users e model used in this paper helps manu-facturers predict the choice preference of product users fordisruption response schemes and optimize the biobjectivesof minimizing economic cost input and maximizing productuser utility Additionally the model can quantify morecomplex uncertainty scenarios (such as the transport ofhazardous or contaminated goods) especially for businessesthat need to consider user risk preferences
Second in this paper we find that the CLRIP consid-ering disruption and risk preference is NP-hard and evensmall-scale examples have difficulty finding exact solutionsis paper contributes an LR-MGA algorithm e LR al-gorithm relaxes the constraint conditions to simplify themodel and the MGA algorithm finds the compromise so-lution between the biobjective functions e example ex-periment proves the effectiveness and efficiency of the LR-MGA algorithm proposed in this paper e compromisesolution provides a better solution for the manufacturerCLRIP
ird this paper finds that an increase in customerexperience imposes higher requirements for supply chainefficiency is paper presents a routing change selectionframework that considers disruption and product user riskpreferences e framework helps manufacturers exploremore strategic and effective delivery schemes for productusers Additionally the behavior decision method used inthis paper extends the theoretical connotation of the un-certain optimization of discrete networks
14 Structure is paper is organized as follows Section 2reviews the literature and identifies the research gap Section3 describes the location routing inventory problem in dis-crete networks and provides the necessary definition of thecost-utility uncertainty optimization model for supply dis-ruption risk and product usersrsquo subjective risk preferenceis section describes a biobjective linear integer pro-gramming model with the objective function of minimizingthe total cost of the manufacturer and maximizing thesubjective utility of the product users Section 4 introducesthe implementation of the LR-MGA algorithm Section 5presents an example verification and comparative analysisBased on randomly generated examples a series of exper-iments and comparisons are completed to verify the effec-tiveness and efficiency of the LR-MGA algorithm Section 6gives the conclusions and insights
2 Literature Review
21 Subject Locking To accurately find the study focus andhotspot of research on the CLRIP under disruption risk thispaper uses CiteSpace visualization software to sort 1798pieces of literature based on the WoS database [13] Cite-Space draws a cluster network (in Figure 1) to determine thestudy focus Figure 1 reports that supply disruption
2 Mathematical Problems in Engineering
(clustering 0) is a study focus of research on the CLRIPunder disruption risk Figure 2 shows the color legendcorresponding to time CiteSpace draws a history of theappearance of the keyword ldquosupply disruptionrdquo from 1990 to2021 (Figure 3) Figure 3 shows that supply disruption isalways the critical factor of the CLRIP under disruption risk
CiteSpace analyzes the 1798 pieces of literature anddraws Figures 1ndash3 e data report shows that supply dis-ruption is the key influencing factor of CLRIP optimizationFigure 1 shows the study topic and hotspot of the CLRIPunder disruption risk Figure 3 dynamically shows thatsupply disruption has always fundamentally affected theCLRIP with respect to disruption risk
22LiteratureReview Disruption risk is the deviation of anysubsystem or parts (raw materials) from the original plan inmoving from the starting point to the demand point [14ndash17]Supply disruption analysis is of great practical significance tothe system decision of the CLRIP Scholars pay more at-tention to logistics disruption and supplier disruption[18 19] among which supplier disruption and trans-portation disruption caused by external environmentalfactors are the most serious [20 21] Some scholars con-sidered whether the supplier is regular or disrupted Supplydisruption is described as a fixed probability in a singleperiod and is abstracted as a continuous Markov process in amultiperiod Meyer first assumed that the demand andproduction capacity were determined and proposed theinventory production decision when the supply was dis-rupted [22] Tomlin designed a strategy of replacing in-ventory with capacity flexibility under supply disruption andcompared the disruption management strategies with andwithout capacity flexibility [23] Hishamuddin found thetransportation disruption caused by external environmental
factors designed a two-stage series production-inventoryrestoration model with a recovery time window determinedthe optimal order quantity and production quantity andgave the restoration plan for disruption to minimize the totalcost [24] Some results show that the optimal order quantityof each supplier can provide for the supply chain network oftwo suppliers and one manufacturer e production-in-ventory strategy is evaluated with supply disruption [25 26]Considering demand and supply disruption or demand andproduction disruption simultaneously some scholars havestudied supply chain resilience [27 28] Supply disruptionfundamentally affects the tactical level of decision-makingfor the CLRIP
Some scholars focus on stochastic supply disruptiondelayed orders rejected defective batches and the EOQmodel [29] Liu studied the CLRIP while considering astochastic supply disruption and the uncertainty of demandand replenishment lead times and addressed a two-phasemethod to solve the CLRIP by using queuing theory andintegrated model technology [30] To ensure the smoothoperation of the supply chain after a major disaster someenterprises adopt continuously holding emergency supplysources Chakraborty studied the supply chain network withtwo suppliers and a retailer the suppliers are subject to asupply disruption and the demand is stochastic Chakra-borty uses game theory to coordinate the impact of supplychain disruption and mitigation strategies of a retailer toimprove supply chain performance [31] External disruptionis one of the critical factors for the CLRIP Because of thehigh disruption risk and complex externalities of the fuel
Figure 1 Cluster network of the CLRIP under disruption risk
2011 2012 2013 2014 2015 2016 2017 2018 2019 2020
Figure 2 Color legend corresponding to time
Mathematical Problems in Engineering 3
transportation process Pourhejaz considered the routingdecision variables designed the biobjective CLRIP modelwith the minimax transportation time and total system costand adopted a modified M-O algorithm for the CLRIPmodel Research has found that the transportation timeminimax can reduce the external disruption risk in the fuellogistics and improve the sustainability of the supply chainnetwork [32] Tavana paid attention to major public crisisincidents emphasized the efficiency of the humanitarianlogistics network before and after disasters studied centralfacilities locations predisaster inventory decisions con-cerning perishable goods and postdisaster route planningfor rescue vehicles according to the particularity of distri-bution points and effectiveness of relief materials provided amixed-integer linear programming (MILP) model of theCLRIP and designed epsilon-constraint and NSGA-II al-gorithms for the CLRIPmodele gap analysis results showthat NSGA-II outperforms other algorithms in solvingsmall-scale examples and that RPBNSGA-II outperformsother algorithms in solving large-scale examples [5]
23 Literature Summary With the continuous improvementof product usersrsquo time satisfaction higher requirements areimposed for the efficiency of the CLRIPe study finds that thebounded rational behavior of product users fundamentallyaffects the decision-making concerning CLRIPs Consumer riskpreference is the primary reference variable of the CLRIP de-cision system [33] Scholars divide consumersrsquo purchase be-havior preferences after the disruption of stock into fivecategories switching merchants delaying purchasessubstituting products with different specifications of the samebrand switching brands and abandoning purchases all thesepreferences are collectively referred to as product usersrsquo supply
disruption risk preferences (PUSDRPs) [34] Product users areself-adaptive individuals e PUSDRP is a critical variable insupply chain network design Additionally the logical rela-tionship between product usersrsquo purchase behavior and supplyand demand fluctuation is also significant After a disruptionconsumers can perceive that retailers are out of stock epotential losses caused by distribution networksrsquo being out ofstock include the loss of brand sales and the loss of commoditysales [35 36] Scholars have found that both out-of-stock brandsand competitive brands will suffer losses due to supply chaindisruption [37 38] Some scholars pay attention to retailer out-of-stock disruption and study the retailerrsquos out-of-stock loss andthe change in consumersrsquo purchasing behavior after out-of-stock disruptions Some scholars pay attention to supplier out-of-stock disruptions and study how to retain consumers toreduce brand sales and commodity sales [39 40] Reichartfocused on the factor analysis of the impact of customersrsquo riskperformance on supply chain performance and thought thatsuch factor analysis needs a set of modeling and evaluationschemes suitable for large-scale complex networks [41]
Tables 1ndash3 reflect the problem characteristics directlyTable 2 compares the present and earlier related studiesabout the CLRIP under risk ere are some current studieson the product user risk preference for the CLRIP underdisruption risk (Table 3) however there are few quantitativeand subjective utility studies on user disruption risk pref-erence Few studies consider supply disruption and user riskpreference together
24 Research Gap First unlike the traditional integratedoptimization model this paper considers the deviation oftheory from practice Focusing on supply chain networkuncertainty and product user experience the manufacturerCLRIP integrated optimization with disruption probability
7
Term Supply Disruption burst=005 Save Plot to File Legend Fontsize 14
e Keyword Appeared in 60 Recordse History of Appearance
6
5
4
3
2
1
0
1990
1991
1992
1993
1994
1995
1996
1997
1998
1999
2000
2001
2002
2003
2004
2005
2006
2007
2008
2009
2010
2011
2012
2013
2014
2015
2016
2017
2018
2019
2020
2021
0
1 1 1 1 1 1 1 1 1 1 1 1 1 1 1
3
6
4
5
6
1
2 2
1 1
2 2
3
2
4
1
Figure 3 History of the appearance of the keyword ldquosupply disruptionrdquo
4 Mathematical Problems in Engineering
ensures that the delivery procedure can achievemanagementoptimization
Second unlike the existing combined network optimi-zation research our research divides the combined systeminto location routing and inventory according to the cir-culation link e network optimization problem is trans-formed into a traditional CLRIP problem which isconducive to the expansion of the method
ird unlike conventional uncertainty researchmethods this paper focuses on the subjective behaviorcharacteristics of product users and quantifies the riskpreference of product userse subjective utility function isused to evaluate the impact of risk attitude on discretenetwork optimization
Finally unlike the traditional expected utility theorymodel this paper considers the bounded rationality andsubjectivity of product users and proposes a routing changeselection framework for product users Compared to
traditional expected utility theory this framework is sig-nificantly better in evaluating utility value and preference
3 Problem Description andSymbol Explanation
31 AssumptionA joint network is composed of the manufacturer andproduct user Vc 1 2 j1113864 1113865
e number of VDC 1 2 i in the manufacturerwarehouse is limitede possible capacity levels for each warehouse areknowne manufacturer provides one or more than oneproduct typee manufacturer has the ability to ensure the quantityof product user orders through inventory control
Table 1 Summary of relevant studies about CLRIP under risk
Author MP DT MC LC Risk Object Model SMYing and Mingyao (2015) [42] mdash Deterministic mdash radic Stochastic disruption mdash MIP MetaheuristicZhao and Ke (2017) [43] mdash Deterministic mdash radic Stochastic disruption Bi-o MINLP TOPSISRayat et al (2017) [44] mdash Variable mdash mdash Stochastic disruption Bi-o MINLP MetaheuristicBozorgi and Ali (2017) [45] radic Stochastic radic radic Supply disruption Bi-o MINLP AMOSAPourhejazy et al (2019) [32] mdash Deterministic mdash mdash Stochastic disruption Muti-o MINLP MetaheuristicTavana et al (2018) [5] radic Stochastic radic radic Humanitarian supply chain Muti-o MILP RPBNSGA-IIVahdani 2017 [46] radic Variable radic radic Supply disruption Muti-o MIP MetaheuristicTomlin (2006) [23] mdash Variable mdash radic Supply disruption One-o Mip Tailored hybrid GAHishamuddin et al (2013) [24] radic Stochastic mdash radic Supply disruption One-o MILP Proposed heuristicLiu et al (2020) [30] mdash Uncertainties mdash radic Supply disruption One-o MILP GACurrent study radic Stochastic radic radic Supply disruption Bi-o MILP Proposed heuristicMP multiperiod DT demand type MC multicommodity LC limited capacity SM solution method
Table 2 Comparing the present study with earlier related studies
Author MP DT MC LC Risk Object Model SMRayat et al (2017) [44] mdash Variable mdash mdash Stochastic disruption Bi-o MINLP MetaheuristicPourhejazy et al (2019) [32] mdash Deterministic mdash mdash Stochastic disruption Muti-o MINLP MetaheuristicYing and Holweg (2015) [41] mdash Deterministic mdash radic Stochastic disruption mdash MIP MetaheuristicCurrent study radic Stochastic radic radic Supply disruption Bi-o MILP LR-MGAMP multiperiod DT demand type MC multicommodity LC limited capacity SM solution method
Table 3 A summary of relevant studies about CLRIP based on product user risk preference
Author QS SU Focus
Gruen et al (2008) [37] mdash mdash (i) To define risk preference(ii) To divide risk preference into five types
Apurba et al (2020) [33] radic mdash(i) To propose an NLIP model to integrate the LIP(ii) To locate the facility based on the customer risk preference(iii) To adopt a metaheuristic algorithm to solve the problem
Gruen (2002) [36] mdash mdash (i) To study the retail supply disruption(ii) To analyze the impact of the customer preference
Andreas and Holweg (2007) [41] mdash mdash (i) To focus on the factor analysis of risk preference on supply chain performance(ii) To find out factor analysis needs a set of models and evaluation scheme
Current study radic radic (i) To design the subject utility maximize object function(ii) To integrate the disruption probability to CLRIP model
QS quantitative study SU subjective utility
Mathematical Problems in Engineering 5
Each product user could be assigned to only onewarehouseEach vehicle has a maximum capacityEach vehicle could be assigned to only one routee manufacturerrsquos total cost includes fixed warehousecost fixed vehicle cost and the variable routing cost
32 Problem Description Manufacturers allocate and dis-tribute orders according to product user demand afterproduct users send order requests to the manufacturers Tomeet the demands of users manufacturers allocate theirproducts to warehouses near users in advance to enhance theflexibility of manufacturers to respond to user orders ispaper fully considers PUSDRPs to solve this problem fromthe perspective of manufacturers and optimizes the orderallocation and logistics distribution to maximize productuser utility and minimize operation costs e supply chainsystem is shown in Figure 4
Manufacturers face the antinomy problem when makinginventory decisions On the one hand manufacturer inventorydeployment which is usually 20ndash40 of the manufacturerrsquostotal assets is very expensive On the other hand becausewarehouse capacity is limited manufacturers do not haveunlimited inventory erefore in order allocations the orderdelivery time may be affected
When a product user places an order demand accordingto his or her own business activities the manufacturer al-locates the order that can meet the demand that is thedistribution warehouse is allocated and the routing is se-lected according to the product user order quantity For abatch of user orders accepted by the manufacturer we as-sume that the utility of the PUSDRP is closely related to thejoint system and the manufacturer can ensure the quantityof product user orders through inventory control Assumingthat the number of VDC 1 2 i in the manufacturerwarehouse is limited a joint system is composed of themanufacturer and product user Vc 1 2 j1113864 1113865
e problem to be solved in this paper is to optimize themanufacturer operating cost and product user utility in the jointsystem by considering the product user disruption risk pref-erenceemanufacturer distributes the products to customersby using i(1le ileK) warehouses When the manufacturermeets customer demand dj the transportation time fromwarehouse i to product user j directly affects the joint systemservicee direct utility of this process tomeet the product userdemand is recorded as eminusgi from manufacturer to warehouseProduct user indirect utility eminustij is generated when themanufacturer transports the product to user j Each selectedwarehouse i will indirectly give utility eminusei to the product user
33 Symbol Explanation e symbols variables and ob-jective functions used in this study are described in Tables4ndash7
34 Biobjective Model of the Joint CLRIP SystemIncreasing brand awareness is a great incentive for manu-facturers to obtain many user orders Additionally decision-
makers are also faced with the problem of order allocationand logistics distribution of the CLRIP for joint systems
e manufacturer distribution cost includes the fixedwarehouse cost the fixed vehicle cost and the variable trans-portation cost From the perspective of the demand objectives ofthe joint system the manufacturerrsquos operation cost and theproduct userrsquos subjective utility are expressed as two objectivefunctions which are the main design objectives of joint systemoptimization e purpose of this paper is to find the optimalwarehouse quantity allocate users to warehouses minimize thecost of opening warehouses and maximize user utility
Z1 Z1 min 1113944iisinVDC
fwiyi + 1113944hisinH
1113944iisinVDC
1113944jisinVC
fvhxhij + 1113944
iisinVDC
1113944jisinVC
cijxij
(1)
st 1113944hisinH
1113944iisinVDC
xhij 1 j isin VC (2)
1113944hisinH
1113944iisinVDC
xhij 1113944
hisinH1113944
iisinVDC
xhji j isin VC (3)
1113944jisinVC
xijqj le qiyi i isin VDC (4)
1113944iisinVDC
xij 1 j isin VC (5)
xhij + 1113944
hprimeisinHhprime ne h
1113944
iprimeisinVDCiprime ne i
xhprimeiiprime le 2 i isin VDC j isin VC ine j h isin H
(6)
1113944iisinVDC
1113944jisinVC
xhij lexij h isin H (7)
uhij ge 0 (i j) isin E h isin H (8)
xhij isin 0 1 (i j) isin E h isin H (9)
xij isin 0 1 i isin VDC j isin VC (10)
yi isin 0 1 i isin VDC (11)
1113944iisinVDC
fij minus 1113944iisinVDC
fji qj j isin VC (12)
fij leQhxhij i isin VDC j isin VC ine j (13)
fij le 1113944hisinH
Qh minus qj1113872 1113873xhij i isin VDC j isin VC (14)
fij ge qi 1113944hisinH
xhij i isin VDC j isin VC (15)
Function (1) is an object function z1 which represents thetotal minimization cost of the CLRIP system and the
6 Mathematical Problems in Engineering
manufacturerrsquos total cost includes the fixed warehouse cost thefixed vehicle cost and the variable routing cost
Constraint (2) ensures that each product user can only beassigned once Constraint (3) ensures that the departure of eachvehicle from each node is possible only after its entering themConstraint (4) ensures that the manufacturer warehouse fa-cilitiesrsquo service capacity is sufficient to meet the demands ofproduct users Constraints (5) and (10) ensure that each productuser accepts only one warehouse order allocation Constraints(6) and (7) are routing constraints Constraint (8) guarantees thetotal load limit of the vehicle Constrains (9)ndash(11) assign 0-1decision variables for users to open the warehouse Constraint(12) guarantees the warehouse capacity limit Constraint (13)guarantees the vehicle load does not exceed the vehicle capacitylimit Constraints (14) and (15) ensure that a load of the vehiclecan meet the orders of the product users
To simplify the joint system optimization problem in thispaper the vehicle problem in the distribution process is sim-plified Only the cost of serving all usersrsquo demands and theinherent cost of operating the warehouse are considered thelatter cost including the transportation and warehouse costs isa variable cost
e total costCij 1113936iisinVDC1113936jisinVC
cijxij + 1113936iisinVDCfwiyi from
warehouse i to userj where 1113936iisinVDC1113936jisinVC
cijxij is the totalvariable transportation cost and 1113936iisinVDC
fwiyi is the fixedwarehouse cost related to the process fromwarehouse i to userjTo simplify y object function Z1 into function (16)
Z1 min 1113944iisinVDC
1113944jisinVC
cijxij + 1113944iisinVDC
fwiyi (16)
Function (17) is the object function Z2 which representsthe maximization of user utility For the CLRIP under
disruption risk user utility which is essential is the mainoptimization objective of this paper1113936iisinVDC
1113936jisinVceminustijxij
represents the direct utility of transportation to meet thedemands of users and 1113936iisinVDC
(eminusgi + eminusei)yi represents theindirect utility of manufacturer to warehouse and warehouseto the user
Z2 max 1113944iisinVDC
1113944jisinVC
eminustijxij + 1113944iisinVDC
eminusgi + eminusei( 1113857yi (17)
st 1113944iisinVDC
xij 1 forallj isin VC
(18)
1113944jisinVC
djxij le qiyi foralli isin VDC (19)
1113944jisinVC
xij le niyi foralli isin VDC(20)
xij 1
01113896 i isin VDC j isin VC (21)
yi 1
01113896 i isin VDC (22)
Constraints (18) and (21) ensure that each user acceptsonly one warehouse order allocation Formulas (19) and (20)ensure that the manufacturer warehouse facilitiesrsquo servicecapacity is sufficient to meet the demands of product usersConstraints (21) and (22) assign 0-1 decision variables forusers to open warehouses
ManufacturerWarehouse
Product user
Product user
Product user
Warehouse
Product user
Product user
Product user
Warehouse
Product user
Product user
Product user
scheme R
scheme S
Warehouse
Figure 4 Product user service supply chain system based on the CLRIP
Mathematical Problems in Engineering 7
4 Algorithm Design
Many optimization problems become NP-hard problemsas the size of the problem increases e difficulty andscale of calculation increase as the number of data in-creases It is almost impossible to obtain the exact so-lution it can be obtained only by using exact algorithmsIn this paper a general biobjective INLP model whoseobjectives are minimum economic cost and maximumutility is proposed both objectives are difficult to attain
together even in small-scale networks To solve theproblem conveniently this paper improves the model anddesigns LR-MGA to approximate the objective function
41 Lagrange Relaxation Method of the Biobjective Modele LR method is a general technique that can be appliedto various combinatorial optimization problems to solvespecific constraints e main idea is to relax the Lagrangefactor by eliminating the problematic conditions or
Table 4 Set description
No Set Explanation1 J 1 2 Jmax z e number of users any user j isin J
2 K 1 2 Kmax e number of open warehouses any open warehouse k isin K
3 VDC 1 2 i e potential warehouse node4 VC 1 2 j1113864 1113865 Product user node5 H 1 2 Hmax e vehicle set any vehicle h isin H
6 E e1 e2 emax1113864 1113865 e set of arcs any arc e isin E
7 fij e total load of the vehicle driving on the arc (i j) isin E which is the set of variables uhij with respect to H
Table 5 Variable parameter description
No Variableparameter Explanation
8 qi e storage volume i isin VDC of warehouse i
9 ni e number of users served by warehouse i in one order cycle i isin VDC10 Qh e vehicle capacity11 fvh e fixed dispatching cost of the vehicle12 uh
ij e total load of vehicle access node i to node j
13 cij
e variable cost generated by the transportation process and warehouse operation process from warehouse i touser j
14 fwi e fixed cost incurred by warehouse i
15 dj e demand of user j
16 eminustij
Product user utility that is satisfied by transportation from warehouse i to user jwhen the demand is met dj
directly17 eminusgi Product user utility generated by the manufacture transport product to each warehouse directly18 eminusei Product user utility generated by the transport between each warehouse i and product user indirectly
Table 6 Decision variable description
No Decision variables Explanation19 xij 0 1 If the user order is assigned to warehouse xij 1 otherwise xij 020 yi 0 1 If the warehouse is open as 1 otherwise 021 xh
ij 0 1 If the vehicle travels from node i toj as 1 otherwise 0
Table 7 Objective function description
No Decision variables Explanation22 Z1 e objective function 123 Z2 e objective function 2
8 Mathematical Problems in Engineering
transforming the factor into a function of assigningweights Each weight represents a penalty factor that doesnot meet the specific conditions of the solution e morethe solutions violate the conditions the higher thepenalty coefficient In this paper we relax two capacityconstraints for a specific problem to ensure at least onefeasible solution
Step 1 relax two constraints (the number of cases andthe number of warehouses) the LR method is appliedto solve the warehouse location in manufacturer orderallocation to reduce the fixed cost caused by the openwarehousee following equation ensures the demandutility generated from transportation storage anddelivery
Min 1113944kisinVDCminusopen
1113944jisinVC
ckjxkj (23)
Max 1113944kisinVDCminusopen
1113944jisinVC
eminustkjxkj (24)
Equations (23) and (24) are subject to the followingconstraints
1113944kisinVDCminusopen
xkj 1 forallj isin VC(25)
1113944jisinVC
djxkj le qk forallk isin VDCminusopen (26)
1113944jisinVC
xkj le nk forallk isin VDCminusopen (27)
xkj 1
01113896 k isin VDCminusopen j isin VC (28)
Constraints (25) and (28) ensure that each user isassigned to only one warehouse and constraint (28)defines a binary decision variable Constraints (26) and(27) guarantee capacity boundary constraintse number of experimental cases in a single ware-house and the number of users that the manufacturercan servee number of cases and users defined by theLagrange factor in the model are as follows(λk ge 0) isin R(φk ge 0) isin Rforallk isin VDCminusopen
LR1 manufacturer cost minimization is function
Min 1113944kisinVDCminusopen
1113944jisinVC
ckjxkj + 1113944kisinVDCminusopen
λk 1113944jisinVC
djxkj minus qk⎛⎝ ⎞⎠
+ 1113944kisinVDCminusopen
φk 1113944jisinVC
xkj minus nk⎛⎝ ⎞⎠
(29)
LR2 user utility maximization is function
Max 1113944kisinVDCminusopen
1113944jisinVC
xkjeminustkj + 1113944kisinVDCminusopen
λk 1113944jisinVC
djxkj minus qk⎛⎝ ⎞⎠
+ 1113944kisinVDCminusopen
φk 1113944jisinVC
xkj minus nk⎛⎝ ⎞⎠
(30)
Both LR1 and LR2 are subject to the followinglimitations
1113944kisinVDCminusopen
xkj 1 forallj isin VC(31)
xkj 1
01113896 k isin VDCminusopen j isin VC (32)
Problems (29)ndash(32) can be decomposed into tworelaxed subproblems LR1 and LR2 For a givenmultiplier λk isin Rge 0 φk isin Rge 0 is the optimal lowerbound of the problem thus satisfying equations(29)ndash(32) To solve the following subproblem for eachuserforallj isin VC
LR1 minimize the total cost of the manufacturer asfunction
Min 1113944kisinVDCminusopen
xkj ckj + djλk + φk1113872 1113873(33)
LR2 maximize user utility as function
Max 1113944kisinVDCminusopen
xkj eminustkj + djλk + φk1113872 1113873(34)
Suppose the time step of LB(φtλt) is t e con-straints of LR1 and LR2 are as follows
1113944kisinVDCminusopen
xkj 1 forallj isin VC(35)
xkj 10
1113896 k isin VDCminusopen j isin VC (36)
LR1 and LR2 set the following auxiliary function
LB φtλt1113872 1113873 1113944
jisinVC
LBj φtλt1113872 1113873 minus 1113944
kisinVDCminusopen
λkqk minus 1113944kisinVDCminusopen
φknk
(37)
Step 2 updated Lagrange factor equations (38) and(39) can be applied to solve the minimum cost of eachuser order allocation We need to update the upperbound Lagrange factor formula and the lower boundconstraint is equation (37)At time t the distribution of the warehouse isupdated by
Mathematical Problems in Engineering 9
stk 1113944
jisinVC
xtkjdj minus qk (38)
rtk 1113944
jisinVC
xtkjdj minus nk (39)
e solution is obtained by the LR as equations (29) and(30) and constrained as equations (31) and (32)Step 21 Lagrange relaxation method for a singleproduct in this step we propose a Lagrange relaxationmethod for a single product In this method α is aconstant in the (0 2] interval and βt and ctare scalarcoefficients of the fitness function as equations (42) and(43) e updated Lagrange process starts with theLagrange factor of the population as being 0 Fromequations (40) and (41) we can find that the value of λk
increases with the increase in the number of ware-houses k and λk decreases if the warehouse causesexcessive cost disturbancest
k gt 0 indicates that thedemand exceeds the limit of warehouse capacity
λt+1k max 0 λt
k + βts
tk1113872 1113873 (40)
φt+1k max 0φt
k + ctr
tk1113872 1113873 (41)
βtα UB minus LB φtλt
1113872 11138731113872 1113873
1113936kisinVDCminusopens
tk1113872 1113873
2 (42)
ct
α UB minus LB φtλt
1113872 11138731113872 1113873
1113936kisinVDCminusopenr
tk1113872 1113873
2 (43)
Step 3 Lagrange relaxation method for multiproductlet (λp
k ge 0) isin R(φp
k ge 0) isin Rforallk isin VDCminusopen
LR1 minimize the total cost of the manufacturer asfunction
Min 1113944kisinVDCminusopen
1113944jisinVC
cp
kjxkj + 1113944kisinVDCminusopen
λp
k 1113944jisinVC
dp
j xkj minus qp
k⎛⎝ ⎞⎠
+ 1113944kisinVDCminusopen
φp
k 1113944jisinVC
xkj minus np
k⎛⎝ ⎞⎠
(44)
LR2 maximize the user utility as function
Max 1113944kisinVDCminusopen
1113944jisinVC
xkjepminustkj + 1113944
kisinVDCminusopen
λp
k 1113944jisinVC
dp
kxkj minus q
p
k⎛⎝ ⎞⎠
+ 1113944kisinVDCminusopen
φp
k 1113944jisinVC
xkj minus np
k⎛⎝ ⎞⎠
(45)
Constraints of LR1 and LR2 are
1113944kisinVDCminusopen
xkj 1 forallj isin VC(46)
xkj 10
1113896 k isin VDCminusopen j isin VC (47)
e problem constraints are relaxed and used to al-locate each customer order with the lowest cost toobtain the LB function To obtain an excellent updatedLagrange multiplier factor we need to determine anupper bound We will use a feasible solution based onthe product user warehouse allocation evaluationutility However the calculation of the lower bound ofallocation will likely result in some loss of accuracy incapacity calculation especially for a multiproductproblem To obtain the best upper bound (for examplethe lowest cost) we need to establish a good method forreallocating user orders when warehouse capacityoverflowsFor the order allocation problem of a single productthe allocation is based on the decreasing utility ofproduct user demand When the product user demandcapacity constraint violates the warehouse capacity theproduct user order is assigned to the next lowest costsolution However when multiple products are allo-cated each product has a certain demand utility foreach user and is constrained by the warehouse capacityerefore different solutions ensure the utility value ofuser satisfaction
42 Basic Design Idea of LR-MGA is paper designs abiobjective solving framework for the joint optimization oforder allocation and distribution problems e frameworkuses LR-MGA to generate a set of compromise solutionsduring order allocation and routing is phase determinesthe warehousersquos location-allocation strategy and routingplanning
To simplify the calculation the manufacturer uses the LRmethod to optimize the location allocation thereby ensuringonly the lowest essential economic cost and ignoring thesolution of each warehouse location e method is suitablefor users with biobjective allocation is paper extends theLagrange Relaxation Model in three aspects (1) by relaxingthe two capacity constraints (2) by evaluating the robustnessof each candidate location solution according to the man-ufacturer cost and user utility through optimal allocationand (3) by identifying a robust compromise solution forfacility location and then further exploring the possibility ofmultiobjective optimization e possible trends of com-promise solutions to joint optimization problems are shownin Figures 5ndash7
Figure 5 shows the process of decision-making equi-librium before the facility location and the trend chart of thecost target and utility target obtained by each decisionscheme When manufacturers consider the risk preferencefor disruption of the user supply system opening morewarehouses can significantly shorten the delivery time and
10 Mathematical Problems in Engineering
improve the subjective utility of users but the cost willincrease
e binary string in Figure 6 shows the opening andclosing of warehouse facilities (1 represents an open ware-house and 0 represents a closed warehouse) For examplestrings 1110011001 indicate that warehouse facilities 1 2 36 7 and 10 are open and that facilities 4 5 8 and 9 areclosede idea and process shown in Figures 5 and 6 jointlygenerate the compromise solution decision-making shownin Figure 7
Figure 7 shows that in biobjective optimization whenthe manufacturer achieves the optimal economic costproduct user allocation can be realized at is the man-ufacturer can obtain the range compromise solution at eachstage e purpose of this paper is to propose a multi-objective optimization method that enables manufacturersto explore a more strategic and effective distribution schemefor users according to the predetermined location ofwarehouse facilities
In this paper the genetic algorithm is used to solve ajoint optimization problem of a joint system considering the
PUSDRPe objective function is used as an index and theprocess is as follows
Step 1 select an open warehouse According to theconstraints the chromosome is divided into severalgene segments and each gene segment represents awarehouseStep 2 select product users to serve Assign the selectedusers to the warehouseStep 3 calculate the warehouse selection cost in theorder allocation processStep 4 calculate the transportation cost in the distri-bution processStep 5 calculate the joint total cost of order allocationand distribution
0B1
0B21110011001
1110111011
1010010001
Prod
uct u
serrsquos
util
ity
Manufacturers cost
Figure 5 e idea of the compromise solution
0B1
0B2 1110011001
Prod
uct u
serrsquos
util
ity
Manufacturers cost
Figure 6 e process of the compromise solution
Manufacturers cost
1110011001
1010010001
Prod
uct u
serrsquos
util
ity
1110111011
Figure 7 e compromise solution
2
1
65
3
4
Product User
Distribution Warehouse
Closed Warehouse
Figure 8 Solutions under cost-based allocation
Mathematical Problems in Engineering 11
In Figure 8 users are assigned to different warehousesafter an open warehouse combination is selected thusleading to a trend between manufacturer cost and userutility As shown in Figure 6 for example 111010 stands forwarehouses Nos 1ndash6 among which warehouses Nos 1 2 3and 5 are open From the perspective of minimizing themanufacturer cost as shown in Figure 8 the transportationcost caused by routing will decrease as much as possiblebased on the cost allocation e warehouse will distributeproducts to users according to the standard of a low routingcost as much as possible at the cost of prolonging the de-livery time of user orders and reducing utility
However based on the distribution of supply disruptionrisk preference as shown in Figure 9 considering thePUSDRP if the delivery time is reduced as much as possiblea warehouse with a short delivery time will select as much aspossible to improve product user utility but themanufacturing cost will increase
5 Discussion and Numerical Experiment
51 Analysis Process and Influencing Factors of RouteSelection In this paper we consider that warehouse allo-cation and route selection are closely related to order al-location in joint optimization which considers thedisruption risk preference of product users for joint systems
In logistics distribution the manufacturer cannot de-termine the perfect delivery time first due to the uncertaintyof the distribution network erefore delivery time isregarded as a random variable Product user delay timepreference will significantly affect product user subjectiveutility For a given path scheme there is a probability dis-tribution and the delivery time of users e manufacturerseeks a distribution scheme that meets product user pref-erences to improve product user utility Product user utilityis the joint utility expectation of maximizing order allocationand logistics distribution is paper proposes a joint op-timization idea that considers the disruption risk preferenceof the user supply system
52 Numerical Experiment Analysis
521 User Preferences e fundamental problem of userrouting risk preference is to choose the most desired routingsubjectively from two alternative routes R and Se specificsituation is divided into two hypotheses which are describedas Q1 and Q2 questionnaires (the investigators have theknowledge reserve and rational conditions and fully un-derstand the setting of the experiment scene) Generallywhen placing an order the interviewees must choose tworoutes R and S in the questionnaire and the delivery time ofeach route is the same e alternative path diagram isshown in Figure 10
Q1 the delivery time on both routes may be reduced dueto improved transportation conditions Let (t1 p t2 q)
represent that there is p possibility of saving t1 time whenthe order is fulfilled and there is q possibility of saving t2time when the order is fulfilled en there is a 1 minus p minus qpossibility that there is no decrease in the delivery time For
the interviewed users the selection of characteristic param-eters is shown in Table 8 In Table 8 disruption responsescheme sets are denoted as R and S under Q1 In set R (3050 50 10) means that there is a 50 possibility of de-creasing the delivery time by 30 when the order is fulfilled anda 10 possibility of decreasing the delivery time by 50 whenthe order is fulfilled en there is a 1 minus 50 minus 10 40possibility that there is no decrease in the delivery time
Q2 the delivery time on the two routes may increase due totraffic congestion Let (t1 p t2 q) represent that there is ap possibility of increasing t1 time when the order is fulfilledand there is a q possibility of increasing t2 time when theorder is fulfilled en there is a 1 minus p minus q possibility thatthere is no increase in the delivery time For the interviewedusers the selection of characteristic parameters is shown inTable 9 In Table 9 disruption response scheme sets are denotedas R and S underQ2 In set R (30 40 50 10) means thatthere is a 40 possibility of increasing the delivery time by 30when the order is fulfilled and there is a 10 possibility ofincreasing the delivery time by 50 when the order is fulfilleden there is a 1 minus 40 minus 10 50 possibility that there isno increase in the delivery time
2
1
65
3
4
Product User
Distribution Warehouse
Closed Warehouse
Figure 9 Solutions under preference-based allocation
R
S
Figure 10 e schematic diagram of alternate routes R and S
12 Mathematical Problems in Engineering
e estimated values based on the expected utility theoryare shown in Table 10 According to Tables 8 and 9 thecomprehensive parameter estimation statistics table for thetwo strategies is obtained When considering only the userrsquosrisk preference for disruption the utility value and theprobability that both strategies will be adopted show agradual change and the risk neutrality is a relatively bal-anced value
522 Parameter Estimation Based on Experimental DataParameter estimation is performed according to the pre-vious experimental data statistics on user preferences Forconvenience the following symbols are defined in thissection
(Δx+i pi) is the utility increased by probability pi be-
cause of Δx+i
(Δxminusminusi pminusi) is the utility loss obtained from the prob-
ability pminusi because of Δxminusminusi
U(R) 1113936ni1 φ(Δx+
i )π+(pi) + 1113936j0jminusmφ(Δxminus
j )πminus (pj)isthe expected value of the user utility-related charac-teristic parameter sequence (Δxminus
m pminusm
Δx+1 p1 Δx+
n pn) where Δxminusminusm le middot middot middot le 0leΔx+
1le middot middot middot leΔx+
n
R is the probability of choosing the disruption re-sponse scheme Rin test scenario i
U(Ri) is the utility of Rin scenario i
U(Si) is the utility of disruption response scheme S intest scenario i
P(Ri gt Si) 11 + exp(U(Si) minus U(Ri)) the probabilitythat R is more effective than S in scenario i
is paper can predict product user respondentsrsquopreference for a disruption response scheme selection by
using the values of the reevaluation parameters men-tioned above as shown in Table 11 e tuning param-eters are shown in Table 12
523 Sensitivity Analysis Table 11 shows a convergentestimation thus indicating that the reassessment pa-rameter values are more suitable for describing the choiceof the disruption response scheme of product usersHowever the estimation effect at τ 30 min is not asgood as that in Table 10 because the initial estimationparameters are obtained according to the expected utilitytheory and the estimation of expected utility is modifiedby considering past product user preferences
Based on the results of the strategy set we conduct asensitivity analysis To quantify from the perspective ofuser experience the two objective functions of themanufacturerrsquos economic cost and the warehousersquos orderallocation utility are considered at the same time as themain design objective function of optimization
According to Tables 8 and 9 the sample set is tested inthree situations e differences in total cost user utilityerror rate and running time of the comparison sample setused by LR GA and LR-MGA are shown in Table 13
As the complexity of the algorithm increases theoperation time increases and the error rate graduallydecreases as shown in Tables 14ndash16 In Table 11 theplanning cost increases with the increase in utility bututility increases slowly Table 15 shows that the planningcost increases with the increase in utility more quicklyHowever the planning cost shown in Table 16 increasesmost quickly with the increase in utility e differencesin cost efficiencies are well represented in different al-gorithmic complexities
Table 8 e routing risk preference of Question Q1
Disruption response scheme R Disruption response scheme S
Parameter setting Size Percentage Parameter setting Size Percentage1 (30 50 50 10) 258 047 (65 10 75 10) 585 0832 (30 50 50 30) 314 056 (65 10 75 15) 530 0763 (30 50 50 25) 243 044 (65 10 75 65) 600 0854 (30 50 50 35) 230 041 (65 10 75 35) 614 0885 (30 50 50 45) 237 042 (65 10 75 45) 606 0866 (30 50 50 55) 243 044 (65 10 75 55) 600 0857 (30 50 50 65) 261 047 (65 10 75 65) 582 0838 (30 50 50 75) 273 048 (65 10 75 75) 570 0829 (30 25 50 30) 282 050 (65 15 75 15) 561 08010 (30 45 50 30) 302 054 (65 35 75 15) 542 07711 (30 50 50 30) 290 051 (65 40 75 15) 554 07912 (30 55 50 30) 273 048 (65 45 75 15) 570 08213 (30 60 50 30) 266 047 (65 50 75 15) 578 08314 (30 65 50 30) 264 047 (65 55 75 15) 579 08315 (30 70 50 30) 245 044 (65 60 75 15) 599 08516 (30 7 5 50 30) 228 041 (65 65 75 15) 615 08817 (30 80 50 30) 195 035 (65 70 75 15) 648 09218 (30 85 50 30) 164 029 (65 75 75 15) 680 09719 (30 30 50 30) 290 051 (65 75 75 15) 554 07920 (30 35 50 30) 360 065 (65 65 75 15) 483 068
Mathematical Problems in Engineering 13
Table 9 e routing preference of Question Q2
Disruption response scheme R Disruption response scheme S
Parameter setting Size Percentage Parameter setting Size Percentage1 (30 40 50 10) 337 043 (65 10 75 10) 546 0832 (30 40 50 30) 410 052 (65 10 75 15) 494 0763 (30 40 50 25) 318 041 (65 10 75 65) 560 0854 (30 50 50 35) 300 038 (65 10 75 35) 573 0885 (30 50 50 45) 309 039 (65 10 75 45) 566 0866 (30 50 50 55) 318 041 (65 10 75 55) 560 0857 (30 50 50 65) 342 043 (65 10 75 65) 543 0838 (30 50 50 75) 357 045 (65 10 75 75) 532 0829 (30 25 50 30) 368 046 (65 15 75 15) 524 08010 (30 30 50 30) 378 048 (65 75 75 15) 517 07911 (30 35 50 30) 470 060 (65 65 75 15) 451 06812 (30 40 50 30) 430 055 (65 30 75 15) 480 07313 (30 45 50 30) 393 050 (65 35 75 15) 505 07714 (30 50 50 30) 378 048 (65 40 75 15) 517 07915 (30 55 50 30) 357 045 (65 45 75 15) 532 08216 (30 60 50 30) 347 043 (65 50 75 15) 539 08317 (30 65 50 30) 344 043 (65 55 75 15) 540 08318 (30 70 50 30) 319 041 (65 60 75 15) 559 08519 (30 75 50 30) 298 038 (65 65 75 15) 574 08820 (30 80 50 30) 255 032 (65 70 75 15) 605 092
Table 10 e parameter estimation
Utility function Relative risk aversionR S
Value Percentage Value PercentageU(y) eminus ay α 015 310914 3110 357323 8910U(y) eminus ay α 025 247423 3421 548765 6187U(y) eminus ay α 050 507413 5053 582742 5679U(y) y Risk neutral 420432 6734 694798 5578
Table 11 e R and S parameter estimation
τR S
Value Percentage Value Percentage30 287852 3232 617878 676860 210403 3966 379875 603490 210937 4461 315646 5589120 320453 4875 352976 5125
Table 12 Tuning parameters
VC 12 50VDC 12 8dj Usim[0 10000]eminusei Usim[0 1]ni Usim[0 60]qi Usim[0 200]eminusgi Usim[0 1]eminustij Usim[0 1]
14 Mathematical Problems in Engineering
6 Conclusion and Managerial Insights
61 Main Conclusions First supply disruption leads tosupply chain disruption To solve the problem that themanufacturer needs to provide satisfactory distributionoptions for product users under the interruption sce-nario this paper considered the interruption and sub-jective risk preference together to design the disruptionresponse strategy of the discrete network In this paperthe disruption probability is designed and the cost-utilitybiobjective integer nonlinear programming model isgiven to solve the CLRIP problem of manufacturing order
allocation and delivery is model quantified the sub-jective risk preference of product users Scenario 1 inTable 14 shows that the manufacturerrsquos planned costinput increases with the increase in product user utilitybut the increase in utility is slow Scenario 2 in Table 11shows that the planned cost input increases with theincrease in utility and the speed is faster Scenario 3 inTable 16 shows that the planning cost input increases withthe increase in utility and the speed is the fastest
Second the LR-MGA algorithm is proposed in this papere LR algorithm relaxes constraints to simplify the model andthe MGA algorithm finds the optimal solution for the CLRIP
Table 13 Test of algorithms
Situation 1 Situation 2 Situation 3LR radic times times
GA times radic times
LR-MGA radic radic radic
Table 14 e sensitivity of costs and utilities in Situation 1
Situation 1Cost ($) Utility Error () Time (s)1330 031 755 521191401 031 700 525861472 035 292 539471503 041 298 542261530 041 337 553481635 043 256 569201679 043 273 57475
Table 15 e sensitivity of costs and utilities in Situation 2
Situation 2Cost ($) Utility Error () Time (s)1305 031 694 563211481 038 660 571631493 045 634 583311514 051 639 545681529 059 569 569021678 065 504 569821732 068 418 56711
Table 16 e sensitivity of costs and utilities in Situation 3
Situation 3Cost ($) Utility Error () Time (s)1379 031 443 581371321 039 412 590211310 046 464 502481506 053 467 562971581 059 488 587471627 067 443 588321687 072 453 58547
Mathematical Problems in Engineering 15
is algorithm gives a compromise solution between costminimization and utility maximization Compromise solutionscan reduce the total cost of manufacturers and enhance thesubjective utility of product users Sensitivity analysis provesthat the algorithm is effective and efficient in solving discretenetwork integration optimization problems e computationtime and the error rate of the LR-MGA algorithm increase anddecrease respectively with the increase in experimentalcomplexity
ird to solve the problem that increasing customer sat-isfaction requires continuous optimization of supply chainefficiency this paper considers the bounded rationality andsubjectivity of product users and applies a behavioral decisionmethod to design a product user RCSF In Tables 8 and 9 theutility value and the probability that a strategy will be adoptedshow a gradual change trend and the risk neutrality is a rel-atively balanced value e proposed product user RCSF isobviously superior to the traditional expected utility theorymodel e behavior decision method is used to solve theCLRIP integrated optimization problem which expands thetheoretical connotation of uncertain optimization of discretenetworks
62 Managerial Insights Based on the above conclusionsour research has many management insights into applica-tion scenarios Our models and methods can providemanagers with solutions
First to improve the stability of business cooperationbetween manufacturers and users manufacturers willconsider PUSDRPs as much as possible in terms of the long-term economic benefits and on the premise of optimizingthese benefits
Second the biobjective model of the joint CLRIP systemcan be used to quantify many uncertain practical scenarios(such as the transportation of dangerous goods and pol-lutants) especially for businesses with different user riskpreferences
ird the application of algorithms in the CLRIP modelcan help companies transform decision-making from hu-manization to informationization To solve this problemthis paper focuses on constructing a general solutionframework which needs to be extended to a specific practice
In the future it will be valuable to design more so-phisticated algorithms to find order allocation schemes forusers with different risk preferences e IoTand blockchainhave facilitated further exploration into user preferences
Data Availability
All data generated or analyzed during this study are in-cluded in this article e Jd warehouse logistics pricexlsxdata used to support the findings of this study havebeen deposited in the Baidu (httpspanbaiducoms1fz4M0Bjc8KJkPFSTgRXe0A(password pm0t)) repository
Conflicts of Interest
e authors declare that there are no conflicts of interestregarding the publication of this study
Acknowledgments
is work was partly supported by the National NaturalScience Foundation of China (Project no 70431003) theScience-Technology Major Project of Liaoning ProvinceChina (Project no 2019JH110100028) the Talent Projectof Revitalizing Liaoning (Project no XLYC1808044) theScientific Research Foundation Program of the Educa-tional Department of Liaoning Province China (Projectno JYT2019-02) the Major Research and DevelopmentPlan Project of Jiaxing China (Project no 2021BZ20001)and the Science-Technology Planning Project of ShenfuReform and Innovation Demonstration Zone of LiaoningProvince China (Project no 2020JH19)
References
[1] K Govindan M Fattahi and E Keyvanshokooh ldquoSupplychain network design under uncertainty a comprehensivereview and future research directionsrdquo European Journal ofOperational Research vol 263 2017
[2] A Hiassat A Diabat and I Rahwan ldquoA genetic algorithmapproach for location-inventory-routing problem with per-ishable productsrdquo Journal of Manufacturing Systems vol 42no 1 pp 93ndash103 2017
[3] S Tong ldquoContract coordination in dual sourcing supply chainunder supply disruption riskrdquo Mathematical Problems inEngineering vol 2015 Article ID 473212 10 pages 2015
[4] M Biuki A Kazemi and A Alinezhad ldquoAn integrated lo-cation-routing-inventory model for sustainable design of aperishable products supply chain networkrdquo Journal of CleanerProduction vol 260 no 7 p 120842 2020
[5] M Tavana A-R Abtahi D Di Caprio R Hashemi andR Yousefi-Zenouz ldquoAn integrated location-inventory-rout-ing humanitarian supply chain network with pre- and post-disaster management considerationsrdquo Socio-Economic Plan-ning Sciences vol 64 no 12 pp 21ndash37 2018
[6] M F Chen Y Q Liu and Y Song ldquoA contract coordinationmodel of dual-channel delivery between UAVs and couriersconsidering the uncertainty of delivery for last milerdquo DiscreteDynamics in Nature and Society vol 2019 2019
[7] M F Chen Y Q Liu and Y Song ldquoMultimodal transportnetwork optimization considering safety stock under real-time informationrdquo Discrete Dynamics in Nature and Societyvol 2019 2019
[8] Z Rafie-Majd S H R Pasandideh and B Naderi ldquoModellingand solving the integrated inventory-location-routing prob-lem in a multi-period and multi-perishable product supplychain with uncertainty Lagrangian relaxation algorithmrdquoComputers amp Chemical Engineering vol 109 no 1 pp 9ndash222018
[9] S Ji and Q Sun ldquoLow-carbon planning and design in BampRlogistics service a case study of an E-commerce big dataplatform in Chinardquo Sustainability vol 9 no 11 p 2052 2017
[10] MMohammad E Sadoullah and V Behnam ldquoA bi-objectivemathematical model for inventory-distribution-routingproblem under risk pooling effect robust Meta-Heuristicsapproachrdquo Economic Computation and Economic CyberneticsStudies and ResearchAcademy of Economic Studies vol 52no 4 pp 257ndash274 2018
[11] P Karakostas A Sifaleras and M C Georgiadis ldquoAdaptivevariable neighborhood search solution methods for the fleetsize and mix pollution location-inventory-routing problemrdquo
16 Mathematical Problems in Engineering
Expert Systems with Applications vol 153 no 9 p 1134442020
[12] L Kechmane B Nsiri and A Baalal ldquoOptimization of a Two-Echelon location Lot-Sizing routing problem with deter-ministic demandrdquo Mathematical Problems in Engineeringvol 2018 no 7 12 pages Article ID 2745437 2018
[13] C Chen ldquoCiteSpace II detecting and visualizing emergingtrends and transient patterns in scientific literaturerdquo Journalof the American Society for Information Science and Tech-nology vol 57 no 3 pp 359ndash377 2006
[14] T Bier A Lange and C H Glock ldquoMethods for mitigatingdisruptions in complex supply chain structures a systematicliterature reviewrdquo International Journal of Production Re-search vol 58 no 6 pp 1835ndash1856 2020
[15] S Xu X Zhang L Feng and W Yang ldquoDisruption risks insupply chain management a literature review based onbibliometric analysisrdquo International Journal of ProductionResearch vol 58 no 11 pp 3508ndash3526 2020
[16] Y Song and Y Q Liu ldquoUncertain optimization of discretesupply networks with order delivery disruption and riskpreference in the postepidemic erardquo Discrete Dynamics inNature and Society vol 2021 Article ID 1910611 14 pages2021
[17] Q Sun L Jiang and H Xu ldquoExpectation-maximizationAlgorithm of Gaussian Mixture Model for Vehicle-Com-modity Matching in Logistics Supply chainrdquo Complexityvol 2021 Article ID 9305890 11 pages 2021
[18] H Huang Y He and D Li ldquoCoordination of pricing in-ventory and production reliability decisions in deterioratingproduct supply chainsrdquo International Journal of ProductionResearch vol 56 no 18 pp 6201ndash6224 2018
[19] Q Sun L Jiang and H Xu ldquoA Double-Layer CombinationAlgorithm for Real-Time Information-Sharing NetworkDesign Problemrdquo Complexity vol 2021 Article ID 485659318 pages 2021
[20] A Kinra D Ivanov A Das and A Dolgui ldquoRipple effectquantification by supplier risk exposure assessmentrdquo Inter-national Journal of Production Research vol 58 no 18pp 5559ndash5578 2020
[21] S Hosseini D Ivanov and A Dolgui ldquoRipple effect mod-elling of supplier disruption integrated Markov chain anddynamic bayesian network approachrdquo International Journalof Production Research vol 58 no 11 pp 3284ndash3303 2020
[22] R R Meyer M H Rothkopf and S A Smith ldquoReliability andinventory in a production-storage systemrdquo ManagementScience vol 25 no 8 pp 799ndash807 1979
[23] B Tomlin ldquoOn the value of mitigation and contingencystrategies for managing supply chain disruption risksrdquoManagement Science vol 52 no 5 pp 639ndash657 2006
[24] H Hishamuddin R A Sarker and D Essam ldquoA recoverymodel for a two-echelon serial supply chain with consider-ation of transportation disruptionrdquo Computers amp IndustrialEngineering vol 64 no 2 pp 552ndash561 2013
[25] Z Li S H Xu and J Hayya ldquoA periodic-review inventorysystem with supply interruptionsrdquo Probability in the Engi-neering and Informational Sciences vol 18 no 1 pp 33ndash532004
[26] A R Akella ldquoDiversification under supply uncertaintyrdquoManagement Science vol 39 no 8 pp 944ndash963 1993
[27] A Beheshtian K P Donaghy R R Geddes andO M Rouhani ldquoPlanning resilient motor-fuel supply chainrdquoInternational Journal of Disaster Risk Reduction vol 24 no 9pp 312ndash325 2017
[28] B C Giri and S Bardhan ldquoCoordinating a supply chain underuncertain demand and random yield in presence of supplydisruptionrdquo International Journal of Production Researchvol 53 no 16 pp 5070ndash5084 2015
[29] K Skouri I Konstantaras A G Lagodimos andS Papachristos ldquoAn EOQ model with backorders and re-jection of defective supply batchesrdquo International Journal ofProduction Economics vol 155 no 9 pp 148ndash154 2014
[30] Y Liu E Dehghani M S Jabalameli A Diabat and C-C LuldquoA coordinated location-inventory problem with supplydisruptions a two-phase queuing theory-optimization modelapproachrdquo Computers amp Industrial Engineering vol 142no 4 p 106326 2020
[31] T Chakraborty S S Chauhan M Ouhimmou andM Ouhimmou ldquoMitigating supply disruption with a backupsupplier under uncertain demand competition vs coopera-tionrdquo International Journal of Production Research vol 58no 12 pp 3618ndash3649 2020
[32] P Pourhejazy O K Kwon and H Lim ldquoIntegratingsustainability into the optimization of fuel logistics net-worksrdquo KSCE Journal of Civil Engineering vol 23 no 3pp 1369ndash1383 2019
[33] A K Saha A Paul A Azeem and S K Paul ldquoMitigatingpartial-disruption risk a joint facility location and inventorymodel considering customersrsquo preferences and the role ofsubstitute products and backorder offersrdquo Computers ampOperations Research vol 117 no 5 p 104884 2020
[34] TW Gruen and D CorstenA Comprehensive Guide to RetailOut-Of-Stock Reduction in the Fast-Moving Consumer Goodsindustry Grocery Manufacturers of America WashingtonNJ USA 2008
[35] P B Schary and M Christopher ldquoe anatomy of a stock-outrdquo Journal of Retailing vol 55 no 2 pp 59ndash70 1979
[36] J Gavan ldquoFitzsimons Consumer response to stockoutsrdquoJournal of Consumer Research vol 27 no 2 pp 249ndash2662000
[37] T W Gruen D Corsten and S Bharadwaj Retail Out ofStocksA Worldwide Examination of Causes Rates andConsumer responses Grocery Manufacturers of AmericaWashington NJ USA 2002
[38] Q Sun W-G Che and H-L Wang Bayesian RegularizationBP Neural Network Model for the Stock Price PredictionSpringer Berlin Germany 2014
[39] E T Anderson G J Fitzsimons and D Simester ldquoMeasuringand mitigating the costs of stockoutsrdquo Management Sciencevol 52 no 11 pp 1751ndash1763 2006
[40] D Yan Y Yao and K Xu ldquoDesigning Supply Chain Back-order Contracts for Customer Retentionrdquo Working Papers2008
[41] A Reichhart and M Holweg ldquoCreating the customer-re-sponsive supply chain a reconciliation of conceptsrdquo Inter-national Journal of Operations amp Production Managementvol 27 no 11 pp 1144ndash1172 2007
[42] Z Ying and Q Mingyao ldquoA Metaheuristic Approach to theReliable Location Routing Problem under disruptionsrdquoTransportation Research Part E Logistics amp TransportationReview vol 83 2015
[43] J Zhao and G Y Ke ldquoIncorporating inventory risks in lo-cation-routing models for explosive waste managementrdquoInternational Journal of Production Economics vol 193 2017
[44] F Rayat M Musavi and A Bozorgi-Amiri ldquoBi-objectivereliable location-inventory-routing problem with partialbackordering under disruption risks a modified AMOSA
Mathematical Problems in Engineering 17
approachrdquo Applied Soft Computing vol 59 pp 622ndash6432017
[45] M Bozorgi-Amiri andM Ali ldquoBi-objective Reliable Location-Inventory-Routing Problem with Partial Backordering underDisruption Risks A Modified AMOSA approachrdquo AppliedSoft Computing vol 59 2017
[46] B Vahdani D Veysmoradi and F Noori ldquoTwo-stage multi-objective location-routing-inventory model for humanitarianlogistics network design under uncertaintyrdquo InternationalJournal of Disaster Risk Reduction vol 27 2017
18 Mathematical Problems in Engineering
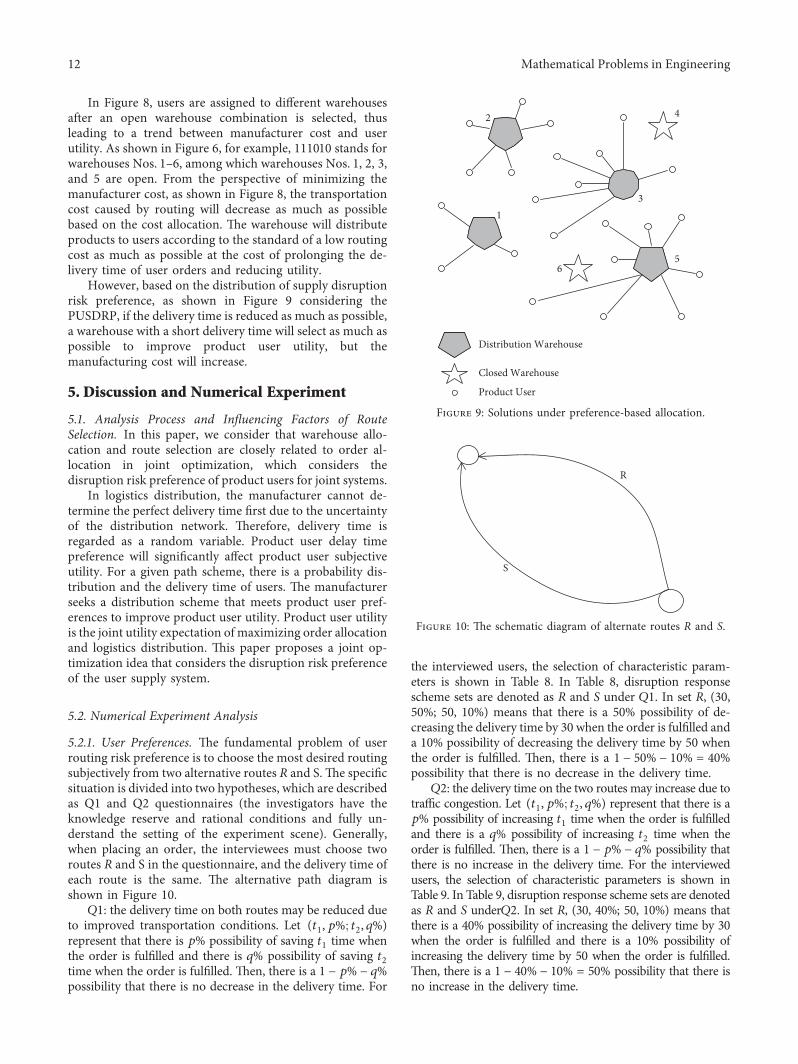