Embed Size (px)
Citation preview
American Institute of Aeronautics and Astronautics
1
A Hybrid Airfoil Design Method for Icing Wind Tunnel
Tests
Gustavo E. C. Fujiwara1, Brian S. Woodard
2, Brock D. Wiberg
3, Andrew J. Mortonson
4, and Michael B. Bragg
5.
University of Illinois at Urbana-Champaign, Urbana, Illinois 61801, USA
Modern commercial aircraft wings are far too large to be tested full-scale in existing icing
wind tunnels and ice accretion scaling methods are not practical for large scale factors. Thus
the use of hybrid scaling techniques, maintaining full-scale leading-edges and redesigned aft
sections, is an attractive option for generating full-scale leading-edge ice accretions. The
advantage lies in utilizing reduced chord models that minimize blockage effects in the icing
tunnels. The present work discusses the design of hybrid airfoils with large scale factors that
match the ice shapes of the full-scale airfoils predicted by LEWICE. Assessments of the
effects of scale factor, extent of the full-scale leading-edge, nose droop angle, zero-angle of
attack pitching moment coefficient (Cm0), and droplet size are also presented. Hybrid or
truncated airfoils are shown to produce ice shapes accurately, even at angles of attack
different from the design angle of attack with the proper application of either flap, adjusted
test angle of attack, or both. Further results suggest that hybrid circulation does not need to
match full-scale circulation in order to match ice shapes, resulting in decreased loading for
higher scale factor hybrid airfoils. Matching the flowfield around the hybrid airfoil to the
full-scale flowfield provided a superior method for predicting ice shape agreement,
stagnation point location being a first order and suction peak magnitude a second order
parameter. This goal can be accomplished by varying the aft geometry, through Cm0 and
nose droop angle.
Nomenclature
α = Airfoil Angle of Attack
αD = Hybrid Design Angle of Attack
β = Collection Efficiency
βmax = Maximum Collection Efficiency
c0 = Reference Chord (Full-scale)
cfs = Full-scale Chord
chyb = Hybrid Airfoil Chord
Cp = Pressure Coefficient
Cl = Lift Coefficient
Cm0 = Zero-Angle of Attack Pitching Moment Coefficient
CRM = Common Research Model
CRM65 = 65% Scaled Common Research Model
δf = Flap Deflection, Positive Down
= Airfoil Circulation
= Non-Dimensional Airfoil Circulation
h/c = Tunnel height over model chord
η = Wing Spanwise Position
L = Lift on Body
LE = Leading edge
1 Graduate Research Assistant, Department of Aerospace Engineering, Member AIAA.
2 Post Doctoral Researcher, Department of Aerospace Engineering, Member AIAA.
3 Graduate Research Assistant, Department of Aerospace Engineering, Member AIAA.
4 Graduate Research Assistant, Department of Aerospace Engineering, currently Rolls Royce, IN, Member AIAA.
5 Interim Dean, College of Engineering and Professor of Aerospace Engineering, Fellow AIAA.
Dow
nloa
ded
by U
NIV
ER
SIT
Y O
F IL
LIN
OIS
on
Aug
ust 1
4, 2
013
| http
://ar
c.ai
aa.o
rg |
DO
I: 1
0.25
14/6
.201
3-28
26
5th AIAA Atmospheric and Space Environments Conference
June 24-27, 2013, San Diego, CA
AIAA 2013-2826
Copyright © 2013 by Gustavo Eidji Camarinha Fujiwara, Brian Woodard, Brock Wiberg, Andrew Mortonson, Michael Bragg. Published by the American Institute of Aeronautics and Astronautics, Inc., with permission.
American Institute of Aeronautics and Astronautics
2
LWC = Liquid Water Content
MVD = Median Volume Diameter of Droplets
RANS = Reynolds-averaged Navier-Stokes equations
SF = Scale Factor (full-scale chord divided by hybrid chord)
s/c0 = Normalized Surface Length Coordinate
SST = Shear Stress Transport
T = Freestream Temperature
TE = Trailing edge
U∞ = Freestream Velocity
x = Horizontal Coordinate
x/c0 = Normalized Horizontal Coordinate
y = Vertical Coordinate
y/c0 = Normalized Vertical Coordinate
y+
= Dimensionless Wall Distance
I. Introduction
IRCRAFT icing has been an ongoing topic of research in air transportation safety since at least the 1930s. With
the development of computational fluid dynamics (CFD) in the 1970s came an opportunity for a deeper
understanding of flowfields with ice accretions.1 Two-dimensional airfoil ice shapes have been studied and
characterized, but the ice shapes on three-dimensional wings and their aerodynamic effects are not fully understood,
especially for wings with significant taper and sweep such as those encountered on modern commercial airliners.
The certification of commercial aircraft by the FAA, under the Icing Design Envelopes2 of 14 CFR Parts 25 and
29 Appendix C, requires in-flight testing of the icing protection systems. This is a difficult task due to the challenge
and expense of finding the appropriate atmospheric and icing cloud conditions, resulting in further support of CFD
to aid in the design and analysis of ice protection systems. Nevertheless, computational models alone are not
sufficient for understanding this problem, and icing wind tunnel testing is required especially when detailed ice
shape geometries are required. However, full-scale modern wings are far too large to be tested in the existing icing
wind tunnels. Simple geometric scaling of the wing model to fit in the icing tunnel and the application of existing ice
accretion scaling methods applies only to moderate size models and scale factors and is bounded by the available
tunnel speeds and droplet sizes.3 Thus, an alternative and attractive method for reproducing accurate full-scale
leading-edge ice shapes for large wings in existing icing tunnels is the use of hybrid (or truncated) airfoil models
that have full-scale leading-edges with redesigned aft sections. This process provides icing models with much
shorter chords, which reduce tunnel blockage effects while still maintaining droplet impingement characteristics and
ice accretion representative of the full-scale wing.
Research on truncated airfoils began in the 1950s, maintaining a portion of the full-scale airfoil leading-edge
geometry and adding a simple fairing or flap to the back. Ice shapes generated on these truncated designs were
shown to match those produced by the full-scale airfoils.4 The hybrid design method was developed in 1997 by
Saeed, Selig and Bragg5 to systematically design the hybrid airfoils for this purpose. This design process was well-
documented both computationally and experimentally for hybrid scale factors up to two by Saeed et al,5 and
computational studies of hybrid designs with scale factors greater than two were first documented by Mortonson.6
The present work is part of a bigger research program that includes experimental and computational studies of
3D swept wings with ice accretions involving NASA, Boeing, and the FAA.7 Thus, the full-scale airfoils used as a
baseline for the design of the hybrid airfoils are from the 65% scale Common Research Model (CRM), referred to as
the CRM65 in the remainder of this paper. The CRM was designed by engineers at Boeing and NASA8
to represent
a typical modern wide-body commercial transport with both computational and experimental data publicly available.
It has been tested in the NASA Ames 11-ft wind tunnel as well as the National Transonic Facility.9 The CRM was
designed for a cruise Mach number of 0.85 at a Reynolds number of 40 million. It has an aspect ratio of 9.0, a taper
ratio of 0.275, and a washout of 8.2 degrees from the side of body to wing tip.8 The CRM65 has a span of 125.3 ft, a
chord of 25.4 ft at the side of body, and a chord of 5.82 ft at the wing tip. The mean aerodynamic chord is 14.94 ft,
and the wing area is 1,745 ft2. The wing is swept 35° at quarter-chord and is tapered with a Yehudi break at 37% of
the span.
A
Dow
nloa
ded
by U
NIV
ER
SIT
Y O
F IL
LIN
OIS
on
Aug
ust 1
4, 2
013
| http
://ar
c.ai
aa.o
rg |
DO
I: 1
0.25
14/6
.201
3-28
26
Copyright © 2013 by Gustavo Eidji Camarinha Fujiwara, Brian Woodard, Brock Wiberg, Andrew Mortonson, Michael Bragg. Published by the American Institute of Aeronautics and Astronautics, Inc., with permission.
American Institute of Aeronautics and Astronautics
3
II. Design Method
Hybrid Airfoil Design
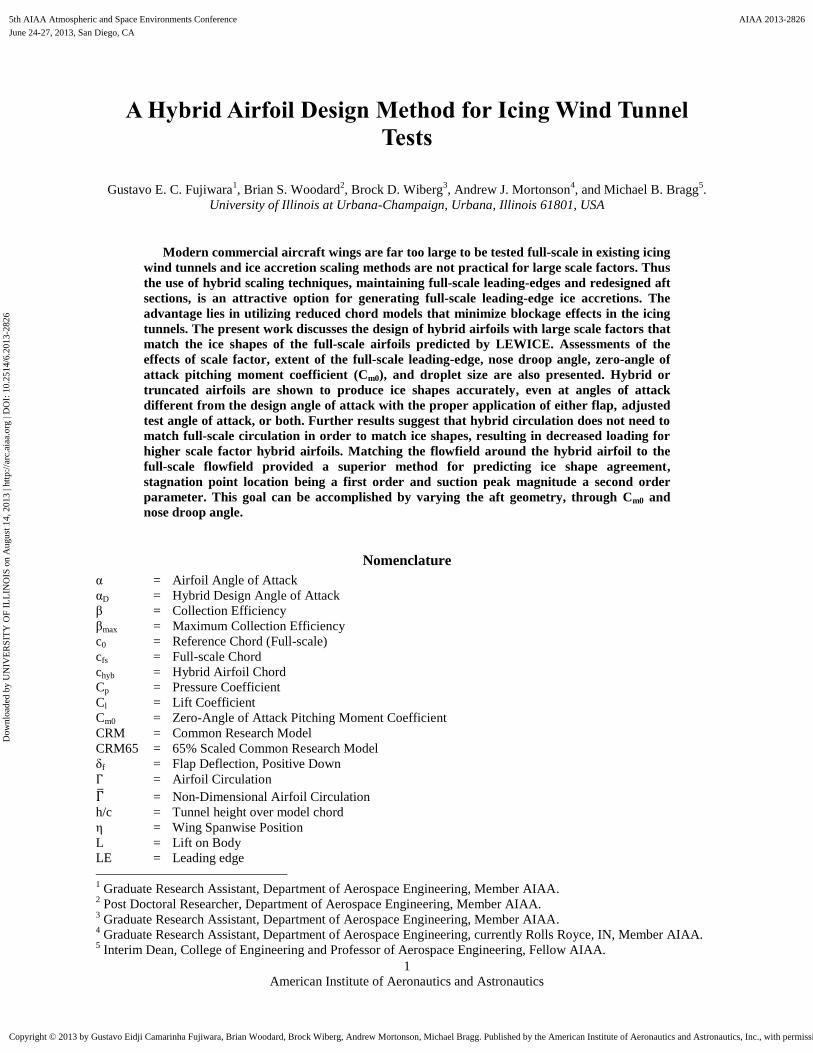
PROFOIL, a multipoint inverse design code, developed by Selig10
when used in this application allows for the
control of the main design of the hybrid airfoil through three geometrical parameters: hybrid scale factor (SF),
defined as the full-scale chord divided by the hybrid chord, and upper and lower leading-edge extents. An example
of a hybrid airfoil with 10% lower and 5% upper leading-edge extent, and a scale factor of 2 is shown in Fig. 1.
Figure 1. Geometric input variables for the hybrid airfoil design
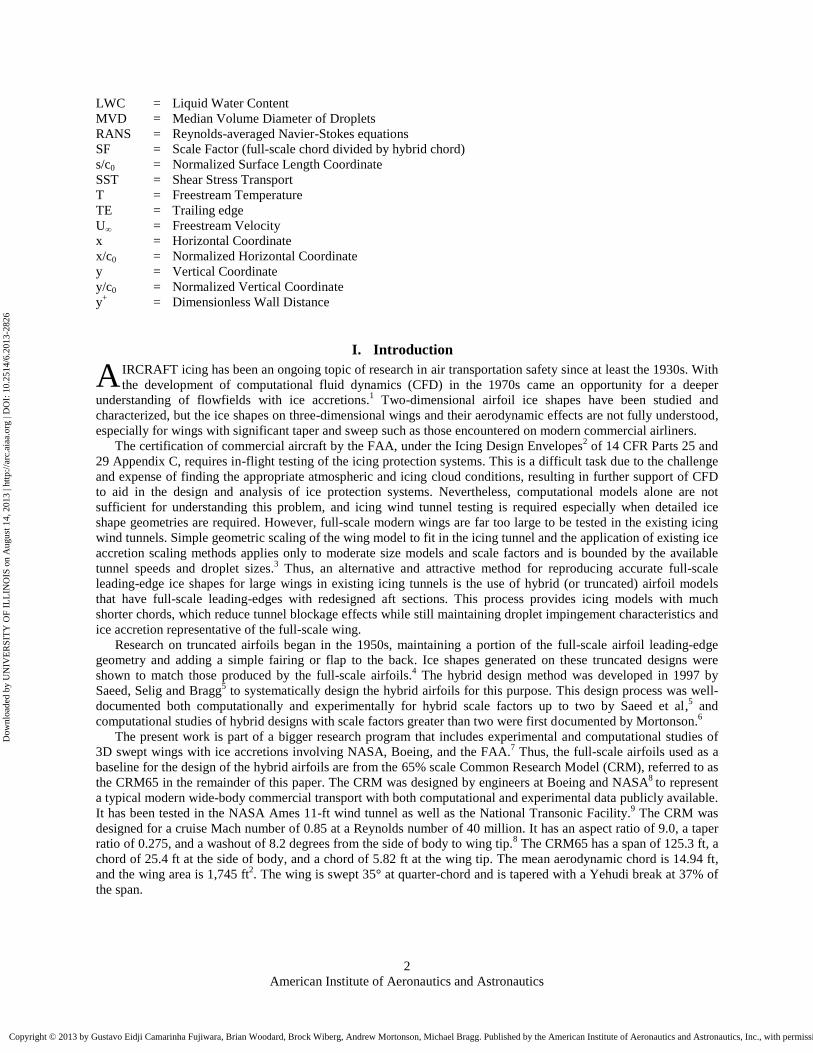
Two additional design variables determine the aft section geometry: nose droop angle and zero-angle of attack
pitching moment coefficient (Cm0). The nose droop is the angle of the full-scale airfoil nose with respect to the
modified aft section, which affects the camber distribution by changing the height of the trailing-edge relative to the
leading-edge. Its values are generally between -6° and +6°, such that positive angles lead to a higher trailing-edge
position. The Cm0 controls the mean camber line curvature of the aft section without moving the location of the
trailing-edge. It is generally between 0 and -0.5, such that the more negative the value, the more curvature it adds to
the airfoil. Both parameters are illustrated in Fig. 2.
Figure 2. Geometric effect of nose droop angle and Cm0
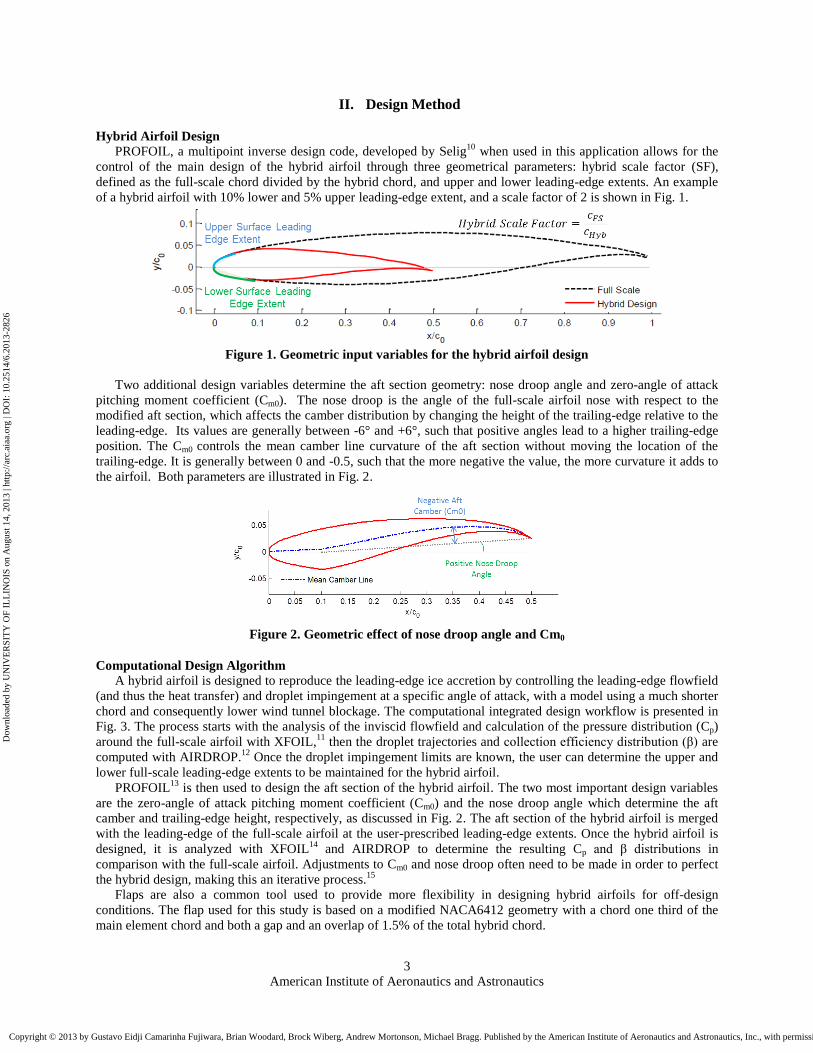
Computational Design Algorithm
A hybrid airfoil is designed to reproduce the leading-edge ice accretion by controlling the leading-edge flowfield
(and thus the heat transfer) and droplet impingement at a specific angle of attack, with a model using a much shorter
chord and consequently lower wind tunnel blockage. The computational integrated design workflow is presented in
Fig. 3. The process starts with the analysis of the inviscid flowfield and calculation of the pressure distribution (Cp)
around the full-scale airfoil with XFOIL,11
then the droplet trajectories and collection efficiency distribution (β) are
computed with AIRDROP.12
Once the droplet impingement limits are known, the user can determine the upper and
lower full-scale leading-edge extents to be maintained for the hybrid airfoil.
PROFOIL13
is then used to design the aft section of the hybrid airfoil. The two most important design variables
are the zero-angle of attack pitching moment coefficient (Cm0) and the nose droop angle which determine the aft
camber and trailing-edge height, respectively, as discussed in Fig. 2. The aft section of the hybrid airfoil is merged
with the leading-edge of the full-scale airfoil at the user-prescribed leading-edge extents. Once the hybrid airfoil is
designed, it is analyzed with XFOIL14
and AIRDROP to determine the resulting Cp and β distributions in
comparison with the full-scale airfoil. Adjustments to Cm0 and nose droop often need to be made in order to perfect
the hybrid design, making this an iterative process.15
Flaps are also a common tool used to provide more flexibility in designing hybrid airfoils for off-design
conditions. The flap used for this study is based on a modified NACA6412 geometry with a chord one third of the
main element chord and both a gap and an overlap of 1.5% of the total hybrid chord.
Dow
nloa
ded
by U
NIV
ER
SIT
Y O
F IL
LIN
OIS
on
Aug
ust 1
4, 2
013
| http
://ar
c.ai
aa.o
rg |
DO
I: 1
0.25
14/6
.201
3-28
26
Copyright © 2013 by Gustavo Eidji Camarinha Fujiwara, Brian Woodard, Brock Wiberg, Andrew Mortonson, Michael Bragg. Published by the American Institute of Aeronautics and Astronautics, Inc., with permission.
American Institute of Aeronautics and Astronautics
4
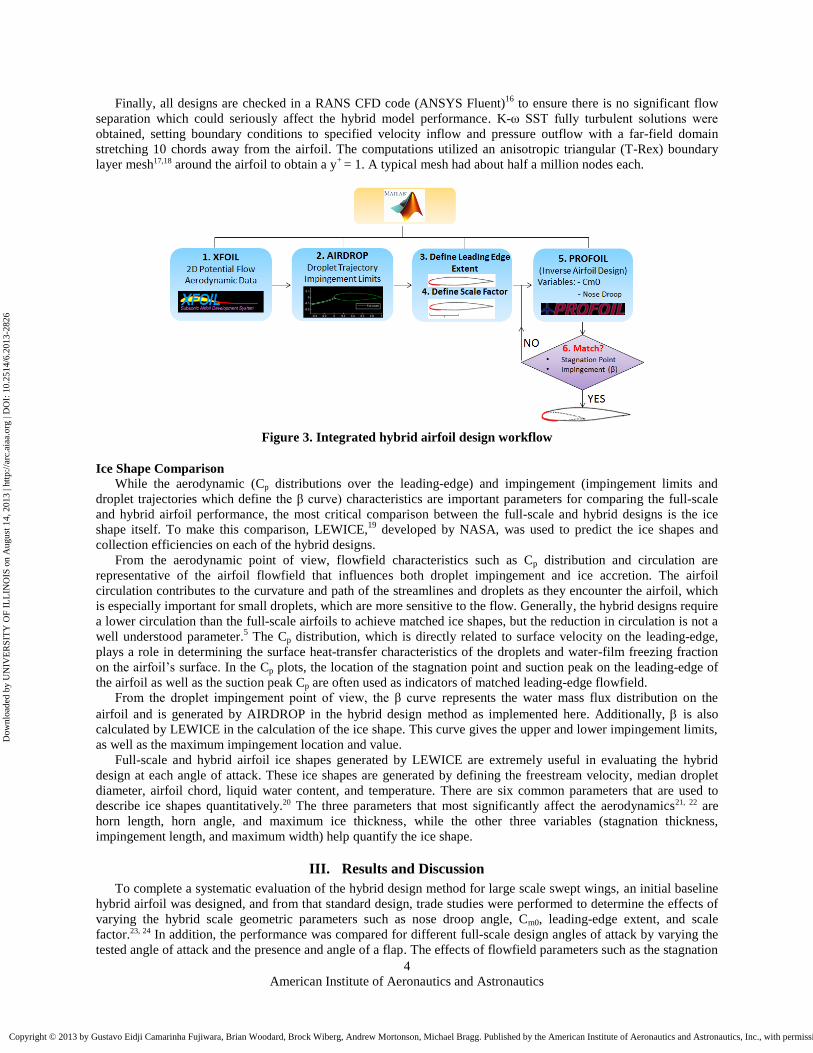
Finally, all designs are checked in a RANS CFD code (ANSYS Fluent)16
to ensure there is no significant flow
separation which could seriously affect the hybrid model performance. K-ω SST fully turbulent solutions were
obtained, setting boundary conditions to specified velocity inflow and pressure outflow with a far-field domain
stretching 10 chords away from the airfoil. The computations utilized an anisotropic triangular (T-Rex) boundary
layer mesh17,18 around the airfoil to obtain a y+
= 1. A typical mesh had about half a million nodes each.
Figure 3. Integrated hybrid airfoil design workflow
Ice Shape Comparison
While the aerodynamic (Cp distributions over the leading-edge) and impingement (impingement limits and
droplet trajectories which define the β curve) characteristics are important parameters for comparing the full-scale
and hybrid airfoil performance, the most critical comparison between the full-scale and hybrid designs is the ice
shape itself. To make this comparison, LEWICE,19
developed by NASA, was used to predict the ice shapes and
collection efficiencies on each of the hybrid designs.
From the aerodynamic point of view, flowfield characteristics such as Cp distribution and circulation are
representative of the airfoil flowfield that influences both droplet impingement and ice accretion. The airfoil
circulation contributes to the curvature and path of the streamlines and droplets as they encounter the airfoil, which
is especially important for small droplets, which are more sensitive to the flow. Generally, the hybrid designs require
a lower circulation than the full-scale airfoils to achieve matched ice shapes, but the reduction in circulation is not a
well understood parameter.5 The Cp distribution, which is directly related to surface velocity on the leading-edge,
plays a role in determining the surface heat-transfer characteristics of the droplets and water-film freezing fraction
on the airfoil’s surface. In the Cp plots, the location of the stagnation point and suction peak on the leading-edge of
the airfoil as well as the suction peak Cp are often used as indicators of matched leading-edge flowfield.
From the droplet impingement point of view, the β curve represents the water mass flux distribution on the
airfoil and is generated by AIRDROP in the hybrid design method as implemented here. Additionally, is also
calculated by LEWICE in the calculation of the ice shape. This curve gives the upper and lower impingement limits,
as well as the maximum impingement location and value.
Full-scale and hybrid airfoil ice shapes generated by LEWICE are extremely useful in evaluating the hybrid
design at each angle of attack. These ice shapes are generated by defining the freestream velocity, median droplet
diameter, airfoil chord, liquid water content, and temperature. There are six common parameters that are used to
describe ice shapes quantitatively.20 The three parameters that most significantly affect the aerodynamics21, 22 are
horn length, horn angle, and maximum ice thickness, while the other three variables (stagnation thickness,
impingement length, and maximum width) help quantify the ice shape.
III. Results and Discussion
To complete a systematic evaluation of the hybrid design method for large scale swept wings, an initial baseline
hybrid airfoil was designed, and from that standard design, trade studies were performed to determine the effects of
varying the hybrid scale geometric parameters such as nose droop angle, Cm0, leading-edge extent, and scale
factor.23, 24 In addition, the performance was compared for different full-scale design angles of attack by varying the
tested angle of attack and the presence and angle of a flap. The effects of flowfield parameters such as the stagnation
Dow
nloa
ded
by U
NIV
ER
SIT
Y O
F IL
LIN
OIS
on
Aug
ust 1
4, 2
013
| http
://ar
c.ai
aa.o
rg |
DO
I: 1
0.25
14/6
.201
3-28
26
Copyright © 2013 by Gustavo Eidji Camarinha Fujiwara, Brian Woodard, Brock Wiberg, Andrew Mortonson, Michael Bragg. Published by the American Institute of Aeronautics and Astronautics, Inc., with permission.

American Institute of Aeronautics and Astronautics
5
point location and airfoil circulation on the ice shape were evaluated. Finally, all designs were checked for flow
separation using 2-D Navier-Stokes solutions.
Initial Baseline Hybrid Design
The baseline full-scale airfoil for this study was chosen from the 64% semispan CRM65 location. The airfoil was
taken in the normal direction (perpendicular to leading-edge) for this icing analysis purpose, applying infinite swept
wing theory.25 Note that the airfoil includes the local geometric twist angle of -1.1° relative to the aircraft.
The baseline freestream icing conditions selected for this study include a temperature of 24.8°F (-4°C) and
median volume droplet diameter (MVD) of 20 μm with a Langmuir-D distribution. 26, 27 On the full-scale airfoil this
resulted in a horn ice formation for icing times greater than 10 minutes and with a large chordwise extent of the ice
shape. The liquid water content, LWC, was 0.551 g/m3, and the flight speed used was 120 m/s which yields a speed
of 95.17 m/s normal to the CRM leading-edge which is swept at 37°. These freestream conditions will be referred to
as the Baseline Icing Conditions. The evaluation of wind tunnel effects by Bragg and Wells28, 29
showed reduced
effects of tunnel walls as tunnel height over model chord (h/c) increased above 2. The NASA Icing Research Tunnel
has a test section of 6 ft (vertical) by 9ft (horizontal), which for a hybrid model mounted vertically would yield h/c =
2.64 for SF = 3, and h/c = 1.76 for SF = 2.30 The SF of 2 was selected for the baseline hybrid design. The
impingement limits for the full-scale airfoil at α = 4° and MVD = 20 μm are x/c0 = 5.9% on the lower surface and
x/c0 = 0.1% on the upper surface for a monodisperse droplet size distribution, but x/c0 = 15.0% and 0.6% for a
Langmuir-D distribution due to the presence of larger droplets. Leading-edge chordwise extents of x/c0 = 10% on
the lower and 5% on the upper surfaces were selected.
The initial hybrid design for the baseline case has nose droop of -1° (down) and Cm0 = -0.13, and both the full-
scale and hybrid designs are presented in Fig. 4. LEWICE was set to automatically select the number of time-steps
per minute in these runs.
Freestream Conditions
VNormal = 95.17 m/s
pinf = 69702 Pa α = 4°
Icing Conditions
T = -4°C Icing Time = 45 min
MVD = 20 μm
LWC = 0.551 g/m3 Hybrid Design Parameters
η = 64% SF = 2
LE lower extent x/c0 = 10%
LE upper extent x/c0 = 5% Cm0 = -0.13
Nose Droop = -1°
b) c) d)
Effect of Droplet Size
All cases in the present work were run at the Baseline Icing Conditions described previously, except for the
following droplet size study, in which the MVD was increased from 20 to 40 μm to check if the hybrid design done
at an MVD of 20 μm still presents satisfactory performance in predicting full-scale ice shapes with the larger
particles.
As the droplet size increases so does particle inertia, making the droplets less susceptible to aerodynamic forces
applied by the surrounding flowfield. As a consequence, the larger droplets produce larger impingement limits and
0 0.2 0.4 0.6 0.8 1
-2
-1.5
-1
-0.5
0
0.5
1
Cp
x/c0
Full Scale
Hybrid (Baseline)
= 4°
-0.1 -0.08 -0.06 -0.04 -0.02 0 0.02
0.1
0.2
0.3
0.4
0.5
s/c0
Full Scale
Hybrid (Baseline)
= 4°
0 0.02 0.04 0.06
-0.02
-0.01
0
0.01
0.02
0.03
0.04
y/c
0
x/c0
Clean
Full Scale
Hybrid (Baseline)
= 4°
Figure 4.a) Baseline hybrid design compared to the full scale airfoil.
b) Pressure distributions comparison
c) Collection efficiencies comparison
d) Ice shapes comparison
0 0.1 0.2 0.3 0.4 0.5 0.6 0.7 0.8 0.9 1
-0.1
-0.05
0
0.05
0.1
x/c0
y/c
0
Full Scale
Hybrid Design
= 4°, = 64%
Baseline Icing Conditions
Dow
nloa
ded
by U
NIV
ER
SIT
Y O
F IL
LIN
OIS
on
Aug
ust 1
4, 2
013
| http
://ar
c.ai
aa.o
rg |
DO
I: 1
0.25
14/6
.201
3-28
26
Copyright © 2013 by Gustavo Eidji Camarinha Fujiwara, Brian Woodard, Brock Wiberg, Andrew Mortonson, Michael Bragg. Published by the American Institute of Aeronautics and Astronautics, Inc., with permission.
American Institute of Aeronautics and Astronautics
6
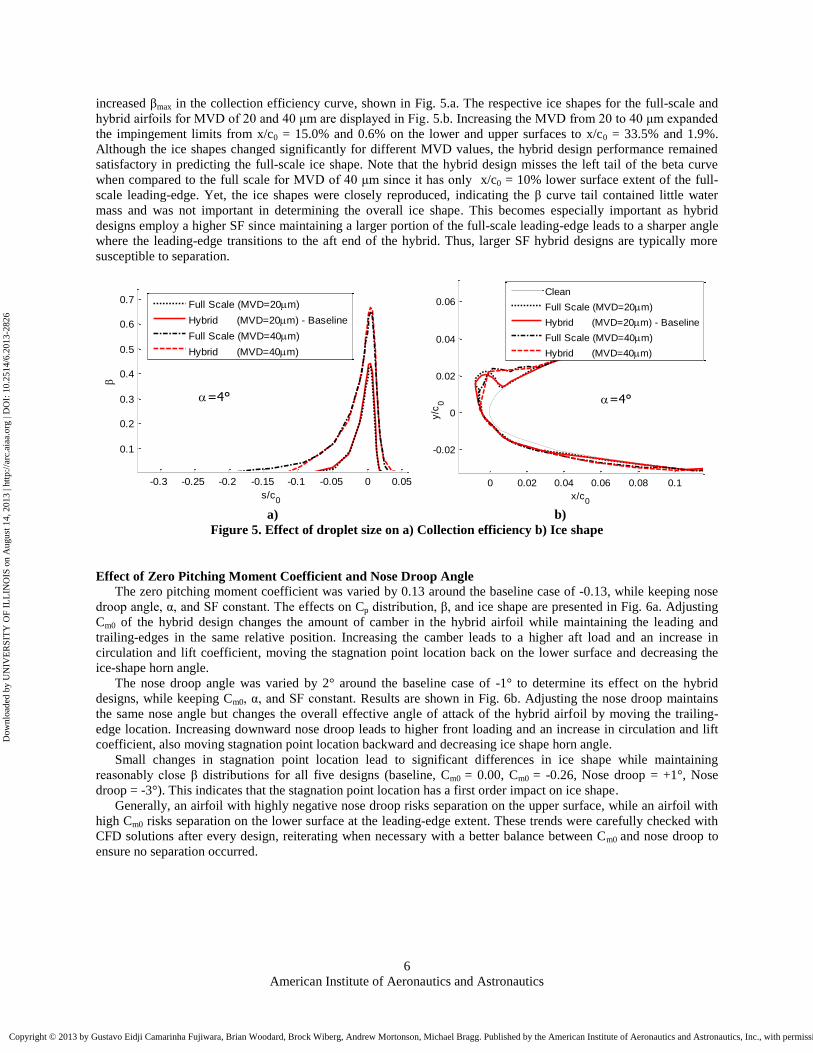
increased βmax in the collection efficiency curve, shown in Fig. 5.a. The respective ice shapes for the full-scale and
hybrid airfoils for MVD of 20 and 40 μm are displayed in Fig. 5.b. Increasing the MVD from 20 to 40 μm expanded
the impingement limits from x/c0 = 15.0% and 0.6% on the lower and upper surfaces to x/c0 = 33.5% and 1.9%.
Although the ice shapes changed significantly for different MVD values, the hybrid design performance remained
satisfactory in predicting the full-scale ice shape. Note that the hybrid design misses the left tail of the beta curve
when compared to the full scale for MVD of 40 μm since it has only x/c0 = 10% lower surface extent of the full-
scale leading-edge. Yet, the ice shapes were closely reproduced, indicating the β curve tail contained little water
mass and was not important in determining the overall ice shape. This becomes especially important as hybrid
designs employ a higher SF since maintaining a larger portion of the full-scale leading-edge leads to a sharper angle
where the leading-edge transitions to the aft end of the hybrid. Thus, larger SF hybrid designs are typically more
susceptible to separation.
a) b)
Figure 5. Effect of droplet size on a) Collection efficiency b) Ice shape
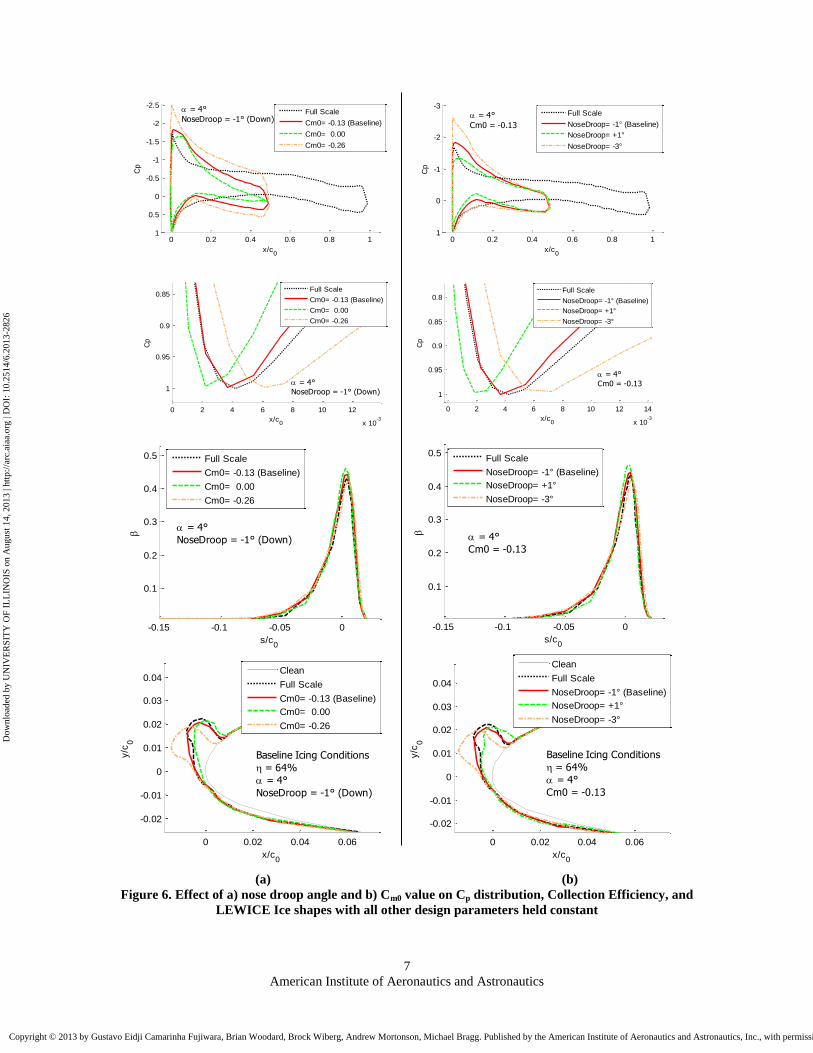
Effect of Zero Pitching Moment Coefficient and Nose Droop Angle
The zero pitching moment coefficient was varied by 0.13 around the baseline case of -0.13, while keeping nose
droop angle, α, and SF constant. The effects on Cp distribution, β, and ice shape are presented in Fig. 6a. Adjusting
Cm0 of the hybrid design changes the amount of camber in the hybrid airfoil while maintaining the leading and
trailing-edges in the same relative position. Increasing the camber leads to a higher aft load and an increase in
circulation and lift coefficient, moving the stagnation point location back on the lower surface and decreasing the
ice-shape horn angle.
The nose droop angle was varied by 2° around the baseline case of -1° to determine its effect on the hybrid
designs, while keeping Cm0, α, and SF constant. Results are shown in Fig. 6b. Adjusting the nose droop maintains
the same nose angle but changes the overall effective angle of attack of the hybrid airfoil by moving the trailing-
edge location. Increasing downward nose droop leads to higher front loading and an increase in circulation and lift
coefficient, also moving stagnation point location backward and decreasing ice shape horn angle.
Small changes in stagnation point location lead to significant differences in ice shape while maintaining
reasonably close β distributions for all five designs (baseline, Cm0 = 0.00, Cm0 = -0.26, Nose droop = +1°, Nose
droop = -3°). This indicates that the stagnation point location has a first order impact on ice shape.
Generally, an airfoil with highly negative nose droop risks separation on the upper surface, while an airfoil with
high Cm0 risks separation on the lower surface at the leading-edge extent. These trends were carefully checked with
CFD solutions after every design, reiterating when necessary with a better balance between Cm0 and nose droop to
ensure no separation occurred.
-0.3 -0.25 -0.2 -0.15 -0.1 -0.05 0 0.05
0.1
0.2
0.3
0.4
0.5
0.6
0.7
s/c0
Full Scale (MVD=20m)
Hybrid (MVD=20m) - Baseline
Full Scale (MVD=40m)
Hybrid (MVD=40m)
=4°
0 0.02 0.04 0.06 0.08 0.1
-0.02
0
0.02
0.04
0.06
y/c
0
x/c0
Clean
Full Scale (MVD=20m)
Hybrid (MVD=20m) - Baseline
Full Scale (MVD=40m)
Hybrid (MVD=40m)
=4°
Dow
nloa
ded
by U
NIV
ER
SIT
Y O
F IL
LIN
OIS
on
Aug
ust 1
4, 2
013
| http
://ar
c.ai
aa.o
rg |
DO
I: 1
0.25
14/6
.201
3-28
26
Copyright © 2013 by Gustavo Eidji Camarinha Fujiwara, Brian Woodard, Brock Wiberg, Andrew Mortonson, Michael Bragg. Published by the American Institute of Aeronautics and Astronautics, Inc., with permission.
American Institute of Aeronautics and Astronautics
7
(a) (b)
Figure 6. Effect of a) nose droop angle and b) Cm0 value on Cp distribution, Collection Efficiency, and
LEWICE Ice shapes with all other design parameters held constant
0 0.2 0.4 0.6 0.8 1
-2.5
-2
-1.5
-1
-0.5
0
0.5
1
Cp
x/c0
Full Scale
Cm0= -0.13 (Baseline)
Cm0= 0.00
Cm0= -0.26
= 4°
NoseDroop = -1° (Down)
0 0.2 0.4 0.6 0.8 1
-3
-2
-1
0
1
Cp
x/c0
Full Scale
NoseDroop= -1° (Baseline)
NoseDroop= +1°
NoseDroop= -3°
= 4°
Cm0 = -0.13
0 2 4 6 8 10 12
x 10-3
0.85
0.9
0.95
1
Cp
x/c0
Full Scale
Cm0= -0.13 (Baseline)
Cm0= 0.00
Cm0= -0.26
= 4°
NoseDroop = -1° (Down)
0 2 4 6 8 10 12 14
x 10-3
0.8
0.85
0.9
0.95
1
Cp
x/c0
Full Scale
NoseDroop= -1° (Baseline)
NoseDroop= +1°
NoseDroop= -3°
= 4°
Cm0 = -0.13
-0.15 -0.1 -0.05 0
0.1
0.2
0.3
0.4
0.5
s/c0
Full Scale
Cm0= -0.13 (Baseline)
Cm0= 0.00
Cm0= -0.26
= 4°
NoseDroop = -1° (Down)
-0.15 -0.1 -0.05 0
0.1
0.2
0.3
0.4
0.5
s/c0
Full Scale
NoseDroop= -1° (Baseline)
NoseDroop= +1°
NoseDroop= -3°
= 4°
Cm0 = -0.13
0 0.02 0.04 0.06
-0.02
-0.01
0
0.01
0.02
0.03
0.04
y/c
0
x/c0
Clean
Full Scale
Cm0= -0.13 (Baseline)
Cm0= 0.00
Cm0= -0.26
Baseline Icing Conditions
= 64%
= 4°
NoseDroop = -1° (Down)
0 0.02 0.04 0.06
-0.02
-0.01
0
0.01
0.02
0.03
0.04
y/c
0
x/c0
Clean
Full Scale
NoseDroop= -1° (Baseline)
NoseDroop= +1°
NoseDroop= -3°
Baseline Icing Conditions
= 64%
= 4°
Cm0 = -0.13
Dow
nloa
ded
by U
NIV
ER
SIT
Y O
F IL
LIN
OIS
on
Aug
ust 1
4, 2
013
| http
://ar
c.ai
aa.o
rg |
DO
I: 1
0.25
14/6
.201
3-28
26
Copyright © 2013 by Gustavo Eidji Camarinha Fujiwara, Brian Woodard, Brock Wiberg, Andrew Mortonson, Michael Bragg. Published by the American Institute of Aeronautics and Astronautics, Inc., with permission.
American Institute of Aeronautics and Astronautics
8
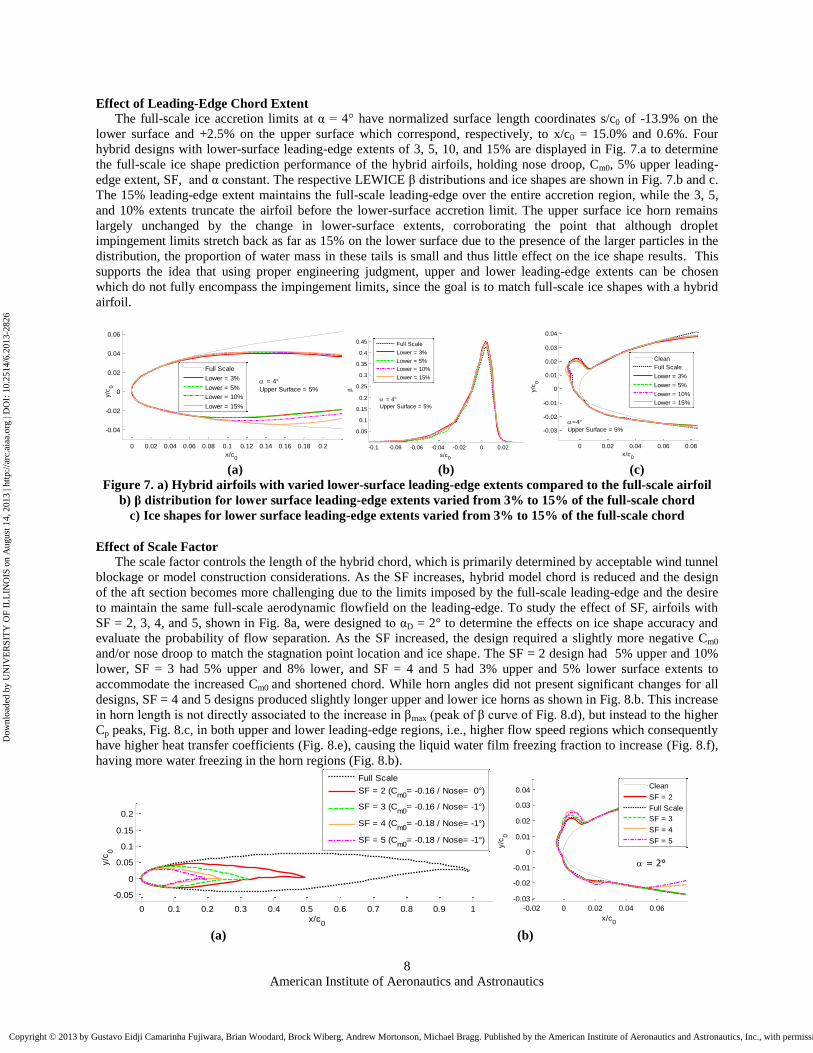
Effect of Leading-Edge Chord Extent
The full-scale ice accretion limits at α = 4° have normalized surface length coordinates s/c0 of -13.9% on the
lower surface and +2.5% on the upper surface which correspond, respectively, to x/c0 = 15.0% and 0.6%. Four
hybrid designs with lower-surface leading-edge extents of 3, 5, 10, and 15% are displayed in Fig. 7.a to determine
the full-scale ice shape prediction performance of the hybrid airfoils, holding nose droop, Cm0, 5% upper leading-
edge extent, SF, and α constant. The respective LEWICE β distributions and ice shapes are shown in Fig. 7.b and c.
The 15% leading-edge extent maintains the full-scale leading-edge over the entire accretion region, while the 3, 5,
and 10% extents truncate the airfoil before the lower-surface accretion limit. The upper surface ice horn remains
largely unchanged by the change in lower-surface extents, corroborating the point that although droplet
impingement limits stretch back as far as 15% on the lower surface due to the presence of the larger particles in the
distribution, the proportion of water mass in these tails is small and thus little effect on the ice shape results. This
supports the idea that using proper engineering judgment, upper and lower leading-edge extents can be chosen
which do not fully encompass the impingement limits, since the goal is to match full-scale ice shapes with a hybrid
airfoil.
(a) (b) (c)
Figure 7. a) Hybrid airfoils with varied lower-surface leading-edge extents compared to the full-scale airfoil
b) β distribution for lower surface leading-edge extents varied from 3% to 15% of the full-scale chord
c) Ice shapes for lower surface leading-edge extents varied from 3% to 15% of the full-scale chord
Effect of Scale Factor
The scale factor controls the length of the hybrid chord, which is primarily determined by acceptable wind tunnel
blockage or model construction considerations. As the SF increases, hybrid model chord is reduced and the design
of the aft section becomes more challenging due to the limits imposed by the full-scale leading-edge and the desire
to maintain the same full-scale aerodynamic flowfield on the leading-edge. To study the effect of SF, airfoils with
SF = 2, 3, 4, and 5, shown in Fig. 8a, were designed to αD = 2° to determine the effects on ice shape accuracy and
evaluate the probability of flow separation. As the SF increased, the design required a slightly more negative Cm0
and/or nose droop to match the stagnation point location and ice shape. The SF = 2 design had 5% upper and 10%
lower, SF = 3 had 5% upper and 8% lower, and SF = 4 and 5 had 3% upper and 5% lower surface extents to
accommodate the increased Cm0 and shortened chord. While horn angles did not present significant changes for all
designs, SF = 4 and 5 designs produced slightly longer upper and lower ice horns as shown in Fig. 8.b. This increase
in horn length is not directly associated to the increase in βmax (peak of β curve of Fig. 8.d), but instead to the higher
Cp peaks, Fig. 8.c, in both upper and lower leading-edge regions, i.e., higher flow speed regions which consequently
have higher heat transfer coefficients (Fig. 8.e), causing the liquid water film freezing fraction to increase (Fig. 8.f),
having more water freezing in the horn regions (Fig. 8.b).
(a) (b)
0 0.02 0.04 0.06 0.08 0.1 0.12 0.14 0.16 0.18 0.2
-0.04
-0.02
0
0.02
0.04
0.06
y/c
0
x/c0
Full Scale
Lower = 3%
Lower = 5%
Lower = 10%
Lower = 15%
= 4°
Upper Surface = 5%
-0.1 -0.08 -0.06 -0.04 -0.02 0 0.02
0.05
0.1
0.15
0.2
0.25
0.3
0.35
0.4
0.45
s/c0
Full Scale
Lower = 3%
Lower = 5%
Lower = 10%
Lower = 15%
= 4°
Upper Surface = 5%
0 0.02 0.04 0.06 0.08
-0.03
-0.02
-0.01
0
0.01
0.02
0.03
0.04
y/c
0
x/c0
Clean
Full Scale
Lower = 3%
Lower = 5%
Lower = 10%
Lower = 15%
=4°
Upper Surface = 5%
0 0.1 0.2 0.3 0.4 0.5 0.6 0.7 0.8 0.9 1
-0.05
0
0.05
0.1
0.15
0.2
x/c0
y/c
0
Full Scale
SF = 2 (Cm0
= -0.16 / Nose= 0°)
SF = 3 (Cm0
= -0.16 / Nose= -1°)
SF = 4 (Cm0
= -0.18 / Nose= -1°)
SF = 5 (Cm0
= -0.18 / Nose= -1°)
-0.02 0 0.02 0.04 0.06
-0.03
-0.02
-0.01
0
0.01
0.02
0.03
0.04
y/c
0
x/c0
Clean
SF = 2
Full Scale
SF = 3
SF = 4
SF = 5
= 2°
Dow
nloa
ded
by U
NIV
ER
SIT
Y O
F IL
LIN
OIS
on
Aug
ust 1
4, 2
013
| http
://ar
c.ai
aa.o
rg |
DO
I: 1
0.25
14/6
.201
3-28
26
Copyright © 2013 by Gustavo Eidji Camarinha Fujiwara, Brian Woodard, Brock Wiberg, Andrew Mortonson, Michael Bragg. Published by the American Institute of Aeronautics and Astronautics, Inc., with permission.
American Institute of Aeronautics and Astronautics
9
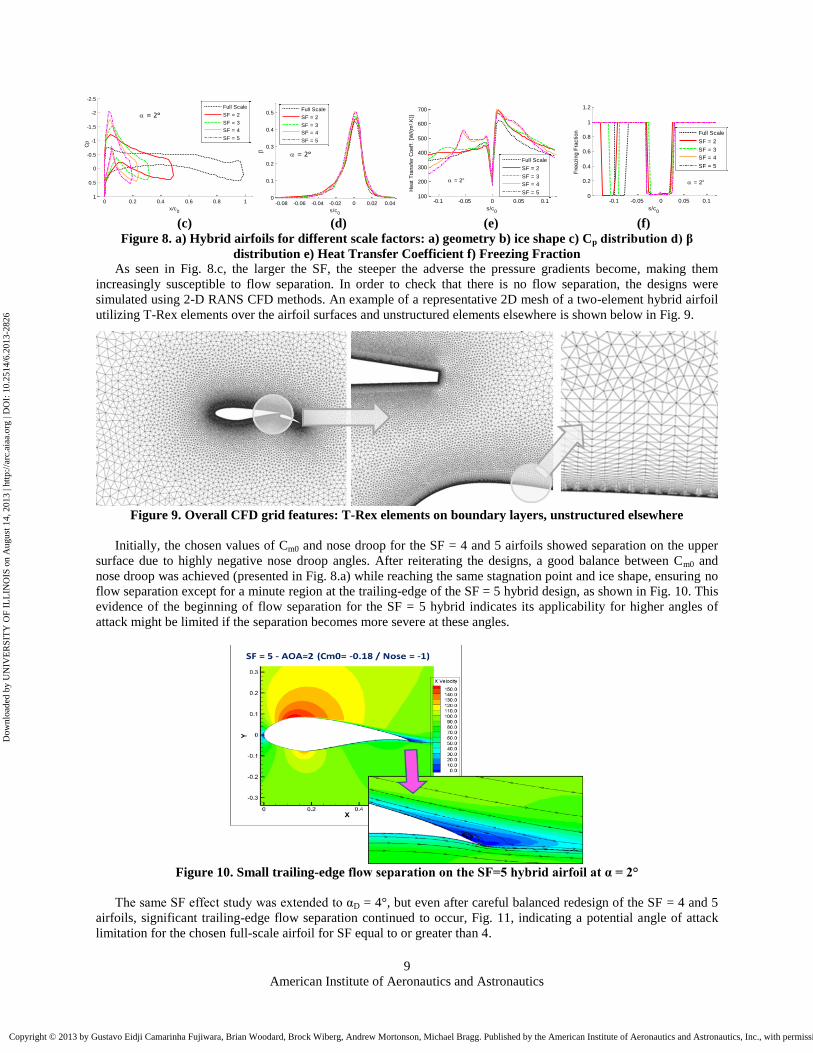
(c) (d) (e) (f)
Figure 8. a) Hybrid airfoils for different scale factors: a) geometry b) ice shape c) Cp distribution d) β
distribution e) Heat Transfer Coefficient f) Freezing Fraction
As seen in Fig. 8.c, the larger the SF, the steeper the adverse the pressure gradients become, making them
increasingly susceptible to flow separation. In order to check that there is no flow separation, the designs were
simulated using 2-D RANS CFD methods. An example of a representative 2D mesh of a two-element hybrid airfoil
utilizing T-Rex elements over the airfoil surfaces and unstructured elements elsewhere is shown below in Fig. 9.
Figure 9. Overall CFD grid features: T-Rex elements on boundary layers, unstructured elsewhere
Initially, the chosen values of Cm0 and nose droop for the SF = 4 and 5 airfoils showed separation on the upper
surface due to highly negative nose droop angles. After reiterating the designs, a good balance between Cm0 and
nose droop was achieved (presented in Fig. 8.a) while reaching the same stagnation point and ice shape, ensuring no
flow separation except for a minute region at the trailing-edge of the SF = 5 hybrid design, as shown in Fig. 10. This
evidence of the beginning of flow separation for the SF = 5 hybrid indicates its applicability for higher angles of
attack might be limited if the separation becomes more severe at these angles.
Figure 10. Small trailing-edge flow separation on the SF=5 hybrid airfoil at α = 2°
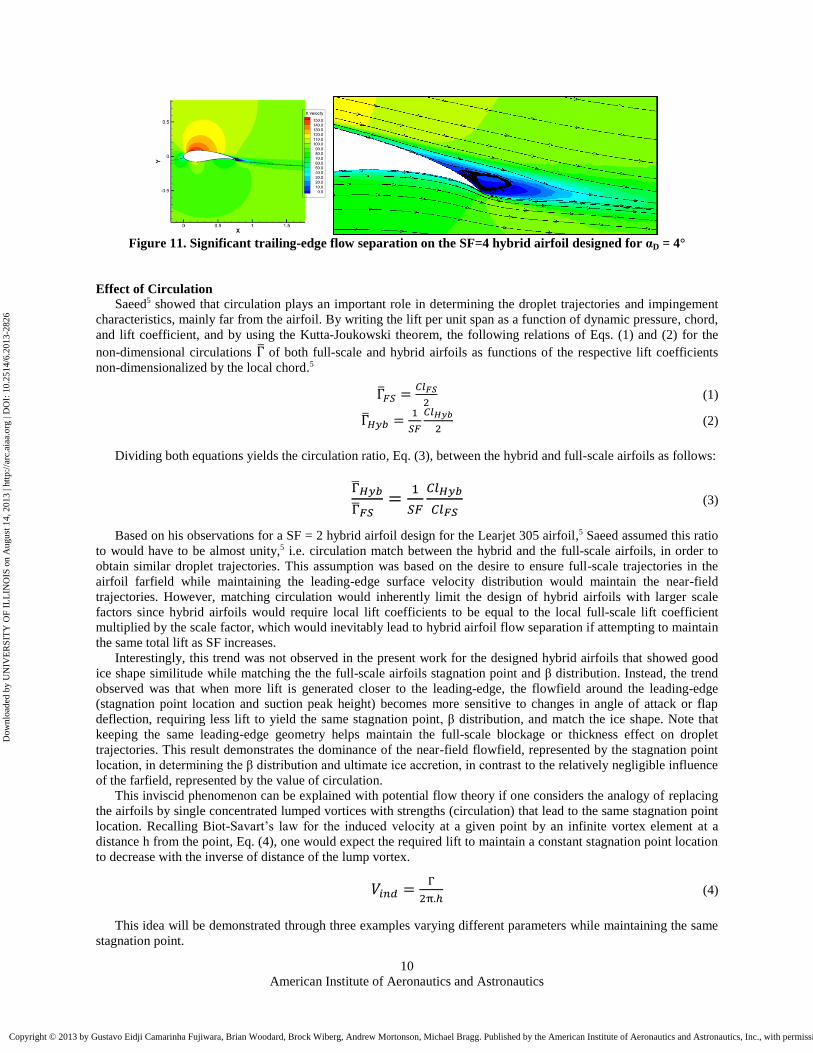
The same SF effect study was extended to αD = 4°, but even after careful balanced redesign of the SF = 4 and 5
airfoils, significant trailing-edge flow separation continued to occur, Fig. 11, indicating a potential angle of attack
limitation for the chosen full-scale airfoil for SF equal to or greater than 4.
0 0.2 0.4 0.6 0.8 1
-2.5
-2
-1.5
-1
-0.5
0
0.5
1
Cp
x/c0
Full Scale
SF = 2
SF = 3
SF = 4
SF = 5
= 2°
-0.08 -0.06 -0.04 -0.02 0 0.02 0.040
0.1
0.2
0.3
0.4
0.5
s/c0
Full Scale
SF = 2
SF = 3
SF = 4
SF = 5
= 2°
-0.1 -0.05 0 0.05 0.1100
200
300
400
500
600
700
s/c0
Heat
Tra
nsfe
r C
oeff
. [W
/(m
².K
)]
Full Scale
SF = 2
SF = 3
SF = 4
SF = 5
= 2°
-0.1 -0.05 0 0.05 0.10
0.2
0.4
0.6
0.8
1
1.2
s/c0
Fre
ezin
g F
raction
Full Scale
SF = 2
SF = 3
SF = 4
SF = 5
= 2°
Dow
nloa
ded
by U
NIV
ER
SIT
Y O
F IL
LIN
OIS
on
Aug
ust 1
4, 2
013
| http
://ar
c.ai
aa.o
rg |
DO
I: 1
0.25
14/6
.201
3-28
26
Copyright © 2013 by Gustavo Eidji Camarinha Fujiwara, Brian Woodard, Brock Wiberg, Andrew Mortonson, Michael Bragg. Published by the American Institute of Aeronautics and Astronautics, Inc., with permission.
American Institute of Aeronautics and Astronautics
10
Figure 11. Significant trailing-edge flow separation on the SF=4 hybrid airfoil designed for αD = 4°
Effect of Circulation
Saeed5 showed that circulation plays an important role in determining the droplet trajectories and impingement
characteristics, mainly far from the airfoil. By writing the lift per unit span as a function of dynamic pressure, chord,
and lift coefficient, and by using the Kutta-Joukowski theorem, the following relations of Eqs. (1) and (2) for the
non-dimensional circulations of both full-scale and hybrid airfoils as functions of the respective lift coefficients
non-dimensionalized by the local chord.5
(1)
(2)
Dividing both equations yields the circulation ratio, Eq. (3), between the hybrid and full-scale airfoils as follows:
(3)
Based on his observations for a SF = 2 hybrid airfoil design for the Learjet 305 airfoil,5 Saeed assumed this ratio
to would have to be almost unity,5 i.e. circulation match between the hybrid and the full-scale airfoils, in order to
obtain similar droplet trajectories. This assumption was based on the desire to ensure full-scale trajectories in the
airfoil farfield while maintaining the leading-edge surface velocity distribution would maintain the near-field
trajectories. However, matching circulation would inherently limit the design of hybrid airfoils with larger scale
factors since hybrid airfoils would require local lift coefficients to be equal to the local full-scale lift coefficient
multiplied by the scale factor, which would inevitably lead to hybrid airfoil flow separation if attempting to maintain
the same total lift as SF increases.
Interestingly, this trend was not observed in the present work for the designed hybrid airfoils that showed good
ice shape similitude while matching the the full-scale airfoils stagnation point and β distribution. Instead, the trend
observed was that when more lift is generated closer to the leading-edge, the flowfield around the leading-edge
(stagnation point location and suction peak height) becomes more sensitive to changes in angle of attack or flap
deflection, requiring less lift to yield the same stagnation point, β distribution, and match the ice shape. Note that
keeping the same leading-edge geometry helps maintain the full-scale blockage or thickness effect on droplet
trajectories. This result demonstrates the dominance of the near-field flowfield, represented by the stagnation point
location, in determining the β distribution and ultimate ice accretion, in contrast to the relatively negligible influence
of the farfield, represented by the value of circulation.
This inviscid phenomenon can be explained with potential flow theory if one considers the analogy of replacing
the airfoils by single concentrated lumped vortices with strengths (circulation) that lead to the same stagnation point
location. Recalling Biot-Savart’s law for the induced velocity at a given point by an infinite vortex element at a
distance h from the point, Eq. (4), one would expect the required lift to maintain a constant stagnation point location
to decrease with the inverse of distance of the lump vortex.
(4)
This idea will be demonstrated through three examples varying different parameters while maintaining the same
stagnation point.
Dow
nloa
ded
by U
NIV
ER
SIT
Y O
F IL
LIN
OIS
on
Aug
ust 1
4, 2
013
| http
://ar
c.ai
aa.o
rg |
DO
I: 1
0.25
14/6
.201
3-28
26
Copyright © 2013 by Gustavo Eidji Camarinha Fujiwara, Brian Woodard, Brock Wiberg, Andrew Mortonson, Michael Bragg. Published by the American Institute of Aeronautics and Astronautics, Inc., with permission.
American Institute of Aeronautics and Astronautics
11
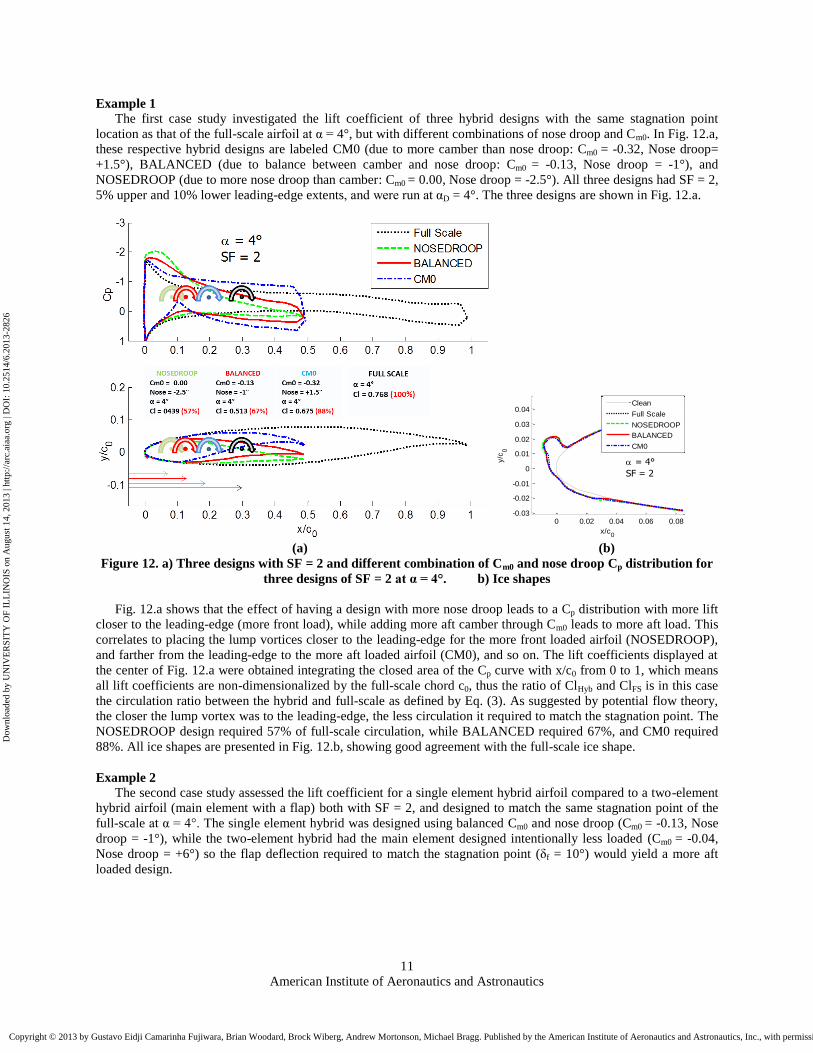
Example 1
The first case study investigated the lift coefficient of three hybrid designs with the same stagnation point
location as that of the full-scale airfoil at α = 4°, but with different combinations of nose droop and Cm0. In Fig. 12.a,
these respective hybrid designs are labeled CM0 (due to more camber than nose droop: Cm0 = -0.32, Nose droop=
+1.5°), BALANCED (due to balance between camber and nose droop: Cm0 = -0.13, Nose droop = -1°), and
NOSEDROOP (due to more nose droop than camber: Cm0 = 0.00, Nose droop = -2.5°). All three designs had SF = 2,
5% upper and 10% lower leading-edge extents, and were run at αD = 4°. The three designs are shown in Fig. 12.a.
(a) (b)
Figure 12. a) Three designs with SF = 2 and different combination of Cm0 and nose droop Cp distribution for
three designs of SF = 2 at α = 4°. b) Ice shapes
Fig. 12.a shows that the effect of having a design with more nose droop leads to a Cp distribution with more lift
closer to the leading-edge (more front load), while adding more aft camber through Cm0 leads to more aft load. This
correlates to placing the lump vortices closer to the leading-edge for the more front loaded airfoil (NOSEDROOP),
and farther from the leading-edge to the more aft loaded airfoil (CM0), and so on. The lift coefficients displayed at
the center of Fig. 12.a were obtained integrating the closed area of the Cp curve with x/c0 from 0 to 1, which means
all lift coefficients are non-dimensionalized by the full-scale chord c0, thus the ratio of ClHyb and ClFS is in this case
the circulation ratio between the hybrid and full-scale as defined by Eq. (3). As suggested by potential flow theory,
the closer the lump vortex was to the leading-edge, the less circulation it required to match the stagnation point. The
NOSEDROOP design required 57% of full-scale circulation, while BALANCED required 67%, and CM0 required
88%. All ice shapes are presented in Fig. 12.b, showing good agreement with the full-scale ice shape.
Example 2
The second case study assessed the lift coefficient for a single element hybrid airfoil compared to a two-element
hybrid airfoil (main element with a flap) both with SF = 2, and designed to match the same stagnation point of the
full-scale at α = 4°. The single element hybrid was designed using balanced Cm0 and nose droop (Cm0 = -0.13, Nose
droop = -1°), while the two-element hybrid had the main element designed intentionally less loaded (Cm0 = -0.04,
Nose droop = +6°) so the flap deflection required to match the stagnation point (δf = 10°) would yield a more aft
loaded design.
0 0.02 0.04 0.06 0.08-0.03
-0.02
-0.01
0
0.01
0.02
0.03
0.04
y/c
0
x/c0
Clean
Full Scale
NOSEDROOP
BALANCED
CM0
= 4°
SF = 2
Dow
nloa
ded
by U
NIV
ER
SIT
Y O
F IL
LIN
OIS
on
Aug
ust 1
4, 2
013
| http
://ar
c.ai
aa.o
rg |
DO
I: 1
0.25
14/6
.201
3-28
26
Copyright © 2013 by Gustavo Eidji Camarinha Fujiwara, Brian Woodard, Brock Wiberg, Andrew Mortonson, Michael Bragg. Published by the American Institute of Aeronautics and Astronautics, Inc., with permission.
American Institute of Aeronautics and Astronautics
12
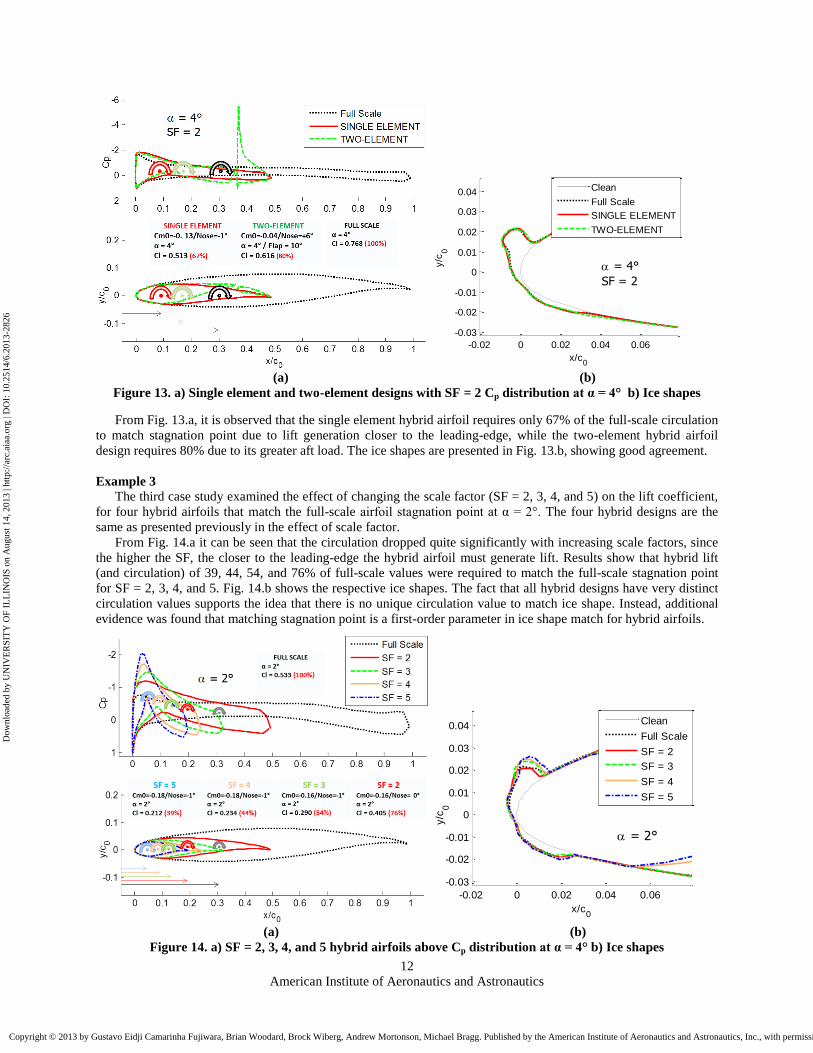
(a) (b)
Figure 13. a) Single element and two-element designs with SF = 2 Cp distribution at α = 4° b) Ice shapes
From Fig. 13.a, it is observed that the single element hybrid airfoil requires only 67% of the full-scale circulation
to match stagnation point due to lift generation closer to the leading-edge, while the two-element hybrid airfoil
design requires 80% due to its greater aft load. The ice shapes are presented in Fig. 13.b, showing good agreement.
Example 3
The third case study examined the effect of changing the scale factor (SF = 2, 3, 4, and 5) on the lift coefficient,
for four hybrid airfoils that match the full-scale airfoil stagnation point at α = 2°. The four hybrid designs are the
same as presented previously in the effect of scale factor.
From Fig. 14.a it can be seen that the circulation dropped quite significantly with increasing scale factors, since
the higher the SF, the closer to the leading-edge the hybrid airfoil must generate lift. Results show that hybrid lift
(and circulation) of 39, 44, 54, and 76% of full-scale values were required to match the full-scale stagnation point
for SF = 2, 3, 4, and 5. Fig. 14.b shows the respective ice shapes. The fact that all hybrid designs have very distinct
circulation values supports the idea that there is no unique circulation value to match ice shape. Instead, additional
evidence was found that matching stagnation point is a first-order parameter in ice shape match for hybrid airfoils.
(a) (b)
Figure 14. a) SF = 2, 3, 4, and 5 hybrid airfoils above Cp distribution at α = 4° b) Ice shapes
-0.02 0 0.02 0.04 0.06
-0.03
-0.02
-0.01
0
0.01
0.02
0.03
0.04
y/c
0
x/c0
Clean
Full Scale
SINGLE ELEMENT
TWO-ELEMENT
= 4°
SF = 2
-0.02 0 0.02 0.04 0.06
-0.03
-0.02
-0.01
0
0.01
0.02
0.03
0.04
y/c
0
x/c0
Clean
Full Scale
SF = 2
SF = 3
SF = 4
SF = 5
= 2°
Dow
nloa
ded
by U
NIV
ER
SIT
Y O
F IL
LIN
OIS
on
Aug
ust 1
4, 2
013
| http
://ar
c.ai
aa.o
rg |
DO
I: 1
0.25
14/6
.201
3-28
26
Copyright © 2013 by Gustavo Eidji Camarinha Fujiwara, Brian Woodard, Brock Wiberg, Andrew Mortonson, Michael Bragg. Published by the American Institute of Aeronautics and Astronautics, Inc., with permission.
American Institute of Aeronautics and Astronautics
13
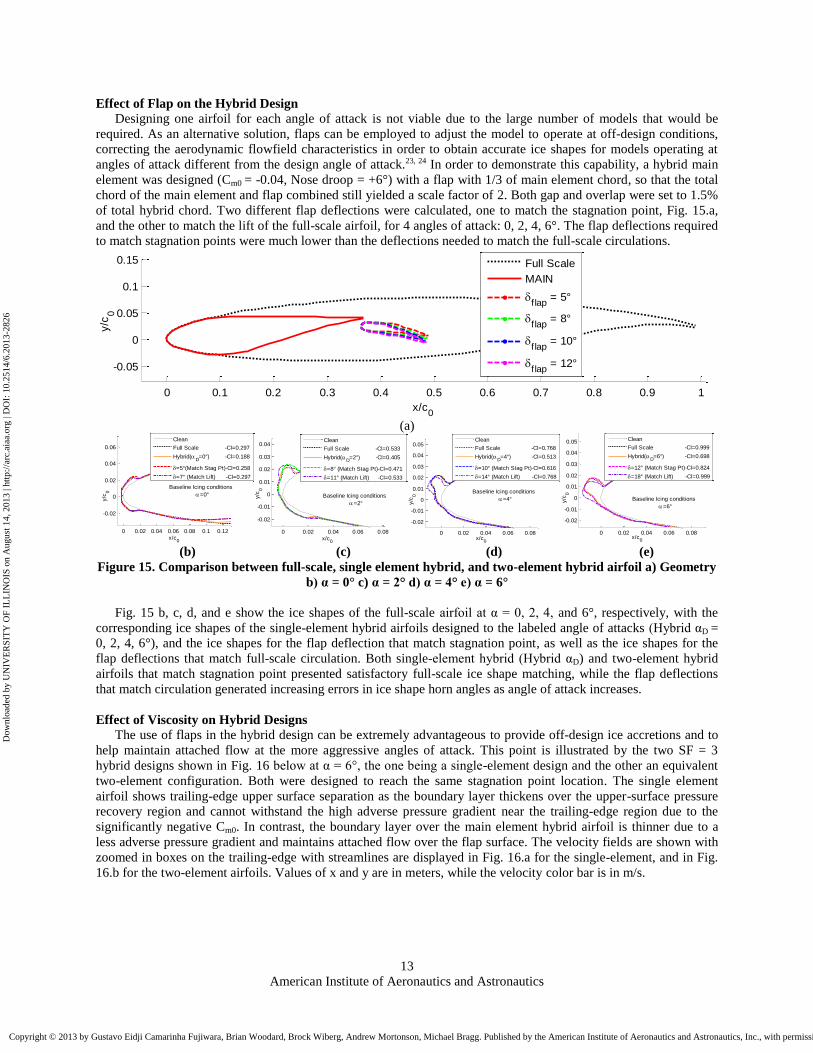
Effect of Flap on the Hybrid Design
Designing one airfoil for each angle of attack is not viable due to the large number of models that would be
required. As an alternative solution, flaps can be employed to adjust the model to operate at off-design conditions,
correcting the aerodynamic flowfield characteristics in order to obtain accurate ice shapes for models operating at
angles of attack different from the design angle of attack.23, 24 In order to demonstrate this capability, a hybrid main
element was designed (Cm0 = -0.04, Nose droop = +6°) with a flap with 1/3 of main element chord, so that the total
chord of the main element and flap combined still yielded a scale factor of 2. Both gap and overlap were set to 1.5%
of total hybrid chord. Two different flap deflections were calculated, one to match the stagnation point, Fig. 15.a,
and the other to match the lift of the full-scale airfoil, for 4 angles of attack: 0, 2, 4, 6°. The flap deflections required
to match stagnation points were much lower than the deflections needed to match the full-scale circulations.
(a)
(b) (c) (d) (e)
Figure 15. Comparison between full-scale, single element hybrid, and two-element hybrid airfoil a) Geometry
b) α = 0° c) α = 2° d) α = 4° e) α = 6°
Fig. 15 b, c, d, and e show the ice shapes of the full-scale airfoil at α = 0, 2, 4, and 6°, respectively, with the
corresponding ice shapes of the single-element hybrid airfoils designed to the labeled angle of attacks (Hybrid αD =
0, 2, 4, 6°), and the ice shapes for the flap deflection that match stagnation point, as well as the ice shapes for the
flap deflections that match full-scale circulation. Both single-element hybrid (Hybrid αD) and two-element hybrid
airfoils that match stagnation point presented satisfactory full-scale ice shape matching, while the flap deflections
that match circulation generated increasing errors in ice shape horn angles as angle of attack increases.
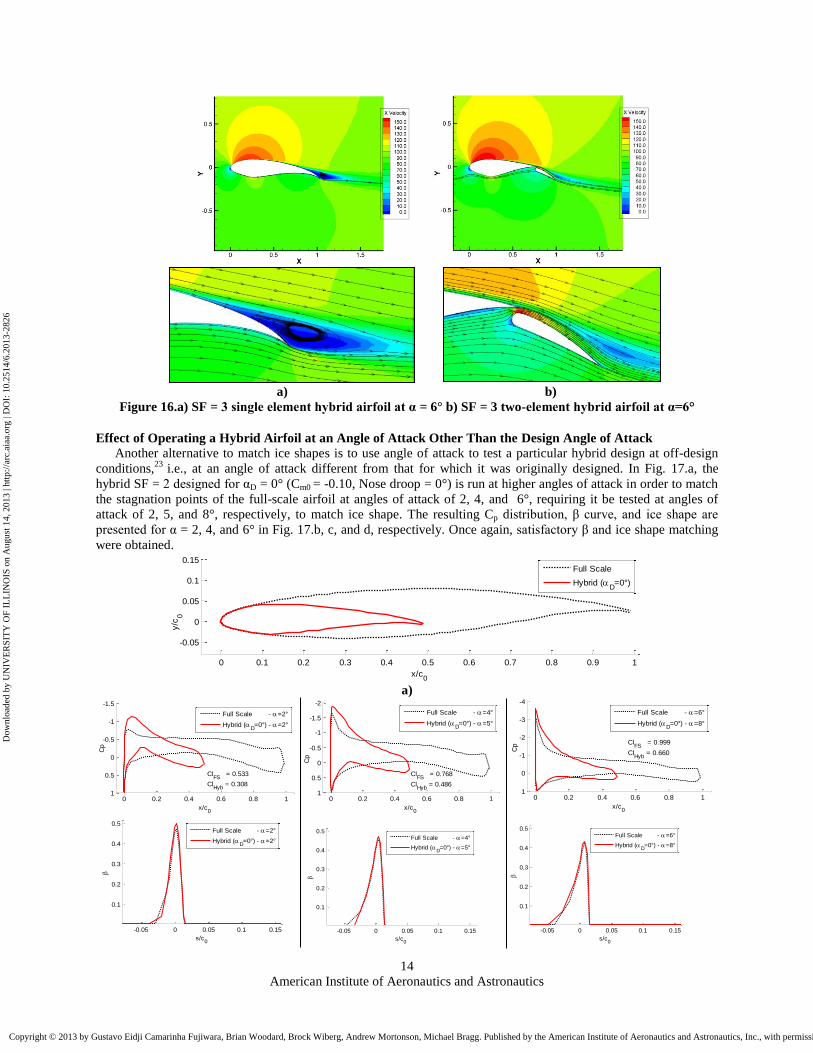
Effect of Viscosity on Hybrid Designs
The use of flaps in the hybrid design can be extremely advantageous to provide off-design ice accretions and to
help maintain attached flow at the more aggressive angles of attack. This point is illustrated by the two SF = 3
hybrid designs shown in Fig. 16 below at α = 6°, the one being a single-element design and the other an equivalent
two-element configuration. Both were designed to reach the same stagnation point location. The single element
airfoil shows trailing-edge upper surface separation as the boundary layer thickens over the upper-surface pressure
recovery region and cannot withstand the high adverse pressure gradient near the trailing-edge region due to the
significantly negative Cm0. In contrast, the boundary layer over the main element hybrid airfoil is thinner due to a
less adverse pressure gradient and maintains attached flow over the flap surface. The velocity fields are shown with
zoomed in boxes on the trailing-edge with streamlines are displayed in Fig. 16.a for the single-element, and in Fig.
16.b for the two-element airfoils. Values of x and y are in meters, while the velocity color bar is in m/s.
0 0.1 0.2 0.3 0.4 0.5 0.6 0.7 0.8 0.9 1
-0.05
0
0.05
0.1
0.15
x/c0
y/c
0
Full Scale
MAIN
f lap
= 5°
f lap
= 8°
f lap
= 10°
f lap
= 12°
0 0.02 0.04 0.06 0.08 0.1 0.12
-0.02
0
0.02
0.04
0.06
y/c
0
x/c0
Clean
Full Scale -Cl=0.297
Hybrid(D=0°) -Cl=0.188
=5°(Match Stag Pt)-Cl=0.258
=7° (Match Lift) -Cl=0.297
Baseline Icing conditions
=0°
0 0.02 0.04 0.06 0.08
-0.02
-0.01
0
0.01
0.02
0.03
0.04
y/c
0
x/c0
Clean
Full Scale -Cl=0.533
Hybrid(D=2°) -Cl=0.405
=8° (Match Stag Pt)-Cl=0.471
=11° (Match Lift) -Cl=0.533
Baseline Icing conditions
=2°
0 0.02 0.04 0.06 0.08
-0.02
-0.01
0
0.01
0.02
0.03
0.04
0.05
y/c
0
x/c0
Clean
Full Scale -Cl=0.768
Hybrid(D=4°) -Cl=0.513
=10° (Match Stag Pt)-Cl=0.616
=14° (Match Lift) -Cl=0.768
Baseline Icing conditions
=4°
0 0.02 0.04 0.06 0.08
-0.02
-0.01
0
0.01
0.02
0.03
0.04
0.05
0.06
y/c
0
x/c0
Clean
Full Scale -Cl=0.999
Hybrid(D=6°) -Cl=0.698
=12° (Match Stag Pt)-Cl=0.824
=18° (Match Lift) -Cl=0.999
Baseline Icing conditions
=6°
Dow
nloa
ded
by U
NIV
ER
SIT
Y O
F IL
LIN
OIS
on
Aug
ust 1
4, 2
013
| http
://ar
c.ai
aa.o
rg |
DO
I: 1
0.25
14/6
.201
3-28
26
Copyright © 2013 by Gustavo Eidji Camarinha Fujiwara, Brian Woodard, Brock Wiberg, Andrew Mortonson, Michael Bragg. Published by the American Institute of Aeronautics and Astronautics, Inc., with permission.
American Institute of Aeronautics and Astronautics
14
a) b)
Figure 16.a) SF = 3 single element hybrid airfoil at α = 6° b) SF = 3 two-element hybrid airfoil at α=6°
Effect of Operating a Hybrid Airfoil at an Angle of Attack Other Than the Design Angle of Attack
Another alternative to match ice shapes is to use angle of attack to test a particular hybrid design at off-design
conditions,23
i.e., at an angle of attack different from that for which it was originally designed. In Fig. 17.a, the
hybrid SF = 2 designed for αD = 0° (Cm0 = -0.10, Nose droop = 0°) is run at higher angles of attack in order to match
the stagnation points of the full-scale airfoil at angles of attack of 2, 4, and 6°, requiring it be tested at angles of
attack of 2, 5, and 8°, respectively, to match ice shape. The resulting Cp distribution, β curve, and ice shape are
presented for α = 2, 4, and 6° in Fig. 17.b, c, and d, respectively. Once again, satisfactory β and ice shape matching
were obtained.
a)
0 0.1 0.2 0.3 0.4 0.5 0.6 0.7 0.8 0.9 1
-0.05
0
0.05
0.1
0.15
x/c0
y/c
0
Full Scale
Hybrid (D=0°)
0 0.2 0.4 0.6 0.8 1
-1.5
-1
-0.5
0
0.5
1
Cp
x/c0
Full Scale - =2°
Hybrid (D=0°) - =2°
ClFS
= 0.533
ClHyb
= 0.308
0 0.2 0.4 0.6 0.8 1
-2
-1.5
-1
-0.5
0
0.5
1
Cp
x/c0
Full Scale - =4°
Hybrid (D=0°) - =5°
ClFS
= 0.768
ClHyb
= 0.486
0 0.2 0.4 0.6 0.8 1
-4
-3
-2
-1
0
1
Cp
x/c0
Full Scale - =6°
Hybrid (D=0°) - =8°
ClFS
= 0.999
ClHyb
= 0.660
-0.05 0 0.05 0.1 0.15
0.1
0.2
0.3
0.4
0.5
s/c0
Full Scale - =2°
Hybrid (D=0°) - =2°
-0.05 0 0.05 0.1 0.15
0.1
0.2
0.3
0.4
0.5
s/c0
Full Scale - =4°
Hybrid (D=0°) - =5°
-0.05 0 0.05 0.1 0.15
0.1
0.2
0.3
0.4
0.5
s/c0
Full Scale - =6°
Hybrid (D=0°) - =8°
Dow
nloa
ded
by U
NIV
ER
SIT
Y O
F IL
LIN
OIS
on
Aug
ust 1
4, 2
013
| http
://ar
c.ai
aa.o
rg |
DO
I: 1
0.25
14/6
.201
3-28
26
Copyright © 2013 by Gustavo Eidji Camarinha Fujiwara, Brian Woodard, Brock Wiberg, Andrew Mortonson, Michael Bragg. Published by the American Institute of Aeronautics and Astronautics, Inc., with permission.

American Institute of Aeronautics and Astronautics
15
b) c) d)
Figure 17. Hybrid airfoil designed to αD = 0° a) Geometry
Run to match ice shape at b) α = 2° c) α = 4° d) α = 6°
IV. Model-Design Trade-Offs
The ultimate goal of designing hybrid airfoil models for icing wind tunnel tests is to match the full-scale airfoil
ice shape. An ideal hybrid airfoil model would produce full-scale ice shape similitude with no flow separation,
minimum model load, and minimum wind tunnel blockage. Of course this is not an achievable design, requiring
compromises in the design process. To accomplish the design using the method described in this paper, the designer
has five hybrid airfoil design parameters: nose droop, Cm0, extent of the full-scale leading-edge section, scale factor,
and flap design.
Matching ice shapes depends primarily on obtaining similar aerodynamic (and thus heat transfer) characteristics
in the near-field region, stagnation point location being of first-order importance, and suction peak magnitude of
second order. This can be accomplished varying the camber distribution (through Cm0 and nose droop) or through
the design and application of a flap.
The above aerodynamic conditions required for ice-shape matching might not be met if flow separation occurs.
Flow separation affects the stagnation point location due to the decrease in lift generated by the airfoil, not to
mention the possibility of inducing undesirable three-dimensional aerodynamic effects on the model, and significant
unsteadiness in the flow. Designs can avoid or minimize flow separation by carefully controlling the location and
intensity of adverse pressure gradients by varying the parameters Cm0 and nose droop which control the hybrid
model camber distribution. More front load, achieved by employing more negative nose droop, leads to higher risk
of separation near the leading-edge, while more aft load, achieved by employing more negative Cm0 or higher flap
deflection, leads to higher risk of separation near the trailing-edge. Also, the higher the scale factor, the higher the
chance of flow separation due to the reduced hybrid airfoil chord potentially leading to higher airfoil lift coefficients
and therefore more required pressure recovery.
Another design constraint concerns the model loads, which may be constrained by limits imposed by the tunnel
balance and turntable. Hybrid model loads can be compared directly by considering the hybrid airfoil lift coefficient
based on the full-scale chord at the given design condition, but very different hybrid airfoil loads can be obtained
while still matching the ice shape. For example, loads can be reduced while still matching the stagnation point and
ice shape by increasing the scale factor (which forces airfoils to generate lift closer to the same full-scale leading-
edge) and/or adding more front load through the addition of more negative nose droop. However, these same
measures that decrease load increase the chance of flow separation.
Blockage effects should be kept to minimum levels while attempting to maintain wind tunnel flow speed and the
airfoil aerodynamic characteristics as close as possible to the flight conditions, but unfortunately, a similar trade-off
exists. Blockage can be reduced by either decreasing the hybrid airfoil thickness by reducing the full-scale leading-
edge extent or decreasing the total model size by increasing the scale factor. Again these come at the cost of
sacrificing the full-scale ice shape accuracy and increasing the chance of flow separation, respectively, requiring
proper engineering judgment and inevitable model compromises.
Especially for large models, the effect of wind tunnel walls on model aerodynamics, droplet trajectories, and ice
accretion should be considered in the final model design. Current research efforts include the use of 3-D CFD
methods (including LEWICE 3D) to examine this effect on the hybrid model design and performance. Particular
concerns include the potential model and sidewall flow separation due to the sometimes high lift coefficients of
these large models. Future hybrid model design methods will incorporate wall effects into the design process.
0 0.02 0.04 0.06 0.08 0.1
-0.02
0
0.02
0.04
0.06y/c
0
x/c0
Clean
Full Scale - =2°
Hybrid (D=0°) - =2°
0 0.02 0.04 0.06
-0.03
-0.02
-0.01
0
0.01
0.02
0.03
0.04
y/c
0
x/c0
Clean
Full Scale - =4°
Hybrid (D=0°) - =5°
0 0.02 0.04 0.06
-0.03
-0.02
-0.01
0
0.01
0.02
0.03
0.04
y/c
0
x/c0
Clean
Full Scale - =6°
Hybrid (D=0°) - =8°
Dow
nloa
ded
by U
NIV
ER
SIT
Y O
F IL
LIN
OIS
on
Aug
ust 1
4, 2
013
| http
://ar
c.ai
aa.o
rg |
DO
I: 1
0.25
14/6
.201
3-28
26
Copyright © 2013 by Gustavo Eidji Camarinha Fujiwara, Brian Woodard, Brock Wiberg, Andrew Mortonson, Michael Bragg. Published by the American Institute of Aeronautics and Astronautics, Inc., with permission.

American Institute of Aeronautics and Astronautics
16
V. Conclusions
The use of hybrid (truncated) airfoils for icing wind tunnel testing was explored in this paper and found to
generate full-scale ice accretions over a range of design parameters. The following conclusions can be drawn from
this study:
With the use of a flap, hybrid models can produce full-scale ice shapes for a range of angles of attack.
The shorter chord length of the hybrid models allows not only wind tunnel tests to be performed with
significantly less blockage, but also imposes lower aerodynamic forces on tunnel balances and turntables as
a consequence of the reduced circulation due to more forward loading, as discussed.
The limits of hybrid model scaling depend on the ability to maintain similar flowfield, aerodynamic, and
heat transfer characteristics between full-scale and hybrid airfoils.
Matching stagnation point was shown to be a first order parameter in matching the ice shape, while Cp peak
(suction peak) magnitude was of second order, correlating to the heat transfer coefficients near the horn
regions.
It was shown that there is no uniqueness in the relationship between stagnation point and lift coefficient for
a hybrid airfoil design. In fact, different combinations of Cm0 and nose droop angle produced the same
stagnation point, and thus ice shape, with different loading and lift coefficients.
A careful balance between Cm0 and nose droop angle should always be sought when trying to match
stagnation point and suction peak magnitude, also aided by proper judgment of adverse pressure gradients
to avoid flow separation on either upper or lower surfaces.
Leading-edge extents do not need to be maintained beyond impingement limits to produce good ice shapes.
In fact, lower surface extents may be ahead of the lower limit of impingement. Thus, wind tunnel size
constraints and engineering judgment based on information about the full-scale ice shape, impingement
limits, icing conditions (how much runback is expected) should all be considered when selecting leading-
edge extents.
When carefully designed, hybrid airfoils with scale factors larger than 2 can be effective and offer
considerable benefits, not the least of which is that they allow testing of large wing sections that would still
be far too large for a wind tunnel even with a chord truncated by 50%. They also have the additional benefit
of reducing loading, another consideration that can be a limiting design constraint for wind tunnel models.
Higher scale factors up to 5 demonstrate good performance in producing full-scale ice shapes with much
reduced loads, but their application is bounded to smaller angles of attack and careful attention is required
in the design process to avoid severe separation. As ice accretes, separation becomes more severe
suggesting that large SF hybrids may also not be suitable for long duration icing tests.
Flapped hybrid designs offer additional benefits; first, they provide a method for running hybrids at off-
design conditions, allow fine tuning of hybrid for design condition, and provide favorable flow
characteristics which can help maintain attached flow at higher scale factors.
In the absence of a flap or flap deflection, the angle of attack of the hybrid airfoil can be varied to adjust the
stagnation point location. Because stagnation point location has a first order impact on ice shape while
other effects such as suction peak and 3D flow may have only a second order impact, varying the angle of
attack to match stagnation point is a crude but effective method for matching ice shape.
Dow
nloa
ded
by U
NIV
ER
SIT
Y O
F IL
LIN
OIS
on
Aug
ust 1
4, 2
013
| http
://ar
c.ai
aa.o
rg |
DO
I: 1
0.25
14/6
.201
3-28
26
Copyright © 2013 by Gustavo Eidji Camarinha Fujiwara, Brian Woodard, Brock Wiberg, Andrew Mortonson, Michael Bragg. Published by the American Institute of Aeronautics and Astronautics, Inc., with permission.
American Institute of Aeronautics and Astronautics
17
Acknowledgements
The funding for this research was provided by NASA grant NNX12AB04A. The authors would like to
acknowledge Andy Broeren, Mark Potapczuk, and the rest of the NASA Glenn Icing Research Branch for their
many technical contributions as well as Boeing engineers Bernard Paul, Adam Malone, Cris Bosetti, John Vassberg,
and Abdi Khodadoust. Acknowledgements are also extended to Eric Loth and Chris Triphahn of the University of
Virginia and University of Illinois, respectively, who assisted with investigations of hybrid designs through CFD
methods. Additionally, the authors thank the graduate students Jeff Diebold and Phil Ansell at the University of
Illinois at Urbana-Champaign, who did preliminary research on this topic, and undergraduate student Stephanie
Camello for gridding some of the 2-D CFD solutions.
References
1Bragg, M.B., Broeren, A.P, Blumenthal, L.A., “Iced-Airfoil Aerodynamics,” Progress in Aerospace Sciences, Vol. 41, No.
5, 2005, pp. 323-418. 214 CFR Part 25, Appendix C. Part I - Atmospheric Icing Conditions. 3Anderson, D. N., “Manual of Scaling Methods,” NASA CR-2004-21287. 4Von Glahn, U.H., “Use of Truncated Flapped Airfoils for Impingement and Icing Tests of Full-scale Leading-Edge
Sections,” NACA/RM E56E11, 1956.
5Saeed, F., Selig, M.S., Bragg, M.B., “Design of Subscale Airfoils with Full-scale Leading-Edges for Ice Accretion Testing”,
AIAA Journal of Aircraft, Vol. 34, No. 1, 1997, pp. 94-100.
6Mortonson, A. J., “Use of Hybrid Airfoil Design in Icing Wind Tunnel Tests of Large Scale Swept Wings,” M.S.
Dissertation, Dept. of Aerospace Engineering, University of Illinois at Urbana-Champaign, Champaign, IL, 2011. 7Broeren, A. P., Potapczuk, M. G., Riley. J. T., Villedieu, P., Moëns, F., Bragg, M. B., “Swept-Wing Ice Accretion
Characterization and Aerodynamics”, AIAA 5th Atmospheric and Space Environments Conference, San Diego, CA, June 24-27,
2013 (submitted for publication).
8Vassberg, J.C., DeHaan, M.A., Rivers, S.M., Wahls, R.A., "Development of a Common Research Model for Applied CFD
Validation Studies,” AIAA-2008-6919, 2008.
9Rivera, M.B., Dittberner, A., “Experimental Investigation of the NASA Common Research Model” AIAA Applied
Aerodynamics Conference, AIAA, Chicago. 2010.
10PROFOIL A Multipoint Inverse Airfoil Design Method, Version 2.0, Selig, M.S., Champaign, IL, 1999.
11XFOIL, Version 6.9, Drela, M. and Youngren, H., Boston, MA, 2001.
12AIRDROP, Bragg, M.B., Urbana, IL, 1990.
13PROFOIL A Multipoint Inverse Airfoil Design Method, Version 2.0, Selig, M.S., Champaign, IL, 1999.
14Drela, M., “XFOIL: An Analysis and Design System for Low Reynolds Number Airfoils,” MIT Dept. of Aeronautics and
Astronautics, 1989.
15Selig, M.S. Mauhmer, M.D., “Multipoint Inverse Airfoil Design Method Based on Conformal Mapping” AIAA Journal,
Vol. 30, No. 5, 1992, pp. 1162-1170. 16ANSYS FLUENT 12.0 User’s Guide. ANSYS, Inc. April, 2009. 17Steinbrenner, J. P., Abelanet, J. P., “Anisotropic Tetrahedral Meshing Based on Surface Deformation Techniques”, AIAA. 18Pointwise User Manual, Pointwise, Inc., Fort Worth, Texas. 2013, pp. 306-318. 19Wright, W.B., “User Manual for the NASA Glenn Ice Accretion Code LEWICE Version 2.2.2”, NASA/CR-2002-211793,
2002. 20Ruff, G.A. “Quantitative Comparison of Ice Accretion Shapes,” AIAA Journal of Aircraft, Vol. 39, No. 2, 2002, pp. 418-
426. 21Bragg, M.B., Broeren, A., Addy, H., Potapczuk, M., Guffond, D., Monteruil, E., “Airfoil Ice-Accretion Aerodynamics
Simulation”, AIAA, Urbana, IL, 2007. 22Broeren, A.P., Bragg, M.B., Addy, H.E., Lee, S., Moens, F., Guffond, D., “Effect of High-Fidelity Ice-Accretion
Simulations on Full-scale Airfoil Performance” AIAA Journal of Aircraft, Vol. 47, No.1, 2010, pp. 240-254. 23Saeed, F., Selig, M.S., and Bragg, M.B., “Hybrid Airfoil Design Method to Simulate Full-scale Ice Accretion Throughout a
Given α Range” AIAA Journal of Aircraft, Vol. 35, No.2, 1998, pp. 233-239. 24Saeed, F., Selig, M.S., Bragg, M.B., “Hybrid Airfoil Design Procedure Validation for Full-scale Ice Accretion Simulation”,
AIAA Journal of Aircraft, Vol. 36, No.5, 1999, pp. 769-776. 25McLean, D. J., Understanding Aerodynamics: Arguing from the Real Physics, 1st Edition, John Wiley & Sons Ltd.,
November 2012, Chap 8, pp. 444-449. 26Langmuir, I., Blodgett, K. B., “A Mathematical Investigation of Water Droplet Trajectories”, Tech. Rep No. 5418, Air
Material Command, AAF, Feb. 19, 1946. 27Shah, A. D., Patnoe, M. W., Berg, E. L., “Droplet Size Distribution and Ice Shapes”, AIAA, 1997.
28TUNDROP, Wells, S. Urbana, IL. 1992.
Dow
nloa
ded
by U
NIV
ER
SIT
Y O
F IL
LIN
OIS
on
Aug
ust 1
4, 2
013
| http
://ar
c.ai
aa.o
rg |
DO
I: 1
0.25
14/6
.201
3-28
26
Copyright © 2013 by Gustavo Eidji Camarinha Fujiwara, Brian Woodard, Brock Wiberg, Andrew Mortonson, Michael Bragg. Published by the American Institute of Aeronautics and Astronautics, Inc., with permission.
American Institute of Aeronautics and Astronautics
18
29Bragg, M.B., Wells, Stephen L. “Effect of Wind-Tunnel Walls on Airfoil Droplet Impingement”; AIAA Journal of Aircraft,
Vol. 31, No.1, 1994 , pp. 175-180. 30Barlow, J.B., Rae, W.H, and Pope.A. Low Speed Wind Tunnel Testing, 3rd Edition, Wiley-India Pvt. Ltd. New Delhi, 2010,
Chap. 9.
Dow
nloa
ded
by U
NIV
ER
SIT
Y O
F IL
LIN
OIS
on
Aug
ust 1
4, 2
013
| http
://ar
c.ai
aa.o
rg |
DO
I: 1
0.25
14/6
.201
3-28
26
Copyright © 2013 by Gustavo Eidji Camarinha Fujiwara, Brian Woodard, Brock Wiberg, Andrew Mortonson, Michael Bragg. Published by the American Institute of Aeronautics and Astronautics, Inc., with permission.