Embed Size (px)
Citation preview
1
A Guide to Booking Airline Tickets Online
Volodymyr Bilotkach University of California, Irvine
Nicholas Rupp East Carolina University
Abstract
In this study, we document and analyze price‐offer curves (the dynamics of offered prices as the departure date approaches) for 105 specific round trip itineraries on 50 busy US routes. The data were collected from the three leading on‐line travel agents’ web‐sites. We exploit across‐route variation in the level of competition and presence of low‐cost carriers (LCC), in particular Southwest Airlines (a carrier that does not sell its tickets through on‐line travel agents). Both fares and yields are consistently higher along the entire price‐offer curve on less competitive markets, and on routes without LCC presence. Price changes are smoother on competitive routes than on markets with one or two competitors. Price drops are observed across a spectrum of the markets, and at any day prior to departure. In particular, at least one price drop was observed within ten days before the flight for about half of all the round trips we tracked. In about one‐third of round trip itineraries, we observed price drops in the last week prior to departure. At the same time, the shape of the average price‐offer curve is as expected – flat up to about three weeks before the flight, and rising rapidly afterwards. We do not document systematic differences across on‐line travel agents; however, differences in price quotes are not infrequent. Simple cost‐benefit analysis shows that when booking a ticket closer to the planned departure date; a traveler should comparison‐shop.

2
1. INTRODUCTION
This study traces the evolution of offered airfares on 50 busy routes on the US domestic market. Our approach differs from that in the literature in the following ways. First, we trace the lowest offered fares for specific round trip itineraries, acknowledging both that many trips involve return travel, and that the round trip airfare is often not equal to the sum of the two one‐way fares. Many previous studies (e.g., Escobari, 2009; Escobari and Gan, 2007) either looked at fare quotes for specific one‐way flights, or examined the lowest round trip quote available. Second, our sample of half of the top 100 domestic routes includes itineraries from markets with varying number of competitors, as well as from markets with and without the presence of low cost carriers (LCCs). Third, we have collected fare quotes simultaneously from three leading on‐line travel agents. Thus, our research design allows us to see whether any systematic airfare differences exist across the different on‐line distributors of travel services.
We arrive at five stylized facts regarding the dynamics of airline price‐offer curves. First, both fares and yields are consistently higher along the entire price‐offer curve on less competitive markets, and on the routes without LCC presence. Second, price changes are smoother on competitive routes than on markets with one or two competitors. Third, price drops are observed across a spectrum of the markets, and at any day prior to departure. In particular, at least one price drop was observed within ten days before the flight for about half of all the round trips we tracked. In about one‐third of round trip itineraries, price drops within the last week prior to departure were observed. Fourth, the shape of the averaged price‐offer curve is as expected – flat up to about three weeks before the flight, and rising rapidly afterwards. Fifth and finally, we do not document systematic differences across on‐line travel agents, however, differences in price quotes are not infrequent.
From a consumer point of view, this paper offers some insight into the optimal booking strategy for an air traveler. First, substantial price increases generally do not happen until three weeks before the flight date – this suggests that the optimal time to purchase a ticket for a price‐conscious traveler is about three to four weeks before the departure date. Second, for airline passengers making last minute purchases, waiting for future price reductions is a risky proposition, since the price trajectory clearly trends upward in the days immediately before departure. Hence waiting for price changes has a negative expected value. Looking at cumulative price changes from 14 to one day before departure in our sample, we find that the average price quote increases by 120 percent over the last two weeks before the flight departure date. At the same time, last minute price drops are more common than conventionally believed. Finally, a simple cost‐benefit analysis of checking fare quotes from different travel agents shows that shopping around appears justified when booking three or fewer weeks prior to departure. Overall, our message to the traveler is: if you book in advance,

3
wait until about four weeks before the planned departure date, and do not shop around. If you have to book closer to the departure date, do not wait, but do shop around.
Studies analyzing samples of offered fares started re‐emerging recently (the first such work can be traced to Stavins’ 2001 study of price dispersion in the US airline industry); and this literature is expected to grow at a fast pace in the near future. Among the topics addressed in this literature are price dispersion (Bilotkach, 2006; Escobari, 2005; Escobari and Gan, 2007; Giaume and Guillou, 2006; Gaggero and Piga, 2011); price dynamics (Piga and Bachis, 2006; Button and Vega, 2007); and fare comparison across booking engines (Chen, 2006; Clemons et al., 2002). Our contribution to this literature is methodological (we are tracing fare quotes for specific round trip itineraries, which is not a common practice), and practical (we both analyze how price‐offer curves differ depending on the underlying market structure, and are able to provide some stylized facts to the traveling public).
The rest of the study is organized as follows. Section 2 discusses the data collection process. Section 3 describes the data analysis exercise. Section 4 concludes. A list of the markets included into our study appears in the Appendix.
2. DATA COLLECTION
Our data collection methodology assumes a week long round‐trip journey, which could be either a business trip, or a visit to friends or relatives. We semi‐randomly select 50 of the top 100 (based on non‐stop passenger traffic) US domestic routes. Our route selection procedure was not exactly random, as we strove for inclusion of markets with varying degree of non‐stop competition into the study. Thus, we first determined which markets were monopolies (as far as non‐stop travel is concerned, at the airport‐pair‐market level) and duopolies, classifying the other markets as competitive. Then, we randomly selected routes out of each of these three sub‐sets of markets. For each route, we randomly assigned whether we would track fares for morning (8am), mid‐day (noon), or evening (5pm) departures. Airport‐pair markets we have chosen reflect a variety of route competition options, from a single carrier to four carriers offering non‐stop service. And perhaps more importantly, low‐cost carriers (Jetblue, Airtran, Frontier, Virgin America, and Southwest Airlines) are also present on some of the routes. In addition to being the leading low‐cost airline in the United States,1 Southwest Airlines is notable for its ticket distribution strategy: among the major US carriers, Southwest is the only one that does not sell its tickets via the major on‐line travel agents, relying primarily on its web‐site (see Bilotkach, 2010, for more detailed discussion of this aspect of Southwest Airlines’ strategy). The list of markets selected for our data collection exercise appears in the Appendix.
1 At the time that these data were collected this statement is correct, however, as of January 2011, American Airlines is no longer selling its tickets on either Expedia or Orbitz due to a contract dispute with these travel agents.

4
Fare quotes have been collected simultaneously via three leading on‐line travel agents’ web sites. Online travel agents as a group sell about one quarter of all domestic airline tickets in the U.S. market. The online travel agent segment of the ticket distribution market is dominated by the three major players: Travelocity (owned by Sabre, currently a privately held company), Expedia (founded within Microsoft in 1995, and an independent publicly traded company since 2005), and Orbitz (started through a partnership of several major airlines in 2001, currently a subsidiary of Travelport, owned by the Blackstone Group – a private equity company). According to the US Department of Transportation, in 2002, 28.5 percent of all bookings with online travel agents were on Travelocity; 28.7 percent – on Expedia and 21.3 percent on Orbitz, for a total of 78.5 percent of all U.S. travel reservations via an on‐line travel agent.2 We chose to collect prices from the three different sources in light of studies suggesting one could observe substantial differences in fare quotes across the major travel agents (Bilotkach and Pejcinovska, 2011; Bilotkach and Rupp, 2010).
Instead of collecting the lowest available round‐trip fare, as other similar studies have done, we focus on specific round‐trip itineraries. This means we trace the lowest offered prices for a specific flight number beginning eight weeks prior to departure. Fares are pulled weekly up to two weeks before departure; then, fares are collected approximately every three days within two weeks of departure. If a particular flight number is no longer available in the airline’s schedule, then we select the same airline’s flight operating as close as possible to the original flight. Only a few such substitutions were made with these occurring typically well in advance of the departure date. The flight departure dates are Wednesday, June 17, 2009, and Friday, June 19, 2009, with the return flight a week later.
For each of the markets included into our study, we have picked one specific round trip itinerary for each airline operating non‐stop service on the route. For example, on the Atlanta‐Newark route Delta, Air Tran, and Continental operate non‐stop flights on this route, hence we collect the lowest fare offered for a specific flight for three itineraries in this market. Given that we track fare quotes simultaneously for three on‐line travel agents’ web‐sites, each day of data collection for this route results in nine fare quotes (3 airlines * 3 travel agents). As fifty markets we selected varied in terms of the number of competitors, we ended up tracking 105 specific round trip itineraries, representing all of the major carriers except Southwest Airlines. Details are in the Appendix.
Fare quotes were collected 56, 48, 42, 35, 28, 21, 14, 10, 7, 4, and 1 day before the scheduled flight date. We increased the frequency of data collection starting two weeks prior to departure, as recent evidence from the data set of actual ticket purchases (Puller et al., 2009) suggests that
2 Travel agency market share data are from “Computer Reservations System Regulations: Final Rule”, 14 CFR Part 255.

5
most of the actual ticket purchases occur at the last minute. In the end, for each round trip itinerary, we have obtained three so‐called “price offer curves”, or profile of fare quotes as the departure day nears. Analysis of these data appear in the next section.
3. DATA ANALYSIS
3.1 General
This section addresses the following issues:
(1) Trends of fare quotes as the flight date approaches. Specifically, we would like to know the following:
• Do fares typically rise as the departure date nears?
• Does route competition including the presence of LCC carriers affect either the level or dynamics of price changes prior to departure?
(2) Instances of price drops as the departure date approaches. In particular, we are interested in the following questions:
• How frequent are price reductions?
• Are price drops more common the closer to the departure date? (3) Differences across online travel agents. The relevant questions include:
• Are there systematic differences in fare quotes for travel agents?
• Are fare differences across travel agents more prevalent the closer to the departure date? We expect to find more differences for two reasons. First, consumers buying last minute tickets may not have time to shop around. Second, airline‐agent contracts may reserve the best (lowest) last minute fares with a particular preferred online travel agent, hence the discrepancy in offered fares.
Our goal is to inform the traveling public on the behavior of offered prices across time, and hence help customers make more informed decisions on the optimal time to book airline tickets.
3.2 Trends in Price Quotes
Figure 1 presents the general trend of averaged offered fares as the departure date nears. It is clear from this figure that the average quotes are rather flat up to 28 days prior to the flight departure; afterwards, a clear upward trend is observed. One lesson for travelers is that the lowest fares typically are offered for passengers booking tickets more than a month in advance of departure. We observe little price differences between fares offered many weeks in advance, as compared to fares four weeks prior to departure. Substantially lower fares, however, are unlikely in the final four weeks prior to departure. In sum, for passengers considering whether to book a ticket more than four weeks in advance, it may be beneficial to wait before buying, as

6
future price reductions are possible (we will discuss this issue in more detail later), while significant price increases are unlikely.
<INSERT FIGURE 1 HERE>
Descriptive analysis of both fare quotes and corresponding yields (fare per mile flown) relative to the market structure produces rather expected results. Specifically, Figure 2 provides a graphical representation of the difference in average yields based on whether the route is served by a monopolist:
Difference = Yieldt(Monopoly) – Yieldt(Non‐monopoly)
where t represents the date before departure. We conduct a similar calculation for the yield differences for routes with and without a low‐cost carrier (and Southwest Airlines) presence:
Difference = Yieldt(LCC) – Yieldt(Non‐LCC).
We present both differences between the means, and the corresponding 95% confidence intervals. The 95% confidence interval on Figure 2 indicates significant differences for average yields on monopoly versus non‐monopoly routes every day that sample fares are collected prior to departure. Figure 3 shows that yields are also significantly higher in markets without the presence of a LCC carrier (i.e., Southwest, Frontier, Jetblue, Air Tran, Virgin America). Figure 4 presents a similar depiction of yield differences on routes served by Southwest Airlines compared to non‐Southwest routes.
In each of these figures (2, 3, and 4) we note that the corresponding differences in yields actually increase as the departure day nears. Comparing how these differences in yields change prior to departure reveals that the largest changes occur on Monopoly routes versus Non‐Monopoly markets, with the difference in yields rising from 5 cents per mile 21 days in advance to over 25 cents per mile the day before departure (a five‐fold increase in the yield differential). In comparison, difference in yields for non‐LCC versus LCC routes increases by a smaller magnitude as departure date nears, rising from 5 cents (21 days in advance) to about 20 cents (1 day before departure). To put this into perspective, fare quote for a 2000‐mile round trip journey (such as a trip from Washington DC to Miami) the day before the flight would be about $400 higher if no low‐cost carriers were present on the route. An even smaller increase occurs when comparing non‐Southwest routes to routes where Southwest is present; the yield difference rises from about 5 cents (21 days before departure) to about 17 cents (a day before departure).
That is, not only are travelers on routes without a LCC presence asked to pay more per mile flown; the differential increases as the departure date nears.

7
<INSERT FIGURE 2 HERE>
<INSERT FIGURE 3 HERE>
<INSERT FIGURE 4 HERE>
We also detect rather curious facts about the dynamics of price changes. Looking at the percentage changes in fare quotes as the departure date nears; Figure 5 shows that the presence of an LCC does not make the trend much smoother than its absence. In comparison, the corresponding graph from Figure 6 looks much smoother for the competitive markets (markets with three or four airlines offering non‐stop services). Figures 5 and 6 also demonstrate that the largest percentage increases in offered fares are observed ten and four days prior to the flight’s departure.
<INSERT FIGURE 5 HERE>
<INSERT FIGURE 6 HERE>
3.3 Price Drops
Throughout this analysis, we will define price drops as more than a $1 reduction in fare quotes between the two dates of data collection. We did not consider cases where price quotes were unavailable on the next date of collection as price drops.
The following stylized facts stand out. First, drops in offered fares as the departure date nears are not uncommon. In fact, in our sample we have observed price drops both 49 days and one day before the scheduled departure of the flight (and, for every single day of data collection in between). At the same time, price drops are clearly more likely to occur 28 or more days prior to the flight’s departure. This is visible from Figure 7 below. Combined with our previous observation that prices do not start increasing until about 21 days before departure; we can say that it generally makes sense to wait until 4 weeks or so before the planned trip date before buying the ticket.
Even if you have to make the booking two to three weeks in advance or sooner; waiting for the price drop can pay off. This decision, however, is like playing a lottery with a negative expected value, since the price is more likely to increase than to decrease.
<INSERT FIGURE 7 HERE>
The second stylized fact is that we observed at least one price drop over the data collection process for most of the itineraries included into our analysis. Figure 8 below shows that no price drops have been observed for only about 8 percent of all the itineraries (more specifically, no price drops were observed for six itineraries on Orbitz, eight on Expedia, and nine on
8
Travelocity). The modal number of price drops per itinerary is two for all travel agents; the median is two for Expedia and Travelocity; three for Orbitz. This means that for about half of the itineraries in our sample, the price went down three or more times as the departure date approached. The maximum number of price drops observed for an itinerary was six (recorded for one itinerary on Expedia and Travelocity).
<INSERT FIGURE 8 HERE>
Looking at the relationship between the airline’s market share and the likelihood of a price drop, we observe that more dominant carriers on the route tend to decrease their fare quotes less frequently. Differences in the frequency of price drops are especially visible for carriers with 50+ percent market share 28, 14, and 7 days prior to the flight departure.
<INSERT FIGURE 9 HERE>
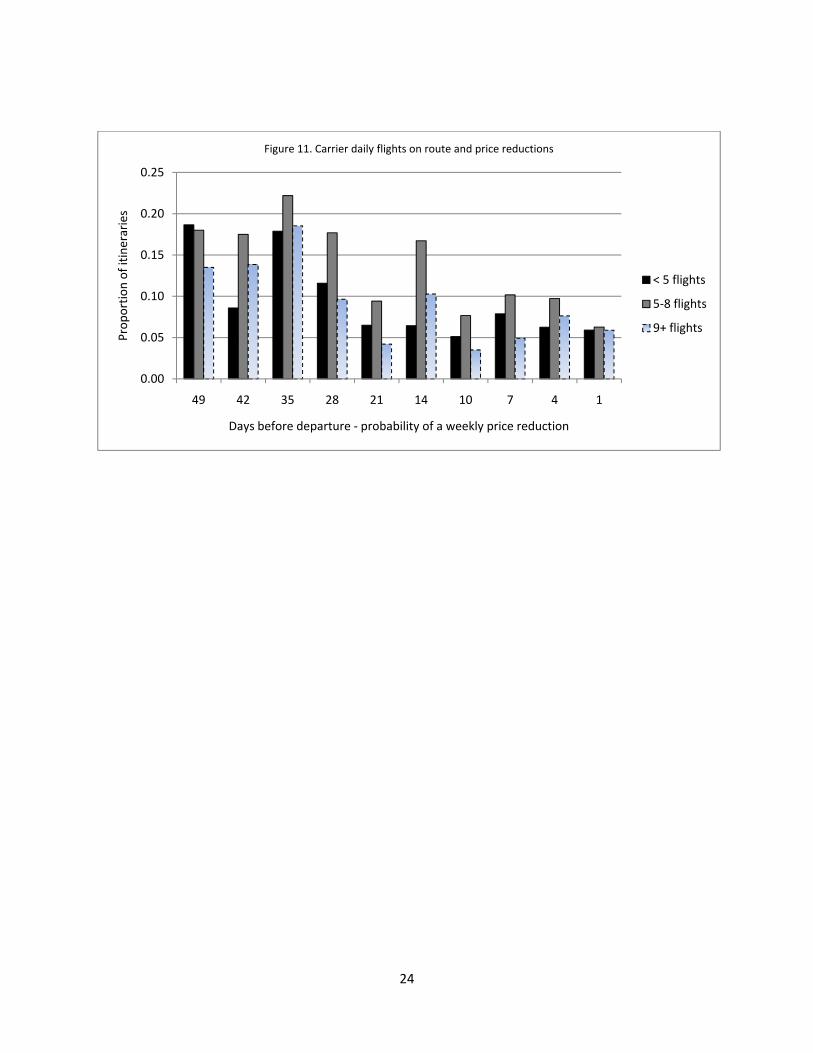
We noted above that we have tracked fare quotes for specific round trip itineraries. We have also determined how many non‐stop flights operate on the day of the flight on each of the markets under consideration, both at the airline and market level. The following figures demonstrate that fewer price drops occur on ‘thinner’ markets (those with fewer flights) closer to the departure date. Interestingly, one to four weeks before departure, airlines which operate more flights on the route are less likely to drop their fares compared to carriers operating fewer daily flights.
<INSERT FIGURE 10 HERE>
<INSERT FIGURE 11 HERE>
3.4 Differences across Agents
Next we turn to price differences across the three major online travel agents. We find that on average agents offer nearly identically priced itineraries. Differences in fare quotes, however, were not uncommon, especially within three weeks of departure. Indeed, one day prior to departure, only seven out of ten itineraries are similarly priced by all three travel agents (meaning that the difference in fares quoted by any two of the three agents is within $5). Again, these observations are visualized on the figures below.
<INSERT FIGURE 12 HERE>
From Figure 12, we can see that Expedia does come out as somewhat of a “low price leader” for fare quotes 14 and 7 days before the flight. In absolute terms, however, this “leadership” does not amount to any significant difference in prices.

9
Figure 13 shows the frequency of similar fares by all three travel agents across airlines. Two figures are reported for each day of data collection: the share of itineraries relative to all itineraries we tracked (105); and the same relative to the number of itineraries for which all three travel agents reported a fare quote. Note that in some cases (more so closer to the departure date) some travel agents did not report any fare quotes for the specific flight combination we have chosen. Our guess is that this could be due to differences in travel‐agent‐airline contracts regarding presentation of overbooked flights. For the purpose of constructing the figure below, we treated fare quotes within $5 of each other as identical.
<INSERT FIGURE 13 HERE>
It is visible that agents report nearly identical fare quotes for the same itineraries about 80 percent of the time, or at least in 7 out of 10 cases where all agents report quotes for the itineraries we have been tracking. The largest share of itineraries with identical quotes occur 10, 28, and 35 days prior to the flight’s departure. Fare discrepancies are somewhat more prevalent closer to the flight departure date. As we noted above, a day before departure date we observe either differences in fare quotes ($5+) or some agents not offering fares for about seven out of ten itineraries.
3.5 Cost‐Benefit Analysis of Searching for Additional Fare Quotes
One lesson for the traveler from this analysis is that even though on average all travel agents report identical fare quotes; it still may make sense to shop around. Checking one more travel agent’s web‐site is relatively costless; and you might find a different (not necessarily a better) deal less than 20 percent of the time. Hence, the expected benefit still appears to outweigh the costs.
For example, consider a case of booking a round trip from Atlanta to Boston with Delta Air Lines seven days prior to departure. In our sample, the fare quoted by Travelocity for that trip was $323, while both Orbitz and Expedia quoted $313, or $10 lower fare. A customer starting his/her search from Travelocity would save $10 if he/she checked other travel agents’ web‐sites. The marginal cost of performing this additional check is $2 (based on the assumption that consumers need three minutes per each additional fare check, and the consumer’s time is valued at $20 per hour). Of course, our hypothetical traveler would not gain anything if he/she started searching with Orbitz or Expedia to begin with. Yet, assuming the first site to check the fare quotes is chosen randomly, it still makes sense to perform additional searches, in our Atlanta‐Boston trip example. One third of the time, you gain $8 ($10 difference in fares net of $2 marginal cost of search); and with probability of 2/3 you lose $2, so the expected value is positive. Additional search, however, does not yield positive expected value in our example for
10
a traveler with a time valuation of $33.33/ hour or higher3. Averaged across 105 itineraries for fare quotes 7 days before the flight departure, maximum hypothetical savings from searching around is $24.50. This means that on average a traveler with value of time of $81.68 or less should continue searching 7 days before the departure, assuming two out of three agents offer the lowest fare quote for a specific itinerary.
To see how much a hypothetical traveler can save from searching around, Table 1 presents the average highest potential savings from checking all three travel agents’ sites (defined as the absolute difference between the highest and the lowest quote for a given itinerary on a given day). Savings are clearly the lowest for fare quotes collected 35 and 28 days prior to departure, and the highest for quotes obtained 7 days prior to the flight date. Overall, average savings from searching across travel agents appear modest; however, given low marginal cost of search, a traveler with value of time of $15/hour will be advised to shop around when booking a flight three weeks to one day before departure.
<INSERT TABLE 1 HERE>
Combining results reported in Table 1 with the previously outlined information on dynamics of fare quotes, we can make the following suggestions to the traveler. If you are booking in advance, wait until about four weeks prior to the planned flight date, and take the first price quote you encounter (assuming you book with one of the three major on‐line travel agents included in this study). If you are booking three weeks or sooner before your planned departure date, do not wait (as prices will rise rather than fall); however, do shop around – the money you may save will likely be worth the effort.
3.6 The Dynamics of Price Changes
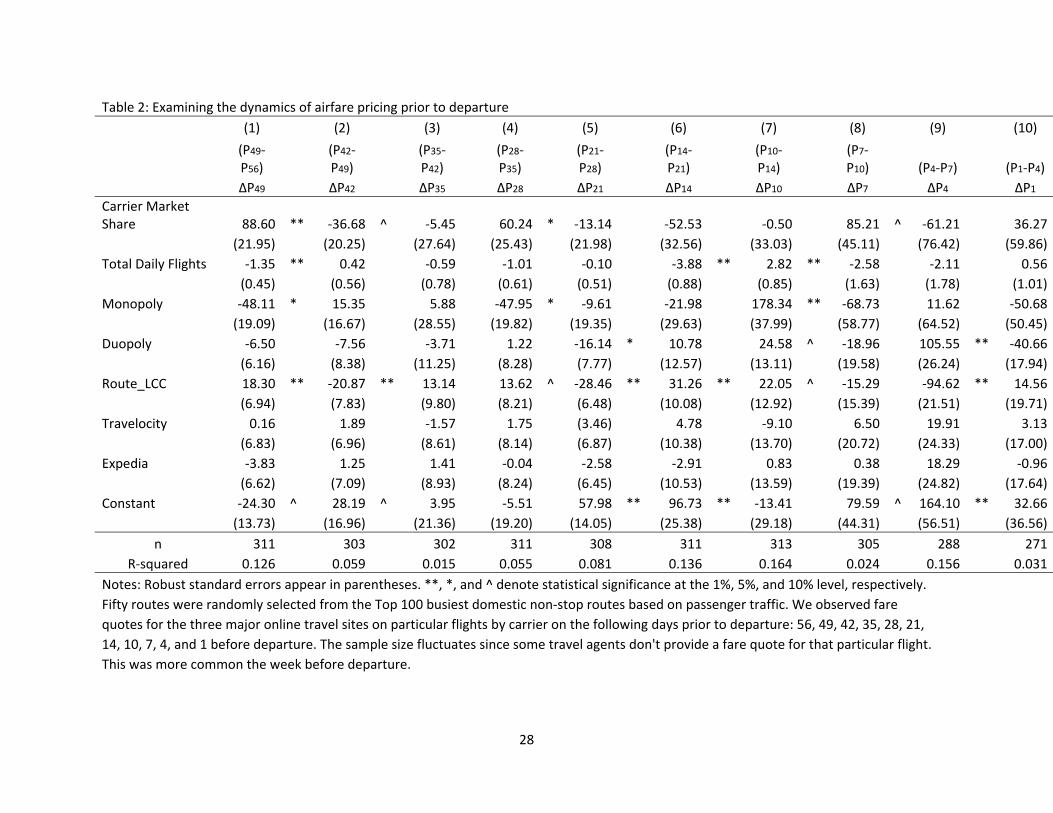
The analysis of changes in price quotes and differences across travel agents is summarized in the simple regression analysis reported below. Using the magnitude of the change in the fare quote between the two consecutive days (Pi‐Pj) of data collection, we explore whether market structure, airline market share, or presence of low‐cost carriers have any effect on fare changes. Specifically, we estimate the following model:
(Pi‐Pj) = α + β Mkt.Share + δ Tot.Flights + η Mkt.Structure + ξ LCC + ω Agents + ε
3 For $Y of maximum savings from checking two additional websites, assuming that the marginal cost of searching two other travel agents’ sites is $X, and supposing, as in our example, that a traveler picks the first site randomly, and that two agents offer the lowest fare for a given itinerary; searching provides a positive expected value if
0. This gives ; or the corresponding value of time of per hour (recall we assumed that searching two other agents’ web-sites takes a total of six minutes). This cut-off value of time will be higher, if we suppose that only one agent offers the lowest fare quote.

11
Where Mkt.Share represents a carrier’s market share on the route; Tot.Flights are the total daily non‐stop flights on the route across all carriers; Mkt.Structure is an indicator variable for routes served by a single carrier (Monopoly) or two carriers (Duopoly); LCC is another indicator variable taking the value of one on routes where a low‐cost carrier is present; and Agents is an indicator variable for the travel agent that offered the fare quote.
We ran ten regressions, corresponding to eleven days of data collection. Results reported in Table 2 show that carriers with larger market share are more likely to increase prices prior to departure. We find that the change in prices significantly increase 49, 28, and 7 days prior to departure for the carriers with larger route market share. The size of the market appears to have little bearing on the dynamics of price changes prior to departure.
<INSERT TABLE 2 ABOUT HERE>
Market structure does appear to influence price changes with price cuts offered on monopoly routes well before departure (49 and 28 days in advance) followed by steep price increases 10 days before departure. A similar yet smaller magnitude price changes occur for duopoly routes with price reductions coming 21 days in advance followed by price increases 10 and 4 days before departure with the largest increases coming 4 days prior to departure.
The presence of a low‐cost carrier has large effects (both positive and negative) on price changes. No clear trend appears when examining pricing dynamics on low cost carrier routes other than there is considerable variation in prices with price increases frequently countered by subsequent price decreases. For example, LCC routes have $18 price increases 49 days in advance followed by a $21 price reduction 42 days in advance. LCCs clearly disciplines pricing at the last minute, this is the most noticeable effect of low‐cost carriers on a route. Recall that immediately prior to departure monopoly and duopoly routes typically have substantial price increases, we observe no such price spikes for low‐cost carrier routes. If anything, prices immediately before departure are more likely to drop (e.g., see the $95 price reduction four days before departure for LCC routes).
Finally, we observe no systematic differences in offered prices at any time prior to departure among any of the three major online travel agents.
4. CONCLUSIONS
This paper examined the dynamics of offered airline prices for flights between 1 day and 56 days prior to departure. Tracking the same flight numbers and itineraries across the three major online travel agents for fifty of the top 100 busiest U.S. domestic non‐stop routes we are able to make some inferences about the dynamics of airline price‐offer curves. We find five stylized facts for airline pricing. First, both fares and yields are consistently higher along the entire price‐
12
offer curve on less competitive markets, and on routes without LCC presence. Second, price changes are smoother on competitive and LCC routes than on markets with one or two competitors. Third, price drops are observed across a spectrum of markets, and at any day prior to departure. In particular, at least one price drop was observed within ten days before the flight for about half of all round trips tracked. In about one‐third of round trip itineraries, price drops within the last week prior to departure were observed. Fourth, the shape of the averaged price‐offer curve is as expected – flat up to about three weeks before the flight, and rising rapidly afterwards. Fifth and finally, we do not document systematic differences across on‐line travel agents; however, differences in price quotes are not infrequent.
These findings suggest that consumers looking for airline tickets well in advance from the departure date may benefit from waiting to make an airline purchase. As the departure date nears (especially within 3 weeks), fares are much more likely to rise than fall, so we encourage potential passengers not to wait for further price drops within the final 21 days prior to departure. Finally, we do encourage passengers to seek a second (or third) price quote when making last minute ticket purchases since these fares exhibit the most discrepancies among online travel agents.
REFERENCES
Bilotkach, V. (2006) “Understanding Price Dispersion in the Airline Industry: Capacity Constraints and Consumer Heterogeneity”, in Darin Lee, ed. Advances in Airline Economics, Vol. 1, pp. 329‐345, Elsevier
Bilotkach, V. (2010) “Reputation, Search Cost, and Airfares”, Journal of Air Transport Management, 15, 251‐257
Bilotkach, V., and M. Pejcinovska (2011) “Distribution of Airline Tickets: A Tale of Two Market Structures”, forthcoming in J. Peoples, ed. Pricing Behavior and Non‐Price Characteristics in the Airline Industry
Bilotkach, V., and N. Rupp (2010) “Do Consumers Benefit from Low‐Price Guarantees? Evidence from On‐Line Travel Agents”, working paper
Button, K., and H. Vega (2007) “The Temporal‐Fares‐Offered Curves in Air Transportation”, working paper
Chen, J. (2006) “Differences in Average Prices on the Internet: Evidence from the Online Market for Air Travel”, Economic Inquiry, 44, 656‐670
Clemons, E.C., I‐H. Hann, and L.M. Hitt (2002) “Price Dispersion and Differentiation in Online Travel: an Empirical Investigation”, Management Science, 48, 534‐549

13
Escobari, D. (2006) “Are Airlines Price Discriminating? Tourist versus Business Travelers”, working paper.
Escobari, D. (2009) “Systematic Peak‐load Pricing, Congestion Premia and Demand Diverting: Empirical Evidence”, Economics Letters, 103 (1), April 2009, 59‐61.
Escobari, D., and L. Gan (2007) “Price Dispersion under Costly Capacity and Demand Uncertainty”, NBER working paper #13075.
Gaggero, A., and C. Piga (2011) “Airline Market Power and Intertemporal Price Dispersion”, Journal of Industrial Economics, forthcoming
Giaume, S., and S. Guillou (2006) “Concentration, Market Share Inequality and Prices: An Examination of European Airline Markets”, in Darin Lee, ed. Advances in Airline Economics, Vol. 1, pp. 273‐296, Elsevier
Piga, C., and E. Bachis (2006) “Pricing Strategies by European Low Cost Airlines: or, when is it the best time to book online?” Loughborough University Department of Economics Working Paper WP 2006‐14.
Puller, S., A. Sengupta, and S. Wiggins (2009) “Testing Theories of Price Dispersion and Scarcity Pricing in the Airline Industry”, NBER Working Paper 15555.

14
Figure 1: Average fare quotes
$100
$150
$200
$250
$300
$350
$400
$450
$500
$550
$600
56 49 42 35 28 21 14 10 7 4 1
Fare ($
)
Days prior to departure

15
Figure 2: Difference in average yields: monopoly and non‐monopoly routes prior to departure
0.00
0.05
0.10
0.15
0.20
0.25
0.30
0.35
0.40
56 49 42 35 28 21 14 10 7 4 1
Yield (fare/miles)
Diff
95% CI
95% CI

16
Figure 3: Difference in average yields for routes without and with LCC presence
0.00
0.05
0.10
0.15
0.20
0.25
0.30
56 49 42 35 28 21 14 10 7 4 1
Yield (fare/miles)
Diff
95% CI
95% CI

17
Figure 4: Difference in average yields for routes with and without Southwest Airlines’ presence
0.00
0.05
0.10
0.15
0.20
0.25
0.30
56 49 42 35 28 21 14 10 7 4 1
Yield (fare/miles)
Diff
95% CI
95% CI

18
Figure 5: Dynamics of price changes for routes with and without LCC
‐10
0
10
20
30
40
50
60
0 10 20 30 40 50
Percen
tage change
Days before departure
All
LCC
NoLCC

19
Figure 6: Dynamics of price quotes depending on market structure
‐10
0
10
20
30
40
50
60
70
0 10 20 30 40 50
Percen
tage change
Days before departure
Monopoly
Duopoly
Competitive

20
Figure 7: Share of itineraries with decreasing, increasing, and unchanging price quotes observed during the sample period (56 days to 1 day prior to departure).
0.00
0.10
0.20
0.30
0.40
0.50
0.60
0.70
0.80
0.90
49 42 35 28 21 14 10 7 4 1
Prop
ortio
n of itineraries
Days before departure
decrease
no chg
increase

21
Figure 8. Price drops by itineraries and agents for fares collected up to 56 days in advance
0
0.05
0.1
0.15
0.2
0.25
0.3
0.35
0 1 2 3 4 5 6
Share of Itineraries with
Drops
Number of Price Drops per Itinerary
Expedia
Orbitz
Travelocity

22
Figure 9: Likelihood of price drops depending on carrier’s market share on the route
0.00
0.05
0.10
0.15
0.20
0.25
49 42 35 28 21 14 10 7 4 1
Prop
ortio
n of iten
aries
Days before departure ‐ probability of a weekly price reduction
< 0.3 mkt share
0.3‐0.5 mkt share
0.5+ mkt share

23
0.00
0.05
0.10
0.15
0.20
0.25
0.30
49 42 35 28 21 14 10 7 4 1
Prop
ortio
n of itineraries
Days before departure ‐ probability of a weekly price reduction
Figure 10. Total daily flights on route and price reductions
< 14 flights
14‐20 flights
21+ flights
24
0.00
0.05
0.10
0.15
0.20
0.25
49 42 35 28 21 14 10 7 4 1
Prop
ortio
n of itineraries
Days before departure ‐ probability of a weekly price reduction
Figure 11. Carrier daily flights on route and price reductions
< 5 flights
5‐8 flights
9+ flights

25
Figure12: Average fare quotes by different agents
$200
$250
$300
$350
$400
$450
$500
$550
56 49 42 35 28 21 14 10 7 4 1
Fare ($
)
Days prior to departure
Travelocity
Expedia
Orbitz

26
Figure 13: Share of itineraries where all agents report fare quotes within $5 of each other
0
0.1
0.2
0.3
0.4
0.5
0.6
0.7
0.8
0.9
1
1day 4days 7days 10days 14days 21days 28days 35days 42days 49days 56 days
Prop
ortio
n of Itineraries
Where all agent report a quote Relative to all itineraries

27
Table 1. Potential Savings from Shopping around
Days before Flight Savings from Search Highest Value of Time for
Searching, $/hour Average St. Dev Maximum 56 $9.22 $28.47 $182.00 $30.72 49 $4.13 $31.32 $316.00 $13.78 42 $6.61 $32.85 $316.00 $22.03 35 $1.97 $11.31 $82.00 $6.57 28 $0.55 $3.14 $30.00 $1.84 21 $7.36 $34.97 $311.00 $24.54 14 $9.72 $25.91 $150.00 $32.42 10 $8.47 $42.56 $311.00 $28.23 7 $24.50 $87.85 $667.00 $81.68 4 $6.12 $34.09 $321.00 $20.42 1 $5.62 $25.83 $195.00 $18.73
Note: “Highest Value of Time for Searching” refers to the highest value of time (per hour) for which marginal benefit of checking quotes across three travel agents exceeds marginal cost, given the average savings from the search. Assumes 3 minutes for checking an additional fare quote; and supposes two out of three agents offer the lowest fare. See also footnote 3.
28
Table 2: Examining the dynamics of airfare pricing prior to departure (1) (2) (3) (4) (5) (6) (7) (8) (9) (10)
(P49‐P56)
(P42‐P49)
(P35‐P42)
(P28‐P35)
(P21‐P28)
(P14‐P21)
(P10‐P14)
(P7‐P10) (P4‐P7) (P1‐P4)
ΔP49 ΔP42 ΔP35 ΔP28 ΔP21 ΔP14 ΔP10 ΔP7 ΔP4 ΔP1 Carrier Market Share 88.60 ** ‐36.68 ^ ‐5.45 60.24 * ‐13.14 ‐52.53 ‐0.50 85.21 ^ ‐61.21 36.27
(21.95) (20.25) (27.64) (25.43) (21.98) (32.56) (33.03) (45.11) (76.42) (59.86) Total Daily Flights ‐1.35 ** 0.42 ‐0.59 ‐1.01 ‐0.10 ‐3.88 ** 2.82 ** ‐2.58 ‐2.11 0.56
(0.45) (0.56) (0.78) (0.61) (0.51) (0.88) (0.85) (1.63) (1.78) (1.01) Monopoly ‐48.11 * 15.35 5.88 ‐47.95 * ‐9.61 ‐21.98 178.34 ** ‐68.73 11.62 ‐50.68
(19.09) (16.67) (28.55) (19.82) (19.35) (29.63) (37.99) (58.77) (64.52) (50.45) Duopoly ‐6.50 ‐7.56 ‐3.71 1.22 ‐16.14 * 10.78 24.58 ^ ‐18.96 105.55 ** ‐40.66
(6.16) (8.38) (11.25) (8.28) (7.77) (12.57) (13.11) (19.58) (26.24) (17.94) Route_LCC 18.30 ** ‐20.87 ** 13.14 13.62 ^ ‐28.46 ** 31.26 ** 22.05 ^ ‐15.29 ‐94.62 ** 14.56
(6.94) (7.83) (9.80) (8.21) (6.48) (10.08) (12.92) (15.39) (21.51) (19.71) Travelocity 0.16 1.89 ‐1.57 1.75 (3.46) 4.78 ‐9.10 6.50 19.91 3.13
(6.83) (6.96) (8.61) (8.14) (6.87) (10.38) (13.70) (20.72) (24.33) (17.00) Expedia ‐3.83 1.25 1.41 ‐0.04 ‐2.58 ‐2.91 0.83 0.38 18.29 ‐0.96
(6.62) (7.09) (8.93) (8.24) (6.45) (10.53) (13.59) (19.39) (24.82) (17.64) Constant ‐24.30 ^ 28.19 ^ 3.95 ‐5.51 57.98 ** 96.73 ** ‐13.41 79.59 ^ 164.10 ** 32.66
(13.73) (16.96) (21.36) (19.20) (14.05) (25.38) (29.18) (44.31) (56.51) (36.56) n 311 303 302 311 308 311 313 305 288 271
R‐squared 0.126 0.059 0.015 0.055 0.081 0.136 0.164 0.024 0.156 0.031 Notes: Robust standard errors appear in parentheses. **, *, and ^ denote statistical significance at the 1%, 5%, and 10% level, respectively. Fifty routes were randomly selected from the Top 100 busiest domestic non‐stop routes based on passenger traffic. We observed fare quotes for the three major online travel sites on particular flights by carrier on the following days prior to departure: 56, 49, 42, 35, 28, 21, 14, 10, 7, 4, and 1 before departure. The sample size fluctuates since some travel agents don't provide a fare quote for that particular flight. This was more common the week before departure.

29
APPENDIX – LIST OF MARKETS
Origin Destination Airline(s) Flight Date
Monopoly (non‐stop routes)
Atlanta Savannah, GA Delta 17‐Jun
Atlanta Salt Lake City Delta 17‐Jun
Charlotte, NC Tampa US Airways 17‐Jun
Cincinnati Atlanta Delta 19‐Jun
Denver Washington, DC (IAD) United 17‐Jun
Miami Dallas (DFW) American 19‐Jun
New Orleans Houston (IAH) Continental 19‐Jun
New York (LGA) Charlotte, NC US Airways 19‐Jun
New York (LGA) Dallas (DFW) American 19‐Jun
San Diego Dallas (DFW) American 19‐Jun
Duopoly (non‐stop routes)
Atlanta Boston Delta, AirTran 17‐Jun
Atlanta Baltimore Delta, AirTran 17‐Jun
Atlanta Orlando Delta, AirTran 17‐Jun
Atlanta Pittsburgh Delta, AirTran 17‐Jun
Atlanta Ft. Myers, FL Delta, AirTran 17‐Jun
Chicago (ORD) Dallas (DFW) American, United 19‐Jun
Chicago (ORD) Los Angeles American, United 19‐Jun
Chicago (ORD) San Francisco American, United 17‐Jun
Chicago (ORD) St. Louis American, United 17‐Jun
Detroit New York (LGA) American, Northwest 17‐Jun
New Orleans Atlanta Delta, AirTran 19‐Jun
New York (LGA) Chicago (ORD) American, United 19‐Jun
Orlando Detroit AirTran, Northwest 17‐Jun
Phoenix Dallas (DFW) American, US Airways 19‐Jun
San Francisco Atlanta Delta, AirTran 19‐Jun
San Francisco Washington, DC (IAD) United, Virgin America 19‐Jun
Tampa Atlanta Delta, AirTran 19‐Jun
Competitive (non‐stop routes)
Atlanta Newark Delta, AirTran, Continental 17‐Jun

30
Chicago (ORD) Boston American, United, Jetblue 19‐Jun
Chicago (ORD) Seattle American, United, Alaska 17‐Jun
Dallas (DFW) Denver American, United, Frontier 19‐Jun
Denver Las Vegas United, Frontier, Southwest 17‐Jun
Denver Kansas City United, Frontier, Southwest 17‐Jun
Denver San Diego United, Frontier, Southwest 17‐Jun
Denver San Francisco United, Frontier, Southwest 17‐Jun
Denver Los Angeles United, Frontier, American, Southwest 17‐Jun
Denver Minneapolis United, Frontier, Northwest,Southwest 17‐Jun
Denver Salt Lake City United, Frontier, Delta, Southwest 17‐Jun
Detroit Chicago (ORD) American, Northwest, United 17‐Jun
Houston (IAH) Denver Continental, United, Frontier 19‐Jun
Las Vegas Seattle Alaska, US Airways, Southwest 17‐Jun
Los Angeles Washington, DC (IAD) American, United, Virgin America 19‐Jun
Newark Chicago (ORD) American, Continental, United 17‐Jun
Philadelphia Chicago (ORD) American, United, US Airways 19‐Jun
Phoenix Los Angeles United, US Airways, Southwest 19‐Jun
Phoenix Chicago (ORD) American, United, US Airways 19‐Jun
San Francisco San Diego United, Virgin America, Southwest 19‐Jun
Seattle Phoenix Alaska, US Airways, Southwest 19‐Jun
Seattle Denver Alaska, Frontier, United, Southwest 19‐Jun
Seattle Los Angeles Alaska, United, Virgin America 19‐Jun
Note: Southwest Airlines does not offer fares through any of the three major online travel agents, hence we do not have Southwest fare data. We do, however, observe which routes Southwest flies, hence they are included in the above route competition characterization. Airport codes used: ‐ ORD: Chicago O’Hare ‐ IAD: Washington Dulles ‐ IAH: Houston George Bush Intercontinental ‐ DFW: Dallas‐Ft. Worth International ‐ LGA: New York LaGuardia
![Volodymyr Bulgakov, Volodymyr Kuvach v & Jüri Olt · Volodymyr Bulgakov, Volodymyr Kuvachоv & Jüri Olt This Publication has to be referred as: Bulgakov, V[olodymyr]; Kuvachоv,](https://img.dokumen.tips/doc/110x75/606c519a31edaf6c2a383e69/volodymyr-bulgakov-volodymyr-kuvach-v-jri-olt-volodymyr-bulgakov-volodymyr.jpg)