Embed Size (px)
Citation preview

A Gravity Model Analysis of the Benefits of Economic Integration in the Pacific Rim
David KaremeraSouth Carolina State University
Wilbur I. SmithFlorida A&M University
Kalu OjahSaint Louis University
John A. ColeBenedict College
Abstract
A modified gravity model of international trade is used to evaluate determ i -nants of flows of commodities most often traded in the Pacific Rim. It is shownthat the gravity model can be reparameterized effectively by using time seriesand cross section data rather than using cross section data alone. Documentedevidence indicates that all independent variables including income, export and
Journal of Economic Integration14(3), Sep. 1999; 347– 367
* Correspondence Address: Department of Economics, South Carolina State University,Orangeburg, SC 29117, U.S.A., (Fax)803-536-8066, (E-mail) [email protected]. Theauthors wish to thank Won Koo and Stephen Devadoss for constructive suggestionson earlier drafts. We also thank session participants at the Western Economic Associa-tion International conference organized in Seattle, Washington in July 1996. The paperbenefitted form conversation with Jeffrey Bergstrand and Benjamin Kim. EmmanuelOnunkwo, and Viceola Sykes patiently read the manuscript. The usual disclaimerapplies.
©1999 – Institute for International Economics, Sejong Institution. All rights reserved.

3 4 8 A Gravity Model Analysis of the Benefits of Economic Integration in the Pacific Rim
import unit values, exchange rates, and membership in regional trade groupsare major determinants of trade flows in the Pacific Rim. Specifically, member -ship in the ASEAN significantly increased trade creation among members aswell as fostered trade diversion from members to nonmembers. However, theimpact of membership in the NAFTA on trade flows in the Pacific Rim is limit -ed and appears to be commodity specific. (JEL Classifications: F15, F14,F02) <Key Words : pacific rim, economic integration, generalized gravitymodel, ASEAN, NAFTA>
I. Introduction
The potential for regional economic integrations to increase trade amongp a rtners has been long recognized in the international trade literature. Forinstance, Aiken [1973] and Balassa [1975] showed that European economicintegrations under both the European Community (EC) and the Euro p e a nF ree Trade Agreement (EFTA) significantly increased inter-member tradeflows. Brown et al. [1990] analyzed and documented the effects of a morerecent North American economic integration, i . e . the North American Fre eTrade Agreement (NAFTA). Karemera and Koo [1994] empirically evaluatedthe trade expansion effects of the US-Canada free trade agreement. Howev-e r, only a few studies have been devoted to the empirical examination of thetrade benefits of an economic integration in the Pacific Rim, especially theAsian members of the region. Yamazawa [1992] offers an excellent survey ofPacific Rim’s subregional groupings that seem to operate in a loose form oftrade arrangements. His surv e y, however, does not provide a well definedempirical analysis of the benefits of a free trade agreement among the coun-tries of the Asian Pacific Rim, and does not bring a needed focus on theAsian members of the region. It is on account of this vacuum that the curre n tstudy has specific relevance. This study uses the gravity model of intern a-tional trade to provide a quantitative assessment of the benefits of free tradea g reements in the Pacific Rim.
F o rmal theoretical foundations for the gravity model are provided inAnderson [1979] and Bergstrand [1985, 1989]. Bergstrand provides a soundt h e o retical foundation for the gravity model and generalizes the conventionalmodel. The traditional gravity model contains the following three variable

David Karemera, Wilbur I. Smith, Kalu Ojah, and John A. Cole 3 4 9
c o m p o n e n t s :1. Economic factors affecting trade flows in the exporting country2. Economic factors affecting trade flows in the importing country3. Natural or artificial factors enhancing or restricting trade flows between
trading part n e r s .The gravity model has been used to evaluate aggregate bilateral trade
flows between pairs of countries (Linneman [1966]; Anderson [1979];B e rgstrand [1985, 1989] and Summary [1989]). We modified this model fur-ther to permit an examination of the benefits and determinants of trade flowsin an economically integrating Pacific Rim. In this study, the gravity model isspecified and reparameterized into a time series and cross-sectional frame-work. This modified model is then used to evaluate trade flow effects of themost often traded commodities among the Pacific Rim countries. Furt h e r-m o re, the effects of subregional groups on Pacific Rim trade are examined.
The rest of the paper is organized as follows: Section II highlights thei m p o rtance of integration in the Pacific Rim. Section III provides a review ofgravity models while section IV presents the particular empirical methodolo-gy used in this study. Section V presents a review of pro c e d u res and datas o u rces. Section VI discusses the estimated results and the relative benefitsto specific industries. The last section summarizes the results and concludesthe paper.
II. The Importance of Economic Integration in the Pacific Rim.
The Pacific Rim comprises the world’s largest and fastest growing intern a lmarkets (Eichengreen and Frankel [1995]). It currently has both countrieswith the largest per capita income growth and potential growth in purc h a s i n gp o w e r. As the trend towards regional trade groupings continues, negotia-tions for an Asian Pacific Economic Cooperation or APEC-wide free tradea g reement are under way. At the APEC summit in Bogor, Indonesia, theAPEC countries expressed commitment to the creation of a free trade zoneby the year 2020. That commitment was first discussed during the APECmeeting in Seattle, Washington in November of 1993. It is now routinely re i t-erated in subsequent association meetings. The most advanced nations inthe region are expected to provide the lead and pursue free movements of
3 5 0 A Gravity Model Analysis of the Benefits of Economic Integration in the Pacific Rim
goods and services in the APEC countries by the year 2010. The APEC coun-tries included in the analysis are shown in Table 1 below.
As is re p o rted in Table 1, the APEC member countries are Australia, Cana-da, China, Hong Kong, Indonesia, Japan, Malaysia, Mexico, New Zealand,Philippines, Singapore, South Korea, Thailand, Taiwan, and the UnitedStates. Of particular interest in this study are the subregional trade groups inthe larger Pacific Rim region. These subregional groups are NAFTA, whichcomprises Canada, Mexico, and United States; and the Association of SouthEast Asian Nations, ASEAN, which comprises Indonesia, Malaysia, Philip-pines, Singapore, and Thailand. The descriptive statistics in Table 1 pro v i d e
Table 11993 Profiles of Countries of the Asia-Pacific
Economic Cooperation (APEC)
1 TA designates trade agreement, and FTA designates free trade agreement, and n.a.
stands for not available.Source: International Financial Statistics in Various Issues
Merchandise Trade
CountryPopulation Per Capita GDP
Imports Exports Subregional Trade Group1
(Mil.) (Mil. of U.S. $)(Mil. of U.S. $) (Mil. of U.S. $)
Australia 17.66 15.87 45,577.0 42,723.0 Australia-New Zealand TACanada 28.94 18.57 139,035.0 145,178.0 NAFTA, U.S.-Canada FTAChina 1,196.40 0.45 103,088.0 90,970.0Hong Kong 5.92 18.53 138,658.0 135,248.4Indonesia 189.14 0.83 28,327.8 36,823.0 ASEANJapan 124.70 33.41 241,624.0 362,244.0Malaysia 19.25 3.14 45,657.1 47,121.7 ASEANMexico 91.21 3.98 50,147.3 30,241.4 NAFTANew Zealand 3.46 13.06 9,636.2 10,536.7 Australia-New Zealand TAPhilippines 65.65 0.81 18,754.4 11,088.7 ASEANSingapore 2.87 20.01 85,234.0 74,011.6 ASEANSouth Korea 44.06 7.50 83,800.0 82,236.0Thailand 58.58 2.12 46,208.0 37,168.0 ASEANTaiwan 20.84 10.68 n.a. n.a.United States 258.12 24.58 603,438.0 464,773.0 NAFTA, U.S.-Canada FTA

David Karemera, Wilbur I. Smith, Kalu Ojah, and John A. Cole 3 5 1
Table 2Sample of Bilateral Trade Flows for Selected Pacific
Rim Countries (000’s omitted)
* : averages used for year 86-88.n.a.: not consistent over time and country.
YearAverage
1993 1992 19915811: Plastic Materials
United States imports from Canada 609,801 681,502 596,947 550,953 Japan imports from Canada 266,623 325,208 245,449 229,213 Taiwan imports from Canada 36,787 39,291 35,899 35,172
5812: Refined Plastic MaterialsUnited States imports from Japan 346,892 350,521 328,418 361,737 Japan imports from South Korea 301,642 321,324 295,941 287,661 Taiwan imports from Japan 82,279 82,361 75,960 88,517
6516: Synthetic Fiber BlendsUnited States imports from Canada 214,644 231,748 215,386 196,797 China imports from Hon 242,459 213,942 253,803 259,633 South Korea imports form Japan 45,362 40,756 49,502 45,827
6822: Worked Copper AlloysChina imports from Hong Kong 116,908 112,714 117,396 120,614 Malaysia imports from Singapore 69,060 99,392 55,814 51,974 United States imports from Japan 32,772 30,298 32,316 35,703
7231: Civil Engineering EquipmentUnited States imports from Mexico 871,238 1,349,302 1,163,300 101,111 Malaysia imports from Singapore 109,002 132,233 98,251 96,523 South Korea imports from Japan 32,126 30,683 30,844 34,851
7143: Reaction EnginesUnited States imports from Hong Kong 111,991* n.a. n.a. n.a.South Korea imports from United States 484,593* n.a. n.a. n.a.Singapore imports from United States 275,609* n.a. n.a. n.a.

3 5 2 A Gravity Model Analysis of the Benefits of Economic Integration in the Pacific Rim
insights into the absorption capacity of the region re g a rding merchandise flows. Population andGDP figures are provided as a gauge of the markets and sizes involved.
Table 2 provides selected bilateral flows of specific commodities that are most often traded inthe region. As can be seen in Table 2, trade flows in the Pacific Rim region seem to be pro d u c t -specific. For example, Japanese imports of Refined Plastic Materials from Korea increased by11.70% from 1991 to 1993. In the same period, Malaysia’s imports of Civil Engineering Equipmentf rom an ASEAN part n e r, Singapore, increased by 36.99%. However, in the other groups such asWorked Copper Alloys, imports and exports exhibit trade fluctuations over the sample period.
In summary, this study examines and evaluates trade determinants for the Pacific Rim re g i o n .It also examines the implications of the subregional trade arrangements for the entire Pacific Rimtrade. The commodity groups included in the analysis are those that are most frequently tradedamong the APEC member countries during the study period. More specifically, particular atten-tion is paid to the trade group’ s effects on the gro u p ’s members and nonmembers in the contextof the Pacific Rim.
III. Development of a Gravity Model
The theoretical derivation of a gravity model follows the standard pro c e d u re outlined in thei n t e rnational trade literature. According to Linneman [1966] and Bergstrand [1985, 1989], a gravi-ty model is a re d u c e d - f o rm equation of a general equilibrium of demand and supply systems. Themodel of trade demand for each country is derived by maximizing a constant elasticity of substitu-tion (CES) utility function subject to income constraints in importing countries. The model oftrade supply is derived from the firms’ profit maximization pro c e d u re in the exporting country,with re s o u rce allocation determined by the constant elasticity of transformation. The gravitymodel of trade flows is then obtained under market equilibrium conditions, where demand fortrade flows equals supply of the flows. It follows:
(1)
w h e re
Xij = the dollar volume of trade flows between country i and c o u n t ry j ;
Yi(Yj) = the national income of country i (j) ;Cij = the transportation cost (CIF/FOB) between i and j ;Tij = the other factors either aiding or restricting trade between i and j ;Pi(Pj) = the unit value of export (import s ) ;Eij = the spot exchange rate (country j’s currency in terms of
c o u n t ry i’s curre n c y );Ii(Ij) = the inflation in each respective country;eij = the error term; and
Xij = 0Yi1 Yj
2 Cij3 Tij
4 Pi5 Pj
6 Eij7 Ii
8 I j9 eij
i =1,..., N1 and j = 1,...,N2

David Karemera, Wilbur I. Smith, Kalu Ojah, and John A. Cole 3 5 3
β = parameters of the model.
The Mathematical derivation of Equation (1) is explained in Berg s t r a n d[1985, 1989]. A brief summary of the derivation is provided as an appendix inKoo and Karemera <[1991], pp. 443-335>.
Gravity models hypothesize that an exporting country ’s income re p re-sents the country ’s production and supply capacity while an importing coun-t ry ’s income re p resents the country ’s purchasing power or its absorptionc a p a c i t y. Trade flows are expected to be positively related to the export i n gand importing countries’ income. Tr a n s p o rtation costs and tariffs, which aretrade barriers, should be negatively related to the volume of trade flows. Theprices of a particular commodity in both exporting and importing countriesa re important in determining trade flows such as when a commodity movesf rom a country where prices are low to a country where prices are high.Trade flows are hypothesized to be positively related to changes in exportprices and negatively related to changes in import prices.
Exchange rates are one of the most important macroeconomic factorsa ffecting trade flows. Exchange rates used in the analysis are defined aschanges in the prices of importing countries’ currencies in terms of export-ing countries’ currencies. An appreciation of a country ’s currency reduces itse x p o rts and increases its imports. A currency depreciation, on the otherhand, will elicit the opposite eff e c t s .
IV. An Empirical Gravity Model of the Pacific Rim Trade Flows
Traditional gravity models generally employ aggregate goods trade data,and they evaluate trade flows at a specific time period as demonstrated inB e rgstrand [1985, 1989], Anderson [1979], and Lineman [1966]. We departsomewhat from the traditional model by reparameterizing equation (1) into acombined time series and cross-section model. The modified model is thenused to analyze the effects of other factors (besides those suggested by thetraditional gravity model) which enhance or impede trade between import-ing and exporting countries. That is, in addition to trade factors common tothe traditional gravity model, our model includes variables re p resenting, forinstance, environmental or socioeconomic factors af fecting trade flows

3 5 4 A Gravity Model Analysis of the Benefits of Economic Integration in the Pacific Rim
among trade partners, and free trade variables.The Pacific Rim includes members of subregional trade groups. The sub-
g roups are engaged in cooperative trade arrangements. Dummy variablesre p resenting trade flows from specific groupings are included in the modi-fied model. Specifically, a dummy variable re p resenting trade flows amongthe Association of South East Asian Nations (ASEAN) is included to identifythe extent to which membership of two countries in ASEAN (AS2) enhancedtrade in the Pacific Rim. Another dummy variable re p resenting trade flowsamong members and non-ASEAN members (A Sn) is included to identifytrade diversion. Likewise, a dummy variable re p resenting trade between twoN A F TA countries (NA2)is included to evaluate NAFTA’s effects on trade inthe region. Similarly, another dummy variable re p resenting trade between aN A F TA country and a non-NAFTA country (NAn) is used to identify theextent of trade diversion from the North American free trade area. It ishypothesized that economic integration or trade arrangement under NAFTAand/or ASEAN would enhance trade flows among member countries. Thatis, there will be a trade creation effect. However, a trade between a beneficia-ry and nonbeneficiary will yield a trade diversion effect as well.
F i n a l l y, two variables re p resenting environmental factors were included toexamine both the effects of cultural similarity and level of development ontrade in the Pacific Rim region. Such factors show the effects of specific sub-g roups on the inter- and intra-group trade. The pertinent factors are the spe-cific distance between integrating countries (N Di j) and integrating members’levels of development (P i n ci j). The hypothesis is that trade group membercountries close to each other are more likely to have similar cultures or cul-tural heritages, similar patterns of consumption and production, and highincentives for trade with each other. A relatively short distance between spe-cific integrating countries will enhance trade more than a relatively long dis-tance between member countries. While the interpretation has the feature ssimilar to that of the traditional distance variable, the variable re p re s e n t i n gdistance among the integrating countries focuses on the effects of distancebetween countries under a free trade tre a t y.
Brada and Mendez [1985] provide a computational definition of the level ofdevelopment variable as P i n ci j = (Yi / Ni) ( Yj / Nj). The per capita income hasbeen often used to reflect a country ’s level of development. The level of

David Karemera, Wilbur I. Smith, Kalu Ojah, and John A. Cole 3 5 5
development among integrating members should have a positive impact ontrade among beneficiaries because there is more trade among countries withsimilar per capita incomes as demonstrated by Pagoulatos and Sore n s e n[ 1 9 7 5 ] .
The traditional adjacency dummy variable is retained in the empiricalmodel because, in addition to characteristics identified for countries withclose pro x i m i t y, it is assumed that there is even more trade between coun-tries with common borders than countries without common borders. There-f o re, the expanded empirical model of the Pacific Rim trade is specified asf o l l o w s :
(2)
W h e re
Dij = distance between exporting country i and importing country j ;A Di j = dummy variable re p resenting countries with common bord e r;NA2 = dummy variable identifying trade flows between 2 NAFTA
c o u n t r i e s ;NAn = dummy variable indicating a trade flow between a NAFTA
and non-NAFTA country ;AS2 = dummy variable indicating trade flows between 2 ASEAN
c o u n t r i e s ;ASn = dummy variable indicating a trade flow between an ASEAN
member and a non-ASEAN member; Pi(Pj) = e x p o rt (import) unit price for exporting country i ( i m p o rt-
ing country j);Ndij = distance between integrating countries i and j ;Pincij = level of development of integrating member countries i an j ;
All other variables have been previously defined.
V. Econometric Procedure and Source of Data
As noted earlier, classical gravity models use cross-section data to estimatetrade effects and relationships for a particular time period (e . g ., one year).
Xij = 0Yi1 Yj
2 Dij3 Pi
4 Pj5 Eij
6 Ii7 I j
8 Ndij9 Pincij
10e 11 ADij e 12 NA2
e 13 NAn e 14 AS2 e 15 ASn

3 5 6 A Gravity Model Analysis of the Benefits of Economic Integration in the Pacific Rim
H o w e v e r, in real life, cross-section data observed over several years pro v i d em o re useful information than cross-section data alone. There f o re, in theempirical implementation of model (2), we reparameterize the traditionalmodel into a time series and cross-sectional framework with a study timeperiod that ranges from 1984 to 1993.
Financial data, such as gross domestic product, exchange rates, domesticwhole sales price indices, and population data, were obtained from theI n t e rnational Financial Statistics published by the International MonetaryFund. The dollar volume of trade flows and corresponding quantities wereobtained from the United Nations Statistics Division Office. Import ande x p o rt unit values were simply computed by dividing the dollar volume oftrade by the respective quantity of each commodity category.
For the distance measure, ocean freight rates were not readily available.The distance between country i and j (Di j) is used as a proxy for transport a-tion costs and geographical factors impeding trade flows. This form u l a t i o nhas been commonplace in the literature (e . g ., see Bergstrand [1985] and[1989]; Geraci and Prewo [1979]; and Linneman [1966]). The distances wereobtained from the oceanographic maps published by the U.S. Navy. Export-ing and importing countries engaged in sporadic trade were excluded fro mthe analysis in order to obtain a data set consistent with the time series andc ross section framework. Since the number of countries in the Pacific Rimthat were consistently engaged in trade over the selected sample period issmall and the time span short relative to the number of estimated parame-ters, serial correlation problems may be negligible, and, according to Judgeet al. ([1985], p. 515), it may be better to treat coefficients as fixed. A dummyvariable identifying free trade flows between countries with common bord e r ssuch as the US and Canada is also identical to the adjacency dummy variable.T h e re f o re, one variable was used to avoid multicollinearity problems. Like-wise, the variable re p resenting specific distance among integrating countriessuch the distance between NAFTA countries or ASEAN countries were latereliminated to avoid multicollinearity problems. The model was then estimat-ed using the heteroskedasticity consistent covariance estimator proposed byWhite [1985].

David Karemera, Wilbur I. Smith, Kalu Ojah, and John A. Cole 3 5 7
VI. Results
The problems associated with pooling techniques have been extensivelydiscussed in literature, including Hausman [1978], Judge et al. [1985], andHsiao [1986]. For clarity and notational simplification, we use the symbolsused by Judge et al.([1985], p. 516). Similar notations can be seen in Koo andK a remera ([1991], p. 446). Equation (2), in time series and cross sectionframework, can be written as:
(3)
w h e re :
Xijt = trade observation from country i to country j at time t(t = 1,......, T) ;
Zijt = a corresponding trade determinant vector;= a response coefficient vector; and
ijt = the trade effect associated with the country pair.
Equation 3 indicates that all response coefficients are constant and thee rror term is assumed to capture effects over time and cross section units.The specification is plausible because the number of time series units orc ross section units alone is small and less than the number of model parame-ters. There f o re, the specific time and cross section effects are assumed negli-gible and the disturbance term will capture diff e rences over time and individ-ual countries. The reader is re f e rred to Koo and Karemera ([1991] p. 446)for a summary of methods of estimation of alternative model effects.
A. Specification Tests
Traditional gravity models do not have variable augmentation as specifiedin equation (2). The generalized gravity model re p resented by equation (2)includes both gravitational variables and the variables re p resenting the fre etrade, economic, and cultural development characteristics associated withboth the exporting and importing countries. Equation (2) was subjected tospecification tests. An F-test statistic developed by Godfrey [1986] for modelspecification indicated, at the 1% significance level, that model (3) should be
Xijt = Zijt + ijt

3 5 8 A Gravity Model Analysis of the Benefits of Economic Integration in the Pacific Rim
used in the trade flow analysis. Among the six commodity groups analyzed,the smallest statistic re c o rded is F=36.10, which significantly exceeds thecritical value of F(5, 13) = 4.86 at the 1% level. Altern a t i v e l y, given that model(1) is nested in model (2), the likelihood ratio test for specifications (Kmenta,[1986], p. 593) gives a likelihood ratio λ=36.19, which exceeds χ2 = 15.09 atthe 1% significance level and 5 degrees of freedom. It also rejects the nullhypothesis of no social or economic variable augmentation. These re s u l t ssuggest that in modeling international trade flows in the Pacific Rim, social,economic and environmental factors should be considered and be subjectedto econometric specification tests.
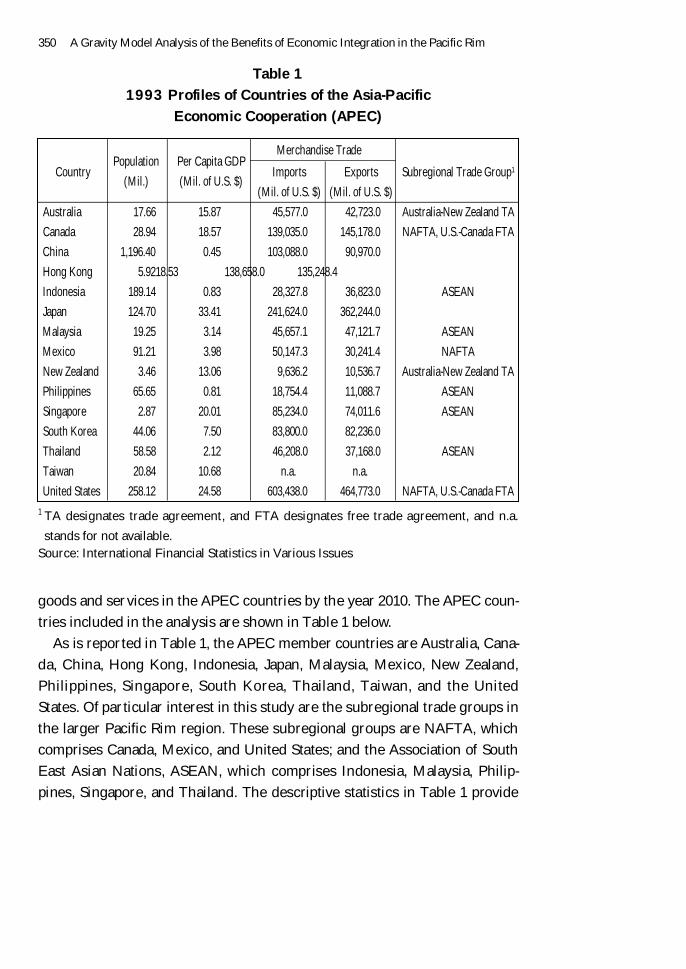
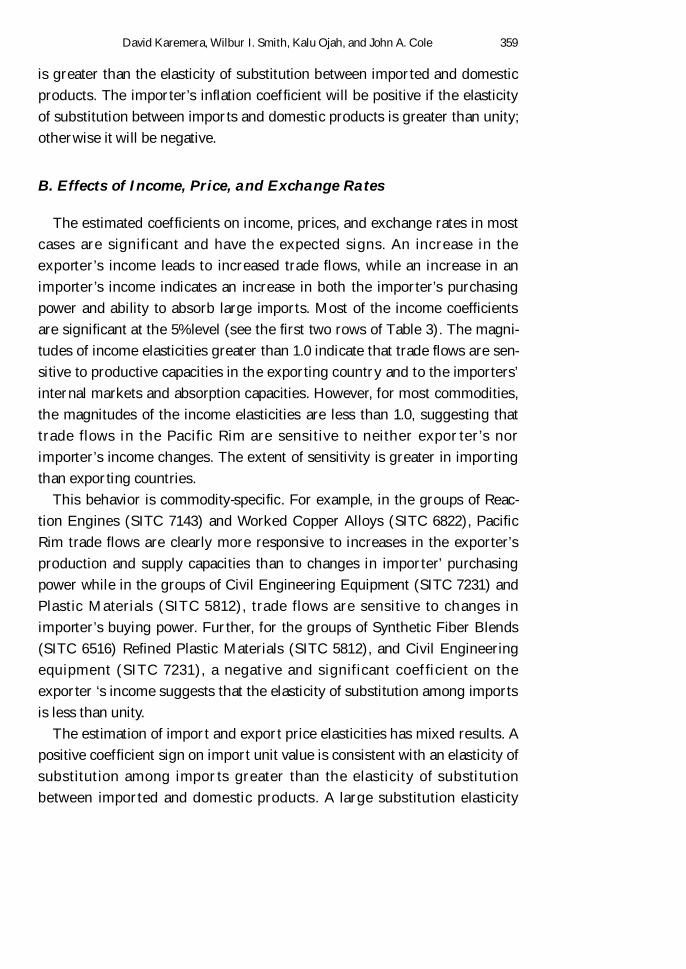
The parameter estimates of the models are presented in Table 3. Thedependent variable in all re g ressions is the dollar volume of trade (i . e., thesum of dollar value of imports and exports). The estimated coefficients formost gravitational variables (i . e., income and distance) and the variable re p-resenting integration grouping (pact) are significant in most cases. For eachestimated model, the adjusted R2 indicates that included factors explain mostof the variations in the respective dependent variables. The analysis of thee ffects of factors affecting trade flows in the Pacific Rim is based on expectedc o e fficient signs of the gravity model variables.
B e f o re proceeding to the result analysis, some signs of the estimatedm o d e l ’s parameters need further explanation. The following variables haveunambiguous expected signs. An increase in a country j ’s income or ana p p reciation of a country j ’s currency will lead to movements of trade flowsf rom country i to countr y j. The existence of free trade arr a n g e m e n tbetween countries i and j will increase trade from i to j while a relatively longdistance between i and j is expected to impede trade from i to j. In a detailedderivation of a generalized gravity model similar to equation (2), Berg s t r a n d[1985, 1989] explains that an exporting country i ’s income, unit price, andinflation may have ambiguous signs. If the elasticity of substitution amongi m p o rts is greater than unity, the export e r ’s income and inflation variableswill have a positive and a negative sign, re s p e c t i v e l y. In addition, a re l a t i v e l ylow elasticity of transformation among exportables and a large elasticity ofsubstitution between production for domestic and foreign markets lead to anegative coefficient on the export e r ’s unit price. Furt h e r, the import unitvalue may have a positive sign if the elasticity of substitution among import s
David Karemera, Wilbur I. Smith, Kalu Ojah, and John A. Cole 3 5 9
is greater than the elasticity of substitution between imported and domesticp roducts. The import e r ’s inflation coefficient will be positive if the elasticityof substitution between imports and domestic products is greater than unity;o t h e rwise it will be negative.
B. Effects of Income, Price, and Exchange Rates
The estimated coefficients on income, prices, and exchange rates in mostcases are significant and have the expected signs. An increase in thee x p o rt e r ’s income leads to increased trade flows, while an increase in ani m p o rt e r ’s income indicates an increase in both the import e r ’s purc h a s i n gpower and ability to absorb large imports. Most of the income coeff i c i e n t sa re significant at the 5% level (see the first two rows of Table 3). The magni-tudes of income elasticities greater than 1.0 indicate that trade flows are sen-sitive to productive capacities in the exporting country and to the import e r s ’i n t e rnal markets and absorption capacities. However, for most commodities,the magnitudes of the income elasticities are less than 1.0, suggesting thattrade flows in the Pacific Rim are sensitive to neither export e r ’s nori m p o rt e r ’s income changes. The extent of sensitivity is greater in import i n gthan exporting countries.
This behavior is commodity-specific. For example, in the groups of Reac-tion Engines (SITC 7143) and Worked Copper Alloys (SITC 6822), PacificRim trade flows are clearly more responsive to increases in the export e r ’sp roduction and supply capacities than to changes in importer’ purc h a s i n gpower while in the groups of Civil Engineering Equipment (SITC 7231) andPlastic Materials (SITC 5812), trade flows are sensitive to changes ini m p o rt e r ’s buying power. Furt h e r, for the groups of Synthetic Fiber Blends(SITC 6516) Refined Plastic Materials (SITC 5812), and Civil Engineeringequipment (SITC 7231), a negative and significant coef ficient on thee x p o rter ‘s income suggests that the elasticity of substitution among import sis less than unity.
The estimation of import and export price elasticities has mixed results. Apositive coefficient sign on import unit value is consistent with an elasticity ofsubstitution among imports greater than the elasticity of substitutionbetween imported and domestic products. A large substitution elasticity

3 6 0 A Gravity Model Analysis of the Benefits of Economic Integration in the Pacific Rim
Table 3Estimated Gravity Models for Bilateral Trade
Between Pacific Rim Countries
Four-Digit Standard International Trade Classification (SITC) Commodity Groups
Note: (1) Student’s t statistics are presented within parentheses. * indicates statisticalsignificance at the 5% level; **at 2.5 % level; and *** at 1% level.
(2) SITC commodity code 7231 represents Civil Engineering Equipment; 7143represents reaction Engines; 6822 represents Worked Copper Alloys; 6516represents Synthetic Fiber Blends; 5812 represents Refined Plastic Materials.
(3) NAFTA2 and ASEAN2 capture the effects that membership in the same tradegroup has on the bilateral trade among Pacific Rim countries. NAFTAn a n dASEANn measures the bilateral trade effect between a group member and non-member country.
Variable 7231 7143 6822 6516 5812 58111. Exporter’s income (Yi) –0.220* 1.056*** 0.947*** –0.627*** –0.591*** 0.631***
(–2.277) (9.261) (4.395) (–5.835) (–6.378) (4.097)2. Importer’s income (Yj) 7.035*** 0.602*** 0.619*** 0.010 1.982* 0.359***
(3.307) (11.607) (3.478) (0.160) (1.933) (5.904)3. Export unit price (Pi) –0.321 –0.140 0.089 –0.752** 0.046 –0.504**
(–1.195) (–1.719) (1.571) (–2.723) (0.794) (–2.768)4. Import unit price (Pj) 0.084 –0.413*** –0.361 0.856** –0.070 0.541**
(0.284) (–3.963) (1.998) (3.055) (–0.717) (2.828)5. Distance (Dij) 7.129** 0.754 –2.564*** –0.081 –1.172 –0.706***
(3.197) (1.334) (3.847) (–0.251) (–1.402) (–6.033)6. Exchange rate (Ei j) – 0.091* 0.455*** 0.220* 0.055*** 0.277***
(2.231) (4.031) (2.008) (5.142) (4.883)7. Exporter’s inflation (Ii) –0.039 1.774* 1.006 0.238 –1.132*** 0.335
(–0.417) (2.400) (1.548) (0.674) (–5.124) (0.573)8. Importer’s inflation (Ij) 1.804 1.214** 0.869 –0.080 –3.576 –0.006
(1.196) (2.650) (1.296) (0.154) (–1.509) (–0.085)9. NAFTA2 (NA2) 0.140 3.398 – – – 0.879**
(0.170) (1.593) (2.948)10. NAFTAn (NAn) – 1.667** – – – –
(2.730)11. ASEAN2 (AS2) 8.483* – 0.482*** 1.145*** – –
(2.144) (3.238) (6.066)12. ASEANn (ASn) 2.791* – 0.283 0.455 1.678 –0.530
(2.173) (0.418) (1.391) (1.293) (–1.245)13. Level of development (Pinci j) 0.166*** – – 0.015* – –
(3.615) (2.133)Constant –43.690** –11.074 14.981* 9.369** 16.785* 7.911**
(–3.029) (1.526) (2.459) (2.726) (2.278) (2.910)Adjusted R2 0.813 0.985 0.776 0.894 0.949 0.964Number of Observations 36 32 30 36 40 36MSE 0.360 0.147 0.200 0.159 0.100 0.095

David Karemera, Wilbur I. Smith, Kalu Ojah, and John A. Cole 3 6 1
between home products and products from abroad and a small elasticity oft r a n s f o rmation among exportables lead to a negative coefficient on thee x p o rt e r ’s unit price. This finding is consistent with Bergstrand ([1985] p.479). Thus, the similar explanation provided above may be applied to theinflation variables. The reader can judge the significance of the estimates bylooking at the corresponding t-ratios. The magnitude of the price elasticitiesa re less than 1.0 for most commodity groups suggesting that the flows areless sensitive to commodity price changes in the Pacific Rim trade. However,the magnitude of import price elasticities are slightly greater than that of thee x p o rt price elasticities, suggesting that trade flows are less sensitive tochanges in export prices than in import prices.
The exchange rates coefficients (re p o rted in row 6) are positive and signif-icant in most cases. That is, an appreciation of an importing country ’s cur-rency (a depreciation of an exporting country ’s currency) increases tradeflows from the exporting country to the importing country. These findingsshow that changes in exchange rates significantly affect trade flows in thePacific Rim.
C. Effects of Subregional Trade Groups
The model includes variables re p resenting membership in subre g i o n a ltrade groups. The coefficients measuring the trade effects of two membercountries (N A2 and A S2) are significant, indicating that integration pactsenhance trade among members, especially through trade creation eff e c t s .H o w e v e r, for commodity groups such as Civil Engineering Equipment, thereis significant evidence of trade diversion. For example, for this commodityg roup, the coef ficient on A Sn indicates that while the ASEAN led toi n c reased trade among members, it also promoted trade among non-ASEANmembers. That is, its expansion in the Pacific Rim trade also yielded tradediversion effects. On the other hand, the commodity group of Worked Cop-per Alloys provides evidence that subregional groups enhanced trade amongits members, and, consequently, enhanced trade in the Pacific Rim. Overall,t h e re is evidence that subregional trade groups (i . e ., NAFTA and ASEAN) inthe Pacific Rim contribute to increased trade flows in the region. Additional-l y, and in sum, the evidence indicates that more of the subregional gro u p s ’

3 6 2 A Gravity Model Analysis of the Benefits of Economic Integration in the Pacific Rim
trade effects are via trade creation than via trade diversion. This finding isconsistent with findings documented by Eichengreen and Frankel ([1995] p.93) and Karamera and Ojah [1998]. Karemera and Ojah [1998] studied thetrade creation and diversion effects of NAFTA. They document that NAFTAexpands trade in North America through both trade creation and trade diver-sion and that about seventy percent of the total expansion in the commodi-ties examined is attributable to trade cre a t i o n .
D. Effects of Environmental Factors on Trade in the Pacific Rim.
A c c o rding to the theory of spatial equilibrium, the quantities of a commod-ity traded are inversely related to distance. A relatively large distance dis-courages trade while a relatively short distance is more likely to stimulatetrade. It is hypothesized that countries with shorter distance among them-selves are more likely to be better acquainted and share similar culture thancountries that are geographically farther apart. The distance among integrat-ing countries may be subject to similar interpretation. Thus, shorter distanceamong integrating members reduces resistance or impediments to trade andshould be associated with higher levels of trade, and vice versa. In this study,the estimated coefficients have expected negative signs except coeff i c i e n t son the commodity groups of Civil Engineering Equipment and ReactionEngines. Since types and quality of these specific commodity groups pro-duced in the exporting countries are not homogeneous and since demand isquality specific in most importing countries, the pattern of trade in thesecommodity groups of Civil Engineering Equipment and Reaction Engines isnot determined on the basis of distances in the Pacific Rim trade.
F u rt h e rm o re, it may be argued that, in the era of regional groupings, dis-tance is not an trade impediment it used to be. Cargo ships and planes arel a rger and faster. Modern means of transportation including Private carr i e r ssuch Federal Express and the United Parcel Service, telecommunications,and the Internet are now used to “shrink” distance as a factor resisting trade.T h e re f o re, as technology brings the costs of overcoming distance down, thee m e rging of regional groupings is facilitated; which provides an impetus form o re trade. Finally, the results indicate that APEC countries with common

David Karemera, Wilbur I. Smith, Kalu Ojah, and John A. Cole 3 6 3
b o rders or in close proximity trade more than countries that are more geo-graphically separated.
The level of development variable was included to re p resent another envi-ronment factor. Brada and Mendez [1985] defined the level of developmentas the per capita income of integrating countries. The level of developmentshould have a positive effect on economic integration and trade flow. A highlevel of development is likely to be associated with a high need for exchangein both intermediate and finished goods. As Krugman and Obstfeld [1994]o b s e rved, such trades are more likely to be driven by economies of scale( i n t r a - i n d u s t ry trade) than by comparative advantage (inter- i n d u s t ry trade).The results indicate that increases in the per capita income lead to incre a s e sin trade flows. In fact, the result here is particularly notable for the commodi-ty groups of Civil Engineering Equipment and Synthetic Fiber Blends. How-e v e r, this evidence is not documented for all the commodity groups we ana-lyzed. Thus, more re s e a rch involving larger data sets and a longer samplingperiod is needed. In other words, further studying the effects of the re l a t i v elevel of development and per capita incomes on trade in the Pacific Rimwould be a fruitful agenda for future re s e a rc h .
VII. Concluding Remarks
A re d u c e d - f o rm gravity model derived from a general equilibrium modelof international trade is modified to evaluate the determinants of trade flowsof some selected commodity groups in the Pacific Rim. This model employstime series and cross-sectional data. We placed special emphasis on thee ffects of subregional pacts on the Pacific Rim trade. Additionally, we exam-ined the effects of cultural and economic factors on integrating (trade pactmembers) nations.
Our study shows that gravity models can be reparameterized into a timeseries and cross-sectional model and used for the statistical description oftrade flows and the analysis of the economic integration effects. In the caseof the Pacific Rim trade, documented evidence on selected commodityg roups suggests that environmental, free trade, and economic variablesshould be considered in the modeling of trade flows that are due to econom-ic integration.

3 6 4 A Gravity Model Analysis of the Benefits of Economic Integration in the Pacific Rim
Our findings on the traditional gravitational variables (such as incomes ofi m p o rting and exporting countries, prices of the traded commodity, and dis-tance between trade partners) are, generally, in conformity with those docu-mented in previous studies. Furt h e rm o re, findings on the effects of subre-gional trade pacts on trade flows in a larger economically integrating are a ,such as the Pacific Rim, seem to be highly commodity-specific. For instance,documented results show that while ASEAN enhanced trade among ASEANmembers, it also increased trade among non-ASEAN members, thus stimu-lating both trade creation and trade diversion effects. This finding furt h e rindicates that trade pacts are beneficial to both participating and nonpart i c-ipating countries in the region. We document evidence that enviro n m e n t a lfactors such as the distance between economically integrating countries havesignificant and positive effects on trade flows of the integrating area. Thee ffect of per capita income of integrating member countries on trade flow isp re l i m i n a ry in this study because of data limitation. However, the pre l i m i-n a r y evidence suggests that integrating high-income countries eliciti n c reased trade flows in the economic union.
In conclusion, our study has amply demonstrated the importance of incor-porating economic, free trade, and environmental factors into the traditionalgravity framework when modeling the determinants or effects of trade flowson an economically integrating area, such as the Pacific Rim. This insight isp a rticularly important in this era of increased economic regionalism andglobalization. Indeed, one can infer from our findings that economic re g i o n a l-ism and economic globalization are not contradictory. If subregional tradeg roups enhanced trade in a region, then regionalism should enhance thebenefits of economic globalization. The verification of this conjecture, there-f o re, presents an interesting question for future re s e a rch.
References
Anderson James [1979], “A Theoretical Foundation of the Gravity Eq u a t i o n , ”American Economic Review, Marc h .
Balassa, Bela [1975], “Trade Creation and Trade Diversion in the Euro p e a nCommon Market: An Appraisal of the Evidence,” in E u ropean Econom -ic Integration, Bela Balassa, (ed.), Amsterdam, North Holland.

David Karemera, Wilbur I. Smith, Kalu Ojah, and John A. Cole 3 6 5
Baldwin, R.E. and T. M u rray [1986], “MFN Ta r i ff Reductions and LDC Bene-fits under GSP: A Reply,” The Economic Journ a l, March; pp. 537-539.
B e rgstrand, Jeff rey [1985], “The Gravity Equation in International Tr a d e :Some Microeconomic Foundation and Empirical Evidence,” T h eReview of Economics Statistics; pp.474-481.
Brada, C. Josef and Jose A. Mendez [1985], “Economic Integration amongDeveloped, Developing and Centrally Planned Economies: A Compara-tive Analysis,” The Review of Economics and Statistics; pp. 549-556.
B rown, Drusilla K., Alan V. Deard o rff, and Robert M. Stern [1992], “A Nort hAmerican Free Trade Agreement: Analytical Issues and a Computation-al Assessment,” The World Economy, January; pp. 11-29.
E i c h e n g reen, Barry and Jeff rey A. Frankel [1995], “Economic Regionalism:Evidence from Two 20th Century Episodes,” The North American Jour -nal of Economics and Finance 62, Fall; pp. 89-106.
Geraci, Vincent and Wi l f red Priwo [1977], “Bilateral Trade Flows and Tr a n s-p o rtation Costs,” The Review of Economics and Statistics 60; pp. 67-74.
G o d f re y, Jeff rey [1986] Specification Tests in Econometrics, Nort h - H o l l a n d ,A m s t e rd a m .
Goldstein, Morris and Moshkin Khan [1978], “The Supply and Demand forE x p o r ts: A Simultaneous Approach,” Review of Economics andS t a t i s t i c s, Febru a ry; pp. 275-286.
Hausman, J.A., “Specification Tests in Econometrics,” E c o n o m e t r i c a 46; pp.1 2 5 1 - 1 2 7 2 .
Hsiao, C. [1986], Analysis of Panel Data, Cambridge University Press, NewYo r k .
I n t e rnational Monetary Fund, I n t e rnational Financial Statistics, Va r i o u sI s s u e s
Jacobs, Stephen P. [1997], “The NAFTA: Exports, Jobs, Wages, and Invest-ment,” Business America, October 18; pp. 3-5.
Judge, G. G., W. E. Hill, R. C. Lutkepohl and H.C. Lee [1985], The Theory andPractice of Econometrics (second edition), Wi l e y, New York.
K a remera, David and Kalu Ojah [1998], “An Industrial Analysis of Trade Cre-ation and Trade Diversion Effects of NAFTA,” The Journal of EconomicIntegration 13, September; pp. 400 - 425.
K a remera, David and Won Koo [1994], “Trade Creation and Diversion

3 6 6 A Gravity Model Analysis of the Benefits of Economic Integration in the Pacific Rim
E ffects of the U.S.-Canadian Free Trade Agreement,” C o n t e m p o r a ryEconomic Policy XII, January; pp. 12-23.
Kmenta, Jan, Elements of Econometrics (second ed.), New York : MacMillan.Koo, Won W., Ihn H. Uhm, and Joel Golz [1991], “Bilateral Trade Relation-
ship between the United States and Canada: Implications of Free Tr a d eA g reement,” C o n t e m p o r a ry Policy Issues, January; pp. 56-69.
Koo, Won W. and David Karemera [1991], “Determinants of World WheatTrade Flows and Policy Analysis,” Canadian Journal of AgriculturalE c o n o m i c s 39; pp. 439-455.
Koo, Won W., David Karemera, and Richard Taylor [1994], “A Gravity ModelAnalysis of Meat Trade Policies,” Agricultural Economics 10; pp. 81-88.
K rugman, Paul and Maurice Obstfeld [1994], I n t e rnational Economics: Theo -ry and Policy ( T h i rd edition.), Harper Collins College Publishers, NewYork; pp. 127-130.
Linneman, Hans [1966], An Econometric Study of International Trade Flows,A m s t e rd a m: North Holland Publishing.
Pagoulatos, Emilio and Robert Sorensen [1986], “What Determines the Elas-ticity of Industry Demand?” I n t e rnational Journal of Industrial Org a n i -zation N o rth Holland, 4; pp. 237-250.
S a p i r, Andre [1981], “Trade Benefits under the EEC Generalized System ofP re f e rences,” E u ropean Economic Review 15; pp. 339-355.
S u m m a ry, Rebecca [1989], “A Political Economic Model of U.S. BilateralTrade,” The Review of Economics and Statistics; pp. 179-192
P o m f ret, Richard [1986], “MFN Ta r i ff reductions and Developing CountryTrade Benefits under GSP: A Comment,” The Economic Journ a l, July;pp. 534-536.
UN, I n t e rnational Trade Statistics Ye a r b o o k, Statistical Division, UnitedNations, New York, Various Issues.
Ve rdoon and Petrus J. [1972], “Measuring Integration Effects: A Surv e y, ”Economic Review, March; pp. 237-49.
White, H. [1981], “A Heteroskedastic-Consistent Covariance Matrix and aD i rect Test for Hetero s k e d a s t i c i t y,” E c o n o m e t r i c a 48; pp. 817-838.
Wonnacottt, Ronald and Paul Wonnacott [1982], “Free Trade between UnitedStates and Canada: 15 Years Later,” C a n a d i a n Public Policy Supplement,O c t o b e r.

David Karemera, Wilbur I. Smith, Kalu Ojah, and John A. Cole 3 6 7
Yamazawa, Ippei [1992], “On Pacific Economic Integration,” The EconomicJ o u rnal 102; pp. 1519-1529.