Embed Size (px)
Citation preview
A Grain Exporter’s Perspective
ICS Annual Dry Bulk Conference 2021
November 18, 2021
Agenda
1.Prairie Crop Production
2.Canola Crush Expansion-what is going on?
3.Anchorage Issues and Low Hanging Fruit
Prairie Crop Production
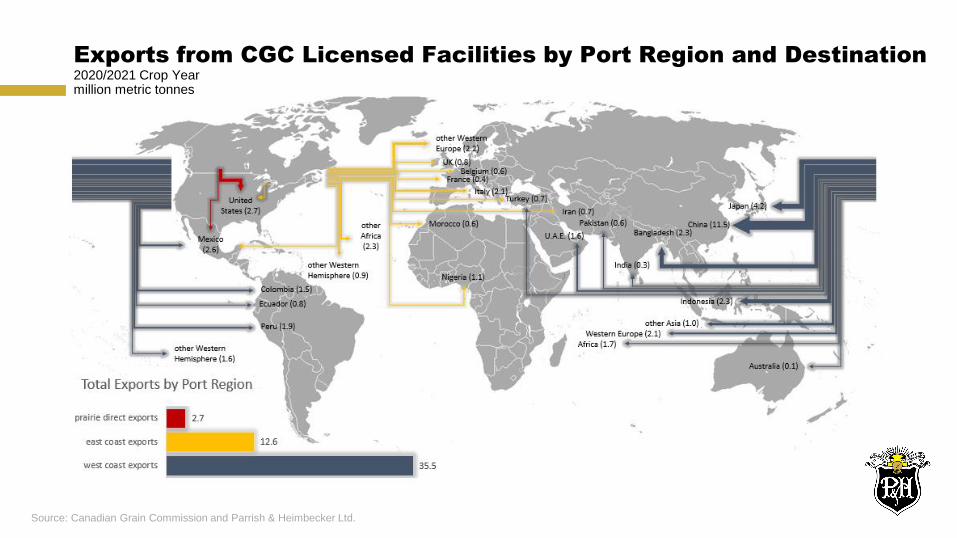
Source: Canadian Grain Commission and Parrish & Heimbecker Ltd.
Exports from CGC Licensed Facilities by Port Region and Destination 2020/2021 Crop Yearmillion metric tonnes
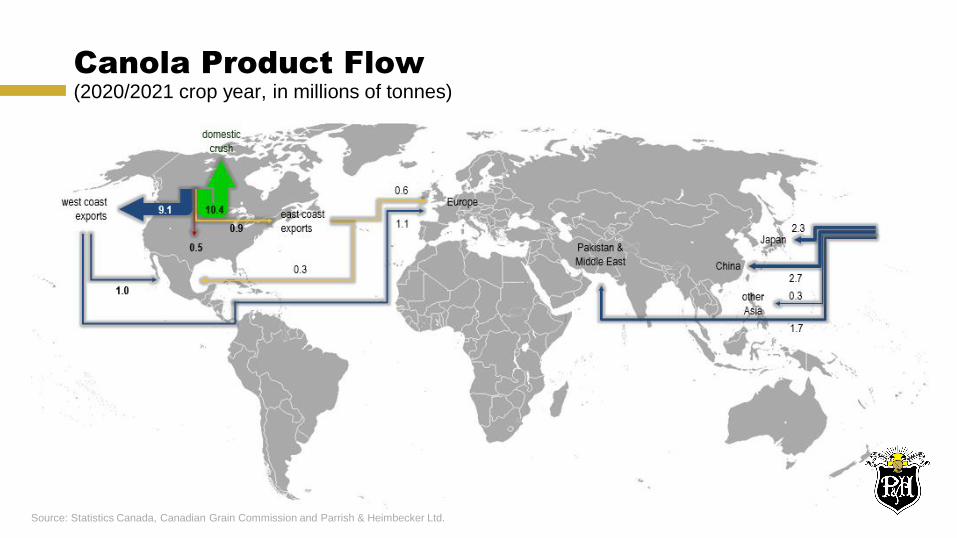
Canola Product Flow (2020/2021 crop year, in millions of tonnes)
Source: Statistics Canada, Canadian Grain Commission and Parrish & Heimbecker Ltd.
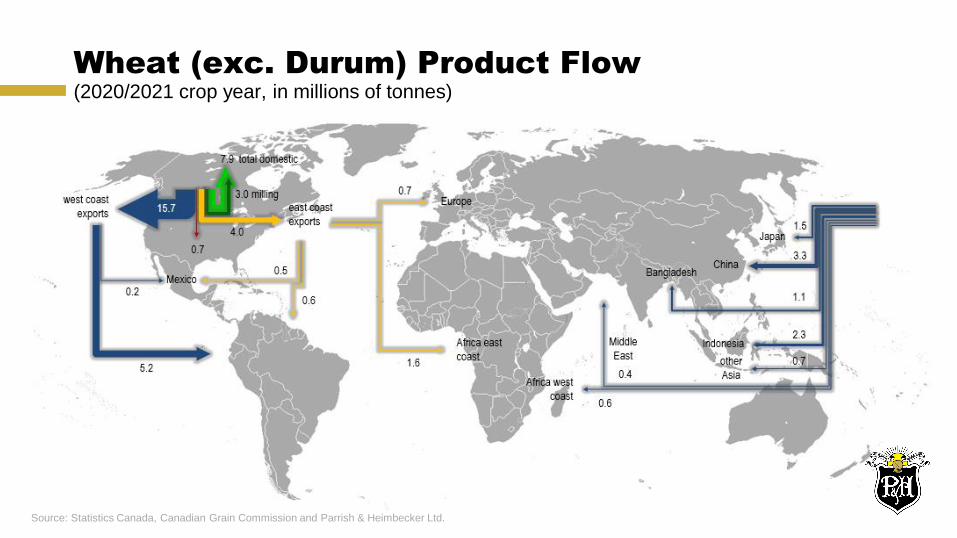
Wheat (exc. Durum) Product Flow (2020/2021 crop year, in millions of tonnes)
Source: Statistics Canada, Canadian Grain Commission and Parrish & Heimbecker Ltd.
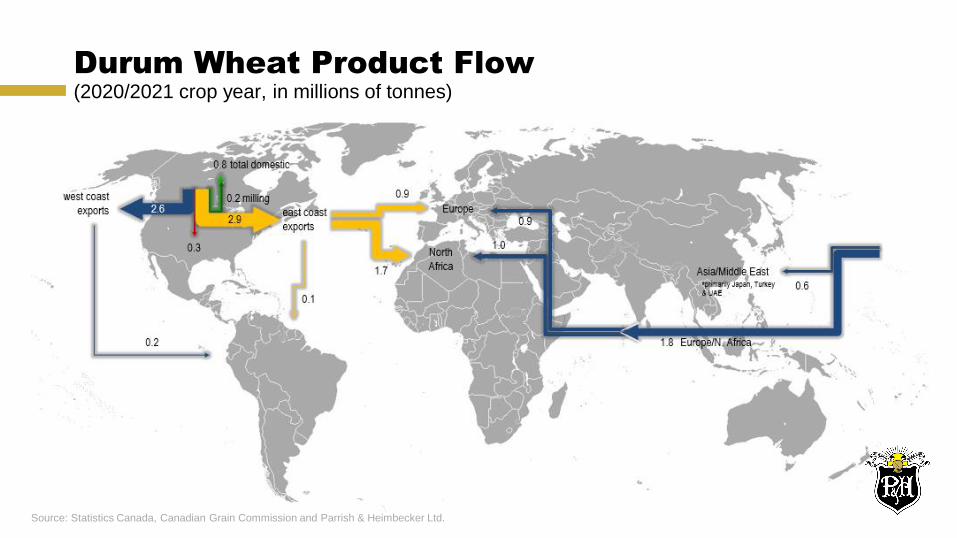
Durum Wheat Product Flow (2020/2021 crop year, in millions of tonnes)
Source: Statistics Canada, Canadian Grain Commission and Parrish & Heimbecker Ltd.
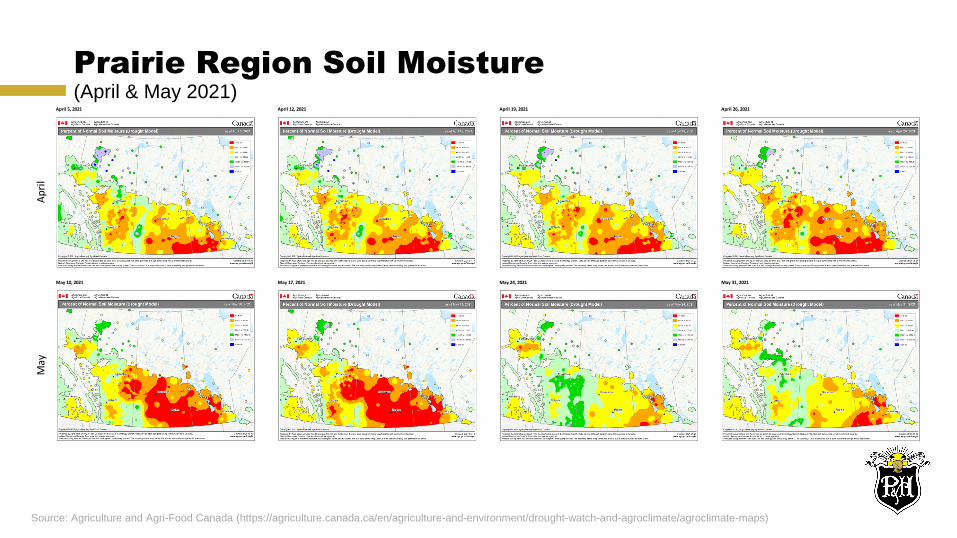
Prairie Region Soil Moisture(April & May 2021)
Ap
ril
May
April 5, 2021 April 12, 2021 April 19, 2021 April 26, 2021
May 10, 2021 May 17, 2021 May 24, 2021 May 31, 2021
Source: Agriculture and Agri-Food Canada (https://agriculture.canada.ca/en/agriculture-and-environment/drought-watch-and-agroclimate/agroclimate-maps)
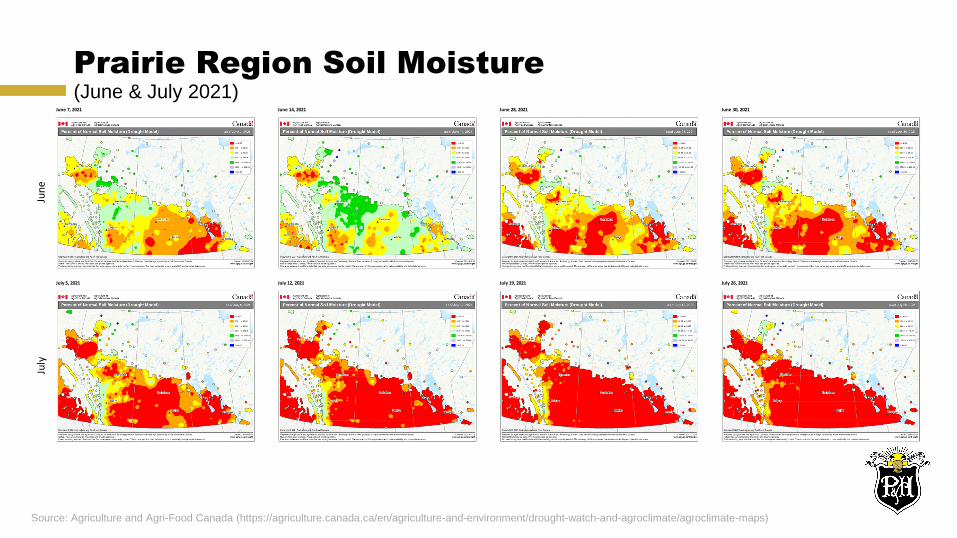
Prairie Region Soil Moisture(June & July 2021)
Jun
eJu
ly
June 7, 2021 June 14, 2021 June 28, 2021 June 30, 2021
July 5, 2021 July 12, 2021 July 19, 2021 July 26, 2021
Source: Agriculture and Agri-Food Canada (https://agriculture.canada.ca/en/agriculture-and-environment/drought-watch-and-agroclimate/agroclimate-maps)
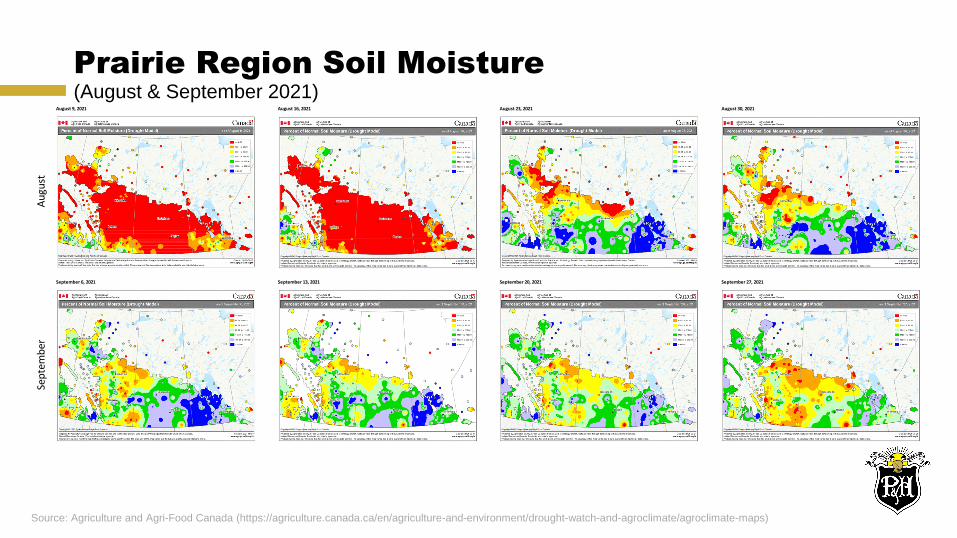
Prairie Region Soil Moisture(August & September 2021)
Au
gust
Sep
tem
ber
September 6, 2021 September 13, 2021 September 20, 2021 September 27, 2021
August 9, 2021 August 16, 2021 August 23, 2021 August 30, 2021
Source: Agriculture and Agri-Food Canada (https://agriculture.canada.ca/en/agriculture-and-environment/drought-watch-and-agroclimate/agroclimate-maps)
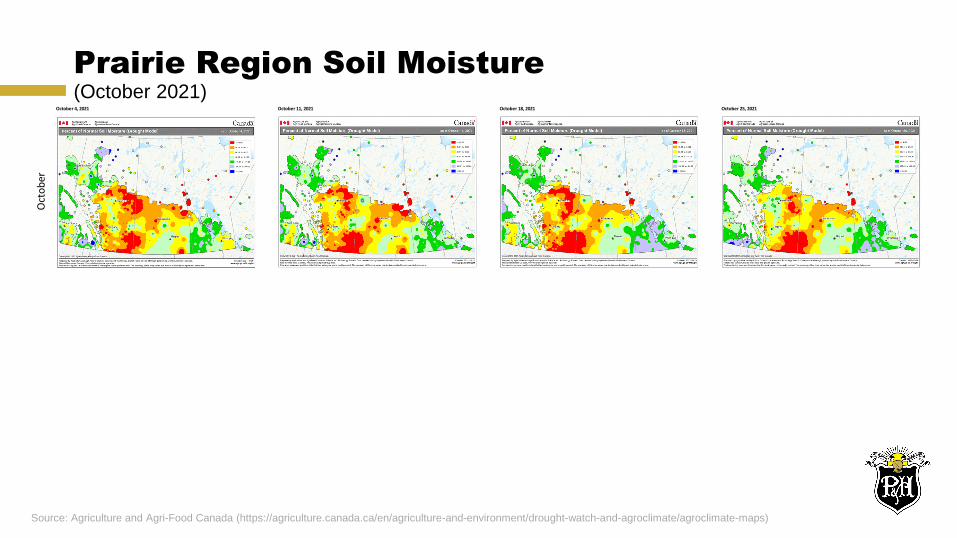
Prairie Region Soil Moisture(October 2021)
Oct
ob
er
October 4, 2021 October 11, 2021 October 18, 2021 October 25, 2021
Source: Agriculture and Agri-Food Canada (https://agriculture.canada.ca/en/agriculture-and-environment/drought-watch-and-agroclimate/agroclimate-maps)
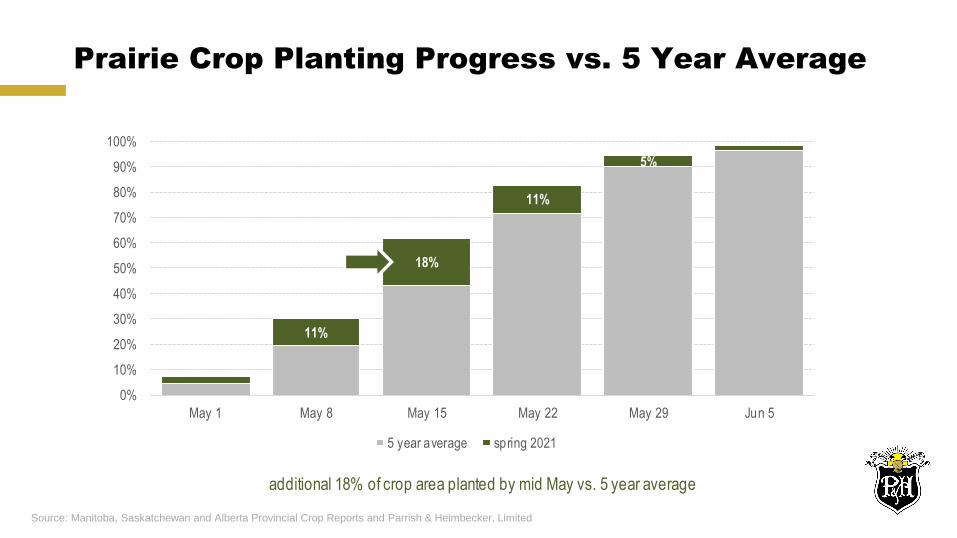
Prairie Crop Planting Progress vs. 5 Year Average
Source: Manitoba, Saskatchewan and Alberta Provincial Crop Reports and Parrish & Heimbecker, Limited
11%
18%
11%
5%
0%
10%
20%
30%
40%
50%
60%
70%
80%
90%
100%
May 1 May 8 May 15 May 22 May 29 Jun 5
5 year average spring 2021
additional 18% of crop area planted by mid May vs. 5 year average
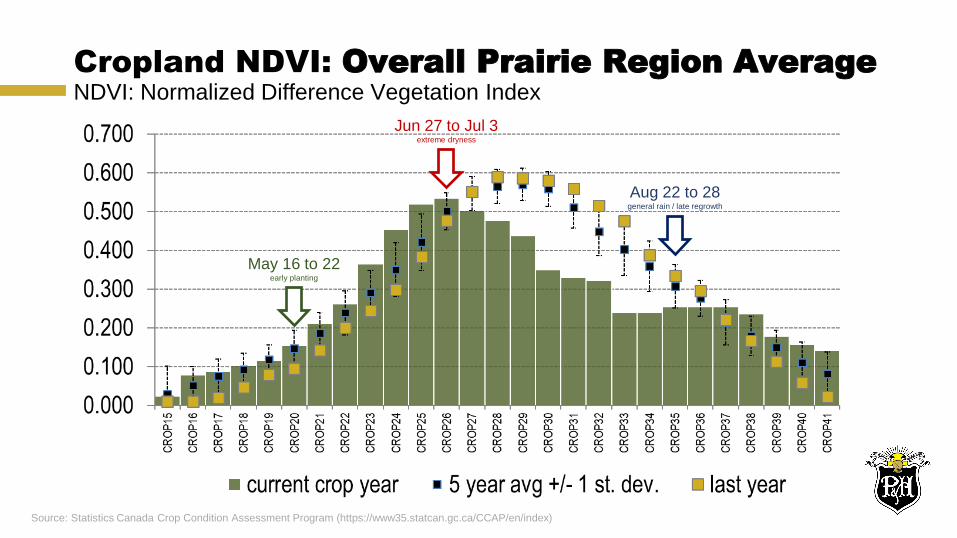
Cropland NDVI: Overall Prairie Region AverageNDVI: Normalized Difference Vegetation Index
Source: Statistics Canada Crop Condition Assessment Program (https://www35.statcan.gc.ca/CCAP/en/index)
Jun 27 to Jul 3extreme dryness
May 16 to 22early planting
Aug 22 to 28general rain / late regrowth
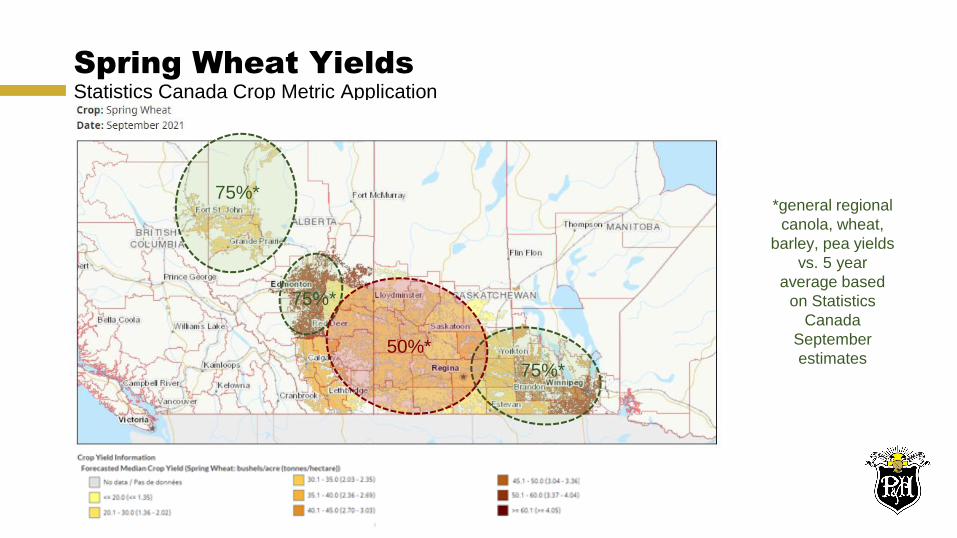
Spring Wheat YieldsStatistics Canada Crop Metric Application
*general regional
canola, wheat,
barley, pea yields
vs. 5 year
average based
on Statistics
Canada
September
estimates75%*
75%*
75%*
50%*
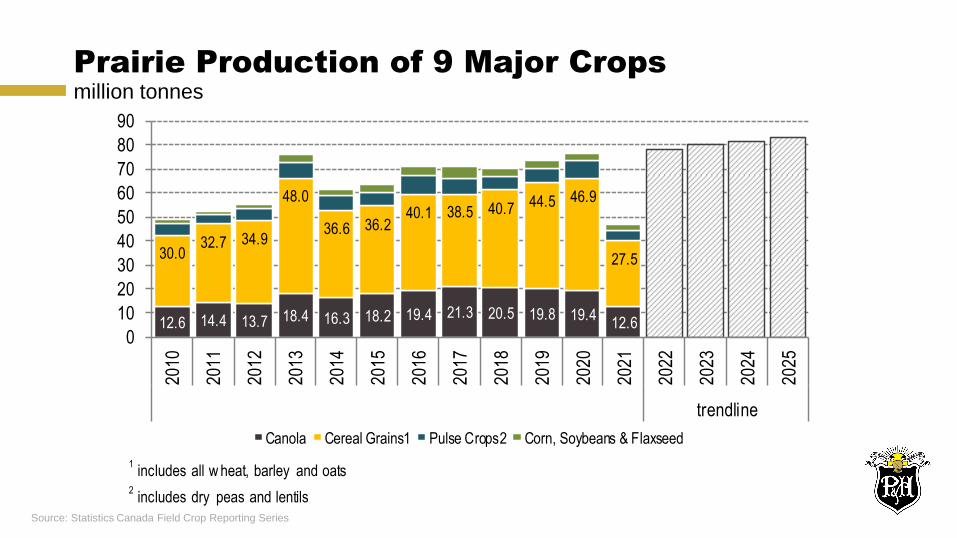
Prairie Production of 9 Major Cropsmillion tonnes
Source: Statistics Canada Field Crop Reporting Series
1 includes all w heat, barley and oats
2 includes dry peas and lentils
12.6 14.4 13.7 18.4 16.3 18.2 19.4 21.3 20.5 19.8 19.412.6
30.032.7 34.9
48.0
36.6 36.240.1 38.5 40.7 44.5 46.9
27.5
0
10
20
30
40
50
60
70
80
90
2010
2011
2012
2013
2014
2015
2016
2017
2018
2019
2020
2021
2022
2023
2024
2025
trendline
Canola Cereal Grains1 Pulse Crops2 Corn, Soybeans & Flaxseed

Exports, Domestic Use and Stocks Scenariocanola, wheat and durum 2021/2022 crop year vs. 3 year average
Source: Statistics Canada and Parrish & Heimbecker, Limited
Canola Wheat Durum
9,900
4,200
10,500
9,300
3,200 1,200
3 yr avg 2021/2022
ending stocks domestic disappearance exports
4,600 2,800
8,100 7,200
19,700
13,200
3 yr avg 2021/2022
ending stocks domestic disappearance exports
1,100 550
900
800
5,200
2,950
3 yr avg 2021/2022
ending stocks domestic disappearance exports
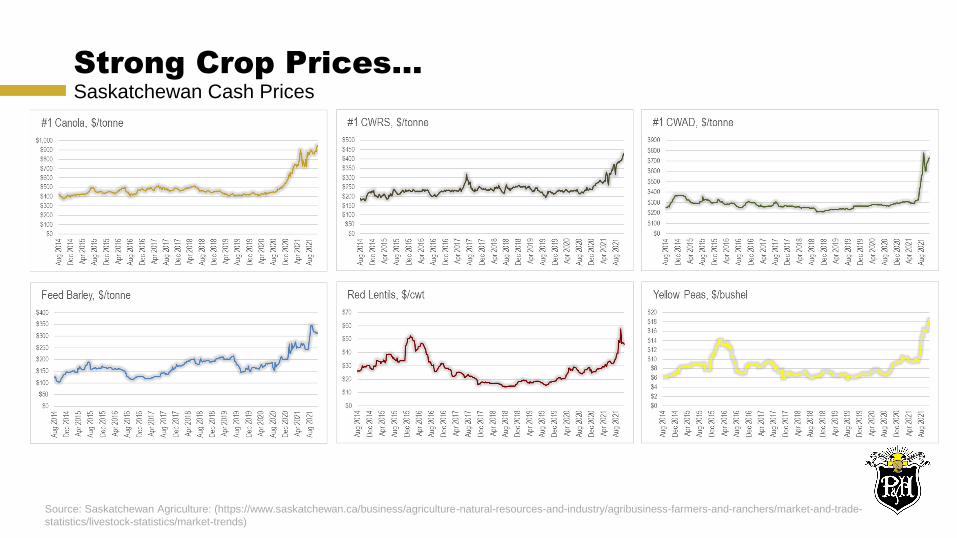
Strong Crop Prices…Saskatchewan Cash Prices
Source: Saskatchewan Agriculture: (https://www.saskatchewan.ca/business/agriculture-natural-resources-and-industry/agribusiness-farmers-and-ranchers/market-and-trade-
statistics/livestock-statistics/market-trends)
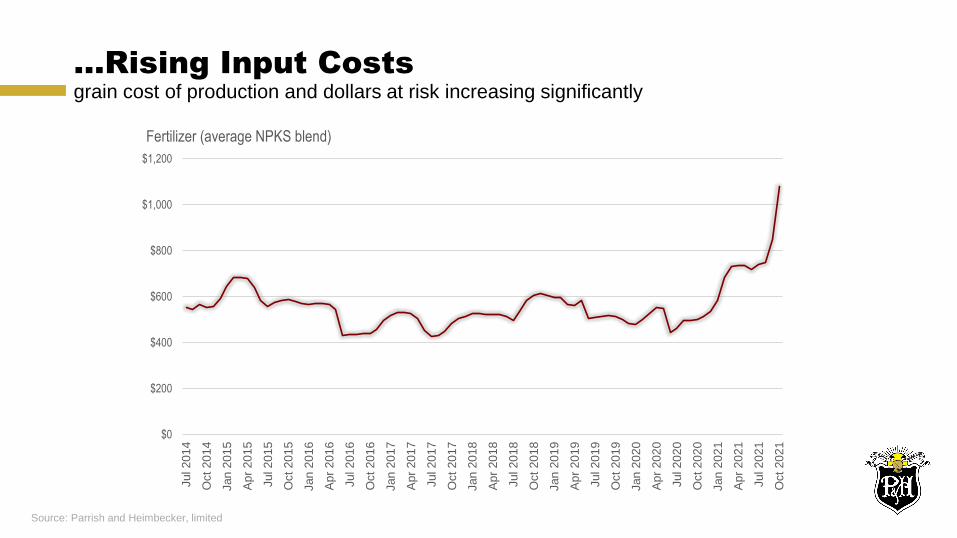
…Rising Input Costsgrain cost of production and dollars at risk increasing significantly
Source: Parrish and Heimbecker, limited
$0
$200
$400
$600
$800
$1,000
$1,200
Jul 20
14
Oct
20
14
Jan
20
15
Ap
r 20
15
Jul 20
15
Oct
20
15
Jan
20
16
Ap
r 20
16
Jul 20
16
Oct
20
16
Jan
20
17
Ap
r 20
17
Jul 20
17
Oct
20
17
Jan
20
18
Ap
r 20
18
Jul 20
18
Oct
20
18
Jan
20
19
Ap
r 20
19
Jul 20
19
Oct
20
19
Jan
20
20
Ap
r 20
20
Jul 20
20
Oct
20
20
Jan
20
21
Ap
r 20
21
Jul 20
21
Oct
20
21
Fertilizer (average NPKS blend)
Canola Crush Expansion
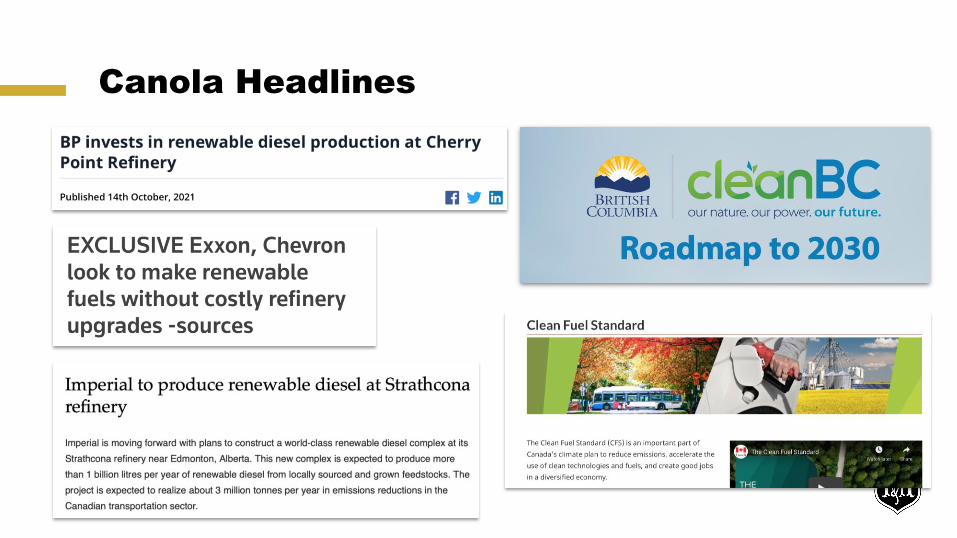
Canola Headlines
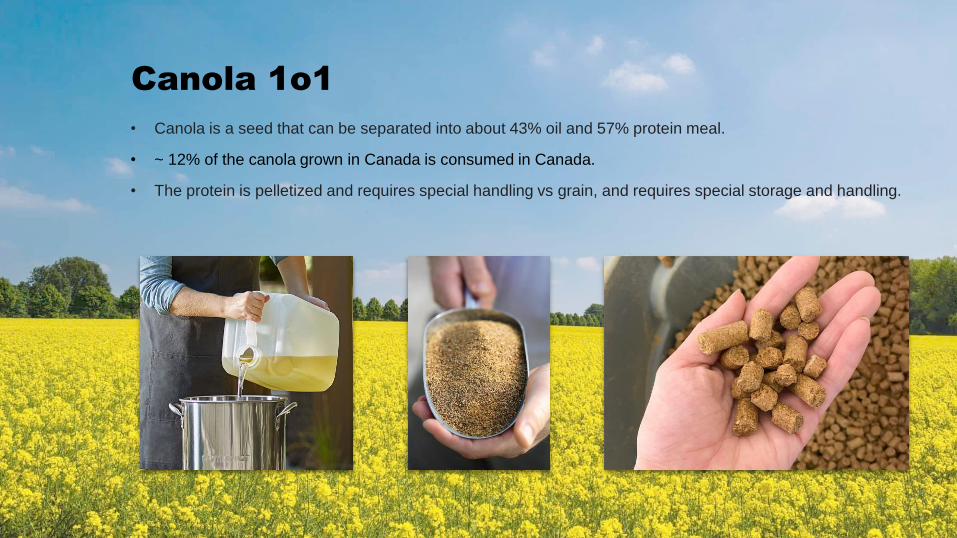
Canola 1o1
• Canola is a seed that can be separated into about 43% oil and 57% protein meal.
• ~ 12% of the canola grown in Canada is consumed in Canada.
• The protein is pelletized and requires special handling vs grain, and requires special storage and handling.
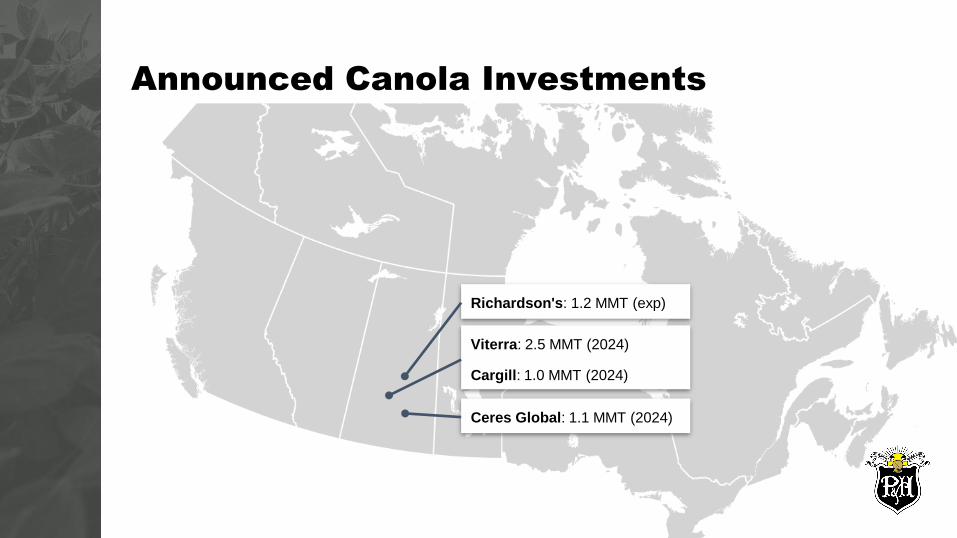
Viterra: 2.5 MMT (2024)
Cargill: 1.0 MMT (2024)
Richardson's: 1.2 MMT (exp)
Ceres Global: 1.1 MMT (2024)
Announced Canola Investments
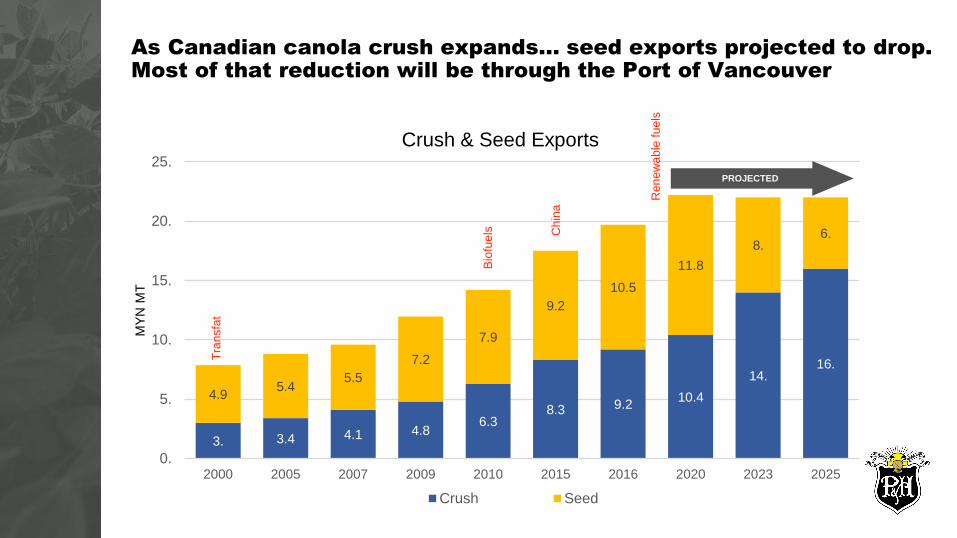
3. 3.4 4.1 4.86.3
8.3 9.210.4
14.16.
4.95.4
5.5
7.2
7.9
9.2
10.5
11.8
8.6.
0.
5.
10.
15.
20.
25.
2000 2005 2007 2009 2010 2015 2016 2020 2023 2025
MY
N M
TCrush & Seed Exports
Crush Seed
PROJECTED
As Canadian canola crush expands… seed exports projected to drop. Most of that reduction will be through the Port of Vancouver
Tra
nsfa
t
Bio
fue
ls Chin
a
Ren
ew
ab
le fu
els

Partially Offset by Increased Meal & Oil Exports Requiring Specialized Handling Facilities at the West Coast.
3.2 3.4 3.4 4. 4.
4.64.9 5.3
7.68.7
0.
2.
4.
6.
8.
10.
12.
14.
2018 2019 2020 2023 2025
MY
N M
T
Oil & Meal Exports
Oil Meal
PROJECTED
Source: COPA Oil & Meal Total Exports 2018-2020
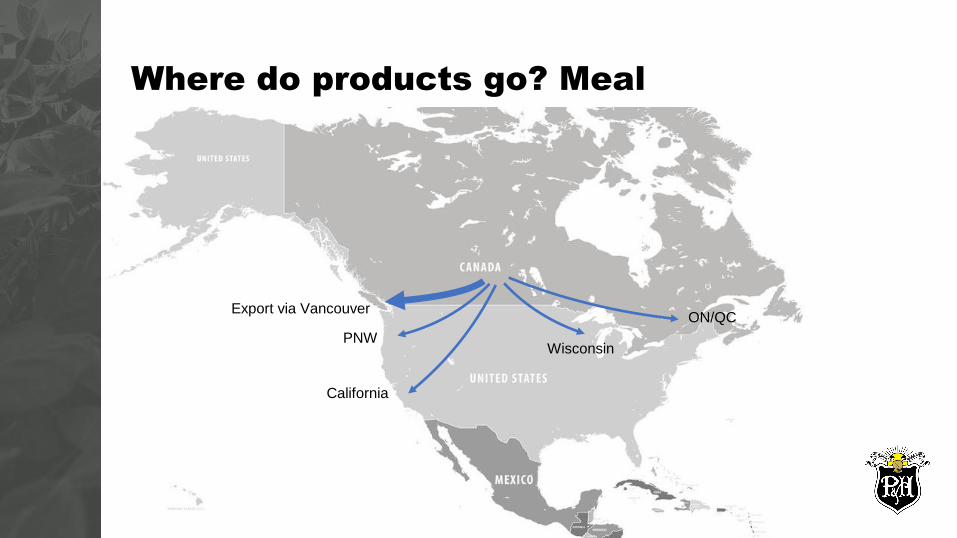
Where do products go? Meal
Export via Vancouver
California
Wisconsin
ON/QC
PNW

Where do products go? Oil
Export via Vancouver
USA - Biodiesel
USA - Food Service
ON/QC - Food Service & Biodiesel
Anchorage Issues and Low Hanging Fruit
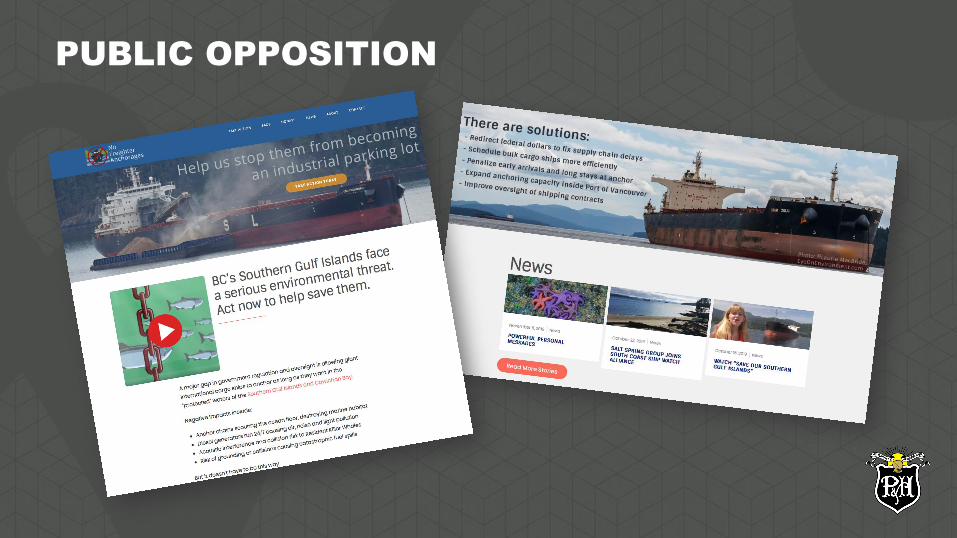
PUBLIC OPPOSITION
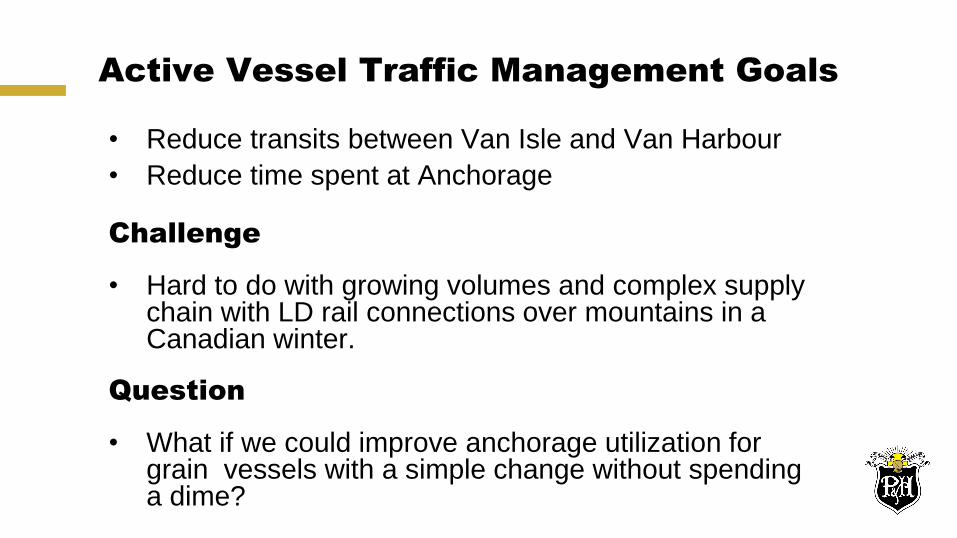
Active Vessel Traffic Management Goals
• Reduce transits between Van Isle and Van Harbour
• Reduce time spent at Anchorage
Challenge
• Hard to do with growing volumes and complex supply chain with LD rail connections over mountains in a Canadian winter.
Question
• What if we could improve anchorage utilization for grain vessels with a simple change without spending a dime?
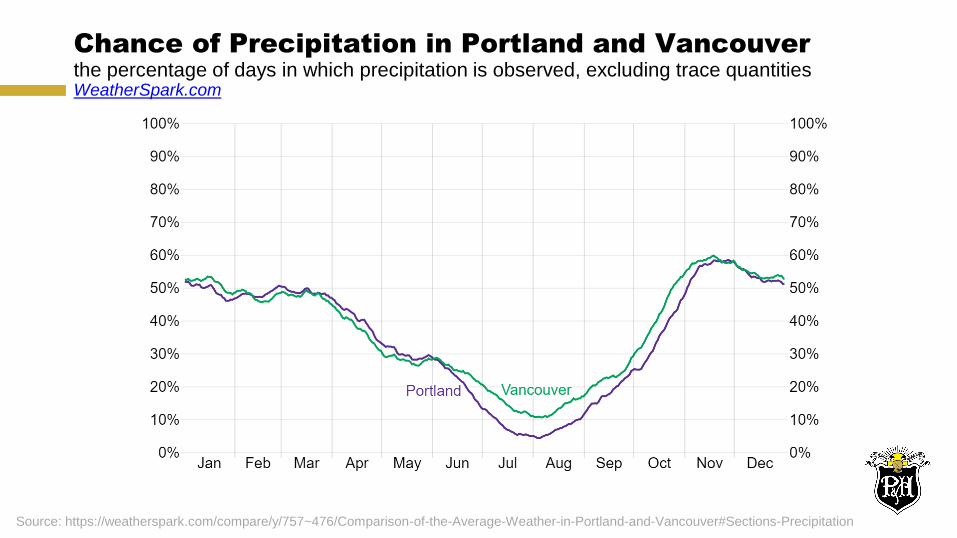
Chance of Precipitation in Portland and Vancouverthe percentage of days in which precipitation is observed, excluding trace quantitiesWeatherSpark.com
Source: https://weatherspark.com/compare/y/757~476/Comparison-of-the-Average-Weather-in-Portland-and-Vancouver#Sections-Precipitation
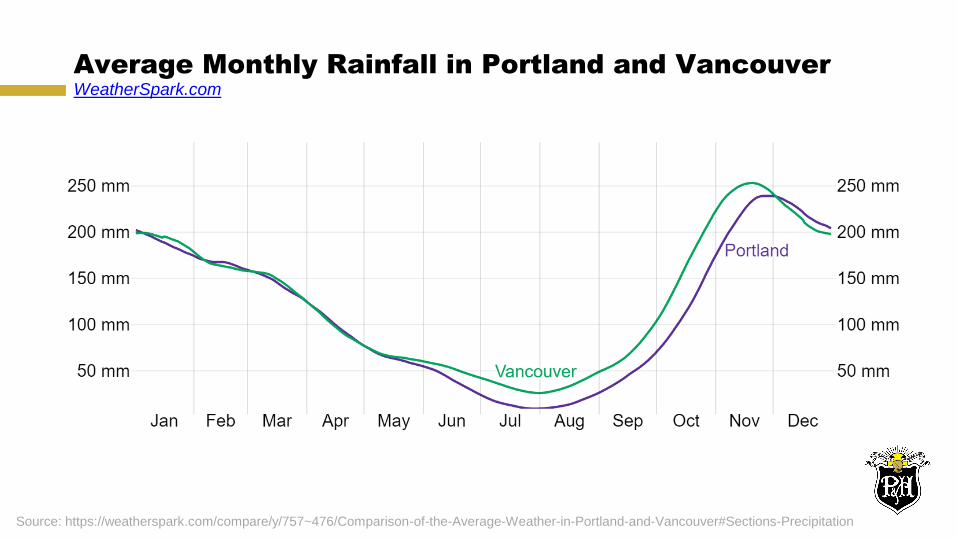
Average Monthly Rainfall in Portland and VancouverWeatherSpark.com
Source: https://weatherspark.com/compare/y/757~476/Comparison-of-the-Average-Weather-in-Portland-and-Vancouver#Sections-Precipitation
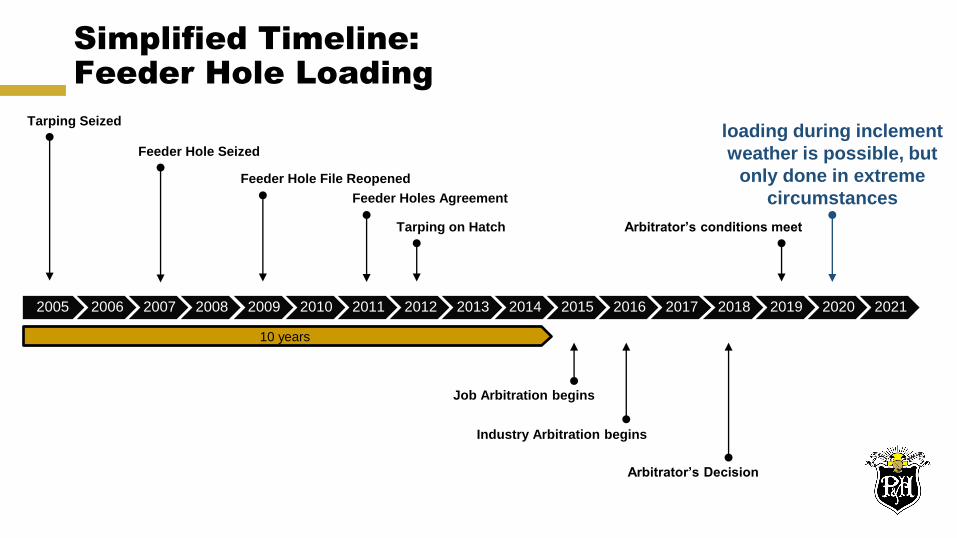
Simplified Timeline: Feeder Hole Loading
2005 2006 2007 2008 2009 2010 2011 2012 2013 2014 2015 2016 2017 2018 2019 2020 2021
Tarping Seized
Feeder Hole Seized
Feeder Hole File Reopened
Feeder Holes Agreement
Tarping on Hatch
Job Arbitration begins
Industry Arbitration begins
Arbitrator’s Decision
10 years
Arbitrator’s conditions meet
loading during inclement
weather is possible, but
only done in extreme
circumstances
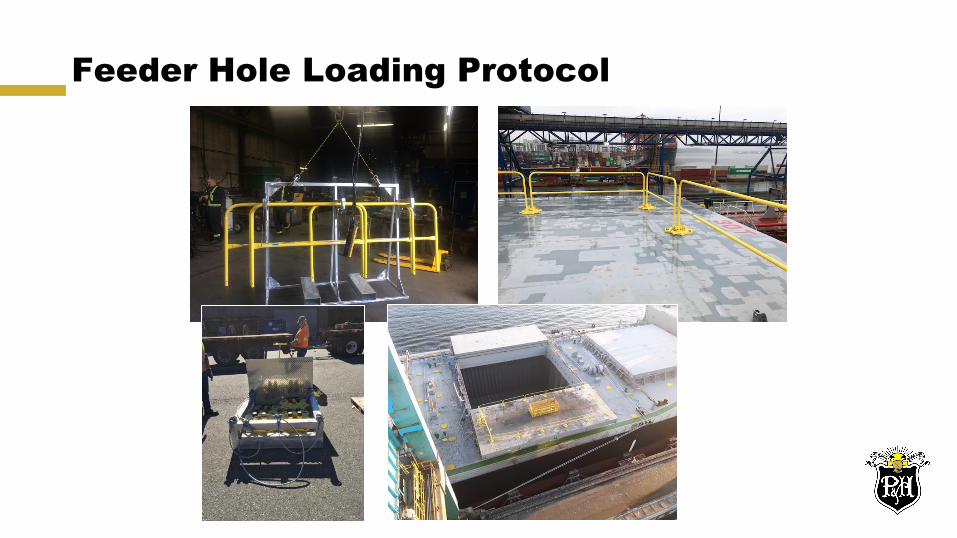
Feeder Hole Loading Protocol
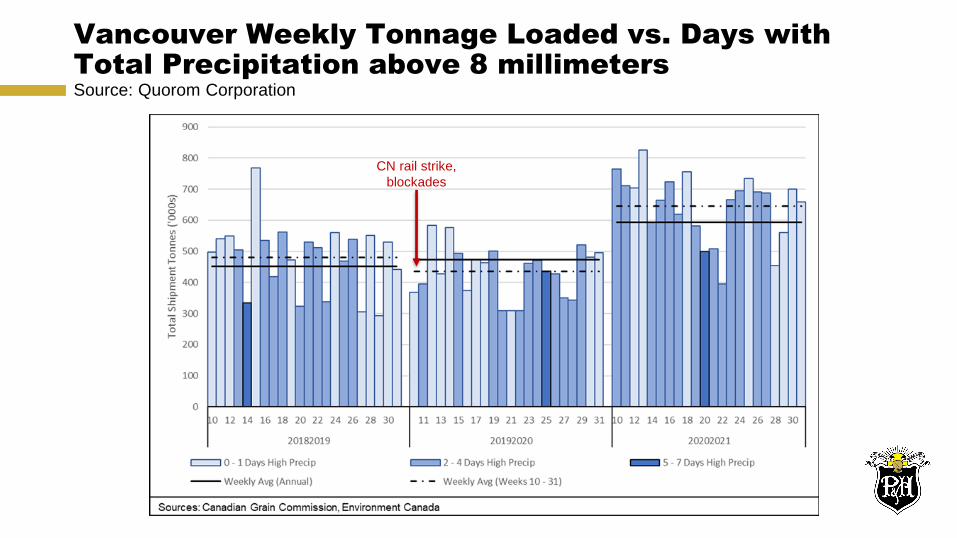
Vancouver Weekly Tonnage Loaded vs. Days with Total Precipitation above 8 millimeters Source: Quorom Corporation
CN rail strike,
blockades
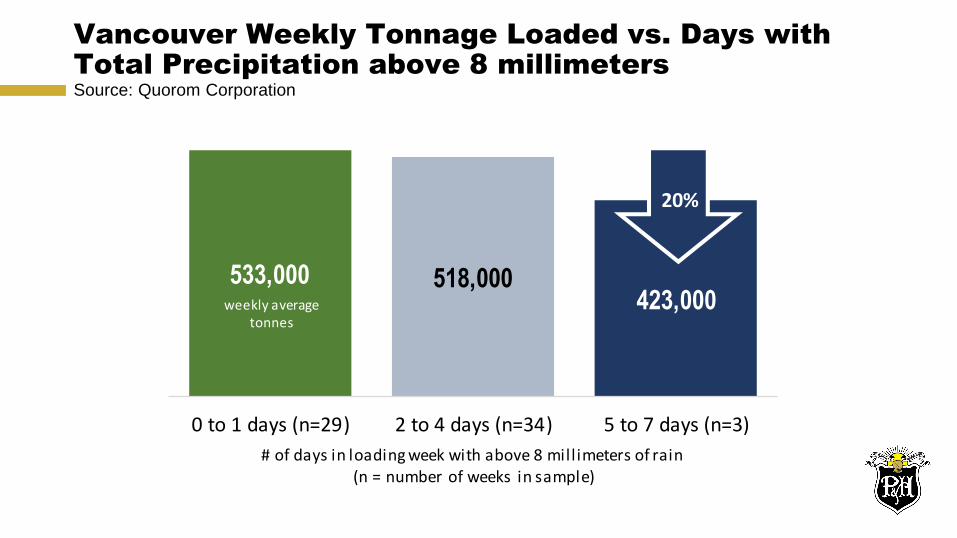
Vancouver Weekly Tonnage Loaded vs. Days with Total Precipitation above 8 millimeters Source: Quorom Corporation
533,000 518,000423,000
0 to 1 days (n=29) 2 to 4 days (n=34) 5 to 7 days (n=3)
# of days in loading week with above 8 mill imeters of rain (n = number of weeks in sample)
20%
weekly average tonnes
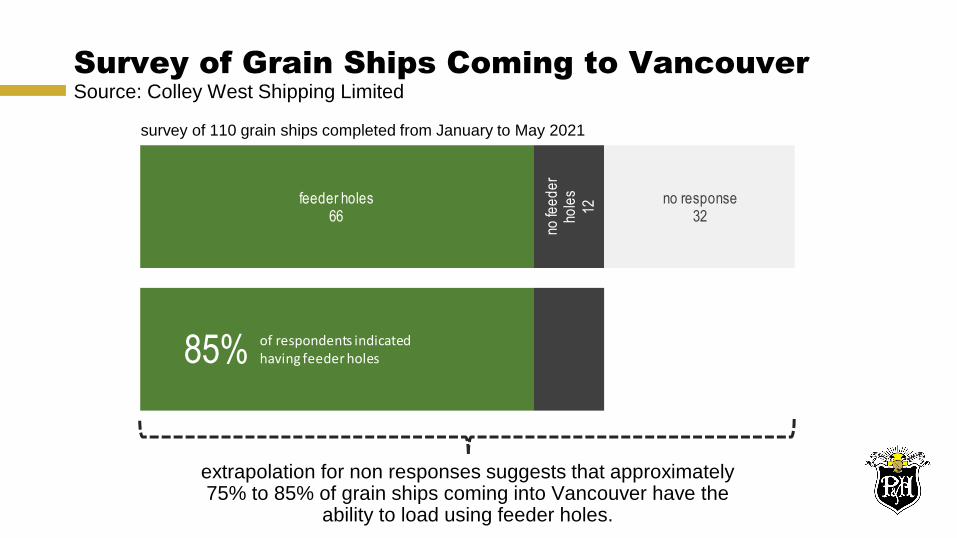
Survey of Grain Ships Coming to Vancouver Source: Colley West Shipping Limited
extrapolation for non responses suggests that approximately 75% to 85% of grain ships coming into Vancouver have the
ability to load using feeder holes.
feeder holes66
no fe
ed
er
hole
s
12
no response32
85% of respondents indicated having feeder holes
survey of 110 grain ships completed from January to May 2021
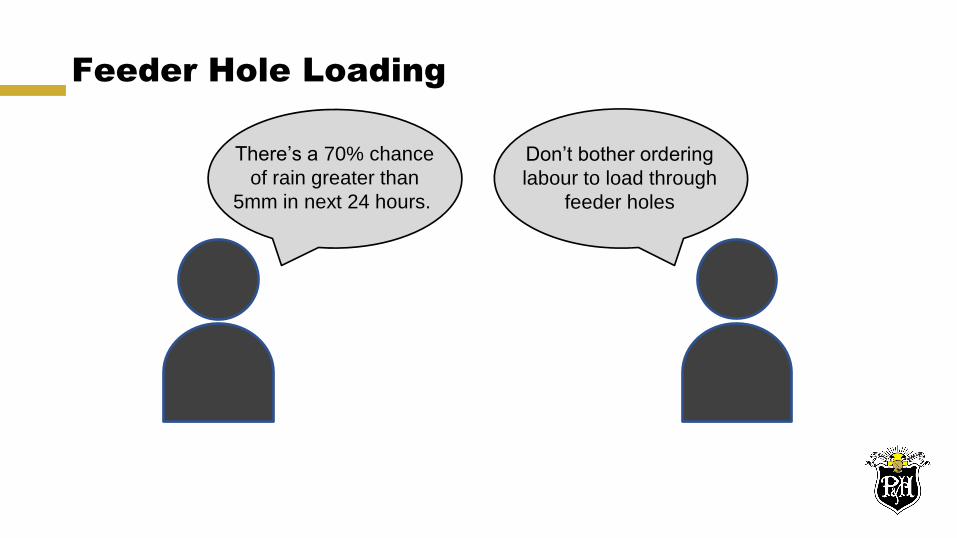
Feeder Hole Loading
There’s a 70% chance
of rain greater than
5mm in next 24 hours.
Don’t bother ordering
labour to load through
feeder holes

CRB Example
• Any delay in loading by vessel shall be subject to a charge of $12,000.00 for each hour or fraction thereof.
• Cement Hole Loading not an ILWU safety or manning issue
• Any vessel equipped with openings in the hatch covers, commonly referred to as cement holes, will be required to make use of them when needed during loading at the berth. Refusal to use these openings will result in delay of berth charges of $12,000 per hour or fraction thereof.
• “Rain Letter” not an LOI
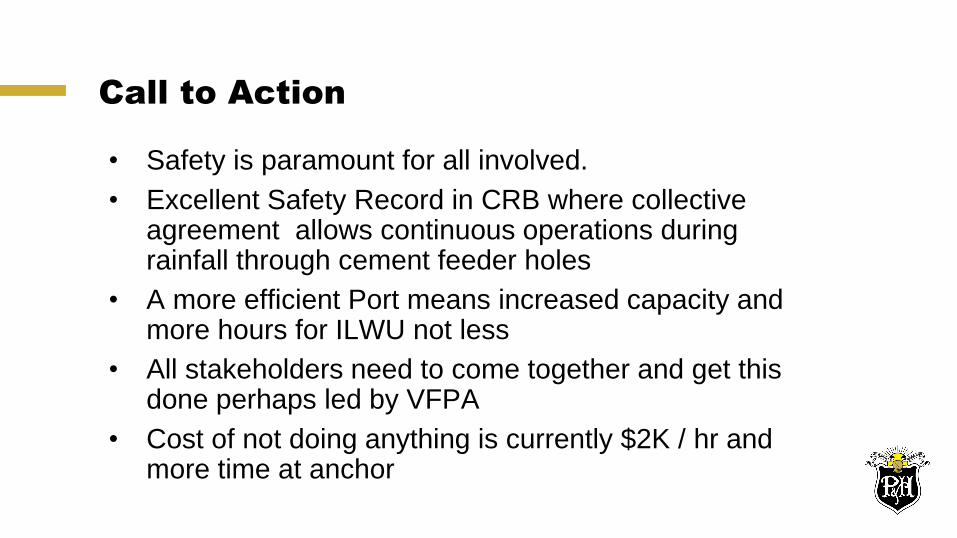
Call to Action
• Safety is paramount for all involved.
• Excellent Safety Record in CRB where collective agreement allows continuous operations during rainfall through cement feeder holes
• A more efficient Port means increased capacity and more hours for ILWU not less
• All stakeholders need to come together and get this done perhaps led by VFPA
• Cost of not doing anything is currently $2K / hr and more time at anchor

Thank you!