Embed Size (px)
Citation preview

Contents lists available at ScienceDirect
NeuroImage
journal homepage: www.elsevier.com/locate/neuroimage
A framework for designing dynamic lp-ntPET studies to maximize thesensitivity to transient neurotransmitter responses to drugs: Application todopamine and smoking
Shuo Wanga,b, Sujin Kima,c, Kelly P. Cosgrovea,c,d, Evan D. Morrisa,b,c,d,⁎
a Yale PET Center, Yale University, New Haven, CT, USAb Department of Biomedical Engineering, Yale University, New Haven, CT, USAc Department of Radiology and Biomedical Imaging, Yale University, New Haven, CT, USAd Department of Psychiatry, Yale University, New Haven, CT, USA
A R T I C L E I N F O
Keywords:PETvoxel analysisneurotransmitterdopaminedrugsmoking
A B S T R A C T
The “linear parametric neurotransmitter PET” (lp-ntPET) model was introduced to capture the time course oftransient endogenous neurotransmitter response to drug stimulus from dynamic PET data. We previously usedthis novel analysis tool to probe the short-lived dopamine (DA) response induced by cigarette smoking in thePET scanner. It allowed us to find a sex difference in the DA signature of cigarette smoking. To make best use ofthis tool to characterize neurotransmitter response to drug stimulus, the sensitivity of lp-ntPET to detect suchresponses must be maximized. We designed a series of simulation studies to examine the impact of the followingfactors on the sensitivity of lp-ntPET using smoking-induced DA release as an example application: tracerdelivery protocol, pre-processing for image denoising, timing of the smoking task, duration of the PET scan, anddose of the radiotracer. Our results suggest that a Bolus paradigm could replace a more difficult B/I paradigmwithout sacrificing the sensitivity of the method. Pre-processing the PET data with the de-noising algorithmHYPR could improve the sensitivity. The optimal timing to start the smoking task is 45min in a 90min scan and35min in a 75min scan. A mild shortening of the scan time from 90mCi to 75min should be acceptable withoutloss of sensitivity. We suggest a lower dose limit of a bolus injection at 16mCi to limit underestimation of DAactivation. This study established the framework to optimize the experimental design for reaching the fullpotential of lp-ntPET to detect neurotransmitter responses to drugs or even behavioral tasks.
1. Introduction
The “linear parametric neurotransmitter PET” (lp-ntPET) methodwas introduced (Normandin et al., 2012; Kim et al., 2014) tocharacterize the temporal patterns of time-varying neurotransmitterrelease induced by drug stimulus from dynamic PET data. We used thisnovel analysis tool previously to estimate DA response to cigarettesmoking in the PET scanner. It allowed us to identify a sex difference inthe brain’s DA signature of cigarette smoking (Cosgrove, Wang et al.,2014). We found that nicotine-dependent men responded rapidly andconsistently to cigarette smoking in the right ventral striatum, the locusof the reinforcement effect of drugs such as nicotine. Women did not. Asecondary finding was that, women responded faster than men in a partof the dorsal putamen, which has been implicated in habit formation(Porrino et al., 2004; Everitt and Robbins, 2013). These findings areconsistent with the established notions that men smoke primarily for
the reinforcing drug effect of nicotine (Perkins et al., 2001), whilewomen tend to smoke cigarettes for other reasons, such as to alleviatestress and negative mood or out of habit.
None of the temporal differences that we observed could have beendiscovered without lp-ntPET. To make best use of this novel analysistool to characterize neurotransmitter response to stimulus, the sensi-tivity of lp-ntPET to detect such responses must be maximized. Weexperienced several challenges that may have weakened the power oflp-ntPET. One obstacle was getting sufficient radioactivity dose. In oursmoking study, our tracer delivery protocol was set to deliver 20mCi of[11C]raclopride in a 90 min bolus plus constant infusion scan with aKbol of 105 min. It is quite a demanding burden on us to producesufficient radioactivity following this protocol. Lower radioactivity dosecould lead to greater noise and lower sensitivity of our method.Another challenge was the high noise level of voxel-by-voxel analysis.We believe lower noise in the voxel-level time activity curves (TACs)
http://dx.doi.org/10.1016/j.neuroimage.2016.10.019Received 18 May 2016; Accepted 12 October 2016
⁎ Correspondence to: Yale PET Center, 801 Howard Avenue, New Haven, CT 06520, USA.E-mail address: [email protected] (E.D. Morris).
NeuroImage 146 (2017) 701–714
Available online 13 October 20161053-8119/ © 2016 Elsevier Inc. All rights reserved.
MARK

from the PET data will lead to more reliable parameter estimation. Inaddition, to better inform the neuroimaging community of the use oflp-ntPET, two remaining design parameters are the timing of the taskand the duration of the scan.
Our goal in this study was to address these challenges by optimizingthe experimental design and image processing procedure to achievemaximum sensitivity of lp-ntPET in detecting transient neurotrans-mitter response induced by stimulus. To this end, we designed a seriesof simulation studies to assess the impact of the following factors onthe sensitivity of lp-ntPET: (1) tracer delivery protocol, (2) pre-processing for image denoising, (3) timing of the challenge/task, (4)duration of the PET scan, and (5) dose of the radiotracer.
Among many possible applications, one application of lp-ntPET isto probe the short-lived DA response to cigarette smoking. Smokingremains the leading preventable cause of death in the US. Quittingsmoking is extremely hard and current therapies to aid in smokingcessation are not effective enough. The primary addictive chemical intobacco is nicotine. Nicotine, along with most drugs of abuse, has beenshown to cause DA release (Di Chiara and Imperato 1988). Dopaminehas been critically implicated in the reinforcing effects of nicotine andtobacco cigarette smoking. A number of PET imaging studies at-tempted to measure smoking-induced striatal DA release (Barrettet al., 2004; Brody et al., 2004, 2006; Scott et al., 2007), but withhighly variable results. We believe these inconsistencies observed weredue to reliance on conventional PET methods that were really onlyappropriate to detect sustained DA release (Sullivan et al., 2013) (e.g.,in response to amphetamine administration). But, the DA response tocigarette smoking is brief (lasting only minutes).
In addition, it has been suggested that a drug’s addictive liabilitymay be dependent on the timing of DA release (Volkow and Swanson,2003), something that cannot be assessed in humans with conventionalPET analysis methods. To probe the short-lived neurotransmitterresponse to drug stimulus in PET data on a voxel-by-voxel basis, wedeveloped lp-ntPET (Morris et al., 2005, 2008, 2013; Normandin andMorris, 2008; Normandin et al., 2012; Kim et al., 2014). This methodallows us to characterize the important temporal patterns of transientDA release with parametric images of DA parameters and “DA movies”(Morris et al., 2013) of the brain from [11C]raclopride PET scans. Thestrength of lp-ntPET over conventional methods has two main parts.One, it is designed to detect short-lived time-varying neurotransmitterresponse, and is thus ideal for imaging the DA response to cigarettesmoking. Two, the resulting parametric images contain timing infor-mation about DA activation that was not previously measurable in vivo.
By optimizing the experimental design and image processingprocedure to maximize the sensitivity of the lp-ntPET method to detectshort-lived neurotransmitter response, we found in our simulationstudies: 1. a tracer delivery protocol that saves radioactivity, 2. a pre-processing algorithm that reduces noise, 3. an optimal timing of thetask that yields maximum sensitivity, 4. a shorter scan duration thatpreserve performance, and 5. a minimum dose of the radiotracer tomaintain a consistently high sensitivity. The application of lp-ntPET isnot limited to imaging DA release or cigarette smoking. This studyestablished the framework to optimize the experimental design for usewith lp-ntPET analysis in a broader field of neuroimaging research todetect neurotransmitter responses to drugs or even behavioral tasks.
2. Materials and methods
2.1. Lp-ntPET model
Eq. (1) shows the operational equation of lp-ntPET (Normandinet al., 2012). The first three terms are the MRTM model (Ichise et al.,2003) that considers endogenous DA to be time-invariant. The addi-tional term (dashed in Eq. (1)) describes the pattern of transient DArelease induced by smoking/drug challenge by extending the LSRRM ofAlpert et al. (2003) using a basis function approach.
∫ ∫ ∫C t R C t k C u du k C u du γ C u h u du( ) = ( ) + ( ) − ( ) − ( ) ( )T R
t
R a
t
T
t
T i1 2
0
2
0 0
(1)
CT and CR are the concentrations in the target and reference region,respectively. R1 is delivery ratio, k2 is a transfer rate constant betweenthe free compartment and the plasma, and k a2 is the apparent transferrate constant between the target tissue (taken as one compartment)and the plasma. h t( )i is one of the possible response functions in apredefined library. The coefficient γ is the magnitude of the timevarying response h t( )i .
The library of possible response functions includes gamma-variatefunctions [Eq. (2a)] and pure exponential functions [Eq. (2b)].
h t t tt t
exp α t tt t
u t t( ) = −−
1− −−
( − )iD
P D
αD
P DD
⎛⎝⎜
⎞⎠⎟
⎛⎝⎜
⎡⎣⎢
⎤⎦⎥⎞⎠⎟ (2a)
h t exp β t t u t t( ) = ( ( − )) ( − )i D D (2b)
The variable tD is a response start time (relative to the start of thetracer), tP is a peak response time (relative to the start of the tracer), αrepresents sharpness of the function, and β is the exponential timeconstant. During the curve fitting process, only one of the responsefunctions from the library is used for a given fit. The response functionwith the best fit is chosen.
The lp-ntPET model is applied voxel-by-voxel to all the PET data.Using an F test, at each voxel the fit with lp-ntPET is compared to thefit with MRTM. This generates an F statistics map as a measure of theimprovement of the fit achieved by lp-ntPET over MRTM, corrected bydegrees of freedom. The F statistics map is first thresholded by an Fstatistics value that translates to a p-value < 0.05 and then thresholdedby a cluster size threshold to correct for multiple comparisons andcontrols the false positive rate < 10%. The remaining voxels after thethresholding processes are identified to contain significant DA release.The details of the theory and implementation of lp-ntPET have beendescribed by Kim et al. (2014).
2.2. Simulations
Noisy and noiseless striatal [11C]raclopride time activity curves(TACs) with DA release at various time points were simulated for scandurations of 90 and 75 min in 3-min frames. To best represent the realdata, our simulated noisy data used a similar noise level as was foundin voxel-level TACs from a real human [11C]raclopride scan. Thenoiseless TACs were simulated using the full ‘ntPET’ model (Morriset al., 2005), which is a nonlinear model of tracer binding to a receptorin the presence of a time-varying endogenous competitor. The simula-tions were implemented in Matlab (R2012b, MathWorks, Inc., Natick,MA) using modeling functions provided by a library of COMKAT(Muzic and Cornelius, 2001).
2.2.1. Input functionDifferent input functions were used for simulating different injec-
tion protocols. (1) Input function for simulating bolus data. Thesimulated Bolus data used an input function (Fig. 1a) taken from[11C]raclopride rest scan following a Bolus injection of 20mCi into amale subject (85.45 kg). The simulation of 90 min and 75 min dataused the first 90 min or 75 min of the input function, as needed. Thesimulation of Bolus data with varied delivered doses used the aboveinput function scaled by dose (scale factor = delivered dose/20mCi). (2)Input function for simulating bolus plus constant infusion data. Theinput function following a bolus plus constant infusion (B/I) protocol(Fig. 1b) with a Kbol=105min, a scan duration T=90min and delivereddose of 20mCi (equivalent to a dose of 29.36 mCi at the beginning ofthe scan) was calculated using the Eq. (3) (Carson et al., 1993),
S. Wang et al. NeuroImage 146 (2017) 701–714
702

∫g t
K f t f τ dτ
K T( ) =
( ) + ( )
+bol
t
bol
0
(3)
where g t( ) is the predicted input function following a B/I protocol, andf t( ) is the input function following a bolus administration of 29.36 mCiof [11C]raclopride. The input function following a B/I protocol withKbol=105 min, T=75 min and delivered dose of 20 mCi (equivalent to adose of 27.29 mCi at the beginning of the scan) was calculated usingthe same equation with f t( ) being the input function following a bolusadministration of 27.29 mCi of [11C]raclopride. Because the totaldelivery is over a shorter period of time, there is less decay duringinfusion and less dose is required at start.
2.2.2. Kinetic parametersKinetic parameters were set for the target region (striatum) and the
reference region (cerebellum) based on typical parameters valuesstated in Pappata et al., 2002. (1) Kinetic parameters for target region.For all simulations, the striatal kinetic parameters were set asK1=0.07344 mL/(min g), k2=0.35872 min-1, kon=0.0173 mL/(pmolmin), koff=0.1363 min-1, Bmax=44 pmol/mL, and Fv= 0.04 mL/mL. (2)Kinetic parameters for reference region. A noiseless cerebellum TACwas also simulated for each study paradigm as the reference regionTAC using the same model by setting K1=0.0918 mL/(min g),k2=0.4484 min-1, and kon
DA=koffDA=0.
2.2.3. DA parametersFree endogenous DA (FDA) was modeled as a gamma-variate
function plus a constant baseline [Eq. (4)], with the start of DA release,tD, the peak time of DA, tP, the sharpness, α, and the peak DA level, γ.The FDA function was applied to the full ntPET model. The DA bindingparameters (association and dissociation rates) were set as kon
DA=0.25mL/(pmol min) and koff
DA=25 min-1 (Morris et al., 1995). (1) DAparameters for null data. To simulate null data, the basal DA level wasset as 100 nM, and the peak DA level = 0 (no DA elevation above thebasal DA level) (Fig. 2a). (2) DA parameters for smoking data. Tosimulate smoking data, the basal DA level was set as 100 nM, and thepeak DA level = 200 nM above basal level (Fig. 2b). A series of timingparameters were applied to the gamma-variate function to simulatevaried start time of cigarette smoking during the scan with takeoff timetD=[25, 35, 45, 55]min, peak time tP= tD+10 min, and sharpness α=1.
F t basalDA γ t tt t
exp α t tt t
u t t( ) = + −−
1− −−
( − )DA D
P D
αD
P DD
⎛⎝⎜
⎞⎠⎟
⎛⎝⎜
⎡⎣⎢
⎤⎦⎥⎞⎠⎟ (4)
2.2.4. NoiseGaussian noise was added to the noiseless target tissue TACs
(Fig. 2c, d, g, h) with zero mean and the following standard deviationcorresponding to the ith time frame [Eq. (5)](Kim et al., 2014).
σ μ C t e t e= × ( ( ( ) × )/Δ ) ×T iλt
iλt− i i (5)
The scale factor μ determines the noise level, C t( )T i is the targettissue tracer concentration of the ith frame in the simulated noiselessTAC, λ is the decay constant for Carbon-11, and tΔ i is the frame lengthof the ith time frame. To reflect the noise level in the real data, the scalefactor μ was set at 0.8 to achieve the same mean coefficient of variationas that in a 90-min B/I [11C]raclopride PET rest scan acquired in theHRRT PET scanner (Siemens/CTI, Knoxville, TN) in a human subjectwith a 20mCi delivered radioactivity. The voxel-level coefficient ofvariation in the real data was determined from the ratio of the standarddeviation to the mean of the last 15 min of [11C]raclopride PETconcentration in each individual voxel within the ventral-striatumregion. Then the mean coefficient of variation was calculated by fittinga Gaussian to the voxel-level coefficient of variation in all voxels. Tovalidate that the noise level in the simulated noisy data (Fig. 2e, f, i, j)was similar to that in the real data, the distributions of F statistics(Fig. 3) after applying lp-ntPET were compared between the twodatasets following procedures described in Kim et al., 2014.
2.3. Creating a 4D phantom
To create a 4D phantom, simulated noisy TACs were placed into a3D striatal template which contains 4 coronal slices and 1004 voxels inthe MNI template space corresponding to the precommissural striatum(ventral striatum, dorsal caudate, and dorsal putamen) (Martinez et al.,2003). (1) Null phantom. To create a single 4D null phantom, 1004noisy TACs of null data were simulated and assigned to each of the1004 voxels in our striatal template (Fig. 4a). For each injectionprotocol, 100 null phantoms were created. (2) Smoking phantom. Tocreate a smoking phantom, 4 clusters (Fig. 4b) of different sizes: [16,32, 64, 128] voxels within the striatal template were filled with noisyTACs of smoking data, while the remaining voxels (Fig. 4c) in thetemplate were filled with noisy TACs of null data. Clusters were 3D.They existed in all 4 slices of the 3D striatal template. Thus wesimulated 4 local volume of activation within the striatal volume ofinterest. For each smoking study paradigm, 100 smoking phantomswere generated.
Fig. 1. a. Plasma input function for a Bolus injection of 20mCi. b. Plasma input function for a Bolus plus infusion (B/I) protocol with a Kbol=105 min, a scan duration T=90 min andtotal delivered dose of 20mCi.
S. Wang et al. NeuroImage 146 (2017) 701–714
703

Fig. 2. a. Simulated DA curve for null data. b. An example of simulated DA curve for smoking data (DA takes off at 35min, peaks at 45min). c. Simulated noiseless striatal null data for aBolus study. d. Simulated noiseless striatal smoking data for a Bolus study. e. Simulated noisy striatal null data for a Bolus study. f. Simulated noisy striatal smoking data for a Bolusstudy. g. Simulated noiseless striatal null data for a B/I study. h. Simulated noiseless striatal smoking data for a B/I study. i. Simulated noisy striatal null data for a B/I study. j. Simulatednoisy striatal smoking data for a B/I study.
S. Wang et al. NeuroImage 146 (2017) 701–714
704

Fig. 3. Comparison of histograms of F statistics between simulated null data and real data from a rest scan. This comparison reflected similar noise level in the simulated data comparedto the real data.
Fig. 4. a. The 4-slice template for precommissural striatum (ventral striatum, dorsal caudate, and dorsal putamen). b. The 4 clusters of different sizes where simulated TACs containingDA activation were placed. Number with arrow indicates the number of voxels contained in each cluster. Voxel size is 2 x 2 x 2 mm3. c. Background voxels in the remaining area of the 4-slice striatum template where simulated TACs of the null data were placed.
S. Wang et al. NeuroImage 146 (2017) 701–714
705

2.4. HYPR De-noising
The simulated 4D phantoms were first processed by “HighlYconstrained backPRojection” (HYPR) (Christian et al., 2010). TheHYPR processing is an image de-noising algorithm that reduces noisein the PET TACs while preserving critical temporal patterns in the data.The algorithm was implemented in this study using a 3 x 3 x 3 voxels3D boxcar smoothing filter, and the entire time series of data as thecomposite image.
2.5. Modeling
The lp-ntPET model was applied to fit the PET data voxel-by-voxelin all phantoms we created (pre and post HYPR de-noising). TheMRTM model was also applied to fit the same data. The weightedresidual sum of squares (WRSS) of both fits in all voxels were recorded.For lp-ntPET fits, we used the following discrete set of parametervalues for the gamma-variate response function for characterizingpatterns of DA response induced by smoking a cigarette. The sharpnessparameter α were set to include 3 possible values: 0.25, 1, and 4.Response start times (tD) were set between (smoking time - 5 min) to(smoking time + 15 min) in increments of 1.5 min. Peak responsetimes (tP) were set between (tD + 1.5 min) and (total scan time - 5 min)in increments of 1.5 min. (Kim et al., 2014).
2.6. F-test thresholding
An F statistics map (Figs. 5a, 6a) was generated with the F statisticscalculated [Eq. (6)] (Kim et al., 2014) for each voxel in the phantom,
where WRSSi and pi are the WRSS and number of parameters,respectively, for model i, and n is the number of data points in a PETTAC. The F statistics, in this case, is a measure of the improvement ofthe fit achieved by lp-ntPET over MRTM, corrected by degrees offreedom. The F statistics map was thresholded by the F statistics valuethat translates to a p-value < 0.05. This step generated the PreliminarySignificance Mask (Figs. 5b, 6b) which was a binarized mask in which 1represents presence of significant DA release in a given voxel.
F =
WRSS WRSSp p
WRSSn p
−−
−
MRTM lp ntPET
lp ntPET MRTM
lp ntPET
lp ntPET
−
−
−
−
⎛⎝⎜
⎞⎠⎟
⎛⎝⎜
⎞⎠⎟ (6)
2.7. Cluster-size thresholding
To correct for multiple comparisons, a cluster-size threshold wasapplied to the Preliminary Significance Mask to generate the FinalSignificance Mask (Figs. 5c, 6c). The cluster-size threshold wasdetermined for each study protocol from simulated null data (Kimet al., 2014). For each protocol, the 100 simulated noisy null phantomswere processed, yielding 100 Preliminary Significance Masks contain-ing clusters of various sizes that were identified as containing sig-nificant DA release in the null data, and were therefore false positiveclusters. A first-pass cluster size threshold was determined so that 99%(Fig. 5d) of the total false positive clusters in the 100 significance mapswere eliminated. The cluster size threshold was further adjusted toensure that 90 out of 100 null phantoms were completely free of false
Fig. 5. Processing steps to determine cluster size threshold that corrects for multiple comparisons and controls the false positive rate to be less than 10%. a. The F statistics mapgenerated from a null phantom. b. The Preliminary Significance Mask thresholded by the F statistics value that translates to a p-value < 0.05. c. The Final Significance Mask thresholdedby the cluster size threshold that corrects for multiple comparisons and controls the false positive rate to be less than 10%. d. The histogram of all false positive clusters in the 100Preliminary Significance Masks generated from 100 simulated null phantoms. A first-pass cluster size threshold was determined so that 99% of the false positive clusters in the 100Preliminary Significance Masks were eliminated. e. The cluster size threshold was further adjusted to ensure that 90 out of 100 Final Significance Masks from simulated null phantomswere completely free of false positive clusters.
S. Wang et al. NeuroImage 146 (2017) 701–714
706

positive clusters (Fig. 5e).
2.8. Metrics for comparing detection sensitivities
For each protocol, the 100 simulated noisy smoking phantoms wereprocessed, with corresponding cluster size threshold applied, yielding100 Final Significance Masks (Fig. 6d) containing clusters that wereidentified to contain significant DA release in the smoking data. Wehave defined sensitivity in two ways to fully characterize the perfor-mance of our method.
2.8.1. Mean voxel-by-voxel sensitivityThe 100 binary final significance masks (Fig. 6d) were summed
(Fig. 6e) and filtered by the binary template of true clusters ofactivation (Fig. 6f) to generate a sensitivity map (Fig. 6g). Each voxelin the sensitivity map contains a sensitivity value ranging from 0 to 100representing the number of smoking phantoms out of 100 phantoms inwhich DA activation was detected at a given voxel. The Mean Voxel-by-Voxel (MV) Sensitivity was calculated as the mean of the voxel-by-voxelsensitivity values across all voxels containing a true cluster of activation[Eq. (7)] (Fig. 7). By rearrangement, the MV Sensitivity can beinterpreted as the Mean Percent of Spatial Extent in the regioncontaining true DA activation that is detected, averaged over 100
Fig. 6. Processing steps to create a voxel-by-voxel sensitivity map. a. The F statistics map generated from a smoking phantom. b. The Preliminary Significance Mask thresholded by theF statistics value that translates to a p-value < 0.05. c. The Final Significance Mask thresholded by the cluster size threshold that corrects for multiple comparisons and controls the falsepositive rate to be less than 10%. d. 100 Final Significance Masks generated from 100 simulated smoking phantoms corresponding to the same study paradigm. e. Sum of the 100 FinalSignificance Masks. f. The template of true clusters of activation. g. The voxel-by-voxel sensitivity map.
Fig. 7. Calculation of Mean Voxel-by-Voxel (MV) Sensitivity. The MV Sensitivity for a true cluster of activation was calculated as the mean of the voxel-by-voxel sensitivity values acrossall voxels in that cluster.
S. Wang et al. NeuroImage 146 (2017) 701–714
707

simulations [Eq. (8)].
Mean SensitivitySensitivity
N
I
N
=∑
=∑ ∑
iN
Voxel i
Voxels
iN
j Voxel i Phantom j
Voxels
=11
100
=11
100 =1100
,
Voxels
Voxels⎛⎝⎜
⎞⎠⎟
(7)
∑
∑
Mean SensitivityI
N
IN
Percent of Spatial Extent
Mean Percent of Spatial Extent
=∑ (∑ )
= 1100
∑
= 1100
=
j iN
Voxel i Phantom j
Voxels
jiN
Voxel i Phantom j
Voxels
j Phantom j
1100 =1
100=1 ,
=1
100 =1 ,
=1
100
Voxels
Voxels
(8)
NVoxels is the number of voxels in a true cluster of activation,SensitivityVoxel i represents the number of smoking phantoms out of100 phantoms in which DA activation was detected at the ith voxel, andIVoxel i Phantom j, is the binary value with 1 representing ‘activation’detected and 0 representing ‘no activation’ detected at the ith voxel inthe jth simulated smoking phantom.
2.8.2. Binary Cluster Detection SensitivityThe Binary Cluster Detection (BC) Sensitivity was calculated as the
number of simulated phantoms with final significance masks thatpartially overlapped with the mask of clusters in the true phantom(Fig. 8). This definition asked the “yes” or “no” question: was a givencluster of activation detected in a simulated phantom. The answer was“yes” when as long as part of the cluster in the true phantom wasidentified to contain DA release in the simulated phantom. The BCSensitivity counted the number of simulated phantoms that werepositively detected out of 100 simulated phantoms and thus representsthe percent chance of a true DA activation being detected withoutregard to a perfect recovery of all voxels in the cluster.
2.9. Study design
We designed 5 different simulation studies to address 5 impactingfactors on the sensitivity of lp-ntPET. Study 1. Tracer Delivery. A Bolusand a B/I dataset were simulated and analyzed to compare thesensitivity of lp-ntPET in detecting transient DA release between thesetwo practices of tracer delivery. The Bolus paradigm was simulated as aBolus injection of 20mCi of [11C]raclopride with a 90min scanduration. The B/I paradigm was simulated with a 90min scan duration,a Kbol of 105min and total delivered dose of 20mCi. In both studies, thesmoking-induced DA release was simulated to take off at 35min afterthe beginning of the injection. Study 2. Pre-processing. The Bolus andB/I datasets in Study 1 were each processed twice following twodifferent procedures to assess the impact of HYPR de-noising on thesensitivity of lp-ntPET in detecting transient DA release. In one case,there was no pre-processing before fitting data with the lp-ntPETmodel. In the second case, phantom data were pre-processed with theHYPR de-noising algorithm prior to data fitting. In our implementationof HYPR, we used a (3 x 3 x 3 voxels) 3D boxcar smoothing filter, and atime-averaged composite image generated from the entire time seriesof data. Study 3. Optimal Timing of Task. A series of Bolus (Fig. 9b)and B/I (Fig. 9c) datasets were simulated to include DA activationstarting at one of four different time points during the scan todetermine the optimal timing to start the smoking task. The DAactivations were simulated as gamma variate functions with take offtime tD=[25, 35, 45, 55]min. Peak time was determined, accordingly, astP=tD+10min (Fig. 9a). Study 4. Scan Duration. Another series ofdatasets were simulated to include DA activation with all the same DAparameters as in Study 3, but with only a 75min scan duration. Study 5.Minimum Radioactivity Dose. A series of Bolus studies were simulatedto represent Bolus injections of 10mCi, 12mCi, 14mCi, 16mCi, 18mCiand 20mCi of [11C]raclopride with a 75min scan duration (Fig. 9d) todetermine the minimum Bolus dose that would provide acceptablesensitivity.
Fig. 8. Calculation of Binary Cluster Detection (BC) Sensitivity. The BC Sensitivity asked the “yes” or “no” question: was a given cluster of activation detected in a simulated phantom.The answer was “yes” (label as “1”) when as long as part of the cluster in the true phantom was identified to contain DA release in the simulated phantom. The BC Sensitivity counted thenumber of simulated phantoms that were positively detected (the number of “1”s) out of 100 simulated phantoms.
S. Wang et al. NeuroImage 146 (2017) 701–714
708

3. Results
3.1. Tracer delivery
The sensitivities of lp-ntPET in detecting the simulated DA releasein the Bolus vs. B/I study without HYPR processing are shown inFig. 10 (green lines). With the same delivered radioactivity dose, theBolus paradigm yielded lower MV Sensitivity vs. the B/I paradigm in all4 simulated clusters containing DA release (green lines in Fig. 10 a vs.b). The BC Sensitivity (green lines in Fig. 10 c vs. d, SupplementaryTable S1) were the same in the 3 largest clusters for Bolus and B/I:100% for the 64-voxel and 128-voxel clusters, and 99% for the 32-voxelcluster. In the smallest cluster (16 voxels), the BC Sensitivity for aBolus study was lower than a B/I study (53% vs. 71%).
3.2. Pre-processing
The sensitivities in both Bolus and B/I studies when the data arepre-processed by the HYPR de-noising algorithm are shown by theorange lines in Fig. 10. HYPR processing dramatically improved theMV Sensitivity in both paradigms (Fig. 10 orange lines vs. green lines,Fig. 11 bottom row vs. top row). In the Bolus paradigm, HYPRincreased the MV Sensitivity from 32.2% to 60.0% (Fig. 10a) in thesmallest cluster containing 16 voxels with true DA activation, and from62.2% to 98.8% in the biggest cluster (128 voxels). In the B/Iparadigm, HYPR improved the MV Sensitivity from 49.5% to 62.9%(Fig. 10b) in the smallest cluster (16 voxels), and from 71.6% to 99.2%in the biggest cluster (128 voxels). When the data in both paradigmswere pre-processed by HYPR, the Bolus paradigm yielded similar MVSensitivity as the B/I (orange lines in Fig. 10 a vs. b), and almostidentical BC Sensitivity as the B/I (orange lines in Fig. 10 c vs. d,Supplementary Table S2).
3.3. Optimal timing of task
Tables 1–4 presents the influence of different takeoff times ofsimulated DA activation (as a representation of the start time of asmoking task) on the sensitivity in 90min Bolus and B/I studies. In the90min Bolus paradigm, the MV Sensitivity was highest when DAstarted to rise from baseline at 35 or 45min following tracer injection(Fig. 12a and Table 1). The highest BC Sensitivity for the 16-voxelcluster was 77% for a DA curve that took off at 45min, 100% for the 32-voxel cluster when DA took off at 35, 45 or 55min, and 100% forclusters of 64 and 128 voxels regardless of DA takeoff times (Table 2).In the 90min B/I paradigm, the maximum MV Sensitivity was achievedwhen DA took off at 45min (Fig. 12b and Table 3). The highest BCSensitivity for the 16-voxel cluster was 84% when DA took off at 55min,100% for the 32-voxel cluster when DA took off at 35, 45 or 55min, and100% for the other 2 clusters regardless of DA takeoff times (Table 4).
3.4. Scan duration
The sensitivity in 75min Bolus and B/I studies with different takeofftimes for DA is shown in Tables 5–8. In the 75min Bolus paradigm, themaximum MV Sensitivity was achieved when DA took off at 35min(Fig. 12c and Table 5). The highest BC Sensitivity for the 16-voxelcluster was 81% for a DA curve that took off at 35min, 100% for the 32-voxel cluster when DA took off at 35min or 45min, and 100% for the64-voxel and 128-voxel clusters regardless of DA takeoff times(Table 6). In the 75min B/I paradigm, the maximum MV Sensitivityoccurred when DA took off at 35min (Fig. 12d and Table 7). Thehighest BC Sensitivity for the 16-voxel cluster was 86% when DA tookoff at 35min, 100% for the 32-voxel cluster when DA took off at 25, 35or 45min, and 100% for the 64-voxel and 128-voxel clusters regardlessof DA takeoff times (Table 8).
The comparison of 75min to 90min scan duration revealed that the
Fig. 9. a. Simulated DA curves with 4 different takeoff times (tD=[25, 35, 45, 55]min,tP=tD+10min) b. Simulated noiseless striatal data containing DA activation for 20mCiBolus studies with a 90min scan duration c. Simulated noiseless striatal data containingDA activation for 20mCi B/I studies with a 90min scan duration d. Simulated noiselessstriatal data containing DA activation that takes off at 35min in 75min Bolus studies withdifferent radioactivity doses.
S. Wang et al. NeuroImage 146 (2017) 701–714
709

Fig. 10. Metrics of sensitivities for Bolus (a, c: dotted lines) and Bolus plus constant infusion (B/I) (b, d: solid lines) without (green lines) and with HYPR processing (orange lines).
Fig. 11. The voxel-by-voxel sensitivity maps in Bolus and B/I studies without and with HYPR processing. Value in each voxel represents the number of phantoms out of 100 noisysimulated phantoms the same voxel was detected to contain significant DA release.
Table 1Mean voxel-by-voxel sensitivity in 90 min bolus studies with different takeoff times ofDA.
Cluster size in phantom (voxels)
Study Paradigm 16 32 64 128
Bolus HYPR tD=25 56.6% 85.9% 95.7% 97.8%Bolus HYPR tD=35 60.0% 92.4% 97.4% 98.8%Bolus HYPR tD=45 64.6% 90.7% 97.2% 98.8%Bolus HYPR tD=55 51.7% 82.7% 93.5% 97.2%
Table 2Binary Cluster Detection Sensitivity in 90min Bolus Studies with Different Takeoff Timesof DA.
Cluster size in phantom (voxels)
Study Paradigm 16 32 64 128
Bolus HYPR tD=25 68% 99% 100% 100%Bolus HYPR tD=35 71% 100% 100% 100%Bolus HYPR tD=45 77% 100% 100% 100%Bolus HYPR tD=55 76% 100% 100% 100%
Table 3Mean Voxel-by-Voxel Sensitivity in 90min B/I Studies with Different Takeoff Times ofDA.
Cluster size in phantom (voxels)
Study Paradigm 16 32 64 128
B/I HYPR tD=25 35.8% 89.6% 95.8% 98.4%B/I HYPR tD=35 62.9% 95.3% 98.6% 99.2%B/I HYPR tD=45 72.8% 95.6% 98.9% 99.4%B/I HYPR tD=55 68.6% 92.3% 97.8% 98.9%
Table 4Binary Cluster Detection Sensitivity in 90min B/I Studies with Different Takeoff Times ofDA.
Cluster size in phantom (voxels)
Study Paradigm 16 32 64 128
B/I HYPR tD=25 43% 99% 100% 100%B/I HYPR tD=35 70% 100% 100% 100%B/I HYPR tD=45 81% 100% 100% 100%B/I HYPR tD=55 84% 100% 100% 100%
S. Wang et al. NeuroImage 146 (2017) 701–714
710
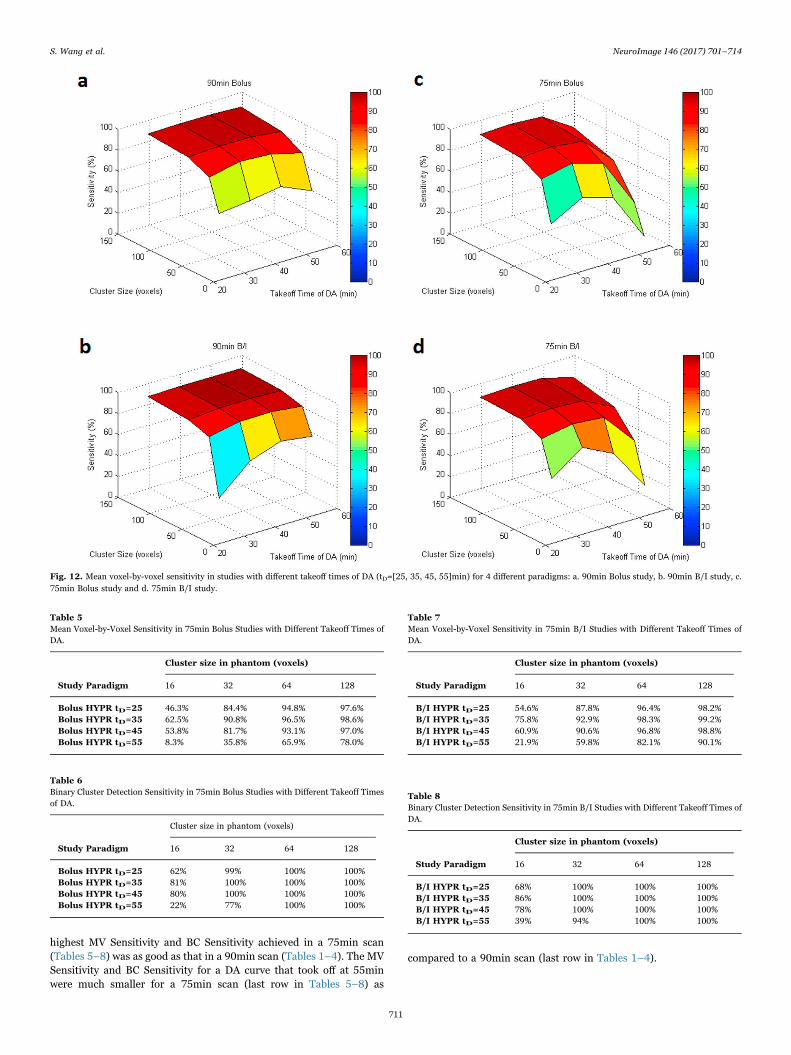
highest MV Sensitivity and BC Sensitivity achieved in a 75min scan(Tables 5–8) was as good as that in a 90min scan (Tables 1–4). The MVSensitivity and BC Sensitivity for a DA curve that took off at 55minwere much smaller for a 75min scan (last row in Tables 5–8) as
compared to a 90min scan (last row in Tables 1–4).
Fig. 12. Mean voxel-by-voxel sensitivity in studies with different takeoff times of DA (tD=[25, 35, 45, 55]min) for 4 different paradigms: a. 90min Bolus study, b. 90min B/I study, c.75min Bolus study and d. 75min B/I study.
Table 5Mean Voxel-by-Voxel Sensitivity in 75min Bolus Studies with Different Takeoff Times ofDA.
Cluster size in phantom (voxels)
Study Paradigm 16 32 64 128
Bolus HYPR tD=25 46.3% 84.4% 94.8% 97.6%Bolus HYPR tD=35 62.5% 90.8% 96.5% 98.6%Bolus HYPR tD=45 53.8% 81.7% 93.1% 97.0%Bolus HYPR tD=55 8.3% 35.8% 65.9% 78.0%
Table 6Binary Cluster Detection Sensitivity in 75min Bolus Studies with Different Takeoff Timesof DA.
Cluster size in phantom (voxels)
Study Paradigm 16 32 64 128
Bolus HYPR tD=25 62% 99% 100% 100%Bolus HYPR tD=35 81% 100% 100% 100%Bolus HYPR tD=45 80% 100% 100% 100%Bolus HYPR tD=55 22% 77% 100% 100%
Table 7Mean Voxel-by-Voxel Sensitivity in 75min B/I Studies with Different Takeoff Times ofDA.
Cluster size in phantom (voxels)
Study Paradigm 16 32 64 128
B/I HYPR tD=25 54.6% 87.8% 96.4% 98.2%B/I HYPR tD=35 75.8% 92.9% 98.3% 99.2%B/I HYPR tD=45 60.9% 90.6% 96.8% 98.8%B/I HYPR tD=55 21.9% 59.8% 82.1% 90.1%
Table 8Binary Cluster Detection Sensitivity in 75min B/I Studies with Different Takeoff Times ofDA.
Cluster size in phantom (voxels)
Study Paradigm 16 32 64 128
B/I HYPR tD=25 68% 100% 100% 100%B/I HYPR tD=35 86% 100% 100% 100%B/I HYPR tD=45 78% 100% 100% 100%B/I HYPR tD=55 39% 94% 100% 100%
S. Wang et al. NeuroImage 146 (2017) 701–714
711

3.5. Minimum radioactivity dose
In 75min Bolus studies with different delivered radioactivity doses,the MV Sensitivity for activated clusters of all sizes gradually decreasedas lower and lower delivered doses were simulated (SupplementaryTable S3 and Fig. S1a). The BC Sensitivity for the 16-voxel cluster wasalmost unchanged when the dose decreased from 20mCi to 16mCi(from 81% to 80%), but started to drop as the dose was lowered to14mCi (76%), and was very low at 10mCi (55%) (Supplementary TableS4 and Fig. S1b). For the 3 largest clusters, the BC Sensitivity wasconstantly 100% when the dose dropped from 20mCi to 10mCi.
3.6. Cluster size threshold
In order to maintain all the same false positive rate to be less than10% in the overall method, the cluster size threshold was varied acrossdifferent study paradigms. The cluster size threshold was similar forBolus and B/I without HYPR pre-processing. HYPR increased thecluster size threshold for Bolus from 11 to 28 voxels, and for B/I from12 to 36 voxels in smoking studies containing DA activation that tookoff at 35min with a 90min scan duration and 20mCi of deliveredradioactivity. As an example to illustrate the number of clustersthresholded out after first- and second-pass, for the 90min B/I studieswith HYPR applied in the 100 simulated null phantoms, the totalnumber of false positive clusters was 2693, the first-pass threshold wasset at 29 voxels so that only 26 ( < 1% of 2693) false positive clusterswere retained, i.e. 99% of false positive clusters were eliminated. Thesurviving 26 false positive clusters were distributed among 22 of the100 null phantoms. The second-pass threshold was increased to 36voxels, so that only 9 out of the 100 phantoms contained 1 falsepositive cluster, thus satisfying our goal that < 10% phantoms have anyfalse positive cluster. As the start time of task went later into the scan,the cluster size threshold became smaller. For example, the cluster sizethresholds for Bolus studies containing DA activation that took off at[25, 35, 45, 55]min were [31, 28, 23, 15]voxels. The 75min scanrequired a smaller cluster size threshold than a 90min scan (e.g., for aBolus study containing DA activation that took off at 35min, the clustersize threshold was 17 voxels for a 75min scan duration as compared to28 voxels for a 90min scan duration). As the Bolus tracer dose waslowered from 20mCi to 10mCi, the cluster size threshold was generallyunchanged until the dose reached 10mCi (17 voxels for [20, 18, 16, 14,12]mCi Bolus doses, and 18 voxels for 10mCi).
4. Discussion
4.1. Bolus as an alternative to B/I
Our main finding was that a Bolus yielded equivalent sensitivity as aB/I paradigm with the same delivered radioactivity dose provided thatHYPR was applied. This finding from simulations provides importantguidance for experimental design of future lp-ntPET experiments onsmoking or similar behavioral tasks, especially when radioactivity dosemay be limited. For a B/I injection of [11C]raclopride with a delivereddose=20mCi, a Kbol=105min and a scan duration of 90min, therequired pre-scan dose must be at least 29.4mCi. When the radio-activity produced by the radiochemistry lab falls below 29.4mCi pre-scan, an alternative paradigm, a Bolus of 20mCi of [11C]raclopridecould be administered without sacrificing the sensitivity of the lp-ntPET method. This finding suggests that when a high enough pre-scandose for the B/I paradigm can not be consistently produced, the Bolusparadigm should be considered as an acceptable alternate design.
4.2. Contribution of HYPR De-noising
We found that HYPR dramatically improved the MV Sensitivity forboth paradigms and the BC Sensitivity in the Bolus paradigm. We
attribute improved sensitivity with HYPR to the effect of noisereduction in the TACs. In fact, we have previously shown the powerof HYPR in reducing noise in the TACs of [11C]raclopride PET data onthe voxel level (Wang et al., 2012). In addition to HYPR, we alsoevaluated the impact of simple spatial smoothing on detection sensi-tivity and temporal precision of the recovered response profile. Theresults (see Supplementary text, Figs. S2-S4 and Table S5) support theselection of HYPR over simple spatial smoothing.
4.3. Optimal timing of the smoking task
Our results comparing smoking challenges starting at different timepoints during the scan favor a 45 min start in a 90 min scan and 35 minstart in a 75 min scan as the optimal timing. The lp-ntPET analysisachieved its maximum sensitivity at these time points especially forsmall areas of activation (e.g., the cluster of 16 voxels in the truephantom). In much bigger areas of activation, the success rate of lp-ntPET in detecting transient DA release was consistently high (99%-100% BC Sensitivity) and insensitive to start time of smoking.
4.4. Scan duration
We found that the maximum sensitivity in a 75min scan was asgood as that in a 90min scan. This suggests that the duration of asmoking PET scan can be shortened from 90min to 75min. Theadvantage of shortening the scan duration is probably based on thefact that TACs in a 75min scan are less noisy than those in a 90minscan with the same delivered radioactivity dose and can thus reducefalse positive findings. It should be noted that the 75min scan showedlower sensitivity compared to a 90min scan if DA takeoff was late (e.g.,55min). This was probably because as DA took off later, less perturba-tion to the shape of TACs introduced by the DA release was captured inthe scan data. The difference between fits with MRTM and lp-ntPETbecame less pronounced. This suggests that late start time of tasksshould be avoided when using a shorter scan.
4.5. The minimum radioactivity dose
Our results comparing different doses of the radiotracer suggest apractical minimum dose of 16mCi in the bolus paradigm. Although themean percent of detected spatial extent (reflected by the MVSensitivity) gradually decreased as the delivered dose was lowered,the overall chance of detecting an activated region (the BC Sensitivity)was unchanged when the dose decreased from 20mCi to 16mCi, butstarted to drop as the dose was lowered to 14mCi. Doses lower than16mCi of bolus injection could lead to underestimation of DA activa-tion. That is, actual DA release in subjects who received lower than16mCi of [11C]raclopride would be detected less frequently due tolower sensitivity of the method.
4.6. Cluster size threshold
The cluster size threshold was intentionally varied across differentstudy paradigms. With these cluster size thresholds applied to theircorresponding study paradigms, the false positive rate was maintainedto be constant ( < 10%) in the overall method. Although the cluster sizethreshold was increased by HYPR for Bolus from 11 to 28 voxels, andfor B/I from 12 to 36 voxels (in smoking studies containing DAactivation that took off at 35min with a 90min scan duration and20mCi of delivered radioactivity), the sensitivity was still higher whenHYPR was applied. That is, even with a larger cluster size threshold,HYPR allowed us to achieve higher sensitivity. This was because HYPRadded spatial correlation to the neighboring voxels of true clusterscontaining DA activation, which effectively enlarged the areas ofactivation.
S. Wang et al. NeuroImage 146 (2017) 701–714
712

4.7. Limitations and possible uses
Only one shape of the DA response function was used in oursimulation study. The peak height of DA activation was simulated to be200% above the basal level. This peak height was picked based onresults from previous microdialysis studies, which showed that admin-istration of nicotine in doses equivalent to smoking produced 200%(Pontieri et al., 1996) and 250% (Domino and Tsukada, 2009)increases in extracellular DA above basal level in the striatum of ratsand monkeys, respectively. In studies of cocaine and amphetamine,which were shown to be able to increase DA anywhere from 250 to1,000% in the rat striatum (Carboni et al., 2001), the sensitivity of lp-ntPET to detect such DA activation with a lot greater magnitude wouldbe much higher (Kim et al., 2014).
The timing of DA response in our simulations was assumed to takeoff as soon as the cigarette smoking started, and to rise to its peakheight 10min after takeoff. This was typical of smoking one or twocigarettes based on estimated DA curves observed in our smoking study(Cosgrove, Wang et al., 2014). In our curve fitting process, the searchspace for the response start times (tD) was bounded between (smokingtime - 5 min) to (smoking time + 15 min). For PET experiments thatinvolve drug challenges or behavioral tasks with different durations,the search space for response start times should be adjusted for thespecific study. If the shape of the DA response induced by the drug/taskis known to be different from the one we used, a tailored library ofpossible response functions specific to the drug/task should beconstructed when implementing lp-ntPET.
The phantoms in this study were created by placing the simulatedTACs into a 3D striatal template which contains 4 coronal slices and1004 voxels in the MNI template space with a voxel size of 2 x 2 x 2mm3. Since the phantoms were created and analyzed in the templatespace, the general conclusions in this study are not specific to ourHRRT scanner. The absolute sensitivity values, though, are related tothe noise level of the PET TACs which, in turn, depend on thecharacteristics of the PET scanner. For use with the HR+ scanner,which has lower spatial resolution (i.e., bigger voxel size) than theHRRT, the noise level of the TACs in individual voxels could be lowerthan our simulated noise level. The sensitivity of lp-ntPET to detect DAactivation on the voxel level in less noisy PET data acquired by the HR+scanner could be higher, but the chance of detecting small activatedclusters could be lower due to the lower spatial resolution, i.e., if theactivation locus is smaller than an HR+ voxel, then we’ll miss the evententirely.
5. Conclusion
In this study, we optimized the design and pre-processing of PETstudies using lp-ntPET analysis to detect short-lived DA release (suchas we would expect from cigarette smoking) during a PET scan. Oursimulations suggest that a Bolus paradigm could replace a moredifficult B/I design and would not sacrifice the sensitivity of themethod. The de-noising algorithm HYPR, in all circumstances, couldimprove the sensitivity of lp-ntPET. The optimal timing to start thesmoking task is 45min in a 90min scan and 35min in a 75min scan. Amild shortening of the scan time from 90mCi to 75min should beacceptable without loss of sensitivity. We suggest setting the lower doselimit of a Bolus injection at 16mCi to limit possible underestimation ofDA activation. Since the cluster size threshold to control the same falsepositive rate across different study paradigms must be varied, whendesigning a new lp-ntPET study, the cluster size threshold needs to betailored for that specific study. We optimized the PET study designbased on the shape of DA response that we believe applies to oursmoking study. The general findings should apply to other studies thatinduce a similar DA response. If the shape of DA response induced byanother challenge differs substantially from the one we used, additionalsimulations following the framework presented may be necessary.
Acknowledgements
The authors acknowledge the support of National Institute on DrugAbuse [R21DA032791, K02DA031750, and R01DA03870] and theOffice of Research on Women's Health [P50DA033945].
Appendix A. Supplementary material
Supplementary data associated with this article can be found in theonline version at http://dx.doi.org/10.1016/j.neuroimage.2016.10.019.
References
Alpert, N.M., Badgaiyan, R.D., Livni, E., Fischman, A.J., 2003. A novel method fornoninvasive detection of neuromodulatory changes in specific neurotransmittersystems. Neuroimage 19, 1049–1060.
Barrett, S.P., Boileau, I., Okker, J., Pihl, R.O., Dagher, A., 2004. The hedonic response tocigarette smoking is proportional to dopamine release in the human striatum asmeasured by positron emission tomography and [11C]raclopride. Synapse 54, 65–71.
Brody, A.L., Olmstead, R.E., London, E.D., Farahi, J., Meyer, J.H., Grossman, P., Lee,G.S., Huang, J., Hahn, E.L., Mandelkern, M.A., 2004. Smoking-induced ventralstriatum dopamine release. Am. J Psychiatry 161, 1211–1218.
Brody, A.L., Mandelkern, M.A., Olmstead, R.E., Scheibal, D., Hahn, E., Shiraga, S.,Zamora-Paja, E., Farahi, J., Saxena, S., London, E.D., McCracken, J.T., 2006. Genevariants of brain dopamine pathways and smoking-induced dopamine release in theventral caudate/nucleus accumbens. Arch. Gen. Psychiatry 63, 808–816.
Carboni, E., Spielewoy, C., Vacca, C., Nosten-Bertrand, M., Giros, B., Di Chiara, G., 2001.Cocaine and amphetamine increase extracellular dopamine in the nucleusaccumbens of mice lacking the dopamine transporter gene. J. Neurosci. 21 (RC141),1–4.
Carson, R.E., Channing, M.A., Blasberg, R.G., Dunn, B.B., Cohen, R.M., Rice, K.C.,Herscovitch, P., 1993. Comparison of bolus and infusion methods for receptorquantitation: application to [18F]Cyclofoxy and Positron Emission Tomography. J.Cereb. Blood Flow. Metab. 13, 24–42.
Christian, B.T., Vandehey, N.T., Floberg, J.M., Mistretta, C.A., 2010. Dynamic PETdenoising with HYPR processing. J. Nucl. Med 51, 1147–1154.
Cosgrove, K.P., Wang, S., Kim, S.J., McGovern, E., Nabulsi, N., Gao, H., Labaree, D.,Tagare, H.D., Sullivan, J.M., Morris, E.D., 2014. Sex differences in the brain’sdopamine signature of cigarette smoking. J. Neurosci. 34, 16851–16855.
Di Chiara, G., Imperato, A., 1988. Drugs abused by humans preferentially increasesynaptic dopamine concentrations in the mesolimbic system of freely moving rats.Proc. Natl. Acad. Sci. USA 85, 5274–5278.
Domino, E.F., Tsukada, H., 2009. Nicotine sensitization of monkey striatal dopaminerelease. Eur. J. Pharmacol. 607, 91–95.
Everitt, B.J., Robbins, T.W., 2013. From the ventral to the dorsal striatum: devolvingviews of their roles in drug addiction. Neurosci. Biobehav Rev. 37, 1946–1954.
Ichise, M., Liow, J.S., Lu, J.Q., Takano, A., Model, K., Toyama, H., Suhara, T., Suzuki, K.,Innis, R.B., Carson, R.E., 2003. Linearized reference tissue parametric imagingmethods: application to [11C]DASB positron emission tomography studies of theserotonin transporter in human brain. J. Cereb. Blood Flow. Metab. 23, 1096–1112.
Kim, S.J., Sullivan, J.M., Wang, S., Cosgrove, K.P., Morris, E.D., 2014. Voxelwise lp-ntPET for detecting localized, transient dopamine release of unknown timing:sensitivity analysis and application to cigarette smoking in the PET scanner. Hum.Brain Mapp. 35, 4876–4891.
Martinez, D., Slifstein, M., Broft, A., Mawlawi, O., Hwang, D.R., Huang, Y., Cooper, T.,Kegeles, L., Zarahn, E., Abi-Dargham, A., Haber, S.N., Laruelle, M., 2003. Imaginghuman mesolimbic dopamine transmission with positron emission tomography. PartII: amphetamine-induced dopamine release in the functional subdivisions of thestriatum. J. Cereb. Blood Flow. Metab. 23, 285–300.
Morris, E.D., Fisher, R.E., Alpert, N.M., Rauch, S.L., Fischman, A.J., 1995. In vivoimaging of neuromodulation using positron emission tomography: optimal ligandcharacteristics and task length for detection of activation. Hum. Brain Mapp. 3,35–55.
Morris, E.D., Yoder, K.K., Wang, C., Normandin, M.D., Zheng, Q.H., Mock, B., Muzic,R.F., Jr, Froehlich, J.C., 2005. ntPET: a new application of PET imaging forcharacterizing the kinetics of endogenous neurotransmitter release. Mol. Imaging 4,473–489.
Morris, E.D., Normandin, M.D., Schiffer, W.K., 2008. Initial comparison of ntPET withmicrodialysis measurements of methamphetamine-induced dopamine release inrats: support for estimation of dopamine curves from PET data. Mol. Imaging Biol.10, 67–73.
Morris, E.D., Kim, S.J., Sullivan, J.M., Wang, S., Normandin, M.D., Constantinescu, C.C.,Cosgrove, K.P., 2013. Creating dynamic images of short-lived dopamine fluctuationswith lp-ntPET: dopamine movies of cigarette smoking. J. Vis. Exp., 78.
Muzic, R.F., Jr, Cornelius, S., 2001. COMKAT: compartment model kinetic analysis tool.J. Nucl. Med 42, 636–645.
Normandin, M.D., Morris, E.D., 2008. Estimating neurotransmitter kinetics with ntPET:a simulation study of temporal precision and effects of biased data. Neuroimage 39,1162–1179.
Normandin, M.D., Schiffer, W.K., Morris, E.D., 2012. A linear model for estimation ofneurotransmitter response profiles from dynamic PET data. Neuroimage 59,2689–2699.
Perkins, K.A., Gerlach, D., Vender, J., Grobe, J., Meeker, J., Hutchison, S., 2001. Sexdifferences in the subjective and reinforcing effect of visual and olfactory cigarette
S. Wang et al. NeuroImage 146 (2017) 701–714
713

smoke stimuli. Nicotine Tob. Res. 3, 141–150.Pontieri, F.E., Tanda, G., Orzi, F., Di Chiara, G., 1996. Effects of nicotine on the nucleus
accumbens and similarity to those of addictive drugs. Nature 382, 255–257.Porrino, L.J., Lyons, D., Smith, H.R., Daunais, J.B., Nader, M.A., 2004. Cocaine self-
administration produces a progressive involvement of limbic, association, andsensorimotor striatal domains. J. Neurosci. 24, 3554–3562.
Scott, D.J., Domino, E.F., Heitzeg, M.M., Koeppe, R.A., Ni, L., Guthrie, S., Zubieta, J.K.,2007. Smoking modulation of mu-opioid and dopamine D2 receptor-mediatedneurotransmission in humans. Neuropsychopharmacology 32, 450–457.
Sullivan, J.M., Kim, S., Cosgrove, K.P., Morris, E.D., 2013. Limitations of SRTM, Logangraphical method, and equilibrium analysis for measuring transient dopaminerelease with [11C]raclopride PET. Am. J. Nucl. Med Mol. Imaging 3, 247–260.
Volkow, N.D., Swanson, J.M., 2003. Variables that affect the clinical use and abuse ofmethylphenidate in the treatment of ADHD. Am. J. Psychiatry 160, 1909–1918.
Wang, S., Kim, S.J., Sullivan, J.M., Gillard, J., Gallezot, J.D., Cosgrove, K.P., Morris,E.D., 2012. Opitimization of HYPR filter for detection of smoking-Induced dopaminerelease in [11C]Raclopride PET studies. J. Cereb. Blood Flow. Metab. 32, S182.
S. Wang et al. NeuroImage 146 (2017) 701–714
714