Embed Size (px)
Citation preview

Research ArticleA Five-Level H-Bridge STATCOM for an Off-Grid PV SolarFarm under Two Controllers PI and PIλ-MPC Hybrid
Onur Ozdal Mengi
Department of Energy Systems Engineering, Engineering Faculty, Giresun University, 28100 Giresun, Turkey
Correspondence should be addressed to Onur Ozdal Mengi; [email protected]
Received 6 December 2017; Revised 1 February 2018; Accepted 20 February 2018; Published 4 April 2018
Academic Editor: Mahmoud M. El-Nahass
Copyright © 2018 Onur Ozdal Mengi. This is an open access article distributed under the Creative Commons Attribution License,which permits unrestricted use, distribution, and reproduction in any medium, provided the original work is properly cited.
Investigations were presented in order to eliminate the reactive power on microgrid loads fed by an off-grid and mid-powerphotovoltaic solar energy system (PVSES) with a static synchronous compensator (STATCOM) device. The electric network isspecifically characterized by P-Q loads, ambient temperature, and widely variable solar radiation levels. Two main innovationsare developed. Firstly, the STATCOM apparatus is a 5-level H-bridge inverter with capacitances as load and must totallycompensates the reactive power in the network load. Secondly, this compensation is controlled by a set of fractional PI (PIλ)and model predictive control (MPC) hybrid. The efficiencies of these controllers were compared with classical PI controllers.Large simulations, without and with reactive power compensation, in steady and transient states, are carried out to underlinethe merits of the presented works, by performing in the MATLAB-Simulink environment.
1. Introduction
The sun warms our planet with the resulting energy releasedfrom nuclear explosions taken place within itself and makesour planet a place to live for people, animals, and plants. Thesun, which is our source of life along with the rapid progressof technology, now also serves as an energy source. Photo-voltaic solar cells are systems that convert solar energy fromsunlight into electricity and thus produce electricity. Solarcells come together to form panels, and the panels cometogether to form PVSESs [1]. The solar panels generate DCvoltage at the output. The DC voltage and power obtainedfrom the solar panels are used to feed either DC loads orAC loads by converting it to AC voltage via an inverter. Var-ious solar cell production techniques and materials havebeen developed. There are many solar panels made ofnumerous materials such as amorphous silicon, copperindium gallium selenide, and cadmium telluride [2]. Thecosts and efficiencies of these panels are quite different.Nowadays, solar cells yielding 35% of efficiency have beenproduced [3].
Large scale applications have become more economicalwith the development of solar panel production techniques,
the increase in production, and also the increase in panelpower values and yields [4]. As a result of these, large powerplants have been begun to build from large scale photovoltaicsolar panels [5]. These power plants are on-grid or off-grid[6]. In off-grid PVSESs, compensation must be applied tothe system for reducing harmonics caused by the loadshaving reactive power and preventing injecting of thereactive power from the source [7, 8]. There are many differ-ent compensation techniques. Among them, voltage sourceconverter- (VSC-) based compensators are the Static VARCompensator (SVC), STATCOM,ThyristorControlled SeriesCompensator (TCSC), Static Synchronous Series Compensa-tor (SSSC), and Unified Power Flow Controller (UPFC) [9].STATCOMs are one of the dynamic systems capable of doingthis [10, 11]. STATCOMs are able to do compensation byappropriately switching the reactive power generated bycapacitors. In general, IGBT, thyristor, and transistor areused for switching. These components are switched by tech-niques such as PulseWidthModulation (PWM) and Sinusoi-dal Pulse Width Modulation (SPWM) [12]. There aredifferent topologies in the inner structure of the STATCOM.These systems, which are usually multilevel inverters, areswitched by appropriate control techniques. Current source,
HindawiInternational Journal of PhotoenergyVolume 2018, Article ID 4030214, 14 pageshttps://doi.org/10.1155/2018/4030214
voltage source, impedance source, quasi impedance sourceinverters, and multilevel inverters are commonly used [13].These inverters are controlled by using classical andadvanced control methods such as a PID controller [14],fuzzy logic controllers [15], fractional PID [16], artificialneural networks [17], vector control methods [18], modelpredictive control [19], and genetic algorithms [20].
The innovation carried out by this study is the implemen-tation of a five-level H inverter for the STATCOM converter(including 24 IGBT-s transistors). In addition, this deviceallows eliminating the load reactive powers, to regulate thenetwork voltage by increasing its efficiency and reducing har-monics contained in the electric network. The plant is fed byan off-grid photovoltaic solar power generation system, and
the STATCOM converter is controlled by PIλ and MPC.The efficiency of the obtained advanced control structurewas compared using classical PI controllers. The voltageson loads were tried to keep constant at a value of380V/50Hz with a classical 2-level three-phase voltage. Ithas been tried to create challenging conditions by continu-ously changing the loads, ambient temperature, and the solarirradiation level. In this environment, the performances ofthe controllers were tested and the contribution of theadvanced control techniques was addressed by comparingthe results obtained. All of the simulation was performed inthe MATLAB/Simulink environment.
This paper is organized in four sections. Section 1 con-tains the introduction. The STATCOMdevice and controllers
1
2
25
1 2 40
Filter
Filter
iload
ist
Vst
C1
C2
C3
C4
C5
C6
PI𝜆controller
VPV
VPV
Loads
Couplinginductance
Cascaded 5-levelH-bridgeSTATCOM
40 × 25 = 1000 solar panels
Vgrid
2-level inverter
Vgrid
PWMS1...S6
e
−+380 V
Mechanicalswitches
R S T
u v w
T11
T12 T14
T13
T15
T16 T18
T17
T21
T22 T24
T23
T25
T26 T28
T27
T31
T32 T34
T33
T35
T36 T38
T37
T1
T2
T3
T4
T5
T6
1
2
3
MPC-PI𝜆controller
Figure 1: PVSES with a STATCOM device.
2 International Journal of Photoenergy

are described in Section 2. Section 3 presents simulationresults. The last section gives some remarks and conclusion.
2. Materials and Methods
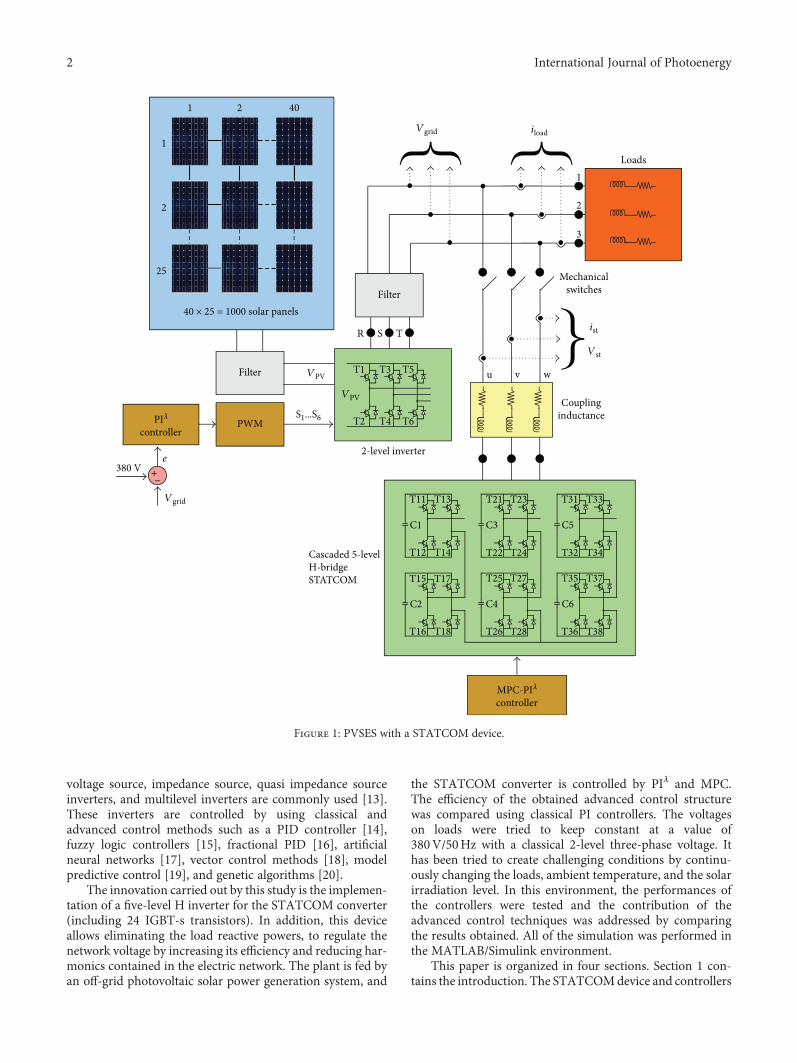
The overall scheme of the proposed PVSES and STATCOMsystem was given in Figure 1. The system consisted of solarpanels, filters, inverters, loads, measuring components, anda STATCOM device.
The solar panels contained 25 parallel branches and 40panels in each branch. The PV solar panels’ output filterhas a 6.5μF capacitor. The voltage obtained from thesepanels was converted to 380V/50Hz AC voltage through a2-level inverter before passing from a filter. The two-levelinverter output filter consisted of a 22μF capacitor and2mH inductance. This inverter is switched using PI control-lers, and carrier frequency is 2 kHz.
The STATCOM device consisted of 5-level H-bridgeIGBTs, capacitors, and a control unit. These controllers herewere used to control the capacitor voltages and IGBTs.Capacitor voltage was controlled by PIλ, and IGBTs werecontrolled by MPC. The STATCOM device was connectedto point of common coupling (PCC) via a coupling induc-tance. Different resistive and motor loads were used as loads.
2.1. PV System. Photovoltaic solar cells are semiconductorcomponents that turn solar light to electrical energy. Thereare different equivalent circuit models. The equivalent cir-cuit model with one diode of a solar panel is seen inFigure 2 [21, 22].
The output voltage of the PV cell is as in (1) [23].
VPV = Nλln ISC − IPV +MI0
MI0−
NM
RsIPV 1
Descriptions of the variables used here are seen inTable 1.
2.2. STATCOM Device. A STATCOM is a parallel-connectedstatic synchronous compensator. The STATCOM is aFACTS device that continuously supplies reactive power toor injects reactive power from the system that it is connected.STATCOM has important features such as having a fastresponse time and fewer space requirements and showingvery good dynamic characteristic under different operatingconditions [24].
The active and reactive power exchanges between theSTATCOM and the system are given by (2).
Pst =V stV sXst
sin δ,
Qst =V sXst
V s −V st cos δ2
V s is system voltage, V st is STATCOM voltage, and δ isthe phase angle between V st and V s. Xst is reactance betweenthe STATCOM and the system. Lst is an inductive part ofthe Xst.
The basic structure of the STATCOM device is shown inFigure 3.
The values of the passive elements of the STATCOM arecalculated in (3) and (4).
Cdc =2 · IRMS
ω · ΔVpp1 − sin arccos Mmaxπ
4 3
Ist
Couplinginductor
VSI
DCcapacitor
Point of commoncoupling
Con
trolle
r
Vst
VDC
Xst
Figure 3: Basic structure of the STATCOM device.
Table 1: The descriptions for the PV cell.
Expression Definition Unit
VPV Cell output voltage V
IPHPhotocurrent, function of irradiation level,
and junction of temperatureA
IPV Cell output current A
ISC Cell short-circuit current A
I0 Reverse saturation current A
RS Series resistance of the cell ΩN Series cells per string
λConstant coefficient and depends upon
the cell material
M Parallel strings
Diode
IPV
VPV
RS
IPH
Figure 2: Equivalent circuit model of a PV solar cell.
3International Journal of Photoenergy

IRMS is the RMS value of the system current, ΔVpp is peakto peak variation of the three-phase system voltage, Mmax isthe maximum value of the modulation index.
VDC8f s nLevel − 1 ΔIr
≤ L ≤V st −V sI load fωIst
4
VDC is DC voltage of the STATCOM, f s is PWM fre-quency, ΔIr is current ripple, V st is VSI voltage, V s is systemvoltage, Iload f is the fundamental harmonic component ofthe load current, ω is angular velocity, Ist is the RMS valueof VSI output current, and nLevel is the number of the inverterlevel [25, 26].
In this study, the five-level H-bridge STATCOM device isused. The reason of this, 3-level inverters give lower qualityresults and 7-level inverters have much more complicatedresults because of using too much IGBTs.
2.3. STATCOM Device Control Structure with a Classical PIController.Various structures for the STATCOM device con-trol are used in literature. One of them is the indirect currentcontrol method [26]. In this method, generally, classical PIcontrollers are used. This control structure is shown inFigure 4.
In Figure 4, I load q is defined as the reactive component ofload current.
2.4. Fractional PID Controller (PIλDμ). PIλDμ controllersare advanced controllers that can give better results thanclassical PI controllers. They are widely used becausethey are able to adjust more precisely than PID
controllers. The best knowns are the descriptions ofCaputo, Grunwald-Letkinov, and Reimann-Liouville [27,28]. The PIλDμ controller general block diagram is shownin Figure 5.
System output, C(s), is as seen in (5).
C s = U sE s = KP +
K Isλ
+ KDsμ 5
Here, λ and μ ≥ 0. λ is the order of integration,and μ is the order of the differentiator. KP, KI, andKD are the PID controller gains. U(s) and E(s) arethe control and error signals, respectively. In this study,PIλDμ controller software was performed by FOMCONtoolbox [29].
2.5. Model Predictive Controller (MPC). MPC is a controltechnique designed on the basis of the prediction ofbehavior of the systems in the next step. It is aimed atestimating the next possible switching states and providingthe selection of switching that minimizes the error overthe existing states. To achieve this, a correct model ofthe system has to be revealed. At each sampling time,the control of a particular topology defines a cost functionthat is minimized as an optimization problem. The generalapplication of MPC in the STATCOM device is as shownin Figure 6.
MPC generally consists of two groups: finite controlset MPC and continuous control set MPC. They aredivided into two groups among themselves. Finite controlset MPC is divided into optimal switching vector MPC
VDC_ref
Istd_refPI PI
PI SPW
M
Istq_refIload_q
VDC
STATCOMcurrent
abcdq
abc
dq
Istd Istq
Vstd_ref
Vstq_ref
+−
+−
+
−
+−
−−
𝜔Lst𝜔Lst
Figure 4: General block diagram of an indirect current controller.
Systemoutput
KP
uG(s)
VDC e 1/S𝜆
PI𝜆D𝜇
S𝜇
KI
KD
++++−
Figure 5: General block diagram of a PIλDμ controller.
4 International Journal of Photoenergy

and optimal switching sequence MPC, and continuouscontrol set MPC is divided into generalized predictive con-trol and explicit MPC. In the simulation, an optimalswitching vector MPC technique was used because it doesnot need a modulator and fixed switching frequency, it isintuitive, and it can perform online optimization [30].The predictive control technique can be used easily inmultilevel STATCOM applications.
For multilevel STATCOMs, the AC side equality is asin (6).
Vabcs = Lst
ddt
iabcst + Rstiabcst + Vabc
st 6
Minimizationof cost
functionPredictive
model
40 × 25 = 1000 solar panels
2-levels inverter
Filter
Filter380 V
LoadsISTATCOMref
PI𝜆D𝜇
STATCOM
VC1
VC2
S1...S6
VPV
Vgrid
Vgrid
VDC
VDC, ref = 200 V
e d dq0wt abc
dq0 to abcabc to dq0q
0
dq0
abcabc wt
PLL
wt
iload
Vgrid
ist
Sk
Z−1
S(k + 1)
ist(k + 1)
VDC
Lst Rst
e
PWMPI𝜆controller
+
++
1/6+
++
Vc1
Vc2
Vc3
Vc4
Vc5
Vc6
KP
KI
KDS𝜇
1/S𝜆−++++
VPV
−+
Figure 6: Block diagram of MPC for the STATCOM device.
Table 2: Photovoltaic solar panel parameters.
Value Unit
Open-circuit voltage 36.3 V
Short-circuit current 7.84A
Maximum power 213.15W
Voltage at maximum power point 29V
Current at maximum power point 7.35Α
Temperature coefficient of short-circuit current 0.102%/deg.C
Temperature coefficient of open-circuit voltage −0.36%/deg.CSerial resistance 0.39 ohm
Diode saturation current 2.92e-10A
Diode ideality factor 0.98
5International Journal of Photoenergy

If iabcst is extracted and discretized from (6), its next valuecan be computed from (7).
iabcst k + 1 = 1 − TsRstLst
iabcst k + TsLst
Vabcs k − Vabc
st k
7
Here, Ts is the sampling time. k expresses the currentstates of the variables. k+1 is used to predict the futurebehavior of the system. Rst is a coupling resistor, Lst is acoupling inductance, iabcst is 3-phase STATCOM current,Vabc
s is 3-phase grid voltage, and Vabcst is 3-phase STAT-
COM voltage.A cost function should then be used. This cost function
should evaluate the all possible switching combinations,choose the option minimizing cost function, and apply it inthe next step. The cost function used to minimize the currenterror is as in (8) [31].
g = iabc,refst k + 1 − iabcst k + 1 8
3. Results and Discussion
Firstly, the installed system was run without the STATCOMdevice. What happened in this case was investigated. Then,the STATCOM device with a PI controller and finally thePIλ-MPC hybrid controller were used, and their results wereshown. In all the simulations, the total power of the pho-tovoltaic solar panels and the system used in PVSES werekept same.
3.1. Data of PV Panels. The solar panels are commerciallyavailable and have the characteristics as defined in Table 2.The passive elements of the STATCOM device consist of4700μF capacitors and of coupling inductance with 56mΩand 12mH [32]. In Figure 7 are shown the exploitationcurves of each panel and the set of panels (40 in series and25 in parallel).
Figure 7 and Table 2 define the data used in commercialPV panels.
Also, in all the simulations, the ambient temperature leveland solar irradiation level were changed according toFigure 8.
3.2. Simulation Results and Discussion.Here, the PV filter hasa 6.5 μF capacitor. The voltage obtained from these panelswas converted to RMS phase-to-phase voltage 380V under50HzAC voltage through a 2-level inverter before passingfrom a filter. This filter consists of a 22 μF capacitor and2mH inductance. The system sampling time is 5 μs. PVpanel output voltage changes between 1200V and 1350V,and output current changes up to 150A.
The installed system was tested using variable loads,according to Table 3 for their connection and disconnectiontimes.
In addition, during the time simulation (between 0 and1 s), ambient solar irradiation and temperature change asshown in Figure 8.
3.2.1. Case 1: Installation without the STATCOM Device(Mechanical Switch Open). The two-level inverter is switchedusing PI controllers, and carrier frequency is 2 kHz, involving
200
150
100
Curr
ent (
A)
50
00 500 1000
Voltage (V)1500
(a)
Pow
er (W
)
2.5
2
1.5
1
0.5
00 500 1000
Voltage (V)1500
×105
(b)
8
6
4
Curr
ent (
A)
2
00 10 20 30
Voltage (V)40
(c)
Pow
er (W
)
200
250
50
100
150
00 10 20 30
Voltage (V)40
(d)
Figure 7: (a) Total PVSES output V-I diagram, (b) total PVSES output V-P diagram, (c) a photovoltaic solar panel V-I diagram, (d) aphotovoltaic solar panel V-P diagram.
6 International Journal of Photoenergy

a pulse width modulation principle. In the absence of theSTATCOM device, the compensation of reactive power can-not not be performed. The graphs obtained in this case areshown in Figure 9.
Figure 9 shows that the reactive power taken by the loadcannot be compensated when there is no STATCOM devicein the system. The same reactive power was present on theload and the grid side.
In Figure 9, change in the voltage amplitude on the loadsis shown. PI controllers kept the load voltage constant at380V. Here, 2-level IGBTs inverters were used. PI controllersthat set the load voltage were also set to KP = 0.5, KI = 100.These values were found by different simulations work onthis system. The controller could hold magnificently theRMS phase-to-phase load voltage constant at 380V. Thechange was around ±5V.
As shown in this figure, the dispersion of RMS phase-to-phase voltage is very negligible: around 1V/380V and aftersudden changes of load, we notice: for Δ2 =−5V; for Δ3 =+5.8V; Δ5 =−1V. And the disturbance duration are lesser25ms.
3.2.2. Case 2: STATCOM with a PI Controller. The resultsobtained when an indirect current control method with PIcontrollers were used to control both the VDC voltage andthe switching signals are shown in Figures 10 and 11. Theambient conditions and also the constant change in loadsforced the system. PI controllers used in an indirect currentcontrol method were set to KP = 5 and KI = 40. For PI con-trollers that adjust the load voltage, KP = 0.5 and KI = 100were also taken. This value is the same as the values used inthe case without the STATCOM device.
Figure 10 shows the switching states belonging to a phasewhen the STATCOMwith a PI controller is enabled. The firsttwo graphs show the switchings of IGBTs on the firstH-bridge (triggers of T11 and T12) and the other two onthe second H-bridge (triggers of T15 and T16). While twoIGBTs on each bridge were switched, the opposite way ofthe switchings was sent to the other two.
Figure 12 shows the efficiency of the STATCOM device.The reactive power compensation was performed success-fully. The reactive power take from the grid was zero.
Also, Figure 12 shows change in the tension on loads.Although PI controllers had a high overshoot value, they keptthe load voltage at 380 quite well. The PI controller constantswere KP = 0.5 and KI = 100. These values are deduced by trialand error.
As shown in this figure, overshoot is too bad. This valuereach 465V. So, ΔVO is +85V. Nevertheless, ΔV2 and ΔV3are negligible. Between t2 and t3, the reactive power residueis approximately +300VAr.
In Figure 13, each DC capacitor voltage VDC in theSTATCOM device were kept at 200V and the capacitorvoltage on H-bridge converter is perfectly balanced. Thisunderlines that the more the controllers efficiently operate,the compensation action is more performing.
Table 3: Loads used in the system and times that they entered thecircuit.
Load type Value Commutation times (s)
R +50 kW t1 = 0: connection
RL +10 kW/+10 kVAr t2 = 0.3: connection
RL −10 kW/−10kVAr t3 = 0.45: disconnection
R +5 kW t4 = 0.6: connection
L +5 kVAr t5 = 0.8: connection
1010Sx (W/m2)
Tx (°C)
Time (S)
1000990980970960950940
252423222120
0 0.1 0.2 0.3 0.4 0.5 0.6 0.7 0.8 0.9 1
0 0.1 0.2 0.3 0.4 0.5 0.6 0.7 0.8 0.9 1
Figure 8: Ambient solar irradiation level and temperature changes.
7International Journal of Photoenergy
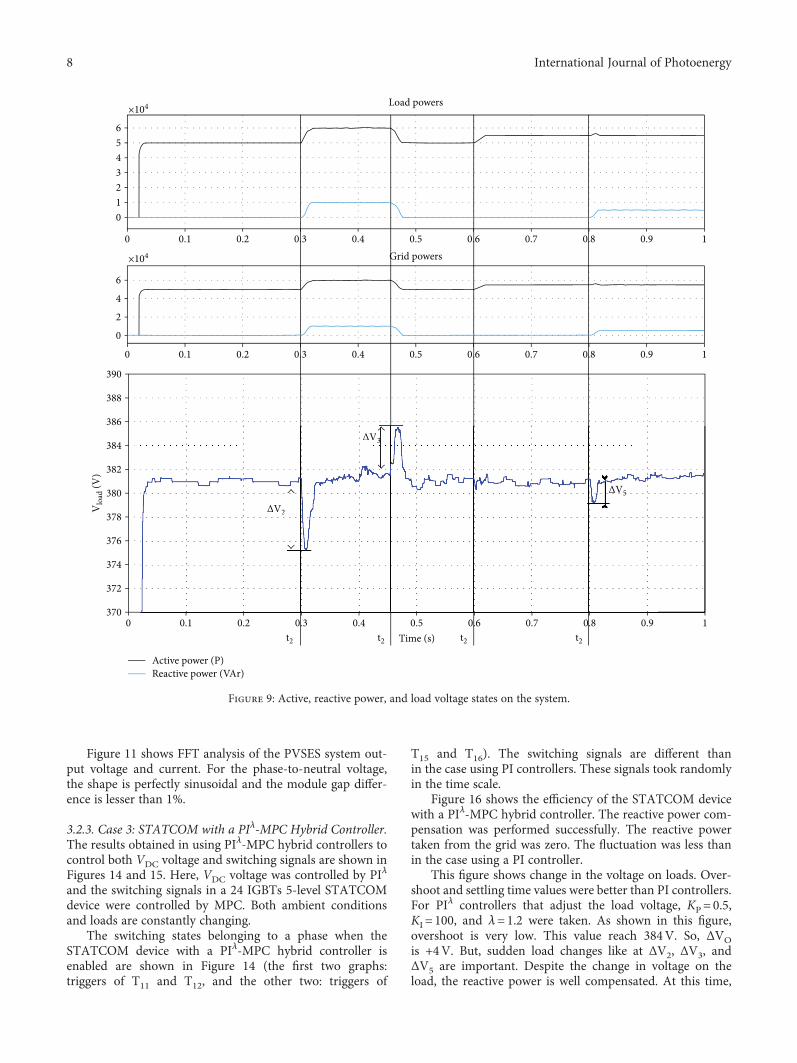
Figure 11 shows FFT analysis of the PVSES system out-put voltage and current. For the phase-to-neutral voltage,the shape is perfectly sinusoidal and the module gap differ-ence is lesser than 1%.
3.2.3. Case 3: STATCOM with a PIλ-MPC Hybrid Controller.The results obtained in using PIλ-MPC hybrid controllers tocontrol both VDC voltage and switching signals are shown inFigures 14 and 15. Here, VDC voltage was controlled by PIλ
and the switching signals in a 24 IGBTs 5-level STATCOMdevice were controlled by MPC. Both ambient conditionsand loads are constantly changing.
The switching states belonging to a phase when theSTATCOM device with a PIλ-MPC hybrid controller isenabled are shown in Figure 14 (the first two graphs:triggers of T11 and T12, and the other two: triggers of
T15 and T16). The switching signals are different thanin the case using PI controllers. These signals took randomlyin the time scale.
Figure 16 shows the efficiency of the STATCOM devicewith a PIλ-MPC hybrid controller. The reactive power com-pensation was performed successfully. The reactive powertaken from the grid was zero. The fluctuation was less thanin the case using a PI controller.
This figure shows change in the voltage on loads. Over-shoot and settling time values were better than PI controllers.For PIλ controllers that adjust the load voltage, KP = 0.5,KI = 100, and λ=1.2 were taken. As shown in this figure,overshoot is very low. This value reach 384V. So, ΔVOis +4V. But, sudden load changes like at ΔV2, ΔV3, andΔV5 are important. Despite the change in voltage on theload, the reactive power is well compensated. At this time,
t2 t2 t2 t2
ΔV2
ΔV3
ΔV2
ΔV3
×104
6543210
0 0.1 0.2 0.3 0.4 0.5
Load powers
0.6 0.7 0.8 0.9 1
×104
6
4
2
0
390
388
386
384
382
380
Vlo
ad (V
)
378
376
374
372
370
0 0.1 0.2 0.3 0.4 0.5
Grid powers
0.6 0.7 0.8 0.9 1
0 0.1 0.2 0.3 0.4 0.5Time (s)
0.6 0.7 0.8 0.9 1
Active power (P)Reactive power (VAr)
ΔV5
Figure 9: Active, reactive power, and load voltage states on the system.
8 International Journal of Photoenergy

1
0.5
0.35 0.351 0.352 0.353 0.354 0.355 0.356 0.357 0.358 0.359 0.36
0
1
0.5
0.35 0.351 0.352 0.353 0.354 0.355 0.356 0.357 0.358 0.359 0.360
1
0.5
0.35 0.351 0.352 0.353 0.354 0.355 0.356 0.357 0.358 0.359 0.360
10.5
0.35 0.351 0.352 0.353 0.354 0.355Time (s)
0.356 0.357 0.358 0.359 0.360
Figure 10: Switchings belonging to a phase when the STATCOM device with a PI controller is enabled.
200
2
1.5
1
0.5
00 10 20 30 40 50
Harmonic order
Fundamental (50 Hz) = 309.9, THD = 5.05%
60 70 80 90 100
Signal
FFT analysis
−200
0
0.6 0.61 0.62 0.63 0.64 0.65Time (s)
FFT window: 5 of 35.55 cycles of selected signal
0.66 0.67 0.68 0.69
Sign
al m
ag.
Mag
(% o
f fun
dam
enta
l)
(a) Voltage FFT analysis
SignalFFT window: 5 of 35.55 cycles of selected signal
0.6 0.61 0.62 0.63 0.64 0.65Time (s)
0.66 0.67 0.68 0.69
2
1.5
1
0.5
00 10 20 30 40 50
Harmonic order
Fundamental (50 Hz) = 118.5, THD = 4.18%
60 70 80 90 100
FFT analysis
Mag
(% o
f fun
dam
enta
l)
100
−50−100
500
Sign
al m
ag.
(b) Current FFT analysis
Figure 11: FFT analysis of phase to neutral voltage and line current on the electric network of the system.
9International Journal of Photoenergy

reactive power on the system is approximately +50VAr.This is a too low value.
Figure 17 shows that the capacitor voltages in theSTATCOM device are kept at 200V. Both settlingtime and overshoot values were much better than thecase using a PI controller. Also, the fluctuations inthe load changes were less. Here, the PIλ-type control-ler was used. In PIλ controllers used both in the set-ting of voltage on load and in the controlling of VDCvoltage in the STATCOM, controller parameters areKP = 5, KI = 40, ve λ=1.2 were taken.
Figure 15 underlines the good results shown in Figure 11(the same values about the modulus of phase-to-neutral andits THD).
t2 t3 t4 t5
ΔVO
ΔV2
ΔV3
×104
×104
6
4
2
0
6
8
4
2
0
460
440
420
400Vlo
ad (V
)
380
360
0 0.1 0.2 0.3 0.4 0.5 0.6 0.7 0.8 0.9 1
0 0.1 0.2 0.3 0.4 0.5
Grid powers
Load powers
0.6 0.7 0.8 0.9 1
0 0.1 0.2 0.3 0.4 0.5Time (s)
0.6 0.7 0.8 0.9 1
Active power (W)Reactive power (VAr)
Figure 12: Reactive power compensation when the STATCOM device with a PI controller is enabled and voltage change on loads.
240220200180160
Vdc (
V)
140120100
800 0.1 0.2 0.3 0.4 0.5
Time (s)0.6 0.7 0.8 0.9 1
Figure 13: Capacitor voltage control in the STATCOM device witha PI-controller.
10 International Journal of Photoenergy

Time (s)
0
1
0.5
0
1
0.5
0
1
0.5
0
10.5
0.35 0.351 0.352 0.353 0.354 0.355 0.356 0.357 0.358 0.359 0.36
0.35 0.351 0.352 0.353 0.354 0.355 0.356 0.357 0.358 0.359 0.36
0.35 0.351 0.352 0.353 0.354 0.355 0.356 0.357 0.358 0.359 0.36
0.35 0.351 0.352 0.353 0.354 0.355 0.356 0.357 0.358 0.359 0.36
Figure 14: Switchings belonging to a phase when the PIλ-MPC hybrid controller is enabled.
FFT window: 5 of 43.37 cycles of selected signal
Time (s)0.6
−200
0
Sign
al m
ag.
Signal
FFT analysis
200
0.61 0.62 0.63 0.64 0.65 0.66 0.67 0.68 0.69
Fundamental (50 Hz) = 309.8, THD = 4.94%
Mag
(% o
f fun
dam
enta
l)
Harmonic order0
0
0.5
1
1.5
2
10 20 30 40 50 60 70 9080 100
(a) Voltage FFT analysis
FFT window: 5 of 43.37 cycles of selected signal
Time (s)0.6
−50−100
0
Sign
al m
ag.
50100
0.61 0.62 0.63 0.64 0.65 0.66 0.67 0.68 0.69
Fundamental (50 Hz) = 118.8, THD = 4.17%
Mag
(% o
f fun
dam
enta
l)
Harmonic order0
0
0.5
1
1.5
2
2.5
10 20 30 40 50 60 70 9080 100
Signal
FFT analysis
(b) Current FFT analysis
Figure 15: FFT analysis of a PVSES system.
11International Journal of Photoenergy

4. Conclusion
In the study, the performance of the STATCOM device usinga PIλ-MPC hybrid controller has been investigated and com-pared with the version using a PI-type controller to eliminatethe reactive power on loads fed by off-grid solar panels. Thesystem was forced by constantly changing the ambienttemperature and the solar irradiation level as well as theloads, and the efficiencies of the controllers were tried tobe shown meanwhile.
In the system, VDC voltage was controlled by PIλ and theswitching signals in a 24 IGBTs 5-level STATCOM devicewere controlled by MPC. The most important reason for thisis that PID-type controllers can be placed everywhere com-fortably, while it is necessary to use detailed mathematical
equations for designing MPCs. This makes MPCs difficultto design. However, the controllers with different PID typescan be placed easily everywhere that errors are in. MPC con-trols the switching signals in the STATCOM device. It worksmore efficiently because it chose the right and the best onefrom the switching possibilities. VDC voltage was controlledby PIλ that is able to adjust more precisely than PI. By com-bining these two controllers, a hybrid controller was created.
The comparison of STATCOM device results obtainedfrom PI and PIλ-MPC controllers shows that PIλ VDC over-shoot parameters are better than PI because PIλ overshootis 213V and PI overshoot is 230V. Similarly, the reactivepower overshoot value for a PI controller is 70 kVAr. ButMPC has no overshoot. PIλ load voltage overshoot is 384V;PI controller load voltage overshoot is 465V.
7 × 104
× 104
6543210
6
4
2
0
390
ΔVO
ΔV2
ΔV3
ΔV5
388
386
384
382
380
Vlo
ad (V
)
378
376
374
372
370
0 0.1 0.2 0.3 0.4 0.5 0.6 0.7 0.8 0.9
Active power (W)Reactive power (VAr)
1
0 0.1 0.2 0.3 0.4 0.5
Grid powers
Load powers
0.6 0.7 0.8 0.9 1
0 0.1 0.2 0.3
t2 t3 t4 t5
0.4 0.5Time (s)
0.6 0.7 0.8 0.9 1
Figure 16: Reactive power compensation when the STATCOM device with a PIλ-MPC hybrid controller is enabled and load voltage change.
12 International Journal of Photoenergy

PIλ VDC settling times are better than those of PI. The PIλ
settling time is 0.1ms, and the PI settling time is 0.3ms forthe steady state. The reactive power settling time is 0.02msfor a PI controller and MPC is approximately 0ms, andfinally, the load voltage settling time is 0.05ms for a PIcontroller and 0.02ms for a PIλ controller.
If we compare steady state errors, PIλ and PI controllersare equal for the VDC steady state error parameter and loadvoltage steady state error parameter. VDC steady state erroris 0 in both PI and PIλ controllers. The load voltage steadystate error change range is ±6V in both PI and PIλ control-lers. But reactive power steady state error is better thanMPC. MPC steady state error is 50VAr, and the PI controllervalue is 300VAr.
The results of the FFT analysis show that the PIλ-MPCcontroller is better than the PI controller. Total harmonicdistortion of the PIλ-MPC controller is 4.94% for voltageanalysis and 4.17% for current analysis, and then PI control-ler FFT analysis for voltage is 5.05% and current is 4.18%.
As mentioned in the previous paragraph, the reactivepower compensation performed very well and the error rateswere very weak. The overshoot values of PI controllers werehigher than those of PIλ-MPC hybrid controllers. Also, thesettling time values were shorter on the PIλ-MPC hybrid con-troller. In general, the performance of the PIλ-MPC hybridcontroller is much better than those of PI controllers.
Conflicts of Interest
The author declares that they have no conflicts of interest.
References
[1] I. H. Altas and A. M. Sharaf, “A novel on-line MPP searchalgorithm for PV arrays,” IEEE Transactions on EnergyConversion, vol. 11, no. 4, pp. 748–754, 1996.
[2] T. D. Lee and A. U. Ebong, “A review of thin film solar celltechnologies and challenges,” Renewable and SustainableEnergy Reviews, vol. 70, pp. 1286–1297, 2017.
[3] J. Praveen and V. VijayaRamaraju, “Materials for optimizingefficiencies of solar photovoltaic panels,” Materials Today:Proceedings, vol. 4, no. 4, Part D, pp. 5233–5238, 2017.
[4] S. C. W. Krauter, Solar Electric Power Generation, Springer,New York, NY, USA, 2006.
[5] S. Sumathi, L. A. Kumar, and P. Surekha, Solar PV and WindEnergy Conversion Systems, Springer, Switzerland, 2015.
[6] V. Chamola, B. Krishnamachari, and B. Sikdar, “Green energyand delay aware downlink power control and user associationfor off-grid solar-powered base stations,” IEEE Systems andJournal, vol. PP, no. 99, pp. 1–12, 2017.
[7] L. Luo, W. Gu, X.-P. Zhang et al., “Optimal siting and sizing ofdistributed generation in distribution systems with PV solarfarm utilized as STATCOM (PV-STATCOM),” AppliedEnergy, vol. 210, pp. 1092–1100, 2018.
[8] P. R. Yelpale, H. T. J. Hod, and C. Charmole, “New controlstrategy for grid integrated PV solar farm to operate asSTATCOM,” in 2017 International Conference on Circuit,Power and Computing Technologies (ICCPCT), Kollam,India, April 2017.
[9] R. Sirjani and A. R. Jordegi, “Optimal Placement and Sizing ofDistribution Static Compensator (D-STATCOM) in ElectricDistribution Networks: A review,” Renewable and SustainableEnergy Reviews, vol. 77, no. 4, pp. 688–694, 2017.
[10] H. Yonezawa, M. Tsukada, and J. J. Paserba, “Study of aSTATCOM application for voltage stability evaluated bydynamic PV curves and time simulations,” in 2000 IEEEPower Engineering Society Winter Meeting, pp. 1471–1476,Singapore, Singapore, January 2000.
[11] S. Eshtehardiha, M. B. Poodeh, and M. R. Zare, “Improvementof STATCOM performance with multi variable controlmethods,” in IET-UK International Conference on Informationand Communication Technology in Electrical Sciences (ICTES2007), pp. 105–111, Tamil Nadu, India, December 2007.
Time (s)0
190
195
200
Vdc (
V)
205
210
215
0.1 0.2 0.3 0.4 0.5 0.6 0.7 0.8 0.9 1
Figure 17: Capacitor voltage control in the STATCOM device with a PIλ-MPC hybrid controller.
13International Journal of Photoenergy

[12] K. Rao and N. Patel, “Effectuation in SPWM technique for3-Φ VSI using STM32F4 discovery board interfaced withMATLAB,” in 2016 IEEE 7th Power India InternationalConference (PIICON), Bikaner, India, November 2016.
[13] F. L. Luo and H. Ye, Advenced DC/AC Inverters, CRC Press,USA, 2013.
[14] Z. Wu, C. Xu, and Y. Yang, “Adjustable PID control based onadaptive internal model and application in current shared con-trol of multi inverters,” Journal of the Franklin Institute,vol. 354, no. 7, pp. 2699–2711, 2017.
[15] A. Saygın and A. Kerem, “Fuzzy logic based control of a loadedasynchronous motor using a 6-switched 3-level inverter,” in2017 18th International Conference on Computational Prob-lems of Electrical Engineering (CPEE), pp. 1–4, Kutna Hora,Czech Republic, September 2017.
[16] I. Rasoanarivo, K. Arab-Tehrani, and F. M. Sargos, “Fractionalorder PID andmodulated hysteresis for high performance cur-rent control in multilevel inverters,” in 2011 IEEE IndustryApplications Society Annual Meeting (IAS), pp. 1–7, Orlando,FL, USA, October 2011.
[17] H. Soliman, I. Abdelsalam, H. Wang, and F. Blaabjerg, “Artifi-cial neural network based DC-link capacitance estimation in adiode-bridge front-end inverter system,” in 2017 IEEE 3rdInternational Future Energy Electronics Conference and ECCEAsia (IFEEC 2017 - ECCE Asia), pp. 196–201, Kaohsiung,Taiwan, June 2017.
[18] M. R. B. Fathima, P. M. J. Princy, and S. R. Prasath, “Mathe-matical modeling of SVPWM ınverter fed 3 phase inductionmotor vector control in MATLAB/Simulink environment,”in 2017 International Conference on Circuit, Power and Com-puting Technologies (ICCPCT), pp. 1–8, Kollam, India, April2017.
[19] J. Su and D. Sun, “Model predictive torque-vector control forfour-switch three-phase inverter-fed PMSM with capacitorvoltage offset suppression,” in Electrical Machines and Systems(ICEMS), pp. 1–5, Sydney, New South Wales, Australia,August 2017.
[20] S. Qian, Y. Ye, H. Wu, and Z. Zhuang, “Optimizing PWMswitching sequence of inverters using an immune geneticalgorithm,” in 2016 8th International Conference on Intelli-gent Human-Machine Systems and Cybernetics (IHMSC),pp. 7–10, Hangzhou, China, August 2016.
[21] I. H. Altas and A. M. Sharaf, “A photovoltaic array simula-tion model for MATLAB-Simulink GUI environment,” in2007 International Conference on Clean Electrical Power,pp. 341–345, Capri, Italy, May 2007.
[22] I. H. Altas and A. M. Sharaf, “A novel maximum power fuzzylogic controller for photovoltaic solar energy systems,” Renew-able Energy, vol. 33, no. 3, pp. 388–399, 2008.
[23] M. A. S. Masoum, H. Dehbonei, and E. F. Fuchs, “Theoreticaland experimental analyses of photovoltaic systems with volt-age and current-based maximum power-point tracking,” IEEETransactions on Energy Conversion, vol. 17, no. 4, pp. 514–522,2002.
[24] B. Singh, K. Al-Haddad, R. Saha, and A. Chandra, “Staticsynchronous compensators (STATCOM): a review,” IETPower Electronics, vol. 2, no. 4, pp. 297–324, 2009.
[25] N. G. Hingorani and L. Gyugti, Understanding FACTS,Consepts and Technology of Flexible AC Transmission Systems,IEEE Press, USA, 2000.
[26] K. Yanmaz, I. H. Altas, and O. O. Mengi, “Five level cascadedH-bridge D-STATCOM using a new fuzzy and PI controllersmodel for wind energy systems,” Advances in Electrical andComputer Engineering, vol. 17, no. 4, pp. 49–58, 2017.
[27] P. Shah and S. Agashe, “Review of fractional PID controller,”Mechatronics, vol. 38, pp. 29–41, 2016.
[28] I. Rasoanarivo and F. M. Sargos, “Multi-objective analysis fordesigning and controlling microgrids under multi-controlwith PID, MHCC and FOPID controllers,” in 2013 IEEEIndustry Applications Society Annual Meeting, pp. 7–10, LakeBuena Vista, FL, USA, October 2013.
[29] A. Tepljakov, E. Petlenkov, and J. Belikov, “FOMCON:fractional-order modeling and control toolbox for MATLAB,”in 2011 Proceedings of the 18th International ConferenceMixed Design of Integrated Circuits and Systems (MIXDES),pp. 684–689, Gliwice, Poland, June 2011.
[30] S. Vazquez, J. Rodriguez, M. Rivera, L. G. Franquelo, andM. Norambuena, “Model predictive control for power con-verters and drives: advances and trends,” IEEE Transactionson Industrial Electronics, vol. 64, no. 2, pp. 935–947, 2017.
[31] J. Rodriguez and P. Cortes, Predictive Control of PowerConverters and Electrical Drives, Wiley-IEEE Press, UnitedKingdom, 2012.
[32] I. Rasoanarivo, P. Boos, and B. Davat, “Improvements ofparallel active filter performances,” in EPE’97, pp. 898–902,Trondheim, Norway, September 1997.
14 International Journal of Photoenergy

TribologyAdvances in
Hindawiwww.hindawi.com Volume 2018
Hindawiwww.hindawi.com Volume 2018
International Journal ofInternational Journal ofPhotoenergy
Hindawiwww.hindawi.com Volume 2018
Journal of
Chemistry
Hindawiwww.hindawi.com Volume 2018
Advances inPhysical Chemistry
Hindawiwww.hindawi.com
Analytical Methods in Chemistry
Journal of
Volume 2018
Bioinorganic Chemistry and ApplicationsHindawiwww.hindawi.com Volume 2018
SpectroscopyInternational Journal of
Hindawiwww.hindawi.com Volume 2018
Hindawi Publishing Corporation http://www.hindawi.com Volume 2013Hindawiwww.hindawi.com
The Scientific World Journal
Volume 2018
Medicinal ChemistryInternational Journal of
Hindawiwww.hindawi.com Volume 2018
NanotechnologyHindawiwww.hindawi.com Volume 2018
Journal of
Applied ChemistryJournal of
Hindawiwww.hindawi.com Volume 2018
Hindawiwww.hindawi.com Volume 2018
Biochemistry Research International
Hindawiwww.hindawi.com Volume 2018
Enzyme Research
Hindawiwww.hindawi.com Volume 2018
Journal of
SpectroscopyAnalytical ChemistryInternational Journal of
Hindawiwww.hindawi.com Volume 2018
MaterialsJournal of
Hindawiwww.hindawi.com Volume 2018
Hindawiwww.hindawi.com Volume 2018
BioMed Research International Electrochemistry
International Journal of
Hindawiwww.hindawi.com Volume 2018
Na
nom
ate
ria
ls
Hindawiwww.hindawi.com Volume 2018
Journal ofNanomaterials
Submit your manuscripts atwww.hindawi.com