Embed Size (px)
Citation preview
A fish intestinal epithelial barrier model establishedfrom the rainbow trout (Oncorhynchus mykiss) cell line,RTgutGC
Matteo Minghetti & Carolin Drieschner &
Nadine Bramaz & Hannah Schug & Kristin Schirmer
Received: 28 November 2016 /Accepted: 2 February 2017 /Published online: 1 March 2017# The Author(s) 2017. This article is published with open access at Springerlink.com
Abstract The intestine of fish is a multifunctional or-gan: lined by only a single layer of specialized epithelialcells, it has various physiological roles including nutri-ent absorption and ion regulation. It moreover com-prises an important barrier for environmental toxicants,including metals. Thus far, knowledge of the fish intes-tine is limited largely to in vivo or ex vivo investiga-tions. Recently, however, the first fish intestinal cell line,RTgutGC, was established, originating from a rainbowtrout (Oncorhynchus mykiss). In order to exploit theopportunities arising from RTgutGC cells for exploringfish intestinal physiology and toxicology, we present
here the establishment of cells on commercially avail-able permeable membrane supports and evaluate itssuitability as a model of polarized intestinal epithelia.Within 3 weeks of culture, RTgutGC cells show epithe-lial features by forming tight junctions and desmosomesbetween adjacent cells. Cells develop a transepithelialelectrical resistance comparable to in vivo measuredvalues, reflecting the leaky nature of the fish intestine.Immunocytochemistry reveals evidence of polarization,such as basolateral localization of Na+/K+-ATPase(NKA) and apical localization of the tight junction pro-tein ZO-1. NKA mRNA abundance was induced asphysiological response toward a saltwater buffer, mim-icking the migration of rainbow trout from fresh toseawater. Permeation of fluorescent molecules provedthe barrier function of the cells, with permeation coeffi-cients being comparable to those reported in fish. Final-ly, we demonstrate that cells on permeable supports aremore resistant to the toxicity elicited by silver ions thancells grown the conventional way, likely due to im-proved cellular silver excretion.
Keywords Fish intestine . Polarized epithelium .
Permeation . Ion regulation . Silver toxicity . In vitromodel
AbbreviationsFW FreshwaterL-15 Leibovitz’s culture mediumNKA Na+/K+-ATPaseRTgutGC Intestinal cell line from rainbow trout
(rainbow trout gut Germany-Canada)
Cell Biol Toxicol (2017) 33:539–555DOI 10.1007/s10565-017-9385-x
M. Minghetti :C. Drieschner :N. Bramaz :H. Schug :K. SchirmerEawag, Swiss Federal Institute of Aquatic Science andTechnology, Überlandstrasse 133, 8600 Dübendorf, Switzerland
M. MinghettiDepartment of Integrative Biology, Oklahoma State University,Stillwater, OK, USA
C. DrieschnerSchool of Architecture, Microsystems Laboratory 4, EPFLausanne, Lausanne, Switzerland
H. Schug :K. SchirmerSchool of Architecture, Civil and Environmental Engineering,EPF Lausanne, Lausanne, Switzerland
K. Schirmer (*)Institute of Biogeochemistry and Pollutant Dynamics, ETHZürich, Zürich, Switzerlande-mail: [email protected]
SW SeawaterTEER Transepithelial electrical resistanceZO-1 Zona occludens 1 (a tight junction protein)
Introduction
The fish intestinal epithelium is an importantenvironment-organism interface whose physiologicalfunctions include nutrient transport, osmoregulationand protection from environmental stressors, such astoxicants (Grosell et al. 2011). Research on themolecular and biochemical processes in the specializedintestinal cells fosters fundamental knowledge andprovides impetus for improved fish health, as inaquaculture, and protection, as in environmental riskassessment. Yet, progress in this research has thus farlargely relied on in vivo experiments. Sundh et al.(2014) and Grosell et al. (2007), for example, have usedmolecular, biochemical and immunohistochemical ap-proaches on salmonids to understand the role of the fishintestine during the process of acclimation to seawater.However, these types of studies, while relying on a fullydeveloped, functional epithelium, do not allow for con-trolled variation of experimental parameters on the levelof the organ itself. Here, isolated perfused intestinalsegments or sac preparations provide useful ex vivoexperimental models. Indeed, gut sac preparations havebeen used to study intestinal absorption of metals indifferent fish species (Kwong and Niyogi 2009;Hogstrand et al. 2002; Handy et al. 2000). Again, theintestinal epithelium stays intact but the preparations arelimited in their durability and only few experimentalconditions can be tested per fish. Finally, freshlyisolated intestinal epithelial cells can be used for shortterm in vitro investigations. Such an approach was, forexample, chosen by Burke and Handy (2005) andKwong and Niyogi (2012) to evaluate time- andconcentration-dependent copper and cadmium accumu-lation. Yet, as cells are suspended, they lose their struc-ture as organized epithelial cell layer, making the studyof transport processes in the polarized cell layer impos-sible. Thus, to provide a much more accessible,tuneable, animal-free model for mechanistic studies onpolarized fish intestinal cells, we here present details ofthe establishment of a novel fish epithelial barrier modelbased on the rainbow trout gut cell line, RTgutGC(Kawano et al. 2011).
In vivo, the epithelium of the intestine is organized in amonolayer composed of four basic cell types: absorptiveepithelial cells, mucus-producing goblet cells, endocrineand immune cells (Jutfelt 2011). In addition, due to itsintense self-renewal kinetics, the intestinal epithelium pos-sesses stem cells residing in the intestinal crypt (Clevers2013). The vast majority are epithelial cells also calledenterocytes. These cells are polarized, differentiating anapical side facing the intestinal lumen, and a basolateralside facing the organism interior. One characteristic of theapical side are tight junctions, which seal the membranesbetween neighbouring cells to control diffusion throughthe intercellular space. Other features of fish enterocytesinclude the apical formation of microscopic membraneprotrusions, so-called microvilli, as a means to increasethe surface for absorption of nutrients, and the basolateralexpression of the Na+/K+-ATPase (NKA), important forion regulation and other physiological processes (Grosellet al. 2007; Marshall and Grosell 2006). Our focus inestablishing the piscine in vitro intestinal barrier modelwas on characterizing the development of a polarizedepithelium when growing the RTgutGC cell line as mono-layer on a permeable support. Similar methodology haspreviously led to the development of models of the humanintestinal epithelium based on Caco-2 cells (Sambuy et al.2005) and of the gill epithelium based on primary gill cells(Bury et al. 2014).
Referring to the first characterization of the RTgutGCcell line upon routine maintenance on solid cell culturesupport (Kawano et al. 2011), this cell line was initiatedfrom a primary culture derived from the distal portion ofthe gut of a small, healthy female rainbow trout. Thecells appear to have immortalized spontaneously, areheteroploid and possess an epithelial-like morphology.Moreover, they were reported to express alkaline phos-phatase activity, a commonly considered marker ofenterocyte differentiation, when cultures were initiatedat very high cell densities (Kawano et al. 2011). Wetherefore started to explore to what extent the RTgutGCcells develop a functional epithelium if cultured in atwo-compartment system on permeable cell culture sup-port, where an apical and a basolateral side can bemimicked to promote polarization and enabletransport-dependent studies at this interface. We havepreviously shown that these cells can be cultured oncommercial inserts with pore sizes ranging from 0.4 to3 μm and that membranes with the 3-μm pore size areamenable to study the transport of nanoparticles acrossthe epithelial cell layer (Geppert et al. 2016).
540 Cell Biol Toxicol (2017) 33:539–555

We here report on the step-by-step establishment ofthe intestinal epithelial cell monolayer on 0.4-μm poresize membranes, the selected structural and functionalfeatures characterizing this cell layer and its response toa physiological (acclimation to increased salinity) and atoxicological (silver ions) stimulus. Acclimation to in-creased salinity was selected because of its physiologi-cal importance in anadromous fish, such as rainbowtrout, and because the intestine has a key role in thisprocess (Kültz 2015). Exposure to silver ions was cho-sen because silver is a toxic metal known to be able tocross the intestinal barrier, likely due to copper trans-porters (Behra et al. 2013).
Material and methods
RTgutGC cell culture
Routine cell culture RTgutGC cells were routinely cul-tured essentially as described by Kawano et al. (2011).Briefly, cells were grown in 75-cm2 flasks (TPP,Trasadigen, Switzerland) in Leibovitz’s L-15 Mediumwithout phenol red (no. 21083-027, Invitrogen, Basel,Switzerland) supplemented with 5% foetal bovine se-rum (FBS, Gold, PAA Laboratories GmbH, Austria)and 1% gentamicin (PAA Laboratories GmbH, Austria,10 mg/mL). Cells were maintained at 19 °C in normalatmosphere and split into two flasks once confluent,which was every 2 to 3 weeks. Confluent cells werewashed twice with Versene (Invitrogen, Basel, Switzer-land), and cells were detached using trypsin (0.25% inphosphate-buffered saline, PBS, Biowest, Germany).
Cell culture on permeable membranes RTgutGC cellswere seeded onto commercially available, transparenttissue culture inserts for multiwell plates (pore size =0.4 μm; polyethylene terephthalate [PET] from GreinerBio-One, Germany). Insert size was chosen dependingon the application (see the following): 0.33-cm2 inserts(for 24-well plates) for cell viability, confocal micros-copy and electron microscopy; 1.13-cm2 inserts (for 12-well plates) for permeability and quantitative RT-PCR(qPCR) analyses; and 4.52 -cm2 inserts (for 6-wellplates) to determine the concentration of silver in cellsafter a 24 h exposure. Initial experiments with or withoutfibronectin showed that the fibronectin promoted fasterattachment and a more homogeneous distribution ofcells—fibronectin coating was therefore used
throughout. To accomplish the coating, inserts wereincubated at room temperature for 2 h with fibronectin(50μg/mL; Roche Applied Science, Basel, Switzerland)in PBS (Bioswisstec AG, Schaffhausen, Switzerland)then washed once with PBS prior to adding cells. Toinitiate cultures on the inserts, cell suspensions in L-15/FBS were added in 300, 1000 and 3000 μL for 24-, 12-and 6-well inserts (referred to as apical compartment),respectively. These were then placed in the correspond-ing culture wells (referred to as basolateral compart-ment), which were subsequently filled with, respective-ly, 1000, 1700 and 3400 μL of L-15/FBS. When boththe apical and the basolateral compartment was filledwith the same medium, such as L-15/FBS as describedpreviously, the set-up is termed Bsymmetrical^. In casethat the medium composition differed in the two com-partments, the set-up is termed Basymmetrical^ (seebelow).
All experiments were carried out with a starting celldensity of 62,500 cells/cm2, counting cells with aCASY® cell counter (Casy model TTC, Schärfe SystemGmbH, Reutlingen, Germany). After testing differentdensities initially, this cell density was found to lead tothe formation of a confluent monolayer within 1 day,reducing culture time, but at the same time be lowenough to avoid the formation of multiple cell layers.Culture medium was fully replaced by fresh medium inboth the apical and basolateral compartment approxi-mately every 7 days. The formation of the barrier wasassessed based on transepithelial electrical resistance(TEER), the evolution and localization of zona oc-cludens (ZO-1), NKA and f-actin proteins byimmunocytochemistry/confocal microscopy and non-invasive cell viability measurements (see the followingsection). Moreover, electron microscopy was used tofurther confirm the presence of tight junctions and des-mosomes and to verify that the cell barrier consisted ofonly a single layer of cells.
Measurement of TEER
TEER measurements were done prior to mediumchange using an epithelial tissue voltohmeter (EVOMX;World Precision Instruments) fitted with chopstick elec-trodes (STX-2) and surface-normalized values calculat-ed according to the manufacturer’s instructions. Mea-surements across inserts with medium but no cellsserved as control, and resulting values were subtractedfrom results with cells.
Cell Biol Toxicol (2017) 33:539–555 541
Immunocytochemistry and confocal microscopy
To initiate imaging, inserts were washed twice with PBS.Cells were fixed by incubation in a solution of 3.7%paraformaldehyde (Sigma-Aldrich, Switzerland) in PBSfor 15 min at room temperature. Permeabilization wasachieved by incubating the cells in a solution of 0.2% (v/v) Triton (Sigma-Aldrich, Switzerland) in PBS for30 min at 4 °C. The Bimage-it^ solution (MolecularProbes, Invitrogen, Switzerland) was used for blocking.For detection of zonula occludens, a monoclonal anti-body (ZO-1) conjugated to Alexa Fluor® 488 was ob-tained from Invitrogen (Molecular Probes, Invitrogen,Switzerland) and applied at 5 μg/mL in PBS. Monoclo-nal sodium-potassium ATPase α5-subunit antibody(NKA, Developmental Studies Hybridoma Bank, TheUniversity of Iowa, USA) was applied at 5 μg/mL inPBS. Alexa Fluor® 488 conjugated anti-mouse second-ary antibodies (Molecular Probes, Invitrogen, Switzer-land), used in combination with the NKA primary anti-body, were also applied at 5 μg/mL in PBS. Primaryantibody incubation was performed overnight at 4 °C,while incubation with secondary antibody and the f-actinstaining (Rhodamine phalloidin, Molecular Probes,Invitrogen, Switzerland), applied at 2 unit/mL in PBS,were done for 1 h at room temperature. Nuclear counterstaining was achieved by incubating cells with 300 nMDAPI (Molecular Probes, Invitrogen, Switzerland) for5 min at room temperature just before imaging. Finally,the PET membrane holding the cells was washed severaltimes with PBS, excised from the insert, mounted on amicroscope slide (Thermo Scientific, Switzerland) andcovered with ProLong Antifade solution (MolecularProbes, Invitrogen, Switzerland).
Imaging was performed using a Leica SP5 (Wetzlar,Germany) upright confocal laser scanning microscope,equipped with the acquisition software LAS AF 2.6.v.The ×63 OIL (NA 1.4) objective was used. Images ateach wavelength (405 nm for DAPI, 488 nm for AlexaFluor® 488 conjugated secondary antibodies and543 nm for Rhodamine phalloidin) were acquired se-quentially. For visualization, Z-stacks were recorded; toavoid bleaching of the fluorescent dyes, step size wasmanually set at 0.6 μm. Images 1.2 μm from the top(apical) or bottom (basolateral) side were recorded. Sig-nals from five fields of view (FOVs; 5337 ± 350 μm2)were analysed by the co-localization module of the LASAF 2.6v software. Co-localization of ZO-1 and f-actinvaried along the Z dimensions; however, only the
highest value of co-localization was recorded for eachFOV. Side views were generated using 3D renderingmodule from the Imaris software (Bitplane, v. 7.6.5,Switzerland).
Electron microscopy
Chemical fixation The PET membrane with the cellswas carefully excised from the insert. The samples werefixed in phosphate-buffered 2.5% glutaraldehyde, post-fixed in 1% osmium tetroxide and block stained with1% uranyl acetate then dehydrated in a graded ethanolseries and finally embedded in Epon resin (EMbed 812,EMS). After polymerization at 60 °C, ultrathin sectionswere cut on an ultramicrotome (Reichert Ultracut S)perpendicular to the cell monolayer. Due to differentmaterial properties of resin andmembrane, some foldingoccurred. For scanning electron microscopy (SEM),100-nm sections were transferred onto silicon chips:no post-staining was applied. Micrographs were takenon a FEI Magellan 400 at 2 kV the backscatter electronsignal. Large area scans were performed by stitchingindividual image tiles.
Chemical fixation is a simple and fast preparationmethod, but the integrity of membranes is not guaranteed,and therefore, the structure might be prone to artefacts.Therefore, findings were compared with specimen pre-pared by freeze substitution followed by TEM analyses.
Freeze substitution The PET membrane with the cellswas carefully excised from the insert. With a biopsypuncher, 5-mm discs were punched out and transferredinto a sandwich made of two aluminium specimen car-riers with a sample cavity of 100 μm of depth. Thecarriers were previously covered with a thin layer ofhexadecane to facilitate the removal of the frozen sam-ple during the follow-up preparation and filled with PBSbuffer. The sandwiches were high-pressure frozen (Bal-Tec; HPM 100) and transferred into a freeze substitutionunit (homemade with Tecon Temperature Controller)pre-cooled to −90 °C for the substitution in acetonemixed with 1.6% OsO4, 0.2% UrAc and 5% water.The substitution was done at −90 °C for 3 h, −70 °Cfor 2 h and −35 °C for 12 h, washed in acetone andembedded in HM20 before polymerizing under UV.Ultrathin sections (50 nm, Reichert Ultracut S) werestained with uranyl acetate and lead citrate and analyzedusing TEM (FEI; Morgagni) at an acceleration voltageof 100 kV.
542 Cell Biol Toxicol (2017) 33:539–555
Assessment of cell viability
Non-invasive assessment of cell viability was ac-complished by means of the fluorescent cell viabilityindicator dye, Alamar Blue, essentially as describedby Schirmer et al. (1997). Alamar Blue is a com-mercial preparation of the dye resaruzin, which en-ters the cells and is reduced to resorufin by mito-chondrial, microsomal and cytosolic oxidoreduc-tases (O’Brien et al. 2000). Cell viability wasassessed as one of the parameters of the intactnessof RTgutGC cells cultured in inserts. In the case ofexposure of cells to AgNO3 (see the following sec-tion), cell viability was additionally assessed in cellsgrown conventionally on the bottom of 24-wellplates (Greiner Bio-One, Germany).
Cells cultured in inserts (0.33 cm2) At the time ofassessment, the exposure medium was aspirated firstfrom the basolateral and then the apical compartmentand cells were washed once with PBS. Then, 100 μL ofa 5% Alamar Blue solution was added to the apicalcompartment; the basolateral compartment was leftempty. Cells were incubated in the dark at 19 °C for30min, and then fluorescencewas recorded from the topwith a Tecan Infinite 2000 multiwell plate reader(Switzerland) at an excitation/emission wavelength of530 and 595 nm, respectively. To account for the smallarea of the insert and the fact that the position of insertsmay shift slightly in the wells, nine positions weremeasured. These positions reflect the fluorescence inthe centre of the inserts with very small variationsamong them. The resulting average fluorescent units(F.U.) were corrected for background fluorescence mea-sured in inserts without cells. In one experiment, theAlamar Blue fluorescence values were converted to cellnumber based on a separately prepared standard curveof F.U. vs. insert cell number according to Ganassinet al. (2000).
Cells cultured in wells of 24-well plates To compare theresponse of cells grown in inserts to those grown con-ventionally on the bottom of culture wells upon expo-sure to a toxicant, AgNO3, cells were plated in the 24-well plates and cell viability was assessed as describedpreviously with two modifications. First, the volume ofAlamar Blue added was 400 μL; and second, fluores-cence wasmeasured based on a single read in the middleof the well as described by Schirmer et al. (1997).
Permeation of fluorescently labelled molecules
To assess the tightness and integrity of the RTgutGC celllayer, three fluorescently labelled dyes of different mo-lecular size were used: Lucifer Yellow (LY, potassiumsalt, MW = 522 Da; Thermo Fisher Scientific, Switzer-land), Dextran FD4 (FD4, MW = 4000 Da; Sigma-Aldrich; Buchs, Switzerland) and Dextran FD40(FD40, MW = 40,000 Da; Sigma Aldrich; Buchs, Swit-zerland). Since excitation and emission maxima of thedyes overlap (λex/em LY = 450/520 nm, λex/em FD4/FD40 = 485/544 nm), they were applied and analyzedin separate preparations of cells. Dyes were dissolved inthe medium used during permeation studies (see below)at a final concentration of 50 μg/mL for LY and 1 mg/mL for FD4/FD40.
To initiate the permeation assay, TEER values ofcultures grown for 21–28 days in 1.13-cm2 (12-wellplate) inserts were measured first. Then, cells werepre-incubated with the specified medium (apical[1 mL]: L-15/FBS, L-15/ex, seawater (SW) or freshwa-ter (FW); basolateral [1.7 mL]: L-15/FBS or L-15/ex)for 30 min at 19 °C and TEER measurement was re-peated. Thereafter, dyes were applied to the apical (=do-nor) compartment and plates were incubated at 19 °C forup to 72 h. At different time points, the solution in thebasolateral (=receiver) compartment was carefullymixed and then 50 μL was withdrawn from two differ-ent positions. The 50 μL aliquots were transferred to a96-well plate, and the fluorescence was detected imme-diately at the respective emission and excitation wave-length. In the beginning, in the middle and at the end ofexposure, a sample from the apical compartment wastaken to verify the stability of the dye concentration inthe apical compartment. The fluorescence data weretransformed to amount permeated dye based on thelinear regression of separately prepared standard curves.
The removed sample volume was taken into accountby adjusting the total receiver volume after each mea-surement. The apparent permeability Papp [cm/s] wascalculated according to Hubatsch et al. (2007, protocol2) as follows:
Papp ¼ dQdt
� �� 1
A� C0
� �ð1Þ
with dQdt
� �being the steady state flux [μmol s−1], A the
insert surface area [cm2] and C0 the initial concentration[μM] in the apical compartment. For this way of
Cell Biol Toxicol (2017) 33:539–555 543

analysis, the receiver concentration should not exceed10% of the donor concentration in order to maintainsteady-state conditions throughout the experiment(Hubatsch et al. 2007).
Expression of sodium-potassium ATPase
NKA was assessed in two ways: (1) based on enzymeactivity in conventionally grown RTgutGC cells com-pared to activity found in intestinal and gill tissue and(2) based onmessenger RNA (mRNA) abundance usingqPCR in cells grown in inserts.
Enzyme activity measurements The basic protocol forNKA activity was performed according to McCormick(1993) with some modifications for the RTgutGC cellline. Tissues from rainbow trout were obtained fromMachrihanish fish farm, Campbeltown, UK. Gills(four–five gill filaments) from four individuals, andanterior intestine (between the pyloric ceca and theileocecal valve) and posterior intestine (between theileocecal valve and the anus) from three individuals,were dissected and immediately frozen in liquid nitro-gen. Modifications were required to adapt the method tothe RTgutGC cell culture. The ratio of cell number to theSEI buffer (150 mM sucrose, 10 mM EDTA, 50 mMimidazole, pH 7.3) was optimized: 8.3 × 10⁶ cells (usu-ally obtained from one 75-cm2 flask) were re-suspendedin 200 μL of SEI, which corresponds to an optimalamount of protein for the assay (~30–50 μg protein/10 μL). Thereafter, samples were immediately frozenat −80 °C.
To initiate NKA activity analyses, tissues or cells werethawed on ice. With regard to the intestinal tissue, gutenterocyteswere collected via scraping of themucosa layerfrom the serosa muscolar layer with a glass microscopeslide. Tissues (about 10 mg per analysis) were then ho-mogenized in 100 μL ice-cold SEI buffer using a mechan-ical homogenizer ULTRA-TURRAX® whereasRTgutGC cells (8.3 × 10⁶ in 200 μL SEI) were homoge-nized via sonication (three pulses for 5 s; LabSonic®).
RNA extraction, cDNA synthesis and quantitativePCR Total RNA was extracted by adding 600 μL ofTRIzol® Reagent (Invitrogen/Gibco, Germany) directlyonto the RTgutGC cell monolayer grown on 1.13-cm2
(12-well) inserts. The phase separation was performedusing Phase Lock heavy tubes (5prime, USA), addingan additional ethanol precipitation step (1:10 volumes of
sodium acetate 3 M and 1:3 volumes of ethanol) sup-plemented with 1 μg/μL RNase free glycogen(Fermentas, Switzerland). The purified total RNA wasthen DNase treated using the TURBO DNase Kit(Invitrogen/Ambion, Germany) following the manufac-turer’s instructions. Quantity and quality of isolatedRNA was determined by spectrophotometry with anND-1000 NanoDrop (Labtech Int., East Sussex, UK)and by electrophoresis using 0.5 μg of total RNA in a1% agarose gel. The ratio 260:280 was always morethan 1.9, and an average of ~3 μg of total RNA waspurified from each insert. Complementary DNA(cDNA) synthesis was performed using the AdvantageRT-for-PCR Kit (Clontech, Switzerland) from 1 μg oftotal RNA and applying 500 nM of random hexamerand oligo-dT following the manufacturer’s instruction.Subsequent to the cDNA synthesis, the samples werediluted ten times in nuclease-free water (Sigma-Aldrich,Switzerland) for qPCR analysis. Primers for qPCR weredesigned using Primer-BLAST (http://www.ncbi.nlm.nih.gov/tools/primer-blast/) as detailed in Table 1.Oligonucleotide primers for the target gene ATP1a1(coding for NKA) and the reference gene, elongationfactor 1 alpha (EF1α), were used at 0.3 μMwith 1/40 ofthe cDNA synthesis reaction (5 μL of a 1:10 dilution)and 10 μL of SYBR Green Premix Taq II (Takara,USA), in a total volume of 20 μL. Each sample wasrun in triplicate using an Applied Biosystems 7500 FastReal-Time PCR System thermocycler. QuantitativePCR cycling conditions were as indicated in the Takarainstruction manual: 1 cycle at 95 °C for 30 s followed by40 cycles at 95 °C for 5 s and 60 °C for 1 min. After 40cycles, a melt curve was generated bymeasuring samplefluorescence during heating from 60 to 95 °C. Thespecificity of reactions was checked by inspecting melt-ing curve profiles and by sequencing of amplicons froma random selection of samples. Determination of ampli-fication efficiencies was measured using a dilution se-ries of a pool of cDNA samples. All amplificationefficiencies were over 93%. Quantification wasachieved by a parallel set of reactions containing stan-dards consisting of serial dilution of spectrophotometri-cally determined, linearized plasmid containing theabove-mentioned cDNA sequences. Cloning of PCRproducts was achieved using the TOPO® TA Cloning®Kits (Invitrogen, UK). Normalization of copy numberacross biological samples was achieved by dividing thecopy number of the target gene ATP1a1 to the copynumber of the reference gene EF1α. To confirm cDNA
544 Cell Biol Toxicol (2017) 33:539–555

sequences, sequencing was performed using a Beckman8800 autosequencer, and the Lasergene SeqMan soft-ware (DNASTAR) was used to edit and assemble DNAsequences.
Response of cells to buffers mimicking saltwateror freshwater
To test if cells would sustain exposure to medium thatmore closely reflects the milieu of the intestinal lumen,L-15/FBS culture medium in the apical compartmentwas replaced by L-15/ex. This is a simplified version ofthe complete L-15 culture medium: it contains only thesalts, galactose and pyruvate of the original mediumcomposition (Schirmer et al. 1997; Table 2).
To specifically explore how cells respond to fresh-water vs. seawater conditions, buffers were prepared tomimic luminal and extracellular fluids of fish in vivoacclimating to SW and FW according to Genz et al.(2011) (Table 2). While the FW buffer is very similarto L-15 medium in terms of salt composition, the SWmedium has 2.2-fold less sodium and 41 and 3.4 moremagnesium and calcium, respectively. The cell layerwas established in complete media under symmetricalconditions on inserts for 3 weeks as described previous-ly. The two buffers were then added to the apical com-partment whereas the basolateral compartment wasmaintained with complete medium.
Response of cells to silver ion exposure
Exposure The response to AgNO3 exposure was evalu-ated in confluent conventional cell monolayers in 24-well plates (seeded at 62,500 cells/cm2 and incubatedfor 48 h prior to exposure) and in cells grown in0.33 cm2 (24-well) inserts as described previously. Todetermine toxicity of AgNO3, cells were washed twicewith PBS. Then, 1000 or 300 μL of AgNO3, dissolvedat concentrations ranging from 0.08 to 50 μM in L-15/
ex, were applied to cells in the wells or inserts, respec-tively. L-15/ex was also used in the bottom compart-ment of the insert (symmetrical conditions). Symmetri-cal conditions with protein-free media were chosen toavoid scavenging of silver ions by medium proteins(Minghetti and Schirmer 2016). Cells were incubatedfor 24 h at 19 °C in the dark. Following exposure, cellviability was assessed as described previously andexpressed as percentage of non-exposed controls.
Cell internal metal accumulation Intracellular silverconcentrations were measured by ICP-MS (Element 2high-resolution sector field ICP-MS, Thermo Finnigan,Germany). Thus, RTgutGC cells were seeded as de-scribed above in six-well plate inserts (4.52 cm2, 3 mLvolume) or in wells of six-well plates to achieve aconventional monolayer. Cells were exposed to400 nM AgNO3 in L-15/ex for 24 h. This concentra-tion was chosen to be sufficiently high for ICP-MSanalysis and sufficiently low to maintain cell viabilitywithin 100 ± 3% as assessed by Alamar Blue. Toensure removal of loosely bound silver, cells were thenwashed twice with a solution of 0.5 mM cysteine inPBS. Cells were lysed by applying 1 mL of 50 mMNaOH and incubated at room temperature for 2 h. Analiquot of the cell lysate was used for protein quanti-fication using the modified Lowry assay (Thermo Sci-entific, USA) and bovine serum albumin as a standard.For metal determination, samples were desiccatedusing a concentrator (Concentrator plus, Eppendorf,Germany) and digested adding 2 mL of 65% HNO3
and 0.5 mL of 30% H2O2 in a high-performancemicrowave digestion unit (MLS 1200 MEGA, Swit-zerland) at a maximum temperature of 195 °C for20 min. The digest was then diluted 50 times andmeasured. The recovery of AgNO3 was ≥99%. Thereliability of the measurement was determined usingspecific water references (M105A, IFA System,Austria).
Table 1 Primers used for qPCR
Gene name Forward primer 5″→3″ Reverse primer 5″→3″ Repository IDa
ATP1a1 TGTGGCCGTCTTTCTGGGCATG AGCAAATGGTGGAGGTGGAGCC NM_001124459
EF1α ATATCCGTCGTGGCAACGTGGC TGAGCTCGCTGAACTTGCAGGC NM_001124339
aGenBank (http://www.ncbi.nim.nih.gov/)
Cell Biol Toxicol (2017) 33:539–555 545

Data analysis
Unless otherwise indicated, data were analysed andplotted using GraphPad Prism ver. 5.0, San Diego,CA. Statistical analysis methods applied are describedin the corresponding figure legends.
Results
Establishment of a monolayer of intestinal cells
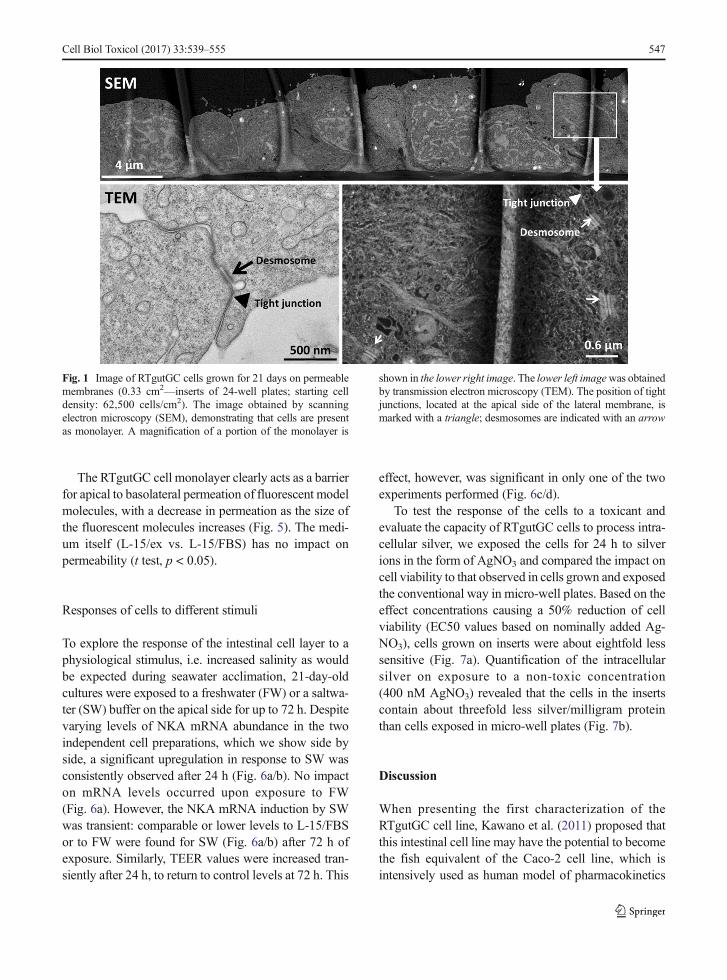
A cell density of 62,500 cells/cm2 and a culture periodof about 21 days with symmetrical culture conditionswere found to consistently yield a dense, single epithe-lial cell layer on the permeable membranes (Fig. 1—SEM image). We also cultured cells for 28 days or evenlonger with similar results, although a double cell layerwas occasionally observed in some locations after≥28 days. We started to measure TEER after the cells
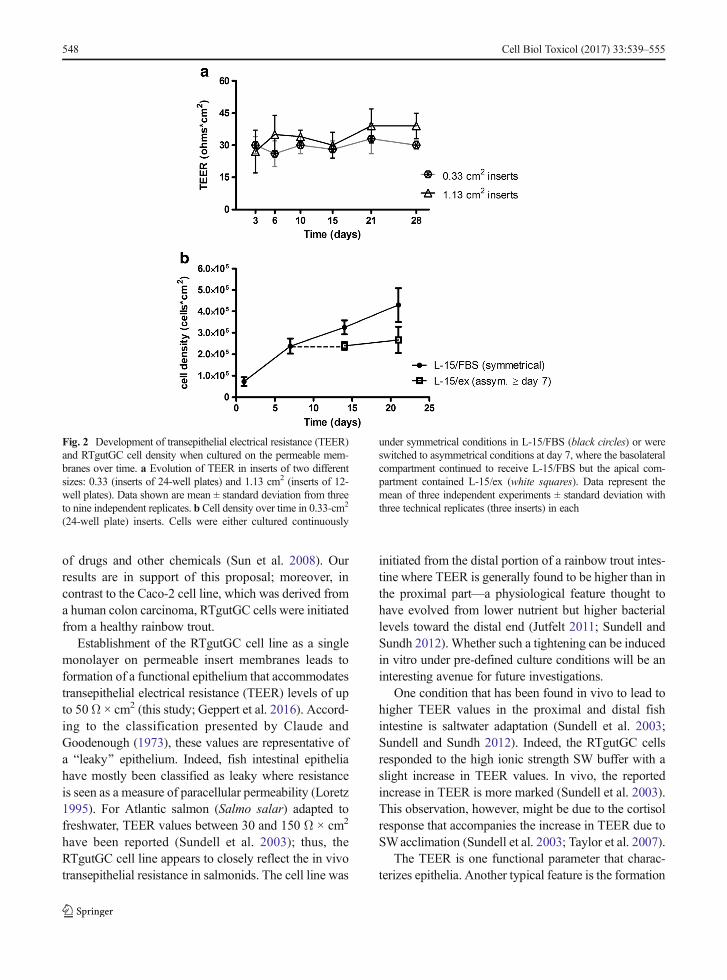
had been in culture for 3 days to first allow the cells toattach and adjust to their new culture environment.TEER values reached between 30 to 50 Ω × cm2
(Fig. 2a, Fig. 6c/d) from 3 to 28 days with little evolu-tion of TEER values over time. Over the same period,cell number increased by about sixfold when monitoredfor up to 21 days (Fig. 2b, black circles). When weexchanged the cell culture medium in the apical cham-ber with the simple buffer, L-15/ex, after the first weekof culture, cells stopped proliferating but remained via-ble (Fig. 2b, white squares). These results demonstratethat the culture system is stable under asymmetricalconditions with a simple buffer apically, which can betaken to more closely resemble the conditions in vivounder food deprivation (Minghetti and Schirmer 2016).
Structural and functional features of the intestinal celllayer
Scanning and transmission electron microscopy analy-ses of RTgutGC cells grown on inserts show the forma-tion of cellular structures involved in cell-cell adhesiontypical of epithelia, namely desmosomes and tight junc-tions (Fig. 1—TEM image). Specific antibody stainingfurther confirms the presence of the tight junction pro-tein ZO-1 (Fig. 3). As illustrated in Fig. 3a, cells polarizeover time: between day one and day 28, ZO-1 proteinsapparently move to the apical side; likewise, f-actindevelops an apical structure co-localizing with ZO-1while basolaterally f-actin stress fibres are present fromday one. This process was confirmed in co-localizationanalysis (Table 3). A side view image moreover revealsthat the cells become taller as the cell layer becomesmore compact: cells increase in height from about 6 μmon day one to about 11 μm within 21 days (Table 3;Fig. 3b).
Polarization of the cells can also be observed basedon the localization of the Na+/K+-ATPase (NKA), whichis expressed basolaterally (Fig. 4a, b), as would beexpected in vivo. Moreover, NKA mRNA abundancelevels in cells cultured on inserts were consistentlydetected, reaching stable levels from about day 15 on(Fig. 4c). We were also able to confirm NKA enzymeactivity in RTgutGC cells, but this required convention-al flask cell culture to obtained sufficient material. Ascan be seen in Fig. 4d, NKA enzyme activity levels areeasily discernible although they are between three to sixtimes lower than in samples of rainbow trout intestineand gill tissue.
Table 2 Composition of the different buffers to create asymmet-rical culture conditions
Inorganic salts and othercomponents (mM)
L-15/exa FWb SWb
NaCl 155 151 69.0
KCl 6.08 3.00 5.00
MgSO4 1.88 0.88 77.5
MgCl2 2.38 22.5
CaCl2 1.44 1.00 5.00
NaHPO4 1.52 0.50
KH2PO4 0.50 0.50
NaHCO3 5.00
Glucose 5.00
Galactose 5.70
Pyruvate 5.70
HEPES (free acid) 3.00
HEPES (Na salt) 3.00
Ionic strengthb (mmol/kg) 173 158 289
Osmolality (mmol/kg) 354 339 283
pH 7.2 7.6 7.6
a According to Schirmer et al. (1997)b Freshwater (FW), saltwater (SW): these buffer compositionswere chosen to reflect the luminal composition after exposure offish in freshwater or saltwater on the basis of Genz et al. (2011)c Ionic strength was calculated using the software VisualMINTEQ. Osmolality was measured using an osmometer (Vapro5600, Wescor, USA)
546 Cell Biol Toxicol (2017) 33:539–555
The RTgutGC cell monolayer clearly acts as a barrierfor apical to basolateral permeation of fluorescent modelmolecules, with a decrease in permeation as the size ofthe fluorescent molecules increases (Fig. 5). The medi-um itself (L-15/ex vs. L-15/FBS) has no impact onpermeability (t test, p < 0.05).
Responses of cells to different stimuli
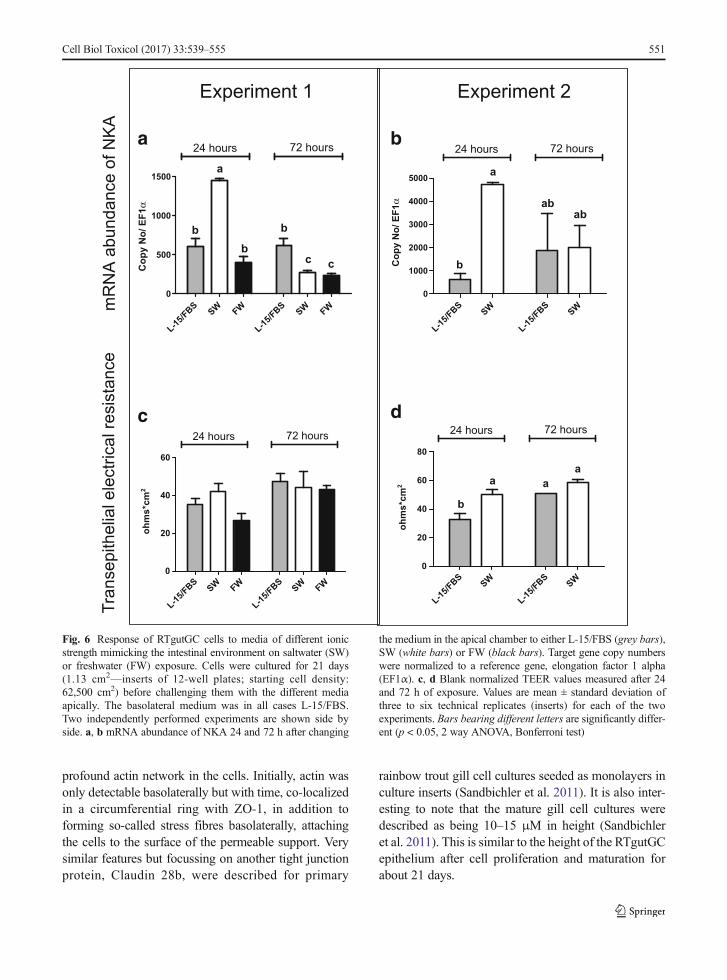
To explore the response of the intestinal cell layer to aphysiological stimulus, i.e. increased salinity as wouldbe expected during seawater acclimation, 21-day-oldcultures were exposed to a freshwater (FW) or a saltwa-ter (SW) buffer on the apical side for up to 72 h. Despitevarying levels of NKA mRNA abundance in the twoindependent cell preparations, which we show side byside, a significant upregulation in response to SW wasconsistently observed after 24 h (Fig. 6a/b). No impacton mRNA levels occurred upon exposure to FW(Fig. 6a). However, the NKA mRNA induction by SWwas transient: comparable or lower levels to L-15/FBSor to FW were found for SW (Fig. 6a/b) after 72 h ofexposure. Similarly, TEER values were increased tran-siently after 24 h, to return to control levels at 72 h. This
effect, however, was significant in only one of the twoexperiments performed (Fig. 6c/d).
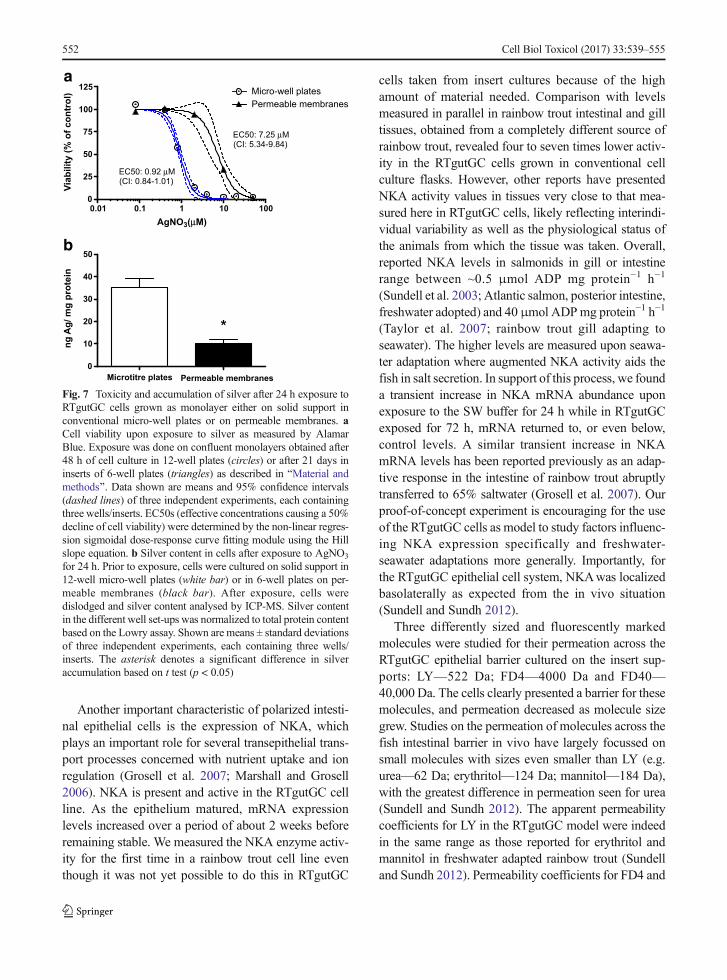
To test the response of the cells to a toxicant andevaluate the capacity of RTgutGC cells to process intra-cellular silver, we exposed the cells for 24 h to silverions in the form of AgNO3 and compared the impact oncell viability to that observed in cells grown and exposedthe conventional way in micro-well plates. Based on theeffect concentrations causing a 50% reduction of cellviability (EC50 values based on nominally added Ag-NO3), cells grown on inserts were about eightfold lesssensitive (Fig. 7a). Quantification of the intracellularsilver on exposure to a non-toxic concentration(400 nM AgNO3) revealed that the cells in the insertscontain about threefold less silver/milligram proteinthan cells exposed in micro-well plates (Fig. 7b).
Discussion
When presenting the first characterization of theRTgutGC cell line, Kawano et al. (2011) proposed thatthis intestinal cell line may have the potential to becomethe fish equivalent of the Caco-2 cell line, which isintensively used as human model of pharmacokinetics
Fig. 1 Image of RTgutGC cells grown for 21 days on permeablemembranes (0.33 cm2—inserts of 24-well plates; starting celldensity: 62,500 cells/cm2). The image obtained by scanningelectron microscopy (SEM), demonstrating that cells are presentas monolayer. A magnification of a portion of the monolayer is
shown in the lower right image. The lower left imagewas obtainedby transmission electron microscopy (TEM). The position of tightjunctions, located at the apical side of the lateral membrane, ismarked with a triangle; desmosomes are indicated with an arrow
Cell Biol Toxicol (2017) 33:539–555 547
of drugs and other chemicals (Sun et al. 2008). Ourresults are in support of this proposal; moreover, incontrast to the Caco-2 cell line, which was derived froma human colon carcinoma, RTgutGC cells were initiatedfrom a healthy rainbow trout.
Establishment of the RTgutGC cell line as a singlemonolayer on permeable insert membranes leads toformation of a functional epithelium that accommodatestransepithelial electrical resistance (TEER) levels of upto 50Ω × cm2 (this study; Geppert et al. 2016). Accord-ing to the classification presented by Claude andGoodenough (1973), these values are representative ofa Bleaky^ epithelium. Indeed, fish intestinal epitheliahave mostly been classified as leaky where resistanceis seen as a measure of paracellular permeability (Loretz1995). For Atlantic salmon (Salmo salar) adapted tofreshwater, TEER values between 30 and 150 Ω × cm2
have been reported (Sundell et al. 2003); thus, theRTgutGC cell line appears to closely reflect the in vivotransepithelial resistance in salmonids. The cell line was
initiated from the distal portion of a rainbow trout intes-tine where TEER is generally found to be higher than inthe proximal part—a physiological feature thought tohave evolved from lower nutrient but higher bacteriallevels toward the distal end (Jutfelt 2011; Sundell andSundh 2012). Whether such a tightening can be inducedin vitro under pre-defined culture conditions will be aninteresting avenue for future investigations.
One condition that has been found in vivo to lead tohigher TEER values in the proximal and distal fishintestine is saltwater adaptation (Sundell et al. 2003;Sundell and Sundh 2012). Indeed, the RTgutGC cellsresponded to the high ionic strength SW buffer with aslight increase in TEER values. In vivo, the reportedincrease in TEER is more marked (Sundell et al. 2003).This observation, however, might be due to the cortisolresponse that accompanies the increase in TEER due toSWacclimation (Sundell et al. 2003; Taylor et al. 2007).
The TEER is one functional parameter that charac-terizes epithelia. Another typical feature is the formation
Fig. 2 Development of transepithelial electrical resistance (TEER)and RTgutGC cell density when cultured on the permeable mem-branes over time. a Evolution of TEER in inserts of two differentsizes: 0.33 (inserts of 24-well plates) and 1.13 cm2 (inserts of 12-well plates). Data shown are mean ± standard deviation from threeto nine independent replicates. b Cell density over time in 0.33-cm2
(24-well plate) inserts. Cells were either cultured continuously
under symmetrical conditions in L-15/FBS (black circles) or wereswitched to asymmetrical conditions at day 7, where the basolateralcompartment continued to receive L-15/FBS but the apical com-partment contained L-15/ex (white squares). Data represent themean of three independent experiments ± standard deviation withthree technical replicates (three inserts) in each
548 Cell Biol Toxicol (2017) 33:539–555

of tight junction proteins. To regulate transepithelialtransport, tight junctions are located apically in themature epithelium. Indeed, apical localization was con-firmed in RTgutGC cells by electronmicroscopy as wellas by antibody-based staining of the tight junction pro-tein ZO-1. Apical localization of ZO-1 by immunocy-tochemistry has previously been demonstrated in prima-ry rainbow trout gill epithelia likewise grown on com-mercially available permeable membranes (Schnell et al.2016; Walker et al. 2007). Movement of the ZO-1protein was seen in the RTgutGC epithelium over time:while it was not detectable apically on day one, apicalsignals increased, reaching a maximum within 21 days.In further support of the maturation of a polarized epi-thelium in vitro, we observed the development of a
Fig. 3 Immunocytochemicalanalysis of RTgutGC cells grownfor 1 and 28 days on permeablemembranes (0.33 cm2—inserts of24-well plates; starting celldensity: 62,500 cm2). Followingfixation and permeabilization,cells were stained to highlightimportant cellular features: tightjunctions (ZO-1 conjugated withAlexa Fluor 488; green), f-actin(Rhodamine phalloidin; red) andnuclei (DAPI; blue). Apical andbasolateral images were obtainedvia Z-stack (a). Side view (b) wasgenerated analysing Z-stacksusing the Imaris software(Bitplane, v. 7.7) for 3Drendering. Scale bar is 10 μm.Cells were imaged using a LeicaSP5 confocal microscope
Table 3 Co-localization of f-actin and ZO-1 and Z-dimensionover time
Time(days)
Max %co-localizationZO-1/f-actina
Z-dimensiona
(μm)
1 10.9 ± 2.8 6.0 ± 1.2
3 15.2 ± 10.3 8.4 ± 1.4
6 14.8 ± 3.7 9.9 ± 0.5
10 18.8 ± 7.6 9.9 ± 1.9
15 31.7 ± 10.4 9.7 ± 0.4
21 56.4 ± 12.7 11.4 ± 1.7
28 55.9 ± 7.9 11.0 ± 0.7
a Values are means ± SD of five fields of view (FOV:5337 ± 350 μm2 ) obtained using the Leica software LAS AF v.2.6.3 (see also Fig. 3)
Cell Biol Toxicol (2017) 33:539–555 549
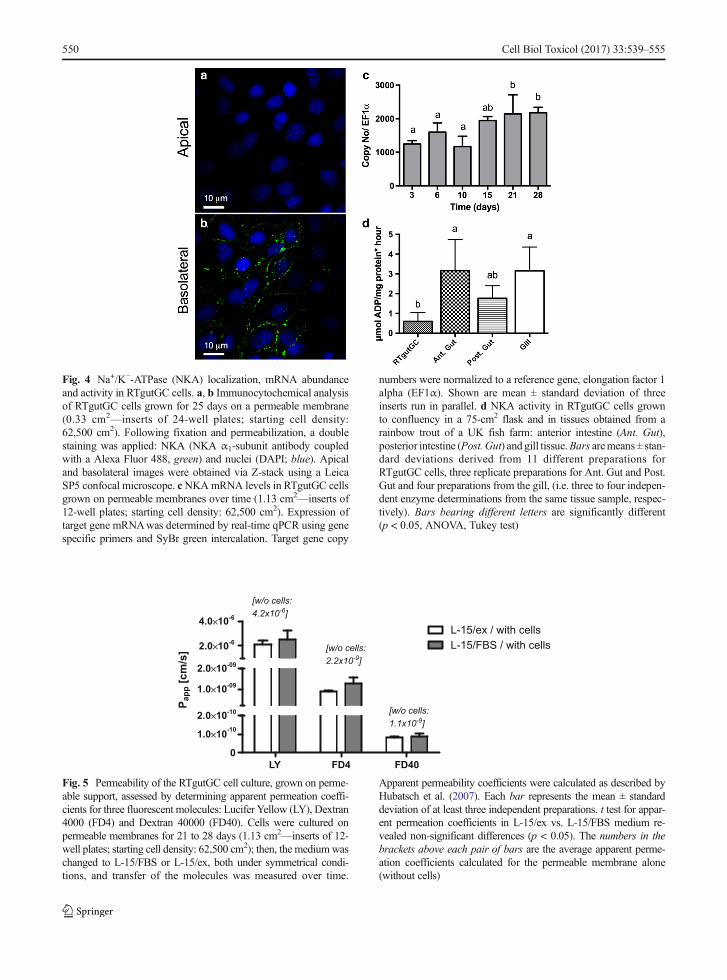
Fig. 4 Na+/K−-ATPase (NKA) localization, mRNA abundanceand activity in RTgutGC cells. a, b Immunocytochemical analysisof RTgutGC cells grown for 25 days on a permeable membrane(0.33 cm2—inserts of 24-well plates; starting cell density:62,500 cm2). Following fixation and permeabilization, a doublestaining was applied: NKA (NKA α1-subunit antibody coupledwith a Alexa Fluor 488, green) and nuclei (DAPI; blue). Apicaland basolateral images were obtained via Z-stack using a LeicaSP5 confocal microscope. cNKAmRNA levels in RTgutGC cellsgrown on permeable membranes over time (1.13 cm2—inserts of12-well plates; starting cell density: 62,500 cm2). Expression oftarget gene mRNAwas determined by real-time qPCR using genespecific primers and SyBr green intercalation. Target gene copy
numbers were normalized to a reference gene, elongation factor 1alpha (EF1α). Shown are mean ± standard deviation of threeinserts run in parallel. d NKA activity in RTgutGC cells grownto confluency in a 75-cm2 flask and in tissues obtained from arainbow trout of a UK fish farm: anterior intestine (Ant. Gut),posterior intestine (Post. Gut) and gill tissue.Bars aremeans± stan-dard deviations derived from 11 different preparations forRTgutGC cells, three replicate preparations for Ant. Gut and Post.Gut and four preparations from the gill, (i.e. three to four indepen-dent enzyme determinations from the same tissue sample, respec-tively). Bars bearing different letters are significantly different(p < 0.05, ANOVA, Tukey test)
LY FD4 FD40
0
1.0×10⁻¹⁰
2.0×10⁻¹⁰
1.0×10-09
2.0×10-09
2.0×10⁻⁶
4.0×10⁻⁶
L-15/ex / with cells
L-15/FBS / with cells
[w/o cells:
4.2x10⁻⁶
]
[w/o cells:
2.2x10⁻⁹
]
[w/o cells:
1.1x10⁻⁹
]
Pap
p [c
m/s
]
Fig. 5 Permeability of the RTgutGC cell culture, grown on perme-able support, assessed by determining apparent permeation coeffi-cients for three fluorescent molecules: Lucifer Yellow (LY), Dextran4000 (FD4) and Dextran 40000 (FD40). Cells were cultured onpermeable membranes for 21 to 28 days (1.13 cm2—inserts of 12-well plates; starting cell density: 62,500 cm2); then, the mediumwaschanged to L-15/FBS or L-15/ex, both under symmetrical condi-tions, and transfer of the molecules was measured over time.
Apparent permeability coefficients were calculated as described byHubatsch et al. (2007). Each bar represents the mean ± standarddeviation of at least three independent preparations. t test for appar-ent permeation coefficients in L-15/ex vs. L-15/FBS medium re-vealed non-significant differences (p < 0.05). The numbers in thebrackets above each pair of bars are the average apparent perme-ation coefficients calculated for the permeable membrane alone(without cells)
550 Cell Biol Toxicol (2017) 33:539–555
profound actin network in the cells. Initially, actin wasonly detectable basolaterally but with time, co-localizedin a circumferential ring with ZO-1, in addition toforming so-called stress fibres basolaterally, attachingthe cells to the surface of the permeable support. Verysimilar features but focussing on another tight junctionprotein, Claudin 28b, were described for primary
rainbow trout gill cell cultures seeded as monolayers inculture inserts (Sandbichler et al. 2011). It is also inter-esting to note that the mature gill cell cultures weredescribed as being 10–15 μM in height (Sandbichleret al. 2011). This is similar to the height of the RTgutGCepithelium after cell proliferation and maturation forabout 21 days.
L-1
5/F
BS
SW
FW
L-1
5/F
BS
SW
FW
0
500
1000
1500
24 hours 72 hours
a
b
b
b
cc
L-1
5/F
BS
SW
L-1
5/F
BS
SW
0
1000
2000
3000
4000
5000
24 hours 72 hours
a
b
ab
ab
L-1
5/F
BS
SW
FW
L-1
5/F
BS
SW
FW
0
20
40
60
24 hours 72 hours
Experiment 1 Experiment 2
ba
c d
L-1
5/F
BS
L-1
5/F
BS
SW
0
20
40
60
80
24 hours 72 hours
b
a a
a
Co
py N
o/ E
F1
αo
hm
s*c
m2
SW
oh
ms
*c
m2
Transepithelial ele
ctr
ical resis
tance
mR
NA
abundance o
f N
KA
Co
py
N
o/ E
F1
α
Fig. 6 Response of RTgutGC cells to media of different ionicstrength mimicking the intestinal environment on saltwater (SW)or freshwater (FW) exposure. Cells were cultured for 21 days(1.13 cm2—inserts of 12-well plates; starting cell density:62,500 cm2) before challenging them with the different mediaapically. The basolateral medium was in all cases L-15/FBS.Two independently performed experiments are shown side byside. a, b mRNA abundance of NKA 24 and 72 h after changing
the medium in the apical chamber to either L-15/FBS (grey bars),SW (white bars) or FW (black bars). Target gene copy numberswere normalized to a reference gene, elongation factor 1 alpha(EF1α). c, d Blank normalized TEER values measured after 24and 72 h of exposure. Values are mean ± standard deviation ofthree to six technical replicates (inserts) for each of the twoexperiments. Bars bearing different letters are significantly differ-ent (p < 0.05, 2 way ANOVA, Bonferroni test)
Cell Biol Toxicol (2017) 33:539–555 551
Another important characteristic of polarized intesti-nal epithelial cells is the expression of NKA, whichplays an important role for several transepithelial trans-port processes concerned with nutrient uptake and ionregulation (Grosell et al. 2007; Marshall and Grosell2006). NKA is present and active in the RTgutGC cellline. As the epithelium matured, mRNA expressionlevels increased over a period of about 2 weeks beforeremaining stable. We measured the NKA enzyme activ-ity for the first time in a rainbow trout cell line eventhough it was not yet possible to do this in RTgutGC
cells taken from insert cultures because of the highamount of material needed. Comparison with levelsmeasured in parallel in rainbow trout intestinal and gilltissues, obtained from a completely different source ofrainbow trout, revealed four to seven times lower activ-ity in the RTgutGC cells grown in conventional cellculture flasks. However, other reports have presentedNKA activity values in tissues very close to that mea-sured here in RTgutGC cells, likely reflecting interindi-vidual variability as well as the physiological status ofthe animals from which the tissue was taken. Overall,reported NKA levels in salmonids in gill or intestinerange between ~0.5 μmol ADP mg protein−1 h−1
(Sundell et al. 2003; Atlantic salmon, posterior intestine,freshwater adopted) and 40μmol ADPmg protein−1 h−1
(Taylor et al. 2007; rainbow trout gill adapting toseawater). The higher levels are measured upon seawa-ter adaptation where augmented NKA activity aids thefish in salt secretion. In support of this process, we founda transient increase in NKA mRNA abundance uponexposure to the SW buffer for 24 h while in RTgutGCexposed for 72 h, mRNA returned to, or even below,control levels. A similar transient increase in NKAmRNA levels has been reported previously as an adap-tive response in the intestine of rainbow trout abruptlytransferred to 65% saltwater (Grosell et al. 2007). Ourproof-of-concept experiment is encouraging for the useof the RTgutGC cells as model to study factors influenc-ing NKA expression specifically and freshwater-seawater adaptations more generally. Importantly, forthe RTgutGC epithelial cell system, NKAwas localizedbasolaterally as expected from the in vivo situation(Sundell and Sundh 2012).
Three differently sized and fluorescently markedmolecules were studied for their permeation across theRTgutGC epithelial barrier cultured on the insert sup-ports: LY—522 Da; FD4—4000 Da and FD40—40,000 Da. The cells clearly presented a barrier for thesemolecules, and permeation decreased as molecule sizegrew. Studies on the permeation of molecules across thefish intestinal barrier in vivo have largely focussed onsmall molecules with sizes even smaller than LY (e.g.urea—62 Da; erythritol—124 Da; mannitol—184 Da),with the greatest difference in permeation seen for urea(Sundell and Sundh 2012). The apparent permeabilitycoefficients for LY in the RTgutGC model were indeedin the same range as those reported for erythritol andmannitol in freshwater adapted rainbow trout (Sundelland Sundh 2012). Permeability coefficients for FD4 and
0.01 0.1 1 10 100
0
25
50
75
100
125
Permeable membranes
Micro-well plates
AgNO3(μM)
Via
bility
(%
o
f c
on
tro
l)
Microtitre plates Permeable membranes
0
10
20
30
40
50
*
ng
Ag
/ m
g p
ro
te
in
EC50: 0.92 μM
(CI: 0.84-1.01)
EC50: 7.25 μM
(CI: 5.34-9.84)
a
b
Fig. 7 Toxicity and accumulation of silver after 24 h exposure toRTgutGC cells grown as monolayer either on solid support inconventional micro-well plates or on permeable membranes. aCell viability upon exposure to silver as measured by AlamarBlue. Exposure was done on confluent monolayers obtained after48 h of cell culture in 12-well plates (circles) or after 21 days ininserts of 6-well plates (triangles) as described in BMaterial andmethods^. Data shown are means and 95% confidence intervals(dashed lines) of three independent experiments, each containingthree wells/inserts. EC50s (effective concentrations causing a 50%decline of cell viability) were determined by the non-linear regres-sion sigmoidal dose-response curve fitting module using the Hillslope equation. b Silver content in cells after exposure to AgNO3
for 24 h. Prior to exposure, cells were cultured on solid support in12-well micro-well plates (white bar) or in 6-well plates on per-meable membranes (black bar). After exposure, cells weredislodged and silver content analysed by ICP-MS. Silver contentin the different well set-ups was normalized to total protein contentbased on the Lowry assay. Shown are means ± standard deviationsof three independent experiments, each containing three wells/inserts. The asterisk denotes a significant difference in silveraccumulation based on t test (p < 0.05)
552 Cell Biol Toxicol (2017) 33:539–555

FD40 where about three orders of magnitude lower forcompared to LY. The small difference observed in per-meation of FD4 and FD40 indicates that there is a sizecut-off for permeation. Opposite to permeation of nano-particles (Geppert et al. 2016), the pore size of theculture membrane is unlikely to restrict permeation:the 40,000 Da dextran molecule is estimated to be about9 nm in diameter (see Sigma product description)whereas the pores of the PET permeable membraneare 400 nm in diameter. The dextran size is about 20-fold larger than the frequently reported junctional poresize of 0.4 nm in human-derived cells (Watson et al.2005), which would suggest transcellular permeation ofFD4/40 molecules across the RTgutGC barrier. Thespecific junctional pore size in the RTgutGC model orin the fish intestine in vivo is not yet known; as well,pore size alone did not explain differences intransepithelial resistance in the human-derived Caco2/T84 cells (Watson et al. 2001). The RTgutGC cellbarrier model therefore offers new opportunities to studythe regulation of junctional proteins and associated per-meation processes under physiological or toxicologicalconditions with a focus on fish.
Indeed, one of the areas of exploitation of theRTgutGC intestinal model is in environmental toxicol-ogy. Our results demonstrate that cells cultured on thepermeable membrane are more tolerant to silver ionexposure than cells cultured on regular, solid culturesupport. One could argue that the greater resistance,i.e. lower sensitivity to silver ion exposure, might bedue to a greater cell density on the inserts, where cellswere cultured over 21 days compared to 48 h in con-ventional culture wells. Thus, less silver per cell mightper se be available. However, to account for this possi-bility, we normalized the levels of silver measured in thecells to total protein in the different culture set-ups. Onthis basis, cells on inserts showed significantly lowerintracellular silver accumulation. We therefore proposethat these cells are better able to eliminate silver. Silveris known to hijack copper transporters (Behra et al.2013). The main copper excretory protein, the Cu-ATPase ATP7A, is expressed and functionsbasolaterally in polarized epithelial cells in mammals(Lutsenko et al. 2008). In this way, the polarizedRTgutGC cells may be more effective in removingsilver into the basolateral space. Although we couldnot localize ATP7A in RTgutGC due to the lack of afish specific antibody, the ATP7A gene is present in fishas well as other vertebrates (Minghetti et al. 2010).
Basolateral localization of the NKA indicates the possi-bility that other ATPases would localize basolaterallyallowing a more efficient metal homeostasis.
In conclusion, we here present development andinitial characterization of the first in vitro intestinalbarrier model for fish. Built from a cell line derivedfrom the intestine of a rainbow trout (Kawano et al.2011), this model offers many new opportunities formechanistic investigations into the roles and functionsof the intestine in fish. We demonstrate several keyfeatures that match the characteristics of the fish intesti-nal epithelium in vivo, such as the extent oftransepithelial electrical resistance and the typical local-ization of proteins featuring polarization of the epithelialcells, clearly observed within 21 culture days. A focusfor further model development could be to attempt thestimulation of microvilli formation and the characteri-zation of mucus production. However, as it stands al-ready now, this model holds promise to address a varietyof processes that is difficult to disentangle in vivo, suchas cellular mechanisms of physiological and pathologi-cal responses, immune function, nutrient uptake andability of intestinal cells to act as a barrier for toxicants.
Acknowledgements M.M. was funded by a Marie Curie Fel-lowship (IEF, No 275135). The authors wish to thank DavidKistler (Utox, Eawag) for technical assistance in ICP-MS mea-surements, Dr. Anne Greet Bittermann and Stephan Handschin(ETHZ) for assistance in electron microscopy and Dr. John Taylor(University of Stirling) for trout tissue samples and help setting upthe NKA activity assay.
Open Access This article is distributed under the terms of theCreative Commons Attribution 4.0 International License (http://creativecommons.org/licenses/by/4.0/), which permits unrestrict-ed use, distribution, and reproduction in any medium, providedyou give appropriate credit to the original author(s) and the source,provide a link to the Creative Commons license, and indicate ifchanges were made.
References
Behra R, Sigg L, Clift MJD, Herzog F, Minghetti M, Johnston B,Petri-Fink A, Rothen RB. Bioavailability of silver nanoparticlesand ions: from a chemical and biochemical perspective. J R SocInterface. 2013;10:20130396. doi:10.1098/rsif.2013.0396.
Burke J, Handy RD. Sodium-sensitive and -insensitive copperaccumulation by isolated intestinal cells of rainbow troutOncorhynchus mykiss. J Exp Biol. 2005;208(Pt 2):391–407.
Bury NR, Schnell S, Hogstrand C. Gill cell culture systems asmodels for aquatic environmental monitoring. J Exp Biol.2014;217:639–50.
Cell Biol Toxicol (2017) 33:539–555 553
Claude P, Goodenough DA. Fracture faces of zonulae occludentesfrom Btight^ and Bleaky^ epithelia. The Journal of Cell Biol.1973;58:390–400.
Clevers H. The intestinal crypt, a prototype stem cell compartment.Cell. 2013;154:274–84. doi:10.1016/j.cell.2013.07.004.
Ganassin RC, Schirmer K, Bols NC. Experimental models: cell/tissue cultures—methods for the use of fish cell and tissueculture as model systems in basic and toxicology research. In:Bullock G, Bunton TE, Ostrander G, editors. The handbookof experimental animals, laboratory fish. San Diego:Academic Press; 2000 .Chapter 38
Genz J, EsbaughAJ, GrosellM. Intestinal transport following transferto increased salinity in an anadromous fish (Oncorhynchusmykiss). Comp Biochem Physiol A Mol Integr Physiol.2011;159:150–8. doi:10.1016/j.cbpa.2011.02.011.
Geppert M, Sigg L, Schirmer K. A novel two-compartment barriermodel for investigating nanoparticle transport in fish intesti-nal epithelial cells. Environmental Science: Nano. 2016;3(2):388–95.
Grosell M, Gilmour KM, Perry SF. Intestinal carbonic anhydrase,bicarbonate, and proton carriers play a role in the acclimationof rainbow trout to seawater. Am. J. Physiol. Regul. Integr.Comp Physiol. 2007;293:2099–111. doi:10.1152/ajpregu.00156.2007.
Grosell M, Grosell M, Farrell AP, Brauner CJ. Themultifunctionalgut of fish. Amsterdam: Elsevier; 2011.
Handy RD, Musonda MM, Phillips C, Falla SJ. Mechanisms ofgastrointestinal copper absorption in the African walkingcatfish: copper dose-effects and a novel anion-dependentpathway in the intestine. J Exp Biol. 2000;203:2365–77.
Hogstrand C,WoodCM, BuryNR,Wilson RW, Rankin JC, GrosellM. Binding andmovement of silver in the intestinal epitheliumof a marine teleost fish, the European flounder (Platichthysflesus). Comp. Biochem. Physiol.—C Toxicol Pharmacol.2002;133:125–35. doi:10.1016/S1532-0456(02)00102-3.
Hubatsch I, Ragnarsson EGE, Artursson P. Determination of drugpermeability and prediction of drug absorption in Caco-2monolayers. Nat Protoc. 2007;2:2111–9.
Jutfelt F. Barrier function of the gut. Encyclopedia of FishPhysiology 2011. 2011;2:1322–31.
Kawano A, Haiduk C, Schirmer K, Hanner R, Lee LEJ, Dixon B,Bols NC. Development of a rainbow trout intestinal epithelialcell line and its response to lipopolysaccharide. Aquat Nutr.2011;17:e241–52. doi:10.1111/j.1365-2095.2010.00757.x.
Kültz D. Physiological mechanisms used by fish to cope withsalinity stress. J Exp Biol. 2015;218:1907–14. doi:10.1242/jeb.118695.
Kwong RWM, Niyogi S. The interactions of iron with otherdivalent metals in the intestinal tract of a freshwater teleost,rainbow trout (Oncorhynchus mykiss). Comp BiochemPhysiol—C Toxicol Pharmacol. 2009;150:442–9.doi:10.1016/j.cbpc.2009.06.011.
Kwong RW, Niyogi S. Cadmium transport in isolated enterocytes offreshwater rainbow trout: interactions with zinc and iron, ef-fects of complexation with cysteine, and an ATPase-coupledefflux. Comp Biochem Physiol C Toxicol Pharmacol.2012;155(2):238–46. doi:10.1016/j.cbpc.2011.09.001.
Loretz CA. Electrophysiology of ion transport in teleost intestinalcells. In: Chris MW, Trevor JS, editors. Fish physiology. SanDiego: AcademicPress; 1995. p. 25–56.
Lutsenko S, Gupta A, Burkhead JL, Zuzel V. Cellular multitask-ing: the dual role of human Cu-ATPases in cofactor deliveryand intracellular copper balance. Arch Biochem Biophys.2008;476:22–32.
Marshall WS, Grosell M. Ion transport, osmoregulation, and acid–base balance. In: Evans DH, Claiborne JB, editors. Thephysiology of fishes. Boca Raton: CRC Press Inc.; 2006. p.177–230.
McCormick SD. Methods for nonlethal gill biopsy and measure-ment of Na+, K+-ATPase activity. Can J Fish Aquat Sci.1993;50:656–8.
Minghetti M, Schirmer K. Effect of media composition on bio-availability and toxicity of silver and silver nanoparticles infish intestinal cells (RTgutGC). Nanotoxicology. 2016;doi:10.1080/17435390.2016.1241908.
Minghetti M, Leaver MJ, George SG. Multiple Cu ATPase genesare differentially expressed and transcriptionally regulated byCu exposure in sea bream, Sparus aurata. Aquat Toxicol.2010;97:23–33.
O’Brien J, Wilson I, Orton T, Pognan F. Investigation of theAlamar Blue (resazurin) fluorescent dye for the assessmentof mammalian cell cytotoxicity. Eur J Biochem.2000;267(17):5421–6.
Sambuy Y, De Angelis I, Ranaldi G, Scarino ML, Stammati A,Zucco F. The Caco-2 cell line as a model of the intestinalbarrier: influence of cell and culture-related factors on Caco-2cell functional characteristics. Cell Biol Toxicol. 2005;21:1–26.
Sandbichler AM, Egg M, Schwerte T, Pelster B. Claudin 28b andF-actin are involved in rainbow trout gill pavement cell tightjunction remodeling under osmotic stress. J Exp Biol.2011;214:1473–87. doi:10.1242/jeb.050062.
Schirmer K, Chan AGJ, Greenberg BM, Dixon DG, Bols NC.Methodology for demonstrating and measuring thephotocytotoxicity of fluoranthene to fish cells in culture.Toxicol in Vitro. 1997;11(1):107–19.
Schnell S, Stott LC, Hogstrand C, Wood CM, Kelly SP, Pärt P,Owen SF, Bury NR. Procedures for the reconstruction, pri-mary culture and experimental use of rainbow trout gillepithelia. Nat Protoc. 2016;11(3):490–8. doi:10.1038/nprot.2016.029.
Sun H, Chow ECY, Liu S, Du Y, PangSun KS. The Caco-2 cellmonolayer: usefulness and limitations. Expert Opin DrugMetab Toxicol. 2008;4(4):395–411.
Sundell KS, Sundh H. Intestinal fluid absorption in anadromoussalmonids: importance of tight junctions and aquaporins.Front Physiol. 2012;3:388. doi:10.3389/fphys.2012.00388.
Sundell K, Jutfelt F, Olsen R, Sandblom E, Hansen T, BjornssonBT. Intestinal transport mechanisms and plasma cortisollevels during normal and out-of-season parr–smolt transfor-mation of Atlantic salmon, Salmo salar. Aquaculture.2003;222:265–85. doi:10.1016/S0044-8486(03)00127-3.
Sundh H, Nilsen TO, Lindström J, Hasselberg-Frank L,Stefansson SO, McCormick SD, Sundell K. Developmentof intestinal ion-transporting mechanisms duringsmoltification and seawater acclimation in Atlantic salmonSalmo salar. J Fish Biol. 2014;85:1227–52.
Taylor JF, Needham MP, North BP, Morgan A, Thompson K,Migaud H. The influence of ploidy on saltwater adaptation,acute stress response and immune function following seawater
554 Cell Biol Toxicol (2017) 33:539–555
transfer in non-smolting rainbow trout. Gen CompEndocrinol.2007;152:314–25. doi:10.1016/j.ygcen.2007.02.029.
Walker PA, Bury NR, Hogstrand C. Influence of cultureconditions on metal-induced responses in a culturedrainbow trout gill epithelium. Environ Sci Technol.2007;41:6505–13.
Watson CJ, RowlandM,Warhurst G. Functional modeling of tightjunctions in intestinal cell monolayers using polyethylene
glycol oligomers. Am J Physiol Cell Physiol. 2001;281:C388–97.
Watson CJ, Hoare CJ, Garrod DR, Carlson GL, Warhurst G.Interferon-gamma selectively increases epithelial permeabil-ity to large molecules by activating different populations ofparacellular pores. J Cell Sci. 2005;118:5221–30.
Cell Biol Toxicol (2017) 33:539–555 555