Embed Size (px)
Citation preview

A Few More Bubbles
Fin254f: Spring 2010
Lecture notes 2.3-2.4
Readings: Shiller 1-2, Kindleberger and Aliber, 8,
"What Moves Stock Prices"

Outline
The U.S. stock market summary The U.S. real estate market Three recent events
Japan 1980's East Asia 1990's U.S: dot.com 90-2000's
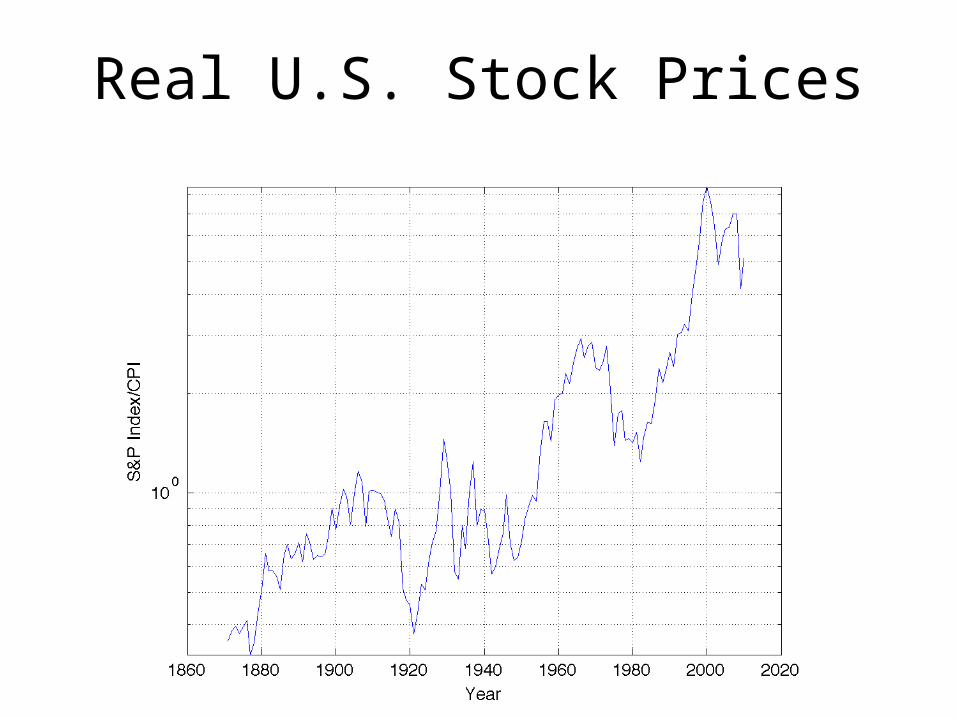
Real U.S. Stock Prices
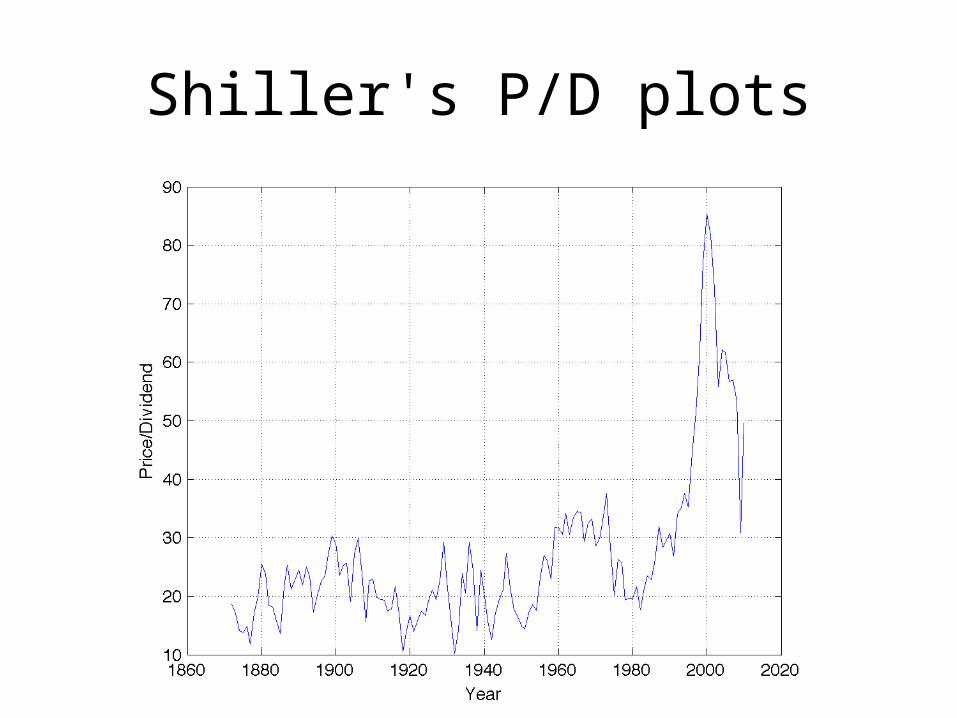
Shiller's P/D plots

and U.S. Price/Earnings Ratio1881-2009
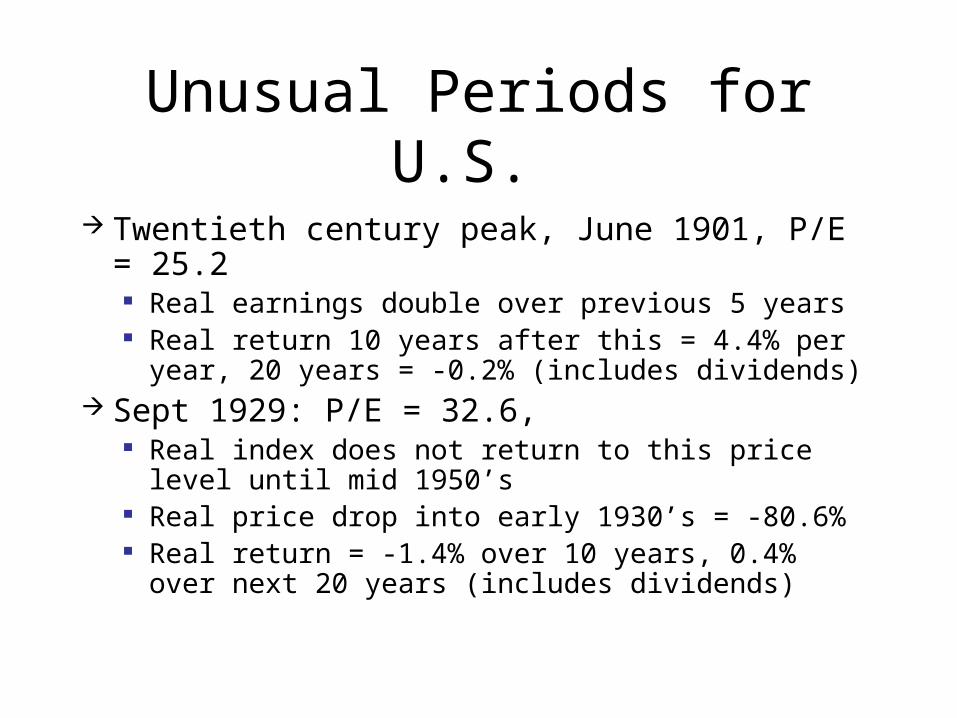
Unusual Periods for U.S.
Twentieth century peak, June 1901, P/E = 25.2 Real earnings double over previous 5 years Real return 10 years after this = 4.4% per year, 20
years = -0.2% (includes dividends) Sept 1929: P/E = 32.6,
Real index does not return to this price level until mid 1950’s
Real price drop into early 1930’s = -80.6% Real return = -1.4% over 10 years, 0.4% over next
20 years (includes dividends)
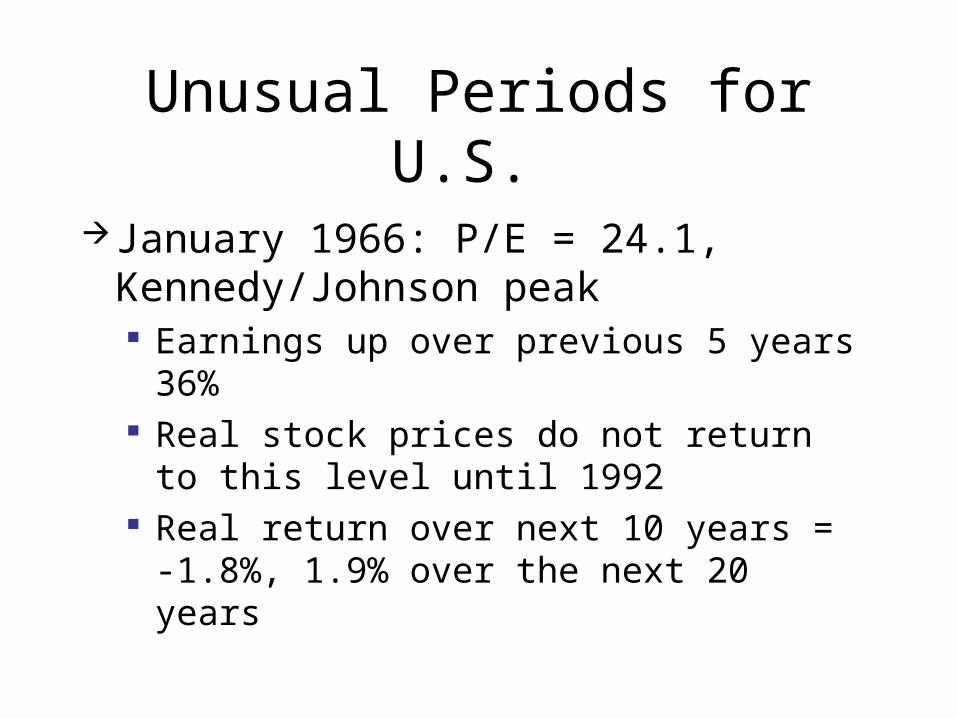
Unusual Periods for U.S.
January 1966: P/E = 24.1, Kennedy/Johnson peak Earnings up over previous 5 years 36% Real stock prices do not return to this level
until 1992 Real return over next 10 years = -1.8%,
1.9% over the next 20 years
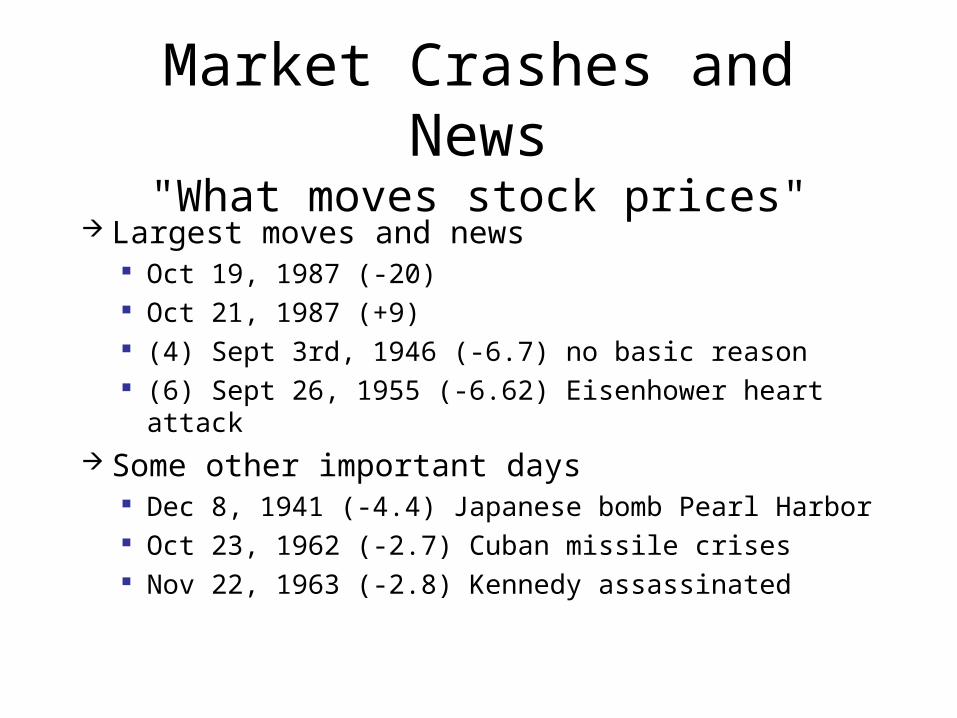
Market Crashes and News"What moves stock prices"
Largest moves and news Oct 19, 1987 (-20) Oct 21, 1987 (+9) (4) Sept 3rd, 1946 (-6.7) no basic reason (6) Sept 26, 1955 (-6.62) Eisenhower heart attack
Some other important days Dec 8, 1941 (-4.4) Japanese bomb Pearl Harbor Oct 23, 1962 (-2.7) Cuban missile crises Nov 22, 1963 (-2.8) Kennedy assassinated
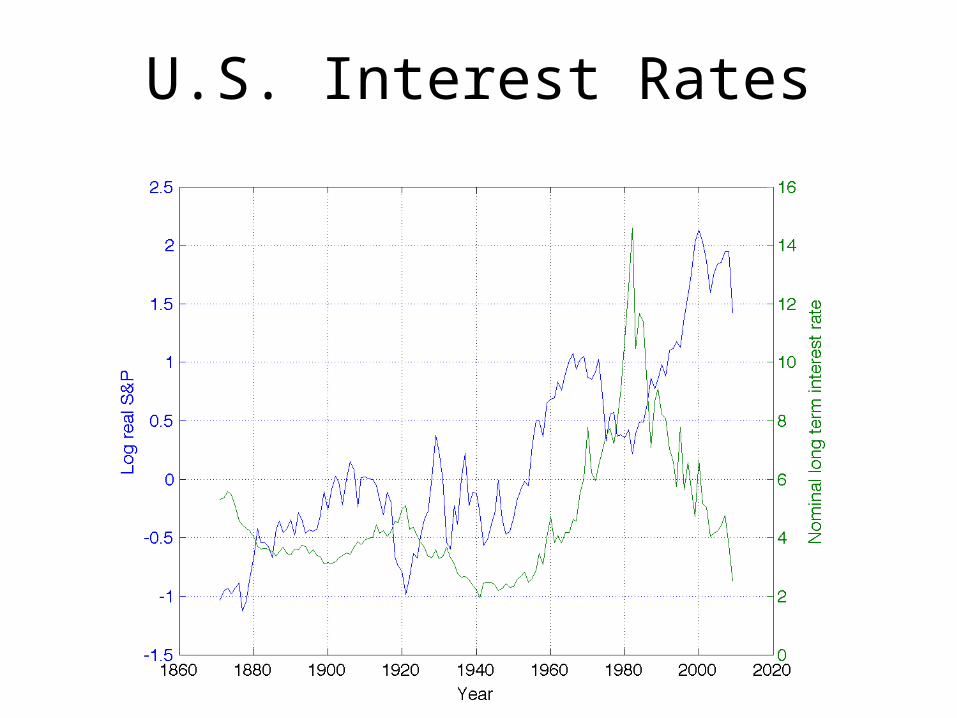
U.S. Interest Rates
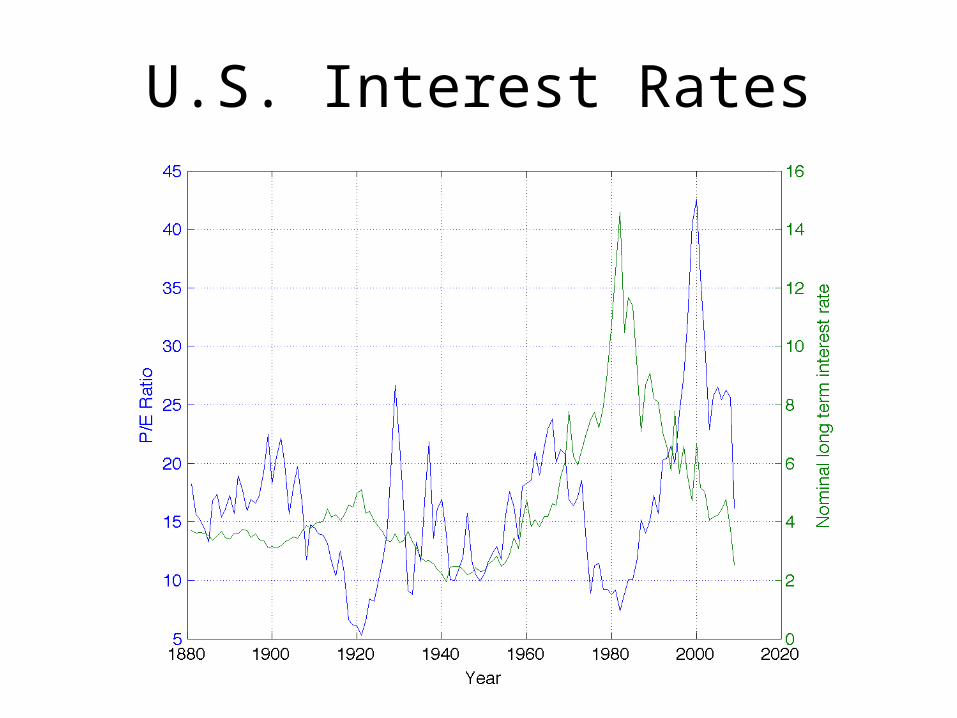
U.S. Interest Rates
U.S. Interest Rates
Few obvious movements with stock prices
International Comovements
Figure 1.2
Outline
The U.S. stock market summary The U.S. real estate market Three recent events
Japan 1980's East Asia 1990's U.S: dot.com 90-2000's
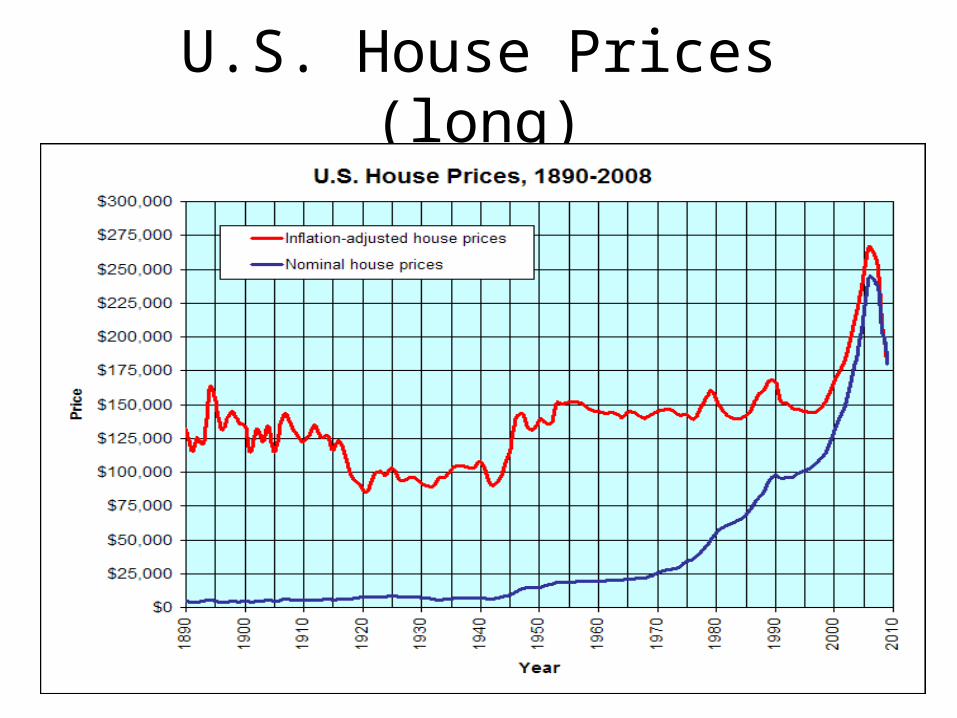
U.S. House Prices (long)

U.S. Real Estate Prices
Shiller figure 2.1Predictability (R2 = 0.5)Run ups are small than stocksPast not informative (nonstationary??)
Statistics difficultFundamentals not well connected (fig.
2.1)

Other Data Features
Several major declines Small run up in the 1920’s Many regional bubbles
Geography is important Figs 2.2, 2.3 Not all cities move together, but more so now?
Large (and permanent) increase after WWII GI Bill of rights Home construction restricted during the war, then
expands
Why Do People Think Home Prices Always Rise?
Two possibilities Infrequent transactions Inflation
Example House bought in 1948 for $16,000, and sold for
$190,000 in 2004 Total real return = 48% Real return per year = 1% Also, property probably improved a lot over time
(different goods) - also in index too
Special Things about Real Estate
Long term comparative data Difficult Hard to find
Curious features about Care and owner/renter incentives
Special tax breaksLeverageCross country differences

Outline
The U.S. stock market summary The U.S. real estate market Three recent events
Japan 1980's East Asia 1990's U.S: dot.com 90-2000's

Bubbles in Asia (80’s-90’s)Kindleberger/Aliber (8)
Japan 1980’s Land values: Imperial palace = California Market value of Japanese land = 2 x U.S.
(land area = 5 percent of US) Stock market: Twice the market val of US
7/10 largest banks are Japanese (assets) Japanese firms acquiring “trophy” properties
Rockefeller center Pebble Beach Golf course

Japanese Growth History
Late 1800’s begins to industrialize Adopting foreign institutional models Early industry built around feudal families
Large multi-industry holding companies General MacArthur outlaws at end of WWII Firms replace this with “cross-holdings”
Holding of other firm’s shares 1950’s-1960’s, Japan starts to catch up
Growth rates near 10 percent per year
Japan in 1980’s
Global economic powerWorld leader in
Cars Electronics Photo optics
Industrial planning: “Japan Inc.”Financial structures: bank lending

Financial Regulation Restrictions on interest rates Negative real returns Leaves only real estate and stocks with positive
returns Mid 80’s begins to deregulate Begins to financially become more global Real estate and stock markets continue rising Bank assets increase, collateral increases, lending
increases Cross holdings magnify changes in asset values: Buy
shares of other firms rather than investing
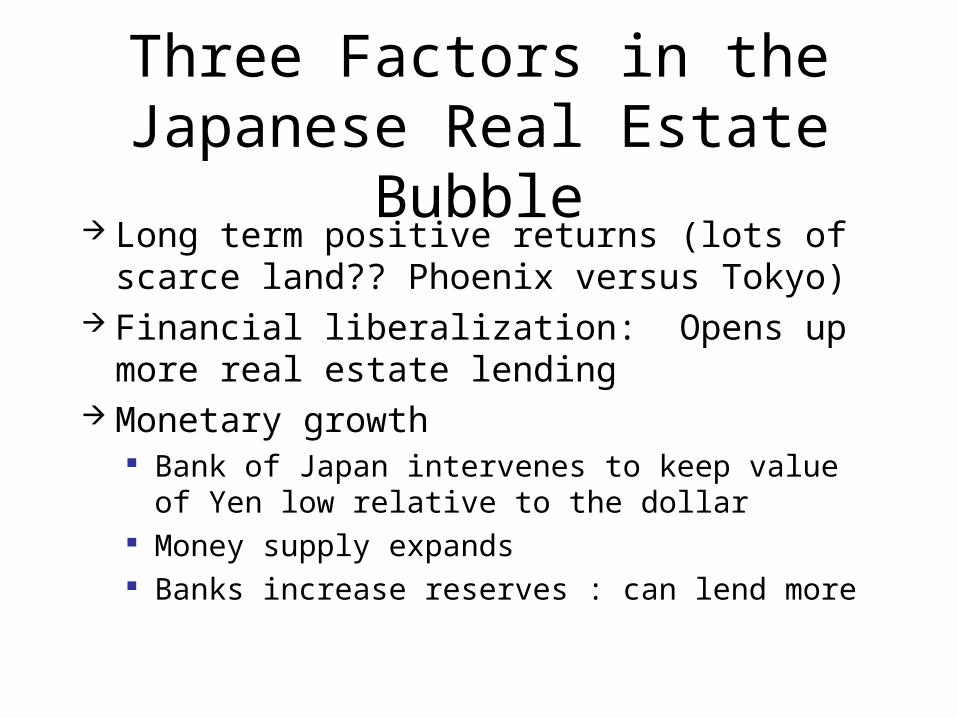
Three Factors in the Japanese Real Estate Bubble
Long term positive returns (lots of scarce land?? Phoenix versus Tokyo)
Financial liberalization: Opens up more real estate lending
Monetary growth Bank of Japan intervenes to keep value of Yen low
relative to the dollar Money supply expands Banks increase reserves : can lend more
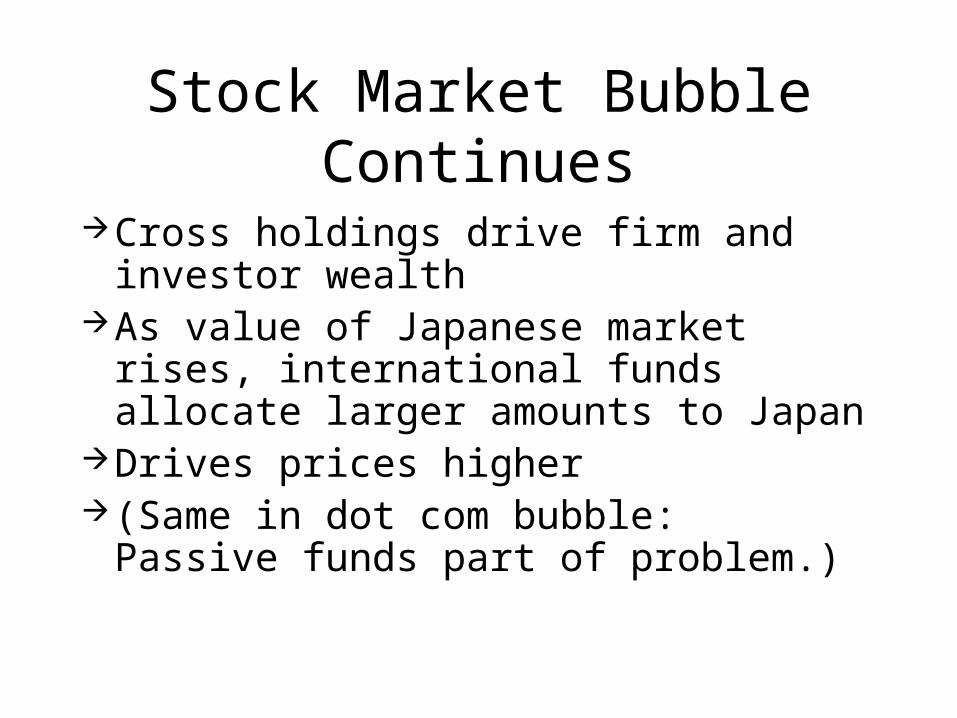
Stock Market Bubble Continues
Cross holdings drive firm and investor wealth
As value of Japanese market rises, international funds allocate larger amounts to Japan
Drives prices higher(Same in dot com bubble: Passive
funds part of problem.)
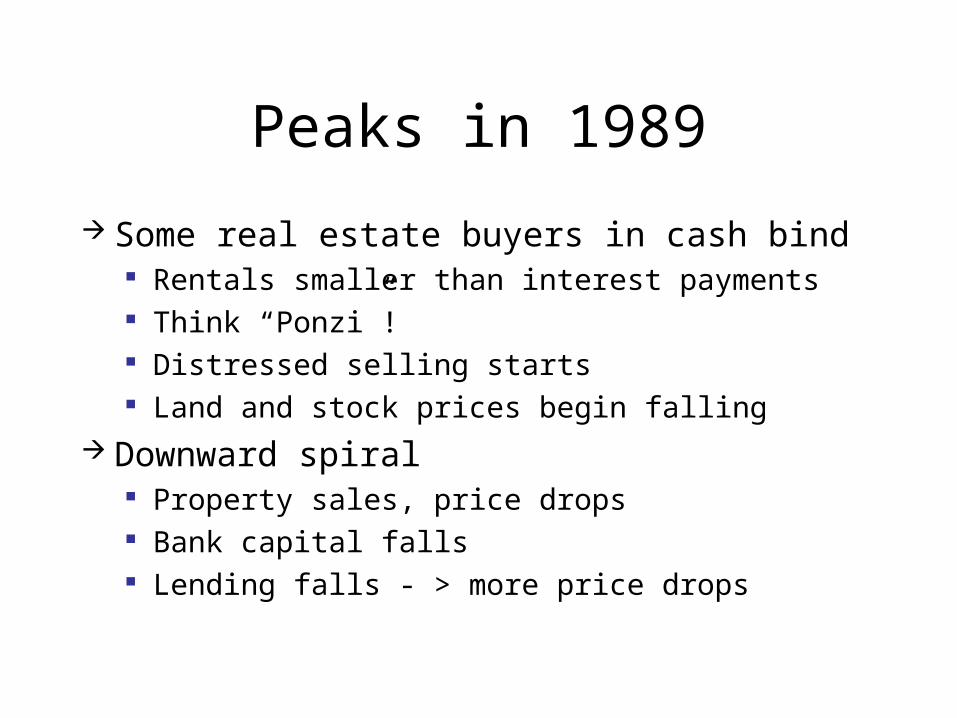
Peaks in 1989
Some real estate buyers in cash bind Rentals smaller than interest payments Think “Ponzi”! Distressed selling starts Land and stock prices begin falling
Downward spiral Property sales, price drops Bank capital falls Lending falls - > more price drops
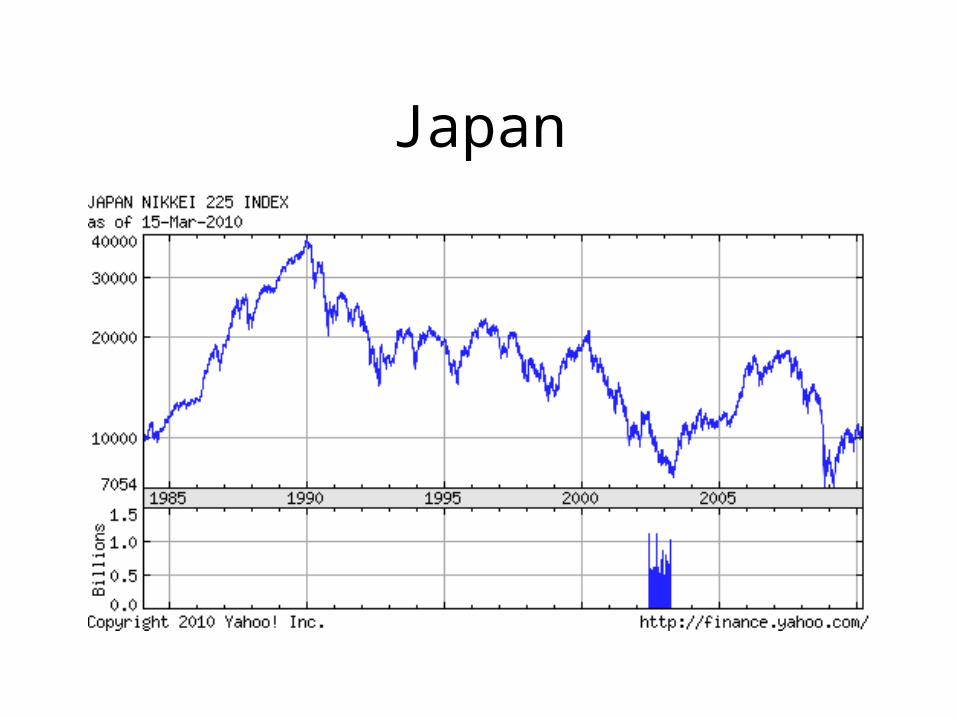
Japan
Japan in the late 90’s and early 2000’s
Japan has some periods of deflation Near zero interest rates Bankruptcies rise Banks in trouble Depositors do not withdraw
Belief government will step in Too big to fail
Foreign lenders to Japanese banks believe government will not help them
Japanese lenders and firms move to foreign banks

Shift Away from Japan
Exports increase/Imports fallYen appreciates Investors shift to China, Malaysia,
Thailand where labor costs were lower
Early 1990's
East Asian "tigers"Beginning in the 1960's and 70'sKey aspects
Transformations Growth (often near 10%)
Stock markets in Thailand and Malaysia take off in the early 90's (300 - 500%)
Foreign Capital
Foreign direct investment Setting up manufacturing Real estate booms Consumer lending takes off 1996: Consumer finance companies experience
losses, begin to fail Foreign creditors nervous Capital inflows suddenly stop Thai Baht can no longer be managed on a dollar
peg, currency collapses
Regional Contagion
Triggers crisis across regionOther currencies collapse
Indonesia loses 70 percent of valueStock prices down 30-60 percentLarge number of banks fail

"Miracle" Comments Disappear
Crony capitalismDestabilizing speculation
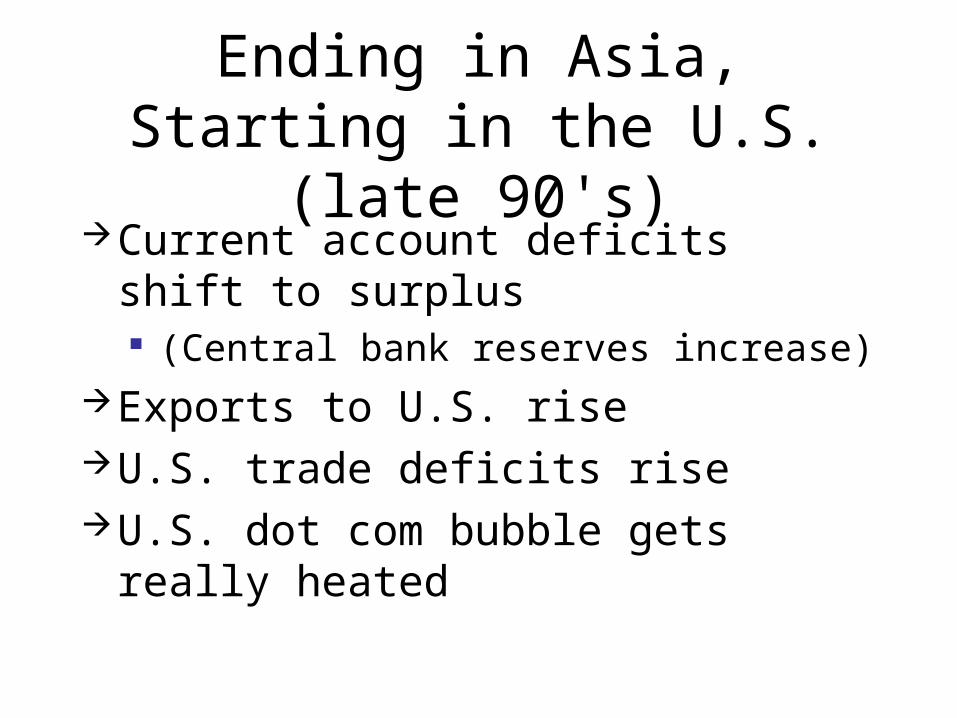
Ending in Asia, Starting in the U.S. (late 90's)
Current account deficits shift to surplus (Central bank reserves increase)
Exports to U.S. riseU.S. trade deficits riseU.S. dot com bubble gets really heated

Dot Com World
VC's, Entrepreneurs, IPO's First day "Price Pop" December 1996: Greenspan "Irrational
Exuberance" Dow = 6300, NASDAQ = 1300
End of 1999 Dow = 11700, NASDAQ = 5400
NASDAQ value = 80% NYSE value Initially "new economy" stocks Eventually all stocks

“Our proprietary portfolio of New Economy stocks was up
over 80.2% in 1998!”
“At this rate, $10,000 turns into $3.4 million in
10 years or less!”

When Did the Bubble Start?
1995?1998?
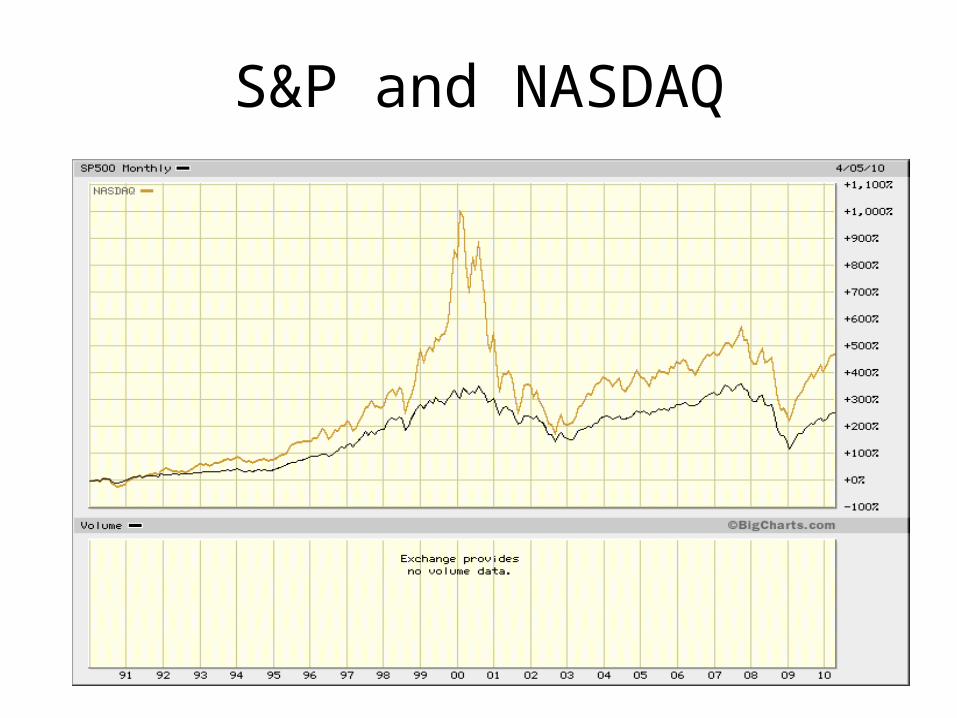
S&P and NASDAQ

Bubble Persists
1999: Fed obsessed with Y2K Increases bank liquidityAfter 2000 Fed reduces liquidityStock market falls 40%, NASDAQ 80%
International Aspects of Dot.com
Capital inflows to U.S.Dollar appreciates Import prices fall in U.S.U.S. inflation lowU.S. savings rates fall
Summary: The Three Recent Bubbles
Japan: 1980'sEast Asia: 1990'sUS dot com: late 90's early 2000'sHow do they fit into the Minsky
taxonomy? Ponzi??


![WELCOME []...65 BUILDINGS Aliber Hall.....56, D2 Alumni House.....75, D3 American Republic Health Center Bell Center Black Cultural Center Branson Plaza Buel Softball Field Carnegie](https://img.dokumen.tips/doc/110x75/60f93560bb6b9256976d76eb/welcome-65-buildings-aliber-hall56-d2-alumni-house75-d3-american.jpg)

![1. DESCRIPCIÓN DE LA ASIGNATURA - … · • KEYNES, J. M. (1991 [1931]): Ensayos de persuasión. Barcelona: Crítica. • KINDLEBERGER, Ch. P. (2009): La crisis económica 1929-1939](https://img.dokumen.tips/doc/110x75/5ba75fdd09d3f23f4e8b4ec5/1-descripcion-de-la-asignatura-keynes-j-m-1991-1931-ensayos.jpg)