Embed Size (px)
Citation preview

A Federal Fiscal History:Canada, 1867-2017
Livio Di Matteo
February 2017


fraserinstitute.org
February 2017 • Fraser Institute
A Federal Fiscal HistoryCanada, 1867–2017
by Livio Di Matteo

fraserinstitute.org

fraserinstitute.org
Contents
Executive Summary / iii
1. Introduction / 1
2. Confederation, Federalism and the Role of the Federal Government / 6
3. Overview of Revenue, Expenditure, and Debt, 1867–2017 / 12
4. Nation Building, 1867–1913 / 24
5. War and Depression, 1914–1945 / 32
6. Post-War Boom, 1945–1973 / 45
7. The Great Divergence—Productivity Slowdown and Fiscal Crisis, 1973–1996 / 55
8. Into the 21st Century, 1996–2017 / 65
9. Conclusion / 76
Appendix 1: Long-term Federal Debt Dynamics / 78
Appendix 2: Federal Fiscal Data, 1867–2017 / 80
References / 93
About the Author / 98
Acknowledgments / 98
Publishing Information / 99
Supporting the Fraser Institute / 100
Purpose, Funding, and Independence / 100
About the Fraser Institute / 101
Editorial Advisory Board / 102

fraserinstitute.org

A Federal Fiscal History: Canada, 1867–2017 • Di Matteo • iii
fraserinstitute.org
Executive Summary
The Canadian federation’s 150th anniversary is an important milestone for a country that has become one of the most successful countries in the world. Canada’s economic evolution from a rural agricultural nation to a modern, highly urbanized, service-intensive economy is accompanied by the federal government’s transition from spend-ing mainly on goods to spending on transfers. Indeed, over two thirds of federal spend-ing today is now largely a transfer payment of some type whether to individuals, other governments, or bondholders. The evolution of the federal government from a produ-cer and provider of public goods and services to a cheque-writing agency is a result that would likely astound the nineteenth-century founders of Canada.
Canada’s federal government has grown both in terms of its absolute revenue and expenditure as well as relative to the economy. At the dawn of Confederation, Canada’s federal government had a budget of $14 million, an expenditure-to-GDP ratio of approximately 5%, and a net debt of $75.7 million. This resulted in a net ratio of debt to GDP of 20% and annual interest charges of $4.9 million absorbing 29% of spending. By 2017, it is anticipated that total federal government spending will be $331 billion with an expenditure-to-GDP ratio of about 15.6%. The net federal public debt will total $759.5 billion, resulting in a debt-to-GDP ratio of 35.7% and debt service costs of $26.4 billion accounting for 8% of federal expenditure.
Paying for this expenditure changed over time. From 1867 to World War I, the federal government’s revenue was dominated by customs duties, which peaked at 66% of rev-enue in 1912. The needs of the war effort sparked the search for new revenue, which led to the creation of the first personal and corporate income taxes and the first fed-eral sales tax. Over time, the importance of these three new revenue sources grew and it is anticipated that by 2017 the personal income tax alone will make up 51% of federal government revenue, corporate taxes, 13%, and commodity taxes (GST, excise taxes and customs duties), 17%.
The 150 years since Confederation have witnessed a transition of the federal gov-ernment from its primary concern with the active economic development of a state grounded in liberal economic principles to an activist role partly aimed at bringing about a more egalitarian state via redistribution. This led to an expansion of the federal

iv • A Federal Fiscal History: Canada, 1867–2017 • Di Matteo
fraserinstitute.org
government’s spending after World War II that, in the absence of more concerted fiscal discipline and given the slowdown in economic growth, ultimately was a factor in the debt crisis of the 1990s.
Prudent government spending is useful: for example, the construction of the trans-continental CPR railway aided by subsidies paid to encourage the building of a risky cap-ital project. However, the same strategy also resulted in over-subsidization of the CPR as well as substantial subsidies to two other, less successful, rail lines. More government spending is not always better and that also applies to the use of deficit financing.
Nevertheless, over the period from 1867 to 2017, Canada’s federal government ran a deficit nearly three quarters of the time with the largest deficit-to-GDP ratios during the two world wars and the run up to the debt crisis of the 1990s. The important policy decisions when it comes to spending are when to spend, what to spend it on, how much to spend, and how to pay for the spending. Getting the wrong answer to any of these questions has fiscal implications.
Given the surge in deficit financing at the federal level currently under way in the wake of the 2016 budget, one wonders if the lessons of the 1990s have already been forgot-ten. While interest rates remain at historic lows, economic growth is also low, making a case for fiscal prudence given the dynamics of deficits and debt. The progress made in reducing the ratio of federal net debt to GDP below 40% will be largely squandered if we allow debt to once again grow uncontrollably.

A Federal Fiscal History: Canada, 1867–2017 • Di Matteo • 1
fraserinstitute.org
1. Introduction
Canada’s sesquicentennial, the 150th anniversary of Confederation, is an important milestone for a country that was the first parliamentary federation [1] and has grown to be one of the most successful countries in the world with enviable economic perform-ance and quality of life. One of the key determinants of economic, political, and social success for any country is the quality of its institutions and Canada has been blessed with stable political institutions, a market economy, and a general quality of govern-ment that has allowed its people to flourish and achieve its potential.
This study presents a history of the public finances of Canada’s federal government focusing on revenue, expenditure, and their composition, as well as deficits and public debt. It follows in the footsteps of a number of studies of federal government finance over the years that were often done within the broader context of overall Canadian fiscal development and included the provinces and municipalities. Classic historical studies include of course the Rowell/Sirois Report (Smiley, 1940/1964) and Mackintosh’s (1940/1964) The Economic Background of Dominion-Provincial Relations, which was origin-ally an Appendix of the Rowell Sirois Report. A more detailed study of Canadian fiscal history from the perspective of public finance and intergovernmental transfer is found in publications by Moore, Perry, and Beach (1966) and Perry (1955, 1989), while the federal government’s finances alone are chronicled by Gillespie (1991).
This publication contributes to this body of work in a number of ways. First, these studies, collectively, only cover the period from 1867 to 1990, which makes this update very timely given the additional quarter century that has passed. Second, the previous studies, while well supported with tables and numbers, are marked primarily by textual analysis and lack a comprehensive visual presentation of the data on a long-term basis that encourages an examination of trends and comparisons over time. This study presents numerous charts that demonstrate long-term trends. Third, this study aspires to be a succinct overview and therefore limits itself to federal finances narrowly defined as revenue and expenditure, their composition, and resulting deficits and debt. Left to more hefty expositions are detailed accounts of federal tax policy, intergovernmental relations, social policy, and regulation.
[1] Though the third federation created after the United States in 1790 and Switzerland in 1848, Canada was the first federation with a Westminster-style parliament.

2 • A Federal Fiscal History: Canada, 1867–2017 • Di Matteo
fraserinstitute.org
The basics of public finance—defining revenue and expenditureAs an analytical device, public finance usually divides the study of the public sector into two sides: expenditure and receipts. Expenditure is the outlays by government and are subdivided into real expenditure—direct spending on goods and services such as health, public works, and defence—and transfers, the redistribution of funds to individuals and other governments by programs such as social security and equalization payments. Receipts are the revenue received by government and the means by which government finances expenditure. The government can raise revenue from taxes such as the per-sonal income tax, sales tax, or property tax as well as other sources [2] or, if expenditure exceeds revenue, it can borrow funds, that is, incur a deficit. The sum of all deficits (and surpluses) plus interest on the money borrowed is the gross debt and when government financial assets are subtracted from the debt one has the net public debt.
Federal government finances are generally done on the basis of the fiscal year, which does not coincide with calendar years. Thus the 2016-to-2017 fiscal year (also referred to as the fiscal year ended March 31st, or fiscal year 2017) runs from April 1, 2016 to March 31, 2017. This standard convention is followed here for the period from 1867 to 1965. However, for the period from 1966 to 2017, when the federal government’s rev-enue and expenditure are discussed a year such as 2016 will refer to the 2016/17 fiscal year to better correspond to other economic variables such as GDP, which are calcu-lated for the calendar year. It should be noted that the definition of a fiscal year has also changed over time. From Confederation to 1906, fiscal years actually closed June 30 whereas since 1907 they have closed March 31.
The dataCompiling the data for a long-term study of the finances of the federal government can be a daunting endeavour. Conformity and continuity can be a challenge when com-piling information on the composition of revenue and expenditure, given changing responsibilities of government as well as changes in definitions and accountability pro-cedures over time. At the same time, total revenue and expenditure as well as data for debt have been consistently collected since Confederation by assorted publications on government finance.
The basic sources for the data in this study are relatively few. For the period from 1867 to 1975, there is heavy reliance on Section H–Government Finance of the second edition
[2] Other sources can include other taxes, user fees, custom’s duties, contributions to social security plans, sales of goods and services as well as investment income.

A Federal Fiscal History: Canada, 1867–2017 • Di Matteo • 3
fraserinstitute.org
of Historical Statistics of Canada (Leacy, 1983). There is an overlapping set of coinciding data from 1966 to the present from the Department of Finance’s Federal Fiscal Reference Tables. Figures on the federal debt are from two sources: assorted volumes of the Canada Yearbook for the period 1867 to 1965 and then, once again, the Federal Fiscal Reference Tables for the period 1966 to the near present. [3] The period from 2015 to 2017 relies on the Spring 2016 Federal Budget.
Additional statistics useful for the economic analysis of government spending include some type of price index, estimates of GDP, and population. The price index used is a GDP deflator. For the period from 1870 to 1985, it is from the work done by M.C. Urquhart (1988) at Queen’s University while, for the period from 1981 to the present, it was obtained from Statistics Canada (series v62788999). Estimates of GDP are from three sources: Urquhart (1988) for the period from 1870 to 1960; an average of Urquhart (1988) and Statistics Canada (series v646937) for the period from 1961 to 1980; an average of two Statistics Canada series for period from 1981 to 2011 (series v646937, v62305783); and afterwards, series v62305783 to 2014; and then estimates from the 2016 Federal Budget for period from 2015 to 2017. Population is from two Statistics Canada series (v742019 for the period from 1867 to 1977; and v52154496 for the period from 1971 to the present.
Some themesNaturally, any account spanning 150 years would benefit from an overview of major themes within which to situate the ensuing deluge of facts, figures, and charts. Facts and numbers on their own are not terribly helpful without context and narrative. One option might be an economic model within which to understand federal finances: for example, a public-choice model in which federal revenue and expenditure decisions are made with an eye towards political marginal benefits and costs in terms of votes gained. [4] However, more appropriate for a general survey work such as this is perhaps a gen-eral set of themes that emerge from observing the evolution of federal fiscal perform-ance over the course of 150 years.
First, the federal government’s role has changed over time. There is the transition from a relatively minimalist and fiscally aware state charged primarily with nation building
[3] Sources 1867–1939: Canada Yearbook 1940: 854–855. 1940-1949: Canada Yearbook 1950: 1024. 1950–1959: Canada Yearbook 1960: 1090. 1960-1965: Canada Yearbook 1967: 1045. 1966–2014: Federal Fiscal Reference Tables, 2015: tables 15, 13. 2015–2017: 2016 Federal Budget.
[4] Such a framework is indeed used in Gillespie, 1991.

4 • A Federal Fiscal History: Canada, 1867–2017 • Di Matteo
fraserinstitute.org
and economic development to a role as a more economically interventionist and activist welfare state in the era after World War II. Then, particularly since the 1960s, there has been the devolution of the responsibility for taxing and expenditure to the provinces. This decentralization of spending within the Canadian federation parallels the federal government’s evolution towards a transfer agency, with provincial and local govern-ments making most of the decisions about the allocation of public money.
Second, used prudently, deficits and debts can be useful. Indeed, a significant use of debt and deficits was to finance the construction of the transcontinental CPR railway during the nation-building phase of the Canadian economy, when subsidies were paid to encourage the building of a risky capital project. However, the same strategy also resulted in over-subsidization of the CPR as well as substantial subsidies to two other rail lines that were not as successful. More is not always better and that applies to the use of deficit financing.
Third, fiscal responsibility is a traditional Canadian value rooted in the classical liberal economic theory that underpinned the views of the Fathers of Confederation about deficits and debt. Despite the pressures of nation building, two world wars and a Great Depression, this philosophy remained integral to the federal government’s fiscal plan-ning and action until after World War II. The robust and lengthy economic growth of the era after World War II, combined with an ideological shift about the role of govern-ment in the economy, led to the eventual relaxation of this discipline in the 1960s; and the result was the putting in place of expenditures that would grow faster than revenue once the growth of the economy began to slow down in the 1970s. This imbalance was not corrected until the fiscal crisis of the 1990s and, after a return to fiscal balance, we appear poised to repeat this mistake. It would appear that when it comes to federal gov-ernment finances there is an absence of long-term learning behaviour.
Fourth, while revenue and expenditure are influenced by economic conditions, it remains that what taxes to levy, what rates to apply, how much to spend, and what to spend it on are all choices. Whatever the economic conditions, over the long term, the federal government has generally had a tendency to increase its expenditure faster than revenue, even during good economic times. Over the 150 years of Confederation, nom-inal federal government revenue has grown at an average annual rate of 7.6% while expenditure has grown at 8.3%. Moreover, expenditure has exceeded revenue—that is, a deficit has been incurred—nearly 75% of the time.

A Federal Fiscal History: Canada, 1867–2017 • Di Matteo • 5
fraserinstitute.org
Finally, the evolution of the Canadian economy from that of a largely rural, agricultural nation to a modern service-intensive economy with the bulk of the population clus-tered in urban centres is paralleled by the federal government’s transition from spend-ing mainly on goods to spending on transfers. Indeed, over two thirds of federal spend-ing today is now largely a transfer payment of some type, whether to individuals, other governments, or bondholders. The evolution of the federal government from a produ-cer and provider of public goods and services to a cheque-writing agency is a result that would likely astound the nineteenth-century founders of Canada.

6 • A Federal Fiscal History: Canada, 1867–2017 • Di Matteo
fraserinstitute.org
2. Confederation, Federalism and the Role of the Federal Government
The structure of the Canadian federation with its division of powers between a federal government and the provinces is rooted on the foundations erected by the founders—the Fathers of Confederation. The founders of the Canadian federation had a vision of government founded in civil liberties [5] and the role of government in economic development as the provider of a framework that would allow individuals to pursue wealth and property. [6] Despite the view that has arisen regarding the founders as merely pragmatic and uninterested in the philosophical underpinnings of government, [7] the founders were determined to limit government interference and protect individ-ual freedom and responsibility.
The founders were familiar with the works of the American founding fathers such as Jefferson, Madison, and Hamilton and the Federalist Papers, as well as European pol-itical philosophers such as Edmund Burke, John Locke, Thomas Hobbs, Jean-Jacques Rousseau, and John Stuart Mill and the Scottish political economists David Hume and Adam Smith. Hume believed commercial societies were the most conducive to the cre-ation of wealth and in conjunction with Adam Smith viewed the state as a means on ensuring economic development by providing a “framework of justice in which self-seeking individuals with their property and specialization were protected by law and authority” (Smith, 1987: 8).
[5] These civil liberties were limits on a government’s activities and marked out areas of individual free-dom and responsibility: freedom from arbitrary arrest or detention, freedom of speech, freedom of wor-ship, freedom to elect a government, and freedom from oppression by authority. See Ajzenstat, 2010: 9.
[6] As noted by La Forest: “During the period around 1867, the philosophy of laissez faire was at its zenith; governmental activity was narrowly restricted, and in consequence so too were governmental expenses” (1967: 1).
[7] Such a view has become dominant since the 1960s and promulgated by the work of historians such as Ramsay Cook, F.H. Underhill, and E.R. Black (Ajzenstat, 2010: 8). For example, Black writes: “Confederation was born in pragmatism without the attendance of a readily definable philosophic rationale” (1974: 4). Ajzenstat, Romney, Gentles, and Gairdner note that the use of the term “pragmatist” has been interpreted as meaning the Fathers of Canadian confederation had no commitment or interest in political ideas but that “[t]hat is nonsense, and pernicious nonsense, because it purges political values from Canada’s found-ing” (1999: 1).

A Federal Fiscal History: Canada, 1867–2017 • Di Matteo • 7
fraserinstitute.org
Even the views of Hume and Smith on public debt and finance shaped the founders given that Confederation also involved a consolidation of the public credit after the debt excesses of the first Canadian railway building age. [8] Hume feared that public debt was the road to national bankruptcy while the somewhat less pessimistic Smith neverthe-less acknowledged that public debt could grow too large and ruin the nation; this led to his suggestion of financial instruments such as sinking funds to manage public debt (Smith, 1987: 8). Yet, even Adam Smith wrote: “The practice of funding [i.e. deficit spend-ing] has gradually enfeebled every state which has adopted it” and that bankruptcy was always the end of great accumulations of debt (Smith A., 1776/1994: 881).
The founders were concerned with wealth accumulation and prosperity and saw free trade as an important component of commercial policy. As John McMillan noted during the Confederation debates in New Brunswick’s House of Assembly, the pur-pose of Confederation would be an alliance “that will enable us to have free trade with our neighbours” (Ajzenstat, Romney, Gentles, and Gairdner, 1999: 127). George Brown in the Province of Canada argued that Confederation was “to throw down all barriers between the provinces … that our farmers and manufacturers and mechanics shall carry their wares unquestioned into every village” (Ajzenstat, Romney, Gentles, and Gairdner, 1999: 135).
Canada is a federation, an institutional arrangement that combines the economic advantages of a larger economic space (such as economies of scale) with the advantages of decentralization (such as policies tailored to local needs). Each participating jurisdic-tion retains some degree of local political and economic power [9] while having some shared decision-making responsibilities. [10] It is within the institutional arrangements of Confederation that the structure and dynamics of Canada’s federal government are to be found.
The Canadian system of government is commonly viewed as having three levels of gov-ernment: federal, provincial, and municipal though under the Constitution the munici-palities are actually under provincial jurisdiction. The British North America Act of 1867 (Reid, Stewart, McNaught, and Crowe, 1959) brought into being the Dominion of Canada,
[8] P.J. Smith writes that: “In brief, Confederation was to be a credit instrument that would provide the resources necessary for the economic development of the British North American colonies” (1987: 27).
[9] For detailed discussion of federal governments and their economic role, see Boadway and Shah, 2009: 4–60.
[10] In a federation, there is “[a] public sector with both centralized and decentralized levels of decision-making in which choices made at each level concerning the provision of public services are determined largely by the demands for these services by the residents of (and perhaps others who carry on activities in) the respective jurisdiction” (Oates, 1972: 17).

8 • A Federal Fiscal History: Canada, 1867–2017 • Di Matteo
fraserinstitute.org
which at that time consisted of Ontario, Quebec, Nova Scotia, and New Brunswick. Manitoba joined the federation in 1870, British Columbia in 1871, Prince Edward Island in 1873. Alberta and Saskatchewan were carved out of the Northwest Territory in 1905 and Newfoundland & Labrador joined in 1949. At present, the Canadian federation consists of 10 provinces and three territories, the Yukon, the Northwest Territories, and Nunavut, which are administered by the federal government. As well, there are 3,664 municipalities as well as 617 First Nation communities (Federation of Canadian
Municipalities, 2006: 7; Indigenous and Northern Affairs Canada, 2014).
Canada federated in 1867 in response to a number of economic and political factors. Key amongst these economic factors as laid out in the classic Royal Commission Report on Dominion-Provincial Relations (“Rowell-Sirois Report”) (Smiley, 1940/1964) was the desire to generate the resources to fund a transcontinental rail link and build a common market. [11] Confederation was seen as a solution to these economic problems as it was expected to foster a national economy and internal common market, spur economic opportunities for the slowing economies of the Atlantic provinces and central Canada, and lessen exposure to the effects of the economic actions and policies of the United States and Britain. Among the objectives of Confederation were establishment of a free trade area, [12] an interprovincial transport system, stabilization of public credit by the creation of the federal government as a new fiscal entity, and the opening of the north-west with a rail link that could be funded by new borrowing after the consolidation of public credit.
[11] More specifically, there were the following factors. [1] The loss of imperial preference as Britain moved to free trade and the loss of trading privileges with the United States with the end of the 1854 Reciprocity treaty. As a result, Confederation was to be an exercise in the creation of a common market among the British North American colonies. [2] The need to deal with debt problems while funding further investments in transportation was another reason for Confederation. By 1866, the Government of Canada (Ontario and Quebec) had loaned $33 million to railway companies while municipalities had loaned $7 mil-lion, a sizeable sum relative to GNP estimates for Canada in 1870 of $383 million (Urquhart, 1994: table
1.1). Glazebrook (1938/1969: 172–185) notes how between 1850 and 1860 the Province of Canada saw railway track grow from 66 miles to 2000 and its debt increase from $18.783 to $54.142 millions—an increase of 189%—practically destroying the credit standing of the British North American colonies. By 1867, gov-ernment transportation investments accounted for 60% of total provincial and municipal debt and one third of current government spending were on transportation. [3] The potential territorial aggrandize-ment of the United States, especially in the wake of the Civil War, sparking the need for mutual defence. [4] The desire to exploit Canada’s west—the vast Northwest territory stretching approximately from Lake Superior to British Columbia and north to the Arctic—by building a rail link to the west and using it as an investment frontier much as the Americans were doing with their Union Pacific Railway and their west.
[12] Section 121 of the British North America Act of 1867 provides that the produce of each province is to be admitted duty-free to the other provinces (La Forest, 1967: 16).

A Federal Fiscal History: Canada, 1867–2017 • Di Matteo • 9
fraserinstitute.org
The fiscal solutions of Confederation involved the existing debts of the provinces being taken over by the federal government. The net outstanding debt after all calculations were made was determined at $88.6 million, of which $72.1 million was assumed by a united Canada and the remainder was set at $8.7 million to Nova Scotia and $7.8 mil-lion to New Brunswick in recognition that not all provinces had borrowed equally. [13] Thus, Canada was born in debt and debt service costs were a major federal expenditure from the beginning.
Why a federal system rather than a unitary state? On the eve of Confederation, the British North American colonies were not integrated economically. Upper and Lower Canada were a natural economic unit but divided ethnically into French and English. A federal arrangement was also an accommodation made to Quebec that allowed it to retain jurisdiction over language and culture. The Maritimes were a distinct economic region and wary of surrendering too much economic authority to a central government. Therefore: “Federal union was a plan whereby, through mutual concession, cultural and local loyalties could be preserved and reconciled with the political strength and solidar-ity of the whole” (Smiley, 1940/1964: 29).
The powers and responsibilities of the federal government and the provinces are out-lined in the British North America Act with the division of economic powers between the federal and provincial governments set out in Sections 91 and 92 (Reid, Stewart,
McNaught, and Crowe, 1959: 244–276). Confederation ultimately resulted in the construc-tion of a classical liberal state with the federal government accorded the key powers to promote the functioning and economic development of a free-market economy accord-ing to the vision of classical economists like Adam Smith. [14]
Among the powers exclusively accorded to the federal government were public debt and property, the regulation of trade and commerce, postal service, defence, navigation and shipping, and, most important, the raising of money by any mode or system of taxa-tion. The exclusive powers of the provincial governments included the management and sale of public lands belonging to the province and the timber and wood thereon,
[13] Perry (1955: 41). An average per-capita figure of debt outstanding by all provinces was calculated using 1861 population and the actual debt compared to that calculated from the average.
[14] The classical view of government is that of a minimalist state. Smith summarizes the duties of the sovereign or role of government as defence, justice, and public works. See Book V of Smith, A., 1776/1939.

10 • A Federal Fiscal History: Canada, 1867–2017 • Di Matteo
fraserinstitute.org
establishment and maintenance of hospitals and asylums, municipal institutions in the province, education subject to certain provisions, and direct taxation within the prov-ince in order to raise revenue for provincial purposes. [15]
The general intent and design of the British North America Act (BNA) appears to pro-vide for fiscally dominant federal government, though one in which many services were to be delivered at the provincial or municipal level. While the prevailing philosophy of the times limited government to traditional functions such as defence, a key excep-tion was the need in settler economies to develop transportation infrastructure. Prior to Confederation, government activity in providing these transport facilities accounted for about half of government spending with large debts being acquired to finance this expenditure (La Forest, 1967: 2).
The federal government got unlimited taxing power with the bulk of Federal revenue in 1867 coming from customs duties and excise taxation. The provinces were prohibited from levying interprovincial tariffs and could only raise revenue through direct taxation. This traditional division, where direct taxes are taxes on people while indirect taxes are taxes on commodities or things, meant the provinces initially could levy an income tax but not excise or manufacturing taxes. [16] Given the unpopularity of income taxation in the nineteenth century, this would appear to have been a rather direct way to limit any provincial tendencies towards excess expenditure. Moreover, the functions and respon-sibilities assigned to the provinces in 1867 were not viewed as costly (La Forest, 1967: 2).
[15] Major powers of the Federal Government (Section 91): general powers to make laws for peace, order and good government, the residual power, public debt and property, regulation of trade and commerce, defence, money, banking and criminal law, ability to raise revenue by any means of taxation whatsoever. As well, there was Section 106—referred to as the federal spending power—giving the federal government the right to appropriate funds from the consolidated revenue fund “for public service” and allowing the federal government to directly enter any field. Finally, the Federal government also has the power of dis-allowance with respect to provincial legislation. Major powers of the Provincial Government (Section 92): provinces were given exclusive rights to make laws in areas of a local or private nature within the province, property and civil rights, management and sale of public lands; the administration of justice, jurisdiction over municipal institutions, education, and hospitals (health). Joint jurisdiction was provided for (Section 95) with joint federal and provincial responsibility in the areas of agriculture and immigration, with fed-eral laws assuming predominance in case of conflict. Provincial governments could raise revenue only by direct taxation.
[16] Even here, the hand of the classical economists is evident. The distinction between direct and indirect taxes relies heavily on the definition used by John Stuart Mill in his 1848 Principles of Political Economy. Mill wrote: “Taxes are either direct or indirect. A direct tax is one which is demanded from the very person who it is intended or desired should pay it. Indirect taxes are those which are demanded from one person in the expectation and intention that he shall indemnify himself at the expense of another; such as the excise or customs” (La Forest, 1967: 63).

A Federal Fiscal History: Canada, 1867–2017 • Di Matteo • 11
fraserinstitute.org
Nevertheless, given their surrender of tariff revenue, the provinces were left with spending in excess of revenue and alternative fiscal arrangements were made in 1867 with the creation of the Dominion subsidies, the first intergovernmental transfer pro-gram. These subsidies were paid on a per-capita basis and in the long term have been interpreted as a commitment to offset the fiscal gap as well as to promote regional fiscal equity and hence serve as the forerunners of modern fiscal transfer arrangements. [17] Moreover, that they were paid on a per-capita basis has served as a precedent for future transfer payments such as the Canada Health Transfer. [18]
While the intent of the BNA appears to have been to provide for a fiscally dominant fed-eral government, [19] federations are not anchored on blocks of granite. Instead, federa-tions evolve and over time the provinces have become acquired fiscal power comparable to that of the federal government. There has been a trend towards the use of both dir-ect and indirect taxes by the provinces and the federal government and ultimately the provinces have also not been precluded from levying sales taxes. Moreover, under the Constitution, the provinces had jurisdiction on over health and education, areas that have seen the greatest growth in expenditure over the course of the twentieth century, something that was not foreseen by the founders.
[17] The initial statutory subsidies to the provinces amounted to 80¢ per capita and were also accompan-ied by grants in support of government and legislation. In total, these grants to the four provinces in 1867 amounted to $2.795 million (Perry, 1955: 44–45).
[18] However, provincial spending soon outstripped even the resources of the Dominion subsidies as urbanization required continued provincial spending on transportation infrastructure such as railways, roads, and bridges, and provincial governments began levying direct taxes. By 1896, there were corpora-tion taxes, succession duties, and some income taxes at the provincial level (La Forest, 1967: 20).
[19] A dominant federal role is a traditional interpretation of what the founders of Confederation wanted. The Tremblay Report (Kwavnick, 1953/1973) articulates another interpretation of the BNA, the “Compact Theory” of Confederation, which sees the federal government as a creature of the provinces that was cre-ated by a delegation of powers rather than through the creation of new powers. The Tremblay Report “sees the grand theme of Canadian Constitutional Development as the attempt of the provinces to preserve the ‘federative cast’ of 1867 against encroachment of the federal government, against ‘Macdonaldism’ ” (Smiley,
1940/1964: 3). According to the Tremblay Report, the intention of the Fathers of Confederation was “first of all, that the union would be federative and secondly, that within this federative union Lower Canada would enjoy all the autonomy needed to preserve and develop its own national life” (Kwavnick, 1953/1973:
112). Confederation was the provincial leaders coming together and setting up an interprovincial compact. According to the Tremblay Report, the federal government got the most costly obligations (debt, transport, defence) and therefore received the most productive revenue sources of the time, customs and excise.

12 • A Federal Fiscal History: Canada, 1867–2017 • Di Matteo
fraserinstitute.org
3. Overview of Revenue, Expenditure, and Debt, 1867–2017
At the dawn of Confederation, Canada was a rural nation of approximately 3.625 million people of whom only 15% lived in urban areas, with the largest cities being Montreal (107,225), Quebec City (59,699), Toronto (56,092) and Halifax (29,582) (Canada, 1873). Agriculture made up the largest share of the country’s GDP at nearly 40% with manu-facturing surprisingly in second place at approximately 20%. [20] The total output of the Canadian economy in 1870 was $388 million and real per-capita GDP in 1870 in 2014 dollars was $2,700.
From this start, Canada has grown and become one of the most successful federations in the world, with a standard of living and quality of life that is among the highest in the world. By 2015, Canada’s GDP was nearly $2 trillion and its per-capita GDP in 2014 dollars was approximately $55,000. The population is now largely urban with 85% in urban areas and with about one third of a population of 35 million people in just three urban areas: Vancouver, Toronto, and Montreal.
Revenue and expenditureCanada’s economic growth and development was accompanied by changes in the rev-enue and finances of the federal government. Figure 1 plots the revenue and expendi-ture of the federal government from 1867 to 2017. [21] In 1867, revenue and expendi-ture were both $14 million but revenue is forecast to reach $302 billion and expenditure, $331 billion by 2017. Figure 2 plots federal revenue and expenditure in real per-capita terms ($2014). From real per-capita revenue and spending of $133 in 1870, both have grown dramatically and are expected to reach estimated values of $8,773 for expendi-ture and $8,004 for revenue in 2017.
[20] Much of what was considered as manufacturing in the mid-nineteenth century included small-scale rural activities such as cheese making.
[21] Again, it should be noted that the data is presented annually, but is for the fiscal year. It should be noted that the definition of a fiscal year has changed over time. From Confederation to 1906, fiscal years actually closed June 30, whereas since 1907 they have closed March 31. The numbers for 2015 to 2017 are estimates from the 2016 Federal Budget.

A Federal Fiscal History: Canada, 1867–2017 • Di Matteo • 13
fraserinstitute.org
The growth of federal government spending and revenue was most rapid after World War II (figures 1, 2). Between 1870 and 1939, real per-capita ($2014) spending by the federal government rose from $133 to $1,150 and, then, as a result of the war period soared to a peak of $7,025 in 1943. Though spending dropped in the immediate post-War era, growth resumed and by 2015 had reached a value of $8,180. The implied annual growth rate of real per-capita federal government expenditure from 1870 to 2015 is 2.8%, while real per-capita GDP grew only 2% annually.
Figure 1: Revenue and expenditure ($ millions) of the federal government, 1867–2017
Sources: 1867–1965: Historical Statistics of Canada, HSC-H1-18, HSC-H19-34; 1966–2014: Federal Fiscal Reference Tables; 2015–2017: Federal Budget 2016.
0
50,000
100,000
150,000
200,000
250,000
300,000
350,000
2017200719971987197719671957194719371927191719071897188718771867
RevenueExpenditure
$ m
illio
ns
Figure 2: Real per-capita revenue and expenditure ($2014) of the federal government, 1870–2017
Sources for revenue and expenditure: 1867–1965: Historical Statistics of Canada, HSC-H1-18, HSC-H19-34; 1966–2014: Federal Fiscal Reference Tables; 2015–2017: Federal Budget 2016. Sources for population: 1867–1977: v742019 Canada; Estimated population; 1971–2015: v52154496 Canada, Total marital status; 2015–2017: Population 2015–2017 assumed to grow at average annual rate for 2000–2015; 1%. Sources for GDP deflator: 1870–1985: Urquhart, 1988; 1981–2014: v62788999; 2015–2017: Federal Budget 2016 assumes GDP inflation at −0.4%, 1%, and 2.4%; 1% annual average used.
0
2,000
4,000
6,000
8,000
10,000
2017200719971987197719671957194719371927191719071897188718771867
RevenueExpenditure
$201
4

14 • A Federal Fiscal History: Canada, 1867–2017 • Di Matteo
fraserinstitute.org
Government expenditure growing faster than GDP of course results in government spending growing as a share of GDP—a growing public sector. Figure 3 plots the ratio of federal government expenditure to GDP from 1870 to 2017. The periods of the Great Depression and the world wars generate large upward spikes in the size of the federal public sector but generally it is the era after World War II that sees a sustained period of growth of the federal public sector relative to the economy. Until the 1940s, federal expenditure as a share of GDP generally fluctuated between 5% and 10% of GDP. There was then steady growth in the size of the federal public sector with a peak being reached in 1982 at 25%. The federal spending-to-GDP ratio then began to decline and reached a low point of 14% in 2014, the lowest it had been since the mid-1960s. [22]
Figure 4 takes federal spending over time and separates it into program spending and debt service charges and then plots them as a percentage share of GDP. Program spend-ing as a share of GDP was close to 5% of GDP well until World War I when it surged to peak at nearly 14% in 1917. It then fell and rose again during the Great Depression and then soared during World War II peaking at just over 44% in 1943. It then dropped dramatically in the post-War period, reaching 11% by 1949 and then commenced a rise that saw a peak of 21% in 1982. Program spending as a share of GDP began to fall again remaining below 15% for most of the period after the mid-1990s.
[22] Two traditional explanations for long-term growth of the public sector include Wagner’s Law and the Peacock-Wiseman Displacement Hypothesis. See Di Matteo, 2013: 9.
Figure 3: Size of the federal government (revenue and expenditure) relative to economy (GDP), 1870–2017
Sources for revenue and expenditure: 1867–1965: Historical Statistics of Canada, HSC-H1-18, HSC-H19-34; 1966–2014: Federal Fiscal Reference Tables; 2015–2017: Federal Budget 2016. Sources for GDP: 1870–1985: Urquhart, 1988; 1961–2011: v646937; 1981–2014: v62305783; 2015–2017: Federal Budget 2016, Estimates.
0
10
20
30
40
50
2017200719971987197719671957194719371927191719071897188718771867
Revenue/GDPExpenditure/GDP
Perc
enta
ge

A Federal Fiscal History: Canada, 1867–2017 • Di Matteo • 15
fraserinstitute.org
Debt service costs as a share of GDP were quite low for most of the period before World War I but rose quite dramatically with three peaks tied to the debt accumulations of World War I: 1921, at 3.2%; the Great Depression: 1933, at 3.8%; and World War II: 1946, at 3.9%. However, these three peaks are mere foothills in comparison with the peak in debt-service costs reached as part of the federal fiscal crisis of the early 1990s, when the ratio of debt service to GDP reached at an all-time high of 6.6% in 1990.
Deficits and surplusesThe difference between revenue and expenditure is the deficit(−)/surplus(+) and figure 5 and figure 6 plot the deficit to GDP ratio and the value of the real per capita deficit for the period 1870 to 2017. Over the period from 1867 to 2017, Canada’s federal govern-ment ran a deficit more often than not—nearly three quarters of the time. However, as a share of GDP, there are four periods that stand out, having very large ratios of deficit to GDP: [1] World War I; [2] the Great Depression; [3] World War II; and [4] the years leading up to the fiscal crisis of the 1990s. The first three of these periods are all marked by a pronounced V-shape that suggests short-term deficits driven by current economic circumstances whereas the last—the era leading up to the federal fiscal crisis—is a per-iod of persistent and protracted deficits that suggest a more fundamental structural imbalance between revenue and expenditure.
The largest deficits as a share of GDP were during World War II when the years 1942 to 1945 saw deficit-to-GDP ratios that ranged from 17.6% in 1945 to 22.5% in 1943. It should be noted that the largest surplus as a share of GDP was also in the 1940s—in
0
7
14
21
28
35
42
49
20172007199719871977196719571947193719271917190718971887187718670
1
2
3
4
5
6
7
2017200719971987197719671957194719371927191719071897188718771867
Prog
ram
exp
endi
ture
/GD
P (%
)
Sources for expenditure: 1867–1965: Historical Statistics of Canada, HSC-H1-18, HSC-H19-34; 1966–2014: Federal Fiscal Reference Tables 2015; 2015–2017: Federal Budget 2016. Sources for GDP: 1870–1985: Urquhart, 1988; 1961–2011: v646937; 1981–2014: v62305783; 2015–2017: Federal Budget 2016, Estimates.
Figure 4: Ratio (%) of federal program spending and public debt charges to GDP, 1870–2017
Publ
ic d
ebt
char
ges/
GD
P (%
)

16 • A Federal Fiscal History: Canada, 1867–2017 • Di Matteo
fraserinstitute.org
1947 at 4.8%. The next largest deficits were during World War I, when they developed from 4.3% in 1914 to 5.8% in 1916 to 8.6% in both 1918 and 1919. Then there were the deficits of the early 1980s with the largest being in 1982 (7.5% of GDP), 1983 (7.6%), and 1984 (8.2%). These deficits of the 1980s were the worst in a string of deficit years that stretch consecutively from 1970 to 1996.
Figure 5: Ratio (%) of the federal government’s deficit (−) or surplus (+) to GDP, 1870–2017
Sources for deficit: 1867–1965: Historical Statistics of Canada, HSC-H1-18, HSC-H19-34; 1966–2014: Federal Fiscal Reference Tables; 2015–2017: Federal Budget 2016. Sources for GDP: 1870–1985: Urquhart, 1988; 1961–2011: v646937; 1981–2014: v62305783; 2015–2017: Federal Budget 2016, Estimates.
-25
-20
-15
-10
-5
0
5
2017200719971987197719671957194719371927191719071897188718771867
Perc
enta
ge
Figure 6: The federal government’s real deficit (−) or surplus (+) ($2014) per capita, 1870–2017
Sources for deficit: 1867–1965: Historical Statistics of Canada, HSC-H1-18, HSC-H19-34; 1966–2014: Federal Fiscal Reference Tables; 2015–2017: Federal Budget 2016. Sources for population: 1867–1977: v742019 Canada; Estimated population; 1971–2015: v52154496 Canada, Total marital status; 2015–2017: Population 2015–2017 assumed to grow at average annual rate for 2000–2015; 1%. Sources for GDP deflator: 1870–1985: Urquhart, 1988; 1981–2014: v62788999; 2015–2017: Federal Budget 2016 assumes GDP inflation at −0.4%, 1%, and 2.4%; 1% annual average used.
-3,500
-3,000
-2,500
-2,000
-1,500
-1,000
-500
0
500
1,000
2017200719971987197719671957194719371927191719071897188718771867
$201
4

A Federal Fiscal History: Canada, 1867–2017 • Di Matteo • 17
fraserinstitute.org
In real per-capita terms ($2014), the largest deficits are those of World War II fol-lowed quite closely by those of the 1980s. The largest deficit ever in real per-capita terms ($2014) was $3,375 in 1943 and the next largest was $2,982 in 1984. Again, the years from 1970 to 1996 stand out as the longest period of real per-capita deficits in Canadian fiscal history. While 1930 to 1945 was also a period of continuous deficits in both real per-capita terms and as a share of GDP, it was considerably shorter than the era after 1970.
National debtThe sum of all deficits (and surpluses) plus interest is the national debt and figure 7, figure 8 and, figure 9 present a long-term overview of the net federal debt nominally, in real and nominal per-capita terms, and as a share of GDP. In 1867, the total net debt of the Government of Canada was $75.7 million and it is expected to reach $760 billion by 2017. Nominal per-capita federal net debt was $22 in 1867 and is expected to reach $20,740 by 2017. Real per-capita federal net debt (in 2014 dollars) grew from $549 in 1870 and is projected to reach $20,130 in 2017. It reached its highest point in 1995, peaking at $30,255. The ratio of net debt to GDP was 20.2% in 1870 and is expected to be approximately 36% in 2017; it was at its highest in 1946 at 108.9% and at its lowest in 1913 at 11.3%.
Figure 7: Net debt (nominal $ billions) of the federal government, 1867–2017
Sources for debt: 1867–1939: Canada Yearbook 1940, pp. 854–855 (dollars); 1940–1949: Canada Yearbook 1950, p. 1,024; 1950–1959: Canada Yearbook 1960, p. 1,090; 1960–1965: Canada Yearbook 1967, p. 1,045; 1966–2014: Federal Fiscal Reference Tables, 2015, tables 15, 13; 2015–2017: Federal Budget 2016. Note on data series: According to the Federal Fiscal Reference Tables, because of a break in the series following the introduction of full accrual accounting, data from 1983/84 onward are not directly compatible with earlier years.
0
100
200
300
400
500
600
700
800
2017200719971987197719671957194719371927191719071897188718771867
Net
deb
t (n
omin
al $
bill
ions
)

18 • A Federal Fiscal History: Canada, 1867–2017 • Di Matteo
fraserinstitute.org
Figure 8: Nominal and real ($2014) net debt per capita of the federal government, 1867–2017
Sources for debt: 1867–1939: Canada Yearbook 1940, pp. 854–855 (dollars); 1940–1949: Canada Yearbook 1950, p. 1,024; 1950–1959: Canada Yearbook 1960, p. 1,090; 1960–1965: Canada Yearbook 1967, p. 1,045; 1966–2014: Federal Fiscal Reference Tables, 2015, tables 15, 13; 2015–2017: Federal Budget 2016. Sources for population: 1867–1977: v742019 Canada, Estimated population; 1971–2015: v52154496 Canada, Total marital status; 2015–2017: Population 2015–2017 assumed to grow at average annual rate for 2000–2015; 1%. Sources for GDP deflator: 1870–1985: Urquhart, 1988; 1981–2014: v62788999; 2015–2017: Federal Budget 2016 assumes GDP inflation at −0.4%, 1%, and 2.4%; 1% annual average used.
0
5,000
10,000
15,000
20,000
25,000
30,000
35,000
2017200719971987197719671957194719371927191719071897188718771867
Dol
lars
Real ($2014)Nominal
Figure 9: Ratio (%) of the federal government’s net debt to GDP, 1870–2017
Sources for debt: 1867–1939: Canada Yearbook 1940, pp. 854–855 (dollars); 1940–1949: Canada Yearbook 1950, p. 1,024; 1950–1959: Canada Yearbook 1960, p. 1,090; 1960–1965: Canada Yearbook 1967, p. 1,045; 1966–2014: Federal Fiscal Reference Tables, 2015, tables 15, 13; 2015–2017: Federal Budget 2016. Sources for population: 1867–1977: v742019 Canada, Estimated population; 1971–2015: v52154496 Canada, Total marital status; 2015–2017: Population 2015–2017 assumed to grow at average annual rate for 2000–2015; 1%. Sources for GDP deflator: 1870–1985: Urquhart, 1988; 1981–2014: v62788999; 2015–2017: Federal Budget 2016 assumes GDP inflation at −0.4%, 1%, and 2.4%; 1% annual average used. Sources for GDP: 1870–1985: Urquhart, 1988; 1961–2011: v646937; 1981–2014: v62305783; 2015–2017: Federal Budget 2016, Estimates.
0
20
40
60
80
100
120
2017200719971987197719671957194719371927191719071897188718771867
Perc
enta
ge

A Federal Fiscal History: Canada, 1867–2017 • Di Matteo • 19
fraserinstitute.org
The current net public debt of Canada represents the accumulation of all the deficits (and surpluses) plus interest over all years since Confederation. Put another way, $667 billion—or 97% of the federal net debt in 2014—was acquired in the 46 years since 1970. Between 1867 and 2014, the average annual rate of growth of the federal net pub-lic debt comes in at 6.8%. Compare that to population, with an annual average growth rate of 1.6%, and inflation at 2.4% as measured by the annual average growth rate of the GDP deflator.
The dynamics of deficits and debt over the long term are ultimately shaped by the rela-tionship between interest rates (r) and the growth rate of the economy ( g). During periods where r > g, deficit financing can result in rapid debt accumulation and demon-strate the potential instability of deficit finance. During periods in Canadian economic history when r < g, the federal government would see a declining debt-to-GDP ratio even if running primary deficits.
The average growth rate in Canada has exceeded the average effective interest rate on the debt in two major periods: once during the era from about 1890 to 1920—the era of western settlement and the Great Boom—and then during the period from about 1935 to 1980—spanning the era of the postwar boom. During these eras it was possible to run deficits and reduce the deficit-to-GDP ratio. However, dur-ing the other periods, running approximately from 1867 to 1890, 1920 to 1935, and 1980 to the present, the interest rate has generally exceeded growth rates (see Appendix 1: Long-term Federal Debt Dynamics, p. 78).
Composition of revenue and expenditureFederal finances is about more than levels of spending and revenue, deficit and debt: the composition of spending and revenue is also of interest. The long-term evolution of the composition of federal government revenue and expenditure is illustrated in figure 10 and figure 11. From 1867 to World War I, the federal government’s revenue was domin-ated by customs duties, which peaked at 66% of revenue in 1912. During World War I, the financial needs of the war effort sparked the search for new revenue sources and, in quick order, there was the creation of the first personal and corporate income taxes and the first federal sales tax. Over time, the importance of these three new revenue sources grew and it is anticipated that by 2017 the personal income tax alone will make up 51% of federal government revenue, with corporate taxes making up 13% and commodity taxes (GST, excise taxes and customs duties), 17%.
20 • A Federal Fiscal History: Canada, 1867–2017 • Di Matteo
fraserinstitute.org
0
20
40
60
80
100
2017200719971987197719671957194719371927191719071897188718771867
Other
Excise taxes and duties
Customs duties
General sales taxes
Non-resident income tax
Corporate income tax
Personal income tax
Perc
enta
ge
Sources: 1867–1965: Historical Statistics of Canada, HSC-H1-18; 1966–2014: Federal Fiscal Reference Tables 2015; 2015–2017: Federal Budget 2016.
Figure 10: Evolution of the composition (%) of the federal government’s revenue, 1867–2017
0
20
40
60
80
100
2017200719971987197719671957194719371927191719071897188718771867
Public debt charges
Other program expenditure
National defence
Transfers to other governments
Employment relief, insurance
Old age security
Perc
enta
ge
Sources: 1867–1965: Historical Statistics of Canada, HSC-H1-18; 1966–2014: Federal Fiscal Reference Tables 2015; 2015–2017: Federal Budget 2016.
Figure 11: Evolution of the composition (%) of the federal government’s expenditure, 1867–2017
Family allowances, child benefits

A Federal Fiscal History: Canada, 1867–2017 • Di Matteo • 21
fraserinstitute.org
There has also been a shift in the composition of expenditure over the course of 150 years. Until the early twentieth century, the bulk of the federal government’s expendi-ture was on program spending across ministries—largely the wages and salaries of government employees, goods and services, national defence, and assorted economic development spending on transportation and communications. Over time, there has been an increase in transfers of three types: transfers to individuals, transfers to other governments, and transfers to bondholders, that is, interest on the debt.
In 1867, federal spending saw the federal government assume the debts and associ-ated debt service of the provincial governments and the provision of intergovernmental transfers as a condition for their surrender of revenue sources to the federal govern-ment. In 1867, transfers to provincial governments made up 21% of federal spending and public debt charges nearly 29%; however, there were no transfers to individuals in the form of old age security or other payments.
By 1913, payments to the provinces and public debt charges together only accounted for 13% of federal government spending while national defence accounted for 7.6% and the remainder was other program spending. The growth of a comprehensive welfare state, after World War II in particular, saw the onset of family allowances, old age security, and employment insurance. By 2017, transfers to individuals along with those to other governments and bondholders together are expected to account for nearly 58% of fed-eral government spending. Thus, the long-term evolution of federal government spend-ing is marked by transition during the twentieth century from an emphasis on goods and services to a role as a transfer agency.
Of course, as Canada is a federation, federal finances also operate within an environ-ment of provincial/territorial and local finances. The balance between the federal gov-ernment and the other tiers of the federation has also changed over time (figure 12A and figure 12B). The federal government’s share of total revenue (net of transfers) [23] declined in the years after Confederation but began to increase during the Great Depression and reached a peak during World War II and the immediate post-War era. Federal revenue as a share of total government revenue gradually declines starting in the 1950s and presently accounts for about 40% of total government revenue in Canada.
[23] In these two figures, the revenue side is total own source revenue for each level of government. The expenditure side is net of transfers to other tiers (i.e., federal transfers to the provinces are treated as provincial expenditure while provincial transfers to municipalities are treated as municipal expenditure).

22 • A Federal Fiscal History: Canada, 1867–2017 • Di Matteo
fraserinstitute.org
Aside from the period of World War II, expenditure has always been more decentralized than revenue given the provincial responsibilities for health and education under the terms of the Constitution. Immediately after Confederation, federal expenditure (once transfers are excluded from spending) constituted nearly 40% of total government spending in Canada. This declined until the 1920s and then began to rise until the late 1950s when decline set in again. From accounting for nearly 50% of total government
Figure 12b: Ratio of the federal government’s expenditure to total government expenditure (net of transfers to other governments), selected years, 1866–2014
Sources: 1870–1926: Urquhart, 1994; 1933–1960: Historical Statistics of Canada (net of transfers to other governments); 1961–2014: Federal Fiscal Reference Tables, various years (net of transfers to other governments).
0.0
0.1
0.2
0.3
0.4
0.5
0.6
0.7
0.8
0.9
201420102005200019951990198519801975197019611954195019451939193719331930192619211913190418741866
F /
(F +
P +
L)
Figure 12a: Ratio of the federal government’s revenue to total government revenue (exclusive of intergovernmental grants), selected years, 1866–2014
Sources: 1866–1954: Perry, 1955, vol. 2: tbl. 1, p. 619; 1961–2014: Federal Fiscal Reference Tables, various years.
0.0
0.1
0.2
0.3
0.4
0.5
0.6
0.7
0.8
0.9
201420102005200019951990198519801975197019611954195019451939193719331930192619211913190418741866
F /
(F +
P +
L)

A Federal Fiscal History: Canada, 1867–2017 • Di Matteo • 23
fraserinstitute.org
spending in the early 1950s, by 2010 the federal government’s share had declined to about 26% but has since rebounded. This evolution towards a greater decentralization of spending within the Canadian federation parallels the federal government’s evolution towards a transfer agency with provincial and local governments making most of the decisions about the allocation of public money. [24]
From this overview of federal government finances over the long term, it is useful to move into a more detailed fiscal exposition of key periods of Canada’s economic his-tory for a full understanding of the forces behind these trends. These periods are: [1] the nation-building phase of the Canadian economy from 1867 to 1913, during which Canada embarked on the development of a national infrastructure and settlement of the West; [2] the period of economic tumult marked by two world wars and the Great Depression from 1914 to 1945; [3] the post-War boom era and golden age of growth from 1945 to 1973; [4] the productivity slowdown of the post-oil-shock period starting in 1973 that culminated in the federal fiscal crisis of the early 1990s; and [5] the period since the fiscal crisis spanning the years 1996 to 2017.
[24] For a discussion of decentralization within the federation, see Di Matteo, 1995.

24 • A Federal Fiscal History: Canada, 1867–2017 • Di Matteo
fraserinstitute.org
4. Nation Building, 1867–1913
Armed with its nation-building powers, the federal government of the new Dominion of Canada [25] embarked on a program of geographic expansion and consolidation and development of a national infrastructure. Rupert’s Land was purchased from the Hudson Bay Company [26] and new provinces admitted, Manitoba in 1870, British Columbia in 1871, Prince Edward Island in 1873 and, with the surge in settlement on the prairies after 1900, Alberta and Saskatchewan in 1905. Railway projects linking the Maritimes with central Canada and the Canadian Pacific Railway (CPR) were started, and completed when the last spike of the CPR was driven in 1885.
Moreover, an aggressive program of western settlement was begun with the establish-ment of the Dominion Lands Policy that allowed for land grants of 160 acres to any set-tler over 18 years of age for 10 dollars after three years of residence and a minimum of use such as building a habitable residence and cultivating some portion of the land. [27] Between 1870 and 1914, Canada’s population grew from 3.625 million to 7.879 mil-lion while nominal GNP grew from $382.6 to $2,448.6 million. The growth rate of both population and output rose dramatically as a result of the massive investment boom and settlement of the prairies between 1900 and 1914 (Green and Urquhart, 1987: 183–186).
The finances of the federal government during its first half century were provided almost exclusively by indirect taxation—namely, customs duties and excise taxes—and this revenue proved sufficient for the financing of a nation-building program whose hallmark was the Canadian Pacific Railway. The CPR joined the manufacturing regions of the east with the western agricultural settlement frontier into a new national eco-nomic space behind the tariff wall of the National Policy (Fowke, 1957/1971). Indeed, spending on transportation and communications was the largest component of federal
[25] It should be noted that until the mid-twentieth century, the federal government was generally referred to as the Dominion Government.
[26] In return for Rupert’s Land, the Hudson Bay Company received £300,000 sterling, land around its trading posts, and one twentieth of fertile prairie land (Pomfret, 1993: 183).
[27] The first Dominions Land Act was in 1872 but it was only with the up-turn in world wheat prices after 1896 and a more energetic western settlement policy under Department of the Interior Minister Clifton Sifton that immigration to the prairies surged (Norrie, Owram, and Emery, 2008: 193–207).

A Federal Fiscal History: Canada, 1867–2017 • Di Matteo • 25
fraserinstitute.org
budgetary expenditure aside from debt service costs, which were substantial since the new federal government had assumed the public debts of the former British colonies as part of the terms of Confederation.
According to Gillespie (1991: 51), the philosophy of the new federal government for find-ing revenue to finance its nation-building program involved a trade-off between addi-tional debt or additional taxation. Maintaining a low rate of indirect taxation was seen as crucial in order to attract immigrants and promote growth as well as compete for capital and human resources with the adjacent United States. The cost of an extra dollar of debt issue was the reduced credit standing of the federal government and associated higher debt service costs while the cost of an extra dollar of tax revenue was the reduced net immigration flow. Federal government ministers were indeed quite sensitive to the economic effects of levying additional taxes. [28] When it came to tax mix, the federal government was concerned that imposing new direct taxes—namely, an income tax—might encourage emigration to the United States. [29]
Revenue, expenditure, debt, and deficitsFigures 13A, 13B, 14, and 15 provide details on federal government revenue, expenditure, net debt, and deficits as well as the composition of revenue and expenditure over the period from 1867 to 1913. The dawn of Canada saw a balanced budget with revenue and expenditure each at $14 million but deficits soon emerged as government spending on transportation infrastructure ramped up. Between 1867 and 1913, total revenue grew from $14 million to $163 million while total expenditure grew from $14 million to $185 million. As a percentage of GDP, deficits were largest prior to 1890 because of the heavy expendi-ture and subsidization of the Canadian Pacific Railway. However, there were additional rail-way projects after the CPR that were also subsidized by the federal government, including two more transcontinentals: the Canadian Northern Railway, completed in 1915, and the National Transcontinental, completed in 1913 (Norrie, Owram, and Emery, 2008: 203–204).
The building of the Canadian Pacific Railway was an important fiscal issue for the new country and its construction demonstrates the government’s philosophy of encouraging the participation of the private sector in the building of national infrastructure. The
[28] In 1878, Finance Minister Richard Cartwright noted that “the power of imposing fresh taxation is limited within comparatively narrow bounds … there are considerable dangers incident to any largely increased measure of taxation” (Gillespie, 1991: 52).
[29] Gillespie, 1991: 56. Migration to the United States was a constant concern as the absolute number of Canadian-born residents of the United States grew from 147,711 in 1850 to 1,204,637 by 1910 as between 1850 and 1920 nearly two million Canadians immigrated to the United States (Jackson, 1923: 27–28).

26 • A Federal Fiscal History: Canada, 1867–2017 • Di Matteo
fraserinstitute.org
CPR, an impressive engineering project, was also a significant joint economic under-taking by the public and private sectors and, in the absence of government economic support, it is unlikely it would have been constructed when it was given the sparse population west of Lake Superior. However, much of the research suggests that, while a subsidy was necessary given the large degree of risk associated with such a large cap-ital project, it was overly generous. [30] Indeed, the construction of the CPR provides an early example of how public-private partnerships can be harnessed for important national purposes and also how government needs to ensure that not too much public money is spent to achieve a given outcome.
For the entire period from 1867 to 1913, revenue grew at an average annual rate of 6.1% while spending grew at 7.2%. However, the mid-1890s appears to mark a break in growth rates coinciding with the great boom of western settlement. From 1867 to 1895, the average annual growth rate of revenue was 4.0% and that of expenditure, 5.4%, while from 1896 to 1913, the growth rate was 9.3% for revenue and 9.9% for expenditure. However, even with the robust growth of the wheat-boom era after 1896, expenditure generally grew faster than revenue and there were numerous deficits (figures 13A, 13B).
During the 47-year period from 1867 to 1913, the federal budget was in deficit 36 times, or 77% of the period. Deficits were somewhat more pronounced prior to the boom era with deficits in 83% of the years from 1867 to 1895 and 67% of years from 1896 to 1913. Revenue grew faster than expenditure in only 45% of the years between 1867 and 1895 but 67% of the time between 1896 and 1913. As result, there was an accumulation of debt and net federal debt rose from $75.7 million in 1867 to $253.1 million by 1895 and then grew more slowly to $314.3 million by 1913. As a share of GDP, the federal
[30] The CPR project began with a contract awarded in 1872 but the project fell apart in the wake of the Pacific Scandal of 1873 and the fall of the MacDonald conservatives; for the next few years only incremental work was done. In 1878, the MacDonald conservatives returned to power and in 1880 a contract and charter was awarded to the Canadian Pacific Railway Syndicate. The Dominion government provided a direct cash subsidy of $25 mil-lion as well as 25 million acres of land, the donation of 700 miles of track that had already been built, tax exemp-tions for construction materials and CPR lands, and no regulation of freight rates until the CPR was earning a 10% return on capital. The value of the completed sections of track and the cash subsidy alone totalled $63 million and was equivalent to about 11% of Canada’s entire GNP in 1885. George (1968) found that in dollars unadjusted for inflation, the private rate of return on the CPR for the period from 1886 to 1895 ranged from 2.1% to 4.1%, while for the inflation-adjusted figures the return ranged from 2.2% to 4.4% (or an average rate of 3.4%). Given that the normal rate of return on investment was in the 6%-to-10% range, these estimates demon-strate that the CPR was indeed not privately profitable and required a subsidy to make the project attractive to private investors. To yield a 6% return to the CPR the subsidy required was a lump sum in 1885 of $68 million. To yield a 10% return to the CPR in 1885 the subsidy required was a lump sum of $81 million. The value of the subsidy in 1885 is estimated to range from $121 million to $146 million. Therefore, the actual subsidy was about 50% too high. See George, 1968, 1975 for further insight and also Innis, 1971/1923 and Emery and McKenzie, 1996.

A Federal Fiscal History: Canada, 1867–2017 • Di Matteo • 27
fraserinstitute.org
government’s net debt rose from 20.2% in 1867 to peak at 38.5% in 1896. However, as a result of the economic boom it then fell to 11.3% in 1913. Indeed, this 11.3% net-debt-to-GDP ratio is the lowest ever achieved over the entire period from 1867 to 2017.
Composition of revenue and expenditureIn 1867, there were only four main revenue sources for the federal government. The largest category by far was customs duties, which made up 64% of federal revenue. This was followed by excise duties—primarily taxes on liquor and tobacco products—and then revenue from the Post Office. Other non-tax revenue includes revenue from
Figure 13a: Revenue and expenditure ($ millions) of the federal government, 1867–1913
Sources for revenue and expenditure: 1867–1965: Historical Statistics of Canada, HSC-H1-18, HSC-H19-34.
0
50
100
150
200
1912190919061903190018971894189118881885188218791876187318701867
RevenueExpenditure
$ m
illio
ns
0
6
12
18
24
30
36
42
1912190919061903190018971894189118881885188218791876187318701867-5
-4
-3
-2
-1
0
1
2
Net
deb
t/G
DP
(%)
Sources for deficit and surplus: 1867–1965: Historical Statistics of Canada, HSC-H1-18, HSC-H19-34. Sources for debt: 1867–1939: Canada Yearbook 1940, p. 854–855, dollars. Sources for GDP: 1870–1919: Urquhart, 1988.
Figure 13b: Ratio (%) of the federal government’s net debt and defict or surplus to GDP, 1870–1913
Defi
cit/
GD
P (%
)

28 • A Federal Fiscal History: Canada, 1867–2017 • Di Matteo
fraserinstitute.org
bullion and coinage, privileges, licenses and permits, and receipts from sales and ser-vices. The federal revenue base in 1867 was overwhelmingly based on indirect taxation and 86% of its revenue came from only two major sources (figure 14).
Federal budgetary expenditure in 1867 can be divided into seven major categories, the largest of which was debt service at 27%. Even though Canada in 1867 was a new polit-ical entity, the financial settlement of Confederation that entailed the Dominion gov-ernment’s assuming provincial debt meant that the new country started with a national debt. Transfers to other governments—namely, the Dominion statutory subsidies—were the next largest category at 20% and then general government, economic develop-ment, and transportation and communications each came in at 13%. [31] Then there were National Defence at 7% and assorted unclassified expenditure, also 7%.
By 1913, the federal government’s revenue had grown to $163 million but the compos-ition of that revenue was little changed (figure 15). Custom duties still accounted for 64% of total revenue. The share accounted for by excise duties had declined somewhat to 13% while that of other non-tax revenue grew to 14% and that of the Post Office to 8%. Moreover, by 1913 there were also small contributions to revenue from the return on government investments as well as from crown corporations.
Meanwhile, federal expenditure in 1913 still reflected the spending of nation building with transportation and communications accounting for 49% of spending and economic development 19%. This was the tail end of the wheat boom and coming years would see a shift away from expenditure of this sort. Public debt charges and national defence accounted for 7% each while general government accounted for 8% and transfers to other governments, 6%. As a share of spending, public debt charges fell over time despite the accumulation of debt as a result of the long-term decline in interest rates during the nineteenth century that afforded a fiscal dividend. Total federal spending in 1913 was $185 million, about 6.6% of GDP.
A classical liberal stateThe entire period from 1867 to 1913 demonstrated a federal government that saw its function as a laissez-faire, classical liberal state with its key responsibilities being insti-tutional infrastructure and economic nation building with spending concentrated on
[31] According to Urquhart and Buckley’s Historical Statistics of Canada (1965: 189), transportation and com-munications spending are mainly those of the Department of Public Works, the Department of Transport and the Post Office. Economic development is synonymous with resource development and includes the Departments of Agriculture, Fisheries, Mines and Technical Surveys as well as Trade and Commerce.

A Federal Fiscal History: Canada, 1867–2017 • Di Matteo • 29
fraserinstitute.org
Excise duties: 21.43%
Customs duties: 64.29%
Post o�ce: 7.14%
Other non-tax revenue: 7.14%
Defence: 6.67%Unclassified: 6.67%
Transport and communications: 13.33%
Economic development: 13.33%
General government: 13.33%
Transfers to other governments: 20.00%
Public debt charges: 26.67%
Source: Historical Statistics of Canada: HSC-H1-18, HSC-H19-34.
Figure 14: Composition of the federal government’s revenue and expenditure, 1867
Total revenue $14 million
Total expenditure $14 million

30 • A Federal Fiscal History: Canada, 1867–2017 • Di Matteo
fraserinstitute.org
Excise duties: 12.88%
Customs duties: 64.42%
Post oce: 7.98%
Other non-tax revenue: 13.50%
Return on Crown Corporations: 0.61%Return on investments: 0.61%
Other welfare and social security: 2.51%
Defence: 7.53%
Unclassified: 1.61%
Transport and communications: 48.92%
Economic development: 18.82%
General government: 8.06%
Transfers to other governments: 5.91%
Public debt charges: 6.99%
Source: Historical Statistics of Canada: HSC-H1-18, HSC-H19-34.
Figure 15: Composition of the federal government’s revenue and expenditure, 1913
Total revenue $163 million
Total expenditure $185 million

A Federal Fiscal History: Canada, 1867–2017 • Di Matteo • 31
fraserinstitute.org
transportation and communication networks. During this era, as a share of GDP, the federal government’s spending ranged from a low of 4.1% to a maximum of 10.5%, in 1885, the year of the completion of the CPR. Most years saw the ratio of federal expenditure to GDP below 7%.
All of this activity was financed mainly by custom and excise duties with a particular sensitivity to higher taxes as factors likely to discourage labour and capital from locat-ing in Canada, especially when facing competition from the adjacent United States. There was a reliance on debt financing, with the ratio of net debt to GDP rising from 1870 to 1896 but, given the erection of a national transport and communications infra-structure, such expenditure was justified as investment in the future. Indeed, the pres-ence of a national rail link by the mid-1890s facilitated the settlement of the west and ultimately was a precursor to the economic prosperity of the wheat-boom era.
A key lesson from this era is that, used prudently, debt financing can be useful when used to fund investments in economic capacity provided it is combined with reason-able taxation rates and low borrowing costs. [32] Indeed, the most significant example of the use of debt and deficits is that funding the construction of the transcontinental CPR railway during the nation-building phase of the Canadian economy when subsidies were paid to encourage the building of a risky capital project. However, the same strat-egy also resulted in over-subsidization of the CPR as well as substantial subsidies to two other rail lines that were less successful as private enterprises.
The Canadian Northern Railway and the Grand Trunk-National Transcontinental Railway were nearing completion at the end of the wheat-boom era and construction had commenced on the Hudson Bay Railway in 1912, and it was assumed the era of high economic growth would continue. However, the impact of World War I on trade and travel resulted in both of these railways running into financial difficulty and, eventually, in their merger and the creation of the Canadian National Railway in 1922 under gov-ernment ownership. [33] While the role of the federal government in the creation of a national economy by means of debt financing of infrastructure was valuable, in the end a policy of less rather than more debt would have been beneficial.
[32] Gillespie (1991: 71) summarizes federal government fiscal policy during this period as “tax lightly, bor-row cheaply, and spend”.
[33] Norrie, Owram, and Emery (2008: 282) note that federal and provincial governments with their gen-erous loan guarantees were in the end the architects of this railway crisis as the projects were built on debt rather than equity. Lewis and MacKinnon (1987) estimate that these projects had a 70% ex ante probability of going bankrupt.

32 • A Federal Fiscal History: Canada, 1867–2017 • Di Matteo
fraserinstitute.org
5. War and Depression, 1914–1945
The years from 1914 to 1945 marked the end of Canada’s wheat-boom era, the end of the first great age of globalization, and the start of several traumatic decades in international economic and political history that included revolutions, the rise of communism and fas-cism, two world wars and the Great Depression. The prosperity of the pre-1914 era was marked by the centrality of Europe both economically and politically and combined free markets and trade to create a world economy with liberal legal and constitutional insti-tutions in its primary economies and the British pound as the international currency (Hobsbawm, 1998: 6–9). Moreover, it was an age of free movement not only for commod-ities but also for labour, with mass migration from the old world to the new. [34]
World War IThe years 1914 to 1915 saw the end of the boom and a rise in unemployment as well as the start of First World War I—the Great War—with its demands. The coming of the Great War sparked an enormous need for revenue on the part of the federal government and revenue from tariffs quickly proved inadequate as international trade dried up because of war. The most significant development in federal finance during this period was the introduction of direct taxation, [35] a tax on business profits in 1916 and a gen-eral personal income and corporation income tax in 1917. Despite these new revenue sources, the federal government also moved into deficit financing and the vast war debt that accumulated led to continuing revenue needs. As a result, in 1921 the federal sales tax—the Manufacturers Sales Tax—was brought in. Thus, this period saw an expansion of the federal government’s revenue tools, thereby creating the modern tax and pub-lic finance system, as well as an unprecedented experience with large-scale deficits and debt acquisition.
Gillespie notes that during this period: “Taxes were born, grew and died at a speed unparalleled at any other time” ( 1991: 109)). Indeed, tax revenue as a share of GNP
[34] The period from 1820 to 1914 saw 55 million Europeans migrate to North America (71%), South America (21%), and Australasia (7%), averaging about 300,000 per year up to the 1870s and then peaking at about 1.4 million annually in the years leading up to World War I (Ferrie and Hatton, 2013: 4).
[35] Direct taxes are taxes (such as income taxes) levied directly on people while indirect taxes (such as sales taxes) are taxes levied on things. This traditional distinction is somewhat academic as all taxes are ultimately paid by people.

A Federal Fiscal History: Canada, 1867–2017 • Di Matteo • 33
fraserinstitute.org
jumped from about 5.5% of GNP at the start of the war, rising sharply to reach 9% by 1921 (Gillespie, 1991: 110). Along with the birth of the personal and corporate income taxes as well as the national sales tax, this era saw the creation of a special ad valorem customs duty in 1915 that eventually ended in 1920. An excess profits tax was created in 1916; it also ended in 1920. As well, a group of luxury excise taxes were created in 1918 that also were ended by 1920.
Finance in the period of World War I was shaped by a number of factors, the first being the expectation that it would be a short war, an expectation that soon evaporated. This led to the deferment of income taxation until nearly the end of the war as a result of the reluctance to embrace income taxation. Indeed, there was still a general reluctance to impose new and higher taxes as it was felt this would detract from Canada’s competitive position as one of the lowest taxed countries in the world (Perry, 1955: 144). Second, the demands of the Great War on government finance turned out to be modest relative to national output, at least in comparison with World War II. However, as a share of fed-eral expenditure, the two wars were quite comparable: World War I resulted in defence spending hitting about 60% of federal spending while it rose to 80% during World War II. As a result, it was decided at first to finance the war effort primarily by borrowing and the War and Victory Loans program seemed a satisfactory solution to a difficult problem (Perry, 1955: 149).
World War I saw the creation of a debt finance program that was also largely followed during World War II. As a result of the war, access to foreign sources of borrowing became more difficult and therefore the federal government began to issue bonds in Canada, mainly targeting small domestic savers. Financing during World War II was similar except the government targeted retail investors more directly (Pellerin, 2006: 38). The Victory bond issues proved quite popular with Canadians and far more money was raised within Canada than abroad: $2 billion was raised during World War I and $9 bil-lion during World War II (Wrobel, 1995: 2).
The period of World War I saw expenditure from 1915 to 1920 for the war and demobil-ization that cost $1.672 billion with all other non-war expenditure totalling $1.742 bil-lion and with the total accumulated deficit during this period at $1.952 billion (Deutsch,
1940: 540). While new taxes were introduced during this period, in 1918 tariffs and excise duties still accounted for about 70% of federal budgetary revenue and the per-sonal income tax that was created brought in about 2% of federal revenue. Nevertheless, the stage was set for the future expansion of the income-tax system, particularly when it came to financing World War II.

34 • A Federal Fiscal History: Canada, 1867–2017 • Di Matteo
fraserinstitute.org
The interwar period and the Great DepressionThe Canadian economy in the interwar period was marked by a serious recession in 1921, the boom of the roaring ’20s, the 1929 stock-market crash, and then the Great Depression. The recession of 1921 was quite sharp but brief, with a fall of real GNP of 9.6% in 1921 followed by a rebound of 14.5% in 1922 (Norrie, Owram, and Emery, 2008:
281). Economic growth then continued until the end of the decade fuelled by continued expansion of the prairie wheat economy, new consumer technologies such as auto-mobiles and home appliances, as well as resource development particularly in pulp and paper and mining, largely driven by American demand. With the onset of the Great Depression, which reached its worst effects in 1933 when nearly one in four Canadians was unemployed, economic growth collapsed and only in 1939 did real national output surpass that of 1929.
The era of World War I and its immediate aftermath also saw an expansion of federal spending on people and social welfare as a result of the need to provide services for veterans, as well as the establishment of the first old-age pensions. Under the Old Age Pension Act of 1927, the federal government offered to pay half the cost to every prov-ince, which agreed to establish a system of old-age pensions. [36] The onset of the Great Depression after the 1929 stock-market crash also led to increased federal assistance to the provinces to meet the needs of relief costs (unemployment and social assistance) with grants that assumed about 40% of the total outlays on relief from 1930 to 1937 (Smiley, 1940/1964: 176).
The Great Depression severely stressed the finances of provincial governments since relief was a provincial responsibility, and the Rowell-Sirois Royal Commission was appointed to examine federal-provincial finances. Its recommendations of national adjustment grants and a more comprehensive federal unemployment relief program were shelved at the onset of World War II but eventually became key parts of federal government policy in the post-War era.
World War IIThe onset of World War II was a major economic and fiscal transformation for Canada. Federal finance saw change first in debt acquisition and second in the War Taxation Agreements that saw the federal government essentially take over provincial personal
[36] La Forest, 1967: 22–23. It should be noted that this 50% co-payment on the part of the federal govern-ment also established a precedent that repeats itself with the 1957 Hospital Insurance and Diagnostics Act and then Medicare in 1966.

A Federal Fiscal History: Canada, 1867–2017 • Di Matteo • 35
fraserinstitute.org
and corporate income tax bases in return for a compensatory revenue payment. Moreover, financing of the war saw major increases in personal and corporate income-tax rates as well as in commodity taxes on spirits and tobacco. As Perry notes: “This revenue source [the personal income tax] was exploited with an energy that surpassed all previous expectations. Rates were raised to levels which seem almost as unbeliev-able in retrospect as they would have seemed in anticipation” (1955: 360). [37] There was a flat 20% increase in rates in 1939 followed by the introduction of a national defence income-tax rate in 1940 followed by further increases in rates in 1942 as well as reduced exemptions (Perry, 1955: 360). The most remarkable dimensions of these changes invariably include high marginal tax rates on additional income in many of the income ranges. For example, before World War II the marginal rate on taxable income exceeding $1000 (but below $2000) was 4% while by 1942 it was 44%. The marginal rate on taxable income exceeding $10,000 (but below $15,000) was 13.7% before the war and 69% by 1942 (Perry, 1955: 368). While these rates came down after the war, they nevertheless remained higher than they had been before the war.
Revenue, expenditure, debt, and deficitsFigures 16A and 16B provide an overview of federal revenue, spending, net debt, and deficits for the period from 1914 to 1945. Figures 17, 18, 19, and 20 provide details on the composition the federal government’s revenue and expenditure for 1918, the end of World War I; 1929, the end of the roaring ’20s; 1933, the depth of the Great Depression; and 1945, the end of World War II.
Whereas 1912 was marked by a surplus of $26 million with revenue of $169 million and expenditure of $143 million, the end of the boom quickly plunged the federal govern-ment into deficit. The year 1913 was marked by budgetary revenue of $163 million and expenditure of $185 million for a deficit of $22 million. This was followed by a worsen-ing situation in 1914 when revenue collapsed to $133 million while expenditure grew to $246 million as a result of the start of World War I. The federal budget was to remain in deficit until 1923; from that year until 1929 there were successive surpluses. The arrival of the Great Depression again plunged the federal government into deficit and there would be a deficit until the end of the period, in 1945.
The growth of federal expenditure and revenue was especially pronounced during World War II (figure 16A). Despite the Great War and the Depression, the period from 1914
[37] There was indeed opposition from Canadians to the increases in the personal income tax during World War II (Tillotson, 2015).

36 • A Federal Fiscal History: Canada, 1867–2017 • Di Matteo
fraserinstitute.org
to 1938 was marked by an annual average growth rate of federal budgetary revenue of 5.5%, compared to 5.7% for expenditure. However, the period from 1939 to 1945 saw revenue grow at an annual average of 31.6% and expenditure at 44%. The result of course was the accumulation of debt and a rising debt-to-GDP ratio.
Between 1914 and 1945, there was a deficit 25 out of 31 years—just over 80% of the time. This was in contrast to the period from 1896 to 1913, which saw deficits only about two thirds of the time. During World War I, deficits ranged from a low of $113 million in 1914 to a high of $383 million in 1918 with an increase to $390 million in
Figure 16A: Revenue and expenditure ($ millions) of the federal government, 1914–1945
Sources for revenue and expenditure: 1867–1965: Historical Statistics of Canada, HSC-H1-18, HSC-H19-34.
0
1,000
2,000
3,000
4,000
5,000
6,000
19441941193819351932192919261923192019171914
RevenueExpenditure
$ m
illio
ns
0
16
32
48
64
80
96
19441941193819351932192919261923192019171914-25
-20
-15
-10
-5
0
5
Net
deb
t/G
DP
(%)
Sources for deficit and surplus: 1867–1965: Historical Statistics of Canada, HSC-H1-18, HSC-H19-34. Sources for debt: 1867–1939: Canada Yearbook 1940, p. 854–855, dollars; 1940–1949: Canada Yearbook 1950, p. 1,024. Sources for GDP: 1870–1985: Urquhart, 1988.
Figure 16B: Ratio (%) of the federal government’s net debt and defict or surplus to GDP, 1914–1945
Defi
cit/
GD
P (%
)
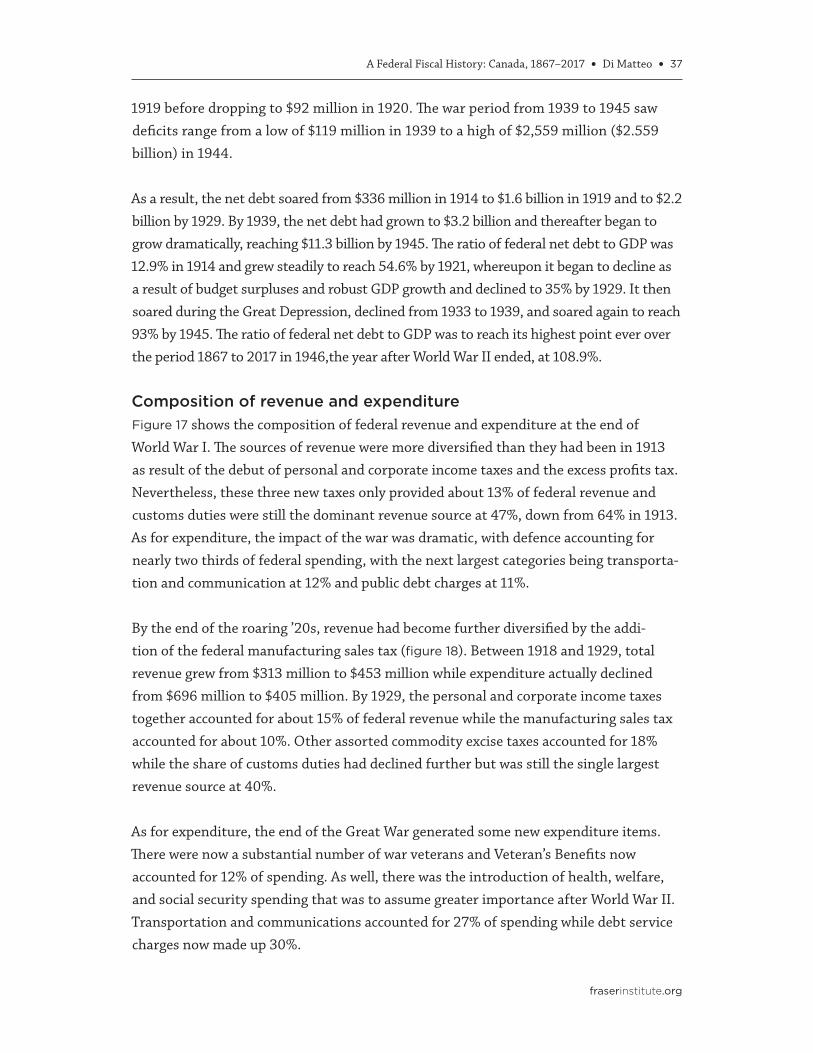
A Federal Fiscal History: Canada, 1867–2017 • Di Matteo • 37
fraserinstitute.org
1919 before dropping to $92 million in 1920. The war period from 1939 to 1945 saw deficits range from a low of $119 million in 1939 to a high of $2,559 million ($2.559 billion) in 1944.
As a result, the net debt soared from $336 million in 1914 to $1.6 billion in 1919 and to $2.2 billion by 1929. By 1939, the net debt had grown to $3.2 billion and thereafter began to grow dramatically, reaching $11.3 billion by 1945. The ratio of federal net debt to GDP was 12.9% in 1914 and grew steadily to reach 54.6% by 1921, whereupon it began to decline as a result of budget surpluses and robust GDP growth and declined to 35% by 1929. It then soared during the Great Depression, declined from 1933 to 1939, and soared again to reach 93% by 1945. The ratio of federal net debt to GDP was to reach its highest point ever over the period 1867 to 2017 in 1946,the year after World War II ended, at 108.9%.
Composition of revenue and expenditureFigure 17 shows the composition of federal revenue and expenditure at the end of World War I. The sources of revenue were more diversified than they had been in 1913 as result of the debut of personal and corporate income taxes and the excess profits tax. Nevertheless, these three new taxes only provided about 13% of federal revenue and customs duties were still the dominant revenue source at 47%, down from 64% in 1913. As for expenditure, the impact of the war was dramatic, with defence accounting for nearly two thirds of federal spending, with the next largest categories being transporta-tion and communication at 12% and public debt charges at 11%.
By the end of the roaring ’20s, revenue had become further diversified by the addi-tion of the federal manufacturing sales tax (figure 18). Between 1918 and 1929, total revenue grew from $313 million to $453 million while expenditure actually declined from $696 million to $405 million. By 1929, the personal and corporate income taxes together accounted for about 15% of federal revenue while the manufacturing sales tax accounted for about 10%. Other assorted commodity excise taxes accounted for 18% while the share of customs duties had declined further but was still the single largest revenue source at 40%.
As for expenditure, the end of the Great War generated some new expenditure items. There were now a substantial number of war veterans and Veteran’s Benefits now accounted for 12% of spending. As well, there was the introduction of health, welfare, and social security spending that was to assume greater importance after World War II. Transportation and communications accounted for 27% of spending while debt service charges now made up 30%.

38 • A Federal Fiscal History: Canada, 1867–2017 • Di Matteo
fraserinstitute.org
Personal income tax: 2.55%Corporate income tax: 0.32%
Excess profits tax: 10.51%
Other excise duties: 3.82%
Excise duties: 9.55%
Customs duties: 46.82%
Miscellaneous taxes: 0.64%
Post o�ce: 7.01%
Other non-tax revenue: 16.24%
Return on Crown Corporations: 0.96%
Return on investments: 1.59%
Other welfare and social security: 0.58%
Defence: 63.17%
Unclassified: 2.30%
Veterans benefits: 4.32%
Transport and communications: 12.37%
Economic development: 3.45%
General government: 1.15%
Transfers to other governments: 1.58%
Public debt charges: 11.08%
Source: Historical Statistics of Canada: HSC-H1-18, HSC-H19-34.
Figure 17: Composition of the federal government’s revenue and expenditure, 1918
Total revenue $313 million
Total expenditure $696 million

A Federal Fiscal History: Canada, 1867–2017 • Di Matteo • 39
fraserinstitute.org
Personal income tax: 5.97%
Corporate income tax: 9.29%
Sales tax:9.73%
Other excise duties: 4.20%
Excise duties: 14.38%Customs duties: 39.60%
Miscellaneous taxes: 0.44%
Post o�ce: 7.30%
Other non-tax revenue: 3.54%
Return on Crown Corporations: 0.88%Return on investments: 1.99% Special receipts and credits: 2.65%
Health: 0.25%Welfare: 0.49%
Other welfare and social security: 1.48%
Defence: 5.43%Unclassified: 3.70%
Veterans benefits: 12.35%
Transport and communications: 26.67%
Economic development: 8.64%
General government: 7.16%
Foreign a�airs: 0.25%
Transfers to other governments: 3.46%
Public debt charges: 30.12%
Source: Historical Statistics of Canada: HSC-H1-18, HSC-H19-34.
Figure 18: Composition of the federal government’s revenue and expenditure, 1929
Total revenue $453 million
Total expenditure $405 million

40 • A Federal Fiscal History: Canada, 1867–2017 • Di Matteo
fraserinstitute.org
The Great Depression witnessed an increase in spending and a drop in revenue. Between 1929 and 1933, total federal revenue dropped from $453 million to $325 million, a 28% decline. Figure 19 shows the distribution of revenue and expenditure at the depth of the Great Depression. The share of revenue accounted for by sales taxes and excise duties was 44% while that accounted for by customs duties was 20%. In terms of spending, the most notable change was the expansion of relief spending as a result of the needs cre-ated by the Depression, and the combination of total welfare and other social security spending reached 12% of federal spending during this period.
By the end of World War II, there had been an expansion of spending and revenue reaching into the billions of dollars (figure 20). In 1945, total federal revenue topped $3 billion while total expenditure exceeded $5 billion. National defence was of course dom-inant, making up 57% of federal budgetary expenditure in 1945. Public debt charges on the other hand had dropped to 9% of spending.
The war brought back the excess profits tax and this tax, combined with personal and corporate income taxes now accounted for 44% of federal revenue. As well, an estate tax—a duty imposed on the value of property passing at the time of death— was introduced in 1941 under the Succession Duty Act, which was replaced by the Estate Tax Act in 1959. [38] Sales taxes and excise duties together now accounted for about 23% of revenue while the share accounted for by custom’s duties had dropped to 4%. One other notable item of revenue in 1945 was special wartime receipts and credits, which accounted for just over one fifth of federal revenue. These were non-recurring items and largely made up of capital refunds and special revenue under the war appropriation acts. [39]
[38] The Estate Tax was repealed in 1972 as part of a process of tax reform. It was generally a minor source of federal government revenue and never exceeded 2% of total federal revenue. By the 1960s, the Federal Estate Tax for domiciled decedents allowed a basic exemption of $40,000 with additional exemptions if there were surviving spouses and children. Rates of taxation ranged from 10% to 16% for the first $20,000 of taxable estate value. For values of $20,000 to $200,000, the tax rate ranged from 18% to 26%. From $200,000 to $750,000, the rates ranged from 28% to 42%. From $750,000 to $1,800,000, the rates con-tinued rising eventually reaching 52%. On remaining amounts, the rate was 54% (Canada, Department of
National Revenue, Taxation Division, 1964: 80–81). There was also a Gift Tax, first imposed in 1935 (Perry, 1984:
228). By the 1960s, the Gift Tax ranged from 10% on an aggregate taxable gift value of $5,000 and under to 28% on amounts over $1,000,000. The Federal Gift Tax was also repealed in 1972 (Canada, Dominion Bureau
of Statistics, 1962: 1021; Bird, 1978).
[39] Examples include refunds of previous year’s war expenditure, the sale of surplus war assets and equipment, amounts for materials and equipment received from foreign governments, and so on (Public
Accounts, 1945: xxxv.
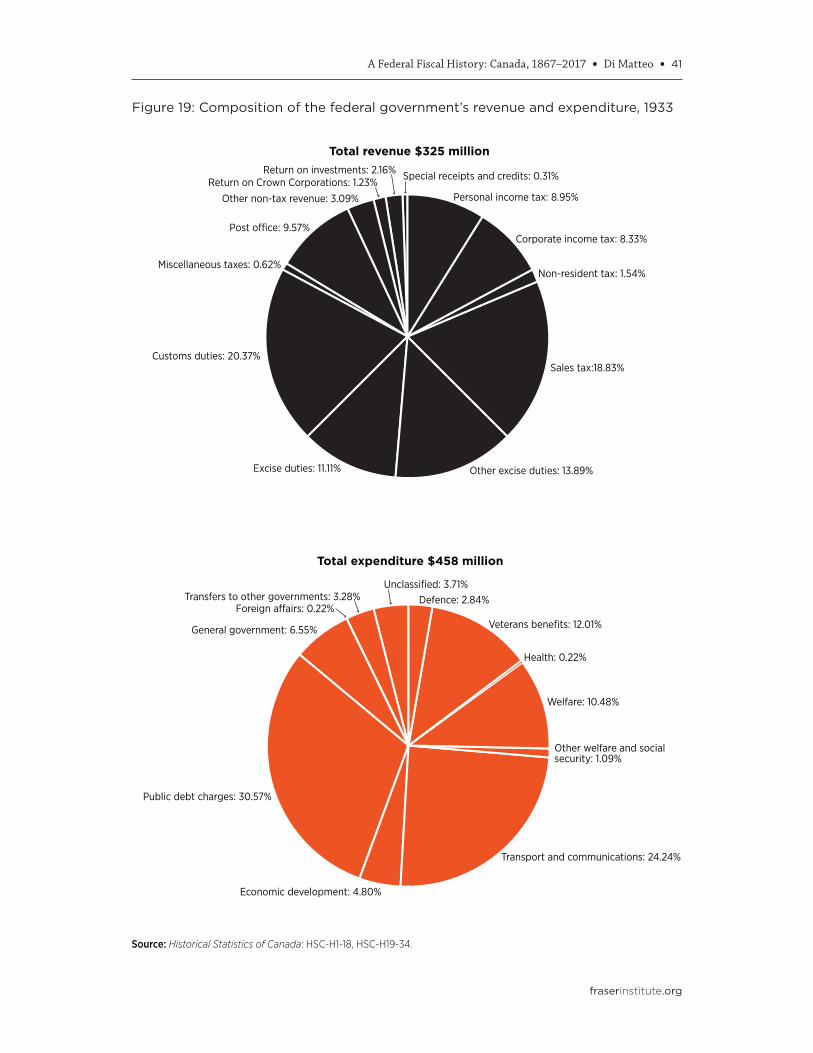
A Federal Fiscal History: Canada, 1867–2017 • Di Matteo • 41
fraserinstitute.org
Personal income tax: 8.95%
Corporate income tax: 8.33%
Non-resident tax: 1.54%
Sales tax:18.83%
Other excise duties: 13.89%Excise duties: 11.11%
Customs duties: 20.37%
Miscellaneous taxes: 0.62%
Post oce: 9.57%
Other non-tax revenue: 3.09%
Return on Crown Corporations: 1.23%Return on investments: 2.16% Special receipts and credits: 0.31%
Health: 0.22%
Welfare: 10.48%
Other welfare and social security: 1.09%
Defence: 2.84%Unclassified: 3.71%
Veterans benefits: 12.01%
Transport and communications: 24.24%
Economic development: 4.80%
General government: 6.55%
Foreign a�airs: 0.22%Transfers to other governments: 3.28%
Public debt charges: 30.57%
Source: Historical Statistics of Canada: HSC-H1-18, HSC-H19-34.
Figure 19: Composition of the federal government’s revenue and expenditure, 1933
Total revenue $325 million
Total expenditure $458 million

42 • A Federal Fiscal History: Canada, 1867–2017 • Di Matteo
fraserinstitute.org
Personal income tax: 22.79%
Corporate income tax: 7.23%
Excess profits tax: 14.16%
Non-resident tax: 0.93%
Estate tax: 0.73%Sales tax: 7.03%
Other excise duties: 9.45%
Excise duties: 6.20%
Customs duties: 4.28%
Miscellaneous taxes: 0.30%Post o�ce: 2.29%
Other non-tax revenue: 0.70%Return on Crown Corporations: 1.86%Return on investments: 0.50%
Special receipts and credits: 21.56%
Health: 0.04%
Family allowances: 3.37%Welfare: 0.84%
Other welfare and social security: 1.32%
Defence: 57.25%
Unclassified: 10.57%
Veterans benefits: 7.82%
Education assistance: 0.27%Transport and communications: 2.51%
Economic development: 2.69%
General government: 2.53%Foreign a�airs: 0.08%
Transfers to other governments: 2.20%
Public debt charges: 8.52%
Source: Historical Statistics of Canada: HSC-H1-18, HSC-H19-34.
Figure 20: Composition of the federal government’s revenue and expenditure, 1945
Total revenue $3,013 million
Total expenditure $5,136 million

A Federal Fiscal History: Canada, 1867–2017 • Di Matteo • 43
fraserinstitute.org
An era of transitionThe period from 1914 to 1945 was a transformative era in the fiscal history of Canada’s federal government, an era when a nineteenth-century revenue and expenditure sys-tem made the transition into the twentieth century. The crucial period was World War II rather than the First, which was of a smaller scale. Real per-capita federal government spending (in 2014 dollars) from 1914 to 1918 rose from $750 to $1,250 whereas from 1929 to 1945 it went from $1,150 to $6,272. The ratio of federal expenditure to GDP was 16% in 1918 and 25% in 1945.
In 1914, the onset of war was seen as a temporary interruption to the traditional busi-ness of government and the system of government finance was much as it had been in 1867. As World War I progressed, it rapidly became evident that existing revenue sources were largely inadequate for funding a modern war. The Great Depression was an additional shock to government as the economy teetered on the brink of collapse. By the end of World War II, the Canadian tax and expenditure system had been completely transformed by the addition of new taxes and expenditure as well as by experience with large-scale debt finance. Indeed, one might argue that Canadians became more comfort-able with the notion of large amounts of public debt, a sense of comfort that was dan-gerously misplaced in the long run given the subsequent debt run-up that started in the 1970s and culminated in the debt crisis of the 1990s.
A dominant feature of the period from 1914 to 1945 was what can only be termed nearly continuous adjustment to an ongoing series of major international economic and polit-ical shocks (Norrie, Owram, and Emery, 2008: 236). The perceived failure of the liberal mar-ket order of the era before World War I to generate prosperity after the war ultimately led to the transformation of the prevailing philosophy of governments internation-ally as well as of Canadian federal finance. Canada’s federal government evolved from one steeped in classical economic liberalism to one focused on a more interventionist government. The mobilization for the war effort in both wars involved the federal gov-ernment’s intervention in production and prices, which set the stage for a more inter-ventionist government in the years to come. During this period of war, the federal gov-ernment was involved in housing construction as well as price, rent, and wage controls, education, pensions, and industrial regulation.
Notwithstanding some of the positive benefits of public investments in welfare, health, and education, the uncritically positive attitude that arose during the period after World War II towards direct economic management by government in response to what were seen as the deficiencies of the market economy during the interwar period was in

44 • A Federal Fiscal History: Canada, 1867–2017 • Di Matteo
fraserinstitute.org
some respects unwise. Governments, and especially authoritarian ones, were ultimately responsible for pursuing both world wars with their subsequent disruptive effects. As for economic dislocation, one might even argue that the government’s policy response to the slowdown of the late 1920s was ultimately responsible for turning what should have been a recession into a catastrophic depression. Along with tight monetary policy, other key blows to the global economy were the return to the gold standard, [40] the rise of tariff barriers, and the drying up of international trade. The absence of flexible exchange rates and the presence of tariffs removed what could have been natural mar-ket adjustment to economic shocks (Temin, 1989).
[40] According to research by Eichengreen (1992) and Eichengreen and Temin (1997), countries that escaped the gold standard and changed to floating exchange rates first, such as Britain in 1931 and America in 1933, tended to recover earlier and far faster.

A Federal Fiscal History: Canada, 1867–2017 • Di Matteo • 45
fraserinstitute.org
6. Post-War Boom, 1945–1973
The end of World War II ushered in a period of robust economic growth and prosper-ity that seemed counter to the conventional wisdom that the end of wartime demand would spark a return to depression-like economic conditions. The period from 1945 to 1973 was marked by significant growth in GDP, rising employment, and expand-ing population in Canada and around the world. Canada’s GDP during this period grew from $12.1 billion in 1945—the start of the post war boom—to reach $128.2 billion in 1973, the start of the productivity slow-down and oil price shock era. This was nearly an 11-fold increase in output compared to the six-fold increase from 1914 to 1945.
In the international sphere, the General Agreement on Tariffs and Trade in 1947 was a rebuttal to the protectionism of the 1930s and sparked a liberalization of the world trad-ing environment and growth in trade at an annual rate of about 7% (Norrie, Owram, and
Emery, 2008: 366). In Canada, pent-up demand from the war years for consumer goods, the presence of substantial private savings from such pent-up demand, as well as the war’s disruption of family formation resulted in a consumer and business spending boom fol-lowed by the demographic surge of the baby boom which in turn reinforced spending. [41]
The period from 1945 to 1950 saw the transition to a peacetime economy with a rise in consumer and investment spending. The baby boom picked up steam during the 1950s, which led to an investment boom driven by housing, transportation and institutional construction. Expanding the transportation infrastructure by national highway building and the construction of the St. Lawrence Seaway further boosted the economy. When combined with the natural resource boom in energy of the 1950s and the manufactur-ing growth of the 1960s as a result of the Auto Pact of 1965, the result was a golden age of economic prosperity.
Building the welfare stateThe period from 1945 to 1973 also saw the federal government assume a more interven-tionist role in the economy; this was ultimately marked by a shift in the composition of its spending from goods and services to transfers as well as an increase in the tax
[41] For an overview of this era’s robust economic growth, see Norrie, Owram, and Emery, 2008: 362–384; and Perry, 1989: 1–25.

46 • A Federal Fiscal History: Canada, 1867–2017 • Di Matteo
fraserinstitute.org
burden on the economy to fund an expansion of programs. Government became deter-mined to play a greater role in the day-to-day life of citizens but this new role of the state was eventually to yield mixed results for overall national economic performance and welfare, and was to become associated with the fiscal crisis of the early 1990s.
The impetus for the modern welfare state [42] can be traced to the aftermath of the Great Depression and the British Beveridge Report, released in 1942. [43] The federal government commissioned the 1943 Report on Social Security and the 1945 White Paper on Employment, which laid the groundwork for social security and the basic principles of economic management in a Keynesian framework: the pursuit of full employment via aggregate demand management. As well, at the 1945 Dominion–Provincial Conference, the Green Book proposals were presented for social assistance and hospital insurance but these moved more slowly as they were directly in provincial jurisdiction.
Canada’s federal government had already sponsored the establishment of unemploy-ment insurance in 1940 (with coverage and benefits substantially expanded in 1971) and in 1945 introduced the program of family allowances. In 1952, Old Age Security was brought in [44] while 1965 saw the establishment of the Canada (and Quebec) Pension Plan and 1967 saw the introduction of the Guaranteed Income Supplement (Perry, 1989: 47). These transfers at the individual level were accompanied by the growth of transfers at the governmental level in the areas of health and education including equalization.
The federal system of post-war intergovernmental transfers is rooted in the Dominion subsidies of Confederation and was given impetus to change by the strains imposed by the Great Depression and the recommendation of the Rowell-Sirois Report in 1940 that a system of National Adjustment Grants be created. These recommendations were shelved as a result of World War II and the federal government took over the personal and corporate tax base and “rented” them from the provinces over what became known as the Wartime Tax Agreements. This type of arrangement continued during the period immediately after the war under what were known as the Tax Rental Agreements but eventually the provinces found it more lucrative to run their own tax systems.
[42] For an overview of the development of the Canadian welfare state, see Moscovitch, 2015.
[43] This was formally known as the Report on Social Insurance and Allied Services and in Britain ultimately resulted in family allowances, national health services, national insurance (worker’s compensation), rent controls, and social security that included unemployment and death benefits.
[44] Old Age Security pensions began in 1952 at $40 per month to all persons aged 70 years and over or at 65.

A Federal Fiscal History: Canada, 1867–2017 • Di Matteo • 47
fraserinstitute.org
However, the concept of payments to the provinces continued under what became known as the Federal-Provincial Fiscal Arrangements Acts starting in 1957, which mark the beginning of federal transfers for health as well as the establishment of equaliza-tion. Equalization was designed to provide federal support to provinces with weaker revenue bases and evolved into a system whereby funds were transferred to less pros-perous provincial governments to provide their residents with reasonably comparable public services at reasonably comparable levels of taxation. The first equalization system provided an unconditional grant that attempted to equalize the yields from only three taxes: personal income taxation, corporate income taxation, and succession duties. This was to change in the years to come as the system grew ever more complicated.
The federal government wished to promote nation-wide medical and social programs and often did so under cost-sharing arrangements with the provinces. The Hospital Insurance Diagnostic Services Act (1957) offered open-ended conditional matching grants to provinces to fund hospital care and diagnostic services while the Medical Care Act (1966) made a similar arrangement to fund physician services, thus putting in place the foundation of Canada’s public health-care system; that is, the federal contribution was 50% of provincial costs.
Also introduced in 1966 was the Canada Assistance Plan (CAP), which was another 50/50 cost-sharing arrangement but this time for provincial expenditure on social assistance. As well, starting in 1967, the federal government also began making its con-tributions to post-secondary education directly to the provinces, thus completing the planks of the modern system of federal transfers to the provinces. [45]
In short, by the early 1970s, the federal government had put into place a comprehensive framework of expenditure policies built on the robust economic growth after World War II and the faith that such robust growth would continue. [46] Along with the use of the apparatus of the federal government to provide for health, education, and income secur-ity, there was also an attempt to deal with regional fiscal and economic disparities via transfer payments and regional development programs. The role of the state as the pro-vider of core public goods within a liberal market economy had shifted to one of govern-ment as a source of redistribution and social investment.
[45] For an overview of the evolution of social spending in Canada, see Gauthier, 2012.
[46] Indeed, the period from 1945 to 1973 saw “a bewildering series of proposals, negotiations, counter-proposals, more negotiations, program implementations and program redesigns” (Norrie, Owram, and
Emery, 2008: 393). For a compelling overview of this era, see Norrie, Owram, and Emery, 2008: 392–399.

48 • A Federal Fiscal History: Canada, 1867–2017 • Di Matteo
fraserinstitute.org
Funding the welfare stateRedistributive activities of course require resources to redistribute and the growth in government revenue came about as a result of robust economic activity as well as of increases in tax rates, particularly for sales and corporate income taxes. Net federal per-sonal income-tax rates actually declined somewhat between 1949 and 1973 for annual taxable incomes higher than $20,001 but rose for those below (Perry, 1989: 391). However, the universality of its coverage grew given that in 1938 only 2.3% of the population had filed income taxes whereas by 1955 it was 24% of the population (Perry, 1989: 383).
Between 1949 and 1973, the federal general sales tax rate rose from 8% to 12% (Perry,
1989: 408). The general corporate income-tax rate rose from 30% in 1947/48 to 50% by 1959/60 and had declined to only 49% by 1973 (Perry, 1989: 396). However, by the 1960s, the federal tax system was the product of decades of changes as the three main taxes—the personal income tax, the corporate income tax, and the manufacturer’s sales tax—were the result of World War I. Indeed, Perry notes that by the 1960s, the Canadian federal tax structure “was the product of half a century of improvisation” (1989: 280), which brought occasional calls for tax reform. The most notable was that of the Carter Commission of the 1960s whose chief slogan, “broaden the base and lower the rates”, was really only implemented with the 1988 tax reforms. [47]
Figure 21A and figure 21B provide an overview of federal revenue and expenditure, net debt, and deficits for the period from 1945 to 1973. Figures 22 and 23 show the compos-ition of revenue and expenditure for two years during this period: 1955, ten years after the end of World War II; and 1967, Canada’s Centennial Year.
At the end of World War II in 1945, Canada’s federal government had a revenue of $3.013 billion, expenditure of $5.136 billion, and a deficit of $2.123 billion. The end of the war saw expenditure plummet rapidly but revenue less so. As a result, the immedi-ate post-war period from 1946 to 1951 saw six consecutive surpluses. After that, there were deficits until 1963 with the exception of the year 1956, when there was a surplus of $260 million (or about 0.8% of GDP). The years 1964, 1965, and 1969 also saw surpluses but the remaining years to 1973 were marked by deficits increasing both in absolute size and as a percentage of GDP. Despite the positive economic environment of the post-war era and the robust economic growth rates, Canada’s federal government managed to post deficits in more than two thirds of the years between 1945 and 1973.
[47] For an overview of the Carter commission and federal tax reform in general, see Perry, 1989: 275–360 and Gillespie, 1991: 181–209.

A Federal Fiscal History: Canada, 1867–2017 • Di Matteo • 49
fraserinstitute.org
Between 1945 and 1973, the expenditure of the federal government increased five-fold while revenue increased seven-fold and yet deficits were the norm. Figure 21A shows that total spending grew from $5.136 billion in 1945 to reach $25.208 billion by 1973. Revenue grew from $3.013 billion to $22.997 billion over the same period. Total revenue grew at an annual average rate of nearly 8% while expenditure grew at 7%.
Figure 21A: Revenue and expenditure ($ millions) of the federal government, 1945–1973
Sources for revenue and expenditure: 1867–1965: Historical Statistics of Canada, HSC-H1-18, HSC-H19-34. 1965–1973: Federal Fiscal Reference Tables, 2015.
0
5,000
10,000
15,000
20,000
25,000
30,000
1972196919661963196019571954195119481945
RevenueExpenditure
$ m
illio
ns
0
20
40
60
80
100
120
1972196919661963196019571954195119481945-20
-15
-10
-5
0
5
10
Net
deb
t/G
DP
(%)
Sources for deficit and surplus: 1867–1965: Historical Statistics of Canada, HSC-H1-18, HSC-H19-34. 1965–1973: Federal Fiscal Reference Tables, 2015. Sources for debt: 1867–1939: Canada Yearbook 1940, p. 854–855, dollars; 1940–1949: Canada Yearbook 1950, p. 1,024; 1950–1959: Canada Yearbook 1960, p. 1,090; 1960–1965: Canada Yearbook 1967, p. 1,045; 1966–2014: Federal Fiscal Reference Tables, 2015, tables 15, 13. Sources for GDP: 1870–1985: Urquhart, 1988.
Figure 21B: Ratio (%) of the federal government’s net debt and defict or surplus to GDP, 1945–1973
Defi
cit/
GD
P (%
)

50 • A Federal Fiscal History: Canada, 1867–2017 • Di Matteo
fraserinstitute.org
Canada’s net debt continued to rise from $11.3 billion to $26.2 billion between 1945 and 1973 but, given the robust growth in the economy and the fact that much of the war debt had been contracted at patriotically low interest rates, the debt-to-GDP ratio fell rapidly. Robust growth was also a reason that, despite the additions of numerous deficits to the debt, the burden of the debt fell. Figure 21B illustrates that from a peak of 108.9% in 1946, the debt-to-GDP ratio fell continuously and by 1973 had reached 20%. At the same time, the deficit-to-GDP ratio fluctuated but was generally in negative terri-tory—indeed, about two thirds of the years from 1945 to 1973 saw a deficit. Aside from 1945, which saw a ratio of deficit/surplus to GDP of 17.6%, the ratio fluctuated between a surplus of 4.8% (in 1947) and a deficit of 2.3% (in 1958).
Composition of revenue and expenditureFigure 22 shows the composition of federal revenue and expenditure in 1955, ten years after the end of the war. In 1955, expenditure was $4.787 billion and revenue, $4.716 billion for a deficit of $71 million. Revenue from personal and, particularly, corporate income taxes continued to grow as a share of federal government revenue. Between 1945 and 1955, the share of revenue derived from the personal income tax grew from 23% to 27% while that from the corporate income tax went from 7% to 23%. The share from customs duties had rebounded from 4% in 1945 to 10% by 1955 but, neverthe-less, it was now a relatively minor revenue source. Sales taxes and excise duties had also grown. By 1955, the combined share of federal revenue from income taxes and sales and excise taxes was 78%.
As for expenditure, the impact of war on federal finances was still substantial given the Korean War from 1950 to 1953 and the onset of the Cold War. Defence in 1955 still made up 38% of federal spending. Social spending was beginning to assume a larger share with Family Allowances now accounting for 8% of spending and Old Age Security and other health and welfare spending totalling about 11%. Transport and communi-cations—a key federal expenditure during the nation-building era—was down to 7% while economic development spending was 5%. Debt service charges were 11% of fed-eral spending while general government, transfers to other governments, and foreign affairs made up the remaining 14%.
Figure 23 presents the composition of revenue and expenditure during Canada’s cen-tennial year. In 1967, the federal government’s budgetary revenue had grown to $10.571 billion while, at $11.260 billion, expenditure exceeded revenue for a deficit of $1.012 bil-lion. By 1967, the modern revenue system had evolved to a point where income taxation

A Federal Fiscal History: Canada, 1867–2017 • Di Matteo • 51
fraserinstitute.org
Personal income tax: 27.31%
Corporate income tax: 22.92%
Non-resident tax: 1.40% Estate tax: 1.42%
Sales tax: 17.01%
Other excise duties: 5.53%
Excise duties: 5.28%
Customs duties: 10.20%
Miscellaneous taxes: 0.36%Post oce: 2.91%
Other non-tax revenue: 2.50%Return on Crown Corporations: 1.80%
Return on investments: 1.36%
Health: 1.16%
Family allowances: 7.97%Old Age Security: 7.6%
Welfare: 0.62%Other welfare and social security: 1.81%
Defence: 38.24%
Unclassified: 0.10%
Veterans benefits: 5.18%
Education assistance: 0.21%
Transport and communications: 7.09%
Economic development: 5.08%
General government: 6.07%
Foreign a�airs: 0.69%Transfers to other governments: 7.47%
Public debt charges: 10.69%
Source: Historical Statistics of Canada: HSC-H1-18, HSC-H19-34.
Figure 22: Composition of the federal government’s revenue and expenditure, 1955
Total revenue $4,716 million
Total expenditure $4,787 million

52 • A Federal Fiscal History: Canada, 1867–2017 • Di Matteo
fraserinstitute.org
Personal income tax: 34.52%
Corporate income tax: 17.22%Non-resident tax: 2.09%
Estate tax: 0.97%
Sales tax: 20.30%
Other excise duties: 3.19%
Excise duties: 4.62%
Customs duties: 7.06%
Post o�ce: 2.67%
Other non-tax revenue: 1.57%Return on Crown Corporations: 4.24% Return on investments: 1.55%
Health: 4.88%
Family allowances: 5.44%
Old Age Security: 12.33%
Welfare: 2.22%
Other welfare and social security: 2.98%
Defence: 15.63%
Unclassified: 3.14%
Veterans benefits: 3.56%
Education assistance: 1.01%Transport and communications: 8.45%
Economic development: 13.08%
General government: 7.25%
Foreign a�airs: 1.93%
Transfers to other governments: 6.55%
Public debt charges: 11.55%
Source: Historical Statistics of Canada: HSC-H1-18, HSC-H19-34.
Figure 23: Composition of the federal government’s revenue and expenditure, 1967
Total revenue $10,571 million
Total expenditure $11,260 million

A Federal Fiscal History: Canada, 1867–2017 • Di Matteo • 53
fraserinstitute.org
was now the dominant revenue source, accounting for more than 50% of revenue. The personal income tax accounted for 35% of revenue and the corporate income tax for 17% for a total share of 51%. Meanwhile, the share of the federal sales tax was 20%, other excise taxes and duties coming in at 8%. Other revenue sources, including cus-toms duties (at 7%), the Post Office, return of crown corporations, and return on invest-ments made up the remaining 21%.
As for expenditure, the full impact of the welfare state had now emerged. Defence spending, while still substantial now only accounted for 16% of spending. Federal health spending, family allowances, Old Age Security, welfare and other social security and education assistance together now accounted for 28% of spending with veteran’s benefits adding another 4%. As well, the era of regional development programs to fight regional economic disparity was in progress and economic development now accounted for 13%. [48] Despite continued deficits and a growing debt, public debt charges still represented as relatively small share of federal spending, coming in at 12%. This of course was the result of interest rates that were extremely low, at least by the standards of the 1970s and 1980s. Federal transfers to the provinces and territories were also still relatively low at 7%, despite the further growth of federal fiscal transfers.
It is remarkable that by the end of the 1960s, despite the robust economic growth of the post-war era, Canada’s federal government was still more often than not generating deficits. Despite a growing economy, Canada’s federal government had embraced a new ethos of increased spending and subsequent deficit financing, not for nation building or national security, but to finance the expansion of the social welfare state and accompan-ied by the aggregate demand-management approach of the Keynesian economic frame-work. Thus, the result was a shift in the role of the federal government during the post-war era away from the more classically liberal economic management principles of the pre-1945 period.
The implications of this shift for the future public finances of Canada’s federal govern-ment were eventually serious. Canada had put in place a major enrichment of spend-ing programs, particularly for social welfare and regional development, that, despite the robust economic and revenue growth of the 1950s and 1960s, more often than not
[48] The Royal Commission on Canada’s Economic Prospects of 1957 (also known as the Gordon Commission) explicitly recognized the existence of regional disparity in Canada and the result was increased spending on regional development that culminated in 1969 with the creation of the Department of Regional Economic Expansion. See Beumier, 1998 for a more detailed account.

54 • A Federal Fiscal History: Canada, 1867–2017 • Di Matteo
fraserinstitute.org
resulted in deficits. While 1968 was to show a surplus, the period from 1969 to 1973 were marked by deficits and with the productivity slowdown of the 1970s, the seeds of the future federal fiscal crisis had been laid. As Canada’s economic productivity waned in the wake of the oil price shocks of the 1970s, economic growth slowed while spend-ing continued to grow faster than revenue. The great divergence between the revenue and the expenditure of the Canadian federal government had begun.

A Federal Fiscal History: Canada, 1867–2017 • Di Matteo • 55
fraserinstitute.org
7. The Great Divergence—Productivity Slowdown and Fiscal Crisis, 1973–1996
The 1970s saw a structural break in Canadian and indeed global economic perform-ance (Norrie, Owram, and Emery, 2008: 362) that brought an end to the post-war economic boom and what had been a golden age of economic growth. There began a long period of slower economic growth that was inaugurated by the first OPEC oil-price shock in 1973. In this respect, Canada’s economic challenges were shared with other developed coun-tries though Canada’s experience had some unique features given the intensity of the reliance of its economy upon natural resources as well as the recurring political quar-rels over Quebec sovereignty (Norrie, Owram, and Emery, 2008: 362). In reality, growth had already begun to slow and inflation increase prior to 1973 but it was the supply-side shock brought about by a quadrupling of oil prices in 1973 that set off a persistent pat-tern of lower growth of real GDP and productivity accompanied by rising inflation and higher unemployment.
The policy response to these economic challenges was originally framed in a Keynesian economic-management framework based on the view that an interventionist gov-ernment could address economic fluctuations via counter-cyclical fiscal and monet-ary policy. Indeed, deficits worsened during this period as government maintained or boosted spending in the hopes the slowdown was temporary. However, even more overt interventions were pursued. For example, in the case of rising inflation, the fed-eral government responded with the Prices and Incomes Commission (1969–72), the Anti-Inflation Board (1975–78), and the voluntary 6% and 5% program in 1982. [49] Yet, these measures were largely ineffective and it was mainly monetary restraint and the rise in interest rates that finally broke the inflationary cycle in the 1980s though it worsened the fiscal crisis through debt-service costs.
The end results were rising deficits and the accumulation of a massive debt that led to the fiscal crisis of the early 1990s, as well as in some eyes the discrediting of the Keynesian economic approach. Indeed, the initial responses to dealing with the
[49] Harvey, 1989: 6. The “6 and 5” program was a voluntary wage restraint program introduced by the fed-eral government and promoted with business and union groups.
56 • A Federal Fiscal History: Canada, 1867–2017 • Di Matteo
fraserinstitute.org
economy reflected the interventionist attitudes, acquired during the post-war era, with a focus on industrial strategies and new spending on items such as regional develop-ment. This, combined with the enrichment of public spending already in place and the rising costs to service the debt as a result of high interest rates, resulted in a great divergence between revenue and expenditure.
At the same time, the post-war economic orthodoxy came to be questioned and then challenged. After the 1970s, directing, fine-tuning, and regulating the economy eventu-ally came to be viewed as unsatisfactory economic policies and greater emphasis began to be placed on the better functioning of market economies and competitiveness. This eventually led in the late 1980s to tax reform; deregulation in telecommunications, transportation, and energy policy; and the pursuit of international trade agreements such as the Free Trade Agreement (FTA) and the North American Free Trade Agreement (NAFTA) (Norrie, Owram, and Emery, 2008: 410–414). Indeed, the implementation of the FTA with the United States in 1988 represents an important change for Canada’s trade that, when combined with NAFTA later on, helped spark a surge in exports.
As well, there was eventually recognition that higher corporate income-tax rates were detrimental to economic activity, a recognition that started a gradual process of rate reduction in the 1990s and into the twenty-first century. This shift in policy was again part of a broader international economic process and put in place the environment for a period of sustained economic growth that started in the mid 1990s and continued rela-tively unabated until the 2008/09 financial crisis and recession.
As federal expenditures rose dramatically, fuelled particularly by debt-service costs, there was also slower revenue growth brought about by a poorly performing economy and exacerbated by changes in tax policy such as the inflation indexation of the per-sonal income tax and the proliferation of tax expenditures. Tax expenditures are essen-tially government assistance or subsidies provided via the tax system and include tax exemptions, deductions, tax credits, and deferrals. Their effect was to narrow the base for the personal and corporate income tax (Gillespie, 1991: 212–213).
During the 1970s, the limits on deductions for contributions to pension plans and registered retirement savings plans were increased as were the personal exemption and the exemption for the elderly. The employment expense deduction was introduced, as well as the post-secondary student deductions, the deduction for interest and dividend income, and the registered home savings plan deduction (Gillespie, 1991: 213). Along with

A Federal Fiscal History: Canada, 1867–2017 • Di Matteo • 57
fraserinstitute.org
the foregoing of government revenue—indeed the value of these expenditures greatly exceeds revenue—these tax expenditures also greatly complicated the personal and cor-porate income-tax systems, a trend that has continued to present day. [50]
Trends and challenges, 1973–1996The period after 1973 was marked by slower growth in real GDP, rising unemployment rates, and rising inflation not only in Canada but also in the rest of the developed world. Canada’s nominal GDP grew from $128.2 billion in 1973—the start of the pro-ductivity slowdown and the era of the oil-price shock—and reached $855.5 billion by 1996. However, in 2014 inflation-adjusted dollars, GDP grew from $651 billion to $1,246 billion, a doubling of real output. In contrast, real output from 1945 to 1973 had nearly quadrupled.
Figure 24 presents key macroeconomic variables for the period from 1945 to 1996, illustrating the challenges of the time period. Between 1945 and 1973, real GDP growth and the unemployment rate both averaged 4.5% annually, the inflation rate averaged 3.4%, and the Bank of Canada rate, 3.6%. Over the period from 1973 to 1996, real GDP growth averaged 3.1%, unemployment averaged 8.9%, inflation, 6.1% and the bank rate, 9.4%. [51] These averages of course mask much of the variation in these indi-cators over the period from 1973 to 1996: the lowest real GDP growth was −3.6% in 1982 while unemployment peaked in 1983 at 11.9%, inflation in 1981 at 12.5%, and the bank rate also in 1981 at 17.9%. The weaker long-term performance was worsened dur-ing major periodic recessions that occurred in 1974/75, 1981/82, and 1990/91 (Cross
and Bergevin, 2012: 10).
This was also an era of much higher federal-provincial tension as the federal government and the provinces dealt with reduced productivity, slower economic growth, and infla-tion, as well as periodic recessions. The federal government sought to restrain transfer
[50] Between 1981 and 2014, the number of federal personal income-tax expenditures (which are cred-its, deductions, exemptions, exclusions, and other preferences) increased from 101 to 128—an increase of 27%. While the number of tax expenditures was essentially flat up to 2001, since 2006 every federal budget has included a new tax credit for specific activities or eligible groups. In 2014, the value of these tax expenditures ($165.0 billion) exceeded total federal personal income-tax revenue ($135.7 billion) (Vaillancourt, Lammam, Ren, and Roy, 2016).
[51] Indeed, for most of this period, the rate of interest on government debt was above the growth rate of the economy. See Appendix 1: Long-term Federal Debt Dynamics, p. 78.

58 • A Federal Fiscal History: Canada, 1867–2017 • Di Matteo
fraserinstitute.org
growth with reforms to Established Program Financing in the late 1970s [52] that con-verted the cost-sharing basis for federal transfers, particularly in health, to a block grant that was divided into a cash grant and the transfer of tax points.
The rise in oil prices during the 1970s also began a shift in economic power to Canada’s western provinces, though the adjustment was temporarily halted with the introduction of the National Energy Program in the federal budget of October 1980. The National Energy Program sought to insulate central Canada from rising energy costs by main-taining domestic Canadian oil and natural gas prices below international market prices as well as taxing the economic rent from this sector. Needless to say, this was a trans-fer of wealth from oil-producing Alberta to the oil-consuming provinces and generated considerable intergovernmental rancour until the program was ended with a change in government in 1985. [53]
The result was federal finances in a state of tumult (figure 25A, 25B). From 1973 to 1996, federal revenue rose from $23.0 billion to $149.9 billion while expenditure grew from $25.2 billion to $158.6 billion. There developed an enormous gap between federal rev-enue and expenditure that went from a $2.2 billion deficit in 1973 to peak at a deficit of
[52] For a discussion, see Hobson, 1995.
[53] For a discussion, see Norrie, Owram, and Emery, 2008: 411–414. A key irritant was the imposition of a Canadian price for oil at approximately $17 per barrel, which was roughly half the world price, along with an oil export tax. While additional revenues were generated for the federal government, the legacy of pol-itical acrimony between east and west was substantial.
-5
0
5
10
15
20
19951990198519801975197019651960195519501945
Figure 24: Macroeconomic variables, Canada, 1945–1996
Unemployment rate (%)Inflation Rate-CPI (%)
Sources for real GDP: 1870–1985: Urquhart, 1988; 1961–2011: v646937; 1981–2014: v62305783; 2015–2017: Federal Budget 2016, Estimates; calculations by author. Sources for unemployment rate: Statistics Canada; Parkin and Bade, 1995. Sources for inflation rate: v41693271 Canada; All-items (2002=100). Sources for bank rate: v122530 Canada; Bank rate (%).
Growth (%) of real GDP ($2014)Bank rate (%)
Perc
enta
ge

A Federal Fiscal History: Canada, 1867–2017 • Di Matteo • 59
fraserinstitute.org
$39 billion in 1992 before declining to $8.7 billion in 1996. Moreover, the deficits were particularly problematic because, aside from recession years, they were largely the result of the non-cyclical effects of the structural nature of federal deficits in the 1973-to-1996 era. [54] Indeed, there was a deficit every year from 1973 to 1996. The federal budget would be balanced shortly thereafter in 1997 as a result of austerity measures taken to
[54] The Federal Fiscal Reference Tables, 2010 in table 46 present actual and cyclically adjusted budget bal-ances for the federal government from 1975 to 2009. For the 16 years from 1975 to 1990, there is a cyclic-ally adjusted deficit in 13 of the 16 years.
Figure 25A: Revenue and expenditure ($ millions) of the federal government, 1973–1996
Sources for revenue and expenditure: 1973–1996: Federal Fiscal Reference Tables, 2015.
0
30,000
60,000
90,000
120,000
150,000
180,000
199519931991198919871985198319811979197719751973
RevenueExpenditure
$ m
illio
ns
0
10
20
30
40
50
60
70
80
199519931991198919871985198319811979197719751973-9
-8
-7
-6
-5
-4
-3
-2
-1
Net
deb
t/G
DP
(%)
Sources for deficit and surplus, net debt: 1973–1996: Federal Fiscal Reference Tables, 2015. Sources for GDP: v646937, v62305783.
Figure 25B: Ratio (%) of the federal government’s net debt and defict or surplus to GDP, 1973–1996
Defi
cit/
GD
P (%
)

60 • A Federal Fiscal History: Canada, 1867–2017 • Di Matteo
fraserinstitute.org
control spending combined with rising revenue from the more robust economic growth that had begun during the mid-1990s. As a share of GDP, the deficit peaked during the recession era of the early 1980s, hitting 8.2% in 1984. Meanwhile, the ratio of net debt to GDP rose from 20.4% in 1973 to peak at 72.8% in 1995 during the federal debt crisis.
Revenue, expenditure, debt, and deficitsFigure 26 presents the composition of revenue and expenditure for 1975 while figure 27 shows the same for the year 1990. They provide for some striking comparisons dur-ing this time when the finances of the federal government deteriorated. In 1975, the total budgetary revenue of the federal government was $29.995 billion and budgetary expenditure, $33.979 billion, for a deficit of just under $4 billion. [55] Income taxa-tion made up 61% of total federal revenue with 42% from the personal income tax and 19% from corporate taxation. The next largest revenue source was sales taxation at 12% with the remaining revenue made up of custom’s duties, excise taxes, and other miscel-laneous taxes. The three largest sources (PIT, CIT, and the federal sales tax) together accounted for 73% of revenue.
Social spending (veteran’s benefits, health, family allowances, old age security, welfare, and education assistance) made up 38% of federal spending. Economic development and transport and communications together accounted for nearly 23% of spending. Meanwhile, public debt charges made up 12% of spending.
By 1990, revenues and expenditures had both ballooned dramatically, reaching $121 billion and $149 billion respectively for a deficit of nearly $30 billion. The distribution of revenue was similar to that of the mid-1970s, with income taxation down slightly to 56% of revenue. On the other hand, sales tax revenue grew slightly to reach 15% of revenue. The three main sources of federal tax revenue together now accounted for 71% of revenue.
The expenditure side reveals the impact of rising debt and associated interest costs as public debt charges swelled as a share of federal budgetary spending. [56] Public debt charges now accounted for 26% of federal spending, the single largest expenditure item;
[55] Historical Statistics of Canada, HSC-H1-18, HSC-H19-34.
[56] Statistics Canada, table 385-0002. The expenditure categories differ somewhat from 1975 because Historical Statistics of Canada is not used as a source of data for this period.

A Federal Fiscal History: Canada, 1867–2017 • Di Matteo • 61
fraserinstitute.org
Personal income tax: 42.43%
Corporate income tax: 19.19%
Non-resident tax: 1.61%Estate tax: 0.04%
Sales tax: 11.73%
Other excise duties: 1.46%
Excise duties: 2.72%
Customs duties: 6.30%
Miscellaneous taxes: 4.97%
Post o�ce: 1.48%
Other non-tax revenue: 1.07%
Return on Crown Corporations: 4.99% Return on investments: 2.01%
Health: 7.49%
Family allowances: 5.76%
Old Age Security: 11.58%
Welfare: 2.61%
Other welfare and social security: 6.24%
Defence: 8.77%
Unclassified: 2.04%
Veterans benefits: 2.01%
Education assistance: 2.06%Transport and communications: 6.54%
Economic development: 16.09%
General government: 7.33%
Foreign a�airs: 1.99%
Transfers to other governments: 7.85%
Public debt charges: 11.64%
Source: Historical Statistics of Canada: HSC-H1-18, HSC-H19-34.
Figure 26: Composition of the federal government’s revenue and expenditure, 1975
Total revenue $29.995 billion
Total expenditure $33.979 billion

62 • A Federal Fiscal History: Canada, 1867–2017 • Di Matteo
fraserinstitute.org
Personal income tax: 45.56%
Corporate income tax: 10.78%Taxes on payments to non-residents: 1.13%
General sales tax: 14.71%
Other consumption taxes: 9.13%
Customs duties: 3.80%
Employment insurance contributions: 8.86%
Investment income: 4.98% Other revenue: 1.06%
Health: 5.25%
Family allowances/child benefits: 3.53%
Old Age Security: 11.02%
Welfare: 13.16%
Other welfare: 0.03%
Defence: 7.79%Unclassified: 8.52%Veterans benefits: 1.15%
Education assistance: 3.22%Transport and communications: 2.88%
Economic development: 5.04%
General government: 3.09%
Foreign a�airs: 2.80%
Transfers to other governments: 6.52%
Public debt charges: 26.03%
Source: Statistics Canada: 385-0002, Federal, provincial and territorial general government revenue and expenditures, for fiscal year ending March 31; Canada; Federal general government; Total revenue (x 1,000,000) (annual, 1989 to 2009).
Figure 27: Composition of the federal government’s revenue and expenditure, 1990
Total revenue $120.8 billion
Total expenditure $149 billion

A Federal Fiscal History: Canada, 1867–2017 • Di Matteo • 63
fraserinstitute.org
its share was to grow larger as the fiscal crisis of the 1990s developed. [57] Social spend-ing managed to retain its share at 37% but other spending was crowded out by the increase in public debt charges. Economic development and transportation and com-munications together fell to 8% while general government dropped to 3% (from 7% in 1975). Thus, one of the consequences of the rise in debt and debt service costs was the crowding out of some federal expenditure on goods and services.
The period from 1973 to 1996 is a remarkable one from the point of view of federal gov-ernment finances because it is marked by the gradual onset of the federal debt crisis and a general lack of action until the early 1990s—when the debt crisis becomes a primary issue—that culminated in the decisive actions of the 1995 federal budget. It is not that the period prior to 1995 was entirely devoid of action: indeed, there were reforms to the federal transfer payment system [58] in an effort to restrain growing costs as well as the tax reform of the late 1980s, which recognized that it was important for taxation to pro-vide incentives for growth. [59]
While one can argue that federal tax reform in Canada since the Carter Report has occurred on a piecemeal and not entirely consistent basis, the 1980s still mark an important period (Boadway, 2014). Indeed, tax reform affected not only personal income and consumption taxation during this period but also corporate income taxation. In 1987, the federal government brought in a plan to reduce the general corporate income-tax rate from 37.8% to 28.8% by 1989. These rates then stayed stable for the 1990s until a second wave of rate reductions began circa 2001 (McKenzie, 2015: 1,014–1,015).
A key takeaway from this era of fiscal crisis is the importance of fiscal discipline in man-aging public finances and the long-term effects of profligacy. In the end, there was little
[57] Indeed, according to the Federal Fiscal Reference Tables, 2015, public debt charges as a share of federal spending peaked in 1996 at nearly 30%.
[58] In 1977, there was the onset of Established Program Financing (EPF), which replaced federal-provincial cost sharing on health with a block grant. In 1984, there was the onset of the Canada Health Act (CHA), which tied the receipt of federal transfers to running a health-care system that met basic con-ditions. In 1996, EPF and the Canada Assistance Plan, which funded income support, were collapsed into one transfer (and the cash portion reduced by one third). This new transfer was called the Canada Health and Social Transfer (CHST).
[59] Tax reform began with the release of the 1987 White Paper (Wilson, 1987), which had as its slogan that the tax base be broadened and rates lowered. The first stage, which took effect in 1988, was personal income-tax reform, which saw the number of tax brackets lowered from 11 to 3 and a reduction in mar-ginal tax rates. The second stage was consumption-tax reform, which saw the federal Manufacturing Sales Tax replaced in 1991 by the Goods and Services Tax with a broader base and lower rates.

64 • A Federal Fiscal History: Canada, 1867–2017 • Di Matteo
fraserinstitute.org
to show from the rising deficits, debt, and debt service costs of this era, given that the spending fuelled current consumption rather than capital spending. Indeed, high inter-est rates reduced government capital spending by diverting resources to servicing the debt and were also a factor in weaker private capital investment. The result was a steep decline in public and private capital investment in Canada as a percentage of GDP that saw this investment fall from a peak of 8% of GDP in the late 1960s to about 4% by the mid-1990s (Bazel and Mintz, 2015: 7). The result was a deterioration in physical infrastruc-ture that would not begin to be remedied until the early twenty-first century.
A Federal Fiscal History: Canada, 1867–2017 • Di Matteo • 65
fraserinstitute.org
8. Into the 21st Century, 1996–2017
In the years that spanned the period from 1973 to 1996, federal finances lost their way as large deficits compounded into mounting net debt that culminated in the federal fis-cal crisis of the 1990s. Decisive steps taken by the federal government with the 1994 Program Review and the 1995 Budget set the federal government on the path to a bal-anced budget. Indeed, these steps helped pave the way for the substantial economic progress that was made from the late 1990s to the onset of the 2008/09 global financial crisis and recession.
The 1990s began a period of economic and policy reform at both the federal and prov-incial levels resulting in government restructuring, reform of unemployment insur-ance, [60] deregulation, deficit reduction, and lower tax rates. These were accompanied by lower interest rates, which afforded a fiscal dividend that allowed for tax relief and investment in infrastructure. The lower interest rates also propelled housing construc-tion and, with its fiscal house in order and growing business confidence, Canada was able to benefit from the export surge from the US economic boom of the late 1990s and the resource boom of the early 21st century. Growth became more robust but there were regional differences as central Canada—Ontario in particular—lagged as a result of a malaise that particularly afflicted the manufacturing sector. [61] While overall Canadian growth rates improved and the economy embarked on a considerable expansion, there was still not a return of the heady days of the 1950s and 1960s.
[60] The period from 1993 to 1996 saw major reforms to entitlements, eligibility, and replacement rates via Bills C-113, C-17, and C-12, including a change in name and tenor from “unemployment” to “employ-ment” insurance. For example, Bill C-12 in 1996 saw the replacement rate for repeat claimants lowered by one percentage point for each 20 weeks of use in the past five years, up to a maximum of five percentage points. For a survey, see Lin, 1998.
[61] A comparison of the variation in growth of per-capita GDP for Canada (without Ontario) against the variation in Ontario for the period from 1982 to 2012 found that the variation in Ontario explains roughly three quarters of the variation in the rest of the national economy, showing Canada to be quite sensitive to Ontario’s economy. Ontario’s economic malaise was the outcome of an incomplete transition to a more competitive world economy and a serious long-term set of economic problems rooted in its eco-nomic productivity that were aggravated by high costs for electricity and energy, a reliance on manufac-turing tied to a US market that saw a major downturn, and a political culture increasingly focused on gov-ernment economic intervention as a solution to the economy’s problems. For a discussion, see Di Matteo,
Clemens, and Palacios, 2014.

66 • A Federal Fiscal History: Canada, 1867–2017 • Di Matteo
fraserinstitute.org
As the twenty-first century progressed, a resource boom that focused on the energy sector in Alberta, Saskatchewan, and Newfoundland & Labrador further propelled the Canadian economy, countering weakness in Ontario, Quebec, and the Maritimes. Indeed, Canada was able to weather the economic downturn of the 2008/09 global financial crisis and recession better than most industrialized countries in part because of the strong economic performance of these resource jurisdictions (Di Matteo, Emes,
Lammam, and Eisen, 2016). Moreover, Canada’s ability to weather the 2008/09 recession also benefitted from the strengthening of the Canadian banking system in 1980s [62] and the fiscal room to engage in stimulus and infrastructure spending provided by the elimination of the deficit in the 1990s (The Economist, 2014, May 3).
As a result, the economic indicators for Canada were generally favourable for the per-iod from 1996 despite the global recession and more recently the slowdown in Canadian growth brought about by the drop in energy prices. From 1995 to 2008, Canada enjoyed a lengthy period of economic expansion with real GDP growth averaging 3% annually, ranging from a low of 1% in 2008 and reaching 5.5% in both 1999 and 2000. [63] Indeed, growth was actually more robust in the late 1990s with some tapering off as the twenty-first century progressed.
The period from 1995 to 2000 saw average real GDP growth of 3.9% annually while the period from 2001 to 2008 saw a drop to 2.3% growth. Real GDP growth in 2009 was negative at −3.2% followed by a rebound the year after and growth averaging 2.2% from 2010 to 2015. The unemployment rate remained stubbornly high from 1991 to 1994—above 10%—but began to decline afterwards and the period from 2000 to 2015, except for the 2009 recession, saw the rate below 8%. [64] The period between 1995 and 2008 saw total employment grow from 13.3 million to 17 million jobs, followed by a drop to 16.7 million in 2009. Growth then resumed and employment reached 17.9 million in 2015. [65]
[62] The financial reforms of 1987 and 1992 saw a consolidation of the Canadian financial system as the main chartered banks acquired or started securities and trust businesses. For further discussion, see Arjani
and Paulin, 2013.
[63] Statistics Canada, v62471340: Real GDP at 2007 constant prices; author’s calculations.
[64] Statistics Canada, v2062815: Canada, Unemployment rate (Percent); Both sexes; 15 years and over; Estimate; Seasonally adjusted.
[65] Statistics Canada, v2062811: Employment (Persons); Both sexes; 15 years and over; Estimate; Seasonally adjusted; author’s calculations.

A Federal Fiscal History: Canada, 1867–2017 • Di Matteo • 67
fraserinstitute.org
Balancing the booksThe federal debt crisis of the early 1990s was the culmination of nearly two decades of rising public debt that with rising debt service costs and the wake-up call of the 1994 Mexican peso crisis [66] finally led to the federal government’s taking decisive budget-ary action: the 1994 Program Review [67] and the 1995 Budget. The federal govern-ment took action to cut nominal spending and public-sector employment, which put the country’s finances back on track. Moreover, the reform of fiscal transfers to the prov-inces, which entailed the creation of the Canada Health and Social Transfer (CHST), was accompanied by a reduction in cash transfers to the provinces. In essence, much of the heavy lifting of the federal fiscal adjustment was transferred to the provinces.
The government planned to balance the books by reducing program spending from $118.3 billion in 1994/95 to $107.9 billion by 1996/97 (Veldhuis, Clemens and Palacios, 2011:
22). Evidence from the Federal Fiscal Reference Tables (2015, table 1) shows that actual program spending dropped from $123.238 billion in 1994/95 to $111.327 billion in 1996/97, a drop of 9.7%. However, total federal transfers to other levels of government fell from $26.3 billion in 1994/95 to $20.5 billion by 1997/98, a drop of 22%. From a $36.632 billion budgetary deficit in 1994/95, the federal government achieved a $2.959 billion surplus in 1997/98 that marked the beginning of a string of successive fiscal sur-pluses that lasted until 2009/10.
As a result of the federal government’s bringing spending under control, balancing the budget, and reducing the public debt, interest charges began to decline [68] and public debt charges fell from a peak of $49.407 billion in 1995/96 to $43.892 billion by 2000/01; by 2014/15 they were down to $26.914 billion. The reduction in the size of government,
[66] The spotlight was turned on Canada’s fiscal situation on January 12, 1995 by an editorial in the Wall Street Journal (Veldhuis, Clemens and Palacios, 2011: 19). The editorial, entitled Canada Bankrupt?, argued that Canada had reached a “debt wall” and might have to call in the assistance of the International Monetary Fund.
[67] The 1994 Program Review required ministers in each department to evaluate their programs using criteria that then led to some significant structural change in federal government programs (Veldhuis,
Clemens and Palacios, 2011: 25).
[68] Another important factor was the decline in interest rates. Rising interest rates in the 1970s and 1980s were a compounding factor in the rising debt. The Bank of Canada rate rose from the mid-1950s to reach a peak of 21.03% in August of 1981 and then declined to 7.14% by March 1987 before rising again to reach 14.05% in May of 1990. Rates then declined (Statistics Canada, series v122530). The decline in rates fuelled what has been referred to as a “fiscal dividend” as resources freed up from paying debt service costs were applied to reducing taxes as well as increasing spending for services like health and education.

68 • A Federal Fiscal History: Canada, 1867–2017 • Di Matteo
fraserinstitute.org
falling interest rates, and economic recovery fuelled by rising exports to the United States during the remainder of the 1990s continued to improve the federal fiscal situation. Indeed, one can posit that the restoration of fiscal balance ultimately led to an improve-ment in the confidence of the business sector and that this was also one of the factors sparking stronger economic performance in the years following the fiscal crisis. [69]
Combined with steps taken to restore the fiscal health of the federal government in the 1995 budget, the more buoyant economy saw the federal government embark on a per-iod of fiscal health that was only interrupted by the 2008/09 global financial crisis and recession. Indeed, the period from 1996 to 2017 begins with the return of fiscal balance and responsibility to federal finances and ends with a resumption of deficits and the growth of debt. The fiscal footprint of the federal government shrinks during this per-iod as the ratio of federal expenditure to GDP dropped from 21% in 1995 to a low of 14% by 2014, but with a projected increase to 15.6% by 2017.
Revenue, expenditure, debt, and deficitsFigure 28A shows federal revenue and expenditure and figure 28B the ratios of net debt and deficit to GDP from 1996 to 2014, with forecasts for 2015, 2016, and 2017 taken from the 2016 Federal Budget. Over the entire period from 1996 to 2017, total federal revenue is expected to grow from $149.889 billion to $302 billion, an annual average growth rate of 3.5% and total federal expenditure from $158.608 billion in 1996/97 to a forecast $331 billion in 2017/18 for an average annual growth rate of 3.6%. By 1997, there was a fiscal surplus of nearly $3 billion and the years from 1997 to 2007 saw 11 consecu-tive budget surpluses ranging from a low of $2.959 billion in 1997/98 to a high of $19.891 billion in 2000/01. However, deficits returned starting in 2008/09 with a $5.755 billion deficit followed in 2009/10 by the largest deficit—in absolute terms—in Canadian his-tory, $55.598 billion dollars. Subsequent years saw deficits of $33.372 billion, $26.279 bil-lion, $18.415 billion, and $5.150 billion before a surplus of $1.911 billion was generated in 2014/15. However, the period from 2015 to 2017 is projected to be one of deficits as the 2016 Federal Fall Economic Statement (Canada, Dep’t of Finance, 2016) forecasts deficits of $1.0 billion, $25.1 billion and $27.8 billion for 2015/16, 2016/17, and 2017/18.
The deficits from 2008 to 2013 were a product of declining revenues and rising expenditures as the federal government embarked on a program of fiscal stimulus in response to the downturn. The Keynesian-style fiscal stimulus brought in by the
[69] It should be noted that another factor reducing uncertainty was the 1995 Quebec Referendum in which Quebec’s voters rejected the proposal to separate from Canada.

A Federal Fiscal History: Canada, 1867–2017 • Di Matteo • 69
fraserinstitute.org
federal government in the 2009 budget was a two-year plan containing $45.4 billion in new spending and tax-relief initiatives. [70] This was supposed to be a temporary increase but the government then pushed back its timeline for a balanced budget by not returning program spending to the pre-stimulus trend. As a result, the accumulated deficits were substantially larger than originally projected and the downward trend in the net debt and ratio of net debt to GDP were halted. Indeed, from 2008 to 2013, the accumulated deficits totalled $144.569 billion and net debt rose from $525.213 billion
[70] Of this federal stimulus, about 14% was delivered in the form of tax relief (Speer and Emes, 2014).
Figure 28A: Revenue and expenditure ($ millions) of the federal government, 1996–2017f
Sources for revenue and expenditure: 1996–2014: Federal Fiscal Reference Tables, 2015; 2015–2017: Federal Budget 2016.
0
50,000
100,000
150,000
200,000
250,000
300,000
350,000
20162014201220102008200620042002200019981996
RevenueExpenditure
$ m
illio
ns
0
10
20
30
40
50
60
70
80
2016f2014201220102008200620042002200019981996-4.00
-3.25
-2.50
-1.75
-1.00
-0.25
0.50
1.25
2.00
Net
deb
t/G
DP
(%)
Sources for deficit and surplus: 1996–2014: Federal Fiscal Reference Tables; 2015–2017; Federal Budget 2016. Sources for debt: 1966–2014: Federal Fiscal Reference Tables, 2015: tables 15, 13; 2015–2017: Federal Budget 2016. Sources for GDP: v62305783, Federal Budget 2016, estimates.
Figure 28B: Ratio (%) of the federal government’s net debt and defict or surplus to GDP, 1996–2017f
Defi
cit/
GD
P (%
)

70 • A Federal Fiscal History: Canada, 1867–2017 • Di Matteo
fraserinstitute.org
to $686.959 billion. To put these numbers in perspective, over the much longer period from 1973 to 1995, Canada accumulated $541.964 billion dollars in deficits and the net debt rose from $240 billion to $609 billion.
However, these are nominal figures and, when adjusted for inflation and population growth, the period from 1973 to 1995 represents the more critical growth of the federal debt. In real per-capita terms ($2014), the net debt per capita rose from $5,971 in 1973 to $30,255 in 1995, an increase of 407%. Between 2008 and 2013, the real per-capita net debt rose from $17,182 to $19,758, an increase of 15%. The ratio of net debt to GDP rose, between 1973 and 1995, from 20.4% to 72.8%; whereas between 2008 and 2013 it rose from 32.7% to 35.6%. The net-debt-to-GDP ratio was not as severely affected since the economy’s expansion since 1995 and the halt in the accumulation of debt prior to 2008 meant that the debt-to-GDP ratio had fallen from 73% in 1995 to 35% by 2014. The federal government was also fortunate that interest rates were at historic lows and debt service charges did not further complicate their fiscal problems.
Composition of revenue and expenditureThe fiscal dividend yielded by low interest rates is particularly apparent in the compos-ition of federal spending during this period. Revenue and expenditure both grew during the first 15 years of the 21st century. The distribution of revenue remained stable though the share of federal revenue from personal income taxes crept upwards and is expected to reach 51% in 2017 (figures 29, 30). In 2000, public debt charges were still nearly 25% of federal government expenditure but by 2015 [71] they had dropped to 10%. The space vacated by debt charges was filled by transfer payments: transfers to individuals, gov-ernments, and business in 2000 totalled approximately 44% of federal spending (up from 34% in 1990) whereas by 2015 they were approximately 61%. [72] A key expan-sion was in federal transfers to governments as the Health Accord in 2004 had estab-lished a health-transfer escalator of 6% growth annually through to 2017. Equalization payments also expanded during this period, growing from $8.959 billion in 1995 to $17.880 billion in 2016, an average annual rate of 3.6%. The surge in equalization was
[71] In this instance, the charts are actually for the fiscal year ending 2015, i.e., the 2014/15 fiscal year.
[72] Composition of expenditure and revenue for 2015 was from the public accounts as composition data from Statistics Canada ends in 2009 and was not currently available. The composition in Statistics Canada, table 385-0002 (1989–2009) matched the categories in Historical Statistics of Canada and allowed for some relatively consistent comparisons for the period from 1867 to 2009. The new Government Finance Statistics available quarterly from 1990 to 2016 (Statistics Canada, table 385-0032) for the federal govern-ment use an expenditure composition that is different from the public accounts and also does not match previous sources.

A Federal Fiscal History: Canada, 1867–2017 • Di Matteo • 71
fraserinstitute.org
Personal income tax: 47.38%
Corporate income tax: 13.31%
Taxes on payments to non-residents: 1.94%
General sales tax: 14.21%
Other consumption taxes: 5.76%
Customs duties: 1.17%
Employment insurance contributions: 10.45%
Investment income: 3.51%
Other revenue: 2.29%
Health: 1.00%Family allowances/child benefits: 3.52%
Old Age Security: 13.65%
Welfare: 10.17%
Other welfare: 0.57%
Defence: 6.86%Unclassified: 9.89% Veterans benefits: 1.21%
Education assistance: 2.84%Transport and communications: 0.99%
Economic development: 3.56%
General government: 3.39%
Foreign a�airs: 2.49%
Transfers to other governments: 14.33%
Public debt charges: 25.51%
Source: Statistics Canada: 385-0002, Federal, provincial and territorial general government revenue and expenditures, for fiscal year ending March 31; Canada; Federal general government; Total revenue (x 1,000,000) (annual, 1989 to 2009).
Figure 29: Composition of the federal government’s revenue and expenditure, 2000
Total revenue $180.3 billion
Total expenditure $173 billion

72 • A Federal Fiscal History: Canada, 1867–2017 • Di Matteo
fraserinstitute.org
Personal income tax: 48.08%
Corporate income tax: 13.97%
Taxes on payments to non-residents: 2.20%
General sales tax: 11.10%
Other consumption taxes: 3.99%
Customs duties: 1.62%
Employment insurance contributions: 8.15%
Investment income: 0.68%
Other revenue: 10.21%
Major transfers to persons: 27.30%
Major transfers to other levels of government: 22.50%
Other transfers: 12.50%
Ministries: 25.50%
Crown corporations: 2.70%
Public debt charges: 9.50%
Source: 2015 Federal Public Accounts.
Figure 30: Composition of the federal government’s revenue and expenditure, 2015
Total revenue $282.346 billion
Total expenditure $280.435 billion
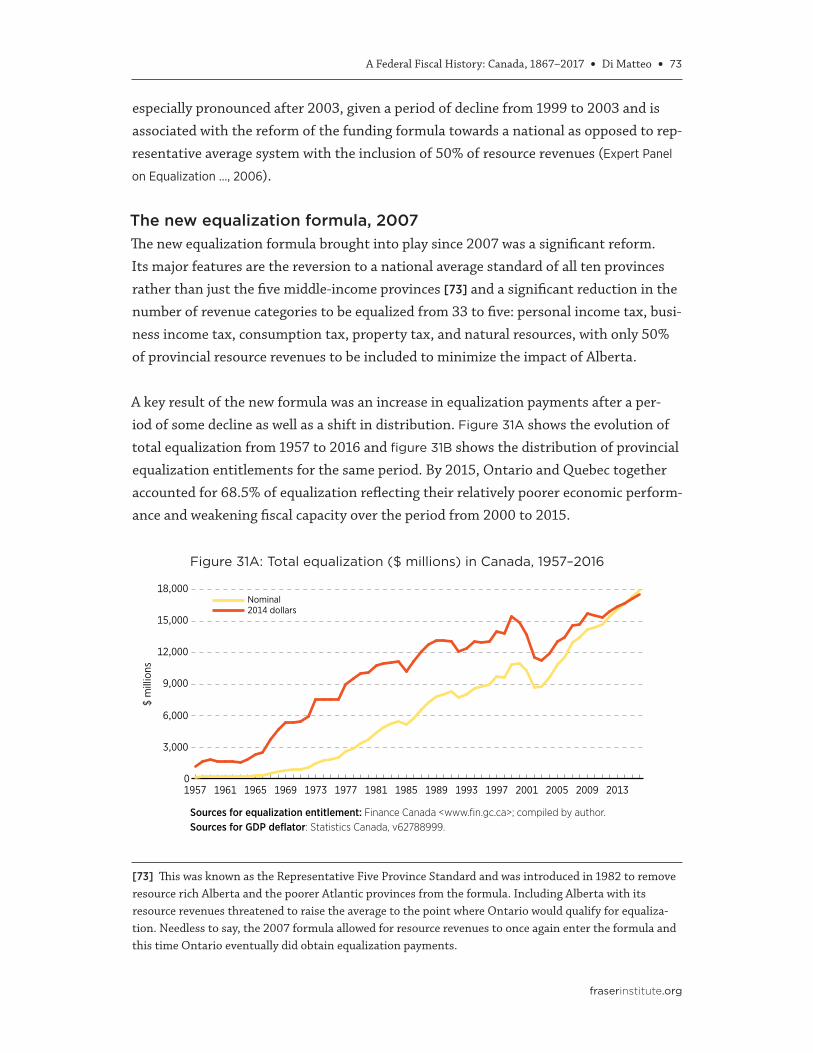
A Federal Fiscal History: Canada, 1867–2017 • Di Matteo • 73
fraserinstitute.org
especially pronounced after 2003, given a period of decline from 1999 to 2003 and is associated with the reform of the funding formula towards a national as opposed to rep-resentative average system with the inclusion of 50% of resource revenues (Expert Panel
on Equalization …, 2006).
The new equalization formula, 2007The new equalization formula brought into play since 2007 was a significant reform. Its major features are the reversion to a national average standard of all ten provinces rather than just the five middle-income provinces [73] and a significant reduction in the number of revenue categories to be equalized from 33 to five: personal income tax, busi-ness income tax, consumption tax, property tax, and natural resources, with only 50% of provincial resource revenues to be included to minimize the impact of Alberta.
A key result of the new formula was an increase in equalization payments after a per-iod of some decline as well as a shift in distribution. Figure 31A shows the evolution of total equalization from 1957 to 2016 and figure 31B shows the distribution of provincial equalization entitlements for the same period. By 2015, Ontario and Quebec together accounted for 68.5% of equalization reflecting their relatively poorer economic perform-ance and weakening fiscal capacity over the period from 2000 to 2015.
[73] This was known as the Representative Five Province Standard and was introduced in 1982 to remove resource rich Alberta and the poorer Atlantic provinces from the formula. Including Alberta with its resource revenues threatened to raise the average to the point where Ontario would qualify for equaliza-tion. Needless to say, the 2007 formula allowed for resource revenues to once again enter the formula and this time Ontario eventually did obtain equalization payments.
Figure 31A: Total equalization ($ millions) in Canada, 1957–2016
Sources for equalization entitlement: Finance Canada <www.fin.gc.ca>; compiled by author. Sources for GDP deflator: Statistics Canada, v62788999.
0
3,000
6,000
9,000
12,000
15,000
18,000
201320092005200119971993198919851981197719731969196519611957
Nominal2014 dollars
$ m
illio
ns
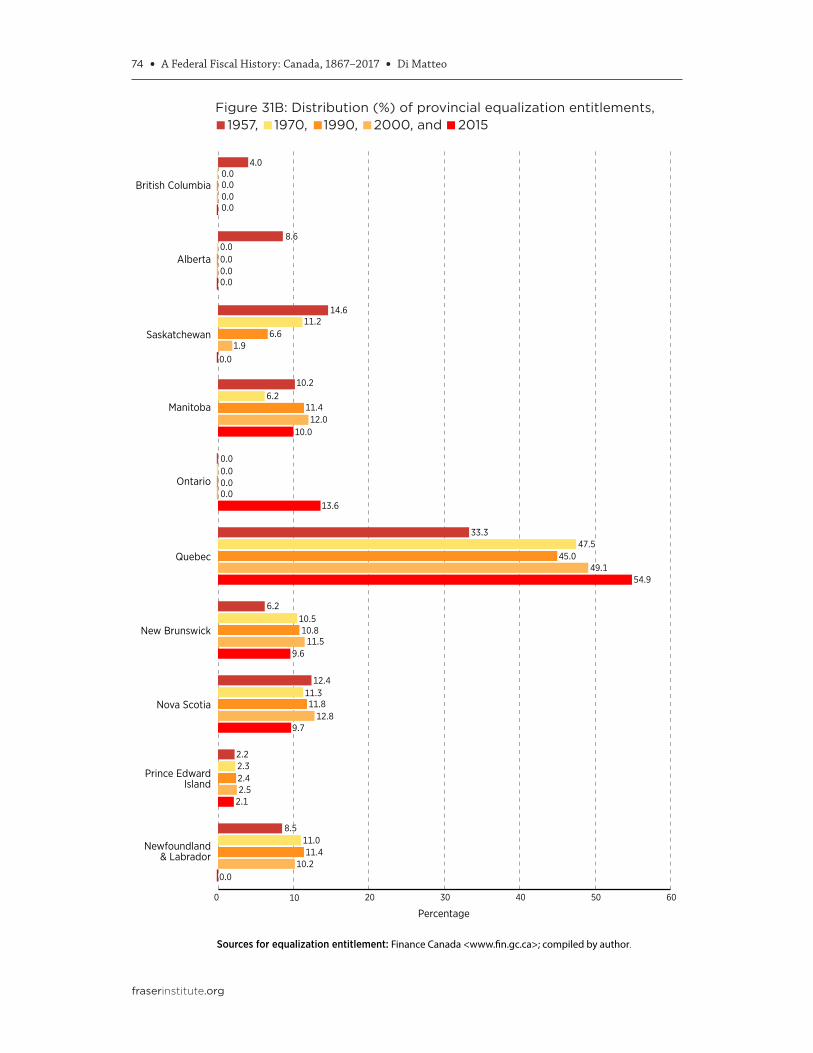
74 • A Federal Fiscal History: Canada, 1867–2017 • Di Matteo
fraserinstitute.org
0 10 20 30 40 50 60
Newfoundland& Labrador
Prince EdwardIsland
Nova Scotia
New Brunswick
Quebec
Ontario
Manitoba
Saskatchewan
Alberta
British Columbia
Figure 31B: Distribution (%) of provincial equalization entitlements, 1957, 1970, 1990, 2000, and 2015
10.012.0
10.2
11.46.2
4.0
8.6
0.01.9
14.6
6.611.2
13.6
0.00.0
0.00.0
54.949.1
33.3
45.047.5
9.611.5
6.2
10.810.5
9.712.8
12.4
11.811.3
2.12.5
2.2
2.42.3
0.010.2
8.5
11.411.0
Sources for equalization entitlement: Finance Canada <www.�n.gc.ca>; compiled by author.
Percentage
0.00.0
0.00.0
0.00.0
0.00.0

A Federal Fiscal History: Canada, 1867–2017 • Di Matteo • 75
fraserinstitute.org
By 2015, the evolution of the federal government’s role from nation builder to a provider of goods and services and then a fiscal transfer agency was complete. Whereas in 1867, transfers to individuals, other governments, and bondholders made up about 47% of expenditure, by 2015 this had grown to 71%. The federal government’s role as a massive cheque-writing agency with money flowing in and then out was complete.
Success and failureOne can interpret the period from 1996 to 2017 as generally an era of fiscal success for the federal government given the elimination of the deficit, successive balanced budgets, the reduction in the federal expenditure footprint, generally lower corpor-ate income-tax rates, and the steep reduction in the ratio of net debt to GDP. At the same time, one can also interpret this era as one when the promise of a healthy long-term evolution of federal finances failed. After the debt cycle of the 1970s and 1980s and the fiscal crisis of the early 1990s, the period from 1996 to 2017 began with a repudiation of spending excess and a restoration of fiscal balance. However, the fis-cal stimulus during the 2009 recession appears to have opened the door for a return to deficit financing, given that large deficits are now forecast until 2020 and beyond, despite the fact that there is no recession currently underway. [74] Despite low inter-est rates, these deficits are still a concern because the evidence suggests that inter-est rates are nevertheless still above long-term growth rates for the economy (see Appendix 1: Long-term Federal Debt Dynamics, p. 78).
Moreover, the future also appears to hold a shift in the federal government’s attitudes towards taxes. Income tax brackets and rates had stayed stable for many years but 2015 saw the introduction of a new income-tax bracket, raising the top tax rate from 29% to 33% on incomes over $200,000. Combined with increases planned for CPP contribution rates and a cancellation of more generous limits for Tax Free Savings Accounts, it would appear that there is a return to higher rates of taxation underway.
[74] The 2016 federal Budget confirmed the government’s plan to run long-term deficits—$113.2 billion over the five-year plan—and increase program spending by 7.6% in 2016/17, following a 6.7% increase in 2015/16. Moreover, as a result of projected lower economic growth and increases in age-related spend-ing, the federal finance Fall Economic Statement 2016 projects deficits at the federal level until past the year 2051 (Canada, Department of Finance, 2016).

76 • A Federal Fiscal History: Canada, 1867–2017 • Di Matteo
fraserinstitute.org
9. Conclusion
At the dawn of Confederation, Canada’s federal government had a budget of $14 million, an expenditure-to-GDP ratio of approximately 5%, and a net debt of $75.7 million. This resulted in a ratio of net debt to GDP of 20% and annual interest charges of $4.9 million, which absorbed 29% of spending. By 2017, it is anticipated that the federal budget will see total expenditure of $331 billion and an expenditure-to-GDP ratio of about 15.6%. The net federal public debt will total $759.5 billion resulting in a ratio of debt to GDP of 35.7% and debt service costs of $26.4 billion, which are expected to account for about 8% of federal expenditure.
A focus on end points of course obscures the trends and patterns of federal finances as they have evolved through changes in its role as a result of Canada’s changing eco-nomic and social circumstances. In 1870, Canada was a minor country—essentially still a British colony—and a predominately rural and agricultural nation of barely four mil-lion people on the verge of expanding and building a nation across the northern half of North America. Today, it is a modern, highly developed, and diversified economy, a member of the G-7, and the tenth largest world economy with a population of approxi-mately 35 million, enjoying one of the highest standards of living in the world.
The evolution of the Canadian economy from a largely rural, agricultural nation to a modern service-intensive economy with the bulk of the population clustered in urban centres is paralleled by the federal government’s transition from spending mainly on goods to spending on transfers. Indeed, over two thirds of federal spending today is now largely a transfer payment of some type whether to individuals, other governments, or bondholders. The evolution of the federal government from a producer and provider of public goods and services to a cheque-writing agency is a result that would likely astound the nineteenth-century founders of Canada.
The finances of Canada’s federal government have evolved much as the role of the fed-eral government has evolved in response to the needs of different eras. During the country’s era of expansion when the West was opened to agricultural settlement, the federal government played a nation-building role. It established the framework for a national economy, particularly by subsidizing the construction of a transcontinental

A Federal Fiscal History: Canada, 1867–2017 • Di Matteo • 77
fraserinstitute.org
railway linking east and west. During periods of extreme threats to national security—the eras of world war in particular—the federal government quickly asserted its fiscal dominance by creating new revenue sources and acquiring debt.
The 150 years since Confederation have witnessed the transition of the federal govern-ment from a state grounded in liberal economic principles charged primarily with eco-nomic development to a more activist state. This led to expansion of the federal govern-ment’s spending in the period after World War II that, in the absence of more concerted fiscal discipline and the slow-down in economic growth, ultimately was a factor leading up to the debt crisis of the 1990s.
Used prudently, government spending is useful: an example is the construction of the transcontinental CPR railway when subsidies were paid to encourage the building of a risky capital project. However, the same strategy also resulted in over-subsidization of the CPR as well as substantial subsidies to two other rail lines that were not as success-ful. More government spending is not always better and that also applies to the use of deficit financing. The important policy decisions are when to spend, what to spend it on, how much to spend, and how to pay for the spending. Getting the wrong answer to any of these questions has fiscal implications.
Given the surge in deficit financing at the federal level currently underway in the wake of the 2016 Budget, one wonders if the lessons of the 1990s have already been forgot-ten. While interest rates remain at historic lows, economic growth is also low, making the case for fiscal restraint given the dynamics of deficits and debt when interest rates exceed growth rates. The progress made in bringing the ratio of federal net debt to GDP below 40% will be largely squandered if we allow debt to once again grow uncontrollably.

78 • A Federal Fiscal History: Canada, 1867–2017 • Di Matteo
fraserinstitute.org
Appendix 1: Long-term Federal Debt Dynamics
The sources of change in the debt/GDP ratio is due to: (1) the size of the primary deficit relative to GDP (x) and (2) the difference between the growth rate of the economy (g) and the interest rate that must be paid on government debt (r). [1] We can express the dynamics using the following simple formula: Δd = [(r − g)d +x], where Δd is the change in the debt-to-GDP ratio; r is the interest rate; g is the growth rate of output; x is the pri-mary (non-interest) deficit as a share of GDP.
When r < g, the government enjoys conditions that enable it to see its debt ratio fall (Δd < 0) even while running primary deficits. When the opposite is true (r > g), the government must run primary surpluses if it wants to see its debt ratio fall. Otherwise, the debt-to-GDP ratio will grow (Δd >0). During periods where r > g, deficit financing can result in a rapid accumulation of debt. Indeed, the years after 1980 saw one such period, a reason for the escalation of the debt problem to a situation where further expenditure reduc-tions were needed. During periods in Canadian economic history when r < g, the federal government would see a declining ratio of debt to GDP even if running primary deficits.
Using data for federal debt service and the net debt for the period from 1867 to 2017, an effective interest rate on the debt was calculated. As well, the growth rate of Canadian GDP was calculated for the period from 1871 to 2017. These two series are plotted together over time in figure A1. The results show there is a high amount of variation in the growth rate of GDP making comparisons difficult. Figure A2 plots a LOWESS smooth of both the effective interest rate and the growth rate of GDP and the resulting figure makes a longer-term comparison of r and g easier.
The smoothed results show that there have been three broad periods where r > g and two periods when r < g in Canadian fiscal and economic history. The growth rate has exceeded the interest only twice: once during the from about 1894 to 1919 encompassing the era of western settlement and the Great Boom and then during the period from 1935 to 1978 encompassing the era of the postwar boom. During these eras, it was possible to run deficits and reduce the deficit-to-GDP ratio. However, during the other periods running approximately from 1867 to 1893, 1920 to 1934, and 1979 to the present, the interest rate has generally exceeded growth rates making deficit finance potentially destabilizing.
[1] For further discussion of the analytics and dynamics of deficits and debts, see Dornbusch, Fischer and
Sparks, 1993: 468–469; Kneebone and Gres, 2013; Courchene, 2002.

A Federal Fiscal History: Canada, 1867–2017 • Di Matteo • 79
fraserinstitute.org
-20
-15
-10
-5
0
5
10
15
20
25
2017200719971987197719671957194719371927191719071897188718771867
E�ective interest rate
GDP growth rate
Perc
enta
ge
Figure A1: E�ective interest rate on the federal government’s debt and Canadian GDP growth rates, 1867–2017
0
2
4
6
8
10
12
2017200719971987197719671957194719371927191719071897188718771867
Perc
enta
ge
Sources for debt: 1867–1939: Canada Yearbook 1940: 854–855 (dollars); 1940–1949, Canada Yearbook 1950: 1024; 1950–1959, Canada Yearbook 1960: 1090; 1960–1965, Canada Yearbook 1967: 1045; 1966–2014: Federal Fiscal Reference Tables, 2015: tables 15, 13; 2015–2017: Federal Budget 2016. Sources for GDP: 1870–1985: Urquhart, 1988; 1961–2011: v646937; 1981–2014: v62305783; 2015–2017: Federal Budget 2016, estimates. Sources for public debt charges: 1867–1965: Series H19–34; 1966–2014: Federal Fiscal Reference Tables 2015; 2015–2017: Federal 2016 Budget.
Figure A2: E�ective interest rate on the federal government’s debt and Canadian GDP growth rates, 1867–2017 (LOWESS smooth, smoothing bandwidth = 0.3)
E�ective interest rate
GDP growth rate
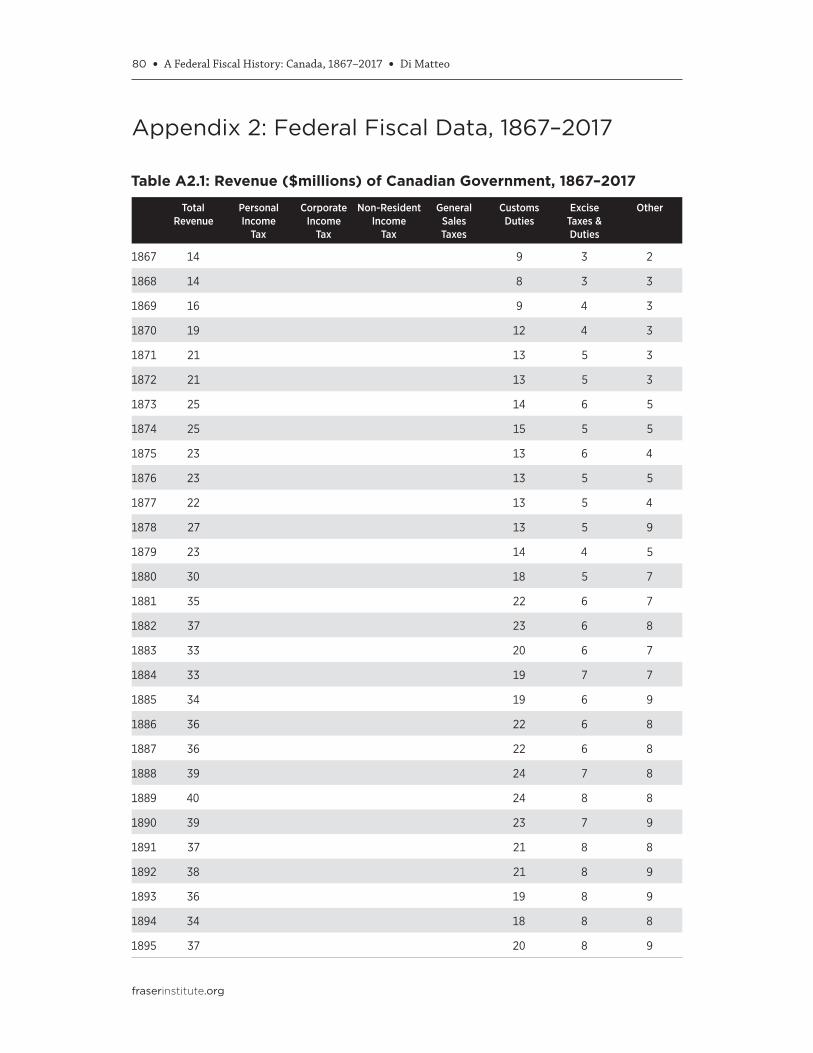
80 • A Federal Fiscal History: Canada, 1867–2017 • Di Matteo
fraserinstitute.org
Appendix 2: Federal Fiscal Data, 1867–2017
Table A2.1: Revenue ($millions) of Canadian Government, 1867–2017
Total Revenue
Personal Income
Tax
Corporate Income
Tax
Non-Resident Income
Tax
General Sales Taxes
Customs Duties
Excise Taxes & Duties
Other
1867 14 9 3 2
1868 14 8 3 3
1869 16 9 4 3
1870 19 12 4 3
1871 21 13 5 3
1872 21 13 5 3
1873 25 14 6 5
1874 25 15 5 5
1875 23 13 6 4
1876 23 13 5 5
1877 22 13 5 4
1878 27 13 5 9
1879 23 14 4 5
1880 30 18 5 7
1881 35 22 6 7
1882 37 23 6 8
1883 33 20 6 7
1884 33 19 7 7
1885 34 19 6 9
1886 36 22 6 8
1887 36 22 6 8
1888 39 24 7 8
1889 40 24 8 8
1890 39 23 7 9
1891 37 21 8 8
1892 38 21 8 9
1893 36 19 8 9
1894 34 18 8 8
1895 37 20 8 9

A Federal Fiscal History: Canada, 1867–2017 • Di Matteo • 81
fraserinstitute.org
Table A2.1 cont’d: Revenue ($millions) of Canadian Government, 1867–2017
Total Revenue
Personal Income
Tax
Corporate Income
Tax
Non-Resident Income
Tax
General Sales Taxes
Customs Duties
Excise Taxes & Duties
Other
1896 38 19 9 10
1897 41 22 8 11
1898 47 25 10 12
1899 51 28 10 13
1900 53 28 10 15
1901 58 32 11 15
1902 69 37 12 20
1903 71 41 13 17
1904 71 42 13 16
1905 80 46 14 20
1906 68 40 12 16
1907 96 57 16 23
1908 86 47 15 24
1909 102 60 15 27
1910 118 72 17 29
1911 136 85 19 32
1912 169 112 21 36
1913 163 105 21 37
1914 133 76 22 35
1915 172 99 24 49
1916 233 134 26 73
1917 261 144 29 88
1918 313 8 1 147 42 115
1919 350 13 7 169 59 102
1920 437 33 14 38 163 78 111
1921 395 40 39 61 106 49 100
1922 410 32 28 90 118 53 89
1923 408 26 29 98 122 61 72
1924 353 25 31 63 108 62 64
1925 383 24 32 73 127 68 59
1926 401 18 29 81 142 73 58
1927 431 23 33 71 157 77 70

82 • A Federal Fiscal History: Canada, 1867–2017 • Di Matteo
fraserinstitute.org
Total Revenue
Personal Income
Tax
Corporate Income
Tax
Non-Resident Income
Tax
General Sales Taxes
Customs Duties
Excise Taxes & Duties
Other
1928 462 25 35 63 187 84 68
1929 453 27 42 44 179 84 77
1930 358 27 44 20 131 73 63
1931 335 25 37 42 104 67 60
1932 312 26 36 57 70 63 60
1933 325 29 27 5 61 66 81 56
1934 362 25 36 6 72 77 83 63
1935 373 33 43 7 78 74 79 59
1936 454 36 58 9 113 84 86 68
1937 517 40 70 10 138 94 95 70
1938 502 47 85 10 122 79 91 68
1939 562 45 78 11 137 104 90 97
1940 872 104 132 13 180 131 193 119
1941 1,489 296 186 28 236 142 327 274
1942 2,250 484 348 28 233 119 395 643
1943 2,765 698 311 27 305 168 476 780
1944 2,687 673 276 29 209 115 486 899
1945 3,013 687 218 28 212 129 472 1,267
1946 3,008 671 239 30 298 237 477 1,056
1947 2,872 670 364 36 372 293 466 671
1948 2,771 763 492 43 377 223 464 409
1949 2,580 622 603 48 403 226 389 289
1950 3,113 652 799 62 460 296 468 376
1951 4,007 976 1,133 55 598 346 530 369
1952 4,585 1,225 1,277 54 708 389 517 415
1953 4,689 1,278 1,247 54 734 407 523 446
1954 4,414 1,284 1,067 61 715 397 479 411
1955 4,716 1,288 1,081 66 802 481 510 488
1956 5,478 1,526 1,336 76 896 549 538 557
1957 5,420 1,635 1,296 64 879 498 549 499
1958 5,130 1,500 1,076 61 868 487 558 580
1959 5,837 1,752 1,234 73 1,003 526 622 627
Table A2.1 cont’d: Revenue ($millions) of Canadian Government, 1867–2017

A Federal Fiscal History: Canada, 1867–2017 • Di Matteo • 83
fraserinstitute.org
Total Revenue
Personal Income
Tax
Corporate Income
Tax
Non-Resident Income
Tax
General Sales Taxes
Customs Duties
Excise Taxes & Duties
Other
1960 6,221 1,941 1,380 88 991 499 636 686
1961 6,374 2,052 1,302 112 1,045 535 626 702
1962 6,570 2,018 1,298 129 1,108 645 642 730
1963 7,003 2,168 1,375 125 1,278 581 666 810
1964 8,141 2,535 1,669 144 1,588 622 680 903
1965 8,865 2,637 1,759 170 1,917 686 742 954
1966 9,975 3,050 1,743 204 2,073 778 777 1,350
1967 10,925 3,650 1,821 221 2,146 746 826 1,515
1968 12,320 4,334 2,213 206 2,098 762 887 1,820
1969 14,755 5,588 2,839 249 2,294 818 897 2,070
1970 15,387 6,395 2,426 258 2,281 815 964 2,248
1971 17,119 7,227 2,396 288 2,653 989 995 2,571
1972 19,808 8,378 2,920 292 3,052 1,182 1,038 2,946
1973 22,997 9,226 3,710 324 3,590 1,384 1,094 3,669
1974 29,965 11,710 4,836 427 3,866 1,809 1,162 6,155
1975 32,441 12,709 5,748 481 3,515 1,887 1,253 6,848
1976 35,283 14,634 5,363 521 3,929 2,097 1,350 7,389
1977 35,633 13,988 5,280 569 4,427 2,312 1,354 7,703
1978 38,214 14,656 5,654 645 4,729 2,747 1,377 8,406
1979 43,310 16,808 6,951 883 4,651 2,996 1,397 9,624
1980 53,181 19,837 8,106 966 5,355 3,185 1,612 14,120
1981 67,289 24,046 8,118 1,138 6,148 3,435 1,739 22,665
1982 67,430 26,330 7,139 1,130 5,842 2,828 1,959 22,202
1983 65,261 26,530 7,174 908 6,561 3,376 2,110 18,602
1984 71,999 28,455 9,234 1,021 7,592 3,794 2,312 19,591
1985 77,742 32,238 9,068 1,053 9,345 3,971 2,827 19,240
1986 86,746 36,733 9,732 1,355 11,972 4,187 2,925 19,842
1987 97,215 42,422 10,710 1,162 12,927 4,385 3,026 22,583
1988 106,349 45,456 11,549 1,578 15,645 4,521 2,959 24,641
1989 115,887 50,584 12,820 1,361 17,672 4,587 3,425 25,438
1990 119,685 56,201 11,545 1,372 13,163 4,001 3,711 29,692
1991 126,086 59,687 9,215 1,261 15,311 3,999 4,557 32,056
Table A2.1 cont’d: Revenue ($millions) of Canadian Government, 1867–2017

84 • A Federal Fiscal History: Canada, 1867–2017 • Di Matteo
fraserinstitute.org
Total Revenue
Personal Income
Tax
Corporate Income
Tax
Non-Resident Income
Tax
General Sales Taxes
Customs Duties
Excise Taxes & Duties
Other
1992 124,486 58,331 7,095 1,191 15,420 3,811 4,103 34,535
1993 123,873 55,173 9,098 1,533 15,939 3,652 3,709 34,769
1994 130,791 60,648 10,969 1,700 17,062 3,575 2,996 33,841
1995 140,257 64,049 15,372 1,882 16,880 2,969 2,998 36,107
1996 149,889 67,796 16,235 2,671 18,159 2,676 3,902 38,450
1997 160,864 74,949 21,179 1,999 19,717 2,766 4,025 36,229
1998 165,520 77,894 21,213 2,208 20,936 2,359 3,706 37,204
1999 176,408 85,070 22,115 2,646 23,121 2,105 3,315 38,036
2000 194,349 92,662 28,293 2,982 24,759 2,784 3,434 39,435
2001 183,930 86,972 24,242 2,925 25,292 3,040 3,953 37,506
2002 190,570 89,530 22,222 3,291 28,248 3,278 4,896 39,105
2003 200,788 93,012 28,612 3,142 28,286 2,887 5,240 39,609
2004 214,237 98,620 31,422 3,560 29,758 3,091 4,954 42,832
2005 224,343 103,770 33,209 4,529 33,020 3,330 4,730 41,755
2006 238,397 110,575 39,361 4,877 31,296 3,704 5,189 43,395
2007 245,525 113,528 42,212 5,693 29,920 3,903 5,245 45,024
2008 237,286 116,612 31,243 6,298 25,740 4,036 4,869 48,488
2009 222,103 105,040 32,247 5,293 26,947 3,490 4,958 44,128
2010 240,840 114,661 31,953 5,137 28,379 3,520 5,662 51,528
2011 249,107 120,537 33,641 5,300 28,370 3,862 5,546 51,851
2012 256,635 125,728 34,986 5,073 28,821 3,979 5,370 52,678
2013 271,677 130,811 36,587 6,404 30,998 4,239 5,413 57,225
2014 282,346 135,743 39,447 6,216 31,349 4,581 5,724 59,286
2015 291,200 142,700 38,800 6,300 33,100 5,200 11,500 53,600
2016 287,700 143,900 37,900 6,300 33,500 5,000 11,100 50,000
2017 302,000 153,700 39,900 6,300 35,200 4,500 11,200 51,200
Data sources for revenue
1867–1965: Historical Statistics of Canada, Series H1-18, Series H19-34;
1966–2014: Federal Fiscal Reference Tables 2015;
2015–2017: Federal Budget 2016.
Table A2.1 cont’d: Revenue ($millions) of Canadian Government, 1867–2017

A Federal Fiscal History: Canada, 1867–2017 • Di Matteo • 85
fraserinstitute.org
Table A2.2: Expenditure ($millions) of Canadian Government, 1867–2017Total
ExpenditureOld Age
Security
Family Allowance;
Child Benefits
Employment Relief,
Insurance
Transfers to Other
Governments
National Defence
Other Program
Expenditure
Public Debt
Charges
1867 14 3 1 6 4
1868 15 3 1 6 5
1869 18 3 1 9 5
1870 19 3 1 10 5
1871 25 3 1 16 5
1872 39 3 1 30 5
1873 33 4 1 22 6
1874 32 4 1 20 7
1875 31 4 1 20 6
1876 32 4 1 20 7
1877 30 4 1 18 7
1878 30 3 1 19 7
1879 33 3 1 21 8
1880 33 4 1 20 8
1881 33 4 1 20 8
1882 42 4 1 29 8
1883 57 4 1 44 8
1884 48 4 3 32 9
1885 60 4 5 41 10
1886 40 4 2 24 10
1887 43 4 2 27 10
1888 42 4 1 27 10
1889 40 4 1 25 10
1890 39 4 1 24 10
1891 40 4 1 25 10
1892 39 4 2 23 10
1893 41 4 1 26 10
1894 41 4 2 24 11
1895 42 4 2 25 11
1896 41 4 3 23 11
1897 43 4 2 26 11
1898 49 4 3 31 11

86 • A Federal Fiscal History: Canada, 1867–2017 • Di Matteo
fraserinstitute.org
Total Expenditure
Old Age
Security
Family Allowance;
Child Benefits
Employment Relief,
Insurance
Transfers to Other
Governments
National Defence
Other Program
Expenditure
Public Debt
Charges
1899 50 4 4 31 11
1900 56 4 3 38 11
1901 61 4 3 43 11
1902 59 4 3 41 11
1903 70 10 4 45 11
1904 77 5 4 57 11
1905 81 7 6 57 11
1906 65 7 4 47 7
1907 110 9 7 83 11
1908 132 9 7 104 12
1909 114 9 6 86 13
1910 122 9 9 91 13
1911 136 10 10 104 12
1912 143 13 11 106 13
1913 185 11 14 147 13
1914 246 12 72 146 16
1915 338 12 173 132 21
1916 497 12 312 137 36
1917 574 11 344 171 48
1918 696 11 439 169 77
1919 740 2 12 347 254 125
1920 529 12 30 347 140
1921 476 1 12 18 310 135
1922 441 1 12 14 276 138
1923 372 13 13 210 136
1924 352 13 13 191 135
1925 356 13 14 198 131
1926 359 13 15 201 130
1927 380 2 14 18 217 129
1928 394 1 14 20 234 125
1929 405 2 14 22 245 122
1930 442 10 19 23 269 121
Table A2.2 cont’d: Expenditure ($millions) of Canadian Government, 1867–2017

A Federal Fiscal History: Canada, 1867–2017 • Di Matteo • 87
fraserinstitute.org
Total Expenditure
Old Age
Security
Family Allowance;
Child Benefits
Employment Relief,
Insurance
Transfers to Other
Governments
National Defence
Other Program
Expenditure
Public Debt
Charges
1931 449 48 14 18 248 121
1932 532 48 15 14 320 135
1933 458 48 15 13 242 140
1934 478 76 15 14 234 139
1935 533 96 18 17 267 135
1936 532 99 17 23 255 138
1937 534 97 21 33 251 132
1938 553 72 21 35 292 133
1939 681 70 19 126 331 135
1940 1,250 50 19 730 305 146
1941 1,885 32 36 1,268 377 172
1942 4,387 31 109 2,563 1,481 203
1943 5,322 34 110 4,242 674 262
1944 5,246 41 108 4,000 757 340
1945 5,136 173 43 113 2,942 1,427 438
1946 2,634 245 45 109 388 1,370 477
1947 2,196 263 59 156 196 1,055 467
1948 2,175 271 67 102 269 991 475
1949 2,449 298 97 105 387 1,111 451
1950 2,901 310 106 126 787 1,133 439
1951 3,759 76 321 83 130 1,447 1,171 531
1952 4,646 323 334 22 342 1,959 1,201 465
1953 4,722 339 350 23 345 1,891 1,278 496
1954 4,657 353 367 24 363 1,762 1,286 502
1955 4,787 366 383 30 359 1,838 1,297 514
1956 5,218 379 398 38 406 1,830 1,633 534
1957 5,482 474 438 48 401 1,712 1,842 567
1958 5,951 559 475 74 490 1,654 2,051 648
1959 6,278 575 491 91 543 1,537 2,257 784
1960 6,551 592 506 103 563 1,538 2,451 798
1961 7,145 625 521 143 567 1,652 2,798 839
1962 7,305 734 532 159 308 1,606 3,048 918
Table A2.2 cont’d: Expenditure ($millions) of Canadian Government, 1867–2017

88 • A Federal Fiscal History: Canada, 1867–2017 • Di Matteo
fraserinstitute.org
Total Expenditure
Old Age
Security
Family Allowance;
Child Benefits
Employment Relief,
Insurance
Transfers to Other
Governments
National Defence
Other Program
Expenditure
Public Debt
Charges
1963 7,681 808 538 172 290 1,730 3,149 994
1964 8,104 885 575 182 399 1,582 3,430 1,051
1965 8,662 927 601 147 466 1,555 3,855 1,111
1966 10,460 1,073 605 250 1,016 1,640 4,639 1,182
1967 11,967 1,388 608 389 1,464 1,754 5,078 1,286
1968 12,987 1,541 612 459 1,813 1,761 5,337 1,464
1969 14,615 1,731 615 542 2,237 1,789 6,007 1,694
1970 16,403 1,907 616 758 2,954 1,818 6,463 1,887
1971 18,905 2,205 614 1,123 3,610 1,862 7,381 2,110
1972 21,709 2,524 608 2,021 4,134 1,937 8,185 2,300
1973 25,208 3,035 993 2,014 4,585 2,224 9,792 2,565
1974 32,190 3,445 1,824 2,351 5,884 2,526 12,922 3,238
1975 38,645 3,934 1,958 3,341 6,874 2,966 15,602 3,970
1976 42,180 4,437 1,980 3,456 8,399 3,373 15,827 4,708
1977 46,512 4,861 2,122 4,121 8,512 3,776 17,589 5,531
1978 51,243 5,491 2,093 4,446 9,551 4,096 18,542 7,024
1979 55,277 6,320 1,725 3,922 10,601 4,377 19,838 8,494
1980 67,737 7,418 1,851 4,524 11,578 5,063 26,645 10,658
1981 82,963 8,585 2,020 5,446 13,088 5,672 33,038 15,114
1982 96,479 9,643 2,231 9,823 14,177 6,599 37,103 16,903
1983 97,624 10,406 2,326 9,782 17,125 7,209 30,346 20,430
1984 109,166 11,418 2,418 10,052 18,548 7,900 33,943 24,887
1985 111,131 12,525 2,501 10,036 18,879 8,386 31,147 27,657
1986 116,588 13,445 2,534 10,444 19,569 9,143 32,735 28,718
1987 126,232 14,349 2,564 10,487 20,518 9,708 37,383 31,223
1988 134,296 15,202 2,606 10,972 22,145 10,206 37,633 35,532
1989 145,030 16,154 2,653 11,694 23,417 10,982 38,884 41,246
1990 153,584 17,039 2,639 14,665 22,928 11,323 39,956 45,034
1991 158,405 18,168 2,606 18,126 24,865 10,759 40,020 43,861
1992 163,505 18,758 3,179 19,065 26,544 10,780 43,847 41,332
1993 162,403 19,578 5,203 17,626 26,947 11,087 41,863 40,099
1994 167,423 20,143 5,322 14,815 26,313 10,580 46,065 44,185
Table A2.2 cont’d: Expenditure ($millions) of Canadian Government, 1867–2017

A Federal Fiscal History: Canada, 1867–2017 • Di Matteo • 89
fraserinstitute.org
Total Expenditure
Old Age
Security
Family Allowance;
Child Benefits
Employment Relief,
Insurance
Transfers to Other
Governments
National Defence
Other Program
Expenditure
Public Debt
Charges
1995 170,263 20,430 5,215 13,476 26,076 9,817 45,842 49,407
1996 158,608 21,207 5,239 12,380 22,162 8,807 41,532 47,281
1997 157,905 21,758 5,352 11,842 20,504 9,087 46,242 43,120
1998 159,741 22,285 5,715 11,884 25,523 9,308 41,723 43,303
1999 162,150 22,856 6,000 11,301 23,243 10,113 45,253 43,384
2000 174,458 23,668 6,783 11,444 24,724 9,744 54,203 43,892
2001 175,882 24,641 7,471 13,726 26,600 10,443 53,350 39,651
2002 183,949 25,692 7,823 14,496 30,640 11,803 56,225 37,270
2003 191,643 26,902 8,062 15,058 29,370 12,869 63,613 35,769
2004 212,774 27,871 8,688 14,748 41,927 14,318 71,104 34,118
2005 211,125 28,992 9,200 14,417 40,757 15,034 68,953 33,772
2006 224,645 30,284 11,214 14,084 42,481 15,732 76,905 33,945
2007 235,928 31,955 11,894 14,298 46,119 17,331 81,006 33,325
2008 243,041 33,377 11,901 16,308 46,476 18,770 85,219 30,990
2009 277,701 34,653 12,340 21,586 56,940 20,863 101,905 29,414
2010 274,212 35,629 12,656 19,850 52,787 21,273 101,146 30,871
2011 275,386 38,045 12,726 17,647 56,794 22,783 96,311 31,080
2012 275,050 40,255 12,975 17,099 58,370 22,978 94,502 28,871
2013 276,827 41,786 13,136 17,300 60,475 21,511 94,399 28,220
2014 280,435 44,103 14,303 18,052 63,109 23,669 90,605 26,594
2015 296,000 45,600 18,100 19,400 65,800 23,464 97,936 25,700
2016 317,100 48,400 21,900 21,100 68,600 23,374 108,026 25,700
2017 331,000 51,100 22,800 21,600 70,300 22,055 116,745 26,400
Data sources for expenditure
1867–1965: Historical Statistics of Canada, Series H1-18, Series H19-34;
1966–2014: Federal Fiscal Reference Tables 2015;
2015–2017: Federal Budget 2016.
Table A2.2 cont’d: Expenditure ($millions) of Canadian Government, 1867–2017

90 • A Federal Fiscal History: Canada, 1867–2017 • Di Matteo
fraserinstitute.org
Table A2.3: Federal Debt ($millions) of Canadian Government, 1867–2017Total Debt Total Assets Net Debt
1867 93 17 76
1868 97 21 76
1869 112 37 76
1870 116 38 78
1871 115 38 78
1872 122 40 82
1873 130 30 100
1874 141 33 108
1875 152 36 116
1876 161 37 125
1877 175 41 133
1878 175 35 140
1879 179 36 143
1880 195 42 152
1881 200 44 155
1882 205 52 154
1883 202 44 158
1884 242 60 182
1885 265 68 196
1886 273 50 223
1887 273 50 227
1888 285 50 235
1889 288 50 238
1890 286 49 238
1891 290 52 238
1892 295 54 241
1893 300 58 242
1894 308 62 246
1895 318 65 253
1896 326 67 258
1897 333 71 262
1898 338 74 264
Total Debt Total Assets Net Debt
1899 345 779 266
1900 346 81 265
1901 355 86 268
1902 366 95 272
1903 361 100 262
1904 365 104 261
1905 378 111 266
1906 392 125 267
1907 380 116 264
1908 408 130 278
1909 479 155 324
1910 471 134 336
1911 475 135 340
1912 508 168 340
1913 483 169 314
1914 544 208 336
1915 700 251 449
1916 937 322 615
1917 1,382 503 879
1918 1,863 671 1,192
1919 2,677 1,102 1,575
1920 3,042 793 2,249
1921 2,902 562 2,341
1922 2,902 480 2,422
1923 2,889 435 2,454
1924 2,820 402 2,418
1925 2,818 401 2,417
1926 2,769 379 2,390
1927 2,726 378 2,348
1928 2,677 380 2,297
1929 2,647 422 2,226
1930 2,545 367 2,178

A Federal Fiscal History: Canada, 1867–2017 • Di Matteo • 91
fraserinstitute.org
Total Debt Total Assets Net Debt
1931 2,610 249 2,262
1932 2,832 456 2,376
1933 2,996 400 2,596
1934 3,141 411 2,730
1935 3,206 360 2,846
1936 3,432 426 3,006
1937 3,543 459 3,084
1938 3,540 439 3,102
1939 3,711 558 3,153
1940 4,029 757 3,271
1941 5,019 1,370 3,649
1942 6,649 2,604 4,045
1943 9,228 3,045 6,183
1944 12,359 3,619 8,740
1945 15,712 4,414 11,298
1946 18,960 5,538 13,421
1947 17,698 4,650 13,048
1948 17,197 4,826 12,372
1949 16,950 5,174 11,776
1950 16,751 5,106 11,645
1951 16,923 5,490 11,433
1952 17,258 6,072 11,185
1953 17,918 6,757 11,162
1954 17,923 6,807 11,116
1955 17,951 6,688 11,263
1956 19,124 7,844 11,280
1957 18,336 7,328 11,008
1958 18,419 7,372 11,046
1959 20,247 8,568 11,678
1960 20,983 8,897 12,089
1961 21,603 9,166 12,437
1962 22,908 9,680 13,228
Total Debt Total Assets Net Debt
1963 24,799 10,880 13,920
1964 25,924 10,854 15,070
1965 26,573 11,069 15,504
1966 28,399 10,691 17,708
1967 30,247 11,497 18,750
1968 32,697 13,280 19,417
1969 34,091 14,814 19,277
1970 38,043 17,750 20,293
1971 42,233 20,154 22,079
1972 46,030 22,050 23,980
1973 48,658 22,467 26,191
1974 54,300 25,884 28,416
1975 60,969 26,349 34,620
1976 69,270 27,753 41,517
1977 81,538 29,142 52,396
1978 99,217 33,792 65,425
1979 107,070 29,678 77,392
1980 123,566 31,618 91,948
1981 141,587 33,965 107,622
1982 170,894 34,223 136,671
1983 244,973 73,117 171,856
1984 284,481 71,811 212,670
1985 319,369 70,125 249,244
1986 355,016 73,184 281,832
1987 388,011 75,036 312,975
1988 421,448 77,879 343,569
1989 449,296 74,539 374,757
1990 487,662 76,582 411,080
1991 524,248 78,519 445,729
1992 563,190 75,973 487,217
1993 607,253 79,327 527,926
1994 648,733 81,239 567,494
Table A2.3 cont’d: Federal Debt ($millions) of Canadian Government, 1867–2017

92 • A Federal Fiscal History: Canada, 1867–2017 • Di Matteo
fraserinstitute.org
Table A2.3 cont’d: Federal Debt ($millions) of Canadian Government, 1867–2017Total Debt Total Assets Net Debt
1995 691,263 92,655 598,608
1996 709,403 100,407 608,996
1997 710,801 103,644 607,157
1998 712,164 109,298 602,866
1999 713,623 123,507 590,116
2000 713,610 141,873 571,737
2001 702,996 137,684 565,312
2002 699,026 139,456 559,570
2003 700,094 149,092 551,002
2004 704,972 155,385 549,587
2005 702,505 165,559 536,946
2006 705,763 181,858 523,905
Total Debt Total Assets Net Debt
2007 692,327 176,046 516,281
2008 824,162 298,949 525,213
2009 883,308 300,836 582,472
2010 920,871 303,963 616,908
2011 969,114 317,579 651,535
2012 1,016,145 337,832 678,313
2013 1,001,723 319,409 682,314
2014 1,023,617 336,658 686,959
2015 1,056,800 336,100 695,700
2016 1,095,500 368,000 727,500
2017 1,138,300 378,800 759,500
Data sources for Debt: 1867–1939: Canada Yearbook 1940: 854–855 (dollars); 1940–1949: Canada Yearbook 1950: 1,024; 1950–1959: Canada Yearbook 1960: 1,090; 1960-1965: Canada Yearbook 1967: 1,045; 1966–2014: Federal Fiscal Reference Tables, 2015: tables 15, 13; 2015–2017: Federal Budget 2016. Note on data series: According to the Federal Fiscal Reference Tables, because of a break in the series following the introduction of full accrual accounting, data from 1983/84 onward are not directly compatible with earlier years.

A Federal Fiscal History: Canada, 1867–2017 • Di Matteo • 93
fraserinstitute.org
References
Ajzenstat, J. (2010). Confederation and Individual Liberty. MacDonald-Laurier Institute.Ajzenstat, J., P. Romney, I. Gentles, and W.D. Gairdner, eds. (1999). Canada’s Founding
Debates. Stoddart.Arjani, N., and G. Pauln (2013). Lessons from the Financial Crisis: Bank Performance and
Regulatory Reform. Bank of Canada. Discussion Paper 2013-4.Bazel, P., and J.M. Mintz (2015). Optimal Public Infrastructure: Some Guideposts to Ensure
We Don’t Overspend. SPP Research Papers 8, 37 (November). School of Public Policy, University of Calgary. <www.policyschool.ca/wp-content/uploads/2016/03/optimal-public-
infrastructure-bazel-mintz.pdf>.Beaumier, G. (1998). Regional Development in Canada. 88-13E. Government of Canada.
<publications.gc.ca/Collection-R/LoPBdP/CIR/8813-e.htm>. Bird, R. (1978). Canada’s Vanishing Death Taxes. Osgoode Hall Law Journal 16, 1: 133–145.Black, E.R. (1974). Divided Loyalties: Canadian Concepts of Federalism. McGill-Queen’s
University Press.Boadway, R. (2014). Piecemeal Tax Reform Ideas for Canada-Lessons from Principles and
Practice. Canadian Tax Journal 62, 4: 1029–1059.Boadway, R., and A. Shah (2009). Fiscal Federalism. Cambridge University Press.Canada (1873). 1871 Census of Canada, Volume I. I.B. Taylor, Printer.Canada, Department of Finance (1945). Public Accounts of Canada 1945. Edmond
Cloutier Printer.Canada, Department of Finance (2016). A Plan for Middle Class Progress: Fall Economic
Statement 2016.Canada, Department of National Revenue, Taxation Division (1964). Taxation Statistics
1964. Queen’s Printer.Canada, Dominion Bureau of Statistics (1962). Canada Yearbook 1962. <http://www66.
statcan.gc.ca/eng/acyb_c1962-eng.aspx>.Cross. P., and P. Bergevin (2012). Turning Points: Business Cycles in Canada since 1926.
Commentary No. 366. C.D. Howe Institute. <www.cdhowe.org/pdf/Commentary_366.pdf>.Courchene, T.J. (2002). Half-Way Home: Canada’s Remarkable Fiscal Turnaround and the
Paul Martin Legacy. Policy Matters 3, 8 (July). Institute for Research on Public Policy. <irpp.org/research-studies/policy-matters-vol3-no8/>.

94 • A Federal Fiscal History: Canada, 1867–2017 • Di Matteo
fraserinstitute.org
Deutsch, J.J. (1940). War Finance and the Canadian Economy. Canadian Journal of Economics and Political Science 6, 4: 525–542.
Di Matteo, L. (1995). Fiscal Centralization at the Provincial-Local Level in Canada, 1961–1991. Canadian Tax Journal 43, 3: 639–659.
Di Matteo, L. (2013). Measuring Government in the 21st Century. Fraser Institute. <www.
fraserinstitute.org/studies/measuring-government-in-the-21st-century>.Di Matteo, L., J. Clemens and M. Palacios (2014). Can Canada Prosper without a
Prosperous Ontario. Fraser Institute. <www.fraserinstitute.org/studies/can-canada-prosper-
without-prosperous-ontario>.Di Matteo, L., J. Emes, C. Lammam, and B. Eisen (2016). Comparing Recent Economic
Performance in Canada and the United States: A Provincial and State-level Analysis. Fraser Institute. <www.fraserinstitute.org/studies/comparing-recent-economic-performance-in-
canada-and-the-united-states>.Dornbusch, R., S. Fischer, and G.R. Sparks (1993). Macroeconomics, Fourth Canadian
Edition. McGraw-Hill Ryerson.The Economist (2014, May 3). Maple, Resting on Laurels: Canada Has Not Learned Every
Crisis Lesson. <http://www.economist.com/news/americas/21601521-canada-has-not-learned-
every-crisis-lesson-maple-resting-laurels>.Eichengreen, B. (1992). Golden Fetters: The Gold Standard and the Great Depression, 1919–
1939. Oxford University Press.Eichengreen, B., and P. Temin (1997). The Gold Standard and the Great Depression. NBER
Working Paper 6060. National Bureau of Economic Research.Emery, J.C.H., and K.J. McKenzie (1996). Damned if You Do, Damned if You Don’t: An
Option Value Approach to Evaluating the Subsidy of the CPR- Mainline. Canadian Journal of Economics 29, 2: 255–270.
Expert Panel on Equalization and Territorial Formula Financing (2006). Achieving a National Purpose: Putting Equalization Back on Track. Department of Finance, Canada.
Federation of Canadian Municipalities (2007). Your Guide to Municipal Institutions in Canada. International Centre for Municipal Development. <www.fcm.ca/Documents/
tools/International/Your_Guide_to_Municipal_Institutions_in_Canada_EN.pdf.Ferrie, J.P., and T.J. Hatton (2013). Two Centuries of International Migration. IZA
Discussion Paper No. 7866.Fowke, V.C. (1957/1971). The National Policy and the Wheat Economy. University of
Toronto Press.Gauthier, J. (2012). The Canada Social Transfers: Past, Present and Future Considerations.
Background Paper No. 2012-48-E (September 13). Library of Parliament. <www.lop.
parl.gc.ca/content/lop/ResearchPublications/2012-48-e.pdf>.

A Federal Fiscal History: Canada, 1867–2017 • Di Matteo • 95
fraserinstitute.org
George, P.J. (1968). Rates of Return in Railway Investment and Implications for Government Subsidization of the Canadian Pacific Railway: Some Preliminary Results. Canadian Journal of Economics 1, 4: 740–762.
George, P.J. (1975). Rates of Return and Government Subsidization of the Canadian Pacific Railway: Some Further Comments. Canadian Journal of Economics 8: 591–600.
Gillespie, W.I. (1991). Tax, Borrow and Spend: Financing Federal Government Spending in Canada, 1867–1990. Carleton University Press.
Glazebrook, G.P. de T. (1938/1969). A History of Transportation in Canada. Greenwood.Green, A.G., and M.C. Urquhart (1987). New Estimates of Output Growth in Canada:
Measurement and Interpretation. In D. McCalla, ed., Perspectives on Canadian Economic History (Copp Clark Pittman): 182–199.
Hobsbawm, E. (1998). Age of Extremes: The Short Twentieth Century, 1914–1991. Abacus.Hobson, P.A.R. (1995). Reforming Federal-Provincial Fiscal Relations: An Assessment of
Some Recent Proposals. Canadian Journal of Regional Science 18, 2: 179–197.Indigenous and Northern Affairs Canada (2014). First Nations People in Canada. <www.
aadnc-aandc.gc.ca/eng/1303134042666/1303134337338>.Innis, H.A. (1971/1923). A History of the Canadian Pacific Railway. University of Toronto Press.Jackson, G.E. (1923). Emigration of Canadians to the United States. Annals of the
American Academy of Political and Social Science 107, Social and Economic Conditions in the Dominion of Canada: 25–34.
Kneebone, R., and M. Gres (2013). The Past and Future of Ontario’s Public Debt. In Jason Clemens and Niels Veldhuis, eds., The State of Ontario’s Indebtedness: Warning Signs to Act (Fraser Institute): 25–34. <www.fraserinstitute.org/studies/state-of-ontarios-
indebtedness>.Kwavnick, E., ed. (1953/1973). Tremblay Report. Carleton Library No. 64. McGill-
Queen’s University Press.La Forest, G.V. (1967). The Allocation of Taxing Power under the Canadian Constitution.
Canadian Tax Foundation.Leacy, F.H., ed. (1983). Historical Statistics of Canada, Second Edition. Statistics Canada.Lewis, F., and M. Mackinnon (1987). Government Loan Guarantees and the Failure of
the Canadian Northern Railway. Journal of Economic History 47, 1: 175–196.Lin, Z. (1998). Employment Insurance in Canada: Policy Changes. Perspectives (Summer).
Cat. No. 75-001-XPE. Statistics Canada.Mackintosh, W.A. (1940/1964). The Economic Background of Dominion-Provincial Relations.
Carleton Library No. 13. McClelland and Stewart.McKenzie, K. (2015). The Corporate Income Tax in Canada-Past, Present, and Future.
Canadian Tax Journal 63, 4: 1011–1026.

96 • A Federal Fiscal History: Canada, 1867–2017 • Di Matteo
fraserinstitute.org
Moore, A.M., J.H Perry, and D.I. Beach (1966). The Financing of Canadian Federation: The First Hundred Years. Canadian Tax Paper No. 43. Canadian Tax Foundation.
Moscovitch, Allan (2015). s.v. Welfare State. The Canadian Encyclopedia. <www.
thecanadianencyclopedia.ca/en/article/welfare-state/>.Norrie, K., D. Owram, and J.C.H. Emery (2008). A History of the Canadian Economy,
Fourth Edition. Nelson.Oates, W. (1972). Fiscal Federalism. Harcourt, Brace, Jovanovich.Parkin, M., and R. Bade (1995). Modern Macro 4th Edition. Prentice-Hall Canada.Pellerin, M. (2006). The Evolution of the Government of Canada’s Debt Distribution
Framework. Bank of Canada Review Spring: 37–44.Perry, J.H. (1955). Taxes, Tariffs and Subsidies: A History of Canadian Fiscal Development.
Volumes 1 and 2. University of Toronto Press.Perry, J.H. (1984). Taxation in Canada, Fourth Edition. Canadian Tax Paper no. 74.
Canadian Tax Foundation.Perry, J.H. (1989). A Fiscal History of Canada—The Postwar Years. Canadian Tax Paper No.
85. Canadian Tax Foundation.Pomfret, R. (1993). The Economic Development of Canada, Second Edition. Nelson.Reid, J.H. Stewart, Kenneth McNaught, and Harry. S. Crowe (1959). A Source-Book of
Canadian History. Longmans, Green.Smiley, D.V., ed. (1940/1964). Rowell/Sirois Report, Book I. Carleton Library No. 5.
McLelland and Stewart.Smith, A. (1776/1937). The Wealth of Nations. Modern Library Edition. Random House.Smith, P.J. (1987). The Ideological Origins of Canadian Confederation. Canadian journal
of Political Science 20, 1 (March): 3–29.Speer, S., and J. Emes (2014). Post-Stimulus Spending Trends in Canada. Fraser Research
Bulletin (February). Fraser Institute. <www.fraserinstitute.org/studies/post-stimulus-
spending-trends-in-canada>.Temin, P. (1989). Lessons from the Great Depression. MIT Press.Tillotson, S. (2015). Warfare State, Welfare State, and the Selling of the Personal Income
Tax, 1942-1945. Canadian Tax Journal 63, 1: 53–90.Urquhart, M.C. (1988). Canadian Economic Growth 1870-1980. Queen’s Economics
Department Discussion Paper No. 734.Urquhart, M.C. (1994). Gross National Product, Canada 1870-1926: Derivation of the
Estimates. McGill-Queen’s University Press.Urquhart, M.C., and K.A.H. Buckley, eds. (1965). Historical Statistics of Canada. MacMillan.Vaillancourt, F., C. Lammam, F. Ren, and M. Roy (2016). Measuring Personal Income Tax
Complexity in Canada. Fraser Institute. <www.fraserinstitute.org/studies/measuring-personal-
income-tax-complexity-in-canada>.

A Federal Fiscal History: Canada, 1867–2017 • Di Matteo • 97
fraserinstitute.org
Veldhuis, N., J. Clemens, and M. Palacios (2011). Budget Blueprint: How Lessons from Canada’s 1995 Budget Can Be Applied Today. Fraser Institute. <www.fraserinstitute.org/
studies/budget-blueprint-how-lessons-canadas-1995-budget-can-be-applied-today>.Wilson, M.H. (The Honourable, Minister of Finance) (1987). The White Paper: Tax Reform
1987. Canada, Department of Finance.Wrobel, M.G. (1995). Debt Repatriation: Issues and Options. Parliamentary Research
Branch. MR-135E. <publications.gc.ca/Collection-R/LoPBdP/MR/mr135-e.htm>.

98 • A Federal Fiscal History: Canada, 1867–2017 • Di Matteo
fraserinstitute.org
About the Author
Livio Di MatteoLivio Di Matteo is a Senior Fellow at the Fraser Institute and Professor of Economics at Lakehead University in Thunder Bay, Ontario, where he specializes in public policy, health economics, public finance, and economic history. His recent work examines health-care spending and its sustainability. As well, he conducts research on the historical evolution of economic inequality. Di Matteo is a member of the CIHI National Health Expenditure Advisory Panel, the Evidence Network (EvidenceNetwork.ca), and is a contributor to the economics blog, Worthwhile Canadian Initiative. He has been listed in Canadian Who’s Who since 1995 and holds a Ph.D. from McMaster University, an M.A. from the University of Western Ontario, and a B.A. from Lakehead University.
Acknowledgments
The author would like to thank the Barbara and Bob Mitchell Fund for its support of this research. He also thanks anonymous reviewers for their thoughtful corrections and comments. Any remaining errors or oversights are the sole responsibility of the author. As the researcher has worked independently, the views and conclusions expressed in this paper do not necessarily reflect those of the Board of Directors of the Fraser Institute, the staff, or supporters.

A Federal Fiscal History: Canada, 1867–2017 • Di Matteo • 99
fraserinstitute.org
Publishing Information
DistributionThese publications are available from <http://www.fraserinstitute.org> in Portable Document Format (PDF) and can be read with Adobe Acrobat® or Adobe Reader®, versions 7 or later. Adobe Reader® DC, the most recent version, is available free of charge from Adobe Systems Inc. at <http://get.adobe.com/reader/>.
Ordering publicationsTo order printed publications from the Fraser Institute, please contact us via e-mail: sales@
fraserinstitute.org; telephone: 604.688.0221, ext. 580 or, toll free, 1.800.665.3558, ext. 580.
MediaFor media enquiries, please contact our communications department via e-mail: [email protected]; telephone: 604.714.4582. In Toronto, contact our media specialist via telephone at 416.363.6575, ext. 238.
CopyrightCopyright © 2017 by the Fraser Institute. All rights reserved. No part of this publication may be reproduced in any manner whatsoever without written permission except in the case of brief passages quoted in critical articles and reviews.
Date of issue ISBNFebruary 2017 978-0-88975-438-6
CitationLivio Di Matteo (2017). A Federal Fiscal History: Canada, 1867–2017. Fraser Institute.
Cover designJames Clarke, Hi. Creative Agency
Credits for coverDuncan Cameron / Library and Archives Canada: “Lester B Pearson”, “Pierre Elliot Trudeau”. Library and Archives Canada: “W.L. Mackenzie King”. Michael Ignatieff: “Jean Chretien”. Office of the Prime Minister: “Justin Trudeau”. William James Topley / Library and Archives Canada: “John A MacDonald”, “Wilfred Laurier”, “Robert Laird Borden”.

100 • A Federal Fiscal History: Canada, 1867–2017 • Di Matteo
fraserinstitute.org
Supporting the Fraser Institute
To learn how to support the Fraser Institute, please contact us via post: Development Department, Fraser Institute, Fourth Floor, 1770 Burrard Street, Vancouver, British Columbia, V6J 3G7, Canada; telephone: toll-free to 1.800.665.3558, ext. 548; e-mail: [email protected]; or visit our webpage: <http://www.fraserinstitute.org/
support-us/overview.aspx>.
Purpose, Funding, and Independence
The Fraser Institute provides a useful public service. We report objective information about the economic and social effects of current public policies, and we offer evidence-based research and education about policy options that can improve the quality of life.
The Institute is a non-profit organization. Our activities are funded by charitable dona-tions, unrestricted grants, ticket sales, and sponsorships from events, the licensing of products for public distribution, and the sale of publications.
All research is subject to rigorous review by external experts, and is conducted and pub-lished separately from the Institute’s Board of Trustees and its donors.
The opinions expressed by authors are their own, and do not necessarily reflect those of the Institute, its Board of Directors, its donors and supporters, or its staff. This publica-tion in no way implies that the Fraser Institute, its directors, or staff are in favour of, or oppose the passage of, any bill; or that they support or oppose any particular political party or candidate.
As a healthy part of public discussion among fellow citizens who desire to improve the lives of people through better public policy, the Institute welcomes evidence-focused scrutiny of the research we publish, including verification of data sources, replica-tion of analytical methods, and intelligent debate about the practical effects of policy recommendations.

A Federal Fiscal History: Canada, 1867–2017 • Di Matteo • 101
fraserinstitute.org
About the Fraser Institute
Our vision is a free and prosperous world where individuals benefit from greater choice, competitive markets, and personal responsibility. Our mission is to measure, study, and communicate the impact of competitive markets and government interventions on the welfare of individuals.
Founded in 1974, we are an independent Canadian research and educational organiza-tion with locations throughout North America and international partners in over 85 countries. Our work is financed by tax-deductible contributions from thousands of individuals, organizations, and foundations. In order to protect its independence, the Institute does not accept grants from government or contracts for research.
Nous envisageons un monde libre et prospère, où chaque personne bénéficie d’un plus grand choix, de marchés concurrentiels et de responsabilités individuelles. Notre mission consiste à mesurer, à étudier et à communiquer l’effet des marchés concurrentiels et des interventions gouvernementales sur le bien-être des individus.
Peer review —validating the accuracy of our researchThe Fraser Institute maintains a rigorous peer review process for its research. New research, major research projects, and substantively modified research conducted by the Fraser Institute are reviewed by experts with a recognized expertise in the topic area being addressed. Whenever possible, external review is a blind process. Updates to previ-ously reviewed research or new editions of previously reviewed research are not reviewed unless the update includes substantive or material changes in the methodology.
The review process is overseen by the directors of the Institute’s research departments who are responsible for ensuring all research published by the Institute passes through the appropriate peer review. If a dispute about the recommendations of the reviewers should arise during the Institute’s peer review process, the Institute has an Editorial Advisory Board, a panel of scholars from Canada, the United States, and Europe to whom it can turn for help in resolving the dispute.

102 • A Federal Fiscal History: Canada, 1867–2017 • Di Matteo
fraserinstitute.org
Editorial Advisory Board
Members
Past members
* deceased; † Nobel Laureate
Prof. Terry L. Anderson
Prof. Robert Barro
Prof. Michael Bliss
Prof. Jean-Pierre Centi
Prof. John Chant
Prof. Bev Dahlby
Prof. Erwin Diewert
Prof. Stephen Easton
Prof. J.C. Herbert Emery
Prof. Jack L. Granatstein
Prof. Herbert G. Grubel
Prof. James Gwartney
Prof. Ronald W. Jones
Dr. Jerry Jordan
Prof. Ross McKitrick
Prof. Michael Parkin
Prof. Friedrich Schneider
Prof. Lawrence B. Smith
Dr. Vito Tanzi
Prof. Armen Alchian*
Prof. James M. Buchanan* †
Prof. Friedrich A. Hayek* †
Prof. H.G. Johnson*
Prof. F.G. Pennance*
Prof. George Stigler* †
Sir Alan Walters*
Prof. Edwin G. West*


![Debt Deficits [Read-Only] - Montana State University · Definitions • Deficit = Expenditure – Revenue –Usually, per year –“The Federal Government’s deficit in 2010 was](https://img.dokumen.tips/doc/110x75/5f42961e92276021d744339c/debt-deficits-read-only-montana-state-definitions-a-deficit-expenditure.jpg)