Embed Size (px)
Citation preview
A Dual Programfor Translation Regulationin Cellular Proliferation and DifferentiationHila Gingold,1,15 Disa Tehler,2,15 Nanna R. Christoffersen,2 Morten M. Nielsen,5 Fazila Asmar,9 Susanne M. Kooistra,2
Nicolaj S. Christophersen,2 Lise Lotte Christensen,5 Michael Borre,6 Karina D. Sørensen,5 Lars D. Andersen,5
Claus L. Andersen,5,7 Esther Hulleman,11 TomWurdinger,12,13 Elisabeth Ralfkiær,10 Kristian Helin,2,3,4 Kirsten Grønbæk,9
Torben Ørntoft,5 Sebastian M. Waszak,14 Orna Dahan,1 Jakob Skou Pedersen,5,8 Anders H. Lund,2,* and Yitzhak Pilpel1,*1Department of Molecular Genetics, The Weizmann Institute of Science, Rehovot 76100, Israel2Biotech Research and Innovation Centre3Center for Epigenetics4The Danish Stem Cell Center (Danstem)University of Copenhagen, 2200 Copenhagen, Denmark5Department for Molecular Medicine6Department of Urology7Department of Surgery8Bioinformatics Research Centre
Aarhus University Hospital, 8000 Aarhus, Denmark9Department of Hematology10Department of PathologyRigshospitalet, University of Copenhagen, 2100 Copenhagen, Denmark11Department of Pediatric Oncology12Department of NeurosurgeryNeuro-oncology Research Group, Cancer Center Amsterdam, VU University Medical Center, 1007 MB Amsterdam, the Netherlands13Department of Neurology, Massachusetts General Hospital and Harvard Medical School, Boston, MA 02114, USA14Institute of Bioengineering, School of Life Sciences, Ecole Polytechnique Federale de Lausanne, 1015 Lausanne, Switzerland15Co-first author*Correspondence: [email protected] (A.H.L.), [email protected] (Y.P.)
http://dx.doi.org/10.1016/j.cell.2014.08.011
SUMMARY
A dichotomous choice for metazoan cells is betweenproliferation and differentiation. Measuring tRNApools in various cell types, we found two distinctsubsets, one that is induced in proliferating cells,and repressed otherwise, and another with the oppo-site signature. Correspondingly, we found that genesserving cell-autonomous functions and genes in-volved in multicellularity obey distinct codon usage.Proliferation-induced and differentiation-inducedtRNAs often carry anticodons that correspond tothe codons enriched among the cell-autonomousand the multicellularity genes, respectively. BecausemRNAs of cell-autonomous genes are induced inproliferation and cancer in particular, the con-comitant induction of their codon-enriched tRNAssuggests coordination between transcription andtranslation. Histone modifications indeed changesimilarly in the vicinity of cell-autonomous genesand their corresponding tRNAs, and in multicel-lularity genes and their tRNAs, suggesting the ex-istence of transcriptional programs coordinatingtRNA supply and demand. Hence, we describe the
C
existence of two distinct translation programs thatoperate during proliferation and differentiation.
INTRODUCTION
An important dichotomy in the life of a cell in many multicellular
species is between proliferation and differentiation. The classic
The Hallmarks of Cancer (Hanahan and Weinberg, 2000) states
that ‘‘.cells may be induced to permanently relinquish their pro-
liferative potential by being induced to enter into postmitotic
states, usually associated with acquisition of specific differentia-
tion-associated traits.’’ Indeed, proliferation and differentiation
are often distinct cellular states; generally, differentiated cells are
less proliferative, and proliferating cells are typically not terminally
differentiated. Cancer demonstrates this dichotomy, as trans-
formed cells sometimes lose their original differentiation marks
(Kumar et al., 2012). This dichotomy was also illustrated in normal
liver (Klochendler et al., 2012), in which a small percentage of pro-
liferative cells show reduced levels of liver differentiation markers.
So far, most studies that examined gene-expression pro-
grams in proliferation, cancerous in particular, and differentiation
focused on the transcriptome (Dutkowski and Ideker, 2011;
Perou et al., 2000). More recently, interest increased in mea-
suring translation and its changes in cancer (Hsieh et al., 2012;
Pavon-Eternod et al., 2009) and in differentiating cells (Ingolia
ell 158, 1281–1292, September 11, 2014 ª2014 Elsevier Inc. 1281
et al., 2011). Originally, the interest in translation was mainly
focused on initiation (Mamane et al., 2006; Sonenberg and Hin-
nebusch, 2009), yet, more recently, attention toward elongation
has increased (Hsieh et al., 2012). The secondary structure of the
mRNA was recognized as a prime factor affecting initiation and
early elongation (Goodman et al., 2013; Kudla et al., 2009; Tuller
et al., 2010). However, whether this essential attribute of mRNAs
can be programmed to change dynamically across conditions is
unknown. The cellular tRNA pool is another prime factor that
controls translation (reviewed in Gingold and Pilpel, 2011; Subra-
maniam et al., 2013; Tuller et al., 2010), and a role of the tRNA
pool in cancer and across differentiated tissues is beginning to
be characterized. Small-RNA sequencing (Yang et al., 2010)
and tRNA customized arrays (Pavon-Eternod et al., 2009) have
provided data regarding changes in tRNA availability in cancer.
Occupancy of the tRNA polymerase, RNA Pol III, in the vicinity
of tRNA genes was measured across organs and species (Kutter
et al., 2011; Raha et al., 2010) as were the histone epigenetic
marks in their vicinity (Barski et al., 2010; Oler et al., 2010). Yet,
it remains unknownwhich tRNAs display which types of changes
in various cell types and how they affect and are affected by the
transcriptome and by cellular physiology.
If we consider the tRNA as the ‘‘supply’’ in translation, then the
codon usage in the transcriptome is the ‘‘demand’’ (reviewed
in Gingold and Pilpel, 2011). The balance between supply and
demand, i.e., the extent of adaptation of the tRNA pool to the
codon usage in the transcriptome, could affect production levels
of proteins (Qian et al., 2012). In addition, cellular fitness could be
affected by the extent of a global codon-to-tRNA adaptation (Ku-
dla et al., 2009; Navon andPilpel, 2011), and especially highly ex-
pressed genes appear to be codon optimized (Gingold et al.,
2012). It was suggested that low compatibility between demand
and supply, especially if presented by highly expressed genes,
can result in a global inefficient allocation of resources such as
ribosomes and thus could be fitness reducing (Kudla et al.,
2009). Hence, production costs and production throughput are
prime factors that can be influenced by coordination between
tRNA supply and demand. Equally interesting are cases in which
certain genes appear to be selected for deliberately low codon-
to-tRNA adaptation, e.g., as in the case of some circadian clock
genes (Xu et al., 2013; Zhou et al., 2013).
Here we measured the tRNA pool in hundreds of proliferating
and differentiating samples, including cancers and normal cells.
We found that the tRNAs that are induced in proliferating cells
are typically repressed in differentiating/arresting cells, and
that they carry anticodons which often correspond to a codon
usage signature that is characteristic of proliferation-related
genes. Conversely, the tRNAs that are induced in differentiating
cells are often found to be repressed in proliferating cells and to
be better tuned to a characteristic codon-usage preference of
the differentiation-related genes.
RESULTS
Opposing tRNA Signatures in Proliferation andDifferentiationIn order to follow changes in the tRNA pool in a diversity of prolif-
erating, differentiating/differentiated, and arrested cells, we used
1282 Cell 158, 1281–1292, September 11, 2014 ª2014 Elsevier Inc.
two complementary experimental platforms: microarrays and
the histone modification maps in the genomic vicinity of the
tRNA genes. First, we designed and printed microarrays that
probe human tRNAs (in addition to other noncoding and coding
genes). Our array platform represents tRNAs for most amino
acids and anticodon types, excluding tRNAs that are either
prone to cross-hybridization or that have low tRNA scores
(Lowe and Eddy, 1997) (see Experimental Procedures, Extended
Experimental Procedures, and Table S3). We used the arrays to
measure expression levels of tRNAs in 470 samples that repre-
sent various states of proliferation (normal or cancerous), differ-
entiation or growth arrest, and senescence (see Table 1). Our
proliferating cells consisted of both primary tumors and cancer
cell lines from diffuse large B cell lymphoma (DLBCL), bladder,
colon, glioblastoma, and prostate cancer. In addition, we also
examined immortalized normal fibroblasts that were induced to
proliferate by expression of key oncogenes, or after release
from serum starvation. Our differentiated cells included normal
cells from each of the above tumor sources, in addition to embry-
onic stem cells (ESCs) after induction of differentiation. In addi-
tion, we inspected immortalized fibroblast cells at two arrested
conditions, namely after induction of senescence and in
response to serum starvation. In parallel to the microarrays, we
analyzed ENCODE data sets (Bernstein et al., 2012) and addi-
tional sources (Bert et al., 2013; Gifford et al., 2013). We in-
spected the vicinity of the human tRNA genes with respect to
several histone modifications that are associated with either
active transcription or repression, in addition to examining occu-
pancy by RNA Pol III (Oler et al., 2010).
The two experimental platforms are complementary, exam-
ining the expression of the tRNAs themselves and their genomic
regions and transcriptional statuses, respectively. Reassuringly,
the tRNA abundance measurements obtained with the arrays
correlate well (Pearson coefficient = 0.54 to 0.71 for the various
conditions) with transcription activation-associated chromatin
modifications as measured in ENCODE across all represented
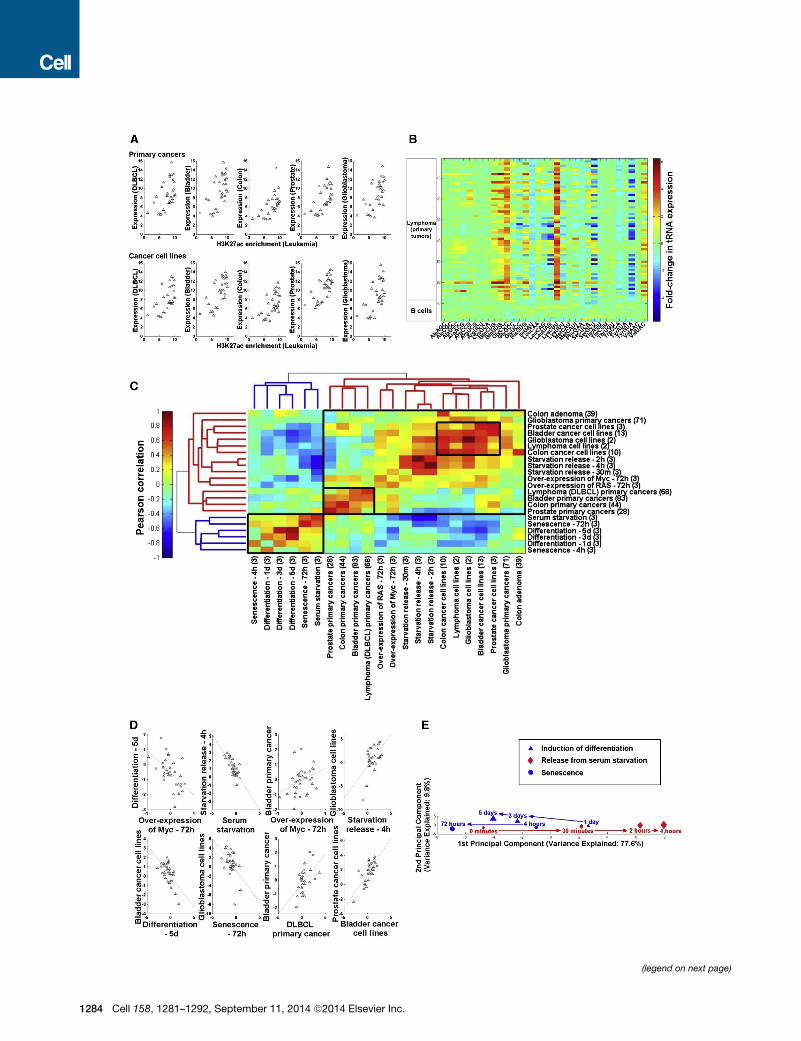
tRNAs (Figure 1A). We first focused on the expression measure-
ments based on microarray platform.
Figure 1B shows the relative changes in the tRNA pool in each
of 68 patients with DLBCL compared to the tRNA levels in normal
B cells from ten healthy donors. Overall, the tRNA pool changes
reproducibly among the lymphoma patients, e.g., the median
Pearson correlation among all pairs of samples was 0.66.
Whereas the expression of some tRNA genes is elevated more
than 10-fold in cancer, the expression of others decreases more
than 10-fold. Interestingly, in some cases, tRNAs that translate
different codons for the same amino acid show opposite trends.
Comparing the tRNA pool changes in several cancer types,
each relative to its corresponding normal tissue, we found a
high similarity among the patients within each given cancer
type (Figure 1C, values on the diagonal), and also a significant,
albeit lower, similarity between different cancers (Figure 1C,
off-diagonal).
Cancerous samples, and even cancer cell lines, are complex
and can be heterogeneous. To complement the picture that
emerges from such samples, and to examine whether the prolif-
eration/differentiation statuses of cells are reflected in their tRNA
pools, we established a series of manipulated noncancerous

Table 1. Overview of Samples Used for RNA Expression Profiling
Cancer/Model System Samples/Cell Lines Sample Description/Experiment
Primary Cancers
Bladder cancer patient samples and cancer cell lines tumor samples (n = 83), normal tissue (n = 8), bladder cancer cell lines (n = 13)
Colon cancer patient samples and cancer cell lines carcinoma samples (n = 44), adenoma samples (n = 39), adjacent normal
mucosa (n = 16), colon cancer cell lines (n = 10)
Diffuse large B cell
lymphoma
patient samples and cancer cell lines tumor samples (n = 68), normal B cells (n = 10), DLBCL cell lines (n = 2)
Glioblastoma patient samples and cancer cell lines tumor samples (n = 71), normal brain (n = 2), glioblastoma cell lines (n =2)
Prostate cancer patient samples and cancer cell lines tumor samples (n = 28), normal tissue (n = 11), prostate cancer cell lines (n = 3)
Model Systems
Differentiation human embryonic stem cells (hESC) ATRA-induced differentiation of hESCs after 0, 1, 3, and 5 days (n = 3 per
time point)
Serum starvation human fibroblast cells: BJ/hTERT proliferating and serum-starved human fibroblast cells with re-introduction of
serum for 30 min, 2 hr, and 4 hr (n = 3 per time point)
Senescence human fibroblast cells:
TIG3/hTERT/BRAF::ER
BRAF-induced senescence versus control in human fibroblast cells after 4 hr
and 72 hr (n = 3 per time point)
MYC overexpression human fibroblast cells: BJ/hTERT human fibroblast cells with overexpression of MYC or control vectors for 24 hr
and 72 hr (n = 3 per time point)
RAS overexpression human fibroblast cells: BJ/hTERT human fibroblast cells with overexpression of HRASV12 or control vectors for
24 hr and 72 hr (n = 3 per time point)
cells that were induced either to proliferate, to arrest growth, to
senesce, or to differentiate.
We first examined the tRNA pool in normal human fibroblasts
induced to proliferate by a 4 hr time course of serum stimulation
following a period of serum starvation-induced cell-cycle arrest.
In addition, we examined the same cell type 72 hr after over-
expression of either of the oncogenes MYC or HRASV12. The
model systems were validated for oncogene overexpression
and induction of relevant proliferation and differentiationmarkers
(Figures S1A and S1B). We found that the tRNA pool changes
similarly among all proliferating samples, either cancerous or
noncancerous (Figure 1C).
To determine the tRNA profile in differentiated and arresting
cells, we created three different model systems: (1) human
ESCs (hESCs) induced to differentiate with retinoic acid; (2)
BRAF-induced senescence in human fibroblasts; (3) induced
cell-cycle arrest in human fibroblasts by serum starvation.
Here too we validated that the treatments yielded the expected
response (Figures S1C and S1D). The changes in tRNA levels
were typically positively correlated among all the differentiated
and arrested cells, whereas they were overall negatively corre-
lated with the changes observed in the proliferating samples
(Figure 1C). Figure 1D illustrates a collection of correlation plots
between the tRNA pool changes among the proliferative sam-
ples (0.38 < Spearman’s rho < 0.69; all p values < 0.05), as
well as the negative correlations between proliferative and differ-
entiating/arresting samples (�0.7 < Spearman’s rho < �0.42; all
p values < 0.05).
Two special tRNAs, the initiator methionine and the selenocys-
teine, are noticeable (Figure S1E). The initiator methionine tRNA,
but not the elongator, is induced in most proliferating samples
and repressed in the differentiating or arresting cells. These re-
sults are in line with a study showing that overexpression of
C
the initiator tRNA-Met elevates cell proliferation in human epithe-
lial cells (Pavon-Eternod et al., 2013). Conversely, the tRNA for
selenocysteine is repressed in many of the proliferating cells
and in cancers in particular, in line with a known anticancerous
effect of selenocysteine (Almondes et al., 2010).
Next we usedprincipal-component analysis (PCA) to represent
the similarity between the tRNA pools at all time points in these
model systems. In this representation, each time point in each
treatment is represented by a dot, pairs of samples with similar
tRNA dynamics are adjacent on the plane, and arrows represent
the direction of time in each treatment. Interestingly, we obtained
a continuous spectrum, on one side of which are the tRNA pools
of the differentiated, senescent, and arrested cells, and at the
other extreme are the proliferating, starvation-released cells
(Figure 1E). Following the tRNA pools along each process, we
observed a gradual smooth transition to one of the two extremes:
cells induced for differentiation or senescence gradually change
their tRNA pool oppositely from proliferating cells.
Importantly, the similarity of the tRNA pools among the prolif-
erative samples, and conversely among the differentiated/ar-
rested samples, does not reflect a global transcriptome-wide
pattern. When we instead clustered the various samples based
on mRNA expression changes, we found a markedly different
picture in which samples are clustered together according to
their tissue origin rather than by proliferation/differentiation sta-
tus (Figure S1F). These results indicate that whereas the mRNA
expression captures a tissue identity signature, the tRNA pool
mainly reflects information about proliferative status of the cell.
This conclusion also holds truewhen examining the tRNApools
using a completely different experimental platform, i.e., the
epigenetic status of tRNA genes in the genome. We analyzed
the ENCODE data set (Bernstein et al., 2012) and checked the
vicinity of tRNA genes with respect to histone modifications
ell 158, 1281–1292, September 11, 2014 ª2014 Elsevier Inc. 1283
(legend on next page)
1284 Cell 158, 1281–1292, September 11, 2014 ª2014 Elsevier Inc.
associated with active or repressed transcription, which were
shown to function similarly at Pol III genes and Pol II transcrip-
tional units (Barski et al., 2010; Oler et al., 2010). We found a
similar trend as observed in the arrays: the transcriptional activity
status in the vicinity of the tRNA pool is similar in differentiated
cells, however it takes a distinct form in cancer cells (Figure S1G).
A Distinct Codon-Usage Signature of Proliferation-RelatedGenes andGenes Involved inDifferentiation andMulticellularityIf each tRNA was equally required for translation of genes
involved in proliferation and differentiation, then any increase
or decrease in the expression of a given tRNA would have
affected the translation of all genes in a similar direction. Under
this assumption, it would be unclear why certain tRNAs increase,
whereas others decrease in expression during proliferation or
differentiation. We thus hypothesized that the differential regula-
tion of the tRNAs might be rooted in a distinction in codon usage
of genes involved in proliferative or differentiation processes. To
examine this possibility, we analyzed codon usage in genes
belonging to various functional categories. We first focused on
two functional gene sets of the Gene Ontology (GO) classifica-
tion (Ashburner et al., 2000), namely the ‘‘M phase of mitotic
cell cycle’’ (92 genes) and ‘‘pattern specification’’ (82 genes),
i.e., genes involved in differentiation.We computed codon usage
for each of the 61 codons for the genes in each of the two cate-
gories (correcting for potential amino acid usage biases, see Fig-
ure 2A legend) and observed a remarkable dichotomy: for most
amino acids, there exists at least one codon that is preferentially
used in the cell-cycle genes and at least one distinct codon that
is preferentially used in the pattern-specification genes (Fig-
ure 2A and Table S1). Interestingly, the cell-cycle-preferred
codons tend to have an A or a T nucleotide at the 3rd codon po-
sition, whereas the pattern-specification preferred codons have
a tendency to end with G or C nucleotides (Figure S2A). Although
it is generally the case that cell-cycle-related genes are more AT
rich, it is particularly their 3rd nucleotide codon position that is
more AT rich (Figure S2A). Notwithstanding, it is well known
that promoters of cell-autonomous/housekeeping genes reside
in CpG islands (Saxonov et al., 2006), thus the high A/T content
of the cell-cycle genes in the 3rd codon position appears to be a
Figure 1. Expression Changes in the tRNA Pool in Proliferation, Differe
(A) A sample of correlation plots depicting similarity between tRNA abundance m
extent of the transcription activation-associated H3K27ac modification as measu
with same anticodon are grouped; a total of 206 tRNA genes, which are covered
(B) An expression matrix of the tRNAs in DLBCL and normal B cells. Each horizon
bottom 10 lines are normal B cells; each column represents a tRNA type, grouped
and the color code depicts (log2) fold-change of each tRNA type (averaged over a
samples.
(C) Hierarchical clustering of all sample types based on changes in tRNA expr
belonging to the same type, where the numbers in parentheses denote the numb
correlation between the tRNA expression profiles of two different sample types.
correlation among all pairs of samples within a given type of samples.
(D) A sample of correlation plots depicting similarity between changes in the tRNA
Each dot represents a tRNA type.
(E) A PCA in which biological samples are represented in the space of tRNA po
replicates. Neighboring dots represent pairs of samples in which the expression o
red arrows depict the change in the tRNA pool during release from serum starvatio
of stem cells (time points are marked by blue triangles), and the second upon in
C
distinct phenomenon. Interestingly, whereas the cell-autono-
mous functions are characterized by high CpG content in their
promoters, multicellularity functions that are not related to devel-
opment and patterning are characterized by low CpG promoter
content (Figure S2B).
Examining all major GO categories in human, including all
‘‘Biological Process’’ categories that include at least 40 genes,
we calculated for each the average codon usage of its constitu-
ent genes. We used PCA to visualize similarity in codon usage
between all gene sets (Figure 2B). In this display, two gene sets
are close if they have a similar codon-usage pattern and are far
apart otherwise. The above-mentioned sets ‘‘M phase of mitotic
cell cycle’’ and ‘‘pattern specification’’ are at the two ‘‘poles’’ of
the projection, thus representing the two most distinct gene
sets in terms of codon usage. Interestingly, the first three PCs
alone span >70% of the variance of the data. A striking result
was that especially along the first PC, there is a clear separation
between gene categories related to development and multicellu-
larity processes on one side and genes related to cellular pro-
liferation and other cell-autonomous processes on the other
(Figure 2B). Particularly, at one end of the first PC axis, we found
genes involved in processes such as cell cycle, DNA replication
and cell division, transcription, translation, mRNAmetabolic pro-
cess, mRNA splicing, DNA repair, protein folding, and nucleo-
some assembly. In contrast, on the other side of the plane, we
found functionalities related to differentiation and developmental
patterning in addition to other multicellularity processes such as
cell adhesion, cell-junction assembly, toll-like receptor signaling,
and extracellular matrix. We also examined the GO category
‘‘negative regulation of cell cycle’’ and found these genes to
reside away from their respected regulated cell-cycle genes tar-
gets. Likewise, angiogenesis genes reside closer to the ‘‘multi-
cellular’’ side, yet ‘‘negative regulators of angiogenesis’’ have a
more proliferation-like codon usage. These findings show how
network properties, such as sign of a regulatory effect, can be
encoded in the codon selection of genes.
Interestingly, whereas the first PC separates GO functional
gene sets according to the cell-autonomous versus multicellu-
larity functionalities, the second PC separates, although much
more modestly, the development and embryonic patterning
genes from the rest of themulticellularity functionalities (including
ntiation, and Senescence
easurements (log scale) obtained with the microarrays on one hand and the
red in ENCODE on the other. Each dot represents a tRNA type (all tRNA genes
both on the array and in ENCODE, are represented).
tal line represents a biological sample: upper 68 lines are DLBCL samples, and
by anticodon. The expression values in all 10 normal samples were averaged,
ll iso-acceptor groups) in each sample relative to the average of the 10 normal
ession profiles. Each column and row represents the average of all samples
er of samples belonging to that type. Off-diagonal entries denote the Pearson
The main diagonal, from top right to bottom left, depicts the median Pearson
pool among different types of proliferative and differentiated/arrested samples.
ol expression changes; all points represent an average over three biological
f the tRNA pool changes similarly. Three time-course treatments are shown: the
n, one of the blue arrows represents the change in the pool during differentiation
duction of senescence (time points are marked by blue circles).
ell 158, 1281–1292, September 11, 2014 ª2014 Elsevier Inc. 1285
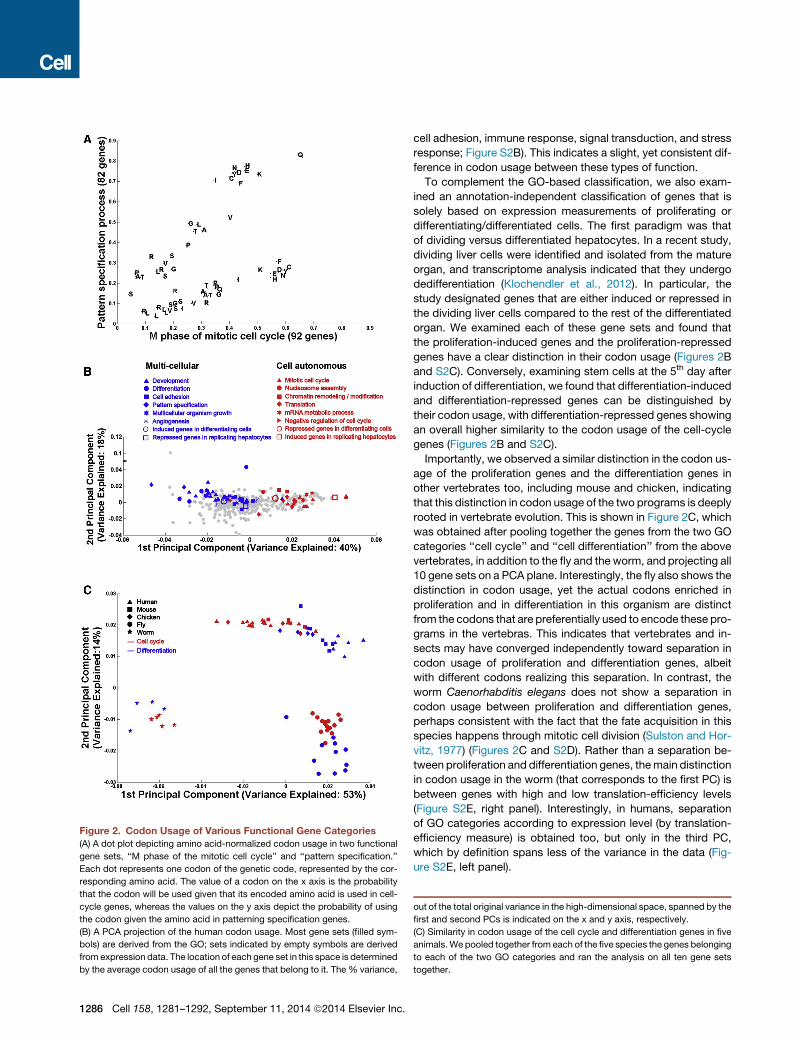
Figure 2. Codon Usage of Various Functional Gene Categories
(A) A dot plot depicting amino acid-normalized codon usage in two functional
gene sets, ‘‘M phase of the mitotic cell cycle’’ and ‘‘pattern specification.’’
Each dot represents one codon of the genetic code, represented by the cor-
responding amino acid. The value of a codon on the x axis is the probability
that the codon will be used given that its encoded amino acid is used in cell-
cycle genes, whereas the values on the y axis depict the probability of using
the codon given the amino acid in patterning specification genes.
(B) A PCA projection of the human codon usage. Most gene sets (filled sym-
bols) are derived from the GO; sets indicated by empty symbols are derived
from expression data. The location of each gene set in this space is determined
by the average codon usage of all the genes that belong to it. The % variance,
1286 Cell 158, 1281–1292, September 11, 2014 ª2014 Elsevier Inc.
cell adhesion, immune response, signal transduction, and stress
response; Figure S2B). This indicates a slight, yet consistent dif-
ference in codon usage between these types of function.
To complement the GO-based classification, we also exam-
ined an annotation-independent classification of genes that is
solely based on expression measurements of proliferating or
differentiating/differentiated cells. The first paradigm was that
of dividing versus differentiated hepatocytes. In a recent study,
dividing liver cells were identified and isolated from the mature
organ, and transcriptome analysis indicated that they undergo
dedifferentiation (Klochendler et al., 2012). In particular, the
study designated genes that are either induced or repressed in
the dividing liver cells compared to the rest of the differentiated
organ. We examined each of these gene sets and found that
the proliferation-induced genes and the proliferation-repressed
genes have a clear distinction in their codon usage (Figures 2B
and S2C). Conversely, examining stem cells at the 5th day after
induction of differentiation, we found that differentiation-induced
and differentiation-repressed genes can be distinguished by
their codon usage, with differentiation-repressed genes showing
an overall higher similarity to the codon usage of the cell-cycle
genes (Figures 2B and S2C).
Importantly, we observed a similar distinction in the codon us-
age of the proliferation genes and the differentiation genes in
other vertebrates too, including mouse and chicken, indicating
that this distinction in codon usage of the two programs is deeply
rooted in vertebrate evolution. This is shown in Figure 2C, which
was obtained after pooling together the genes from the two GO
categories ‘‘cell cycle’’ and ‘‘cell differentiation’’ from the above
vertebrates, in addition to the fly and the worm, and projecting all
10 gene sets on a PCA plane. Interestingly, the fly also shows the
distinction in codon usage, yet the actual codons enriched in
proliferation and in differentiation in this organism are distinct
from the codons that are preferentially used to encode these pro-
grams in the vertebras. This indicates that vertebrates and in-
sects may have converged independently toward separation in
codon usage of proliferation and differentiation genes, albeit
with different codons realizing this separation. In contrast, the
worm Caenorhabditis elegans does not show a separation in
codon usage between proliferation and differentiation genes,
perhaps consistent with the fact that the fate acquisition in this
species happens through mitotic cell division (Sulston and Hor-
vitz, 1977) (Figures 2C and S2D). Rather than a separation be-
tween proliferation and differentiation genes, themain distinction
in codon usage in the worm (that corresponds to the first PC) is
between genes with high and low translation-efficiency levels
(Figure S2E, right panel). Interestingly, in humans, separation
of GO categories according to expression level (by translation-
efficiency measure) is obtained too, but only in the third PC,
which by definition spans less of the variance in the data (Fig-
ure S2E, left panel).
out of the total original variance in the high-dimensional space, spanned by the
first and second PCs is indicated on the x and y axis, respectively.
(C) Similarity in codon usage of the cell cycle and differentiation genes in five
animals.We pooled together from each of the five species the genes belonging
to each of the two GO categories and ran the analysis on all ten gene sets
together.
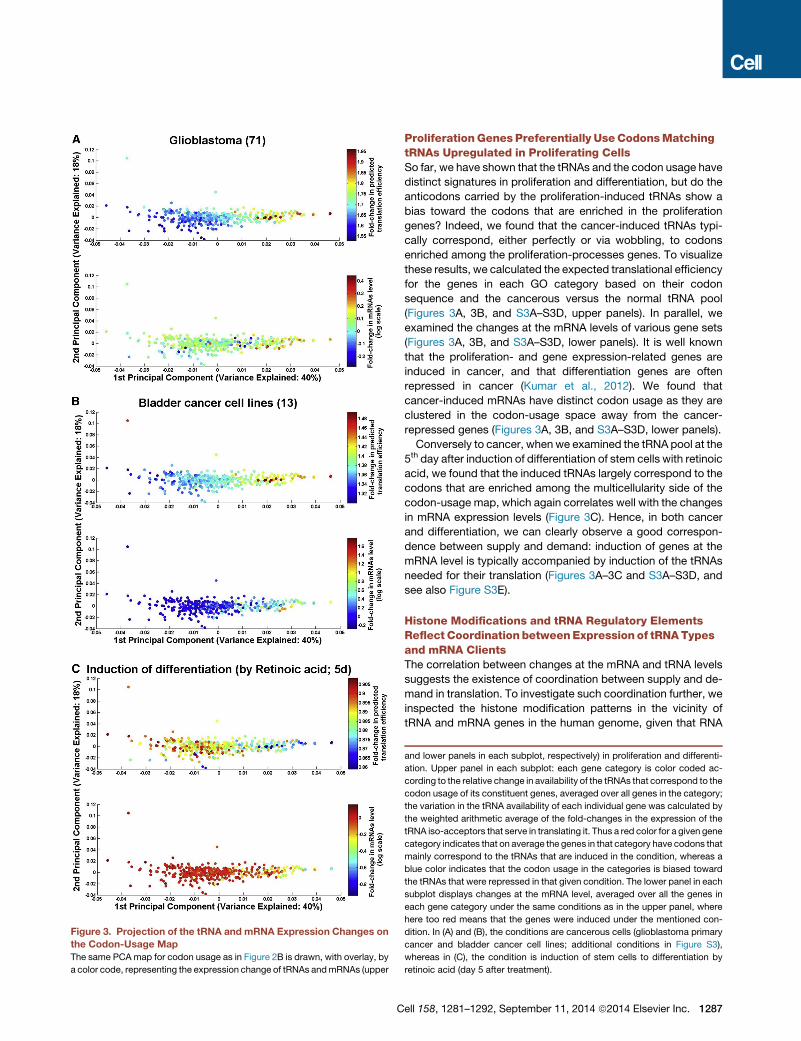
Figure 3. Projection of the tRNA and mRNA Expression Changes on
the Codon-Usage Map
The same PCA map for codon usage as in Figure 2B is drawn, with overlay, by
a color code, representing the expression change of tRNAs andmRNAs (upper
C
ProliferationGenes Preferentially UseCodonsMatchingtRNAs Upregulated in Proliferating CellsSo far, we have shown that the tRNAs and the codon usage have
distinct signatures in proliferation and differentiation, but do the
anticodons carried by the proliferation-induced tRNAs show a
bias toward the codons that are enriched in the proliferation
genes? Indeed, we found that the cancer-induced tRNAs typi-
cally correspond, either perfectly or via wobbling, to codons
enriched among the proliferation-processes genes. To visualize
these results, we calculated the expected translational efficiency
for the genes in each GO category based on their codon
sequence and the cancerous versus the normal tRNA pool
(Figures 3A, 3B, and S3A–S3D, upper panels). In parallel, we
examined the changes at the mRNA levels of various gene sets
(Figures 3A, 3B, and S3A–S3D, lower panels). It is well known
that the proliferation- and gene expression-related genes are
induced in cancer, and that differentiation genes are often
repressed in cancer (Kumar et al., 2012). We found that
cancer-induced mRNAs have distinct codon usage as they are
clustered in the codon-usage space away from the cancer-
repressed genes (Figures 3A, 3B, and S3A–S3D, lower panels).
Conversely to cancer, when we examined the tRNA pool at the
5th day after induction of differentiation of stem cells with retinoic
acid, we found that the induced tRNAs largely correspond to the
codons that are enriched among the multicellularity side of the
codon-usage map, which again correlates well with the changes
in mRNA expression levels (Figure 3C). Hence, in both cancer
and differentiation, we can clearly observe a good correspon-
dence between supply and demand: induction of genes at the
mRNA level is typically accompanied by induction of the tRNAs
needed for their translation (Figures 3A–3C and S3A–S3D, and
see also Figure S3E).
Histone Modifications and tRNA Regulatory ElementsReflect Coordination betweenExpression of tRNATypesand mRNA ClientsThe correlation between changes at the mRNA and tRNA levels
suggests the existence of coordination between supply and de-
mand in translation. To investigate such coordination further, we
inspected the histone modification patterns in the vicinity of
tRNA and mRNA genes in the human genome, given that RNA
and lower panels in each subplot, respectively) in proliferation and differenti-
ation. Upper panel in each subplot: each gene category is color coded ac-
cording to the relative change in availability of the tRNAs that correspond to the
codon usage of its constituent genes, averaged over all genes in the category;
the variation in the tRNA availability of each individual gene was calculated by
the weighted arithmetic average of the fold-changes in the expression of the
tRNA iso-acceptors that serve in translating it. Thus a red color for a given gene
category indicates that on average the genes in that category have codons that
mainly correspond to the tRNAs that are induced in the condition, whereas a
blue color indicates that the codon usage in the categories is biased toward
the tRNAs that were repressed in that given condition. The lower panel in each
subplot displays changes at the mRNA level, averaged over all the genes in
each gene category under the same conditions as in the upper panel, where
here too red means that the genes were induced under the mentioned con-
dition. In (A) and (B), the conditions are cancerous cells (glioblastoma primary
cancer and bladder cancer cell lines; additional conditions in Figure S3),
whereas in (C), the condition is induction of stem cells to differentiation by
retinoic acid (day 5 after treatment).
ell 158, 1281–1292, September 11, 2014 ª2014 Elsevier Inc. 1287

Figure 4. Histone Modification Coordination between tRNA Supply
and Demand
(A) Sequence logo of the box A and box B in the promoters of all tRNA genes, in
the tRNAs that are neither proliferation nor differentiation associated, in the
differentiation tRNAs, and in the proliferation tRNAs. The positions that are
most distinctive between the proliferation and differentiation tRNAs’ versions
of the motifs are highlighted.
1288 Cell 158, 1281–1292, September 11, 2014 ª2014 Elsevier Inc.
Pol III and RNA Pol II share similar modifications associated with
either transcriptional activation or repression (Barski et al., 2010;
Oler et al., 2010).
We first found that usage of a codon tends to correlate with the
extent of histone modification around tRNA genes with the
corresponding anticodon (Figure S4A illustrating H3K27ac).
Focusing on the ‘‘cell cycle’’ and ‘‘cell differentiation’’ gene cat-
egories, we defined two sets of tRNAs: one holding tRNAs
corresponding to codons over-represented among the cell-cy-
cle genes and another with tRNAs corresponding to codons
over-represented among the cell-differentiation genes (listed in
Table S2). We called the two sets ‘‘proliferation tRNAs’’ and ‘‘dif-
ferentiation tRNAs,’’ respectively. To examine whether this clas-
sification corresponds to the transcriptional regulation of the
tRNA genes, we analyzed their promoter sequences and epige-
netic histone modifications. The promoter in tRNA genes is inter-
nal and consists of two known motifs, the ‘‘box A’’ and the ‘‘box
B.’’ To search for sequence differences, we ran a motif-finding
algorithm (MEME, see Experimental Procedures) separately on
the 121 proliferation tRNA genes and on the 118 differentiation
tRNA genes. Remarkably, we found that especially the box B
significantly differs between tRNAs involved in proliferation or
differentiation, indicating distinct and concerted regulation of
their transcription (Figures 4A and S4B).
We next used the ENCODE data to inspect the chromatin state
around the upstream and downstream regions of the tRNA genes
from the two sets and at the flanking regions of the correspond-
ing protein-coding genes from each of the ‘‘cell cycle’’ and ‘‘cell
differentiation’’ GO categories. Figures 4B and S4C show the
tRNA and mRNA level analysis, respectively. In both figures,
we depict the density of the selected activation-associated
modification (H3K27ac) and the repressing modification
(H3K27me3) in two cancer cell lines and three differentiated
normal cell lines (Figures 4B and S4C; see also Figure S4D for
additional chromatin modifications and Figures S4E and S4F
for statistical significance analysis). We made several observa-
tions: (1) when examining the activation-associatedmodification,
the upstream regions of the proliferation tRNAsweremore heavi-
ly modified than their differentiation counterparts, predominantly
in the cancer cells, (2) the repressing modification, H3K27me3,
shows the opposite behavior, consistent with lower transcription
rate of the differentiation tRNAs in all samples, (3) in the
(B) Density profiles of H3K27ac and H3K27me3 modifications in the vicinity of
tRNA genes in either proliferating (cancerous) or differentiated mature cells. All
tRNA genes are aligned according to their TSSs, and the regions of 500 bp
upstream and downstream of the TSS are shown on the x axis. The y axis
shows the averaged density of these two modifications as a function of dis-
tance from the TSS. Shown are the signals (y axis) of the following gene sets:
tRNAs that are not occupied by RNA Pol III (colored in black); occupied ‘‘pro-
proliferation’’ tRNAs (75 genes, colored in red); and occupied ‘‘pro-differenti-
ation’’ tRNAs (81 genes, colored in blue). Each gray line is an average of a
random set of 81 tRNA genes, sampled from 299 occupied human tRNA
genes. p value analysis on the difference between the proliferation and dif-
ferentiation tRNAs is in Figure S4E. Occupancy data were retrieved from Oler
et al. (2010).
(C) The codon-usage PCAmap as in Figures 2 and 3, colored here according to
the density of the activating modification H3K27Ac in the vicinity of tRNA
genes (upper panel, see details in the Experimental Procedures section) or in
vicinity of mRNA-coding genes.
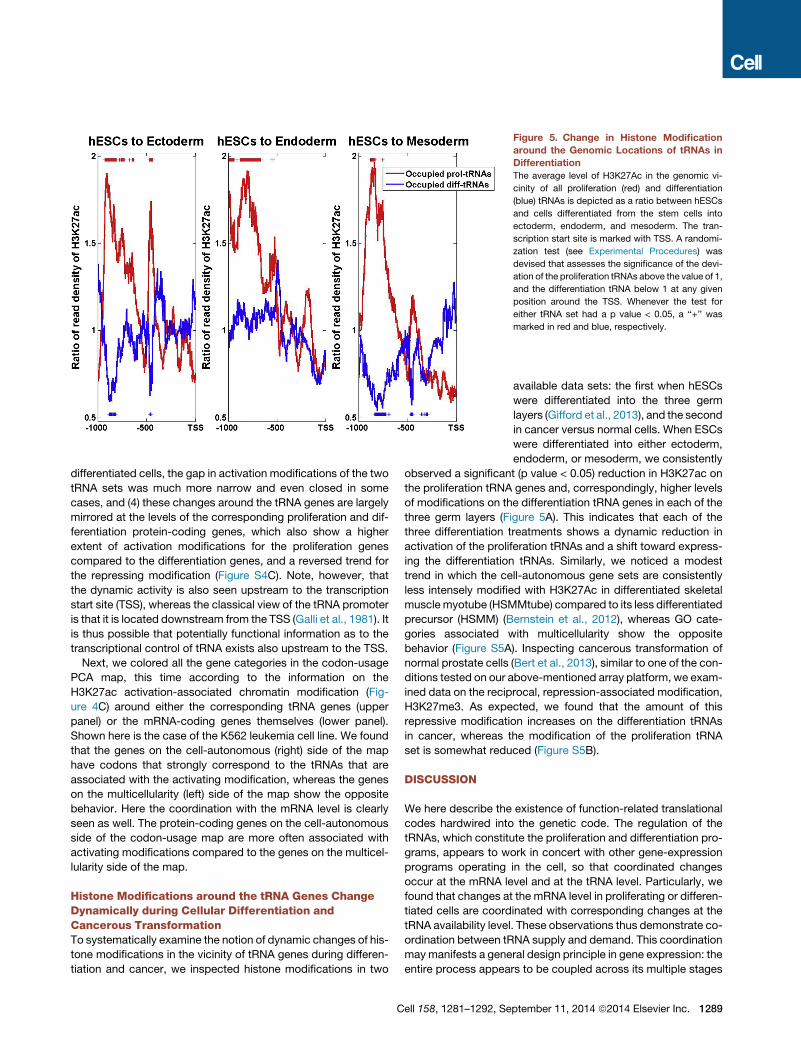
Figure 5. Change in Histone Modification
around the Genomic Locations of tRNAs in
Differentiation
The average level of H3K27Ac in the genomic vi-
cinity of all proliferation (red) and differentiation
(blue) tRNAs is depicted as a ratio between hESCs
and cells differentiated from the stem cells into
ectoderm, endoderm, and mesoderm. The tran-
scription start site is marked with TSS. A randomi-
zation test (see Experimental Procedures) was
devised that assesses the significance of the devi-
ation of the proliferation tRNAs above the value of 1,
and the differentiation tRNA below 1 at any given
position around the TSS. Whenever the test for
either tRNA set had a p value < 0.05, a ‘‘+’’ was
marked in red and blue, respectively.
differentiated cells, the gap in activation modifications of the two
tRNA sets was much more narrow and even closed in some
cases, and (4) these changes around the tRNA genes are largely
mirrored at the levels of the corresponding proliferation and dif-
ferentiation protein-coding genes, which also show a higher
extent of activation modifications for the proliferation genes
compared to the differentiation genes, and a reversed trend for
the repressing modification (Figure S4C). Note, however, that
the dynamic activity is also seen upstream to the transcription
start site (TSS), whereas the classical view of the tRNA promoter
is that it is located downstream from the TSS (Galli et al., 1981). It
is thus possible that potentially functional information as to the
transcriptional control of tRNA exists also upstream to the TSS.
Next, we colored all the gene categories in the codon-usage
PCA map, this time according to the information on the
H3K27ac activation-associated chromatin modification (Fig-
ure 4C) around either the corresponding tRNA genes (upper
panel) or the mRNA-coding genes themselves (lower panel).
Shown here is the case of the K562 leukemia cell line. We found
that the genes on the cell-autonomous (right) side of the map
have codons that strongly correspond to the tRNAs that are
associated with the activating modification, whereas the genes
on the multicellularity (left) side of the map show the opposite
behavior. Here the coordination with the mRNA level is clearly
seen as well. The protein-coding genes on the cell-autonomous
side of the codon-usage map are more often associated with
activating modifications compared to the genes on the multicel-
lularity side of the map.
Histone Modifications around the tRNA Genes ChangeDynamically during Cellular Differentiation andCancerous TransformationTo systematically examine the notion of dynamic changes of his-
tone modifications in the vicinity of tRNA genes during differen-
tiation and cancer, we inspected histone modifications in two
Cell 158, 1281–1292, Se
available data sets: the first when hESCs
were differentiated into the three germ
layers (Gifford et al., 2013), and the second
in cancer versus normal cells. When ESCs
were differentiated into either ectoderm,
endoderm, or mesoderm, we consistently
observed a significant (p value < 0.05) reduction in H3K27ac on
the proliferation tRNA genes and, correspondingly, higher levels
of modifications on the differentiation tRNA genes in each of the
three germ layers (Figure 5A). This indicates that each of the
three differentiation treatments shows a dynamic reduction in
activation of the proliferation tRNAs and a shift toward express-
ing the differentiation tRNAs. Similarly, we noticed a modest
trend in which the cell-autonomous gene sets are consistently
less intensely modified with H3K27Ac in differentiated skeletal
musclemyotube (HSMMtube) compared to its less differentiated
precursor (HSMM) (Bernstein et al., 2012), whereas GO cate-
gories associated with multicellularity show the opposite
behavior (Figure S5A). Inspecting cancerous transformation of
normal prostate cells (Bert et al., 2013), similar to one of the con-
ditions tested on our above-mentioned array platform, we exam-
ined data on the reciprocal, repression-associated modification,
H3K27me3. As expected, we found that the amount of this
repressive modification increases on the differentiation tRNAs
in cancer, whereas the modification of the proliferation tRNA
set is somewhat reduced (Figure S5B).
DISCUSSION
We here describe the existence of function-related translational
codes hardwired into the genetic code. The regulation of the
tRNAs, which constitute the proliferation and differentiation pro-
grams, appears to work in concert with other gene-expression
programs operating in the cell, so that coordinated changes
occur at the mRNA level and at the tRNA level. Particularly, we
found that changes at the mRNA level in proliferating or differen-
tiated cells are coordinated with corresponding changes at the
tRNA availability level. These observations thus demonstrate co-
ordination between tRNA supply and demand. This coordination
maymanifests a general design principle in gene expression: the
entire process appears to be coupled across its multiple stages
ptember 11, 2014 ª2014 Elsevier Inc. 1289

(Dahan et al., 2011; Lotan et al., 2005, 2007). The tRNA availabil-
ity is known to be regulated at various levels including transcrip-
tion, posttranscriptional processing, amino acid loading, and
degradation. Although each level could make important contri-
butions, here we have used comprehensive transcriptomic and
epigenomic mapping to suggest a substantial role for the tran-
scriptional level.
Why do cells coordinate supply and demand in translation?
The observed coordination might be essential as a means to
ensure high expression of certain genes, i.e., genes that are high-
ly expressed at the mRNA level at a certain cellular state might
also be translated more efficiently due to their good adaptation
to the tRNA pool at that state. An alternative consideration
does not implicate the matching between supply and demand
in expression of particular genes but would rather suggest that
proper coordination between supply and demand may allow
optimization of the overall translation-resource allocation in the
cell. According to this notion, when supply and demand are
balanced, ribosomes are expected to flow with little congestion,
and hence production costs are minimized.
Some studies found no evidence for translational selection in
human (dos Reis et al., 2004; Kanaya et al., 2001), suggesting
that synonymous codons in human are not selected to maximize
translation efficiency (Lercher et al., 2003). Conversely, other
studies do indicate weak, yet significant, translational selection
in human, according to estimates of codon-usage adaptation
to the global tRNA pool (Comeron, 2004; Lavner and Kotlar,
2005), and in vertebrates more generally (Doherty and McIner-
ney, 2013). The conservation of the dual translational programs
among the vertebrates examined here shows that this is not a
human-specific trait but rather a much more ancient one that
could have been selected for over prolonged evolutionary pe-
riods and large population sizes.
Why did the translation system evolve to operate with two
distinct modes in proliferation and differentiation? We speculate
that the separation into a dual program can ‘‘lock’’ the differenti-
ated cells in a stable state that prevents undesired proliferation
and transformation. According to thismodel, if, due to noisy tran-
scriptional leakage, a given pro-proliferation gene was abnor-
mally expressed in the cell, it would not be translated efficiently
because the tRNA pool is relatively devoid of tRNAs that corre-
spond to its codon usage. In this respect, the presence of distinct
translational programs may serve to reduce aberrant expression
resulting from transcriptional or posttranscriptional noise and
ensure stable cell-fate decisions during processes such as differ-
entiation. As such, the existence of a dual translational program
may serve to ‘‘canalize’’ cellular processes (Waddington, 1942)
and might thus initially serve as a cancer-protective mechanism.
However, such a translation program may also act as a double-
edged sword because, if cancer hijacks this program by selec-
tively upregulating proliferative tRNAs, it will have the potential
to boost the translation of pro-cancerous transcripts.
EXPERIMENTAL PROCEDURES
Sample Preparation
This study comprised human tissue (cancer and normal) samples from
patients and healthy donors as well as a range of cell-based model systems
1290 Cell 158, 1281–1292, September 11, 2014 ª2014 Elsevier Inc.
depicted in Table 1. All the information about sample collection and prepara-
tion is available in Extended Experimental Procedures and Table S4.
Data Sources
Expression Profiling of Human tRNAs and mRNAs in Different
Cancerous Cell Types and Physiological Conditions
Expression profiles were measured using custom-made microarrays (Nimble-
gen). The microarrays contain probes for 6,856 protein-coding transcripts and
26,910 ncRNAs including 294 probes corresponding to 206 tRNA genes. The
various cell types fromwhich RNAwas hybridized onto the array are detailed in
Table 1. Our microarray platform was recently shown to be useful for charac-
terization of known and also putative human transcripts and was shown to
largely agree with RNA sequencing data, especially among genes that are
as highly expressed (Nielsen et al., 2014). Detailed information about the array
design appears in Supplemental File S2.
tRNA Gene Copy Number
The tRNA gene copy numbers of all analyzed species were downloaded from
the Genomic tRNA Database (http://lowelab.ucsc.edu/GtRNAdb/) (Lowe and
Eddy, 1997).
Coding Sequences
The coding sequences of H. sapiens andM. musculus were downloaded from
the Consensus CDS (CCDS) project (ftp://ftp.ncbi.nlm.nih.gov/pub/CCDS/).
The coding sequences of C. elegans were downloaded from Ensembl ftp
site (http://www.ensembl.org) (WS210, release 59). The coding sequences
of D. melanogaster were downloaded from FlyBase (http://flybase.org/).
Classification of Gene Categories
Defined gene categories by biological process were downloaded from the
Gene Ontology project (http://www.geneontology.org/); to avoid too-small
gene sets, we only considered those with at least 40 genes.
Chromatin Modification
Fragment densities for 25 bp bins along the genome and discrete intervals
of ChIP-seq fragment enrichment were downloaded from the Broad Histone
(wgEncodeBroadHistone) Track at UCSC website (http://genome.ucsc.
edu/).
Calculation of the Variation in the Human tRNA Pool
For each tRNA type (i.e., anticodon) in a given sample, we summed the expres-
sion of its corresponding individual genes. Then we divided the expression of
each tRNA type by its averaged expression in either normal cells of the same
tissue (for primary tumors and cancerous cell lines) or the corresponding refer-
ence condition (e.g., for cells released from starvation, the reference was
starved cells; for cells induced to proliferate by overexpresion of an oncogene,
the reference was cells transduced with an empty vector, etc.) (see Table 1 for
a detailed description). Finally, for a given cell type, we averaged the fold-
changes in the tRNA expression across all of its corresponding samples,
e.g., over 68 samples for DLBCL (see in Table 1).
Estimating Translational Efficiency in Terms of tRNA Activation
Index
We generated a new measure of translational efficiency (implemented in Fig-
ure 4C), termed henceforth as ‘‘tRNA activation index’’ (tACI). Our measure
is calculated similarly to the tAI measure of translation efficiency (dos Reis
et al., 2004), with one major change—we determine tRNA availability in terms
of chromatin modification enrichment rather than gene copy numbers. As
such, the new measure can be computed for every condition in which chro-
matin data exist.
Employing the aforementioned discrete intervals of ChIP-seq fragment
enrichment, we set the activation score of each individual tRNA gene to be
the average enrichment of the activating H3K27ac modification overlapping
the 1,000 bp centered around its TSSs. Individual tRNA genes, for which no
statistically significant signal enrichment was found, were classified as
‘‘not activated.’’ Next, we defined the activation score of each tRNA type
(anticodon) by the sum of the activation scores of its gene copies. Then, we
determined the translation efficiency of an individual codon by the extent of
activation of the tRNAs that serve in translating it, incorporating both the fully
matched tRNA as well as tRNAs that contribute to translation through wobble
rules (Crick, 1966).

Formally, the translation efficiency score for the i–th codon is as follows:
Wi =Xnij = 1
ð1� sijÞtCMEij ;
where n is the number of tRNA isoacceptors that recognize the i-th codon,
tCMEij denotes the sum of the chromatin modification enrichment (CME) of
the activated copies of the j-th tRNA that recognizes the i-th codon, and sijcorrespond to the wobble interaction, or selective constraint on the effi-
ciency of the pairing between codon i and anticodon j, as was determined
and implemented for the original tAI measure. As done in the original tAI
formalism by dos Reis et al., the scores of the 61 codons are further
divided by the maximal score, and finally, the tACI value of a gene with L
codons is then simply calculated as the geometric mean of the wi’s of its
codons:
tACIðgÞ=ffiffiffiffiffiffiffiffiffiffiffiffiffiYLc= 1
wc
L
vuut
Motif Finding
The box A and B motifs, the promoter motifs within tRNA genes, were pre-
dicted using the motif discovery algorithm MEME (v4.6.1; Bailey and El-
kan, 1994) with the following parameters: -dna -mod zoops -nmotifs 2
-minw 15 -maxw 15. Box A and B motifs were learned separately for all
(512), unclassified (273), differentiation (118), and proliferation (120) tRNA
genes. Differences in box A and B motifs between tRNA sets were
assessed using a Pearson correlation-based motif similarity score (Pietro-
kovski, 1996). The score was maximized over all ungapped motif align-
ments and normalized by the average motif length. Differences between
motifs were assessed using a permutation test in which the observed
motif similarity score was compared against a set of 1,000 permutation-
based motif similarity scores. Permutation samples were obtained by
randomly sampling tRNA genes from the whole pool of tRNA genes while
considering the observed tRNA sample set sizes. Motifs were considered
to be significantly different if the observed motif similarity score was within
1% of the lowest permutation-based similarity scores (i.e., one-tailed p
value of 0.01).
Assessing the Significance of Dynamic Changes of Histone
Modifications in tRNA Genes’ Vicinity during Proliferation and
Differentiation
For each experiment, we first normalized the read density of either the
H3K27ac (Figure 5) or H3K27me3 (Figure S5B) histone modification, to
achieve overlapping distribution of either the proliferating or differentiating
cell types and their precursor. For each cell type of a given experiment,
we then sampled 500 times two random tRNA gene sets, where one of
the sets had a set size equal to that of the proliferation tRNAs, and the other
of the differentiation tRNAs. Next, we averaged the histone modification
density for the members of each random set and computed either the ratio
between the averages of each cell type to that of its precursor or the ratio
between the averages of the precursor and its derived cell types at each po-
sition along the sequence coordinates. p values were calculated at each
sequence position as (1) the fraction out of 500 random samples that
showed higher ratios compared to the examined ratio—for either the ratio
seen between the proliferation tRNAs in hESC compared to ectoderm/
mesoderm/endoderm or the differentiation tRNAs in prostate cancer
compared to normal cells; (2) the fraction out of 500 random samples that
showed lower ratios compared to the examined ratio—for either the ratio
seen between the differentiation tRNAs in hESC compared to ectoderm/
mesoderm/endoderm or the proliferation tRNAs in prostate cancer
compared to normal cells.
SUPPLEMENTAL INFORMATION
Supplemental Information includes Extended Experimental Procedures, five
figures, and four tables and can be found with this article online at http://dx.
doi.org/10.1016/j.cell.2014.08.011.
C
AUTHOR CONTRIBUTIONS
H.G., D.T., A.H.L., and Y.P. conceived the project, designed the work,
analyzed all data, and wrote the paper. H.G. did the majority of the computa-
tional work; D.T. did the majority of the experimental work.
ACKNOWLEDGMENTS
Work in the authors’ laboratory is supported by a European Research Council
(ERC) grant (Y.P.) and by the Danish National Advanced Technology Founda-
tion, the Danish Council for Strategic Research, the Danish Council for Inde-
pendent Research, the Novo Nordisk Foundation, the Lundbeck Foundation,
and the Danish Cancer Society (A.H.L.). Y.P. is an incumbent of the Ben-
May Professorial Chair. S.M.K. was supported by a postdoctoral fellowship
from the Netherlands Organisation for scientific research (NWO). The Centre
for Epigenetics is supported by the Danish National Research Foundation
(DNRF82). We thank Simon Kasif and Erez Dekel for stimulating discussions.
Received: December 25, 2013
Revised: May 13, 2014
Accepted: August 8, 2014
Published: September 11, 2014
REFERENCES
Almondes, K.G., Leal, G.V., Cozzolino, S.M., Philippi, S.T., and Rondo, P.H.
(2010). The role of selenoproteins in cancer. Rev. Assoc. Med. Bras. 56,
484–488.
Ashburner, M., Ball, C.A., Blake, J.A., Botstein, D., Butler, H., Cherry, J.M., Da-
vis, A.P., Dolinski, K., Dwight, S.S., Eppig, J.T., et al.; The Gene Ontology Con-
sortium (2000). Gene ontology: tool for the unification of biology. Nat. Genet.
25, 25–29.
Bailey, T.L., and Elkan, C. (1994). Fitting a mixture model by expectation maxi-
mization to discover motifs in biopolymers. Proc. Int. Conf. Intell. Syst. Mol.
Biol. 2, 28–36.
Barski, A., Chepelev, I., Liko, D., Cuddapah, S., Fleming, A.B., Birch, J., Cui, K.,
White, R.J., and Zhao, K. (2010). Pol II and its associated epigenetic marks are
present at Pol III-transcribed noncoding RNA genes. Nat. Struct. Mol. Biol. 17,
629–634.
Bernstein, B.E., Birney, E., Dunham, I., Green, E.D., Gunter, C., and Snyder,
M.; ENCODE Project Consortium (2012). An integrated encyclopedia of DNA
elements in the human genome. Nature 489, 57–74.
Bert, S.A., Robinson, M.D., Strbenac, D., Statham, A.L., Song, J.Z., Hulf, T.,
Sutherland, R.L., Coolen, M.W., Stirzaker, C., and Clark, S.J. (2013). Regional
activation of the cancer genome by long-range epigenetic remodeling. Cancer
Cell 23, 9–22.
Comeron, J.M. (2004). Selective andmutational patterns associated with gene
expression in humans: influences on synonymous composition and intron
presence. Genetics 167, 1293–1304.
Crick, F.H. (1966). Codon—anticodon pairing: the wobble hypothesis. J. Mol.
Biol. 19, 548–555.
Dahan, O., Gingold, H., and Pilpel, Y. (2011). Regulatory mechanisms and net-
works couple the different phases of gene expression. Trends Genet. 27,
316–322.
Doherty, A., and McInerney, J.O. (2013). Translational selection frequently
overcomes genetic drift in shaping synonymous codon usage patterns in ver-
tebrates. Mol. Biol. Evol. 30, 2263–2267.
dos Reis, M., Savva, R., and Wernisch, L. (2004). Solving the riddle of codon
usage preferences: a test for translational selection. Nucleic Acids Res. 32,
5036–5044.
Dutkowski, J., and Ideker, T. (2011). Protein networks as logic functions in
development and cancer. PLoS Comput. Biol. 7, e1002180.
ell 158, 1281–1292, September 11, 2014 ª2014 Elsevier Inc. 1291

Galli, G., Hofstetter, H., and Birnstiel, M.L. (1981). Two conserved sequence
blocks within eukaryotic tRNA genes are major promoter elements. Nature
294, 626–631.
Gifford, C.A., Ziller, M.J., Gu, H., Trapnell, C., Donaghey, J., Tsankov, A., Sha-
lek, A.K., Kelley, D.R., Shishkin, A.A., Issner, R., et al. (2013). Transcriptional
and epigenetic dynamics during specification of human embryonic stem cells.
Cell 153, 1149–1163.
Gingold, H., and Pilpel, Y. (2011). Determinants of translation efficiency and
accuracy. Mol. Syst. Biol. 7, 481.
Gingold, H., Dahan, O., and Pilpel, Y. (2012). Dynamic changes in translational
efficiency are deduced from codon usage of the transcriptome. Nucleic Acids
Res. 40, 10053–10063.
Goodman, D.B., Church, G.M., and Kosuri, S. (2013). Causes and effects of
N-terminal codon bias in bacterial genes. Science 342, 475–479.
Hanahan, D., and Weinberg, R.A. (2000). The hallmarks of cancer. Cell 100,
57–70.
Hsieh, A.C., Liu, Y., Edlind, M.P., Ingolia, N.T., Janes, M.R., Sher, A., Shi, E.Y.,
Stumpf, C.R., Christensen, C., Bonham, M.J., et al. (2012). The translational
landscape of mTOR signalling steers cancer initiation and metastasis. Nature
485, 55–61.
Ingolia, N.T., Lareau, L.F., and Weissman, J.S. (2011). Ribosome profiling of
mouse embryonic stem cells reveals the complexity and dynamics of mamma-
lian proteomes. Cell 147, 789–802.
Kanaya, S., Yamada, Y., Kinouchi, M., Kudo, Y., and Ikemura, T. (2001). Codon
usage and tRNA genes in eukaryotes: correlation of codon usage diversity with
translation efficiency and with CG-dinucleotide usage as assessed by multi-
variate analysis. J. Mol. Evol. 53, 290–298.
Klochendler, A., Weinberg-Corem, N., Moran, M., Swisa, A., Pochet, N., Sa-
vova, V., Vikesa, J., Van de Peer, Y., Brandeis, M., Regev, A., et al. (2012). A
transgenic mouse marking live replicating cells reveals in vivo transcriptional
program of proliferation. Dev. Cell 23, 681–690.
Kudla, G., Murray, A.W., Tollervey, D., and Plotkin, J.B. (2009). Coding-
sequence determinants of gene expression in Escherichia coli. Science 324,
255–258.
Kumar, S.M., Liu, S., Lu, H., Zhang, H., Zhang, P.J., Gimotty, P.A., Guerra, M.,
Guo, W., and Xu, X. (2012). Acquired cancer stem cell phenotypes through
Oct4-mediated dedifferentiation. Oncogene 31, 4898–4911.
Kutter, C., Brown, G.D., Goncalves, A., Wilson, M.D., Watt, S., Brazma, A.,
White, R.J., and Odom, D.T. (2011). Pol III binding in six mammals shows con-
servation among amino acid isotypes despite divergence among tRNA genes.
Nat. Genet. 43, 948–955.
Lavner, Y., and Kotlar, D. (2005). Codon bias as a factor in regulating expres-
sion via translation rate in the human genome. Gene 345, 127–138.
Lercher,M.J., Urrutia, A.O., Pavlıcek, A., and Hurst, L.D. (2003). A unification of
mosaic structures in the human genome. Hum. Mol. Genet. 12, 2411–2415.
Lotan, R., Bar-On, V.G., Harel-Sharvit, L., Duek, L., Melamed, D., and Choder,
M. (2005). The RNA polymerase II subunit Rpb4p mediates decay of a specific
class of mRNAs. Genes Dev. 19, 3004–3016.
Lotan, R., Goler-Baron, V., Duek, L., Haimovich, G., and Choder, M. (2007).
The Rpb7p subunit of yeast RNA polymerase II plays roles in the two major
cytoplasmic mRNA decay mechanisms. J. Cell Biol. 178, 1133–1143.
Lowe, T.M., and Eddy, S.R. (1997). tRNAscan-SE: a program for improved
detection of transfer RNA genes in genomic sequence. Nucleic Acids Res.
25, 955–964.
1292 Cell 158, 1281–1292, September 11, 2014 ª2014 Elsevier Inc.
Mamane, Y., Petroulakis, E., LeBacquer, O., and Sonenberg, N. (2006). mTOR,
translation initiation and cancer. Oncogene 25, 6416–6422.
Navon, S., and Pilpel, Y. (2011). The role of codon selection in regulation of
translation efficiency deduced from synthetic libraries. Genome Biol. 12, R12.
Nielsen, M.M., Tehler, D., Vang, S., Sudzina, F., Hedegaard, J., Nordentoft, I.,
Orntoft, T.F., Lund, A.H., and Pedersen, J.S. (2014). Identification of expressed
and conserved human noncoding RNAs. RNA 20, 236–251.
Oler, A.J., Alla, R.K., Roberts, D.N., Wong, A., Hollenhorst, P.C., Chandler,
K.J., Cassiday, P.A., Nelson, C.A., Hagedorn, C.H., Graves, B.J., and Cairns,
B.R. (2010). Human RNA polymerase III transcriptomes and relationships to
Pol II promoter chromatin and enhancer-binding factors. Nat. Struct. Mol.
Biol. 17, 620–628.
Pavon-Eternod, M., Gomes, S., Geslain, R., Dai, Q., Rosner, M.R., and Pan, T.
(2009). tRNA over-expression in breast cancer and functional consequences.
Nucleic Acids Res. 37, 7268–7280.
Pavon-Eternod, M., Gomes, S., Rosner, M.R., and Pan, T. (2013). Overexpres-
sion of initiator methionine tRNA leads to global reprogramming of tRNA
expression and increased proliferation in human epithelial cells. RNA 19,
461–466.
Perou, C.M., Sørlie, T., Eisen, M.B., van de Rijn, M., Jeffrey, S.S., Rees, C.A.,
Pollack, J.R., Ross, D.T., Johnsen, H., Akslen, L.A., et al. (2000). Molecular
portraits of human breast tumours. Nature 406, 747–752.
Pietrokovski, S. (1996). Searching databases of conserved sequence regions
by aligning protein multiple-alignments. Nucleic Acids Res. 24, 3836–3845.
Qian, W., Yang, J.R., Pearson, N.M., Maclean, C., and Zhang, J. (2012).
Balanced codon usage optimizes eukaryotic translational efficiency. PLoS
Genet. 8, e1002603.
Raha, D., Wang, Z., Moqtaderi, Z., Wu, L., Zhong, G., Gerstein, M., Struhl, K.,
and Snyder, M. (2010). Close association of RNA polymerase II andmany tran-
scription factors with Pol III genes. Proc. Natl. Acad. Sci. USA 107, 3639–3644.
Saxonov, S., Berg, P., and Brutlag, D.L. (2006). A genome-wide analysis of
CpG dinucleotides in the human genome distinguishes two distinct classes
of promoters. Proc. Natl. Acad. Sci. USA 103, 1412–1417.
Sonenberg, N., and Hinnebusch, A.G. (2009). Regulation of translation initia-
tion in eukaryotes: mechanisms and biological targets. Cell 136, 731–745.
Subramaniam, A.R., Pan, T., and Cluzel, P. (2013). Environmental perturba-
tions lift the degeneracy of the genetic code to regulate protein levels in bac-
teria. Proc. Natl. Acad. Sci. USA 110, 2419–2424.
Sulston, J.E., and Horvitz, H.R. (1977). Post-embryonic cell lineages of the
nematode, Caenorhabditis elegans. Dev. Biol. 56, 110–156.
Tuller, T., Waldman, Y.Y., Kupiec, M., and Ruppin, E. (2010). Translation effi-
ciency is determined by both codon bias and folding energy. Proc. Natl.
Acad. Sci. USA 107, 3645–3650.
Waddington, C.H. (1942). Canalization of development and the inheritance of
acquired characters. Nature 150, 563–565.
Xu, Y., Ma, P., Shah, P., Rokas, A., Liu, Y., and Johnson, C.H. (2013). Non-
optimal codon usage is amechanism to achieve circadian clock conditionality.
Nature 495, 116–120.
Yang, J.H., Shao, P., Zhou, H., Chen, Y.Q., and Qu, L.H. (2010). deepBase: a
database for deeply annotating and mining deep sequencing data. Nucleic
Acids Res. 38 (Database issue), D123–D130.
Zhou, M., Guo, J., Cha, J., Chae, M., Chen, S., Barral, J.M., Sachs, M.S., and
Liu, Y. (2013). Non-optimal codon usage affects expression, structure and
function of clock protein FRQ. Nature 495, 111–115.


![Proposed Approach to Regulation of Cellular and Tissue ... · PDF filePROPOSED APPROACH TO REGULATION OF CELLULAR AND TISSUE-BASED PRODUCTS [Docket Number 97N-0068] For further](https://img.dokumen.tips/doc/110x75/5abe6b237f8b9a7e418ce51c/proposed-approach-to-regulation-of-cellular-and-tissue-approach-to-regulation.jpg)