Embed Size (px)
Citation preview

REGULATION OF TRANSLATION AND TRANSCRIPTION BY SIRT1: POTENTIAL
NOVEL MECHANISMS FOR REGULATING STRESS RESPONSE AND AGING
by
Hiyaa Singhee Ghosh
B.S: Delhi University, 1998
M.S: Panjab University, 2000
Submitted to the Graduate Faculty of
University of Pittsburgh, School of Medicine in partial fulfillment
of the requirements for the degree of
Doctor of Philosophy
University of Pittsburgh
[2007]

ii
UNIVERSITY OF PITTSBURGH
School of Medicine
This thesis was presented
by
Hiyaa Singhee Ghosh
It was defended on
December 19, 2007
and approved by
Thomas E. Smithgall, Ph.D, Professor, Microbiology and Molecular Genetics
Martin C. Schmidt, Ph.D, Professor, Microbiology and Molecular Genetics
John S. Lazo, Ph.D, Professor, Department of Pharmacology
Philip E. Auron, Ph.D, Professor and Chairman, Department of Biological Sciences
Thesis Dissertation Advisor: Paul D. Robbins, Ph.D, Professor, Microbiology and Molecular
Genetics

iii
Copyright © by Hiyaa Singhee Ghosh
2007

iv
SIRT1 is a NAD+ dependent deacetylase that targets many histone and non histone
proteins, thereby regulating a broad range of physiological processes such as metabolism,
reproduction, development, and cell survival. In this study, we have identified novel binding
partners for SIRT1 and documented three different cellular processes that are affected by these
novel interactions.
Using a yeast two-hybrid screen, we have identified several potential binding partners for
SIRT1. Transducin like Enhancer of split 1 (TLE1) and eIF2-alpha (eIF2 ) are two such proteins
identified in the screen whose interaction with SIRT1 was further confirmed by co-
immunoprecipitation.
TLE1 is co-repressor for several transcriptional factors including NF-κB. We
demonstrate that SIRT1 and TLE1 repress NF-κB activity and that the catalytic activity of SIRT1
may not be critical for this. Using knock-out cell lines, we further demonstrate that both SIRT1
and TLE1 are required for the down-regulation of NF-κB activity. Our results suggest that the
interaction between SIRT1 and TLE1 is important for mediating repression of NF-κB activity,
potentially through a deacetyalse independent mechanism.
SIRT1 protects cells from genetoxic and oxidative stress, whereas phosphorylation of
eIF2 is critical for translation attenuation and preferential expression of stress related genes
under stress conditions. We demonstrate that SIRT1 depleted cells show higher levels of
phosphorylated eIF2 and delayed expression of the stress response protein, CHOP.
REGULATION OF TRANSCRIPTION AND TRANSLATION BY SIRT1: POTENTIAL
NOVEL MECHANISMS FOR REGULATING STRESS RESPONSE AND AGING
Hiyaa Singhee Ghosh, Ph.D.
University of Pittsburgh, 2007

v
Furthermore, SIRT1 deficient cells show higher sensitivity to stress treatments and a delayed
recovery of protein systhesis. SIRT1 associates with eIF2 regardless of stress condition,
SIRT1’s catalytic activity or the phosphorylation state of eIF2 . These observations suggest a
novel aspect of SIRT1 mediated regulation of cellular stress response.
Both SIRT1 and the target of rapamycin (TOR) are involved in age related diseases and
lifespan. We demonstrate for the first time that these two pathways are interconnected. We show
that SIRT1 null mouse embryonic fibroblasts (MEFs) have larger cell morphology and
upregulated mTOR signaling. Furthermore, SIRT1 activator reduces, whereas inhibitor activates
the mTOR pathway. Rapamycin is effective in inhibiting mTOR activity in both SIRT1 positive
and deficient cells. Finally, we show that SIRT1 physically associates with TSC2 in HeLa cells.
These observations demonstrate that SIRT1 negatively regulates mTOR pathway upstream of
mTOR complex-1 (TORC1), potentially, by regulating the TSC1/2 complex.

vi
Asato Ma Sat Gamaya Tamaso Ma Jyotir Gamaya
Mrityor Ma Amritam Gamaya
Lead me from the unreal to the real, lead me from darkness to light, lead me from
death to immortality.
- Brhadaranyaka Upanishad (I.3.28)
The most beautiful thing we can experience is the mysterious. It is the source of all
true art and all science. He, to whom this emotion is a stranger, who can no longer
pause to wonder and stand rapt in awe, is as good as dead: his eyes are closed.
- Albert Einstein
Dedicated to my parents
Rama and Aswini Kumar Ghosh

vii
ACKNOWLEDGEMENTS
I thank my advisor Dr. Paul D. Robbins for his support and guidance during my graduate
studies. Paul is a brilliant scientist who has a great knack for asking the right questions in
science. During my tenure in his laboratory I have learnt, that most of good science is not all
about just hard work, but mostly about asking the right questions and pursuing them with an
open mind. I am grateful to him for giving me the freedom and flexibility to pursue what
interested me in research, and enabling me of independent scientific thinking, research and
writing.
I thank my thesis committee advisors Drs. Martin C. Schmidt, Thomas Smithgall, Philip
Auron and John S. Lazo for overseeing my dissertation work. They ensured that I addressed the
right questions and kept a goal that was consistent with finishing my graduate studies in a timely
fashion. Their guidance, suggestions and insights during my committee meetings helped me
greatly in keeping my focus and data well organized.
I would also like to thank Dr. Steven Phillips for his initial guidance and concern in
making sure that all was going smooth in my research and studies. I am thankful to the
‘Interdisciplinary Biomedical Graduate Studies’ program for providing me with an extraordinary
opportunity to pursue my Ph.D in an enriched environment of diverse research fields. I sincerely
thank all the members of our graduate office personnel, especially Cindy Duffy, Sandra Honnick,
and Jennifer Walker from the INTBP graduate office, and Dee O’Hara, Diane, MaryAnn, Cheryl

viii
and Debbie from the MGB graduate office, who took care of virtually all my administrative
requirements, enabling me to focus on my studies and research.
I am very thankful to all my lab-mates for providing their help and support; in particular
Nicole, Khaleel, and Chenjie. Their great companionship and an ever helping attitude made these
five years an easy sail for me. A special thanks to Daniel and Nicole for proofreading my thesis.
I will also like to thank our technician Dan Knight, for making sure that my work went
uninterrupted by taking care of all the instruments and ordering issues. I am also thankful to the
Martin lab, in particular VJ, Rhonda, Karein and Daksha for their great company and cooperative
attitude in letting me use the instruments in their lab whenever I needed.
I am very grateful to all my friends in Pittsburgh, who made Pittsburgh ‘a home away
from home’ for me. Their wonderful companionship and selfless support have made my journey
through graduate school smooth, fun and memorable. I thank my friends Barun, Amlan and
Kaustav for being by my side whenever I needed them. Thanks also to all my friends in the US,
India and elsewhere who kept my life rich in fun and activity beyond my research work and
studies.
I owe my aspirations and my strength to pursue them, to the selfless love, support and
encouragement from my parents and sister. My father’s philosophy of keeping higher goals in
life, his determination and resilience, and my mother’s example of endless sacrifices, strength
and courage have been the source of inspiration in my life. My sister’s journey through the
challenges and triumphs of Ph.D. research and her confidence in me, are a great source of
motivation in my life. Thank you for everything.
I am most grateful to my best friend and husband Amith, for his unbound love and
support in enabling me to achieve my dreams. His genuine interest, enthusiasm and

ix
encouragement about my research kept me motivated and excited even during the dull phases.
No words are sufficient to describe the numerous ways by which he positively influences my life
and career everyday. You are the ultimate driving force in my life Amith. Thanks for being the
greatest friend and husband.
I am also very thankful to my parents-in-law and grandparents-in-law for their love and
faith in me, and for their consistent support and encouragement for my career. Finally, my
heartiest thanks to all my siblings-in-law for their love and wishes, and for all the warmth and
joy they bring to my life.

x
TABLE OF CONTENTS
ACKNOWLEDGEMENTS .................................................................................................. VII
THESIS OUTLINE ....................................................................................................... XX
1.0 GENERAL INTRODUCTION.................................................................................1
1.1 BACKGROUND ON SIRTUINS .....................................................................3
1.1.1 Mammalian sirtuins ...................................................................................5
1.1.2 Functions of mammalian sirtuins ..............................................................7
1.1.3 Sirtuins in aging pathways ....................................................................... 16
1.1.4 Sirtuins in caloric restriction ................................................................... 18
1.1.5 Sirtuins in insulin / IGF-signaling............................................................ 20
1.2 ROLE OF SIRT1 IN REGULATING MAMMALIAN AGING ................... 22
1.2.1 SIRT1 and glucose metabolism ................................................................ 24
1.2.2 SIRT1 and lipid metabolism .................................................................... 26
1.2.3 SIRT1 and cancer ..................................................................................... 27
1.2.4 SIRT1 and neuroprotection ..................................................................... 29
1.2.5 SIRT1 and other diseases ......................................................................... 31
1.3 SIRT1 ACTIVATORS .................................................................................... 32
1.4 SIRT1 INHIBITORS ...................................................................................... 34
1.5 MOTIVATION AND OVERVIEW ............................................................... 35

xi
2.0 SIRT1 INTERACTS WITH TRANSDUCIN-LIKE ENHANCER OF SPLIT-1
TO INHIBIT NF-ΚB MEDIATED TRANSCRIPTION ....................................................... 37
2.1 ABSTRACT .................................................................................................... 38
2.2 INTRODUCTION .......................................................................................... 39
2.3 MATERIALS AND METHODS .................................................................... 45
2.3.1 Cell culture ............................................................................................... 45
2.3.2 Construction of plasmids for yeast two-hybrid screen ........................... 45
2.3.3 Yeast two-hybrid analysis ........................................................................ 46
2.3.4 Design of small interfering RNA targeting vectors ................................. 47
2.3.5 Production of retrovirus........................................................................... 49
2.3.6 Retroviral infection and selection of stable cell lines. ............................. 49
2.3.1 Transfection and Luciferase assay ........................................................... 50
2.3.2 Whole cell lysate preparation and protein estimation ............................ 50
2.3.3 Co-immunoprecipitation assay ................................................................ 51
2.3.4 Western blotting ....................................................................................... 52
2.4 RESULTS ........................................................................................................ 53
2.4.1 SIRT1 interacts with TLE1 in vivo .......................................................... 53
2.4.2 SIRT1 and TLE1 repress NF-κB mediated transcription ...................... 58
2.4.3 Deacetylase activity of SIRT1 is not required for suppression of NF-κB
activity 60
2.4.4 SIRT1 and TLE1 are both required for inhibiting NF-κB activity ........ 64
2.5 DISCUSSION .................................................................................................. 68

xii
3.0 SIRT1 ASSOCIATES WITH EUKARYOTIC INITIATION FACTOR 2-ALPHA
AND PLAYS A ROLE IN CELLULAR STRESS RESPONSE ............................................ 72
3.1 ABSTRACT .................................................................................................... 73
3.2 INTRODUCTION .......................................................................................... 74
3.3 MATERIALS AND METHODS .................................................................... 84
3.3.1 Cell culture and drug treatment .............................................................. 84
3.3.2 Transfections and Luciferase assays ........................................................ 85
3.3.3 Detection of SIRT1-eIF2 association ..................................................... 85
3.3.4 Whole cell lysate preparation and protein estimation ............................ 86
3.3.5 Co-immunoprecipitation assay ................................................................ 86
3.3.6 Western blotting ....................................................................................... 87
3.3.7 Cell survival assay .................................................................................... 88
3.3.8 Immunofluorescence Microscopy ............................................................ 89
3.3.9 Protein synthesis assay by 35
S-methionine incorporation ....................... 89
3.4 RESULTS ........................................................................................................ 91
3.4.1 SIRT1 interacts with eIF2 in vivo .......................................................... 91
3.4.2 SIRT1 localizes in the cytoplasm of human and mouse cells .................. 92
3.4.3 eIF2 phosphorylation is enhanced in SIRT1 depleted cells .................. 94
3.4.4 SIRT1 depleted cells show upregulated eIF2 phosphorylation for a
prolonged time ........................................................................................................ 95
3.4.5 SIRT1 deficient cells show delayed CHOP expression in response to
cellular stress ........................................................................................................... 97
3.4.6 SIRT1 deficient cells are more sensitive to free radical stress ................ 98

xiii
3.4.7 Increased sensitivity of SIRT1 deficient cells is caused by translation
inhibition ............................................................................................................... 101
3.4.8 SIRT1 deficient cells show impaired translation recovery in response to
ER stress ................................................................................................................ 102
3.4.9 SIRT1 and eIF2 associate regardless of stress condition .................... 103
3.4.10 SIRT1 catalytic activity or eIF2 phosphorylation does not affect
SIRT1-eIF2 association. ..................................................................................... 104
3.5 DISCUSSION ................................................................................................ 107
4.0 SIRT1 NEGATIVELY REGULATES MAMMALIAN TARGET OF
RAPAMYCIN (TOR) THROUGH TSC2 ............................................................................ 114
4.1 ABSTRACT .................................................................................................. 115
4.2 INTRODUCTION ........................................................................................ 116
4.3 MATERIALS AND METHODS .................................................................. 129
4.3.1 Cell culture and treatment and transfection ......................................... 129
4.3.2 Immunoflorescence Microscopy ............................................................ 130
4.3.3 F-actin staining using rhodamine-phalloidin ........................................ 130
4.3.4 Whole cell lysate preparation and protein quantification .................... 131
4.3.5 Co-immunoprecipitation for detection of protein-protein association . 131
4.3.6 Western blot analysis for mTOR signaling ........................................... 132
4.4 RESULTS ...................................................................................................... 135
4.4.1 SIRT1 regulates mTOR signaling in human and mouse cells .............. 135
4.4.2 SIRT1 does not alter the protein expression of mTOR-complex 1
regulatory proteins. ............................................................................................... 138

xiv
4.4.3 SIRT1 regulates mTOR signaling up-stream of the mTOR complex-1
(mTORC1)............................................................................................................. 140
4.4.4 The catalytic activity of SIRT1 plays a role in regulating mTOR
signaling................................................................................................................. 143
4.4.5 SIRT1 inhibits mTOR signaling by acting through the TSC2.............. 146
4.4.6 SIRT1 associates with TSC2 in HeLa cells ............................................ 148
4.5 DISCUSSION ................................................................................................ 152
5.0 OVERALL DISCUSSION AND CONCLUSIONS ............................................. 161
5.1 TLE1: A NOVEL BINDING PARTNER FOR SIRT1 ................................ 161
5.2 SIRT1: A NOVEL REGULATOR OF EUKARYOTIC INITIATION
FACTOR 2-ALPHA PHOSPHORYLATION AND STRESS RESPONSE ............... 165
5.3 SIRT1: A REGULATOR OF THE TARGET OF RAPAMYCIN
PATHWAY ................................................................................................................... 168
5.4 CLOSING REMARKS ................................................................................. 172
BIBLIOGRAPHY ................................................................................................................. 174

xv
LIST OF TABLES
Table 1.1 Expression pattern, cellular distribution and functions of mammalian sirtuins ..............7
Table 2.1 Protein identified as potential binding partners for SIRT1 in the Yeast two-hybrid
screen ........................................................................................................................................ 54
xvi
LIST OF FIGURES
Figure 1.1 Sirtuin enzymatic activities. ........................................................................................4
Figure 1.2 Mammalian Sirtuins ...................................................................................................6
Figure 2.1 Structure/function relationships in the Gro/TLE family. ........................................... 42
Figure 2.2 Schematic of the Yeast-two hybrid assay, and the bait and library protein constructs 53
Figure 2.3 -galactosidase assay for verification of positive clones ........................................... 54
Figure 2.4 Verification of SIRT1-TLE1 interaction by -galactosidase assay ............................ 56
Figure 2.5 Co-immunoprecipitation of SIRT1 and TLE1 ........................................................... 57
Figure 2.6 SIRT1 and TLE1 repress NF- B dependent luciferase gene expression in HeLa cells
................................................................................................................................................. 58
Figure 2.7 SIRT1-TLE1 co-expression enhances NF-κB repression by SIRT1 or TLE1
individually ............................................................................................................................... 59
Figure 2.8 The catalytic mutant SIRT1-H363Y also represses NF-κB activity ........................... 60
Figure 2.9 N-terminal and C-terminal Flag-tag-SIRT1 .............................................................. 61
Figure 2.10 N-terminus but not C-terminus SIRT1 represses NF-κB activity ............................. 61
Figure 2.11 Protein levels of SIRT1, TLE1, p65 or p50 are not affected by SIRT1 or TLE1
overexpression either individually or together. .......................................................................... 62
Figure 2.12 SIRT1 and TLE1 represses IL8 promoter based natural NF-κB luciferase reporter. 64
xvii
Figure 2.13 TLE1 is unable to repress NF-ĸB dependent gene expression in mouse embryonic
fibroblasts (MEF) that are null for SIRT1 .................................................................................. 66
Figure 2.14 SIRT1 and TLE1 are both required for inhibiting NF-ĸB activity in HeLa cells. ..... 67
Figure 3.1 Translation initiation process of eukaryotic mRNA .................................................. 76
Figure 3.2 Stress stimuli mediated phosphorylation of eIF2 inhibits translation. ...................... 78
Figure 3.3 Integrated stress response by eIF2 phosphorylation ............................................... 81
Figure 3.4 SIRT1 and eIF2 interact with each other in HeLa cells ........................................... 92
Figure 3.5 SIRT1 localizes in the nucleus and cytoplasm of HeLa cells ..................................... 93
Figure 3.6 SIRT1 localizes in the cytoplasm and nucleus of human and mouse cell lines........... 94
Figure 3.7 HeLa cells depleted for SIRT1 show higher eIF2 phosphorylation in response to
stress ......................................................................................................................................... 95
Figure 3.8 SIRT1 depleted HeLa cells show persistently higher level of eIF2 phosphorylation
in response to amino acid starvation and ER stress .................................................................... 96
Figure 3.9 SIRT1 deficient mouse embryonic fibroblasts show higher level of eIF2
phosphorylation in response to amino acid starvation and ER stress .......................................... 97
Figure 3.10 SIRT1 deficient mouse embryonic fibroblasts show delayed CHOP expression
response to ER stress and amino acid starvation. ....................................................................... 98
Figure 3.11 SIRT1 null mouse embryonic fibroblasts are more sensitive to oxidative stress .... 100
Figure 3.12 Translation inhibition leads to increased sensitivity of SIRT1 positive cells to
oxidative stress. ....................................................................................................................... 101
Figure 3.13 SIRT1 null mouse embryonic fibroblasts show slower translation recovery in
response to ER stress ............................................................................................................... 102
Figure 3.14 SIRT1 associates with eIF2 regardless of stress condition ................................. 103
xviii
Figure 3.15 SIRT1 associates with eIF2 regardless of SIRT1’s catalytic activity or eIF2 ’s
phosphorylation status ............................................................................................................. 105
Figure 3.16 SIRT1 associates with the phosphorylation mutant and mimetic eIF2 ................. 106
Figure 4.1 SIRT1, CR and IGF-1 signaling in aging and longevity .......................................... 118
Figure 4.2 TOR complex 1 (TORC1) and TOR complex 2 (TORC2) ...................................... 121
Figure 4.3 mTOR signaling in mammalian cells ...................................................................... 123
Figure 4.4 SIRT1 null mouse embryonic fibroblasts are larger in size ..................................... 135
Figure 4.5 mTOR signaling is more active in SIRT1 null mouse embryonic fibroblasts ........... 136
Figure 4.6 Mouse kidney from SIRT1 heterozygous or homozygous null mice show higher
mTOR activity ........................................................................................................................ 137
Figure 4.7 SIRT1 depleted HeLa cells show higher mTOR activity ......................................... 138
Figure 4.8 Expression level of mTOR regulatory proteins are not altered in response to presence
or absence of SIRT1 ................................................................................................................ 139
Figure 4.9 Rapamycin abrogates mTOR signaling regardless of presence of SIRT1 ................ 141
Figure 4.10 SIRT1 null mouse embryonic fibroblasts show abrogation of mTOR signaling in
response to rapamycin treatment similar to the TSC2 null mouse embryonic fibroblasts .......... 142
Figure 4.11 SIRT1 activator suppresses and inhibitor activates mTOR signaling in HeLa cells
............................................................................................................................................... 144
Figure 4.12 SIRT1 activator suppresses mTOR signaling in 293T cells ................................... 144
Figure 4.13 SIRT1 inhibitor activates mTOR signaling in control but not in SIRT1 depleted
HeLa cells ............................................................................................................................... 145
Figure 4.14 SIRT1 activator can not suppress mTOR signaling in TSC2 null MEFs ............... 146

xix
Figure 4.15 Resveratrol suppresses mTOR signaling in wild-type but not in SIRT1 null MEFs
............................................................................................................................................... 147
Figure 4.16 Resveratrol suppresses mTOR signaling at higher dose in SIRT1 null MEFs but not
in TSC2 null MEFs ................................................................................................................. 148
Figure 4.17 Endogenous SIRT1 and TSC2 Co-immunoprecipitate in HeLa cells ..................... 149
Figure 4.18 Exogenously expressed SIRT1 and TSC2 co-immunoprecipate in HeLa cells ....... 150
Figure 4.19 Proposed model for SIRT1 mediated regulation of mTOR ................................... 159
Figure 5.1 Three novel aspects of SIRT1 function in regulating cellular stress response and aging
............................................................................................................................................... 172
xx
THESIS OUTLINE
Chapter 1: This chapter consists of an introduction to the sirtuins in lower organisms and
mammals, their various target substrates and their role in various cellular functions. This is
followed by some background on the role of sirtuins in aging pathways, caloric restriction and
insulin-signaling pathways. The human SIRT1 has been specifically discussed with regards to its
role in metabolism, endocrine signaling and aging-related diseases such as cancer and
neurodegeneration. In addition, the specific chemical and natural regulator compounds for
SIRT1’s catalytic activity have also been discussed in brief. This section gives a background of
SIRT1’s role in varied cellular pathways indicating the complexity that lie behind SIRT1’s
potential role in regulating mammalian aging.
Chapter 2: This chapter describes the identification of transducin like enhancer of split-1 (TLE1)
as a novel binding partner for SIRT1, and its role in mediating SIRT1’s regulation on NF-κB
activity.
Chapter 3: This chapter describes the identification of eIF2 as yet another novel binding partner
for SIRT1, and its potential role in regulating SIRT1 mediated cellular stress response. The role
of SIRT1 in regulating eIF2 demonstrates a novel role for SIRT1 in translation regulation and
stress response.

xxi
Chapter 4: This chapter describes the role of SIRT1 in regulating the mammalian Target of
Rapamycin (mTOR) pathway. This pathway is involved in cellular growth and size and has been
implicated in longevity in lower organism. Elucidation of SIRT1 as a regulator of this pathway is
thus relevant with regards to SIRT1’s role in cancer and mammalian aging.
Chapter 5: This chapter recaps the major findings of this study, their relevance with regards to
the biology of sirtuins, its role in mammalian longevity and potential future directions of
research.
1
1.0 GENERAL INTRODUCTION
In the past five to six decades, understanding the aging process and the prospects of regulating
longevity has captured the imagination of scientists all over the world. Although death is
inevitable, understanding the process of aging and elucidating how and why cells, and eventually
organisms, die can greatly help us understand and modulate many disease processes that occur
with age, thereby enabling us to come up with useful interventions.
As early as the 1930’s, scientists observed that restricted food intake, termed now as
caloric restriction (CR), can increase lifespan in rodents. Since then, this phenomenon has been
verified in various organisms from yeast to primates, indicating that the process of aging may be
evolutionarily conserved. Discoveries in the past decade have revolutionized the field of aging
research, leading to wide acceptance of the fact that aging, like most other biological processes,
can be regulated. A novel class of regulators, namely, the silent information regulator (SIR2)
family or sirtuins, has been shown to regulate aging and mediate CR-induced longevity in lower
organisms such as yeast, worms and flies [189,191,256,294]. However, it is yet to be determined
if sirtuins regulate longevity in mammals. In the past one decade genetic studies using model
organisms have identified specific genes and signaling pathways that regulate cellular damage
and senescence. These studies indicate a potential critical role for sirtuins in mammalian
longevity. Cellular senescence was first described about four decades ago. The word
‘Senescence’ is derived from a Latin word Senex, meaning old man or old age. Although

2
scientifically the term ‘senescence’ was applied to cells that stopped dividing in culture [119], it
can be interchangeably used with aging, since it describes the deteriorative processes in living
organisms that can ultimately lead to death. The first molecular explanation for the limited
capacity of cells to divide was provided by the discovery of telomere shortening [24,116], a
process regulated by sirtuins. Since then, scientists have been diligently examining other causes
that can lead to aging and death. Broadly, the regulators of lifespan that have been identified to
date, can be categorized as 1) Caloric restriction 2) Gene Silencing 3) hormonal signals and 4)
oxidative stress. In the past decade, the mammalians sirtuins have been implicated extensively in
regulating all of the above processes, thereby affecting multiple signaling pathways that are
interconnected in a very complex way. Although significant advances have been made to
elucidate the various cellular processes the lead to aging phenotype, we are still far from
understanding how these processes and pathways are coordinated in a coherent way to facilitate
cellular struggle against damage and death. Continued research to understand more regarding the
roles of specific genes and proteins involved in pathways regulating lifespan, will greatly help
our search to find the secret of healthy, disease free and youthful additional years in our lives.

3
1.1 BACKGROUND ON SIRTUINS
In the past decade, a novel class of regulators called the ‘Silent information regulator 2 (Sir2)
family or Sirtuins, have been implicated in regulating organism aging and lifespan. Initially
discovered in yeast, Sirtuins are a family of proteins with protein deacetylase and ADP-
ribosyltransferase activity [22,132,193]. The name ‘Sirtuins’ was first given to the family of
these proteins by Roy Frye in 1991 who identified five of the human SIR2 homologues, SIRT1-
5. The first sirtuin gene was discovered in Saccharamyces cerevesiae more than two decades ago
by Klar and collegues [163]. The founding member of the Sirtuin family of proteins, the yeast
Sir2 (Sir2p), was originally known as MAR1, for mating-type regulator 1. It was discovered by
observing a spontaneous mutation that caused sterility due to loss of silencing at the mating-type
loci HMR and HML. Later on, a series of mutations resulting in sterile phenotypes were co-
discovered by Jasper Rine, who named the set of four genes, homologues of SIR2 (HST),
responsible for this trait, as Silent Information Regulator (SIR) 1-4 [137,163,276].
Subsequently, SIR2 homologues were found in bacteria, worms, flies, plants and mammals,
suggesting that the Sirtuin family genes are ancient and evolutionarily conserved.
More than a decade after the discovery of the SIR2 gene, two different groups [6,99],
demonstrated that the SIR2 gene from the Sirtuin family, is required to suppress rDNA
recombination and silencing at telomeric DNA. Subsequently it was shown that the gene
silencing at mating-type loci and telomeres, is associated with hypo-acetylated histone proteins
at the N-terminal lysine residues [30]. After the initial discovery that sirtuins metabolize NAD
and possess ADP-ribosyltransferase activity, it was soon established that the enzymatic activity
of yeast Sir2 protein was essential for gene silencing [87,290]. The first identified protein
substrates of the yeast Sir2 (Sir2p) were histones [22]. Initially it was thought that ADP-
4
ribosylation of histones by Sir2 interferes with histone acetylation, leading to hyper-acetylation
and loss of silencing in Sir2 mutants. However, soon it was shown that Sir2 deacetylated
histones and this activity was absolutely dependent on NAD+ [132,177]. The NAD+ dependent
deacetyalse activity was later described for numerous other sirtuins, including bacterial CobB,
archeabacterial SIR2-AF (Archaeoglobus fulgidus) and human SIRT1-3 and 5 [280]. Sirtuins
were thus categorized as class III histone decetylase (HDAC-III). While class I and II histone
deacetylases use zinc as a co-factor [122], the sirtuins are NAD+ dependent in that they consume
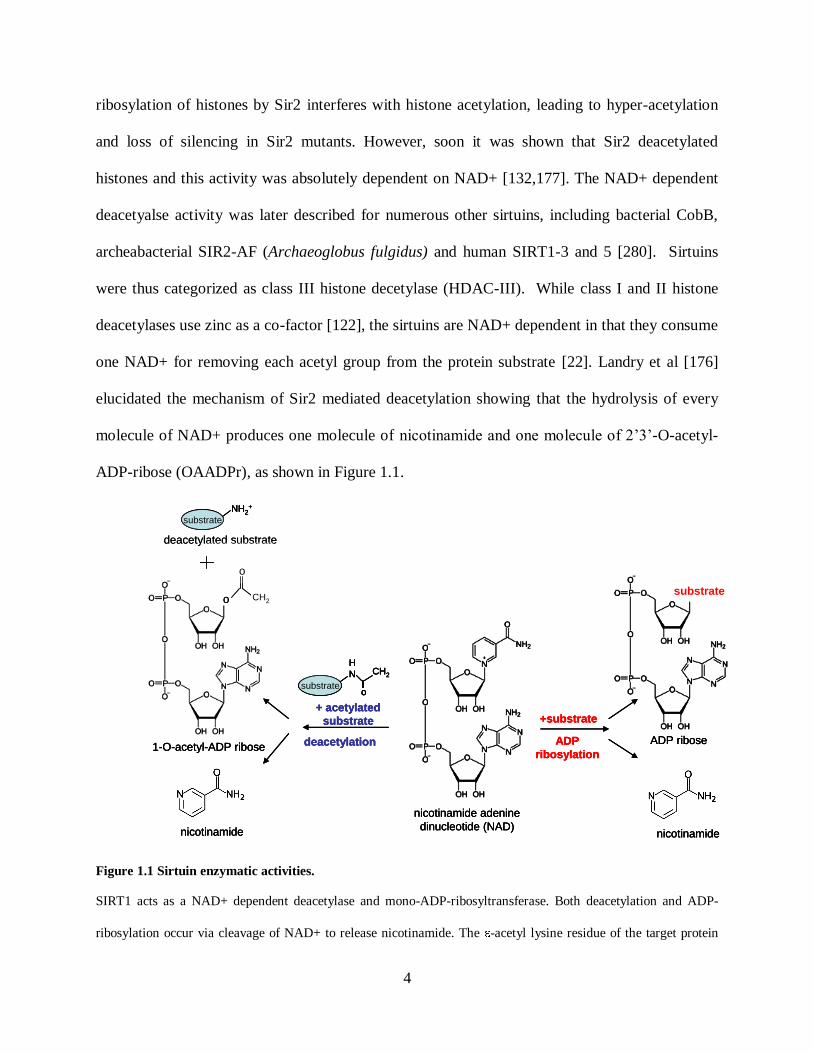
one NAD+ for removing each acetyl group from the protein substrate [22]. Landry et al [176]
elucidated the mechanism of Sir2 mediated deacetylation showing that the hydrolysis of every
molecule of NAD+ produces one molecule of nicotinamide and one molecule of 2’3’-O-acetyl-
ADP-ribose (OAADPr), as shown in Figure 1.1.
Figure 1.1 Sirtuin enzymatic activities.
SIRT1 acts as a NAD+ dependent deacetylase and mono-ADP-ribosyltransferase. Both deacetylation and ADP-
ribosylation occur via cleavage of NAD+ to release nicotinamide. The -acetyl lysine residue of the target protein
o
CH2o
+substrate
ADP
ribosylation
substrate
nicotinamide
ADP ribose
nicotinamide adenine
dinucleotide (NAD)
+ acetylated
substrate
deacetylation1-O-acetyl-ADP ribose
nicotinamide
substrate
NH2+
substrate
H
N CH2
o
deacetylated substrate
o
CH2o
+substrate
ADP
ribosylation
substrate
nicotinamide
ADP ribose
nicotinamide adenine
dinucleotide (NAD)
+ acetylated
substrate
deacetylation1-O-acetyl-ADP ribose
nicotinamide
substrate
NH2+
substrate
H
N CH2
o
o
CH2o
o
CH2o
+substrate
ADP
ribosylation
substrate
nicotinamide
ADP ribose
nicotinamide adenine
dinucleotide (NAD)
+ acetylated
substrate
deacetylation1-O-acetyl-ADP ribose
nicotinamide
substrate
NH2+
substrate
NH2+
substrate
H
N CH2
osubstrate
H
N CH2
o
deacetylated substrate

5
serve as substrate for sirtuin deacetylation. NAD+ and acetylated protein are converted to free lysine side chain,
nicotinamide (NAM) and 2’-O-acetyl-ADP-ribose (2’-OAADPr) by Sirt1. The by-product equilibrates in solution
with 3’-O-acetyl-ADP-ribose.
OAADPr formed as a byproduct of NAD+ dependent deacetylation reaction acts as a
secondary messenger for sirtuin triggered signaling pathways. The absolute requirement of
NAD+ for sirtuin catalysis suggests that sirtuins may have evolved as sensors of cellular energy
and redox states coupled to the metabolic status of the cell. Increasing evidence support that
sirtuins are indeed adapted to interact with changes in NAD+ involving metabolic pathways,
manifested by changes in the concentration of NAD+, NADH and/or nicotinamide
[68,103,182,189-191,253,266]. Nicotinamide, and the reduced dinucleotide, NADH, are
inhibitors of sirtuins. Unlike class I and II HDACs, sirtuins are not affected by Trichostatin A
(TSA).
1.1.1 Mammalian sirtuins
The mammalian sirtuin family consists of seven sirtuins discovered in humans so far namely,
SIRT1-7 [22,87]. All of these have an NAD+ -dependent catalytic core domain, which may act
preferentially as a NAD+ -dependent deacetylase (DAC) and/or mono-ADP-ribosyl transferase
(ART). The N-terminal and C-terminal sequences that flank the catalytic core domain vary in
length between the different sirtuins. The seven mammalian sirtuins also differ in their sub-
cellular localization; SIRT1, SIRT6 and SIRT7 being predominately nuclear, SIRT2 cytoplasmic
[86,224] and SIRT3, SIRT4 and SIRT5 mostly described as mitochondrial. Although initially,

6
SIRT1 was known to be a nuclear protein, more recently it has been found to shuttle between the
nucleus and the cytoplasm, displaying some important cytoplasmic functions as well
[55,110,217,289].
Figure 1.2 Mammalian Sirtuins
The core catalytic domain is conserved between all the seven mammalian sirtuins, SIRT1-7. The N and C-terminal
flanking sequences vary in length. The sub-cellular localization also varies among the seven sirtuins.
In the nucleus, a large fraction of SIRT1 is associated with euchromatin, whereas SIRT6
associates with the heterochromatin and SIRT7 localizes in the nucleous [81,211]. Among the
seven sirtuins, SIRT1 show robust deacetylase activity [224,302], SIRT5 has weak deacetyalse
activity and SIRT2 and 3 possess both deacetylase as well as mono-ADP-ribosyl transferase
activities [86,224,273]. SIRT4 and 6, on the other hand, are mono-ADP-ribosyl transferases
[109,193], and no significant activity has been found for SIRT7 yet. Like their diverse sub-
cellular localization, the mammalian sirtuins are expressed differentially in organs, have multiple
target substrates and affect a broad range of cellular functions.
SIRT1 DAC
DAC & ART
DAC & ART
ART
DAC
ART
unknown
SIRT2
SIRT3
SIRT4
SIRT5
SIRT6
SIRT7
euchromatin
cytoplasm
mitochondria
mitochondria
mitochondria
hetero-chromatin
nucleolus
Catalytic
core domain
SIRT1 DAC
DAC & ART
DAC & ART
ART
DAC
ART
unknown
SIRT2
SIRT3
SIRT4
SIRT5
SIRT6
SIRT7
euchromatin
cytoplasm
mitochondria
mitochondria
mitochondria
hetero-chromatin
nucleolus
Catalytic
core domain

7
Table 1.1 Expression pattern, cellular distribution and functions of mammalian sirtuins
Gene High expression
levels
Low expression
levels
Sub-cellular
localization
Target proteins
SIRT1 Brain, testis, skeletal
muscle, kidney (+++),
thymus,uterus (++)
Liver, spleen,
lungs, ovary,
bone marrow,
heart
nuclear P53,Ku70, NF-
κB, PGC1 ,
MEF2D, MyoD,
PPAR , FOXO,
p300, AceCS1, tat
SIRT2 Brain, skeletal muscle
(+++), liver, testis,
kidney, heart (++)
Thymus, lungs,
bone marrow,
uterus, ovary,
spleen
cytoplasmic -tubulin
SIRT3 Ovary (+++), most other
organs (++)
- mitochondrial PGC1 , AceCS2
SIRT4 Brain, testis, heart, lungs
(+++), liver, skeletal
muscle, kidney, thymud,
uterus, ovary (++)
Bone marrow,
spleen
mitochondrial Glutamate
dehydrogenase
SIRT5 Brain, testis, skeletal
muscle, kidney, heart
(+++), liver, ovary,
lungs, thymus, uterus,
bone marrow (++)
spleen mitochondrial unknown
SIRT6 Fetal brain (+++), brain,
liver, testis, skeletal
muscle, kidney, heart,
ovary (++)
Spleen, thymus,
uterus, bone
marrow, lungs
nuclear DNA pol
SIRT7 Brain, testis, kidney,
spleen, liver
Other organs nuclear RNA pol I
Of the seven mammalian sirtuins, SIRT1 is the most extensively studied, with more than
a dozen known substrates and implicated roles in a wide range of cellular processes including
cell survival and apoptotic pathways.
1.1.2 Functions of mammalian sirtuins
Gene Expression

8
Repression of gene expression is associated with histone hypo-acetylation. Heterochromatin,
which is the more tightly packed form of chromatin, is associated with hypo-acetylated histones.
SIRT1, like the yeast Sir2, facilitates the formation of heterochromatin by targeting and
deacetylating various histone proteins. It deacetylates histone protein H1 at the lysine residues 9
and 26, H3 at 14 and H4 at 16. Apart from deacetylating histone proteins, SIRT1 plays a role in
gene expression by targeting transcription factors. The numerous non-histone targets of SIRT1
include TAFI68 [TBP (TATA-box binding protein) asscociated factor I 68], p300, PACF
[p300/cAMP-response-element-binding protein-associated factor], GCN5, MyoD, MEF2
(MADS box transcription factor enhancer factor 2), p19ARF
, p53, HIC1, NF-κB, PGC1 , PPAR ,
aP2, FOXO1,3a and 4, E2F1, p73, BCA3, Hes1 and Hey2, BCL11A, CTIP2, NCoR, SMRT,
UCP2, HIV-Tat
[11,27,28,34,48,49,53,55,62,81,89,91,93,166,198,216,218,219,233,241,270,271,282,288,298,29
9,302,305,320,327].
TAFI68 is a component of the TBP containing complex, TIF (transcription initiation
factor)-IB/SL, which regulates transcription by RNA Pol I (RNA polymerase I). SIRT1
deacetylates TAFI68, thereby decreasing its DNA binding activity, leading to repression of RNA
Pol I-mediated transcription in vitro [218]. SIRT1 binds and deacetylates the acetyltransferase
p300 at lysine 1020and 1024, thereby inhibiting it. Since, p300 is a limiting transcription
cofactor, its inhibition plays an important role in orchestrating cell differentiation and
metabolism. The functions of the other targets of SIRT1 will be discussed in the following
sections.
Several studies implicate SIRT1 in epigenetic gene regulation in cancer cells. Being
identified as a component of the polycomb repressive complex 4 (PRC4), which harbors the SET

9
domain histone methyltransferase Ezh2 [172], SIRT1 regulates the expression of PRC4 target
genes. It is believed that PRC4-mediated histone modifications may contribute to cancer specific
epigenetic changes. Furthermore, in the context of epigenetic modifications of DNA, SIRT1 also
deacetylates histone H1-K26 which helps spreading hypo-methylated histone H3-K79 and help
form heterochromatin formation [299]. SIRT1 depleted mammalian cells show a reduction in H3
tri-MeK9, H4-MeK20 and H4-K16 hyperacetylation [132]. Interestingly, various tumors and
tumor-derived cell lines show loss of H4-K16 acetylation and H4-K20 trimethylation, suggesting
that these could be hallmarks of epigenetic modification in cancer cells [83]. Notably, SIRT1
localizes specifically to the promoters of tumor suppressor genes whose DNA is
hypermethylated and silenced in many cancers.
Apoptosis and cell survival
SIRT1 plays a role in apoptosis by targeting multiple proteins such as p53, p73, E2F, HIC1 and
Ku70. SIRT1 binds the tumor suppressor p53 and deacetylates it at multiple lysine residues,
thereby inhibiting p53 transactivation and suppressing apoptosis in response to oxidative stress
and DNA damage [198,302]. SIRT1 also binds HIC1 (hypermethylated in cancer 1)
transcriptional repressor and mediates the bypass of apoptosis, potentially by promoting cell
survival and tumorigenesis via p53. Since HIC1 can repress SIRT1 expression and p53 is able to
transactivate HIC1 transcription, SIRT1, HIC1 and p53 are believed to act in a complex loop
where HIC1 represses SIRT1, promoting p53 activity and apoptosis under stress. However,
under conditions, where cells are to be recovered from DNA damage, p53 down-regulates HIC1,
which induces SIRT1 transcription and promotes cell survival.

10
Another mechanism by which SIRT1 regulates apoptosis is by binding and deacetylating
the DNA repair factor Ku70. Ku70 acts as an inhibitor of Bax mediated apoptosis. Deacetylated
Ku70 complexes with the proapoptotic factor Bax, sequestering it away from mitochondria,
thereby blocking it from triggering apoptosis in 293 cells in response to stress [55]. SIRT1 also
binds the cell proliferation and cell-cycle regulator, E2F1, and inhibits the apoptotic function of
E2F1. On the other hand, E2F1 binds directly to the SIRT1 promoter and induces its
transactivation, forming a negative feedback loop between SIRT1 and E2F1 functions. This
mutual regulation of SIRT1 and E2F1 protects against DNA damage [305]. p73 is yet another
protein that SIRT1 targets to regulate apoptosis. Similar to p53, SIRT1 binds and deacetylates
p73, thereby suppressing its transcriptional activity and inhibiting p73 mediated apoptosis in 293
cells [62].
Stress resistance and cell survival
SIRT1 also plays a role in cell survival by regulating the Forkhead transcription factors
(FOXOs). SIRT1 has been documented to deacetylate three out of the four known FOXO
proteins, namely Foxo1, Foxo3a and Foxo4. SIRT1 affects Foxo3a in neurons and fibroblasts,
reducing stress induced apoptosis and increasing expression of DNA repair and cell cycle
checkpoint genes [34,216]. SIRT1 also deacetylates Foxo4 and rescues its repression under
oxidative stress, thereby increasing expression of growth arrest and DNA repair protein,
GADD45 (growth arrest and DNA-damage-inducible ) [166,298]. Acting through Foxo4,
SIRT1 also suppresses the pro-apoptotic proteases caspase-3 and 7 only in transformed cells but
not in normal cells [82]. Interestingly, caspase-9 and Bcl-xL regulate SIRT1 cleavage during
apoptosis, shifting its localization from nucleus to cytoplasm [229].

11
Furthermore, SIRT1 protects pancreatic -cells against glucose induced cytotoxicity by
acting through FOXO1 [162]. In diabetic patients, chronically high plasma glucose causes
cytotoxicity leading to -cell degeneration. This is believed to be caused by increased
mitochondrial oxidation rates, due to higher glucose levels, leading to increased ROS production.
Under these conditions, SIRT1 is required in sustaining FOXO1-mediated transcription of MafA
and NeuroD, which regulate expression of insulin gene2 to prevent apoptosis.
Cellular Senescence
Cellular senescence is a state of permanent cell cycle arrest which is manifested by defined
morphological changes. Senescence can be natural or induced by certain stimuli. SIRT1’s role in
regulating cellular senescence is conflicting. Under certain conditions, SIRT1 has been found to
localize with PML (promyelocytic leukemia) in discrete nuclear structures called the nuclear
bodies. PML proteins are believed to act as co-activator or co-repressor to various transcription
factors affecting apoptotic signals. It is believed that SIRT1 rescues primary mouse embryonic
fibroblasts from PML-mediated premature cellular senescence by inhibiting the pro-apoptotic
factor p53 [178]. However, in other cases, SIRT1 has been shown to promote cellular
senescence, SIRT1 null MEFs show extended replicative potential and higher proliferation
during chronic but sublethal stress [53]. Interestingly, lower SIRT1 levels have been documented
in dividing tissue of older mice, such as testis and thymus or in cells that have been serially
passaged. However, this was not true for immortalized cells or post-mitotic organs [265]. Thus,
although SIRT1’s regulatory role in senescence is conflicting, SIRT1 mediated regulation of
senescence may play a significant role with regard to tumorigenesis in the elderly and aging.

12
DNA Repair
A couple of reports have suggested a potential role of the mammalian sirtuins in DNA repair.
Recently, Mostoslavsky et al showed that SIRT6 knockout mice exhibit impairment in base
excision repair [214]. While the mechanism by which SIRT6 regulates DNA repair is not clear,
the various phenotypic defects found in SIRT6 knockout mice such as premature aging,
abnormal spine curvature and metabolic defects have been attributed to defects in DNA repair.
More recently, SIRT1 has also been implicated in DNA repair mechanism. Upon exposure to
radiation, SIRT1 enhances DNA repair capacity and deacetylation of the repair protein Ku70.
Over-expression of SIRT1 results in the increased repair of DNA strand breakages produced by
radiation. On the other hand, repression of endogenous SIRT1 expression by SIRT1 siRNA
decreases repair activity, indicating that SIRT1 can regulate DNA repair capacity of cells with
DNA strand breaks [140].
Inflammation
SIRT1 plays a role in inflammation by regulating a key regulator NF-κB. SIRT1 represses NF-
κB activity possibly by multiple mechanisms. It has been shown that SIRT1 deacetylates the
RelA/p65 subunit of NF-κB, thereby inhibiting its transactivation potential [320]. Consistent
with this, it has been shown that cigarette smoke extracts can increase pro-inflammatory
responses mediated by NF-κB by decreasing the interaction between SIRT1 and RelA/p65
resulting in increased acetylation and activation of NF-κB [314]. Interestingly, SIRT1 is
expressed at higher levels in calorie restricted rodents which also show decreased inflammatory
responses. Recently in a high-throughput screen, SIRT1 activating compounds were shown to

13
have anti-inflammatory properties such as reduction of the pro-inflammatory cytokine ‘tumor
necrosis factor (TNF- )’ [221].
Development
Many lines of evidence suggest a role of SIRT1 in development. Using a Sir2 knock out
transgenic mice model, McBurney et al. showed that the protein SIRT1 is important for
embrogenesis and gametogenesis. First, only half of the typically expected numbers of pups are
born, and of those that are born, only 20% survive to adulthood. These mice showed
developmental defects such as markedly smaller size as compared to their littermates, slower
development, defects in eye morphogenesis and cardiac septation. Furthermore, the mice that
survive to adulthood are sterile in both sexes, with males having lower sperm count and females
failing to ovulate, potentially due to hormonal inefficiency [206]. The developmental defects in
SIRT1 mutant mice can be explained by SIRT1’s regulation of the transcriptional repressors
Hes1 and Hey2, which play a role in development [288]. Apart from this, SIRT1 is also known
to regulate BCL11A and CTIP2, a mammalian and chicken protein respectively, which play a
role in haematopoietic cell development and malignancies [271]. Consistent with SIRT1’s role in
development, another report showed that SIRT1 is expressed at higher levels in the heart, brain,
spinal cord and dorsal root ganglia of embryos [262]. Another sirtuin member, SIRT2, has been
shown to interact with an homeobox transcription factor important for embryogenesis, HOXA10,
indicating potential role for the other sirtuins in development [11].
Reproduction

14
It has been documented that developing spermatocytes express higher levels of SIRT1 and
deletion of the SIRT1 gene leads to severe sperm abnormality and sterility in mice [206]. Thus
SIRT1 potentially plays a role in the reproductive capacity of animals.
Muscle maintenance
SIRT1 regulates muscle differentiation and muscle mass maintenance by regulating multiple
proteins. SIRT1 deacetylates and inhibits the transcription factor MyoD, a key player in muscle
differentiation. On the other hand, SIRT1’s activity is regulated by decreasing levels of NAD+
during muscle differentiation to alleviate SIRT1-mediated MyoD suppression [89]. SIRT1 also
deacetylates myocyte enhancing factor 2 (MEF2), another transcription factor that regulate
muscle differentiation. Deacetylation of MEF2 by SIRT1 facilitates the HDAC4 mediated
SUMO addition by E3 ligase on MEF2, thereby inhibiting MEF2 mediated transcription [327].
Reduction in muscle mass is a common cause in diseases like muscular dystrophy, cancer
and aging. Balanced turnover of protein is critical for muscle mass maintenance. Two proteins
involved in proteosome mediated proteolysis are MnRF1 (for muscle RING finger 1) and
MAFbx/atrogin-1 (for muscle atrophy F-box) [98]. These two proteins are transcriptionally
regulated by NF-κB and FOXO pathways, which in turn are regulated by SIRT1. Thus, along
with its regulation of MyoD, MEF2, NF-κB and Forkhead transcription factors, SIRT1 plays a
broader role in controlling muscle mass maintenance during injury and aging.
Metabolism

15
The first evidence that suggested a potential role of SIRT1 in metabolism was the induction of
SIRT1 in fasting tissues such as the brain, fat, kidney, muscle and liver [55]. Three different
mammalian sirtuins play a role in regulating metabolism; namely SIRT1, SIRT3 and SIRT4.
First, SIRT1 plays a role in the regulation of hepatic gluconeogenesis by potentiating FOXO1
activity in hepatocytes to direct glucose metabolism towards gluconeogenesis [84]. In addition
SIRT1 interacts with and deacetylates PGC1- , thereby repressing glycolysis and promoting
gluconeogenic gene expression. Furthermore, increased NAD+ and pyruvate levels in fasting
liver results in SIRT1 mediated upregulation of PGC1- [255]. By regulating PCG1- , SIRT1
also regulates mitochondrial function and metabolic homeostasis resulting in increased oxygen
consumption in muscle fibers and induced oxidative phosphorylation and mitochondrial
biogenesis [174,255].
SIRT3 increases cellular respiration and production of reactive oxygen species by
decreasing mitochondrial membrane potential [273]. SIRT3 also induces mitochondrial genes
such as PCG1- , UCP2 and COX II and IV and ATP synthetase. In mammals, acetate from diet
or endogenous reactions is converted to acetyl CoA in the cytoplasm by AceCS1 (acetyl-CoA
synthetase) and in the mitochondria by AceCS2. AcetylCoA is a small molecule that is critical in
fatty acids and amino acids synthesis. It has been documented that SIRT1 and SIRT3 deacetylate
AceCS1 and 2, respectively, thereby activating these enzymes [110,269]. Yet another sirtuin,
SIRT4, has been shown to regulate amino-acid stimulated insulin secretion in pancreatic -cells
[109]. SIRT4 also regulates glutamate dehydrogenase (GDH) by mono-ADP-ribosylation,
thereby inhibiting GDH and slowing the conversion of glutamate into -ketoglutarate.
The up-regulation of SIRT1 in response to fasting in white adipose tissue (WAT)
suggested that SIRT1 might be able to regulate fat synthesis and/or release. Soon it was shown

16
that SIRT1 interacts with PPAR- and plays a role in fat metabolism by regulating adipogenesis
and fat storage [241]. Furthermore, SIRT1 also regulates the levels of the adipocyte derived
hormone adiponectin by acting through FOXO1 [247].
1.1.3 Sirtuins in aging pathways
One of the early events in the discovery of SIRT1 as a lifespan regulator was a genetic screen in
yeast that showed that SIRT1 (yeast SIR2) is a determinant of yeast replicative lifespan, which
measures the number of cell division a mother cells can undergo [155]. Later on it was shown
that increasing dosage of SIRT1 gene extends lifespan, whereas inactivation of SIR2 leads to
shortening of lifespan [149]. In yeast, accumulation of extra-chromosomal rDNA circles (ERCs)
leading to enlarged nucleoli, cell cycle arrest and cellular senescence are considered to be the
cause of aging [278]. SIR2 represses recombination at the rDNA locus and prevents generation
of ERCs, thus slowing down the aging process [149].
The regulation of lifespan by SIRT1 has been shown to be conserved in a wide range of
organisms. In C.elegans, the worm SIRT1 homolog, SIR2.1, regulates life span through a
pathway that is dependent on DAF16 (dauer formation protein 16), a Foxo protein homolog in
worms which is a downstream target of the insulin/IGF pathway. C.elegans carrying a
chromosome duplication containing SIR2.1 exhibit up to a 50% increase in lifespan [294].
However, the worm SIR2.1 does not regulate the insulin/IGF-1 pathway. Instead SIR2.1
associates with a class of scaffolding proteins, 14-3-3, which direct SIRT1’s interaction with
DAF16 and transcriptional activator of DAF16 target genes in a insulin/IGF-independent manner
under stress conditions, suggesting multiple pathways by which SIR2.1 may regulate lifespan in
worms [308]. Similarly, in the fly, Drosophila melanogaster, an extra copy of the dSir2 gene

17
causes the flies to live approximately 18-29% longer [256]. SIR2 is believed to mediate
longevity in flies through a pathway related to caloric restriction.
While a direct role of the mammalian sirtuins in increasing longevity has not yet been
shown, a growing list of evidence suggests that sirtuins may be evolutionarily conserved as
lifespan regulators in mammals too. Initially, the mammalian sirtuins were believed to play a role
in aging by regulating oxidative and genotoxic stress. However, increasing evidence suggest that,
in the complex mammalian system, sirtuins may affect aging by regulating multiple independent
processes such as glucose homeostasis, insulin secretion, fat metabolism and stress resistance
[27,34,55,198,216,217,241,255,302,305]. Some recent reports have attempted to examine the
direct effects of SIRT1 in mammalian tissue and organ longevity. Using transgenic mice with
heart-specific over-expression of SIRT1, it was shown that mild to moderate expression of
SIRT1 retards aging of the heart and induces resistance to oxidative stress and apoptosis,
suggesting that SIRT1 could retard aging and confer stress resistance to the heart in vivo at low
to moderate doses [2]. Caloric restriction and leanness is associated with increased longevity in
organisms ranging from yeast to mammals indicating the role of adipose tissue in lifespan. It has
been documented that decreased adiposity in fat specific insulin receptor knock out (FIRKO)
mice leads to increased lifespan. Interestingly, SIRT1 plays a critical role in fat storage and
adipogenesis in mammals, thereby linking adipose regulation of longevity to SIRT1 [241,247].
In the last couple of years, a direct role of SIRT1 in regulating the aging phenotype has emerged.
First, it was shown that DeltaNp63alpha-mediated down-regulation of SIRT1 results in
accelerated aging phenotype in the mouse [283]. Soon after, SIRT1 was shown to modulate
premature senescence-like phenotype in human endothelial cells [231]. Resveratrol, an activator
of SIRT1 was shown to improve health and survival of mice on high calorie diet [13]. Also,

18
SIRT1 has been documented to modulate insulin like growth factor (IGF) signaling in mice by
increasing expression of the IGF binding protein IGFBP1, a secreted modulator of IGF function.
This is interesting because the insulin/IGF pathway has been documented to play a role in
lifespan in worms [183]. Thus, even though the exact mechanism by which SIRT1 may regulate
lifespan in mammals is still not clear, a growing list of evidence indicates an extensive and direct
participation of SIRT1 in the aging pathways in mammals.
1.1.4 Sirtuins in caloric restriction
Caloric restriction (CR) is a dietary regime in which an organism is provided with at least 20%
fewer calories than it would naturally consume ad libitum, while maintaining adequate nutrition
[207]. CR has been shown to increase the lifespan of a very wide range of organisms such as:
yeast, fruit flies, worms, crustaceans, spiders and rodents [10,134,146,175,200,310]. The role of
CR in lifespan in such a diverse group of organisms suggests that the mechanism by which CR
regulates longevity is an ancient and evolutionarily well conserved pathway. CR has been shown
to increase longevity by retarding age-related deterioration such as insulin resistance, collagen
inelasticity, and reduced immune and neurological functions, thereby delaying onset of age-
related diseases, such as metabolic syndrome, cancer, auto-immune and neurological disorders
[12]. Evidence now suggests that CR may show age-related benefits in primates indicating its
potential role in lifespan extension by reducing aging symptoms [204]. SIRT1 dependence on
NAD+ for its catalytic activity makes SIRT1 a potential player in mediating CR responses to
lifespan. The role of sirtuins in regulating CR was first demonstrated in the yeast Saccharomyces
cerevesiae where lifespan extension by moderate CR (0.5% compared to normal 2%) was
abrogated in strains that were mutated in the SIR2 or NPT1 (nicotinate

19
phosphoribosyltransferase 1) gene [189]. However, while SIR2 was required for lifespan
extension in response to moderate CR, under severe CR (0.05 % glucose), lifespan extension is
believed to be regulated by the TOR (target of rapamycin) pathway [150].
The SIR2 orthologs in C. elegans and D. melanogaster are involved in CR-induced
lifespan extension in these organisms [256,308]. In mammals, CR elicits a complex set of
physiological changes that are linked to healthier and longer lifespan, such as lower blood
glucose, triglycerides, cholesterol and insulin levels, lower body fat, decreased body weight and
increased physical activity along with increased insulin sensitivity and glucose tolerance [168].
Evidences suggest that most of these changes are potentially regulated by mechanisms in which
SIRT1 plays a role. For example, SIRT1 knockout mice fail to show increased physical activity,
even though they show some metabolic changes triggered by CR diet [42]. Secondly, SIRT1
over-expression in adipocytes results in decreased adipogenesis whereas knocking down SIRT1
enhances it [241]. Also, -cell specific SIRT1-overexpressing transgenic mice show improved
glucose tolerance and enhanced insulin secretion in response to glucose challenge [217].
Furthermore, SIRT1 regulates gluconeogenesis by deacetylating and activating PGC1- .
Most recently, experiments using SIRT1 over-expressing transgenic mice displayed some
phenotypes similar to mice on a calorie-restricted diet such as leaner body mass than littermate
controls, higher metabolic activity, reduced blood cholesterol, adipokines, insulin and fasted
glucose levels and higher glucose tolerance. Furthermore, transgenic mice performed better on a
rotarod challenge and also showed a delay in reproduction. These findings suggest that increased
expression of SIRT1 in mice elicits beneficial phenotypes that may be relevant to human health
and longevity [26]. Although the direct role of SIRT1 in CR mediated lifespan extension has not

20
yet been proven in mammals, its involvement in fat storage, glucose homeostasis and insulin
secretion places SIRT1 as a potential central regulator of CR mediated longevity in mammals.
1.1.5 Sirtuins in insulin / IGF-signaling
In the past decade, genetic analysis has revealed a lot about the pathways involved in aging. One
of the better characterized pathways that have emerged to be a prominent player in aging is the
Insulin/Insulin-like growth factor (IGF-1) signaling pathway. A single gene mutation in the IGF-
signaling pathway led to increased lifespan extension in worms, flies and mice, indicating an
evolutionarily conserved hormonal regulation of the aging process. The insulin/IGF-1 signaling
pathway is nutrient activated and decreased signaling through this pathway has been shown to
increase lifespan in C.elegans and mice [1,156,157]. Interestingly, sirtuins have shown an
evolutionarily conserved role in modulating insulin signaling. The SIRT1 orthologs in worms
and mice have been shown to modulate insulin/IGF-1 signaling by interacting through the
Forkhead proteins, DAF16 and FOXO in C.elegans and mice, respectively.
In C.elegans, the SIRT1 ortholog, Sir2.1 extends worm lifespan through the forkhead
transcription factor Daf-16 (homolog of mammalian FOXO) pathway. Loss of function of the
Daf2 (insulin receptor substrate, IRS, in mammals) or AGE1 (phosphoatidyl-inositol-3-kinase,
PI3-K, in mammals) has been shown to extend the worm lifespan [160,213]. The long lived
mutants require Daf-16 to be in the nucleus to activate target gene expression necessary for dauer
formation (a larval developmental state of growth arrest induced upon food limitation).
Activation of Daf2/AGE1 signaling phosphorylates and activates Akt, which then sequesters
Daf16 in the cytoplasm resulting in its inactivation [188,228]. The Sir2.1 duplication that results
in extended worm lifespan fails to do so in strains with mutated Daf-16. In addition, Sir2.1

21
duplicated strains do not further increase lifespan of the Daf-2 mutants, indicating that extra
copies of Sir2.1 promote longevity through the Daf-2/Daf-16 pathway [294]. Recently, it has
been documented that Sir2.1 physically interacts with Daf-16, and the scaffold protein 14-3-3
facilitates this interaction [17,307], emphasizing Sir2.1’s role in worm insulin/IGF-1 signaling
pathway.
The drosophila ortholog of SIRT1, dSir2, is also believed to play a role in the fly lifespan
extension by regulating the insulin/IGF-1 pathway. It has been shown that dSir2 mutant flies can
no longer show extended lifespan under calorie-restriction (CR), indicating that Sir2 extends fly
longevity by acting through CR. Interestingly, the Drosophila histone deacetyalse, Rpd3, which
negatively regulates dSir2 expression is down-regulated by CR. Also, long-lived Rpd3 mutant
flies show an increased dSir2 expression. Furthermore, flies deficient in CHICO, the drosophila
homologue of the mammalian insulin receptor substrate (IRS), show a significant increase in
lifespan. Recent findings have shown that activation of dFOXO in fly brain or fat body extends
longevity and inhibits the endogenous insulin-dependent signaling in the fat body
[54,96,130,257]. Thus, CR and insulin signaling have both been implicated in fly lifespan
extension. Although dSir2 plays a role in CR-mediated lifespan in flies, its role in the
insulin/IGF-1 signaling pathway potentially through dFOXO has not yet been proven directly.
The role of insulin/IGF-1 signaling pathway in extending mammalian lifespan has been
studied in insulin-like growth factor receptor deficient (IGF-R +/-) mice. Unlike IGF-R-/- mice,
which did not survive, IGF-R+/- mice with reduced IGF-R levels, showed longer lifespan more
resistance to oxidative stress than IGF-R+/+ littermates. The long lived IGF-R +/- mice also
exhibited low Akt kinase activity suggesting an increase in FOXO activity similar to the Daf-16
mediated longevity pathway in C.elegans. Furthermore, mice with inactivated insulin receptor in

22
adipose tissue also live longer and are protected against age-related obesity and subsequent
metabolic abnormalities [23,126,241,255].
The role of mammalian SIRT1 in regulating the insulin/IGF-1 pathway is believed to be
through the FOXO protein, which is regulated by deacetylation by SIRT1. Reduced insulin
signaling increased FOXO1 activity and lifespan in mice [1,90,183]. SIRT1 and FOXO1 have
been shown to physically interact. It has been demonstrated that SIRT1 can deacetylate FOXO1
in vivo, thereby either reducing or potentiating FOXO1 transcriptional activity depending on the
context, as determined by its effects on the genes encoding IGF binding protein-1 and
phosphoenolpyruvate carboxykinase [63,84,90,183]. Fasting (or CR) and resveratrol are known
to increase SIRT1 activity, which then modulates FOXO activity, thereby mediating insulin
signaling dependent effects on aging. Interestingly, Cohen et al. have demonstrated that CR-
induced SIRT1 activation could be attenuated by IGF-1, suggesting why a reduction or defect in
IGF-1 signaling could be beneficial to cell survival and lifespan extension [55]. Recently, it has
been shown that treatment of rat hepatoma cells and HEK 293 cells with either insulin or IGF-1
lowers SIRT1 levels and the effects of these two ligands are additive. These results suggest that
insulin/IGF-1 signaling can potentially oppose the cell survival effect of SIRT1, activated in the
aging related metabolic context of caloric restriction.
1.2 ROLE OF SIRT1 IN REGULATING MAMMALIAN AGING
While SIRT1 orthologs in lower organisms have been shown to play a direct role in longevity,
whether or not sitruins regulate human longevity has not yet been proven. The cellular model for
aging, which assays cellular senescence as a manifestation of aging, has shown a positive role of

23
SIRT1 in regulating mammalian aging. Senescence is a process in which cells undergo
permanent cell-cycle arrest and characteristic morphological changes. p53, which is deacetylated
and inactivated by SIRT1, plays a pivotal role in cellular senescence, thereby indicating a
positive role of SIRT1in decelerating cellular senescence [198,302]. Consistent with this, over-
expression of SIRT1 in mouse embryonic fibroblasts (MEFs) inhibits p53 acetylation and
premature senescence induced by promyelocytic leukemia protein (PML) oncogene [178]. Also,
SIRT1 inhibitor, sirtinol has been shown to trigger senescence in human cancer cells [232].
Paradoxically, SIRT1 has also been shown to induce replicative senescence as shown in SIRT1
deleted MEFs that show extended replicative lifespan due to failure to upregulate p19(ARF) and
p53 in response to chronic oxidative stress [53]. These observations suggest that SIRT1 may
regulate senescence differently depending on stress conditions and inducing agents. Recently,
SIRT1 has been shown to protect against stress-induced senescence-like phenotype in human
endothelial cells by acting through p53 [231]. Also, down-regulation of SIRT1 was shown to
accelerate an aging-like phenotype in mouse [283].The other positive role of SIRT1 in promoting
longevity in the cellular model for aging has been shown to be through the Forkhead proteins.
SIRT1 physically binds and deacetylates the FOXO proteins thereby regulating their activity. It
has been shown that SIRT1’s regulation is required for FOXO mediated cellular stress response
to protect cells from oxidative insults.
Apart from SIRT1’s role in cellular model of aging by regulating stress resistance,
growing evidence suggest SIRT1’s role in mammalian aging at a systemic level. The critical
evidences that implicate SIRT1 in mammalian aging pertain to SIRT1’s role in metabolic
regulation and protection against aging-related diseases such as cancer, diabetes and neurological
disorders.
24
1.2.1 SIRT1 and glucose metabolism
Glucose metabolism is a major regulator of cellular energy state and a critical component
of the physiology of CR. Organism with CR mediated longevity show increased insulin
sensitivity and corresponding reduction in blood glucose and insulin levels. Up-regulation of
SIRT1 in CR or fasting mammalian tissues is not surprising as SIRT1 has been shown to regulate
glucose homeostasis by multiple mechanisms in two different tissues, namely insulin secretion in
the pancreas and glucose metabolism in the liver.
Two independent studies have implicated a role for SIRT1 in regulation of insulin
secretion in the pancreas. SIRT1 is constitutively expressed in the endocrine cells of the islets of
Langerhans. Moynihan et al. have shown using a -cell specific SIRT1 over-expressing
(BESTO) mice that these animals have increased glucose tolerance as compared to wild type
animals [27,217]. The BESTO mice showed increased insulin secretion in response to glucose
and conversely, SIRT1-/- mice or their isolated islets showed blunted insulin secretion. Also,
they showed that SIRT1 binds to the promoter and represses transcription of the gene encoding
the mitochondrial uncoupling protein UCP2. UCP2 uncouples mitochondrial respiration from
ATP production and reduces the ability of -cells to convert glucose to ATP[40]. Thus, by
blocking UCP2 function, SIRT1 promotes efficient energy generation. Consistent with this,
BESTO mice show higher ATP production while islets from SIRT1 knock out mice do not show
any increase in the ATP levels in response to glucose. In starved wild-type mice, UCP2 protein
levels increased in the pancreas compared to ad libitum fed animals [27]. Interestingly,
decreased SIRT1 activity due to decreased NAD+ production in fasting pancreas could increase

25
UCP2 transcription. This suggests that NAD+ metabolism may provide a regulatory role for
modulating insulin secretion in -cells and glucose metabolism.
Another organ important in maintaining glucose homeostasis in response to changing
nutrient conditions is the liver. During fasting, liver induces gluconeogenesis to supply other
tissues with glucose. Several recent reports have provided evidence that suggest that this nutrient
response in the liver is under the tight control of SIRT1. SIRT1 has been shown to regulate
gluconeogenesis in liver by two different mechanisms, one involving the FOXO protein and the
other through PCG1- . Under stress conditions, SIRT1 interacts with and deacetylates FOXO1,
promoting FOXO1 dependent transcription of gluconeogenic genes, thereby directing glucose
metabolism from glycolysis to gluconeogenesis [84]. In addition, SIRT1 also interacts with and
deacetylates PCG1- at multiple lysine residues, thereby increasing gluconeogenic gene
transcription via interaction with hepatocyte nuclear factor 4 , with concomitant repression of
glycolytic genes [255]. SIRT1 up-regulation of PCG1- in fasted liver is correlated with increase
in NAD+ and pyruvate, suggesting metabolic control of SIRT1 catalytic activity.
Recently, a direct regulation of insulin action by SIRT1 through its actions to control
PTP1B gene expression has been demonstrated [286,323]. It was shown that SIRT1 knockdown
or inhibition impairs insulin signaling and insulin-stimulated glycogen synthesis, whereas SIRT1
over-expression ameliorates existing insulin resistance and impaired glucose transport in cultured
cells. Sun et al. showed that these effects are mediated in part by silencing PTP1B expression
through histone H3 deacetylation. Interestingly, SIRT1 over-expression in non-insulin-resistant
cells does not affect insulin signaling or glucose transport or markedly affect PTP1B expression,
suggesting that SIRT1's action on insulin signaling and PTP1B is minimal in insulin-sensitive
states.

26
1.2.2 SIRT1 and lipid metabolism
Adipose tissue plays an important role in mediating metabolic control of aging. The primary
depot for fat in mammals is the white adipose tissue (WAT). It is the major site of triglyceride
storage which acts as an important energy source when glucose is scarce in the blood. During
fasting or starvation, triglycerides (TG) from the adipose tissue are mobilized to give free fatty
acids (FFA) to be used by other tissues for energy production [80]. The impact of adipose tissue
on longevity in animals was shown by adipose tissue-specific ablation of IGF receptor which
resulted in about 18% longer lifespan in mice [23].
Interestingly, SIRT1 is up-regulated in CR animals, which show leanness caused by
decreased insulin signaling in fat, which in turn causes decreased fat synthesis and increased
mobilization of fat deposits for release into circulation. An important insulin responsive factor in
WAT is the transcription factor PPAR . PPAR induces fat synthesis and WAT differentiation in
response to insulin signaling. SIRT1 interacts with and represses its transcriptional activity. The
nuclear receptor corepressor (NCoR) and thyroid hormone receptor (SMRT, silencing mediator
of retinoid and thyroid hormone receptor) cofactors for PPAR . SIRT1’s interaction with the
PPAR cofactors leads to its recruitment to the PPAR and the adipose tissue-specific fatty acid
binding protein (aP2) gene promoters. This results in PPAR autoregulatory synthesis and
inhibition of PPAR mediated expression of CCAAT enhancer-binding protein and , and aP2
[241]. SIRT1 over-expression and depletion experiments in mammalian cells have shown that
levesl of SIRT1 expression can control fat deposition. Another mechanism by which SIRT1 may
play a role in lipid metabolism is believed be through FOXO1, as SIRT1 regulates FOXO1 by
deacetylation [70]. Adiponectin, an adipocyte-derived hormone whose plasma concentration

27
mostly correlates inversely with adiposity, is regulated by SIRT1 through FOXO1 regulation.
FOXO1 forms a transcriptional complex at the mouse adiponectin promoter with C/EBP
(CCAAT/enhancer-binding protein ). SIRT1 deacetylates and enhances its interaction with
C/EBP , thereby increasing adiponectin concentrations [247].
Furthermore, the SIRT1 activator resveratrol has been shown to reduce fat accumulation
and increase free fatty acid release, whereas SIRT1 inhibitor, nicotinamide (NAM) inhibits FFA
release [127,241]. Consistent with this, adipose tissue from SIRT1+/- mouse are less responsive
to FFA release when compared to wild-type adipocytes [241]. Also, the SIRT1+/- animals
exhibit lower levels of blood FFA following fasting or -adrenergic stimulation. Thus, SIRT1
inhibits insulin signaling in fat by repressing PPAR activity, thereby reducing adipocyte
differentiation and increasing FFA release, potentially by suppressing expression of aP2.
Yet another role of SIRT1 in regulating fat metabolism was shown last year when
Hallows et al. demonstrated that SIRT1 activates the mammalian acetyl CoA synthetase 1
(AceCs-1) via deacetylation. This is important because AceCS-1 catalyzes the synthesis of
AceCoA, a key molecule in mitochondrial oxidation and lipid synthesis. SIRT1’s regulation on
AceCS-1 indicates that SIRT1 may modulate lipid metabolism by regulating intracellular acetyl-
CoA levels [110].
1.2.3 SIRT1 and cancer
Most cancers are now recognized as an age associated disease because of its prevalence with
increasing age. SIRT1 has been associated with many tumor suppressor proteins. While on one
hand it deacetylates and suppresses the tumor suppressor p53 resulting in reduced p53 mediated

28
apoptosis in response to genotoxic stress, on the other hand, SIRT1 is required for the expression
of the tumor suppressor p19(ARF), which promotes p53 stability, thereby facilitating senescence
in response to chronic oxidative stress [53,198,302]. DNA damage induces SIRT1 expression,
which inhibits cell death and induces stress responses by deacetylation and modulating activities
of p53, forkhead box O (FOXO), E2F transcription factors and Ku autoantigen
[34,55,198,216,302,305]. In theory, anti-apoptotic properties of SIRT1 could enable damaged
cells to escape surveillance making them prone to cancer, thus indicating a potential role of
SIRT1 in tumorignesis. Indeed, SIRT1 was found to participate in several pathways that are
involved in cancer and has been found to localize at aberrantly silenced, but not at the active
promoter of tumor suppressors genes in cell lines [246]. It has been shown that the tumor
suppressor HIC1 (hyper-methylated in cancer-1) directly regulates SIRT1 to modulate p53-
dependent DNA-damage response [48]. HIC1, which regulates SIRT1 expression, is silenced in
certain cancers resulting in up-regulation of SIRT1 and carcinogenesis. Nuclear translocation of
FHL2 (four and a half LIM2), which is expressed in prostate cancer cells, correlates with the
progression of prostate cancer. It has been shown that SIRT1 is also involved in mediating the
anti-apoptotic effects of FHL2 through FOXO1 decaetylation, thereby promoting cancer [316].
Similarly, in hepatocellular carcinoma cells (HepG2) SIRT1 facilitates the aberrant expression of
AFP ( -fetoprotein) which serves as a diagnostic marker of hepatocellular carcinoma, by
deacetylating p53. It was shown that the cell-cycle and apoptosis regulator p33ING1b
, binds SIRT1
and inhibits its ability to deacetylate p53 to prevent carcinoma [152]. Furthermore, SIRT1
regulates the cell-cycle arrest and apoptotic activities of oncogene BCL6, which is implicated in
the pathogenesis of B-cell lymphomas [18]. Consistently, SIRT1 inhibitors, cambinol and sirtinol

29
induces apoptosis and senescence-like growth arrest respectively, in human cancer cell lines
MCF7 and H1299 [121,232].
To reconcile the discrepancy between the tendency of SIRT1 in promoting cancer and its
potential to mediate CR, which reduces cancer risk, there seems to be certain compensatory
SIRT1-dependent cancer-prevention pathways. For example, SIRT1 plays a pro-apoptotic role
by suppressing NF-κB activity [94,320]. It has been shown that the breast cancer associated
protein, BCA3, when neddylated (modified with NEDD8) interacts with SIRT1 to suppress NF-
κB activity, thereby sensitizing breast and prostate cancer cells to TNF- induced apoptosis [91].
Abnormal androgen receptor function has been associated with pathogenesis and progression of
human prostate cancer. SIRT1 has been shown to interact with and preferentially deacetylate
lys630 in the lysine motif of the androgen receptor, thereby repressing its oncogenic signaling
and inhibiting prostate cancer cells from growing in response to androgen dihydrotestosterone
[88].
1.2.4 SIRT1 and neuroprotection
The heart, brain and the central nervous system of mice have been identified as sites of high
SIRT1 expression during embryogenesis and in adult animals [262]. In the nervous system,
SIRT1 is predominantly present in the neuronal bodies [322]. SIRT1 knock-out mice have shown
abnormalities in the central nervous system such as thinner retinal cell layers, indistinguishable
inner and outer segments of photoreceptor cells and abnormal multiple retinal involutions [49].
The first evidence of SIRT1’s role in neuroprotection came from a study on Wallerian
degeneration slow mice (Wlds) mice that were protected from axonal degeneration induced by
physical or chemical injury. In this study, Milbrandt et al. showed that an NAD+ biosynthetic

30
enzyme, Nmnat (nicotinate mononucleotide adenylyltransferase) is primarily responsible for
protection against axonal degeneration in Wlds mice. Furthermore, using neuronal explants from
dorsal root ganglia, they showed that protection by Nmnat is through activation of SIRT1 by
increased nuclear NAD+ [7,16,56].
SIRT1 has also been shown to protect neurons against -amyloid induced toxicity by
inhibiting NF-κB signaling in microglia [46]. Furthermore, SIRT1 over-expression or NAD+
treatment enhances -secretase activity, which cleaves amyloid precursor protein within the A
domain and attenuates A -peptide production. Interestingly, elevated -secretase activity has
been detected in brain specific SIRT1 transgenic mice. SIRT1 has been shown to down-regulate
the serine/threonine ROCK1 (Rho kinase) expression in neurons, resulting in induction of -
secretase [248]. Since, amyloidogenic A peptide toxicity is strongly associated with
Alzheimer’s disease (AD), these evidences suggest a role of SIRT1 in ameliorating AD through
its neuroprotective functions. Interestingly, CR prevents AD prone mice from developing -
amyloid neuropathology, and increases SIRT1 and NAD+/nicotinamide ratios in the brain,
suggesting that the mechanism by which CR protects neurons against -amyloid deposition
could be through modulation of SIRT1. Studies have indicated that SIRT1 may also play a
protective role in Huntington’s disease. It was shown that resevratrol reduces, whereas sirtinol
induces death of neuronal cells in mammalian cell culture model of Huntington’s disease. Also,
overexpression of the worm Sir2.1 rescues neuronal dysfunction phenotype in C. elegans model
for Huntington’s disease [236].
Apart from protecting against cell death, SIRT1 can protect neurons through yet another
mechanism. Increasing evidence show that maintenance of mitochondrial number and function is
critical to neuronal functions, and loss of mitochondria causes many neurodegenerative diseases

31
[15]. PGC-1 , one of the downstream regulators of SIRT1, acts as a master regulator of
mitochondrial number and function, and is highly neuroprotective. PGC-1 null mice show more
sensitivity to neuronal loss by reactive oxygen species producing neurotoxic compounds and
increasing PGC-1 levels protects neurons against oxidative-stress-induced death [284]. Since
SIRT1 is known to regulate PGC-1 activity, it seems likely that SIRT1’s neuroprotective
actions are partly through regulation of PGC-1 activity.
1.2.5 SIRT1 and other diseases
SIRT1 exhibits cardio-protective actions by protecting against cardiac hypertrophy, which is a
major cause of heart failure. Heart failure is caused by inability of the heart to pump blood
efficiently, which begins with cardiac hypertrophy, followed by increased apoptosis resulting in
organ failure. SIRT1 has been shown to protect primary cultured myocytes from programmed
cell death induced by serum starvation or activation of PARP-1, in a p53-dependent way. Using
transgenic mouse with heart-specific over-expression of SIRT1, it was recently shown that mild
to moderate expression of SIRT1 retards aging of the heart by inducing resistance to oxidative
stress and apoptosis, whereas a high dose of SIRT1 induces cardiomyopathy [2,3,242].
Additionally, SIRT1 decetylates histone variant H2A.Z, a factor known to promote cardiac
hypertrophy, thereby facilitating ubiquitin-mediated degradation of H2A.Z and protecting
against heat failure [45].
SIRT1 also shows protective functions in kidney diseases. For example, SIRT1
diminishes mesangial cell apoptosis induced by oxidative stress through inhibiting p53, which
prevents glomerular apoptosis in kidney diseases [170]. SIRT1 also deacetylates Smad7 resulting
32
in enhanced ubiquitin-dependent proteosomal degradation of Smurf1 (Smad ubiquitination
regulatory factor-1), thereby protecting glomerular mesangial cells from TGF dependent
apoptotic signaling which is mediated by Smad7 [171].
SIRT1 plays a role in HIV replication by regulating Tat activity. Tat (transactivator of
transcription) is a HIV-1 protein that is essential for transcriptional activation of integrated
provirus. Without Tat activity, HIV-1 viral replication remains compromised because of aborted
transcription due to inefficient elongation. SIRT1 deacetylates and activates the Tat protein,
thereby increasing viral transcription [233].
1.3 SIRT1 ACTIVATORS
The apparent role of SIRT1 and its orthologs in extending longevity has prompted searching for
compounds that can activate SIRT1 since such compounds can potentially extend lifespan in
absence of CR or genetic alteration. About four years ago, the first such molecule, resveratrol, a
compound produced by plants in response to stress was discovered [127]. Since then many
polyphenol activators of SIRT1 have been discovered such as quercetin, fisetin, iso-
liquiritigenin, piceatannol and butein. These compounds are collectively called the Sirtuin
Activating Compounds or STACs.
Resveratrol, a polyphenolic compound found naturally in grape skin, and a variety of
plants products such as fruits and nuts, was initially reported to increase the catalytic activity of
SIRT1 in vitro. Subsequently, it was shown to mimic CR and increase lifespan in yeast, worms,
fruit flies and fish [313]. The mechanism by which resveratrol functions is not yet clear.

33
However, in S.cerevisiae, C. elegans and D. melanogaster, the effect of resveratrol is SIRT1
dependent and is not further extended by CR, indicating that it may act through CR pathway.
Resveratrol has been shown to modulate a variety of processes in mammals in a SIRT1-
dependent manner such as; neuroprotection, differentiation, tumor suppression and inflammation
[5,13,173]. Consistently, resveratrol effects a number of diseases in mammals namely, cancer,
heart diseases, brain damage, hearing loss, anorexia and injuries to tissues [14]. Similar to lower
organism, it also elicits CR mimicking physiological changes in mammals, for example it
improves tissue pathology and endurance, increases mitochondrial biogenesis, insulin sensitivity
and decreases fat accumulation, blood insulin and IGF-1 [13,174]. Recently, resveratrol has been
shown to increase the survival of high calorie fed mice by shifting its physiology towards
standard diet mice with increased mitochondria, lower blood glucose and insulin and a hepatic
gene expression profile matching the lean mice. This is consistent with the fact that increased
SIRT1 activity can increase PGC-1 activity. Also, mice fed with resveratrol show highly
deacetylated PGC-1 in multiple tissue, indicating a role of SIRT1 activity [174]. Furthermore,
resveratrol induced activation of mitochondrial function has been shown to be dependent on
SIRT1 mediated deacetylation of PGC-1 . Reseveratrol has also shown other effects mimicking
SIRT1 activation such as: promoting cell survival by decetylation of p53, inhibiting adipocyte
differentiation by suppressing PPAR- , rescuing cells polyglutamine toxicity and sensitizing
cells to TNF- induced apoptosis by inducing NF-κB deacetylation [127,236,241,320].
However, a couple of recent reports have shown that resveratrol modulates certain pathways
independent of SIRT1. It was shown that resveratrol inhibits insulin response by disrupting
insulin-induced IRS protein complex and this action is independent of SIRT1. In another report

34
resveratrol was shown to stimulate AMPK activity in neurons independent of SIRT1 and
dependent on LKB1 [66,325].
1.4 SIRT1 INHIBITORS
The biological functions of SIRT1 have triggered interest in the development of SIRT1
activators and inhibitors. Silent information regulator 2 (Sir2) enzymes catalyze NAD+-
dependent protein/histone deacetylation, where the acetyl group from the lysine epsilon-amino
group is transferred to the ADP-ribose moiety of NAD+, producing nicotinamide and the novel
metabolite O-acetyl-ADP-ribose. Soon enough it was shown that physiological concentrations of
nicotinamide noncompetitively inhibit both Sir2 and SIRT1 in vitro. Furthermore, the degree
of
inhibition by nicotinamide (IC50 < 50 µM) was shown to be equal to or better than the most
effective known synthetic inhibitors of this class of proteins. It was proposed that nicotinamide
inhibits deacetylation by binding to a conserved pocket adjacent to NAD
+, thereby blocking
NAD+ hydrolysis. [21]. Recently, it was demonstrated that nicotinamide inhibition is the result of
nicotinamide intercepting an ADP-ribosyl-enzyme-acetyl peptide intermediate with regeneration
of NAD+ (transglycosidation) [139].
Several chemical inhibitors of SIRT1 are also used frequently. Treatment with sirtinol,
splitomicin, suramin, NF023 and NF279, at a low µM level has been shown to inhibit SIRT1
effectively. Recently, a more potent inhibitor was described, EX527 [220,243], which is
approximately 1000 fold more potent than nicotinamide.

35
1.5 MOTIVATION AND OVERVIEW
SIRT1, the human homologue of the yeast SIR2 protein, has been shown to play a role in a wide
range of cellular processes. While in lower organism such as yeast, worms and flies, increasing
the copy number of SIRT1 gene extends lifespan, in mammals it shows many physiological
changes that is relevant to cell survival and longevity. SIRT1 has been shown to mimic caloric
restriction associated physiological changes that relates to a longer and healthier lifespan. In the
past one decade, much has been discovered with regards to SIRT1’s role in various cellular
processes ranging from regulation of gene expression, stress resistance and endocrine signaling
to metabolism. SIRT1 activators have also shown properties of promoting cell survival and
delaying aging. However, a lot remains to be uncovered with regards to the mechanism or
mechanisms by which SIRT1 promotes longevity in mammals. In lower organisms, such as S.
cerevisiae and C. elegans, SIRT1 has been demonstrated to function through the insulin/insulin
like growth factor (IGF-1) signaling pathway. However, the mechanism in mammals seems to be
much more complicated with SIRT1 influencing several signaling pathways, which may be
intricately regulated to impact mammalian longevity.
The goals of this study were to identify novel binding partners for SIRT1 and elucidate
their potential role in SIRT1 mediated effects on mammalian cell survival and longevity.
Specific aim one involved the identification of novel binding partners for SIRT1 using a yeast
two-hybrid system. Following identification of TLE1 as a binding partner for SIRT1, the
relevance of its association with SIRT1 was examined by analyzing its effect on SIRT1 mediated
regulation of NF-κB activity. Specific aim two involved verification of the association between

36
SIRT1 and eIF2 , the second binding partner identified in the yeast two-hybrid screening. The
biological relevance of this association was further investigated with regard to SIRT1 mediated
cellular stress response. Specific aim three pertained to investigating the potential role of SIRT1
in the mTOR pathway, which is involved in cellular growth and proliferation, thereby playing a
role in cancer.

37
2.0 SIRT1 INTERACTS WITH TRANSDUCIN-LIKE ENHANCER OF SPLIT-1 TO
INHIBIT NF-ΚB MEDIATED TRANSCRIPTION
Hiyaa Singhee Ghosh et al.
The work presented in this chapter has been published in The Biochemical Journal,
November 2007.

38
2.1 ABSTRACT
SIRT1 is a NAD+ dependent deacetylase that plays a role in cellular processes such as
transcriptional regulation, stress response, longevity and apoptosis. SIRT1 deacetylates histone
proteins and certain transcription factors such as p53, CTIP2, FOXO and NF-ĸB. To identify
potential SIRT1 interacting factors, we performed a yeast two-hybrid screen. The screen
identified Transducin like Enhancer of split 1 (TLE1) as a possible SIRT1-interacting factor
which was then confirmed by co-immunoprecipitation. TLE1 is a non-DNA binding co-repressor
for several transcriptional factors including NF-ĸB. We demonstrate by co-transfection assays
that SIRT1 and TLE1 both repress NF-ĸB activity. The catalytic mutant of SIRT1, SIRT1-
H363Y, and the N-terminal SIRT1 fragment (1-270a.a) also show similar repression activity,
suggesting that the deacetylase activity of SIRT1 may not be critical for its effect on NF-ĸB
activity. Furthermore, analysis in SIRT1 null murine embryonic fibroblasts and HeLa cells stably
expressing RNAi specific to SIRT1 or TLE1 demonstrate that both SIRT1 and TLE1 are
required for negative regulation of NF-ĸB activity. Taken together, these results suggest that the
interaction between SIRT1 and TLE1 is important for mediating repression of NF-ĸB activity.

39
2.2 INTRODUCTION
SIRT1, a NAD+-dependent deacetylase, is the human homolog of the yeast Sir2 protein
which plays a role in transcriptional regulation, cell cycle, differentiation, metabolism, DNA
damage response, apoptosis and longevity. SIRT1 is classified as a class III histone deacetylase
(HDAC-III), because of its dependence on NAD+ as a cofactor for its activity, as oppose to the
class I and II histone deacetylase that use zinc as a cofactor [122]. Accordingly, the SIRT1
deacetylase is not inhibited by the general histone deacetylase inhibitor trichostatin A, and
instead have its own specific inhibitors such as nicotinamide [69,181]. Other than deacetylating
histone proteins, such as H1, H3 and H4, SIRT1 also deacetylates a number of transcription
factors and other proteins. SIRT1 interacts with the bHLH repressor proteins, HES1, HEY2
[288] and the COUP-TF interacting protein 2 (CTIP2) [270], to confer transcriptional repression.
The other non-histone substrates of SIRT1 include p53, PCAF, MyoD, p300, Ku70, PPARγ and
PGC1 [28,34,89,218,241,255]. SIRT1 is believed to play a protective role under caused
genotoxic or oxidative stress conditions. SIRT1 regulates the Forkhead transcription factors,
Foxo1, 3 and 4 to regulate cellular resistance to oxidative stress [34,63,216,298,316]. SIRT1 also
increases cell survival to DNA damage and oxidative stress by inhibiting p53-mediated apoptosis
[302]. However, the role of SIRT1 deacetylase activity in regulating cellular stress response has
been controversial with reports that demonstrate that overexpression of SIRT1 or inhibition of its
catalytic activity didn’t affect cell viability in response to stress [282,302].
Nuclear factor ĸB (NF-ĸB) is a transcription factor that regulates the expression of a over
150 target genes majority of which participate in host-immune response and stress response
pathways [234]. Apart from immune induction of NF-ĸB, the various physiological stress
conditions that induce NF-ĸB activity are ischemia/reperfusion, liver regeneration and

40
hemorrhagic shock. Physical stress in the form of irradiation and oxidative stress to cells or ER
stress also induce NF-ĸB activity. NF-ĸB is also activated both by environmental stresses, such
as heavy metals or cigarette smoke, and by therapeutic drugs, including various
chemotherapeutic agents. Accordingly, a large variety of stress response genes, such as the
inducible nitric oxide synthase (iNOS) and cyclooxygenase-2 (COX-2) are in turn activated by
NF-ĸB. Because of its role mediating immune response and cellular stress response, NF-ĸB is
believed to relay the information of an imminent stress and at the same time enact a response by
promoting the transcription of genes whose products alleviate the stress condition.
The vertebrate Rel/NF-ĸB family is comprised of five proteins, c-Rel, RelA, RelB,
p105/NF-ĸB and p100/NF-ĸB, all of which are structurally related. To regulate the expression of
its target genes, these dimers bind to a set of related 10 bp DNA sites, collectively called ĸB
sites. The most common transcriptionally active NF-ĸB in mammals consists of a heterodimeric
protein complex p50-RelA (p65) which is specifically called NF-ĸB. In most cells, Rel/ NF-ĸB
transcription complexes are present in a latent, inactive state in the cytoplasm where they are
bound to an inhibitor (IĸB). One of the major step regulating NF-κB activity is removal of IκB
from NF-κB:IκB complexes, a processes that is regulated by controlling IκB degradation via
IKK-mediated phosphorylation. Various stimuli, such as mitogens, growth factors and cytokines
can rapidly activate these transcription complexes by freeing them from their inhibitor and
enabling them to translocate to the nucleus to regulate transcription. Posttranscriptional
modification of p65 is also considered critical for NF-ĸB activity. A number of kinases, such as
protein kinase A catalytic subunit (PKAc), casein kinase II (CKII), PKCζ, and IKK have been
shown to be directly associated with the cytosolic NF-κB:IκB complex, and implicated in p65
phosphorylation [95]. Furthermore, regulation of acetylation on p65 has been shown to be

41
critical for NF-ĸB activity, which further emphasizes the role of p65 phosphorylation in
regulating NF-κB activity, as histone acetylase (HAT) recruitment to p65 is dependent on its
phosphorylation [95]. It has been proposed that acetylation of p65 determines the efficiency of
its interaction with IκBα. Therefore, the acetylated p65 that enters the nucleus is refractory to
inhibition by IκBα, but following HDAC3 recruitment, the deacetylated p65 associates with
IκBα and is exported to the cytoplasm, downregulating NF-κB activity. Accordingly, members
of the histone deacetylases, HDAC1, HDAC2 and HDAC3, have been shown to regulate the
activity of NF-ĸB by deacetylating RelA/p65, increasing its association with IĸB and reducing
transcriptional activity. Acetylation of p65 at lysine residues 122 and 123 decreases DNA
binding affinity of the heterodimer, whereas acetylation at lysine residues 310 and 221 increases
DNA binding and impairs its association with IĸB [47]. Notably, SIRT1 has been reported to
repress NF-ĸB mediated gene expression by deacetylating the p65 subunit of NF-ĸB [320].
NF-ĸB activity is also regulated by members of transducin-like Enhancer of split1
(TLE1), a family of transcriptional repressors that are mammalian homologs of the Drosophila
Groucho protein family. The Groucho family includes three types of proteins. The larger
proteins such as Groucho and its mammalian homologs, transducin-like enhancer of split (TLE)
1 through 3, share five domain structures. These proteins exhibit a common feature including
an
amino-terminal glutamine-rich region (Q domain), a glycine/proline-rich region (GP domain), a
CcN domain containing a casein kinase II
site and nuclear localization sequence, a
serine/proline-rich region (SP domain), and COOH-terminal WD40 repeats [78,285].
Three of
these domains the Q, CcN, WD40 domains are most highly conserved. A shorter protein, the
human TLE4, contains all the domains except for the amino-terminal Q domain. Shortest
proteins in the Groucho family, which contain only the Q domain and the
GP domain, are

42
designated as AES or the Groucho-related gene (Grg) [201,212]. Significant homology is
observed in the Q domain
between AES and other Groucho proteins except for TLE4.
Drosophila Groucho protein and its mammalian homologs, TLEs, have been shown
to serve as
non-DNA binding corepressors for several transcription factors including the Hairy-related
proteins, Runt domain proteins, Engrailed, Dorsal, and lymphoid enhancer factor-1/T-cell factor.
The WD40 repeats in Groucho and TLEs appear to mediate protein-protein interaction with
relevant DNA-binding proteins, such as Engrailed and Hairy [38,71,147,237,295].
Figure 2.1 Structure/function relationships in the Gro/TLE family.
Functional domains of Gro/TLE corepressors. The conserved Q and WD-repeat domains are in color. The open
boxes represent the more flexible central regions in Gro/TLE proteins. Two separate regions, the GP and the SP
domains, are known to possess repression activity (marked by I and II). A pair of putative amphipathic α-helical
motifs are indicated by two lines at the top of the Q domain and are labeled AH1 and AH2.
Based on the findings that the active form of Gro is a tetramer and that Gro makes
specific contacts with the histone deacetylase Rpd3 as well as histones, a model has been
proposed for Gro-mediated transcriptional repression where in: after recruitment to the template
via a direct interaction with sequence specific DNA-binding transcription factors, the ability of
Gro to oligomerize together with the favorable interactions between Gro and histones results in
the nucleation of a Gro polymer that may spread along the DNA template. The template-bound
WD-repeats Q domain GP CcN SP domain
oligomerization protein-protein interactionnuclear
localization
WD-repeats Q domain GP CcN SP domain
oligomerization protein-protein interactionnuclear
localization

43
Gro-polymer then provides a high-affinity interface for the recruitment of key chromatin-
modifying factors, including the histone deacetylase Rpd3. These components may subsequently
serve to establish and/or maintain a transcriptionally silenced chromatin structure.
Several lines of evidence suggest that Gro-homologs in mammals may perform functions
in development and cell-fate determination that are homologous to those carried out by their
Drosophila counterparts. For example, the expression patterns of individual Gro/TLE family
proteins during mouse embryonic development are consistent with roles in segmentation, central
and peripheral neurogenesis, as well as epithelial differentiation [67,167,184]. In addition, TLE
proteins are temporally and spatially coexpressed with Notch as well as other members of the
Notch pathway consistent with possible roles in the multiple cell fate decisions governed by this
pathway [102]. Mammalian Gro/TLE proteins are also known to interact directly with Hairy-
related bHLH transcription factors in mammals — the so called HES (Hairy/Enhancer of split)
family of proteins [78,79,101]. The conserved carboxyl-terminal WRPW motifs in these HES
proteins are sufficient for both the recruitment of Gro/TLE corepressors and transcriptional
repression [79,101]. In addition, direct and functional associations have also been established
between the TLE corepressors and the mammalian counterparts of the Drosophila Tcf and Runt
proteins [9,133,185]. The Drosophila Groucho protein directly binds the Drosophila homolog of
NF-ĸB, Dorsal, and converts it from a transcriptional activator to a repressor
[71]. Similar to this,
the mammalian Groucho homologs, TLE1 and the Amino-terminal Enhancer of Split (AES)
have also been shown to physically interact with the p65 subunit of NF-ĸB to inhibit its activity
through an unknown mechanism [293].
In our study, we performed a yeast two-hybrid analysis to screen the human spleen
cDNA library for identifying potential novel binding partner for SIRT1 to elucidate the

44
underlying mechanism of SIRT1 in mediating cellular stress response and longevity. Our
analysis identified the Transducin like Enhancer of Split-1 (TLE1), as potential novel binding
partner for SIRT1 which was further confirmed in mammalian cells by co-immunoprecipitation.
As mentioned above, both SIRT1 and TLE1 play a role in regulating NF-κB activity. While
SIRT1 was suggested to deacetylate p65 to inhibit NF-κB activity , the mechanism by which
TLE1 repressed NF-κB activity was not elucidated. Hence, we investigated the association of
SIRT1 and TLE1 with regards to their role in regulating NF-κB activity. We demonstrate here,
that repression of NF-ĸB activity mediated by SIRT1 and TLE1 is enhanced when both the
proteins are overexpressed together. More significantly, neither SIRT1 nor TLE1 was able to
repress NF-ĸB activity in the absence of the other. Interestingly, our results also suggest that the
catalytic function of SIRT1 is not required for the repression of NF-ĸB activity. Thus, we
propose that the association between SIRT1 and TLE1 plays a critical role in mediating SIRT1
and TLE1 mediated repression of NF-ĸB activity and possibly the activity of other transcription
factors, potentially through a deacetylase independent mechanism.

45
2.3 MATERIALS AND METHODS
2.3.1 Cell culture
HeLa cells were purchased from American tissue culture consortium (ATCC) and cultured in
DMEM media (Dulbecco’s modified Eagle’s media, Cellgro # 10-013-CV) supplemented with
10% heat inactivated fetal bovine serum (FBS) and 100U penicillin, 100U streptomycin and
0.25 g/ml amphotericin B (antibiotic-antimycotic; GIBCO # 15240-062), Hepes buffer and
2mM L-glutamine. Cells were cultured at 370C, 19% O2 and 5% CO2. The SIRT1-wild-type and
SIRT1 null mouse embryonic fibroblasts were a gift from Dr. Michael McBurney, University of
Ottawa, Canada. These cells were also maintained in the DMEM growth media. SIRT1 MEFs
were cultured at 370C, 15% O2 and 5% CO2. Cells were harvested by treating cells with trypsin-
EDTA (Cellgro, # 25-053-Cl) for 2mins in 370C incubator. Cells were washed by re-suspending
cells in growth media and centrifugation at 5000g in a table-top centrifuge.
2.3.2 Construction of plasmids for yeast two-hybrid screen
A point mutation was carried out using QuikChange kit (Stratagene) to create an in frame
BamHI-SalI cloning site in the yeast expression vector pGBKT7 (Clonetech Laboratories) using
the primers: 5’-GGA GGC CGA ATT CCC GGG ATC CGT CGA CCT GCA G-3’ and 5’-CTG
CAG GTC GAC GGA TCC CGG GAA TTC GGC CTC C-3’. 12 cycles of PCR using PfuTurbo
DNA polymerase (Stratagene) was performed as per manufacturer’s protocol. The PCR product
was digested with the Dpn I restriction enzyme to eliminate the parental supercoiled, methylated
dsDNA. The PCR synthesized plasmids were then transformed into XL-Blue supercompetent

46
cells and plasmid was purified using Maxiprep Kit (QIAGEN). The full length SIRT1 cDNA
was obtained from pYESir2-puro, a generous gift from Robert Weinberg [302], and ligated in
frame into the BamH1/Sal1 Gal4-DNA-binding domain of the frame-shifted yeast expression
vector to generate Gal4DBD- SIRT1 (pGBKT7- SIRT1) for the yeast two-hybrid screen.
2.3.3 Yeast two-hybrid analysis
Yeast two-hybrid screening was performed according to the Clonetech Matchmaker protocol
using the full-length SIRT1 as bait for the human spleen cDNA library (Clonetech Laboratories).
Briefly, the cDNA library was first titered and then amplified to isolate 10.5 x 10⁶
(3 times the
size of the library) independent colonies. The library was plated on LB + 100 g/ml ampicillin
plates at a high enough density so as to get approximately 40,000 colonies per plate (fully
confluent 150 mm plates) using 5 mm diameter sterile, glass beads. Plates were incubated at
37oC for 18-20 hrs. 5ml of sterile LB + glycerol was added to each plate and the colonies were
scraped off using a glass spreader. The pooled colonies were incubated at 30oC for 3 h with
shaking at 200 rpm. Library plasmid was extracted using Megaprep Kit (QIAGEN).
AH109 yeast cells were transformed with pGBKT7- SIRT1 using the PLATE
(PEG/LiAc/Tris-EDTA) transformation protocol (Clonetech Matchmaker). For verification of
fusion protein expression, transformants were selected on SD-trp plates. Protein extraction from
yeast was performed using SDS/Urea method (Yeast protocol handbook, Clonetech). Western
blot analysis was performed on the extracted protein using monoclonal anti- SIRT1 antibody
(Upstate). The large scale, simultaneous co-transformation protocol was performed according to
manufacturer’s instructions (Clonetech). 50μg of the human cDNA expression library fused to
Gal4-transactivation domain in the pACT2 vector (Clonetech) (AD/library) and 100μg of the full
47
length SIRT1 fused to the Gal4 DNA-binding domain in the pGBKT7 yeast expression vector
(DNA-BD/bait) was used. Co-transformants were selected on high-stringency SD/-H/-A/-L/-T/+
2.5mM aminotriazol plates at 30oC. Plasmids expressing Gal4-DBD-p53 and Gal4-AD-T
antigen were used as positive control whereas Lamin C and T-antigen were used as negative
control. The 78 colonies that grew on high stringency selection plates were streaked on SD/-L/-
T/+X- -gal plates for -galactosidase assay for further confirmation of positive clones. Yeast
plasmids were rescued from clones that were positive for the -galactosidase activity using the
Hoffman and Winston method (Clonetech Laboratories) and analyzed by nucleotide sequencing.
The cDNA sequences were compared with NCBI GenBank database for identification of the
interacting proteins.
2.3.4 Design of small interfering RNA targeting vectors
Already published RNAi sequence for knocking down SIRT1 and TLE1 [148,192] was
used to design sequence of two complementary oligonucleotides suitable for cloning into the
pSIREN RetroQ siRNA expression system, according to the instructions in the BD Knockout
RNAi Systems User Manual (BD Biosciences, PT3739-1). The synthetic oligonucleotide
sequences designed against SIRT1 and TLE1 were ordered from ‘Operon Technologies, Inc’,
Alameda, CA. Complementary sequences used for knocking-down SIRT1 is :
5’GATCCGCTGGAGCTGGGGTGT
CTGTTTCAAGAGAACAGACACCCCAGCTCCAGCTTTTTTTCTAGAG3’ and 5’
GCGACCTCGACCCCACAGACAAAGTTCTCTTGTCTGTGGGGTCGAGGTCGAAAAAAAGATCTCT
TAA 3’ and for knocking-down TLE1 is: :

48
5’GATCCGCGTGCCAAACAGGTGACCATTCAAGAGATGGTCACCTGTTTGGCACGCTTTTTTTC
TAGAG3’ and
5’AATTCCTCTAGAAAAAAGCGTGCCAAACAGGTGACCATCTCTTGAATGGTCACCTGTTTGGC
ACGCG 3’[94,148,192]. The oligonucleotides were annealed and ligated into RNAi-ready
pSIREN RetroQ vector according to instructions in the BD Knockout RNAi Systems User
Manual (BD Biosciences, PT3739-1). Ligation products were transformed into Fusion-blue
competent cells and grown on agar plates containing 100 μg /ml ampicillin (Sigma Aldrich, St
Louis, MO) and incubated overnight at 37°C. Single bacterial colonies were grown in 5 ml LB
media supplemented with 100 μg/ml ampicillin and plasmid DNA was extracted using the
QiaPrep Spin Miniprep Kit (Qiagen, Valencia, CA). Restriction digest analysis with restriction
site (BamHI/EcoRI) within the shRNA oligonucleutide sequence was used to identify bacterial
cultures with a properly cloned plasmid. These bacterial cultures were inoculated in 500 ml of
LB and grown overnight at 37°C; plasmid was extracted from these cultures using a Qiagen
Maxiprep Kit. The pSIREN RetroQ expression vectors contain the Human U6 RNA polymerase
III promoter and it also expresses a puromycin-resistance gene enabling selection of infected
cells. Each siRNA consists of a 19-base-pair sequence corresponding to the sense strand of the
targeted RNA and a 19-base-pair anti-sense strand, separated by a short 6-base-pair sequence. A
negative control vector (luciferase shRNA Negative Control Vector) expressing a short RNA
sequence that does not form a hairpin, was used as a control for retroviral infection and
transcription from the U6 promoter (Clonetech).

49
2.3.5 Production of retrovirus
3 × 10⁶ HEK293T cells were plated 10cc culture dishes. Cells were incubated at 37°C in 10 ml
of DMEM-10% FCS with 2 mM L-Glutamine, without antibiotics. At 70-80% confluency, cells
were transfected with 10 μg retroviral plasmid (pSIREN RetroQ-SIRT1-RNAi or pSIREN
RetroQ negative control vector) and 5μg amphotropic envelope packaging plasmid using
LipofectamineTM
2000 transfection reagent (# P/N 52887, Invitrogen, Grand Island, NY), as per
manufacturer’s protocol. After 6 hours, the transfection media on the cells was replaced with
antibiotic-antimycotic supplemented media. After 48 hours post-transfection, media was
collected from the cell cultures and spun at 3000g in a table-top centrifuge. The supernatent was
used for retroviral infection of HeLa cell cultures. Life of virus is about 6-8 hrs at 37oC, so if
there was extra virus, it was stored on ice if used within a couple of hrs of harvesting or stored at
-80oC, good to use within 6 months.
2.3.6 Retroviral infection and selection of stable cell lines.
2 × 10⁶ HeLa cells/ retroviral infection and one mock infection were plated in 10cc culture dishes
in growth media. 6ml of retroviral supernatant were mixed with 2ml growth media and 4μg/ml
Polybrene (Sigma Aldrich, St Louis, MO) and added in HeLa cell culture dishes. Cells were
incubated for 48hrs at 37°C. The infection media was replaced with fresh growth media
supplemented with 1μg/ml puromycin (SIGMA # P7255) and cells were selected for 7 days.
Medium was changed after 2 days when all of the cells from the mock-infected dish died. Newly
generated cell lines stably expressing shRNAi for SIRT1 were grown in normal growth media

50
and examined by western blot analysis for knock-down of SIRT1 protein using anti-SIRT1
antibody (Upstate # 05-707).
2.3.1 Transfection and Luciferase assay
HeLa cells were seeded in a 24 well plate at ~ 80% confluency in DMEM growth media without
antibiotic-antimycotic and cultured for overnight. Next day, cells were transfected with 50ng NF-
κB luciferase reporter plasmid (Stratagene) along with 50ng renilla-luciferase reporter, pRL-TK
plasmid (Promega), using Lipofectamine2000 transfection reagent (Invitrogen) according to
manufacturer’s protocol. At 24 hrs post-transfection, the cells were treated with 10ng/ml TNF-α
(R&D System) for 3 hrs. Cells were harvested followed by protein extraction using NP40 lysis
buffer. Luciferase assays were performed using the Luciferase Assay System (Promega). Renilla
luciferase activity was used as an internal control for transfection efficiency. The data was
presented as percentage luciferase activity (mean ± S.E) of three independent transfections
relative to no-treatment.
2.3.2 Whole cell lysate preparation and protein estimation
Whole cell lysates were made by lysing cells in NP-40 lysis buffer (20mM TrisHCL, pH8.0,
137mM NaCl, 10% glycerol, 1% nonidet P-40, 2mM EDTA). 1X protease inhibitor cocktail
(SIGMA # P2714) was added to lysis buffer just before lysis. Cells were lysed for 20 mins on ice
and lysate was separated from cell debris by centrifugation for 20 mins at 13000g in a micro-
centrifuge at 4oC. Protein concentration of the cell lysates were estimated by Bradford assay. 2 l

51
of lysate was added to 1ml BioRad protein assay reagent (#500-0006, BioRad Labs, Hercules,
CA). 0, 1, 2, 3, 4, 6 and 8 g BSA (SIGMA # A2153) from 1mg/ml stock was used to plot the
standard curve. Readings were taken at 595nm wavelength.
2.3.3 Co-immunoprecipitation assay
HeLa cells were transfected with plasmids expressing myc-tagged TLE1 and flag-tagged SIRT1.
Whole cell protein was extracted using NP40 lysis buffer followed by protein quantification
using the Bradford method as described above. Whole cell extract containing 500µg protein was
incubated with 1µg of anti-flag mouse monoclonal antibody (Chemicon # MAB3118) or anti-
myc mouse monoclonal antibody, clone 9E10 (Upstate # 05-419) for overnight at 4oC on a
rotator. Mouse normal IgG (Santa Cruz Biotech # sc-2025) was used as negative control. 30µl of
a 50% Protein G-sepharose bead slurry (SIGMA # P4691) was added and incubated for 1.5 hrs at
4oC. The beads were then washed five times in 1ml cold lysis buffer. Centrifugation during
washes was carried at 2000g. After the final wash, the supernatant was carefully discarded by
suction using a fine tip pipette. The beads were then resuspended in 25 l of 2X-Lammli sample
loading buffer (BioRad # 161-0737) and boiled for 5 mins to elute the antibody bound
complexes. Proteins were resolved by SDS-PAGE and analyzed by western blotting.
For endogenous protein-protein interaction studies, whole cell extract from HeLa cells
was used for coimmunoprecipitation as described above using anti-TLE1 polyclonal antibody
(SantaCruz Biotech # sc-9121) or anti-SIRT1 monoclonal antibody (Upstate # 05-707) for
immunoprecipitation and anti-SIRT1 monoclonal antibody or anti-TLE1 polyclonal antibody
respectively for Western blot analysis. Rabbit normal IgG ( # sc-2027) and Mouse normal IgG (#
sc-2025) was used appropriately as negative control.

52
2.3.4 Western blotting
Proteins were resolved by SDS-polyacrylamide gel electrophoresis (SDS-PAGE). Depending on
the experiment, immunoprecipitated samples or 50 g lysate protein was loaded in 12%
polyacryamide gels. Separating gels were made using Protogel 30% w/v acryamide: 0.8% w/v
bis-acrylamide ( # EC-890, National Diagnostic), 1.5M Tris-HCL pH8.8, 10% ammonium
persulfate (APS), 10% SDS and 0.1% TEMED ( BioRad # 161-0801). 4% Stacking gel was
made using same above reagents, except 1.5M Tris-HCL pH6.8 instead of pH 8.8. Gels were run
at 10mA for one minigel or at 50V in 1X-SDS-running buffer. Precision plus dual color protein
marker (BioRad # 161-0374) was used as molecular weight standard. Samples resolved on SDS-
PAGE were transferred on PVDF membrane (Immobilon-P, Millipore, Bedford, MA) in a
semidry transfer machine (Bio-Rad, Richmond, CA) at 15V for 1 hr. Membranes were then
incubated in blocking buffer (1X PBS, 5% w/v non-fat dry milk, 1% Tween-20) for 1hr at RT on
a rocker. After blocking, membranes were washed three times with wash buffer (1X PBS,
1%Tween-20) for 5mins each. The washed membranes were then incubated with primary
antibody for 2hrs at RT on a rocker. Primary antibody dilutions used were as follows: 1:1000
anti-TLE1 and 1:2000 for anti-SIRT1, anti-flag-tag and anti-myc-tag antibody. Following
primary antibody staining, membranes were given three washes with wash buffer (PBST), 10
min each and incubated with corresponding HRP-conjugated-secondary antibody (1:5000) for 1
hr at RT on a rocker. Membranes were then washed three times in PBST and proteins were
visualized by enhanced chemiluminescence (# NEL103, PerkinElmer Life Science, Inc).

53
2.4 RESULTS
2.4.1 SIRT1 interacts with TLE1 in vivo
To identify potential binding partners of SIRT1, we performed a yeast two-hybrid analysis to
screen human spleen cDNA library using SIRT1 fused to the Gal4-DNA binding domain (DBD)
as the bait.
Figure 2.2 Schematic of the Yeast-two hybrid assay, and the bait and library protein constructs
Schematic showing the interacting fusion proteins: GAL4 DBD-SIRT1 and AD-human spleen cDNA library, at the
GAL4 upstream activating sequence in a yeast two-hybrid assay. Interaction between the bait protein and the library
protein leads to transactivation of the GAL4 promoter resulting in activation of the LacZ/ His/ Ade reporter. SIRT1
full length cDNA fused with the Gal4 DNA Binding Domain (DBD) in the pGBKT7 framshifted vector was used as
the bait protein. Human spleen cDNA library clones fused with the Gal4-transactivation domain as the prey
Activation Domain (AD) proteins.
We screened approximately 10.5x10⁶ transformants of a human spleen cDNA library
fused to the GAL4 activation domain (AD) in the AH109 yeast strain. A high stringency
nutritional selection media (SD-H/-A/-L/-T+2.5mM AT) was used for the primary selection of
positive clones. The 78 colonies that grew on high stringency selection plates were streaked on
Gal 4 DNA-BD
Gal4 AD
SIRT1-WT
Human spleen cDNA library
Gal 4 DNA-BD
Gal4 AD
SIRT1-WT
Human spleen cDNA library

54
SD/-L/-T/+X- -gal plate for -galactosidase assay for further confirmation of positive clones. As
shown in Figure 2.4 clones showing blue color were finally selected as positive clones.
Figure 2.3 -galactosidase assay for verification of positive clones
Comparison of the cDNA sequences from the positive clones on -galactosidase assay
with NCBI GenBank database identified a number of interesting potential binding partners for
SIRT1. As shown in table 2.1, we identified two positive clones identifying TLE1, and one clone
each for eIF2 , carnitine palmitoyl transferse and metallothionine IIA.
Table 2.1 Protein identified as potential binding partners for SIRT1 in the Yeast two-hybrid screen
Clone number Protein Protein function
55, 60 Transducin Like-Enhancer of Split-1
(TLE1)
Transcriptional corepressor
Required for developmental processes
23 Eukaryotic initiation factor2- alpha Required for stress induced translation
Positive control:
pGBKT7-53
with
pGADT7-T Ag
Negative control:
pGBKT7-Lam
with
pGADT7-T Ag
Positive control:
pGBKT7-53
with
pGADT7-T Ag
Negative control:
pGBKT7-Lam
with
pGADT7-T Ag
Positive control:
pGBKT7-53
with
pGADT7-T Ag
Negative control:
pGBKT7-Lam
with
pGADT7-T Ag

55
(eIF2 ) attenuation
28 Carnitine palmitoyl transferase Rate controlling enzyme in beta-
oxidation
69 Metallothionine-IIA Prevents cells from apoptosis induced
by oxidative stress and metals.
The identification of TLE1 as a potential binding partner of SIRT1 in the yeast two-
hybrid screen was of particular interest because of a number of reasons: a) SIRT1 was known to
play a role in gene silencing by histone deacetylation and regulation of other transcription
factors, whereas TLE1 was a transcriptional corepressor that was required by various
transcription factors for repressing gene expression, b) TLE1 was reported to negatively regulate
NF-ĸB mediated transcription through an unclear mechanism and c) data from our laboratory
suggested that SIRT1 represses NF-κB activity, which was later published by Mayo et al,
demonstrating that SIRT1 deacetylates the p65 subunit to inhibit NF-κB [320] .
To further confirm the interaction between SIRT1 and TLE1, we reintroduced the
plasmids expressing the GAL4-AD-TLE1 fusion rescued from two positive yeast two-hybrid
clones into Y187 yeast strain along with plasmid expressing Gal4-DBD-SIRT1. Protein-protein
interaction was demonstrated by the development of blue coloration on X-ß-gal plates. As shown
in Figure 2.5, blue colonies were observed only with clones expressing SIRT1-DBD and TLE1-
AD and the positive control consisting of plasmids expressing DBD-p53 and AD-T antigen, but
not with the controls consisting of plasmids expressing SIRT1 and AD, DBD and TLE1 or DBD-
Laminin C and AD-antigen.

56
Figure 2.4 Verification of SIRT1-TLE1 interaction by -galactosidase assay
Yeast strain Y187 was transformed with DBD-SIRT1 and AD-TLE1 plasmids rescued from positive clone in first -
Galactosidase assay. Blue coloration on SD/-L/-T/+X- -gal plates is only seen in clones with SIRT1 and TLE1 or T-
Ag and p53 (positive control). Other control sets are as follows: plasmids expressing AD-TLE1 and DBD, DBD-
SIRT1 and AD, DBD-T-antigen and AD-p53, DBD-T-antigen and AD-Lamin C.
To demonstrate that SIRT1 interacts with TLE1 in mammalian cells, the ability to co-
immunoprecipitate endogenous SIRT1 and TLE1 as well as transiently expressed, epitope-
tagged versions of the proteins was examined. As shown in figure 2.6 (A) immunoprecipitation
of whole cell extracts from HeLa cells with anti-TLE1 or anti-SIRT1 antibodies followed by
Western blot analysis with anti-SIRT1 or anti-TLE1 antibody respectively, demonstrated that the
endogenous SIRT1 and TLE1 proteins interact under physiological conditions. Consistent with
this observation, FLAG-tagged SIRT1 and Myc-tagged TLE1 also were co-immunoprecipitated
from transfected HeLa cells (B).

57
Figure 2.5 Co-immunoprecipitation of SIRT1 and TLE1
SIRT1 and TLE1 interact in mammalian cells: A, Whole cell extracts from HeLa cells were immunoprecipitated
with anti-SIRT1 and anti-TLE1 antibody. For control, the extracts were immunoprecipitated with mouse monoclonal
IgG and rabbit polyclonal IgG respectively. The immunoprecipitated proteins were immunoblotted with anti-TLE1
and anti-SIRT1 respectively. B, HeLa cells were transfected with Myc-TLE1 and Flag-SIRT1 and whole cell
extracts were prepared 24 hrs post-transfection with or without TNF induction. SIRT1 and TLE1 were
immunoprecipitated using anti-SIRT1 and anti-TLE1 antibody respectively, followed by Western blotting using
anti-Myc and anti-Flag respectively.
IP: SIRT1 IgG input SIRT1 IgG input
TNFα - - - + + +
IP: TLE1 IgG TLE1 IgG input
TNFα - - + + +
IP: SIRT1 IgG TLE1 IgG
WB: TLE1 SIRT1
TLE1 SIRT1
α-myc-TLE1
α-Flag-SIRT1
A
B
IP: SIRT1 IgG input SIRT1 IgG input
TNFα - - - + + +
IP: TLE1 IgG TLE1 IgG input
TNFα - - + + +
IP: SIRT1 IgG TLE1 IgG
WB: TLE1 SIRT1
TLE1 SIRT1
α-myc-TLE1
α-Flag-SIRT1
A
B

58
2.4.2 SIRT1 and TLE1 repress NF-κB mediated transcription
Both SIRT1 and TLE1 have been shown to regulate transcription mediated by NF-ĸB [293,320].
To examine the effect of SIRT1 and TLE1 on NF-ĸB mediated gene expression, a co-
transfection assay was performed using a luciferase reporter plasmid (5x-ĸB-TATA-Luc)
containing five tandem repeats of the NF-ĸB DNA binding sequence upstream of a TATA box.
As shown in Figure 2.7, overexpression of SIRT1 and TLE1 both inhibited NF-ĸB mediated
luciferase reporter expression in HeLa cells and the inhibitory effect was slightly enhanced when
Sirt1 and TLE1 were both overexpressed.
Figure 2.6 SIRT1 and TLE1 repress NF- B dependent luciferase gene expression in HeLa cells
The data is presented as fold decrease in luciferase activities. HeLa cells were transfected with 50ng of 5x- B-
TATA-Luc reporter plasmid and 500ng of the indicated expression plasmids. pCMV-3B, the vector control, was
included such that all transfections had equivalent amounts of expression plasmids. Renilla luciferase was used as
the internal transfection control. 24 hr post-transfection, cells were induced with TNF for 3hr and harvested for
luciferase analysis.
0
20
40
60
80
100
120
Vector SIRT1 TLE1 SIRT1+TLE1
% a
ctivity
Per
centa
ge
NF
-κB
act
ivit
y
5x-kB-NF-κB-luciferase reporter
0
20
40
60
80
100
120
Vector SIRT1 TLE1 SIRT1+TLE1
% a
ctivity
Per
centa
ge
NF
-κB
act
ivit
y
0
20
40
60
80
100
120
Vector SIRT1 TLE1 SIRT1+TLE1
% a
ctivity
Per
centa
ge
NF
-κB
act
ivit
y
5x-kB-NF-κB-luciferase reporter

59
To investigate further the ability of the SIRT1 and TLE1 interaction to inhibit NF-ĸB
mediated transcription, a dose response analysis was performed using the NF-ĸB dependent
luciferase reporter (Figure 2.8). At lower doses (50 ng and 150 ng) of SIRT1 and TLE1
expression plasmids, repression of NF-ĸB activity was increased by about 30-40% by co-
expression compared to the repression mediated by SIRT1 and TLE1 individually. However, at
the higher dose (500ng) of expression plasmids, the difference between level of repression
mediated by SIRT1 and TLE1 individually compared to when both the proteins were
overexpressed was reduced. This result suggests that co-expression of SIRT1 and TLE1 together,
at least at lower levels of expression, can mediate repression of NF-ĸB activity more efficiently
than either factor alone.
Figure 2.7 SIRT1-TLE1 co-expression enhances NF-κB repression by SIRT1 or TLE1 individually
The data is presented as fold repression of luciferase activity. Cells were transfected with 50ng of 5x- B-TATA-Luc
reporter plasmid and 0, 50 and 150ng of the indicated expression plasmids. pCMV-3B, the vector control was
included such that all transfections had equivalent amounts of expression plasmids. Renilla was used as the internal
transfection control. 24 hr post-transfection cells were induced with TNF for 3hr and harvested for luciferase
assay.
0
20
40
60
80
100
120
Vec
tor
50ng
TLE
1
50ng
SIR
T1
50ng
SIR
T1+TLE
1
150n
g TLE
1
150n
g SIR
T1
150n
g SIR
T1+TLE1
% a
ctivity
5x-kB-NF-κB-luciferase reporter
Per
cen
tag
e N
F-κ
B a
ctiv
ity
0
20
40
60
80
100
120
Vec
tor
50ng
TLE
1
50ng
SIR
T1
50ng
SIR
T1+TLE
1
150n
g TLE
1
150n
g SIR
T1
150n
g SIR
T1+TLE1
% a
ctivity
5x-kB-NF-κB-luciferase reporter
Per
cen
tag
e N
F-κ
B a
ctiv
ity

60
2.4.3 Deacetylase activity of SIRT1 is not required for suppression of NF-κB activity
It has been reported that SIRT1 represses NF-ĸB activity by decetylating its p65 subunit, reducing its
ability to transactivate [320]. Interestingly, the catalytic mutant of SIRT1, SIRT1-H363Y was able to
repress NF-ĸB activity in a co-transfection assay, similarly to wild-type SIRT1 (Figure 2.9). In addition,
the inhibitory effect of the catalytic mutant was enhanced by co-transfection with TLE1.
Figure 2.8 The catalytic mutant SIRT1-H363Y also represses NF-κB activity
The data is presented as fold repression of luciferase activity. Cells were transfected with 50ng of 5x- B-TATA-Luc
reporter plasmid and 500ng of the indicated expression plasmids. pCMV-3B, the vector control was included such
that all transfections had equivalent amounts of expression plasmids. Renilla was used as the internal transfection
control. 24 hr post-transfection cells were induced with TNF for 3hr and harvested for luciferase assay.
Given that the effect of SIRT1 on NF-ĸB transcriptional activity is independent of SIRT1 catalytic
activity, we wished to examine which region of SIRT1 was important for conferring the NF-ĸB inhibitory
activity. For this we cloned the amino (1-270 a.a.) and carboxy terminal (500-747 a.a) fragments of
SIRT1 in pcDNA6A expression plasmids (Figure 2.10).
5x-kB-NF-κB-luciferase reporter
0
20
40
60
80
100
120
vector
SIR
T1
TLE1
SIR
T1+TLE1
SIR
TH36
3Y
TLE1+
SIRTH
363Y
% a
ctivity
Per
centa
ge
NF
-κB
act
ivit
y 5x-kB-NF-κB-luciferase reporter
0
20
40
60
80
100
120
vector
SIR
T1
TLE1
SIR
T1+TLE1
SIR
TH36
3Y
TLE1+
SIRTH
363Y
% a
ctivity
Per
centa
ge
NF
-κB
act
ivit
y

61
Figure 2.9 N-terminal and C-terminal Flag-tag-SIRT1
A 250 a.a stretch of N and C terminal SIRT1 was cloned in pc-DNA6A. Expression of the truncated protein was
checked by western blot analysis for the 40kD fragments using Flag-tag antibody.
As shown in Figure 2.11, overexpression of the amino-terminal region of SIRT1 repressed NF-ĸB activity
similar to full length SIRT1 whereas the carboxy-terminal fragment of SIRT1 did not repress.
Figure 2.10 N-terminus but not C-terminus SIRT1 represses NF-κB activity
122KD
40KD
SIRT1 (1-270) (500-747)
1 270 500 747
Catalytic
core
SIRT1
122KD
40KD
SIRT1 (1-270) (500-747)
122KD
40KD
SIRT1 (1-270) (500-747)
1 270 500 747
Catalytic
core
1 270 500 747
Catalytic
core
SIRT1
0
20
40
60
80
100
120
vector SIRT1 SIRT1(1-270) SIRT1(500-
747)
% a
ctivity
Per
centa
ge
NF
-κB
act
ivit
y
0
20
40
60
80
100
120
vector SIRT1 SIRT1(1-270) SIRT1(500-
747)
% a
ctivity
Per
centa
ge
NF
-κB
act
ivit
y

62
As a further control, we examined the levels of expression of the exogenous SIRT1 and TLE1 as
well as the endogenous NF-κB subunits p65 and p50 in response to TLE1 and/or SIRT1 overexpression.
As shown in Figure 2.12 A, B and C, expression of SIRT1 did not affect the levels of expression of TLE1
and TLE1 did not affect expression of SIRT1. Also, there was no effect of TLE1 and Sirt1 expression on
the levels of the endogenous NF-κB subunits.
Figure 2.11 Protein levels of SIRT1, TLE1, p65 or p50 are not affected by SIRT1 or TLE1 overexpression
either individually or together.
Hela cells were transfected with (A) SIRT1 or its backbone vector, (B) TLE1 or its backbone vector or with (C)
TLE1 or SIRT1 or both. 24 hr post transfection the levels of TLE1, SIRT1 and p65-p50 were detected by western
blot analysis. Anti-tubulin antibody was used for showing load control.
To determine if SIRT1 and TLE1 also regulate transcription from non-synthetic NF-κB
binding sites, we used a natural NF-κB responsive luciferase reporter, BF2-Luc, containing NF-
κB sites from the IL-8 promoter. As shown in Figure 2.13, expression of either SIRT1 or TLE1
alone also was able to repress transcription from the NF-κB sites in the IL-8 promoter (A),
similar to the synthetic NF-κB binding site reporter. Furthermore, co-expression of SIRT1 and
TLE1 together repressed NF-κB activity even more efficiently. Also, the catalytic mutant of
SIRT, SIRT1H363Y (A), and the amino terminal of SIRT1 (B), which does not have the
catalytic domain, were able to repress NF-κB activity similar to the full length SIRT1. This
repression was further enhanced when co-expressed with TLE1. We again show using the IL-8,
SIRT1
tubulin
TLE
1
vect
or
p65
p50
SiIR
T1+TLE
1
SIR
T1
TLE
1
tubulin
CBTLE1
tubulin
SIR
T1
vect
or
A
SIRT1
tubulin
TLE
1
vect
or
SIRT1
tubulin
TLE
1
vect
or
p65
p50
SiIR
T1+TLE
1
SIR
T1
TLE
1
tubulin
CBTLE1
tubulin
SIR
T1
vect
or
A

63
BF2-luc reporter that while the N-terminus of SIRT1 (1-270 a.a) was able to repress NF-κB
activity, no repression was observed with the C-terminus (500-747 a.a) (C).
0
20
40
60
80
100
120
140
vector
Sirt1
TLE1
Sirt+T
LE1
Sirt1H
363Y
Sirt1H
363Y
+TLE1
% a
ctiv
ityA
BF2-Luc-luciferase reporterP
erce
nta
ge
NF
-κB
act
ivit
y
0
20
40
60
80
100
120
140
vector
Sirt1
TLE1
Sirt+T
LE1
Sirt1H
363Y
Sirt1H
363Y
+TLE1
% a
ctiv
ityA
BF2-Luc-luciferase reporterP
erce
nta
ge
NF
-κB
act
ivit
yP
erce
nta
ge
NF
-κB
act
ivit
y
SIRT1
SIRT1
SIRT1
SIRT1
0
20
40
60
80
100
120
vector
SIR
T1
TLE1
SIR
T1t+T
LE1
SIR
T1(1-
270)
SIR
T1(1-
270)
+TLE
1
% a
ctivity
Per
centa
ge
NF
-κB
act
ivit
y BF2-Luc-luciferase reporterB
Per
centa
ge
NF
-κB
act
ivit
y
SIRT1
SIRT1
SIRT1
SIRT1
0
20
40
60
80
100
120
vector
SIR
T1
TLE1
SIR
T1t+T
LE1
SIR
T1(1-
270)
SIR
T1(1-
270)
+TLE
1
% a
ctivity
Per
centa
ge
NF
-κB
act
ivit
y BF2-Luc-luciferase reporter
Per
centa
ge
NF
-κB
act
ivit
y
SIRT1
SIRT1
SIRT1
SIRT1
0
20
40
60
80
100
120
vector
SIR
T1
TLE1
SIR
T1t+T
LE1
SIR
T1(1-
270)
SIR
T1(1-
270)
+TLE
1
% a
ctivity
Per
centa
ge
NF
-κB
act
ivit
yP
erce
nta
ge
NF
-κB
act
ivit
y
SIRT1
SIRT1
SIRT1
SIRT1
0
20
40
60
80
100
120
vector
SIR
T1
TLE1
SIR
T1t+T
LE1
SIR
T1(1-
270)
SIR
T1(1-
270)
+TLE
1
% a
ctivity
Per
centa
ge
NF
-κB
act
ivit
y BF2-Luc-luciferase reporterB

64
Figure 2.12 SIRT1 and TLE1 represses IL8 promoter based natural NF-κB luciferase reporter.
Cells were transfected with 50 ng of IL-8 promoter based, NF-ĸB responsive, BF2-Luc reporter plasmid and 500ng
of the indicated expression plasmids. pCMV-3B, the backbone vector was included such that all transfections had
equivalent amounts of expression plasmids. Renilla was used as the internal transfection control. 24 hr post-
transfection cells were induced with TNFα for 3hr and harvested for luciferase assay.
2.4.4 SIRT1 and TLE1 are both required for inhibiting NF-κB activity
To determine if SIRT1 is required for the inhibitory effect of TLE1 on NF-ĸB activity, the co-
transfection assays with the NF-ĸB reporter were performed in murine embryonic fibroblasts
(MEF) that were either heterozygous null (-/+) or homozygous null (-/-) for SIRT1 [206]. As
shown in Figure 2.14, TLE1-mediated repression of NF-ĸB transcriptional activity was
significantly abrogated in SIRT1 (-/-) MEFs even though TLE1 could repress NF-ĸB activity by
60% in SIRT1 (-/+) MEFs (A). Furthermore, repression of NF-ĸB activity mediated by TLE1
was restored in SIRT1 null (-/-) MEFs by co-transfection with the SIRT1 expression plasmid. As
demonstrated in Figure 2.14 B, C and D, the pattern of repression of NF-ĸB activity mediated by
SIRT1 and TLE1 was restored in SIRT1 null MEFs by transfection with the SIRT1 expression
plasmid.
0
20
40
60
80
100
120
140
vector Sirt1 Sirt1(1-270) Sirt1(500-
747)
% a
ctiv
ity
BF2-Luc-luciferase reporterC
Per
centa
ge
NF
-κB
act
ivit
y
0
20
40
60
80
100
120
140
vector Sirt1 Sirt1(1-270) Sirt1(500-
747)
% a
ctiv
ity
BF2-Luc-luciferase reporterC
Per
centa
ge
NF
-κB
act
ivit
y

65
0
20
40
60
80
100
120
1 2
% a
ctiv
ity
Vector + - + -
- + - +
SIRT1(-/-) SIRT1(-/+)
TLE1
A
Per
cen
tag
e N
F-κ
B a
ctiv
ity
0
20
40
60
80
100
120
1 2
% a
ctiv
ity
Vector + - + -
- + - +
SIRT1(-/-) SIRT1(-/+)
TLE1
A
Per
cen
tag
e N
F-κ
B a
ctiv
ity
0
20
40
60
80
100
120
vector
SIR
T1
TLE1
SIR
T1+TL
E1
% a
ctivity
B SIRT1(+/+)
Per
cen
tag
e N
F-κ
B a
ctiv
ity
0
20
40
60
80
100
120
vector
SIR
T1
TLE1
SIR
T1+TL
E1
% a
ctivity
B SIRT1(+/+)
Per
cen
tag
e N
F-κ
B a
ctiv
ity
0
20
40
60
80
100
120
Vec
tor
SIR
T1
TLE1
SIR
T1+TL
E1
% a
ctivity
CSIRT1(+/-)
Per
cen
tag
e N
F-κ
B a
ctiv
ity
0
20
40
60
80
100
120
Vec
tor
SIR
T1
TLE1
SIR
T1+TL
E1
% a
ctivity
CSIRT1(+/-)
Per
cen
tag
e N
F-κ
B a
ctiv
ity

66
Figure 2.13 TLE1 is unable to repress NF-ĸB dependent gene expression in mouse embryonic fibroblasts
(MEF) that are null for SIRT1
A, Murine embryonic fibroblasts that are homozygous SIRT1 null (-/-) or heterozygous SIRT1 null (-/+) were
transfected with 50ng 5x-ĸB-TATA-Luc reporter plasmid and 500ng of the indicated expression plasmids. pCMV-
3B was used as the vector control. Renilla was used as the internal control for transfection. 24 hr post-transfection
cells were induced with TNFα for 3hr and harvested for luciferase assay. B, C, and D, In the presence of
exogenously expressed SIRT1, TLE1 is able to repress NF-ĸB dependent gene expression in SIRT1 null MEFs.
MEFs that are wild type (B), heterozygous SIRT1 null (C) or homozygous SIRT1 null (D) were transfected with
50ng 5x-ĸB-TATA-Luc reporter plasmid and 500ng of the indicated expression plasmids. Renilla was used as the
internal control for transfection. 24 hr post-transfection cells were induced with TNFα for 3hr and harvested for
luciferase assay.
The results above suggest that the presence of SIRT1 is required for the inhibition of NF-
ĸB by TLE1. To determine if TLE1 was required for the suppression of NF-ĸB activity by
SIRT1, HeLa cells that stably expressed shRNAi to TLE1 or to SIRT1 were established by
retroviral transduction and selection as described in ‘Materials and Methods’. As shown in
Figure 2.15, SIRT1 was unable to repress NF-ĸB in cells with reduced levels of TLE1 (A).
Conversely, in cells with reduced SIRT1 levels, TLE1 was unable to mediate repression of NF-
ĸB activity, similar to results from transfection of the SIRT1 (-/-) MEFs (B). Taken together our
0
20
40
60
80
100
120
Vec
tor
SIR
T1
TLE1
SIR
T1+TL
E1
% a
ctivity
D SIRT1(-/-)
Per
centa
ge
NF
-κB
act
ivit
y0
20
40
60
80
100
120
Vec
tor
SIR
T1
TLE1
SIR
T1+TL
E1
% a
ctivity
D SIRT1(-/-)
Per
centa
ge
NF
-κB
act
ivit
y

67
data suggest that an interaction between SIRT1 and TLE1 is important for the repression of NF-
ĸB activity.
Figure 2.14 SIRT1 and TLE1 are both required for inhibiting NF-ĸB activity in HeLa cells.
The data is presented as percent activity of luciferase activity in HeLa cells that were depleted of either SIRT1 (A)
or TLE1 (B) using siRNA. The cells were transfected with 50ng of 5x-ĸB-TATA-Luc reporter plasmid and 500ng of
the indicated expression plasmids. Renilla was used as the internal transfection control. 24 hr post-transfection cells
were induced with TNFα for 3hr and harvested for luciferase analysis.
Ctrl-RNAi TLE1-RNAi
TLE1
A
0
20
40
60
80
100
120
140
1 2
% a
ctivity
Vector + - + -
- + - +
Ctrl RNAi TLE1 RNAi
SIRT1
Per
cen
tag
e N
F-κ
B a
ctiv
ity
Ctrl-RNAi TLE1-RNAi
TLE1
A
0
20
40
60
80
100
120
140
1 2
% a
ctivity
Vector + - + -
- + - +
Ctrl RNAi TLE1 RNAi
SIRT1
Per
cen
tag
e N
F-κ
B a
ctiv
ity
0
20
40
60
80
100
120
140
1 2
% a
ctivity
Ctrl-RNAi SIRT1-RNAi
SIRT1
B
Vector + - + -
- + - +
Ctrl RNAi SIRT1 RNAi
TLE1
Per
centa
ge
NF
-κB
act
ivit
y
0
20
40
60
80
100
120
140
1 2
% a
ctivity
0
20
40
60
80
100
120
140
1 2
% a
ctivity
Ctrl-RNAi SIRT1-RNAi
SIRT1
B
Vector + - + -
- + - +
Ctrl RNAi SIRT1 RNAi
TLE1
Per
centa
ge
NF
-κB
act
ivit
y

68
2.5 DISCUSSION
SIRT1 is known to repress transcription by associating with several transcription factors such as
bHLH repressor proteins, HES1, HEY2 [288] and COUP-TF interacting protein 2 (CTIP2)
[270]. It also plays a direct role in repressive-chromatin formation by interacting with histone
proteins H1, H3 and H4 [299]. Although the yeast Sir2 is known to deacetylate histone proteins,
its human homolog, SIRT1, has been also shown to deacetylate numerous non-histone substrates
including the nuclear factor –κB. SIRT1 has been shown to inhibit NF-ĸB transcriptional activity
by binding to and deacetylating p65/RelA [46,320]. Recently, Gao et al. showed that the breast
cancer associated protein, BCA3, plays a role in recruiting SIRT1 to NF-ĸB. Furthermore, it was
shown that neddylation of BCA3 is critical for its association with SIRT1 and hence for SIRT1
mediated transcriptional regulation of NF-ĸB [91]. The results presented here and other
unpublished observations from our laboratory strongly suggest that SIRT1 is able to regulate NF-
ĸB activity through a deacetylase-independent mechanism. Overexpression of wild-type SIRT1
and catalytic mutant SIRT1, SIRT1-H363Y, both, repressed a NF-ĸB dependent promoter-
luciferase reporter in HeLa cells. Moreover, the N-terminal fragment of SIRT1, which does not
have any catalytic activity, also repressed NF-ĸB activity. Furthermore, repression mediated by
SIRT1 was not abrogated by nicotinamide, an inhibitor of SIRT1 deacetylase activity
(unpublished data).
In this study, we used a yeast two-hybrid screen to identify TLE1, a known repressor of
NF-ĸB activity, as a SIRT1 interacting factor. The association between SIRT1 and TLE1 was
further confirmed by co-immunoprecipitation of both endogenous and exogenous SIRT1 and
TLE1. Moreover, we showed that endogenous SIRT1 is required for TLE1-mediated repression
of NF-ĸB activity and, conversely, endogenous TLE1 is required for repression of NF-ĸB

69
activity mediated by SIRT1. Taken together our results suggest that SIRT1 is able to regulate
NF-ĸB activity through a deacetylase independent mechanism and requires TLE1.
TLE1 is the mammalian homolog of the Drosophila Groucho protein, a member of a
family of transcriptional co-repressors. These co-repressors lack a DNA binding domain and are
recruited to DNA through their interaction with DNA binding proteins. Earlier studies on the
Drosophila homolog of NF-ĸB, Dorsal, has shown that it acts both as a transcriptional activator
and repressor depending upon its interaction with other transcriptional co-activators or co-
repressors [43]. For example, Groucho directly binds to Dorsal, and converts it from
transcriptional activator to repressor [71]. The mammalian Groucho homologs, TLE1 and the
Amino terminal Enhancer of split (AES), also directly interact with mammalian NF-ĸB to
repress its transcriptional activity [293]. However the exact mechanism by which TLE1
associating with p65 leads to repression of NF-ĸB activity remains to be elucidated. In
Drosophila, the recruitment of Groucho is known to be necessary, but not sufficient for Dorsal-
mediated repression and requires formation of a multiprotein-DNA binding complex consisting
of Dorsal, Groucho and additional proteins such as cut and dead-ringer [71]. Hence, it is likely
that TLE1 may require additional proteins such as SIRT1 to mediate the repression of NF-ĸB
activity. Interestingly, TLE1 and SIRT1 share certain biological properties. For example, SIRT1
and TLE1 are both involved in mediating transcriptional repression by facilitating
heterochromatin formation, TLE1 by virtue of it being a transcriptional co-repressor and SIRT1
by virtue of it being a histone deacetylase (HDAC-III). Both SIRT1 and TLE1 play a direct role
in formation of repressive chromatin by associating with histone H3 [235,299]. Also, both of
these proteins lack a DNA binding domain and are recruited to the DNA by virtue of their
interaction with various DNA binding proteins and histone proteins. Furthermore, both of these

70
proteins have been reported to associate with the RelA/p65 subunit of NF-ĸB thereby repressing
NF-ĸB mediated gene transcription.
Our data demonstrate that neither SIRT1 nor TLE1 are able to repress NF-ĸB activity in
the absence of the other. This suggests that the interaction between these proteins may play a
critical role in repressing NF-ĸB activity. AES binds human p65 in the vicinity of its
transactivation domain [293]. Thus it is possible that TLE1 recruits SIRT1 to the transactivation
domain of p65 to deacetylate lysine 310, mediating repression of NF-ĸB activity. However, as
described above, our data also suggests that the catalytic activity of SIRT1 may not be critical for
repression of NF-ĸB activity. Thus, alternatively, SIRT1 may play a role in recruiting the
transcriptional co-repressor TLE1 to the p65 subunit of NF-ĸB, converting it from a
transcriptional activator to a repressor by associating with histone proteins or other members of
the transcriptional machinery.
Our observation indicating a deacetylase independent function of SIRT1 may potentially
explain some controversial data regarding SIRT1’s role in cellular stress resistance through p53
decetylation. Although overexpression of mouse SIRT1 was reported to increase cell survival
after exposure to hydrogen peroxide and reduce apoptosis after exposure to etoposide [198], the
role of SIRT1’s catalytic activity in cell survival under DNA damage or oxidative stress have
been contradicted by other reports. For example, Vaziri et al showed that SIRT1 overexpression
in BJ cells had no effect on cell survival after exposure to gamma irradiation [302], and more
recently, work by Solomon et al, demonstrated that although SIRT1 deacetylated p53, this did
not play a role in cell survival following DNA damage in certain cell lines and primary human
mammary epithelial cells as inhibition of SIRT1 catalytic activity by EX-527 had no effect on
cell growth, viability, or p53-controlled gene expression in cells treated with etoposide [282].
71
Given SIRT1’s established role in increasing cellular stress resistance and the inconsistency in
SIRT1’s deacetylase activity in mediating cellular stress resistance, it is conceivable that SIRT1
potentially regulates the cellular resistance to stress by functioning through multiple potentially
independent mechanisms, some of which may not require the deacetylase activity. Our finding
demonstrates one such process that is regulated by SIRT1 potentially through a deacetylase
dependent as well as independent mechanism.
Even though the exact mechanism through which the interaction between SIRT1 and
TLE1 help mediate repression of NF-ĸB activity is currently unclear, our results demonstrate for
the first time, that the mammalian Groucho protein, TLE1, can associate with the sirtuin family
protein SIRT1 to convert the transcriptional activator NF-ĸB into a transcriptional repressor.
This result suggests that other transcriptional factors repressed by TLE1 may also be regulated
by SIRT1 and conversely, factors regulated by SIRT1 may be regulated by TLE1.

72
3.0 SIRT1 ASSOCIATES WITH EUKARYOTIC INITIATION FACTOR 2-ALPHA
AND PLAYS A ROLE IN CELLULAR STRESS RESPONSE
Hiyaa Singhee Ghosh et al.

73
3.1 ABSTRACT
SIRT1 is a NAD+ dependent deacetylase that plays a role in cellular stress response and cell
survival. It increases lifespan in various organisms ranging from yeast, worms, flies to mice. By
deacetylating p53, Ku70, E2F1, p73 and the Forkhead transcription factors, SIRT1 inhibits
apoptosis and promotes cell survival. Using a yeast two hybrid screen we identified eIF2-alpha
to be a potential binding partner for SIRT1. SIRT1-eIF2-alpha association was further confirmed
by co-immunoprecipitation of the two proteins in human cell lines. eIF2-alpha plays a critical
role in regulating the initiation step of mRNA translation in response to stress. Phosphorylation
of eIF2-alpha is the first step towards shutting down global protein synthesis in response to stress
stimuli, thereby facilitating preferential expression of stress related genes for effective
functioning of cells under stress condition. We demonstrate that under various different stress
conditions, SIRT1 depleted HeLa cells show higher phosphorylation of eIF2-alpha. Also, we
observed down-regulation of cell cycle protein Cyclin D1 in SIRT1 depleted cells suggesting
inhibition of global protein synthesis, and upregulation of the stress protein ATF4. We further
demonstrate that SIRT1 associates with eIF2 regardless of stress condition or its catalytic
activity. Also, eIF2 associated with SIRT1 regardless of its phosphorylation state. These
observations suggest a novel aspect of SIRT1 mediated regulation of cellular stress response.

74
3.2 INTRODUCTION
SIRT1 is an NAD+ dependent deacetylase that plays a role in a wide range of cellular processes
including cell proliferation, senescence and apoptosis, thereby regulating cellular stress response
and lifespan. SIRT1 is believed to delay the aging process by regulating metabolism and
endocrine signaling and protecting against age related diseases [4,315]. While many studies point
towards a definitive role of SIRT1 in enhancing cell survival and delaying the aging processes,
the mechanism by which all this is achieved is not fully clear and seems to involve a complex
network of various functions of SIRT1. One of the predominant functions of SIRT1 that plays a
role in longevity is regulation of cellular stress response, which protects cells from genetic and
environmental damage. The wide spectrum of SIRT1’s role in cell proliferative and stress
resistance pathways can be attributed mainly to the regulation of FOXO proteins and p53 by
SIRT1. SIRT1 regulates FOXO signaling in a complex cell and context dependent manner. It
induces FOXO target stress response genes GADD45 and MnSOD while repressing the
apoptotic genes, BIM and Fas [34,97,216]. SIRT1 antagonizes p53 apoptotic pathways by
deacetylating the carboxy terminal of p53 which diminishes its DNA binding affinity [198,302].
In order to adapt to a myriad of physiological and environmental stresses, the cells
modulate their gene expression to coordinate expression of stress-response genes, which affects
cell survival, apoptosis, cell-cycle progression and differentiation. The global translation is
suppressed as a response to stress in order to save the energy that is consumed during translation.
However, the selective translation of genes required for cell survival under stress is activated
despite of stress-induced attenuation of global protein synthesis [114,123]. The eukaryotic
initiation factor 2-alpha (eIF2 ) is central to translation control in response to cellular stress.
Translation is controlled by different extra and intra-cellular stimuli, such as nutrients, growth

75
factors, hormones and stress signals. The inhibition of protein synthesis, as a result of eIF2
phosphorylation occurs very rapidly following exposure to stress; within 30 min of endiplasmic
reticulum (ER) stress, eIF2 phosphorylation and translation suppression is complete. This
immediate action is to prevent further influx of nascent proteins into an already saturated ER
lumen. Translation has three distinct phases: initiation, elongation and termination. Although all
three steps have regulatory mechanisms, the rate-limiting step (initiation) is the most critical step
and acts as a checkpoint in translation. Translation initiation is a complex process that begins
with the interaction of the cap-binding protein complex, eukaryotic initiation factor-4F (eIF4F),
with the 5’-end cap structure (m7GpppN, where N is any nucleotide) of the mRNA. eIF4F
comprises of three components: eIF4E, which is the cap-binding protein, eIF4A, a RNA helicase,
and the scaffolding protein eIF4G that bridges the mRNA and the ribosome through eIF3. 40S
ribosome subunit, which associates with eIF3 and eIF1A, binds the ternary complex that consists
of eIF2, methionyl-initiator tRNA (Met-tRNAiMet
) and GTP to form the 43S pre-initiation
complex. After the recognition of the cap structure at the 5’ end, the 40S subunit, as a part of the
43S pre-initiation complex, is recruited to the mRNA, which then scans the mRNA in the 5’ to 3’
direction until it relocates at an initiation codon, where it is joined by the 60S ribosomal subunit
to form the 80S initiation complex and start translation. The initiation factors used in the
formation of the initiation complex are released and recycled for a second round of initiation, in
a reaction catalyzed by eIF5.

76
Figure 3.1 Translation initiation process of eukaryotic mRNA
The initiation processes is mediated by the eukaryotic translation initiation factors (eIFs). The formation of 43S pre-
initiation complex is decided by the availability of a pool of dissociated ribosomal subunits, which is bound by
eIF1A and eIF3. The 43S pre-initiation complex is formed when 40S ribosomal subunit bound to eIF1A and eIF3,
binds to the ternary complex consisting of eIF2-GTP-Met-tRNAiMet. eIF3 and eIF4G associated with the cap-
binding protein complex, eIF4E, then assists in recruiting the 43S pre-initiation complex to the mRNA resulting in
the 48S initiation complex. The initiation factors are released after the formation of the 48S initiation complex so
that they can be recycled for another round of initiation, in a reaction catalyzed by eIF5. eIF5 facilitates the

77
hydrolysis of the GTP carried by eIF2 resulting in dissociation from the 48S complex. Once recruited to the mRNA,
40S subunit scans from 5’ to 3’ on the mRNA and locates itself on the initiation codon (usually an AUG), where the
60S subunit joins to form the 80S initiation complex, thereby starting translation initiation. eIF5B is required for the
joining of the 60S subunit, at which point the polypeptide elongation step starts.
eIF2 phosphorylation regulates translation at the rate limiting initiation step. The
assembly of the ternary complex (eIF2-Met-tRNAiMet
-GTP) which is bound by the 40S subunit,
is regulated by eIF2B. The binding of GTP to eIF2 is the rate-limiting step in the assembly of the
ternary complex. During translation initiation, the GTP bound to eIF2 is hydrolysed to GDP.
Before eIF2 can be recycled for another round of initiation, the exchange of the GDP bound to
eIF2 with a GTP, a reaction catalyzed by eIF2B, is critical for translation to continue. Four
different eIF2 kinases, phosphorylate eIF2 in response to various stress stimuli. General
control non-derepressable-2 (GCN2) in response to amino acid starvation or UV irradiation,
protein kinase RNA (PKR) in response to viral infection, heme-regulated inhibitor kinase (HRI)
in response to lower heme levels, osmotic or heat shock and PKR-like ER kinase (PERK) in
response to ER (endoplasmic reticulum) stress or hypoxia causes phosphorylation of the alpha
subunit of eIF2 at residue serine 51.

78
Figure 3.2 Stress stimuli mediated phosphorylation of eIF2 inhibits translation.
The eukaryotic initiation factor eIF2 consists of three subunits; eIF2 , eIF2 and eIF2 , which form a part of the
translation initiation ternary complex; eIF2-GTP-methionyl-initiator-tRNA (Met-tRNAiMet ). Four different kinases;
GCN2, PKR, HRI and PERK respond to different stress stimuli and phosphorylate the alpha subunit of eIF2. This
results in inhibition of the GDP-GTP exchange by formation of a stable and inactive eIF2-GTP-eIF2B complex.
Recharging of eIF2 after the first round of initiation is accomplished by GDP-GTP exchange on eIF2, which is
catalyzed by eIF2B. Thus, eIF2 phosphorylation results in inhibition of global protein synthesis. However,
Met
eIF2B
Global
protein
synthesis
translation of
ATF4, ATF6, IRE1
ER Stress
Hypoxiaa.a starvation
UV irradiation
PERK GCN2
ATF3
GADD34
CHOP/
GADD153
ATF2
Viral
infection
Heat or osmotic
Shock & heme levels
PKR HRI
P
GDP
GDP
GTP
eIF2B
GTP
GDP
Inactive
complex
eIF2-GDP-
eIF2B
Stress
response
PP1C
Met
GTP
Met-tRNAiMet
Ternary complex
Translation initiation
MetMet
eIF2B
Global
protein
synthesis
translation of
ATF4, ATF6, IRE1
ER Stress
Hypoxiaa.a starvation
UV irradiation
PERK GCN2
ATF3
GADD34
CHOP/
GADD153
ATF2
Viral
infection
Heat or osmotic
Shock & heme levels
PKR HRI
P
GDP
GDP
GTP
eIF2B
GTP
GDP
Inactive
complex
eIF2-GDP-
eIF2B
Stress
response
PP1C
MetMet
GTP
Met-tRNAiMet
Ternary complex
Translation initiation

79
translation of selective mRNA continues which allows cells to adapt to stress conditions. Downstream effectors of
the stress response act in a negative feedback loop to dephosphorylate eIF2 for translation recovery.
Phosphorylaion of eIF2 in response to cellular stress inhibits the exchange of eIF2-GDP
to eIF2-GTP required to bind the Met-tRNAiMet
, thereby preventing formation of the ternary
complex and inhibiting translation. Since eIF2 is present in excess over eIF2B, small changes
in the phosphorylation of eIF2 affects the formation of ternary complex and translation
significantly. Thus eIF2 phosphorylation reduces translation of most mRNAs by preventing the
recognition of 5’ cap structure and translation initiation. However, eIF2 phosphoryation
selectively enhances translation of specific mRNAs that help in adaptation to stress and recovery
of translation for cellular survival. This includes the stress responsive genes such as activating
transcription factor 4 (ATF4), CHOP and GADD34.
The unconventional mechanisms by which specific genes escape translation attenuation
in response to eIF2 phosphoryation involve processes which do not require the 5’cap structure
of mRNA for the initiation process. These mechanisms depend on regulatory regions in the 5’
and 3’ untranslated regions (UTR) of the specific mRNAs. Such regulatory regions are estimated
to be present in as many as half of the vertebrate mRNA. Initiation of these specific mRNA
involve either the ‘internal ribosome entry site’ (IRES) [75,76], or small upstream open reading
frame (uORF) or both [210,240]. ATF4, the downstream effecter of stress response,
circumvents the translational block by eIF2 phosphoryation because of the presence of two
upstream open reading-frames (uORFs) in its 5’ untranslated regions (UTR), one (uORF2) of
which overlaps with the ATF4 ORF and inhibits ATF4 translation [113]. These uORFs, which
ordinarily prevent translation of the true ATF4 ORF, are bypassed only when eIF2 is

80
phosphorylated; making sure that ATF4 is made only under stress conditions. When the ternary
complex for translation initiation is abundant (when eIF2 is low), the ribosomes re-initiate at
the inhibitory uORF2, resulting in translation attenuation of ATF4. Under stress, eIF2 is
phosphorylated resulting in lower eIF2-GTP levels, which in turn results in lower ternary
complex availability and slowing down of re-initiation process. Ribosomes that bind at uORF1
are able to scan through uORF2 without reinitiating due to delayed initiation process, and instead
initiate at the ATF4-coding region resulting in ATF4 translation only under stress condition
[250,301]. Induced ATF4 expression occurs predominantly via translation control as shown by
preferential ATF4 mRNA association with polysomes that occurs during stress-induced eIF2
phosphorylation [113]. Upregulated ATF4 levels induces a cascade of transcriptional regulators
including CHOP/GADD153 and ATF3, resulting in stress gene expression important for cellular
metabolism, the redox status of the cell, and apoptosis [112,115,144,153]. Downstream to
ATF3/CHOP is GADD34, whose expression correlates temporally with eIF2α
dephosphorylation late in the stress response. GADD34 is a stress-inducible regulatory subunit
of a holophosphatase complex that dephosphorylates eIF2α, and plays a role in translational
recovery through feed back inhibition of eIF2α phosphorylation [59,225]. eIF2α phosphorylation
increases translation of ATF4 which acts to upregulate the transcription of CHOP, which in turn,
increases GADD34 levels, late in the stress response pathway. GADD34 associates with type 1
protein phosphatase (PP1) catalytic subunit and activates it, resulting in dephosphorylation of
eIF2α which is thought to dampen the gene expression pathway when there is a sufficient level
of stress gene expression. Under severe stress conditions, CHOP mediates the pro-apoptotic
function of eIF2α phosphorylation. While ectopic overexpression of CHOP results in increasing

81
apoptosis in HeLa cells, 3T3 fibroblasts and keratinocytes [205], CHOP deletion in MEFs have
been shown to impede apoptosis [143].
Phosphorylated eIF2α thus integrates diverse and seemingly unrelated forms of stress, to
initiate signaling in a common downstream stress-response pathway, referred to as an integrated
stress response.
Figure 3.3 Integrated stress response by eIF2 phosphorylation
In response to ER stress, eIF2α phosphorylation by PERK induces ATF4 expression, which is required for increased
expression of ATF3 and other stress genes. ATF3 is required for increased levels of GADD34, which directs the
eIF2α-
phosphorylation
Global
protein
synthesis
translation of ATF4
ER Stress Nutrition stress
PERK GCN2
ATF3
GADD34
CHOP/
GADD153
ATF6,
IRE1
CHOP/
GADD153
ATF2
PP1c
eIF2α-
phosphorylation
Global
protein
synthesis
translation of ATF4
ER Stress Nutrition stress
PERK GCN2
ATF3
GADD34
CHOP/
GADD153
ATF6,
IRE1
CHOP/
GADD153
ATF2
PP1cPP1c

82
type 1 protein phosphatase (PP1) to dephosphorylate eIF2 . ER stress is also recognized by membrane-associated
ATF6 and IRE1, which function to activate the unfolded protein response (UPR), including GRP78 expression.
ATF6 and IRE1 are proposed to work in conjunction with the eIF2 kinase stress pathway to enhance the expression
of many stress genes, including CHOP/GADD153 and ATF3. During nutritional stress, the eIF2 kinase GCN2
induces the sequential expression of bZIP transcription factors ATF4, ATF3, and CHOP. ATF3 contributes to
increased GADD34 expression, which contributes to feedback dephosphorylation of eIF2 . Transcriptional
activation by ATF3 may be indirect through protein-protein interactions. ATF4 is suggested to directly regulate
stress gene expression during nutrient limitation. Analysis of MEF cells carrying a deletion of ATF2 indicate that
this bZIP transcription factor is also required for CHOP expression in response to amino acid deprivation
eIF2 phosphorylation also leads to activation of P13K/mTOR pathway [154], and IκB
degradation dependent and independent activation of NF-κB activity [145]. Recently, it has been
shown that the eIF2 kinase PKR acts upstream of PI3K to turn on the Akt/PKB-FRAP/mTOR
pathway leading to S6 and 4E-BP1 phosphorylation. Interestingly, PI3K signaling activation is
indirect and requires the inhibition of protein synthesis by eIF2 phosphorylation [154].
NF-κB (nuclear factor-κB) is an important component of the cellular stress response. UV-
C and UV-B irradiation activates NF-κB in murine embryo fibroblasts through a mechanism
requiring eIF2 phosphorylation. GCN2 and PERK phosphorylate eIF2 in response to UV
radiation. Lowered protein synthesis accompanied by eIF2 phosphorylation, combined with
eIF2 kinase-independent turnover of IκB (inhibitor of κBa), reduces the levels of IκBa in
response to UV irradiation, resulting in release of NF-κB from the inhibitory IκBa and
facilitating NF-κB entry into the nucleus and targeted transcriptional control. Thus, eIF2
phosphorylation provides resistance to apoptosis in response to this environmental insult [142].
The mechanisms by which eIF2 phosphorylation modulates NF-κB activity can vary depending
83
on the cellular stress condition and the participation of additional stress-response pathways. For
example, activation of NF-κB in response to ER stress involves the release of IκBa from NF-κB
without measurable reductions in IκBa levels [145]. Inhibition of ubiquitin-mediated degradation
significantly decreases activation of NF-κB in response to UV or TNF exposure, but does not
diminish NF-κB induction in response to ER stress, indicating the differences between the
mechanisms activating NF-κB during ER stress and in response to UV or TNF treatments.
Ubiquitin-mediated turnover of IκBa, which would contribute to lowered levels of this inhibitory
protein, is not central to modulation of NF-κB activity in response to ER stress.
SIRT1 plays a role in cell survival and apoptosis in response to stress and energy state. In
an effort to find novel binding partners for SIRT1 using a yeast two-hybrid screen, we
discovered that SIRT1 potentially interacts with eIF2 . We confirmed this interaction by co-
immunoprecipitation of these proteins in human cell lines. In this chapter we demonstrate that
SIRT1 potentially plays a role in cellular stress response through a novel pathway involving
eIF2 . Under various stress conditions, SIRT1 depleted HeLa cells show higher phosphorylation
of eIF2 which is accompanied by reduced levels of the cell-cycle protein Cyclin-D1 and
increase levels of the stress response protein ATF4. In addition, our results show that SIRT1
associates with eIF2 regardless of stress condition. Also, neither SIRT1’s catalytic activity nor
the phosphorylation state of eIF2 was important for this association, did not affect SIRT1-
eIF2 association either. Consistent with the higher phosphorylation of eIF2 in SIRT1 depleted
cells, we observed more sensitivity to oxidative stress and higher NF-κB activity in response to
ER stress. These results suggest a novel regulatory role for SIRT1 in eIF2 mediated cellular
stress response.

84
3.3 MATERIALS AND METHODS
3.3.1 Cell culture and drug treatment
HeLa cells were purchased from American tissue culture consortium (ATCC) and cultured in
DMEM media (Dulbecco’s modified Eagle’s media, Cellgro # ) supplemented with 10% heat
inactivated fetal bovine serum (FBS) and 100U penicillin, 100U streptomycin and 0.25 g/ml
amphotericin B (antibiotic-antimycotic; GIBCO # 15240-062), Hepes buffer and 2mM L-
glutamine. Cells were cultured at 370C, 19% O2 and 5% CO2. The SIRT1-wild-type and SIRT1
null mouse embryonic fibroblasts were a gift from Dr. Michael McBurney, University of Ottawa,
Canada. These cells were also maintained in the DMEM growth media. SIRT1 MEFs were
cultured at 370C, 15% O2 and 5% CO2. For various stress treatments, cells were seeded at about
80% confluency in 60mm culture dishes and cultured for overnight under conditions as
mentioned above. Next day, cells were treated for indicated time periods in stress media such as:
leucine negative media (RPMI 1640, Cellgro, # 10-040-CV), glucose negative media (DMEM ),
serum negative media (Normal growth media without FBS), 2 μg/ml tunicamycin, TM (SIGMA
# T7765) in normal growth media, 200nM thapsigargin, TG (SIGMA # T9033) in normal growth
media, and 500μM H2O2 in normal growth media. The solvent for chemicals like TM and TG
were used in similar concentration for mock-treatment where ever possible. Cells were harvested
by treating cells with trypsin-EDTA (Cellgro, # 25-053-Cl) for 2mins in 370C incubator. Cells
were washed by re-suspending cells in growth media and centrifuged at 1000g in a table-top
centrifuge.

85
3.3.2 Transfections and Luciferase assays
Cells were seeded at ~80% confluency in DMEM growth media without antibiotic-
antimycotic, and cultured overnight. Cells were transfected the next day using
Lipofectamine2000 transfection reagent (Invitrogen # P/N 52887) according to manufacturer’s
protocol. The transfection media on cells was replaced with normal growth media 6hrs post-
transfection. The next day, cells were treated as required for specific experiments and harvested
for analysis. For luciferase assay, cells were seeded in 24 well plate and transfected with 100ng
5X-κB-luciferase reporter plasmid (Stratagene) along with 100ng renilla luciferase reporter,
pRL-TK plasmid (Promega) per well. 24 hrs post-transfection, cells were treated either with
10ng/ml TNF-α (R&D System) or indicated dose of thapsigargin (SIGMA # T9033) for 6hrs.
Cells were harvested, followed by protein extraction using NP40 lysis buffer. Luciferase assays
were performed using the Luciferase Assay System (Promega). Renilla luciferase activity
expressed from the pRL-TK plasmid (Promega) was used as an internal control for transfection
efficiency. 20μl aliquot of each sample was mixed with 100 μl of luciferase assay reagent
(Promega), and luciferase activity was measured in a Beckman Coulter LS6500 scintillation
system in the single-photon mode. The data was calculated as percentage luciferase activity
(mean ± S.E) of three independent transfections relative to the control (mock-treatment).
3.3.3 Detection of SIRT1-eIF2 association
Yeast two-hybrid assay was performed as described in Chapter 2. The interaction between
SIRT1 and eIF2 was confirmed by co-immunoprecipitation assay as described below.

86
3.3.4 Whole cell lysate preparation and protein estimation
Whole cell lysates were made by lysing cells in NP-40 lysis buffer (20mM TrisHCL, pH8.0,
137mM NaCl, 10% glycerol, 1% nonidet P-40, 2mM EDTA). 1X protease inhibitor cocktail
(SIGMA # P2714) was added to lysis buffer just before lysis. Cells were lysed for 20 min on ice
and lysate was separated from cell debris by centrifugation for 20 min at 13000g in a micro-
centrifuge at 4oC. Protein concentration of the cell lysates were estimated by Bradford assay. 2 l
of lysate was added to 1ml BioRad protein assay reagent (#500-0006, BioRad Labs, Hercules,
CA). 0, 1, 2, 3, 4, 6 and 8 g BSA (SIGMA # A2153) from 1mg/ml stock was used to plot the
standard curve. Readings were taken at 595nm wavelength.
3.3.5 Co-immunoprecipitation assay
For exgoneous expression of epitope-tagged proteins, 10 g of the pcDNA-flag-SIRT1 and
pCMV-myc-eIF2 expression plasmids were transfected in HeLa cells using Lipofectamine
TM2000
reagent (Invitrogen # P/N 52887) as per manufacturer’s protocol. 24hr post-transfection,
whole cell lysates were made as described above. For immunoprecipitation, 500 g of cell lysate
was incubated with 2 g of specific protein antibody or epitope-tag antibody, overnight at 40C on
a rotator. For negative control, rabbit normal IgG antibody was used. Next day, samples were
incubated with 35 l ProteinA-sepharose (SIGMA # P9424) and 25 l ProteinG-agarose (SIGMA
# P4691) 50% slurry at 40C on a rotator for 2 hrs. The resin was pelleted by spinning the samples
at 2000g for 5 min in microcentrifuge. The precipitated resin was then washed three times in
cold lysis buffer. Centrifugation during washes was carried at 2000g for 5 min. After the final

87
wash, the supernatant was carefully discarded by suction using a fine tip pipette. The beads were
then resuspended in 25 l of 2X-Lammli sample-loading buffer (BioRad # 161-0737) and boiled
for 5 min to elute the proteins. Samples were spun at highest speed for 1 min in the microfuge
and supernatants were resolved by SDS-PAGE (polyacrylamide gel electrophoresis) on 12% or
8% gels followed by western blot analysis. Antibodies used for immunoprecipitation were as
followed: anti-SIRT1 (Upstate # 05-707), anti-eIF2 (sc-11386), anti-flag-tag (Chemicon #
MAB3118) and anti-myc-tag 9E10 (Upstate # 05-419), Rabbit normal IgG (SantaCruz biotech #
sc2027).
3.3.6 Western blotting
Proteins were resolved by SDS-polyacrylamide gel electrophoresis (SDS-PAGE). Depending on
the experiment, immunoprecipitated samples or 50 g lysate protein were loaded on 12% or 8%
polyacryamide gels. Separating gels were made using Protogel 30% w/v acryamide: 0.8% w/v
bis-acrylamide (National Diagnostic # EC-890), 1.5M Tris-HCL pH8.8, 10% ammonium
persulfate (APS), 10% SDS and 0.1% TEMED (BioRad # 161-0801). 4% Stacking gel was made
using same above reagents, except 1.5M Tris-HCL pH 6.8 instead of pH 8.8. Proteins of
molecular weight ranging between 30-75 kD were resolved on 12% separating gels, whereas
protein with higher molecular weight were resolved on 10 or 8 % separating gels. Gels were run
at 10mA for one minigel in 1X-SDS-running buffer. Precision plus dual color protein marker
(BioRad # 161-0374) was used as molecular weight standard. Samples resolved on SDS-PAGE
were transferred on PVDF membrane (Immobilon-P, Millipore, Bedford, MA) in a semidry
transfer machine (Bio-Rad, Richmond, CA) at 15V for 1-1.5 hr depending on molecular weight
of the protein to be probed. Membranes were then incubated in blocking buffer (1X PBS, 5%

88
w/v non-fat dry milk, 1% Tween-20) for 1hr at RT on a rocker. After blocking, membranes were
washed three times with wash buffer, PBST (1X PBS, 1%Tween-20) for 5min each. The washed
membranes were then incubated with primary antibody overnight at 40C on a rocker. Primary
antibody dilutions used were as follows: 1:1000 anti-eIF and 1:2000 for anti-SIRT1, anti-flag-
tag and anti-myc-tag antibody. Following primary antibody staining, membranes were given
three washes with wash buffer (PBST), 10 mins each and incubated with corresponding HRP-
conjugated-secondary antibody (1:5000) for 1 hr at RT on a rocker. Membranes were then
washed three times in PBST and proteins were visualized by enhanced chemiluminescence (#
NEL103, PerkinElmer Life Science, Inc). For re-probing the same blot, membranes were
incubated in RestoreTM
western stripping buffer (Pierce # 21059) for 10-15min, followed by
three washes, 10 mins each in PBST. Blots were then blocked as mentioned above and probed
with appropriate primary and corresponding secondary antibody, and visualized as described
above. Antibodies used for western blotting are as follows: anti-SIRT1 (Upstate # 05-707,
1:2000), anti-eIF2 (SantaCruz Biotech # sc-11386, 1:1000), anti-flag-tag (chemicon #
MAB3118, 1:2000) and anti-myc-tag 9E10 (Upstate # 05-419, 1: 2000), anti-ATF4/CREB2 (#
sc-200, 1:500, 2hr at RT), anti-GADD153/CHOP (sc-575, 1:500, 2hr at RT), anti-CyclinD1 (Cell
signaling # ), anti-PARP1 antibody (# sc-25780, 1:5000) and anti-HSP90 (sc-13119, 1:5000).
3.3.7 Cell survival assay
Cells (10,000) were seeded per well in 100 l growth media in a 96 well plate and cultured
overnight as mentioned above. Next day, the growth media was replaced with treated media as
indicated and cells were put back in incubator for overnight. 24hr post-treatment, 10 l of MTT

89
reagent, 5mg/ml ( MTT assay kit, ATCC # 30-1010K) was added to each well and incubated at
37oC for 4hr. When blue coloration was visible in mock-treated live cells, the reaction was
stopped by incubating in detergent reagent for 2hr at RT in dark. The absorbance was measured
in a plate reader at 570nm wavelength. The data was calculated as percentage survival (mean ±
S.E) of three independent samples for each set, relative to the control (mock-treatment).
3.3.8 Immunofluorescence Microscopy
HeLa cells were seeded on sterilized (in 99% ethanol) coverslips at 60 % confluency in a 6 well
plate and cultured in normal growth media for overnight. Cells were fixed in 2%
paraformaldehyde for 15 min at room temperature. Immunostaining was performed by
incubating fixed cells in 1:1000 diluted anti-SIRT1 (mouse, clone 2G1/F7, Upstate) antibody for
1hr, followed 45 min incubation with secondary antibody conjugated with alexa-fluor488 (anti-
mouse) at RT. Samples were examined by using an Eclipse E600 microscope (Nikon).
Photomicrographs were taken at 40X magnification.
3.3.9 Protein synthesis assay by 35
S-methionine incorporation
SIRT knock-out and wild-type mouse embryonic fibroblasts were seeded in 6 well plates at a
density of 4.5x10⁵
cells/well. Cells were stress treated for 1hr with 2 M thapsigargin. Cells were
incubated in normal growth media for the rest of the time after 1 hr stress treatment. 30min prior
to the specific time points, cells were depleted for methionine and cystein by replacing the media
with methionine/cystein negative growth media (Gibco DMEM –methionine and –cystine #
21012). At specific time points, cells were pulsed with 200 Ci/ml 35
S-protein labeling mix

90
(Easy-tag Express 35
S-protein labeling mix, Perkin-Elmer#NEG772014MC). Cells were
incubated at 37oC incubator for 30 min after adding the radioactivity. Cells were then harvested
and lysed for western blot analysis. Radioactivity was detected by exposing the gel, wrapped in
saron wrap, to Kodak BioMax MR film.

91
3.4 RESULTS
3.4.1 SIRT1 interacts with eIF2 in vivo
To identify potential binding partners for SIRT1, we used a yeast two-hybrid system to screen
human cDNA library, using SIRT1 fused to the Gal4-DNA binding domain (DBD) as the bait.
We screened approximately 10.5x10⁶ transformants of a human spleen cDNA library fused to the
GAL4 activation domain (AD) in the AH109 yeast strain as described in [94]. The identification
of eIF2 as a potential binding partner for SIRT1 in the our yeast two-hybrid screen was
interesting because both SIRT1 and eIF2 play a role in cellular stress response.
To further confirm this interaction in human cells, we performed co-immunoprecipitation
assays for these two proteins in HeLa cells. Endogenous SIRT1 and eIF2 as well as transiently
expressed, epitope-tagged versions of the proteins were examined for co-immunoprecipitation.
Immunoprecipitation of whole cell extracts from HeLa cells with anti-eIF2 or anti-SIRT1
antibodies followed by western blot analysis with anti-SIRT1 or anti- eIF2 antibody
respectively, demonstrated that the endogenous SIRT1 and eIF2 proteins interact under
physiological conditions (Fig. 3.4 A and B). Consistent with this observation, flag-tagged SIRT1
and myc-tagged eIF2 were also co-immunoprecipitated from transfected HeLa cells (Fig. 3.4 C
and D).
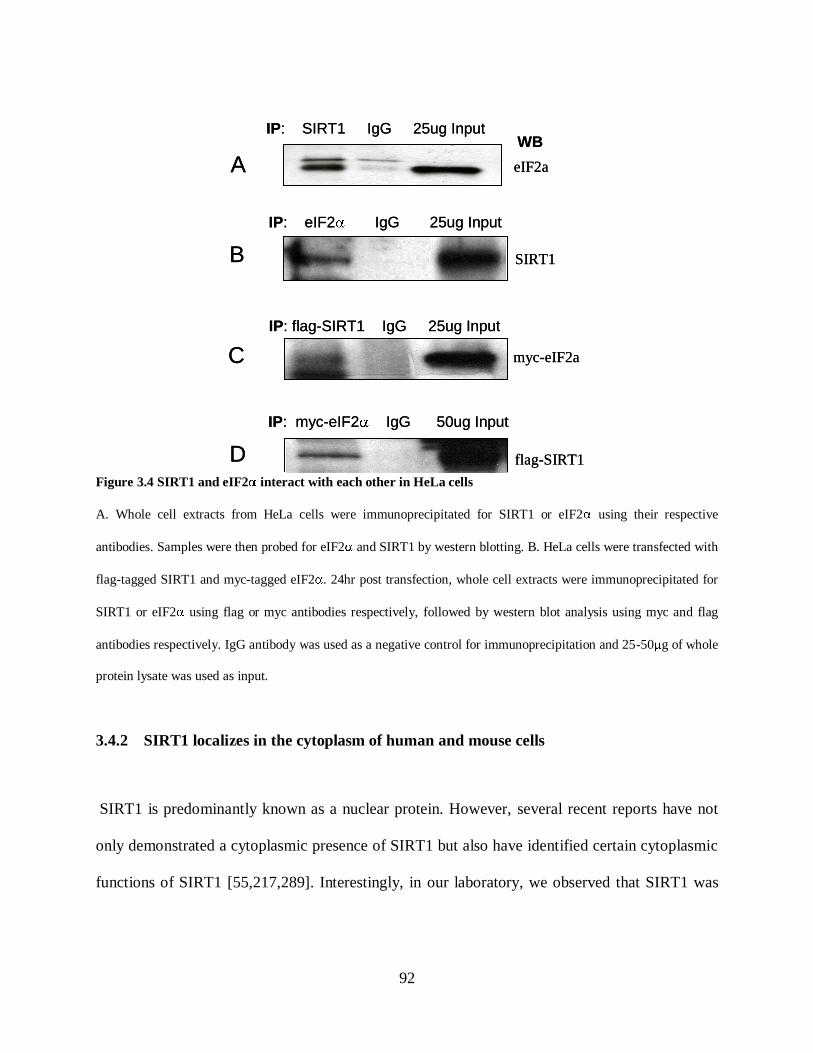
92
Figure 3.4 SIRT1 and eIF2 interact with each other in HeLa cells
A. Whole cell extracts from HeLa cells were immunoprecipitated for SIRT1 or eIF2 using their respective
antibodies. Samples were then probed for eIF2 and SIRT1 by western blotting. B. HeLa cells were transfected with
flag-tagged SIRT1 and myc-tagged eIF2 . 24hr post transfection, whole cell extracts were immunoprecipitated for
SIRT1 or eIF2 using flag or myc antibodies respectively, followed by western blot analysis using myc and flag
antibodies respectively. IgG antibody was used as a negative control for immunoprecipitation and 25-50 g of whole
protein lysate was used as input.
3.4.2 SIRT1 localizes in the cytoplasm of human and mouse cells
SIRT1 is predominantly known as a nuclear protein. However, several recent reports have not
only demonstrated a cytoplasmic presence of SIRT1 but also have identified certain cytoplasmic
functions of SIRT1 [55,217,289]. Interestingly, in our laboratory, we observed that SIRT1 was
IP: SIRT1 IgG 25ug Input
eIF2a
IP: eIF2 IgG 25ug Input
SIRT1
IP: flag-SIRT1 IgG 25ug Input
IP: myc-eIF2 IgG 50ug Input
myc-eIF2a
flag-SIRT1
WB
A
B
C
D
IP: SIRT1 IgG 25ug Input
eIF2a
IP: eIF2 IgG 25ug Input
SIRT1
IP: flag-SIRT1 IgG 25ug Input
IP: myc-eIF2 IgG 50ug Input
myc-eIF2a
flag-SIRT1
WB
A
B
C
D

93
both a nuclear and cytoplasmic protein. Using immuno-fluorescence for SIRT1, we detected
cytoplasmic localization of SIRT1 in HeLa cells (Figure 3.5).
Figure 3.5 SIRT1 localizes in the nucleus and cytoplasm of HeLa cells
HeLa cells were probed with anti-SIRT1 antibody (green) and localization of SIRT1 was detected by
immunofluoroscence microscopy. The nucleus was stained with DAPI (blue). Pictures were taken at 40X
magnification.
To confirm the cytoplasmic presence in different mammalian cell types, we analyzed
SIRT1 by sub-cellular fractionation of three different human cell lines and mouse embryonic
fibroblasts. As shown in Figure 3.6, SIRT1 localizes in the nucleus as well as the cytoplasm of
HeLa, 293T, Jurkat cell lines and in mouse embryonic fibroblasts (MEFs). Notably, we found
more cytoplasmic than nuclear SIRT1 in each of these cell lines. The cytoplasmic localization of
SIRT1 was relevant to its association with eIF2 , because eIF2 is a translation regulatory
protein and translation is a cytoplasmic process. Hence, SIRT1’s cytoplasmic localization and its
association with eIF2 , together indicated towards a cytoplsmic function of SIRT1, which could
be potentially, mediated though eIF2 .

94
Figure 3.6 SIRT1 localizes in the cytoplasm and nucleus of human and mouse cell lines
Sub-cellular fractions of the indicated cell lines were examined by western blot analysis. Parp1, a nuclear protein,
was used as a positive control for nuclear fractionation whereas Hsp90, a cytoplasmic protein, was used as a positive
control for cytoplasmic fractionation. ‘Cyt’: cytoplasmic, ‘Nuc’: Nuclear.
3.4.3 eIF2 phosphorylation is enhanced in SIRT1 depleted cells
Given that SIRT1 plays a role in stress resistance and longevity and our finding that SIRT1
interacts with eIF2 in human cells, we wished to investigate the possible regulatory overlap
between these two proteins in eIF2 mediated stress response. For this, we used SIRT1 depleted
HeLa cells made by stable retroviral expression of shRNAi against SIRT1 [94]. These cells were
treated for 1 hr with different stress conditions, such as amino-acid starvation, glucose starvation,
serum deprivation, ER stress (tunicamycin) and oxidative stress (H2O2). As shown in Figure 3.7
A, under all different stress conditions, the SIRT1 depleted cells showed higher levels of
phosphorylated eIF2 than the matched control cells, indicating SIRT1’s role in stress dependent
regulation of eIF2 phosphorylation.
HeLa
Parp1
Hsp 90
Cyt Nuc Cyt Nuc Cyt Nuc Cyt Nuc
293T MEF
SIRT1
JurkatHeLa
Parp1
Hsp 90
Cyt Nuc Cyt Nuc Cyt Nuc Cyt Nuc
293T MEF
SIRT1
Jurkat

95
Figure 3.7 HeLa cells depleted for SIRT1 show higher eIF2 phosphorylation in response to stress
SIRT1 depleted HeLa cells (generated by stable retroviral expression of shRNAi for SIRT1) and the matched
control cells were treated for 1hr as indicated. Whole cells lysates were analysed by western blotting using
phosphorylated and total protein antibodies for eIF2 . The blot was also probed for SIRT1 to show efficient knock-
down of SIRT1 protein. Tubulin was used as a loading control for the blots. –leu: leucine stravation, -glc: glucose
starvation, -serum: serum starvation, +TM: 2 g/ml tunicamycin, H2O2 : 500nM hydrogen peroxide, hSIRT1: human
SIRT1.
3.4.4 SIRT1 depleted cells show upregulated eIF2 phosphorylation for a prolonged time
Next, we investigated the kinetics of eIF2 phosphorylation between the two types of cells;
SIRT1 depleted and matched control HeLa cells. Control and SIRT1 depleted HeLa cells were
treated with two different stress conditions: amino acid starvation (-leucine) and ER stress
(thapsigargin: causes depletion of ER–Ca2+
) for up to 8hrs and the phosphorylation of eIF2 was
analyzed by western blotting. Interestingly, compared to the control cells, the phosphorylation of
eIF2 was higher in SIRT1 depleted cells at all times points, suggesting that the role of SIRT1 in
+ - + - + - + - + - + - hSIRT1
none -leu -glc -serum +TM +H2O2 1hr treatment
phospho-eIF2α
eIF2α
tubulin
hSIRT1
+ - + - + - + - + - + - hSIRT1
none -leu -glc -serum +TM +H2O2 1hr treatment
phospho-eIF2α
eIF2α
tubulin
hSIRT1

96
eIF2 phosphorylation is not time dependent (Figure 3.8). Also, while the control cells showed
an overall reduction in eIF2 phosphorylation in the later stage of stress (8h), the SIRT1
depleted cells showed sustained phosphorylation of eIF2 through all time points. This suggests
that SIRT1 may be involved in mediating recovery processes during the later phase of stress
response which is important for translation recovery and cell survival.
Figure 3.8 SIRT1 depleted HeLa cells show persistently higher level of eIF2 phosphorylation in response to
amino acid starvation and ER stress
SIRT1 depleted and matched control cells were treated with mock treatment, leucine starvation or thapsigargin (ER
stress) for various time periods as indicated. Whole cell lysates were analyzed by western blot analysis using
phospho- or total protein antibody for eIF2 . +: Negative control RNAi HeLa cells, -: SIRT1 RNAi HeLa cells.
We further confirmed this observation in SIRT1 knock-out mouse embryonic fibroblasts.
Consistent with our data from HeLa cells, the SIRT1 depeted MEFs showed higher level of
eIF2 phosphorylation which was more sustained in response to ER stress (Figure 3.9).
0 0.5 1.0 2.0 4.0 8.0 time (hr)
+ - + - + - + - + - + - hSIRT1
phospho-eIF2α
phospho-eIF2α
-Leucine
+TG
eIF2α
eIF2α
-Leucine
+TG
0 0.5 1.0 2.0 4.0 8.0 time (hr)
+ - + - + - + - + - + - hSIRT1
phospho-eIF2α
phospho-eIF2α
-Leucine
+TG
eIF2α
eIF2α
-Leucine
+TG

97
Figure 3.9 SIRT1 deficient mouse embryonic fibroblasts show higher level of eIF2 phosphorylation in
response to amino acid starvation and ER stress
SIRT1 knock-out and WT MEFs were treated with mock treatment, leucine starvation or thapsigargin (ER stress) for
various time periods as indicated. Whole cell lysates were analyzed by western blot analysis using phospho- or total
protein antibody for eIF2 . +: SIRT1+/+ MEFs, -: SIRT1-/- MEFs.
3.4.5 SIRT1 deficient cells show delayed CHOP expression in response to cellular stress
Downstream to phosphorylation of eIF2 in response to cellular stress is the expression of stress
response proteins such as ATF4 and CHOP. Investigating the downstream effect of eIF2
phosphorylation in WT versus SIRT1 knock out cells, we found that the SIRT1 deficient cells,
which demonstrated higher eIF2 phosphorylation, surpisingly showed a much delayed
expression of the stress response protein CHOP (Figure 3.10). In addition we also observed
reduced levels of CyclinD1 in SIRT1 deficient cells, which can be explained by translation
attenuation of global protein sysnthesis in response to sustained eIF2 phosphorylation in
absence of SIRT1.
+TG
-leu
0 1 4 8 16 24 time (h)
- + + - + - + - + - + - mSIRT1
phospho-eIF2α
eIF2
mSIRT1
+ - + - + - + - + - + - mSIRT1
phospho-eIF2α
eIF2
mSIRT1
0 1 4 8 16 24 time (h)
- + + - + - + - + - + - mSIRT1
phospho-eIF2α
eIF2
mSIRT1
+ - + - + - + - + - + - mSIRT1
phospho-eIF2α
eIF2
mSIRT1

98
Figure 3.10 SIRT1 deficient mouse embryonic fibroblasts show delayed CHOP expression response to ER
stress and amino acid starvation.
SIRT1 knock-out and WT MEFs were treated with mock treatment, leucine starvation or thapsigargin (ER stress) for
various time periods as indicated. Whole cell lysates were analyzed by western blot analysis using phospho- or total
protein antibody for eIF2 . +: SIRT1+/+ MEFs, -: SIRT1-/- MEFs.
Downstream to CHOP is GADD34 which acts in a feedback loop to dephosphorylate eIF2 with
the help of protein phosphatase1 (PP1). Thus, the explanation of higher and more sustained
eIF2 phosphorylation in SIRT1 deficient cells could be rather due to impaired de-
phosphorylation of eIF2 due to delayed expression of CHOP and possibly its downstream
effectors.
3.4.6 SIRT1 deficient cells are more sensitive to free radical stress
eIF2 phosphorylation is critical to cell survival under various stress conditions including
oxidative stress. The later part of stress response involves feed back inhibition of eIF2
0 1 4 8 16 24 time (h)
+TG CHOP
cycD1
actin
CHOP
cycD1
actin
-Leu
- + + - + - + - + - + - mSIRT1
+ - + - + - + - + - + - mSIRT1
99
phosphorylation by its downstream target CHOP and GADD34, which binds the eukaryotic
serine/threonine phosphatase protein phosphatase 1 (PP1) to direct eIF-2α dephosphorylation,
thereby recovering translation to aid expression of stress proteins and help cells recover from
stress [35,59,225]. Thus, delayed expression downstream targets of the stress response pathway
can be detrimental to cell survival. Since, our results suggested that SIRT1 depleted cells have
delayed expression of CHOP and persistently higher levels of eIF2 phosphorylation, we asked
if SIRT1 null cells were more sensitive to stress. To investigate this, we treated SIRT1 null and
wild-type mouse embryonic fibroblasts (MEFs) for 24 hrs with increasing dose of oxidative
stress causing agents, paraquat and H2O2. Our results showed that SIRT1 null MEFs were
significantly more sensitive to oxidative stress compared to wild-type MEFs (Figure 3.11). This
observation was consistent with the slower stress response and sustained upregulated eIF2
phosphorylation in SIRT1 depleted cells.

100
Figure 3.11 SIRT1 null mouse embryonic fibroblasts are more sensitive to oxidative stress
Wild-type and SIRT1 null mouse embryonic fibroblasts were subjected to indicated doses of paraquat and hydrogen
peroxide for 24 hr. MTT assay was used to detect cell survival. Data is presented as percentage survival with regards
to mock (vehicle alone) treatment. Bars = SEM
0
20
40
60
80
100
120
0 100 200 400 800 1000 2000
paraquat ( M)
%via
bility
mSIRT1+/+ mSIRT1-/-
0
20
40
60
80
100
120
0 0.5 1 1.5 2 2.5 3
Hydrogen peroxide (mM)
% v
iab
ility
mSIRT1+/+ mSIRT1-/-

101
3.4.7 Increased sensitivity of SIRT1 deficient cells is caused by translation inhibition
To further examine if the increased sensitivity of SIRT1 depleted cells was because of the
potential block in translation due to sustained eIF2 phosphorylation, we treated the control and
SIRT1 depleted HeLa cells with a translation inhibitory drug, blasticidine, while they were
subjected to hydrogen peroxide treatment and assayed cell survival.
Figure 3.12 Translation inhibition leads to increased sensitivity of SIRT1 positive cells to oxidative stress.
SIRT1 depleted and matched control HeLa cells were treated with increasing dose of hydrogen peroxide as
indicated, with or without 2 g/ml blasticidine for 24 hrs. MTT assay was used to detect cell survival. Data is
presented as percentage survival with regards to mock (vehicle alone) treatment.
As shown in Figure 3.12, our results showed that the SIRT1 positive cells become similarly
sensitive to oxidative stress as SIRT1 depleted cells when translation was blocked. This result
further suggests that the increased sensitivity of SIRT1 depleted cells to oxidative stress could be
potentially a result of impaired translation recovery due to sustained eIF2 phosphorylation.
0
20
40
60
80
100
120
0 0.5 1 1.5 2 2.5 3
hydrogen peroxide (mM)
%via
bility
CtrlRNAi SIRTRNAi
0
20
40
60
80
100
120
0 0.5 1 1.5 2 2.5 3
2ug/ml blasticidine + hydrogen peroxide (mM)
% v
iability
CtrlRNAi SIRTRNAi

102
3.4.8 SIRT1 deficient cells show impaired translation recovery in response to ER stress
To investigate whether higher eIF2 phosphorylation and more sensivity toward cellular
stress in SIRT1 knock-out cells was indeed due to impaired translation recovery, we examined
new protein synthesis in ER stressed cells by 35
S-Methionine incorporation assay. As shown in
Figure 3.13, recovery of protein sysnthesis in SIRT1 deficient cells in response to ER stress was
slower than in WT MEFs.
Figure 3.13 SIRT1 null mouse embryonic fibroblasts show slower translation recovery in response to ER
stress
Wild-type and SIRT1 null mouse embryonic fibroblasts were treated with 2 M thapsigargin for 1hr. Cells were then
pulsed with 200 Ci/ml 35S labeled methionine for 30 mins at each time point. Proteins extracts from cells were
analysed by western blot analysis. New protein systhesis was assessed by incorporation of 35S in cellular protein
detected by autorabiography of the protein blots. Expression of CHOP was detected by probing the blot with anti-
CHOP antibody. Actin was used to detect equal protein load in all lanes.
UT 0 3 7 11 UT 0 3 7 11 post-treat time (h)
SIRT1+/+ SIRT1-/-
CHOP
actin
new protein synthesis
UT 0 3 7 11 UT 0 3 7 11 post-treat time (h)
SIRT1+/+ SIRT1-/-
CHOP
actin
new protein synthesis

103
3.4.9 SIRT1 and eIF2 associate regardless of stress condition
Since SIRT1 depleted cells showed higher eIF2 phosphorylation under stressed conditions and
downstream stress response, we wished to investigate if SIRT1-eIF2 association is regulated by
stress environment. HeLa cells were transfected with flag-tagged SIRT1 expression plasmid and
myc-tagged eIF2 expression plasmid, and treated with –leucine or tunicamycin. Whole cell
extracts were examined for SIRT1-eIF2 association by co-immunoprecipitation using epitope
tag antibodies. The results demonstrated that SIRT1 associated with eIF2 regardless of stress
condition (Figure 3.14).
Figure 3.14 SIRT1 associates with eIF2 regardless of stress condition
IP: myc myc myc IgG 25 g Input
-leu none +TM none none 1h treatment
WB: flag-SIRT1
WB: myc-eIF
IP: flag flag flag IgG 50 g Input
WB: eIF2α
WB: flag-SIRT1
-leu none +TM none none 1h treatment
IP: myc myc myc IgG 25 g Input
-leu none +TM none none 1h treatment
WB: flag-SIRT1
WB: myc-eIF
IP: flag flag flag IgG 50 g Input
WB: eIF2α
WB: flag-SIRT1
-leu none +TM none none 1h treatment

104
HeLa cells were transfected with flag-tagged SIRT1 and myc-tagged eIF2 expression plasmids. 24h post-
transfection, cells were either mock-treated or treated for with –leucine media or tunicamycin (2 g/ml) for 1 hr.
Whole cell lysates were used for immunoprecipitation of SIRT1 or eIF2 using anti-flag-tag or anti-myc-tag
antibody respectively and western blotted for eIF2 or flag antibody for SIRT1. IgG antibody was used as negative
control of immunoprecipitation and 25 or 50 g whole cell lysate was used as input. The blots were also probed for
the immunoprecipitated proteins.
3.4.10 SIRT1 catalytic activity or eIF2 phosphorylation does not affect SIRT1-eIF2
association.
SIRT1 is an NAD+ dependent deacetylase whose catalytic activity has been shown to play a role
in most of its cellular functions. So, we wished to examine if the catalytic domain of SIRT1
played any role in SIRT1-eIF2 association. For this, we used the catalytic mutant of SIRT1,
SIRT1-H363Y, in which the catalytic core domain was mutated by substituting the critical
histidine-363 residue with a tyrosine. HeLa cells were transfected with flag-tagged SIRT1, flag-
tagged SIRT1H363Y, myc-tagged eIF2 or myc-tagged eIF2 S51A (phosphorylation mutant
eIF2 ) as indicated, and SIRT1-eIF2 association was examined by co-immunoprecipitation. As
shown in Figure 3.15 our result suggests that wild-type as well as the catalytic mutant SIRT1
interacts with eIF2 . Furthermore, wild-type as well as the phosphorylation mutant eIF2 , both
associated with SIRT1 in HeLa cells.

105
Figure 3.15 SIRT1 associates with eIF2 regardless of SIRT1’s catalytic activity or eIF2 ’s phosphorylation
status
HeLa cells were transfected with the indicated expression plasmids. 24h post-transfection whole cell lysates were
extracted and used for immunoprecipitation of SIRT1 or eIF2 using anti-flag-tag or anti-myc-tag antibody
respectively and western blotted with flag antibody for SIRT1. IgG antibody was used as negative control of
immunoprecipitation and 25 g whole cell lysate was used as input.
Next we asked if SIRT1 may bind phosphorylated eIF2 more preferentially than un-
phosphorylated eIF2 . For this, we over-expressed SIRT1 either with the phosphorylation
mutant eIF2 , eIF2 S51A, or with the phosphorylation mimetic eIF2 , eIF2 S51D in HeLa
cells and analyzed SIRT1-eIF2 interaction by co-immunoprecipitaion. As shown in figure 3.16,
our results further confirmed that the association of SIRT1 and eIF2 is not dependent on the
phosphorylation state of eIF2 as the phosphorylation mutant and the phosphorylation mimetic
eIF , both interacted with SIRT1.
IP: IgG myc myc myc -----25 g input ------
WB: flag-SIRT1
+ + + - + + -
- - - + - - +
+ - + + - + +
- + - - + - -
flag-SIRT1
flag-SIRT1-H363Y
myc-eIF2
myc-eIF2 -S51A
IP: IgG myc myc myc -----25 g input ------
WB: flag-SIRT1
+ + + - + + -
- - - + - - +
+ - + + - + +
- + - - + - -
flag-SIRT1
flag-SIRT1-H363Y
myc-eIF2
myc-eIF2 -S51A

106
Figure 3.16 SIRT1 associates with the phosphorylation mutant and mimetic eIF2
HeLa cells were transfected with the indicated expression plasmids. 24h post-transfection whole cell lysates were
extracted and used for immunoprecipitation of eIF2 using anti-myc-tag antibody. Extracts were then analysed by
western blotting using flag antibody for SIRT1. IgG antibody was used as negative control of immunoprecipitation.
We also attempted to examine if eIF2 is an acetylated protein by immunoprecipitating eIF2
under stressed or unstressed conditions and probing with anti-acetyl lysine antibody. However,
we could not detect acetylation of eIF2 in our experiment (data not shown).
IP: myc myc myc IgG
WB: SIRT1
+ - - -
- + - -
- - + -
+ + + +
myc-eIF2
myc-eIF2 -S51A
myc-eIF2 -S51D
Flag-SIRT1
IP: myc myc myc IgG
WB: SIRT1
+ - - -
- + - -
- - + -
+ + + +
myc-eIF2
myc-eIF2 -S51A
myc-eIF2 -S51D
Flag-SIRT1

107
3.5 DISCUSSION
Regulation of gene expression at the post-transcriptional and translational level is an
important control mechanism. Translation is the final step in the flow of genetic information and
regulation at this level provides the cells with the capability to respond rapidly to changes in
physiological condition in response to environmental changes. Conditions such as cellular stress
due to heat, irradiation, hypoxia, nutrient deprivation, or apoptosis require immediate changes in
the protein levels of cells. Hence, cells have evolved a unique mechanism by which they can
quickly modulate the process of translation as per requirement. Under stressful conditions,
rather than investing energy in making more protein for maintenance, growth and proliferation
(which consumes up to an estimated 50% depending on the type of organism, [260,309]), cells
use their energy for cell survival processes. Attenuation of translation not only reduces the load
of protein synthesis on cells under stress, but also prevents synthesis of unwanted proteins that
may interfere with cellular stress response. Remarkably, however, despite the stress induced
translation attenuation, selective translation of stress responsive proteins is induced, indeed by
the same mechanism. eIF2 , a eukaryotic translation initiation factor, is a critical regulator for
translation in response to cellular stress. eIF2 phosphorylation by specific kinases in response
to specific stress stimuli induces attenuation of global translation, accompanied by selective
translation of proteins that are required for cell survival under stress.
In an effort to identify novel binding partners for SIRT1, we discovered that SIRT1
interacts with eIF2 . This was interesting because, while eIF2 plays a critical role in regulating
cellular stress response by attenuating translation under stress conditions, SIRT1 is believed to
regulate cell cycle, cellular senescence, apoptosis and metabolism, by functional interactions

108
with a number of transcription factors and other proteins. Calorie restriction mediated lifespan
extension in yeast and worms have been shown to be dependent on SIRT1. Apart from regulating
metabolism, SIRT1 is also believed to delay the aging process by regulating cellular stress
response such as oxidative stress and DNA damage. SIRT1 protects against genotoxic stress and
senescence by deacetylating and inactivating p53 [49,178]. It prevents stress-induced premature
senescence and inhibits apoptosis by regulating p53, E2F, FOXO and Ku70
[55,231,232,281,298,305]. Stress resistance is often considered as an effecter of longevity.
SIRT1’s widespread role in protection against stress indicates a potential link between SIRT1
mediated stress resistance and longevity. Thus, SIRT1’s association with eIF2 was very
interesting, because it indicated a potential novel role of SIRT1 in regulating stress response
through translation control.
Interestingly, although SIRT1 is predominantly known to be a nuclear protein, our data
(figure 3.5 and 3.6) indicated that SIRT1 localizes in the cytoplasm of multiple mammalian cell
types such as HeLa, 293T, Jurkat and murine embryonic fibroblasts. Others have reported
various cytoplasmic substrates and functions of SIRT1, such as IRS2 [326] and acetyl-CoA [110]
and SIRT1’s role in inhibiting Bax mediated apoptosis via Ku70. The cytoplasmic localization
and functions of SIRT1 are very relevant to our observation that SIRT1 associates with eIF2
since the major function of eIF2 is in protein synthesis, which is a cytoplasmic process.
Interestingly, the majority of SIRT1 substrates identified thus far are transcription factors, which
mediate SIRT1’s role by regulating gene expression at the level of transcription. Thus, SIRT1’s
association with eIF2 suggested a novel category of SIRT1 target proteins, namely a
‘translation’ factor, thereby indicating the potential role for SIRT1 in translational regulation.

109
Phosphorylation of eIF2 by four different eIF2 kinases in response to specific stress
stimuli is one of the early steps in the coordinated cellular stress response. While under stress,
cells have to reprogram their gene expression such that it can reduce the load of protein synthesis
to save energy and at the same time make sure that translation of proteins required for cell
survival during stress conditions is activated. The integrated stress response involves 1)
inhibition of growth and proliferation by translation attenuation of global proteins, 2) increased
expression of chaperone proteins to increase cellular protein folding capacity for maintenance of
macromolecular integrity, 3) increased sysnthesis of repair and damage control proteins such as
glutathione and superoxide-dismutase to recover from stress related damage and finally 4)
induction of apoptotic pathway proteins in case of severe damage where eliminating damaged
cells is important to protect the organism [169]. eIF2 plays a role in the rate limiting step of
protein synthesis, and phosphorylation of eIF2 is cardinal to translation attenuation in response
to cellular stress and induction of stress protein synthesis.
Since SIRT1 also plays a role in stress response, we investigated if its association with
eIF2 has any relevance to stress-mediated eIF2 phosphorylation. Interestingly, we observed
that depletion of SIRT1 resulted in increased eIF2 phosphorylation in response to various stress
stimuli. In order to verify whether or not the difference in phosphorylation of eIF2 between
SIRT1 depleted and control cells was a time dependent effect, we further performed a time
course for ER stress (thapsigargin) or a.a starvation (-leucine) in wild-type and SIRT1 depleted
cells. We found that, eIF2 phosphorylation was much more robust and sustained in SIRT1
depleted cells. Notably, we saw faster and more prominent induction of eIF2 phosphorylation
in SIRT1 depleted cells in response to both stress types; a.a starvation and TG induced ER stress.

110
Interestingly though, we observed that the SIRT1 deficient cells which showed higher eIF2
phosphorylation showed much delayed expression of the stress responsive protein CHOP (Figure
3.10). One of the important regulatory mechanisms of eIF2 mediated stress response is the
negative feedback loop that functions later in the stress response and plays a role in translation
recovery after the initial stress induced attenuation of protein synthesis. This process involves de-
phosphorylation of eIF2 by proteins that are synthesized downstream to the stress response
signaling cascade. The feed-back inhibition of eIF2 phosphorylation is important for translation
of genes required for recovery and survival of stressed cells. A delayed expression of the
downstream stress response proteins can hinder with the dephosphorylation of eIF2 through the
negative feedback loop, which in turn can affect translation recovery in the later phase of stress
response.
Since we observed that SIRT1 depleted cells demonstrate delayed CHOP expression and
a more sustained eIF2 phosphorylation in response to stress, we investigated if SIRT1 deficient
cells were more sensitive to stress. In response to a 24 hour-long free radical stress induced by
two different agents; paraquat and hydrogen peroxide, the SIRT1 null cells showed significantly
more sensitivity compared to the matched control cells. This suggests that SIRT1 may be
important for cell survival during the prolonged stress response. This is consistent with our
observation that SIRT1 deficient cells show sustained eIF2 phosphorylation which could be
due to impaired translation recovery during the later phase of stress response, thereby rendering
cells more prone to death.
We attempted to invesitigate this further by examining new protein systhesis in SIRT1
deficient versus wild-type cells at various time points post-stress treatment by 35S-radiolabeled
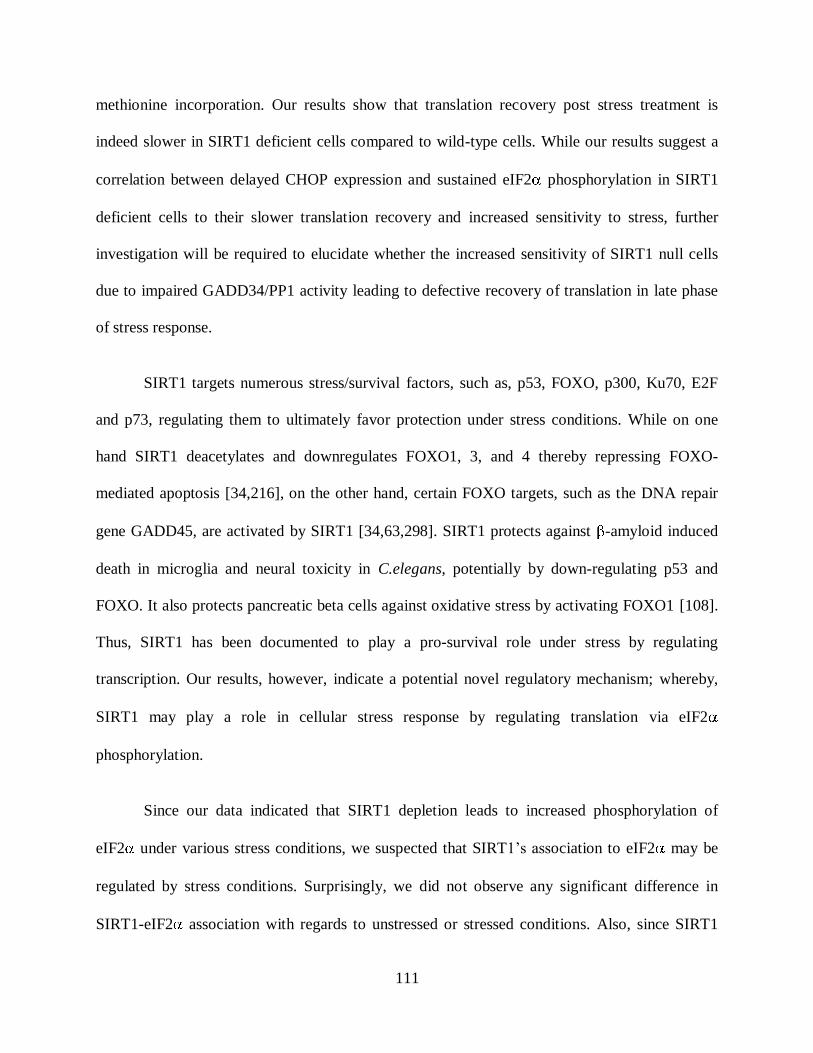
111
methionine incorporation. Our results show that translation recovery post stress treatment is
indeed slower in SIRT1 deficient cells compared to wild-type cells. While our results suggest a
correlation between delayed CHOP expression and sustained eIF2 phosphorylation in SIRT1
deficient cells to their slower translation recovery and increased sensitivity to stress, further
investigation will be required to elucidate whether the increased sensitivity of SIRT1 null cells
due to impaired GADD34/PP1 activity leading to defective recovery of translation in late phase
of stress response.
SIRT1 targets numerous stress/survival factors, such as, p53, FOXO, p300, Ku70, E2F
and p73, regulating them to ultimately favor protection under stress conditions. While on one
hand SIRT1 deacetylates and downregulates FOXO1, 3, and 4 thereby repressing FOXO-
mediated apoptosis [34,216], on the other hand, certain FOXO targets, such as the DNA repair
gene GADD45, are activated by SIRT1 [34,63,298]. SIRT1 protects against -amyloid induced
death in microglia and neural toxicity in C.elegans, potentially by down-regulating p53 and
FOXO. It also protects pancreatic beta cells against oxidative stress by activating FOXO1 [108].
Thus, SIRT1 has been documented to play a pro-survival role under stress by regulating
transcription. Our results, however, indicate a potential novel regulatory mechanism; whereby,
SIRT1 may play a role in cellular stress response by regulating translation via eIF2
phosphorylation.
Since our data indicated that SIRT1 depletion leads to increased phosphorylation of
eIF2 under various stress conditions, we suspected that SIRT1’s association to eIF2 may be
regulated by stress conditions. Surprisingly, we did not observe any significant difference in
SIRT1-eIF2 association with regards to unstressed or stressed conditions. Also, since SIRT1

112
functions predominantly by deacetylating various target proteins, we examined if the association
of SIRT1 with eIF2 depended on the intergrity of SIRT1’s catalytic domian. Interestingly, we
observed that SIRT1 associates with eIF2 regardless of an intact catalytic domain. Furthermore,
we could not detect eIF2 to be acetylated under stressed or unstressed conditions. By
examining the phosphorylation of eIF2 kinases in SIRT1 depleted cells in response to stress,
we could not detect any difference in the activity of these kinases with regards to SIRT1’s
presence or absence (data not shown). Although we can not rule out the regulation of eIF2
phosphorylation by deacetylase activity of SIRT1, it is also possible that SIRT1 regulates eIF2
phosphorylation by acting as a scaffold protein, thereby binding and masking the potential
phosphorylation site on eIF2 . In this regard, we investigated if SIRT1 had any binding
preference for phosphorylated versus de-phosphorylated versions of eIF2 , by using a
phosphorylation mutant eIF2 , eIF2 S51A and a phosphorylation mimetic eIF2 , eIF2 S51D.
However, our results showed that SIRT1 binds to eIF2 , irrespective of its phosphorylation
status. While this observation is slightly puzzling, it is possible that when exogenously over-
expressed, these two proteins have strong enough affinity for each other to bind regardless of any
conditions. Alternatively, there could be a temporal regulation of SIRT1-eIF2 association with
regards to eIF2 de-phosphorylation.
While the mechanism of SIRT1 mediated regulation of eIF2 is still unclear, our data
suggests a role for SIRT1 in eIF2 mediated stress response, thereby indicating, for the first
time, a role for SIRT1 in translation regulation to control cellular stress response. Given that
SIRT1 plays a role in cell survival and protection against age-related diseases, its role in

113
translation attenuation, in response to cellular stress, can open up new directions for SIRT1
mediated therapeutic intervention of stress related diseases.

114
4.0 SIRT1 NEGATIVELY REGULATES MAMMALIAN TARGET OF RAPAMYCIN
(TOR) THROUGH TSC2
Hiyaa Singhee Ghosh et al.

115
4.1 ABSTRACT
Calorie restriction (CR) or mutations in Insulin/insulin-like growth factor (IGF)-1 signaling are
two conserved pathways implicated in longevity in yeast, worms, flies and mice. SIRT1 is
required for CR mediated lifespan extension in yeast, worm, fly and potentially in mice. SIRT1
is also believed to be involved in insulin/IGF-1 signaling mediated longevity in a range of
organisms by acting through the forkhead proteins. Downstream to the insulin/IGF-1 pathway is
the target of rapamycin (TOR), which has been implicated in regulating cell growth and stress
resistance in response to nutrients, growth factors, energy and stress conditions. TOR has been
found to be involved in extending lifespan in yeast and Drosophila. The mammalian target of
rapamycin (mTOR) and SIRT1, have both been shown to be involved in several age-related
diseases. Although the mechanism by which SIRT1 potentially regulates longevity in mammals
is still not understood, it is conceivable that SIRT1 may regulate the IGF-1/mTOR signaling to
mediate longevity in mammals.
Here we demonstrate that SIRT1 regulates mTOR signaling. SIRT1 deficient or depleted
cells show elevated mTOR activity. In addition, SIRT1 activator, resveratrol reduces whereas,
inhibitor, nicotinamide, enhances mTOR acitivty in a SIRT1 and TSC2-dependent manner.
Furthermore, SIRT1 physically associates with TSC2 in vivo. These results indicate that SIRT1
potentially regulates mTOR signaling through its deacetylase activity on the TSC1/TSC2
complex. Thus, we demonstrate for the first time that SIRT1 and mTOR, two proteins that are
involved in longevity pathways and age related diseases, are potentially interconnected at a point
upstream of the mTOR complex-1.

116
4.2 INTRODUCTION
In the past few decades, work in the field of aging research has indicated that aging, like most
physiological functions, is a regulated process mediated through multiple signaling pathways.
Common genetic and environmental factors regulate aging in different species through diverse
regulatory mechanisms showing that some of the pathways believed to be involved in aging are
evolutionarily conserved. Caloric restriction (CR) and the Insulin/IGF-1 signaling pathway are
two such conserved mechanisms that have been shown to regulate lifespan in a wide range of
organisms: from the unicellular yeast to mammals.
SIRT1, the NAD+ protein deacetylase has been shown to extend lifespan in yeast,
worms, flies and potentially in mammals. Interestingly, CR has been shown to increase lifespan
in yeast, Drosophila, C. elegans and mice [104,146,165,256,257,277,311,313], and reduces
many age related physiological symptoms in mammals such as free radicals, damaged
macromolecules, plasma insulin, body temperature, and weight. CR has been shown to also
delay the onset of many age related diseases in mammals such as cancer, diabetes and various
neurodegenerative disorders [168]. Furthermore, the CR mediated lifespan extension in yeasts,
worms and flies have been shown to be SIRT1 dependent. Sirtuins are known to mediate at least
some of the effects of CR and extend lifespan, potentially by regulating stress response and
metabolism [41].
Genetic analyses of the aging processes in multi-cellular organisms, including C. elegans,
Drosophila and mice have shown that a single-gene-mutation significantly extends lifespan in all
these organisms. Like CR, modulation of genes in the insulin-signaling pathway, which alters
nutrient sensing, has been shown to extend lifespan in various species [103,104,203,238,291]. It
has been theorized that CR regulates certain genetic pathways that shift an organism’s metabolic

117
investment from reproduction and growth toward somatic maintenance, allowing survival under
stressed conditions until there are suitable reproductive conditions [124,161,291]. The best
characterized pathway so far is the insulin/insulin-like growth factor-1 endocrine system. In C.
elegans, in response to starvation or crowding, the insulin/IGF-1 signaling pathway controls the
formation of the dauer larva, an alternative developmental state that is non-reproducing, stress
resistant, and long lived [164,254]. Mutations in genes of the same pathway, daf-2 (insulin
receptor) and age-1 (phosphatidyl inositol-3 kinase), lead to doubling of lifespan, and render the
animals more sensitive to dauer formation [157]. Both the dauer formation and lifespan-
extension phenotypes are suppressed by mutations in daf-16, a forkhead family transcription
factor [157,304]. Similarly, Drosophila mutations in Inr (insulin-like-receptor) and chico
(insulin-receptor substrate), both regulate lifespan [54,291]. The insulin/IGF-1 signaling
pathway is nutrient activated and decreased signaling through this pathway increases lifespan in
C. elegans and mice [156,157]. Interestingly, the SIRT1 orthologs have been shown to interact
with insulin/IGF-1 signaling pathway in C. elegans and mice. In particular, SIRT1 regulates the
IGF-1/Akt/FOXO signaling pathway in C. elegans, and mice through deacetylation of FOXO
[34,55,294]. Also, CR has been shown to reduce rodent serum IGF-1 levels [72] and this
reduction appears to mediate, at least in part, its lifespan prolonging effects [168,275,281], thus
linking the reduction in IGF-1 mediated longevity to CR. Interestingly, Cohen et al. [55] showed
that CR-induced SIRT1 induction could be attenuated by IGF-1 and treatment of cells with either
insulin or IGF-1 lowers SIRT1 levels, indicating the inverse relationship between SIRT1 and
insulin/IGF-1 pathway in stress resistance, cell survival and longevity.

118
Figure 4.1 SIRT1, CR and IGF-1 signaling in aging and longevity
In yeast Sir2p (SIRT1) activity is increased through increased expression of the NAD+ salvage pathway enzyme,
nicotinamidase PNC1, but also by increasing the NAD+/NADH ratio (or lowering NADH levels) in response to
calorie restriction (CR). Main cause of aging in yeast is considered to be the exponential accumulation of
extrachromosomal circular DNA repeats (ERCs). Increased NAD+ and PNC1 which activates Sir2p, inhibit the
formation of the deleterious extrachromosomal circular DNA repeats (ERCs) and contribute to life span extension in
yeast. The glucose and nutrients fermentation pathway activates the AKT-related kinase Sch9 which induces
oxidative stress and participates in yeast aging. Under severe CR inactivation of this pathway promotes longevity in
yeast. The longevity pathway is conserved amongst worms, flies and mammals. Activation of the insulin growth
factor receptor IGFR (Daf-2/dIGFR) activates the insulin receptor substrate IRS (p65/CHICO), which stimulates
phosphoinositol-3 kinase PI3K (AGE-1/dPI3K), which in turn phosphorylates the PKB/AKT kinase. AKT
phosphorylates and inactivates FOXO (Daf-16/dFOXO). Inactivation of the insulin receptor pathway promotes
longevity in worms, drosophila, and mammals through increased activity of FOXO. Sir2/SIRT1 activation induces
life span extension through interaction with Daf-16/FOXO factors. PNC1=pyrazinamidase/Nicotinamidase 1;
Sir2p=yeast silent information regulator 2; NADH=reduced form of nicotinamide adenine dinucleotide;
Sch9=Saccharomyces cerevisiae protein kinase 9; Daf-16=‘dauer’ larvae transcription
MAMMALS
Nutrients/
hormones
Insulin/ IGF1
receptor
IRS
AKT
FOXO
Fasting
Resveratrol
SIRT1
AGING
PI3K
FLY
Nutrients/
hormones
Insulin receptor
CHICO
AKT
dFOXO
Caloric
Restriction
dSir2
AGING
Sir2.1
Gene
silencing
ERCs
Caloric
Restriction
CR
Nicotinamidase
PNC1NADH
Sch9
oxidative
stress
Severe CR
AGING
YEAST WORM
nutrients
Daf2
AGE-1
AKT
DAF-16
Caloric
Restriction
Sir2.1
Induction of
ER stress
proteinsAGING
dPI3K
?
Stress response
Metabolism
Development
Cell cycle etc
Rpd3
MAMMALS
Nutrients/
hormones
Insulin/ IGF1
receptor
IRS
AKT
FOXO
Fasting
Resveratrol
SIRT1
AGING
PI3K
FLY
Nutrients/
hormones
Insulin receptor
CHICO
AKT
dFOXO
Caloric
Restriction
dSir2
AGING
Sir2.1
Gene
silencing
ERCs
Caloric
Restriction
CR
Nicotinamidase
PNC1NADH
Sch9
oxidative
stress
Severe CR
AGING
YEAST WORM
nutrients
Daf2
AGE-1
AKT
DAF-16
Caloric
Restriction
Sir2.1
Induction of
ER stress
proteinsAGING
WORM
nutrients
Daf2
AGE-1
AKT
DAF-16
Caloric
Restriction
Sir2.1
Induction of
ER stress
proteinsAGING
dPI3K
?
Stress response
Metabolism
Development
Cell cycle etc
Rpd3

119
factor-16; AGE-1=worm homolog of the phosphoinositol-3 kinase; AKT=protein kinase B; Rpd3=reduced
potassium dependence 3 (class II histone deacetylase); IGF-1=insulin growth factor-1; FOXO=forkhead box
subgroup ‘O’ transcription factor; IRS=insulin receptor substrate; CHICO=drosophila homolog of IRS;
SIRT1=sirtuin 1.
In Drosophila, nutrient and insulin signaling have been shown to be critical factors in
regulating not only lifespan but also growth and size [230]. Mutations of genes involved in the
insulin signaling pathway have shown reduction in fly size [25,32,180]. The highly conserved
TOR (target of rapamycin) kinases, which is a downstream component of the insulin/IGF-1
signaling pathway, has emerged as a prominent player in regulating cell growth, size and
longevity. Recent evidence suggests that the fat body in Drosophila acts as a nutrient sensor,
which uses TOR signaling to generate a humoral signal that modulates insulin signaling and
growth in peripheral tissues [57]. Over-expression of dTSC1 or dTSC2, upstream effectors of
TOR, or mutation in dTOR or dS6K (downstream TOR susbstrate), leads to longevity phenotype
in Drosophila [151]. TOR deficiency in the nematode C.elegans was recently shown to extend
lifespan [303]. Furthermore, in yeast 6 out of 10 gene mutations that increased the replicative life
span corresponded to components of the TOR pathway including TOR and S6K1 (Sch9) that
play a role in the regulation of translation [150].
TOR, which is specifically inhibited by the macrolide rapamycin, belongs to a family of
phosphatidylinositol kinase-related kinases (PIKK). These proteins contain a carboxy-terminal
serine/threonine protein kinase domain that resembles the catalytic domain of
phosphatidylinositole 3-kinases (PI3Ks) and PI4Ks. Amino-terminal to the kinase domain in
TOR is the FKBP12-rapamycin binding domain. Rapamycin forms a complex with the
intracellular cofactor, the peptidyl-propyl cis/trans isomerase, FKBP12, which then binds and

120
inhibits TOR. Single amino acid substitutions in this domain yield TOR proteins (TOR1-1 and
TOR2-1) that are no longer bound and inhibited by FKBP12-rapamycin complex. TOR was
originally identified by mutations, TOR1-1, and TOR2-1, that conferred resistance to the growth
inhibitory properties of rapamycin, in budding yeast Saccharomyces cerevesiae [120].
Subsequent biochemical studies in mammalian cells led to the identification of the mammalian
target of rapamycin, mTOR. TOR has been found to be conserved in all eukaryote genomes
examined, including yeast, algae, slime mold, plants, worms, flies and mammals. Unlike yeast,
which in some cases have two TOR genes, higher eukaryotes possess only a single TOR gene
[60,61,179].
Genetic and biochemical studies in yeast have identified that there are two distinct TOR
complexes; TOR complex-1 (TORC1) and TOR complex-2 (TORC2) (Figure 4.2). While
TORC1 is rapamycin sensitive and regulates the temporal cell growth, TORC2 is rapamycin
insensitive and decides the spatial aspects of cell growth.

121
Figure 4.2 TOR complex 1 (TORC1) and TOR complex 2 (TORC2)
The mammalian target of rapamycin (mTOR) exists in two multimeric complexes: mTOR complex 1 (TORC1) and
mTOR complex2 (mTORC2). TORC1 mediate the rapamycin-sensitive signaling branch that couples growth cues to
the accumulation of mass in response to positive stimuli. TORC2 signaling is rapamycin –insensitive and is required
for the organization of the actin cytoskeleton.
Similar to yeast, mammals also have two TOR complexes. mTOR complex-1 (mTORC1)
consists of the mTOR (289kD), raptor(150kD) and mLST8 (also called G L) (36kD), and
potentially regulates the temporal aspects of cell growth. mTORC1 is bound by FKBP12-
rapamycin which results in inhibition of mTORC1 kinase activity both in vivo and in vitro
[111,158,263]. Although the mechanism by which FKBP12-rapamycin inhibits mTORC1 is not
fully understood, it has been shown that FKBP12-rapamycin complex disassociates raptor-
mTOR [158], suggesting that FKBP12-rapamycin blocks access to substrates. In another
mLST8Raptor
mTOR
Nutrients stress rapamycin
Ribosome
biogenesis Translation Autophagy
mTOR complex 1
mTORC1
S6K1S6K2
CLIP-1704E-BP1
mLST8Rictor
mTOR
Actin organiszation
mTOR complex 2
mTORC2
PKCRAC1
Akt1
mLST8Raptor
mTOR
mLST8Raptor
mTOR
Nutrients stress rapamycin
Ribosome
biogenesis Translation Autophagy
mTOR complex 1
mTORC1
S6K1S6K2
CLIP-1704E-BP1
mLST8Rictor
mTOR
Actin organiszation
mTOR complex 2
mTORC2
PKCRAC1
Akt1
mLST8Rictor
mTOR
Actin organiszation
mTOR complex 2
mTORC2
PKCRAC1
Akt1

122
experiment it was shown that FKBP12-rapamycin inhibits mTORC1 autophosphorylation,
suggesting that FKBP12-rapamycin inhibits the intrinsic mTORC1 kinase activity [138].
TOR complex-2 (mTORC2) consists of mTOR, mLST8 and rictor (200kD). Knockdown
of mTOR or rictor (but not raptor) results in loss of both actin polymerization and cell spreading,
indicating a role in the spatial aspect of cellular growth. mTORC2 is neither bound by FKBP12-
rapamycin nor is inhibited by it [138,263]. TOR kinases integrate various signals to regulate cell
growth. The four major inputs that are sensed by mTOR are: growth factors, nutrients, energy
and stress (Figure 4.3).
mTOR pathway responds to growth factors via the phosphoinositide-3-kinase (PI3K)
pathway. Binding of insulin/IGF-1 to their receptors leads to the recruitment and
phosphorylation of the insulin receptor substrate (IRS) and subsequent recruitment of P13K. This
activates the PI3K signaling in which PI3K bound to IRS converts phosphatidylinositol-4, 5-
phosphate (PIP2) to phosphatidylinositol-3, 4, 5-phosphate (PIP3). PIP3 co-recruits PDK1 and
Akt to the membrane, resulting in the phosphorylation and activation of Akt by PDK1. PIP3
accumulation is antagonized by the lipid phosphatase PTEN. Activation of Akt enables it to
phosphorylate and inactivate TSC2.

123
Figure 4.3 mTOR signaling in mammalian cells
In response to growth factors (insulin/IGF-1), energy status, nutrients (amino acids) and stress signals, various
signaling pathways are activated. Most of these pathways converge at the major upstream regulator of mTOR, the
TSC1/TSC2 complex, which in turn regulate the downstream mTOR activator Rheb.
TSC1-TSC2 acts as a heterodimmer that negatively regulates mTOR signaling by acting as a
GAP (GTPase activating protein) for small GTPase Rheb [195,196]. Although Rheb binding to
mTOR is independent of Rheb possessing the guanyl nucleotide, the GTP bound Rheb is an
activator of mTORC1, while the nucleotide-free Rheb acts as an inhibitor [195,196,279].
IGF-1
IRS
P13K
Akt/PKB
TSC1
TSC2
Rheb
mTORC1
4EBP1
S6K1
S6eIF4E
Low
energyLKB1
AMPK
HYPOXIA
HIF1
REDD1
nutrients
resveratrol
DNA
damagep53
PDK1
PTENNF1
RAS
RSK
ERK
mTORC2
Rho, Rac PKC
Akt/PKB
?
Protein synthesis
MetabolismRibosome
biogenesis Transcription
Autophagy Actin organization
Rapamycin
IGF-1
IRS
P13K
Akt/PKB
TSC1
TSC2
Rheb
mTORC1
4EBP1
S6K1
S6eIF4E
Low
energyLKB1
AMPK
Low
energyLKB1
AMPK
HYPOXIA
HIF1
REDD1
nutrients
resveratrol
DNA
damagep53DNA
damagep53
PDK1
PTENNF1
RAS
RSK
ERK
mTORC2
Rho, Rac PKC
Akt/PKB
?
Protein synthesis
MetabolismRibosome
biogenesis Transcription
Autophagy Actin organization
Rapamycin

124
Inactivation of TSC2 by Akt phosphorylation thus activates mTOR signaling in response to
insulin/IGF-1.
Nutrients, especially amino acids, have been proposed to activate mTORC1 either via
inhibition of TSC1/2 complex [92] or via stimulation of Rheb [279]. hVPS34, a class III PI3K
(converts phosphatidylinositol to phosphatidylinositol-3-phosphate) have also been reported to
signal amino acid availability to mTORC1 independently of the TSC1-2/Rheb axis [37,223].
TORC1 senses the cellular energy status through AMP-activated protein kinase (AMPK). AMPK
is activated in response to low cellular energy (high AMP/ATP ratio). Activated AMPK then
down-regulates energetically demanding processes like protein synthesis and stimulates ATP-
generating processes such as fatty acid oxidation. Activated AMPK directly phosphorylates
TSC2 at sites different than Akt phosphorylation sites and enhances its GAP activity, leading to
inhibition of mTORC1 signaling. The tumor suppressor LKB1 acts as the upstream activator
kinase for AMPK. Interestingly, it has been suggested that Akt activates mTORC1 not only by
direct phosphorylation and inactivation of TSC2 but also by maintaining high ATP levels,
thereby causing decrease in AMP/ATP ratio and turning off AMPK mediated activation of TSC2
[73].
Cells regulate environmental stress, such as hypoxia and low energy, by down-regulating
energy demanding processes and arresting growth. Under hypoxia, TOR signaling is inhibited
thereby down-regulating protein synthesis. The signal for hypoxia is mediated to mTORC1 via
REDD1 and REDD2 [33,252] whose expression is up-regulated by the transcription factor HIF1.
REDD acts upstream to TSC1/2 and downstream to Akt to inhibit mTORC1. REDD also acts
independent of LKB1-AMPK pathway to regulate mTORC1. Other stresses like DNA damage is
linked to mTORC1 through p53 [74]. p53 activated by DNA damage down-regulates mTORC1

125
via the AMPK-TSC2 pathway. A reducing environment is signaled to mTORC1 through the
redox sensor in the FATC domain of mTOR [65,264].
Other than Akt and AMPK, TSC2 is also regulated through phosphorylation by the
Ras/MAPK/Erk pathway. Ras activates Raf/MEK1/2-Erk1/2 cascade. Activated Erk1/2 then
directly phosphorylates TSC2 at sites that differ from the Akt target sites and inactivates TSC1/2
complex [199]. MAPK activates RSK1 which phosphorylates and inhibits TSC2 causing
activation of mTORC1 signaling [259].
Thus, different growth and stress pathways converge at the TSC1-TSC2 complex to
regulate mTORC1 signaling. The best studied mTOR targets are the translation regulators S6K1
and 4EBP1. Both S6K and 4EBP1 have a conserved five amino acid sequence called the TOR
signaling (TOS) motif. The TOS motif found at the N-terminus of S6K (Phe-Asp-Ile-Asp-Leu)
and in the C-terminus of 4EBP1 (Phe-Glu-Met-Asp-Ile) is necessary for phosphorylation of these
proteins by mTORC1 in vivo [267]. By phosphorylating these two substrates, mTOR regulates
translation initiation. S6K1 belongs to the AGC family of protein kinases and needs to be
phosphorylated at its C-terminus hydrophobic motif as well as a site in the T loop of its kinase
domain. mTORC1 phosphorylates thr389 in the hydrophobic domain of S6K1. Activated S6K1
phosphorylates and activates the 40S ribosomal protein S6 which plays a role in translation of
the 5’tract oligopyrimidine (5’TOP) mRNA. These mRNAs encode for ribosomal proteins and
elongation factors, thus playing a role in increasing the translation capacity in general. S6K also
phosphorylates the elongation factor 2 kinase (eEF2K) [306]. However, some reports have
suggested that S6K or S6 are not required for TOP mRNA translation [239,261]. mTORC1 also
promotes cap-dependent translation by phophorylating and inactivating the 4EBP1 inhibitory

126
protein. This results in release of eIF4E, which can then associate with eIF4G to stimulate
translation initiation.
Apart from regulating translation through S6K and 4EBP1, mTORC1 also regulates
ribosomal biogenesis by regulating rRNA gene transcription. mTORC1 plays a role in gene
expression by regulating transcription of metabolic and biosynthetic pathway genes through URI
(unconventional prefoldin RPB5 interactor). mTORC1 has been recently reported to regulate the
self renewal processes, autophagy, by inhibiting the protein kinase ATG1 and also by regulating
trafficking of nutrient transporters thereby promoting uptake of glucose, amino acids,
lipoproteins and iron [73,209,317]. Furthermore, Kim et al. have shown that mTORC1 may
regulate adipogenesis, since rapamycin prevents adipocyte differentiation and lipid accumulation
[159]. Although the mechanism by which mTORC1 regulates adipogenesis is not clear, it is
believed that the nuclear receptor PPAR may be involved. Interestingly, SIRT1 regulates
adipogenesis and lipid metabolism by regulating PPAR and other factors.
Recent studies suggest that constitutive activation of TSC-mTOR-S6K1 signaling
induces a negative feedback loop to attenuate PI3K-PDK1-Akt pathway via phosphorylating and
inhibiting IRS [117,272,297]. S6K1, in particular, regulates IRS1 both at the transcriptional level
as well as through phosphorylation, thereby abolishing IRS1 adaptor function [297]. It was
shown that loss of TSC1 or TSC2 in mouse embryonic fibroblasts (MEFs) or Drosophila, leads
to a strong inhibition of insulin-mediated PI3K signaling [32]. Interestingly, S6K1 has also been
found to phosphorylate mTOR at Thr2446 and Ser2448. S6K mediated mTOR phophorylation is
dependent on PI3K and is increased in response to constitutively active Akt, indicating a
feedback loop [50,125]. The effect of phosphorylation of mTOR at Thr2446/Ser2448 on
mTORC1 signaling is yet to be identified.

127
Detailed analysis of the mTOR pathway has revealed that mTORC1 signaling is tightly
linked to tumorigenesis. Aberrantly high mTORC1 activity appears to be responsible for many
cancers and hamartoma syndromes (characterized by benign tumors). The specific mTOR
inhibitor rapamycin and its various derivates are currently under clinical trial as cancer drugs.
Rapamycin has also been used as an allograft rejection drug as it interferes with T cell activation,
thereby acting as an immunosuppressive agent in renal, liver and cardiac transplantation.
Recently, inhibitors of mTOR are also being tested for treatment against several autoimmune
disorders such as rheumatoid arthritis, psoriasis, multiple sclerosis and Parkinson’s disease [321].
mTOR inhibitors are also being considered for cardiac hypertrophy, a major risk factor for heart
failure, since overgrowth of cardiomyocytes is dependent on the PI3K-mTORC1 pathway
[135,292].
Lifespan extension has been linked with phenotypes including stress resistance,
metabolic rate, lipid level, reproductive capacity and body size [8,194,226], which are affected
by CR. The molecular mechanism by which CR extends lifespan is not yet clear, however,
evidence suggest that IGF-1/TOR pathways may play a key role. First, CR reduces the plasma
IGF-1 levels [31]. Second, the CR mediated lifespan extension of Drosophila and yeast is not
increased further by mutations in the IGF/TOR pathway [150]. Finally, the TOR pathway acts as
a nutrient sensor which, like SIRT1, makes it a good candidate to mediate the effect of CR on
lifespan. Both mTOR and SIRT1 have been shown to be involved in pathways eliciting these
physiological attributes, suggesting that these pathways may possibly coordinate or intersect with
each other. Despite a conceivable link between SIRT1 mediated regulation of metabolism,
longevity and age related diseases, and mTOR mediated regulation of pathways involved in
growth signaling, longevity and diseases, no direct link has been established yet between these

128
two important regulators. We wished to investigate a possible overlap between mTOR and
SIRT1 with regards to stress resistance and cell growth. In the present section we demonstrate
for the first time that SIRT1 indeed regulates mTOR signaling through TSC2 and this regulation
is potentially mediated through SIRT1’s deacetylase activity.

129
4.3 MATERIALS AND METHODS
4.3.1 Cell culture and treatment and transfection
HeLa, 293T and Jurkat cells were purchased from ATCC and maintained in DMEM media
(Dulbecco’s modified Eagle’s media) supplemented with 10% heat inactivated fetal bovine
serum and 100U penicillin, 100U streptomycin and 0.25 g/ml amphotericin B (antibiotic-
antimycotic; GIBCO # 15240-062), Hepes buffer and 2mM L-glutamine. Cells were cultured at
370C, 19% O2 and 5% CO2. The SIRT1-wild-type and SIRT1 null mouse embryonic fibroblasts
were a gift from Dr. Michael McBurney, University of Ottawa, Canada. These cells were also
maintained in the DMEM growth media. SIRT1 MEFs were cultured at 370C, 15% O2 and 5%
CO2. For various treatments, cells were seeded at about 80% confluency in culture dishes and
cultured for overnight in normal growth media. Next day, cells were treated treatment media
such as: leucine negative media (RPMI 1640, Cellgro, # 10-040-CV), glucose negative media
(DMEM ), serum negative media (Normal growth media without FBS), 2 μg/ml tunicamycin,
TM (SIGMA # T7765) in normal growth media, 500μM H2O2 in normal growth media, 200nM
insulin in normal growth media, rapamycin (SIGMA# R0395), resveratrol (SIGMA # R5010)
and nicotinamide. The solvent for chemicals like TM, insulin and H2O2 were used in similar
concentration for mock-treatment where ever possible. Cells were harvested by treating cells
with trypsin-EDTA (Cellgro, # 25-053-Cl) for 2mins in 370C incubator. Cells were washed by
re-suspending cells in growth media and centrifugation at 5000g in a table-top centrifuge.
For transfection, cells were seeded at ~80% confluency in DMEM growth media without
antibiotic-antimycotic, and cultured overnight. Cells were transfected the next day using
Lipofectamine2000 transfection reagent (Invitrogen # P/N 52887) according to manufacturer’s

130
protocol. The transfection media on cells were replaced with normal growth media 6hrs post-
transfection. The next day cells were treated as required for specific experiments and harvested
for analysis.
4.3.2 Immunoflorescence Microscopy
HeLa cells were seeded on sterilized (in 99% ethanol) coverslips at 60 % confluency in a 6 well
plate and cultured in normal growth media for overnight. Cells were fixed in 2%
paraformaldehyde for 15 min at room temperature. Immunostaining was performed by
incubating fixed cells in 1:1000 diluted anti-SIRT1 (mouse, clone 2G1/F7, Upstate) antibody for
1hr, followed 45 min incubation with secondary antibody conjugated with alexa-fluor488 (anti-
mouse) at RT. DAPI (blue) was used for nuclear staining. Following the secondary antibody
treatment, cells were washed with PBS and the coverslips were mounted on slides in Vectashield
(Vector Labs, Burlingame, CA) for fluorescent microscopy. Samples were examined by using
an Eclipse E600 microscope (Nikon). Pictures were taken at 40X magnification.
4.3.3 F-actin staining using rhodamine-phalloidin
Cells were seeded in a 6 well plate on sterilized cover-slips and grown for 24 hr. Cells were then
fixed in 2% formaldehyde for 15 mins at room temperature. Rhodamine-conjugated phalloidin
(Molecular probes) was used for F-actin staining and DAPI was used as nuclear stain. The cells
were examined for fluorescence under fluorescent microscope and pictures were taken at 40X
magnification.

131
4.3.4 Whole cell lysate preparation and protein quantification
Whole cell lysates were made by lysing cells in NP-40 lysis buffer (20mM TrisHCL, pH8.0,
137mM NaCl, 10% glycerol, 1% nonidet P-40, 2mM EDTA). 1X protease inhibitor cocktail
(SIGMA # P2714) was added to lysis buffer just before lysis. Cells were lysed for 20 min on ice
and lysate was separated from cell debris by centrifugation for 20 min at 13000g in a micro-
centrifuge at 4oC. For total protein extracts from kidney tissue, kidney was homogenized in the
RIPA lysis buffer (50 mM Tris·HCl/1% Nonidet P-40/150 mM NaCl/1 mM EDTA/1 mM NaF/1
mM Na3VO4) and protease inhibitors (Roche Molecular Biochemicals # 1836170) and
centrifuged for 20 min at 15,000 × g at 4°C. Nuclear and cytoplasmic sub-cellular fractionation
was done using NE-PER fractionation kit (Pierce, #78833). Protein concentration of the cell
lysates were estimated by Bradford assay. 2 l of lysate was added to 1ml BioRad protein assay
reagent (#500-0006, BioRad Labs, Hercules, CA). 0, 1, 2, 3, 4, 6 and 8 g BSA (SIGMA #
A2153) from 1mg/ml stock was used to plot the standard curve. Readings were taken at 595nm
wavelength.
4.3.5 Co-immunoprecipitation for detection of protein-protein association
HeLa cells were cultured in 100mm dish in normal growth media as described above. Cells were
either used for endogenous or epitope-tagged overexpressed protein-protein interaction. For
exogenous protein co-immunoprecipitation, cells were co-transfected with 10 g pcDNA6-flag-
SIRT1 and pcDNA6-flag-HA-TSC2 expression plasmids in antibiotic free media using
lipofectamine2000 transfection reagent. 24 hrs post transfection, cells were either mock treated
for treated with –leucine media, 500 M H2O2, 10mM nicotinamide (NAM) and 100 M

132
resveratrol (RES) for 1hr. Cells were scraped and lysed using NP40 lysis buffer +PI. 500 g of
whole cell lysate was incubated overnight with 10 l anti-TSC2 and 2 g anti-SIRT1 (for
endogenous protein CoIP) or 2 g anti- SIRT1 and 2 g anti-flag (for over-expressed protein
CoIP) at 40C. Anti-IgG was used as negative control for immunoprecipitation.
Immunoprecipitated proteins were then pulled down by incubating lysates with 35 l ProteinA-
sepharose (SIGMA # P9424) and 25 l ProteinG-agarose (SIGMA # P4691) 50% slurry at 40C
on a rotator for 2 hrs. The resin was pelleted by spinning the samples at 2000g for 5 mins in
microcentrifuge. The precipitated resin was then washed three times in cold lysis buffer.
Centrifugation during washes was carried at 2000g. After the final wash, the supernatant was
carefully discarded by suction using a fine tip pipette. The beads were then resuspended in 25 l
of 2X-Lammli sample loading buffer with (BioRad # 161-0737) and boiled for 5 mins to elute
the proteins. Protein sample was spun at 13000 rpm for 1 min at RT to precipitate the beads and
the supernatants were loaded in 8% separating gel for SDS-PAGE. Blots were then probed for
anti-SIRT1 and anti-TSC2 or anti-HA antibody. Antibodies used for immunoprecipitation are as
follows: anti-SIRT1 (Upstate # 05-707), and anti-TSC2 (cell signaling technology # 3612), anti-
flag-tag (Chemicon # MAB3118), anti-HA-tag (Cell Signaling, # 2367), rabbit normal IgG
(SantaCruz Biotech # sc2027) and mouse normal IgG (sc-2025).
4.3.6 Western blot analysis for mTOR signaling
Proteins were resolved by SDS-polyacrylamide gel electrophoresis (SDS-PAGE). Depending on
the experiment, immunoprecipitated samples or 50 g lysate protein was loaded in 15% or 8%

133
polyacryamide gels. Separating gels were made using Protogel 30% w/v acryamide: 0.8% w/v
bis-acrylamide (National Diagnostic# EC-890), 1.5M Tris-HCL pH8.8, 10% ammonium
persulfate (APS), 10% SDS and 0.1% TEMED (BioRad # 161-0801). 4% Stacking gel was made
using same above reagents, except 1.5M Tris-HCL pH6.8 instead of pH 8.8. Proteins of lower
molecular weight ranging between 15-75 kD were resolved in 15% separating gels, whereas
protein with higher molecular weight (100-300 kD) were resolved in 8 % separating gels. Gels
were run at 10mA for one minigel or at 50V in 1X-SDS-running buffer. Precision plus dual color
protein marker (BioRad # 161-0374) was used as molecular weight standard. Samples resolved
on SDS-PAGE were transferred on PVDF membrane (Immobilon-P, Millipore, Bedford, MA) in
a semidry transfer machine (Bio-Rad, Richmond, CA) at 15V for 1h at RT for 15% gels and 2hr
at 4oC for 8% gels. Membranes were then incubated in blocking buffer (1X PBS, 5% w/v non-fat
dry milk, 1% Tween-20) for 1hr at RT on a rocker. After blocking, membranes were washed
three times with wash buffer (1X PBS, 1%Tween-20) for 5mins each. The washed membranes
were then incubated with primary antibody overnight at 40C on a rocker. Primary antibody
dilutions used were as follows: 1:2000 for anti-SIRT1, anti-flag-tag and 1:1000 for all other
antibodies. Following primary antibody staining, membranes were given three washes with wash
buffer (PBST), 10 mins each and incubated with corresponding HRP-conjugated-secondary
antibody (1:2000) for 1 hr at RT on a rocker. Membranes were then washed three times in PBST
and proteins were visualized by enhanced chemiluminescence (# NEL103, PerkinElmer Life
Science, Inc). For re-probing the same blot, membranes were incubated in RestoreTM
western
stripping buffer (Pierce # 21059) for 10-15mins, followed by three washes, 10 mins each in
PBST. Blots were then blocked as mentioned above and probed with appropriate primary and
corresponding secondary antibody, and visualized as described above. Antibodies used for

134
western blotting are as follows: anti-SIRT1 (Upstate # 05-707, 1:2000), anti-flag-tag (Chemicon
# MAB3118, 1:2000), anti-PARP1 antibody (# sc-25780, 1:5000) and anti-HSP90 (sc-13119,
1:5000). All other antibodies were purchased from Cell signaling technologies; phospho-mTOR
(# 2971), mTOR (# 2972), phospho-S6 (# 2211), S6 (#2217), phospho-S6K (# 9205), S6K
(#9202), phospho-4EBP1 (# 9451), 4EBP1 (# 9452), phospho-4E (#9741), TSC2 (# 3612), TSC1
(#4963), Raptor (# 4978), Rheb (# 4935).

135
4.4 RESULTS
4.4.1 SIRT1 regulates mTOR signaling in human and mouse cells
mTOR regulates cellular and organism growth by sensing nutrient and hormonal signals.
Enhanced mTOR activity is associated with an increase in cell size [268]. We observed that
SIRT1 null mouse embryonic fibroblasts (MEFs) show larger cell morphology compared to wild
type MEFs (Figure 4.4). This is consistent with a recently published article that documented
enlarged and flattened morphology of SIRT1-inhibited or SIRT1 depleted (by siRNA) human
endothelial cells [231].
Figure 4.4 SIRT1 null mouse embryonic fibroblasts are larger in size
SIRT1 null and wild type mouse embryonic fibroblasts (MEFs) were stained for F-actin using rhodamine
labeled phalloidin (red) stain. The nucleus was stained with DAPI (blue). Actin staining was visualized by
fluorescent microscopy at 40X magnification.
Given that up-regulation of mTOR leads to larger cell mass and size, we investigated the
activity of the mTOR pathway in WT and SIRT1 null MEFs by analysis of phosphorylation of
the mTOR substrates, S6K and 4EBP1, as well as S6. Since the mTOR pathway is regulated by
SIRT1+/+ SIRT1-/-
40x 40x
SIRT1+/+ SIRT1-/-SIRT1+/+ SIRT1-/-
40x 40x

136
nutrients and growth conditions, we examined mTOR signaling in these cells with or without
stress conditions by treating the cells with no treatment or leucine starvation. As shown by higher
levels of phosphorylated mTOR substrates; S6K, S6 and 4EBP1, mTOR activity remained
significantly up-regulated in SIRT1 null MEFs regardless of stress condition (Figure 4.5).
Figure 4.5 mTOR signaling is more active in SIRT1 null mouse embryonic fibroblasts
Wild-type and SIRT1 null MEFs were either mock-treated or leucine starved for 1 hr. Whole cell extracts
were made using NP-40 lysis buffer followed by Western blot analysis of phosphorylation of the mTOR substrates
using phospho-protein-antibody (Cell Signaling Technology) for various mTOR substrate proteins.
SIRT1 is expressed at very high levels in kidney [64]. To determine if SIRT1 regulates
mTOR signaling in vivo in mice, kidney extracts from SIRT1 homozygous or heterozygous null
mice (Figure 4.6) were examined. Consistent with the results in MEFs, extracts of kidney from
phospho-mTOR
mTOR
phospho-S6K
p4EBP1
4EBP1
S6
mSIRT1
-/- +/+ +/+ -/- mSIRT1
phospho-S6
none -leucine
S6K
actin
phospho-mTOR
mTOR
phospho-S6K
p4EBP1
4EBP1
S6
mSIRT1
-/- +/+ +/+ -/- mSIRT1
phospho-S6
none -leucine
S6K
actin
mTOR
phospho-S6K
p4EBP1
4EBP1
S6
mSIRT1
-/- +/+ +/+ -/- mSIRT1
phospho-S6
none -leucine
S6K
actin

137
SIRT1 homozygous null and SIRT1 heterozygous null mice showed higher mTOR activity when
compared with wild type mice.
Figure 4.6 Mouse kidney from SIRT1 heterozygous or homozygous null mice show higher mTOR activity
Kidney extracts from wild-type (+/+), SIRT1 heterozygous null (+/-) and homozygous null (-/-) mice were
made using Triton-X100 lysis buffer. mTOR activity was measured by western blot analysis of the phosphorylated
mTOR pathway proteins.
To confirm these results in human cells, HeLa cells stably depleted in SIRT1 using
shRNAi were generated by stable retroviral infection (as described in chapter 2 of the thesis).
The cells were either mock-treated or treated with various different stress conditions such as
amino acid stress (leucine starvation), energy stress (glucose starvation), ER stress
(tunicamycin), growth factor stress (serum deprivation) and free radical stress (hydrogen
peroxide stress). As shown in Figure 4.7, under these different stress conditions, mTOR activity
remained significantly up-regulated in cells that had reduced levels of SIRT1 as indicated by
higher phosphorylation of the mTOR substrates S6K and S6.
phospho-4EBP1
+/+ -/+ -/- mSIRT1
phospho-mTOR
phospho-S6K
phospho-S6
phospho-4E
beta-actin
phospho-4EBP1
+/+ -/+ -/- mSIRT1
phospho-mTOR
phospho-S6K
phospho-S6
phospho-4E
beta-actin
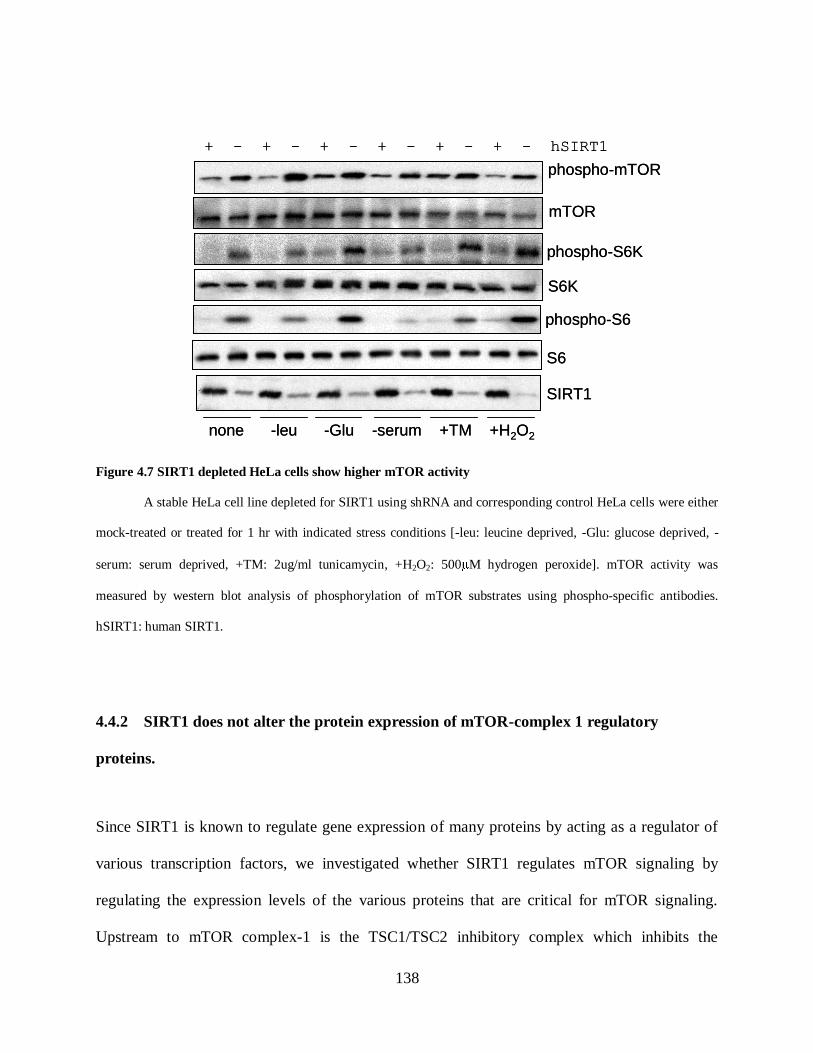
138
Figure 4.7 SIRT1 depleted HeLa cells show higher mTOR activity
A stable HeLa cell line depleted for SIRT1 using shRNA and corresponding control HeLa cells were either
mock-treated or treated for 1 hr with indicated stress conditions [-leu: leucine deprived, -Glu: glucose deprived, -
serum: serum deprived, +TM: 2ug/ml tunicamycin, +H2O2: 500 M hydrogen peroxide]. mTOR activity was
measured by western blot analysis of phosphorylation of mTOR substrates using phospho-specific antibodies.
hSIRT1: human SIRT1.
4.4.2 SIRT1 does not alter the protein expression of mTOR-complex 1 regulatory
proteins.
Since SIRT1 is known to regulate gene expression of many proteins by acting as a regulator of
various transcription factors, we investigated whether SIRT1 regulates mTOR signaling by
regulating the expression levels of the various proteins that are critical for mTOR signaling.
Upstream to mTOR complex-1 is the TSC1/TSC2 inhibitory complex which inhibits the
+ - + - + - + - + - + - hSIRT1
none -leu -Glu -serum +TM +H2O2
phospho-mTOR
phospho-S6K
phospho-S6
mTOR
S6
S6K
SIRT1
+ - + - + - + - + - + - hSIRT1
none -leu -Glu -serum +TM +H2O2
phospho-mTOR
phospho-S6K
phospho-S6
mTOR
S6
S6K
SIRT1
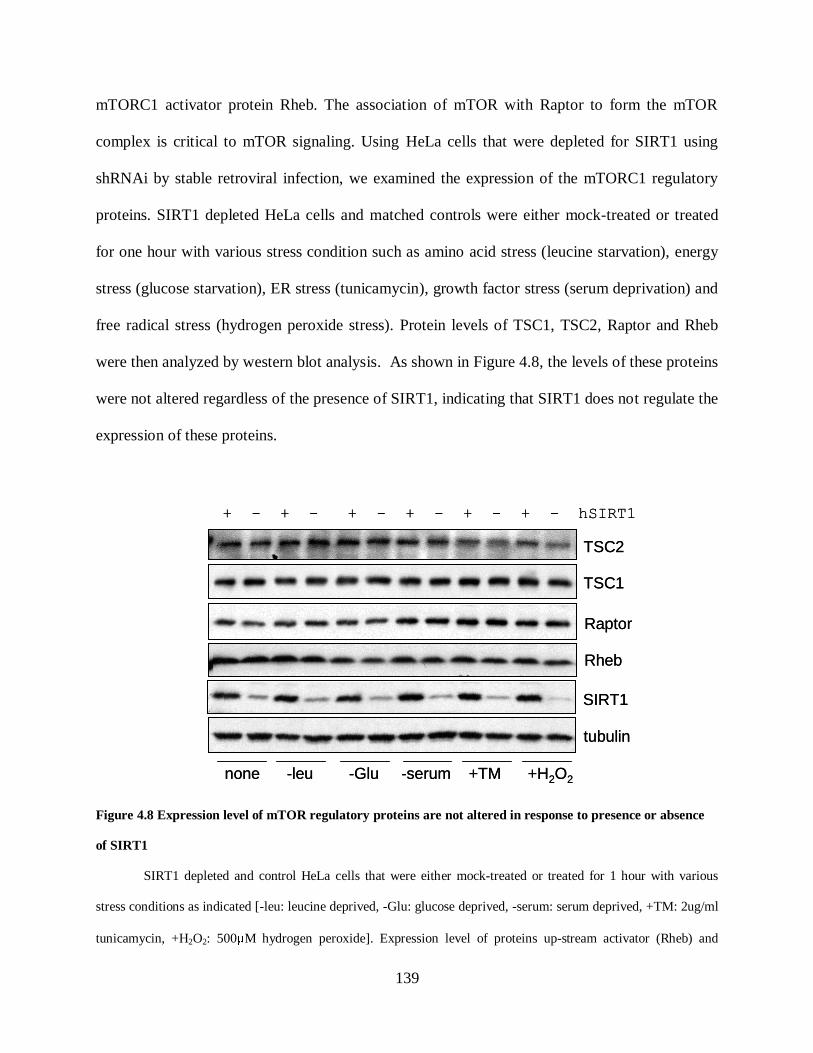
139
mTORC1 activator protein Rheb. The association of mTOR with Raptor to form the mTOR
complex is critical to mTOR signaling. Using HeLa cells that were depleted for SIRT1 using
shRNAi by stable retroviral infection, we examined the expression of the mTORC1 regulatory
proteins. SIRT1 depleted HeLa cells and matched controls were either mock-treated or treated
for one hour with various stress condition such as amino acid stress (leucine starvation), energy
stress (glucose starvation), ER stress (tunicamycin), growth factor stress (serum deprivation) and
free radical stress (hydrogen peroxide stress). Protein levels of TSC1, TSC2, Raptor and Rheb
were then analyzed by western blot analysis. As shown in Figure 4.8, the levels of these proteins
were not altered regardless of the presence of SIRT1, indicating that SIRT1 does not regulate the
expression of these proteins.
Figure 4.8 Expression level of mTOR regulatory proteins are not altered in response to presence or absence
of SIRT1
SIRT1 depleted and control HeLa cells that were either mock-treated or treated for 1 hour with various
stress conditions as indicated [-leu: leucine deprived, -Glu: glucose deprived, -serum: serum deprived, +TM: 2ug/ml
tunicamycin, +H2O2: 500 M hydrogen peroxide]. Expression level of proteins up-stream activator (Rheb) and
TSC2
TSC1
Raptor
Rheb
tubulin
+ - + - + - + - + - + - hSIRT1
none -leu -Glu -serum +TM +H2O2
SIRT1
TSC2
TSC1
Raptor
Rheb
tubulin
+ - + - + - + - + - + - hSIRT1
none -leu -Glu -serum +TM +H2O2
SIRT1

140
inhibtor (TSC1/2) proteins as well as the mTOR-complex 1 (mTORC-1) Raptor, were analyzed by western blot
analysis of whole cell extracts using total protein antibody.
4.4.3 SIRT1 regulates mTOR signaling up-stream of the mTOR complex-1 (mTORC1).
Rapamycin, a macrolide that is produced by the bacterium Streptomyces hygroscopicus acts as a
specific inhibitor of mTOR complex 1 (mTORC1), but does not inhibit the mTOR complex 2
(mTORC2). Upon entering cells, rapamycin binds to its intracellular receptor, FKBP12, a
cytosolic binding protein collectively called immunophilin. This complex then forms a ternary
complex with mTOR and inhibits mTOR and mTOR-mediated signaling network [118].
To investigate if SIRT1 regulates mTOR signaling upstream to mTORC1, we treated
control and SIRT1 depleted HeLa cells with 25nM rapamycin and examined the mTOR activity
by analyzing phosphorylation of mTOR substrates. As shown in Figure 4.11, rapamycin
treatment completely abolished the phophorylation of S6K, S6 and 4EBP1 in SIRT1 depleted as
well as control cells indicating that SIRT1 regulates mTOR upstream of mTORC1.

141
Figure 4.9 Rapamycin abrogates mTOR signaling regardless of presence of SIRT1
HeLa cells depleted for SIRT1 (-) and control matched cells (+) were treated with 25nM rapamycin for 1hr. Whole
cell lysates were analyzed by western blotting for phosphorylation of various mTOR substrates. Anti-tubulin was
used to show equal load for all lanes.
Upstream to mTORC-1 is the inhibitory complex TSC1/TSC2. mTOR is downregulated
by TSC1/TSC2 complex through its regulation of the small GTP-binding protein Rheb. TSC2
acts as a GTPase activating protein for Rheb, an upstream activator of mTOR, thereby
inactivating Rheb and inhibiting mTOR signaling [136]. It has been shown that TSC2 null cells
show persistently upregulated mTOR signaling whereas over-expression of TSC1 and TSC2
leads to mTOR inhibition [244,324]. Since, we observed that SIRT1 acts as an inhibitor of
mTOR signaling, we wished to investigate, if SIRT1 null MEFs respond similarly as TSC2 null
MEFs in response to rapamycin treatment. Wild-type and TSC2 null or SIRT1 null MEFs were
phospho-S6K
phospho-S6
phosho-4EBP1
SIRT1 + - + -
no treat 25nM rapamycin
tubulin
4EBP1
S6K
S6
phospho-S6K
phospho-S6
phosho-4EBP1
SIRT1 + - + -
no treat 25nM rapamycin
tubulin
4EBP1
S6K
S6
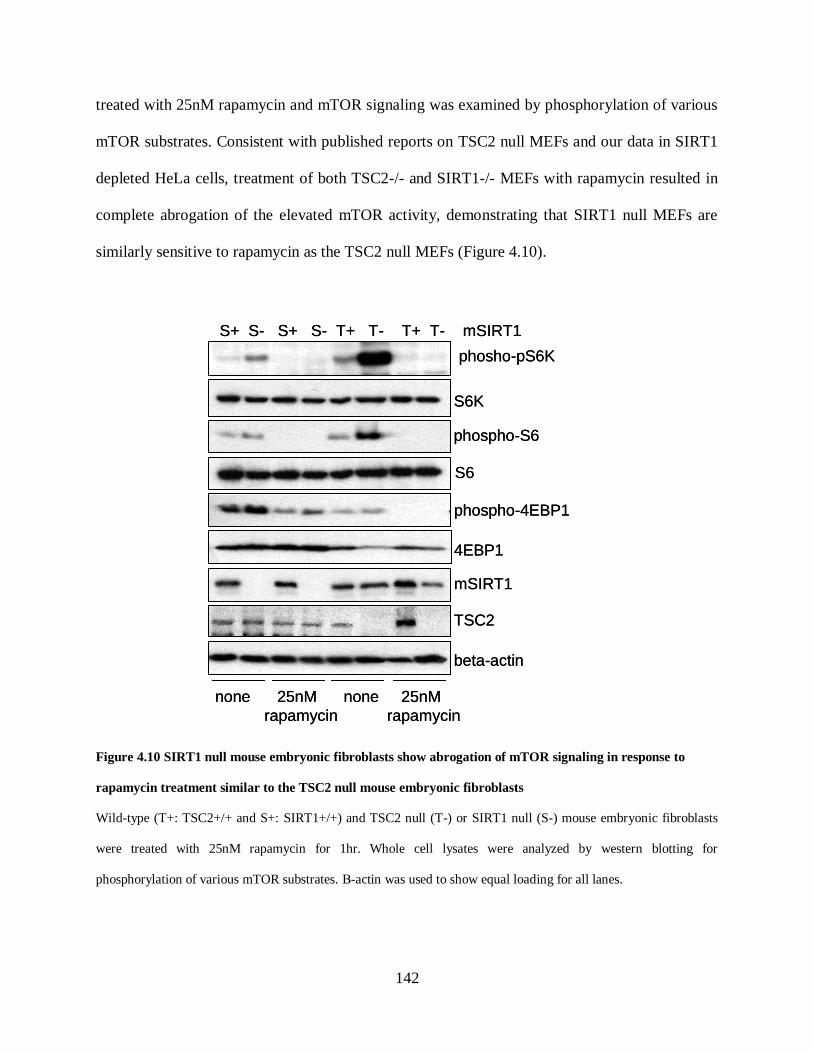
142
treated with 25nM rapamycin and mTOR signaling was examined by phosphorylation of various
mTOR substrates. Consistent with published reports on TSC2 null MEFs and our data in SIRT1
depleted HeLa cells, treatment of both TSC2-/- and SIRT1-/- MEFs with rapamycin resulted in
complete abrogation of the elevated mTOR activity, demonstrating that SIRT1 null MEFs are
similarly sensitive to rapamycin as the TSC2 null MEFs (Figure 4.10).
Figure 4.10 SIRT1 null mouse embryonic fibroblasts show abrogation of mTOR signaling in response to
rapamycin treatment similar to the TSC2 null mouse embryonic fibroblasts
Wild-type (T+: TSC2+/+ and S+: SIRT1+/+) and TSC2 null (T-) or SIRT1 null (S-) mouse embryonic fibroblasts
were treated with 25nM rapamycin for 1hr. Whole cell lysates were analyzed by western blotting for
phosphorylation of various mTOR substrates. Β-actin was used to show equal loading for all lanes.
beta-actin
phospho-4EBP1
phosho-pS6K
mSIRT1
phospho-S6
S+ S- S+ S- T+ T- T+ T- mSIRT1
none 25nM none 25nM
rapamycin rapamycin
S6K
S6
4EBP1
TSC2
beta-actin
phospho-4EBP1
phosho-pS6K
mSIRT1
phospho-S6
S+ S- S+ S- T+ T- T+ T- mSIRT1
none 25nM none 25nM
rapamycin rapamycin
S6K
S6
4EBP1
TSC2

143
4.4.4 The catalytic activity of SIRT1 plays a role in regulating mTOR signaling
SIRT1 is a NAD+ dependent deacetylase whose catalytic activity plays a role in most of the
known biological functions of SIRT1. Resveratrol (RES), a natural polyphenol, acts as an
activator of SIRT1 that has been shown to increase lifespan in S. cerevisiae, C. elegans and D.
melanogaster in a SIRT1-dependent manner [127,313]. Nicotinamide (NAM), a byproduct of
SIRT1 catalytic reaction, non-competitively inhibits SIRT1. SIRT1 enzymes are multifunctional
in that the deacetylase reaction involves the cleavage of the nicotinamide-ribosyl, cleavage of an
amide bond, and transfer of the acetyl group ultimately to the 2'-ribose hydroxyl of ADP-ribose.
Nicotinamide inhibits SIRT1 by intercepting an ADP-ribosyl-enzyme-acetyl peptide
intermediate with regeneration of NAD+ (transglycosidation) [139].
To examine if the catalytic activity of SIRT1 is important for regulation of mTOR
signaling, HeLa cells were treated with the SIRT1 activator resveratrol (RES) and inhibitor
nicotinamide (NAM), under stress (-leucine) or growth (Insulin) conditions. mTOR signaling
was measured by examining phosphorylation levels of S6 and 4EBP1. As shown in Figure 4.13,
resveratrol suppressed mTOR signaling regardless of stress or growth conditions, suggesting that
the catalytic activity of SIRT1 may play a role in mTOR regulation. We also examined the
effect of RES and NAM on 293T cells. As shown in figure 4.11, RES and NAM had similar
effects on mTOR signaling in 293T cells as they had in HeLa cells. Interestingly however, we
observed higher mTOR signaling even under leucine starvation in 293T cells, which was
completely abolished by RES treatment.

144
Figure 4.11 SIRT1 activator suppresses and inhibitor activates mTOR signaling in HeLa cells
Hela cells were either mock-treated or treated for 1 hr with –leucine media, 200nM insulin and 100µM resveratrol
(RES) or 10 mM nicotinamide (NAM) as indicated. mTOR signaling was analyzed by western blotting for
phosphorylation of the mTOR substrate proteins.
Figure 4.12 SIRT1 activator suppresses mTOR signaling in 293T cells
293T cells were either mock-treated or treated for 1 hr with –leucine media, 200nM insulin and 100µM resveratrol
(RES) or 10 mM nicotinamide (NAM) as indicated. mTOR signaling was analyzed by western blotting for
phosphorylation of the mTOR substrate proteins.
no treat 200uM RES 10mM NAM
phosho-S6
phospho-4EBP1
no –leu ins no –leu ins no –leu ins
4EBP1
S6
1.0 0.7 1.4 0.06 0.01 0.05 1.6 1.0 2.0
1.0 0.9 1.3 0.2 0.0 0.5 0.8 0.8 0.6
no treat 200uM RES 10mM NAM
phosho-S6
phospho-4EBP1
no –leu ins no –leu ins no –leu ins
4EBP1
S6
1.0 0.7 1.4 0.06 0.01 0.05 1.6 1.0 2.0
1.0 0.9 1.3 0.2 0.0 0.5 0.8 0.8 0.6
phospho-S6
phospho-4EBP1
S6
4EBP1
no –leu ins no –leu ins no –leu ins
no treat 200uM RES 10mM NAM
1.0 17.6 90 0 0 1.6 0.8 14 98
1.0 1.6 1.0 0.08 0.14 0.7 0.3 0.9 0.7
phospho-S6
phospho-4EBP1
S6
4EBP1
no –leu ins no –leu ins no –leu ins
no treat 200uM RES 10mM NAM
1.0 17.6 90 0 0 1.6 0.8 14 98
1.0 1.6 1.0 0.08 0.14 0.7 0.3 0.9 0.7
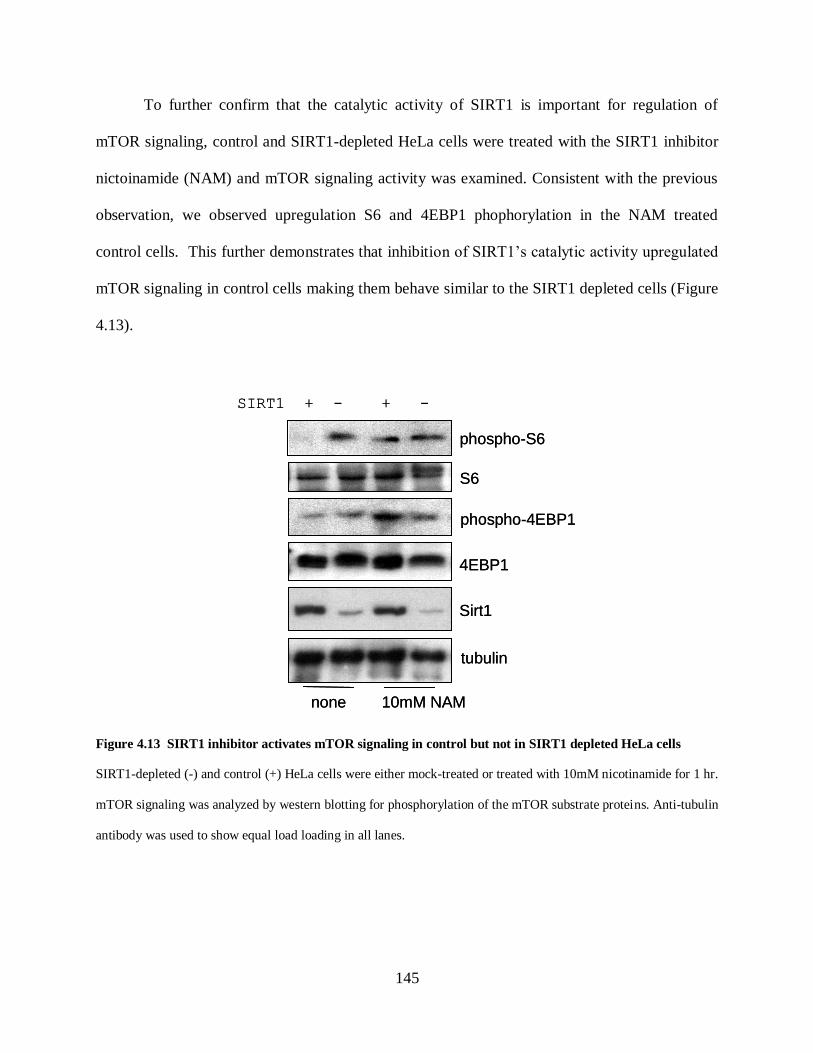
145
To further confirm that the catalytic activity of SIRT1 is important for regulation of
mTOR signaling, control and SIRT1-depleted HeLa cells were treated with the SIRT1 inhibitor
nictoinamide (NAM) and mTOR signaling activity was examined. Consistent with the previous
observation, we observed upregulation S6 and 4EBP1 phophorylation in the NAM treated
control cells. This further demonstrates that inhibition of SIRT1’s catalytic activity upregulated
mTOR signaling in control cells making them behave similar to the SIRT1 depleted cells (Figure
4.13).
Figure 4.13 SIRT1 inhibitor activates mTOR signaling in control but not in SIRT1 depleted HeLa cells
SIRT1-depleted (-) and control (+) HeLa cells were either mock-treated or treated with 10mM nicotinamide for 1 hr.
mTOR signaling was analyzed by western blotting for phosphorylation of the mTOR substrate proteins. Anti-tubulin
antibody was used to show equal load loading in all lanes.
SIRT1 + - + -
phospho-S6
phospho-4EBP1
4EBP1
S6
Sirt1
tubulin
none 10mM NAM
SIRT1 + - + -
phospho-S6
phospho-4EBP1
4EBP1
S6
Sirt1
tubulin
none 10mM NAM

146
4.4.5 SIRT1 inhibits mTOR signaling by acting through the TSC2
TSC1/2 antagonizes the mTOR signaling pathway via stimulation of GTP hydrolysis of the
mTORC1 upstream activator protein, Rheb [187]. TSC1/2 thus plays a pivotal role in mediating
growth factors, nutrient and energy sensing signals to mTOR-dependent targets. Since our results
suggested that SIRT1’s inhibitory effect on mTOR signaling is upstream of mTORC1, we
investigated if SIRT1 mediated down-regulation of mTOR signaling was TSC2 dependent. As
shown in figure 4.14, while SIRT1 inhibitor NAM could stimulate, and the SIRT1 activator RES
could inhibit S6 phosphorylation in wild type MEFs, they were ineffective in TSC2 null MEFs
suggesting that SIRT1 potentially mediates its effects through TSC2.
Figure 4.14 SIRT1 activator can not suppress mTOR signaling in TSC2 null MEFs
Wild-type and TSC2 null MEFs were either mock-treated or treated with 10 mM nicotinamide or 50 M resveratrol
for 1 hr. mTOR signaling was analyzed by western blotting for phosphorylation of the mTOR substrate protein S6.
Resveratrol has been reported to have SIRT1 independent effects. For example,
resveratrol inhibits the insulin induced Akt and MAPK activation in a SIRT1 independent
phospho-S6
S6
TSC2
no treat 10mM
NAM50 M
RES
-/- +/+ -/- +/+ -/- +/+ mTSC2
ratio-/-
+/+2.7 1.3 3.8
phospho-S6
S6
TSC2
no treat 10mM
NAM50 M
RES
-/- +/+ -/- +/+ -/- +/+ mTSC2
ratio-/-
+/+ratio
-/-
+/+2.7 1.3 3.8

147
manner [325]. Resveratrol also activates AMPK, an activator of TSC1/2 complex, in Neuro2a
cells and primary neurons in a LKB1 dependent but SIRT1 independent way [66]. Since,
resveratrol is documented to regulate certain pathways independent of SIRT1, in order to
confirm that the effect of resveratrol on mTOR pathway, shown in figure 4.15 was SIRT1
dependent, we examined the effect of resveratrol in wild-type versus SIRT1 null MEFs. Our
results show that resveratrol inhibits S6 phosphorylation in wild-type, but not in SIRT1 null
MEFs, demonstrating that the effect of resveratrol on mTOR signaling is through SIRT1 (figure
4.16).
Figure 4.15 Resveratrol suppresses mTOR signaling in wild-type but not in SIRT1 null MEFs
Wild-type and SIRT1 null MEFs were either mock-treated or treated with 10 mM nicotinamide or 50 M resveratrol
for 1 hr. mTOR signaling was analyzed by western blotting for phosphorylation of the mTOR substrate S6.
Furthermore, in a dose response effect of resveratrol on wild-type versus TSC2 null or
SIRT1 null MEFs, we observed that while S6 phosphorylation remained high in TSC2 null
MEFs regardless of increase in resveratrol concentration, the SIRT1 null MEFs showed mild
reduction in S6 phosphorylation in response to higher (100 M) dose of resveratrol, suggesting a
phospho-S6
S6
mSIRT1
no treat 10mM
NAM50 M
RES
-/- +/+ -/- +/+ -/- +/+ mSIRT1
ratio-/-
+/+1.7 1.0 2.5
phospho-S6
S6
mSIRT1
no treat 10mM
NAM50 M
RES
-/- +/+ -/- +/+ -/- +/+ mSIRT1
ratio-/-
+/+ratio
-/-
+/+1.7 1.0 2.5

148
parallel SIRT1 independent pathway through which resveratrol down-regulates the mTOR
pathway.
Figure 4.16 Resveratrol suppresses mTOR signaling at higher dose in SIRT1 null MEFs but not in TSC2 null
MEFs
Wild-type, TSC2 null and SIRT1 null MEFs were either mock-treated or treated with 25, 50 or 100 M resveratrol
for 1 hr. mTOR signaling was analyzed by western blotting for phosphorylation of the mTOR substrate S6.
4.4.6 SIRT1 associates with TSC2 in HeLa cells
Given that the effects of resveratrol and nicotinamide on mTOR regulation were both SIRT1 and
TSC2 dependent, we investigated by co-immunoprecipitation if these two proteins associated
25 50 100 M resveratrol
phospho-S6
S6
+/+ -/- +/+ -/- +/+ -/- mTSC2
25 50 100 M resveratrol
phospho-S6
S6
2.4 3.0 4.2ratio-/-
+/+
2.1 2.9 1.5ratio-/-
+/++/+ -/- +/+ -/- +/+ -/- mSIRT1
25 50 100 M resveratrol
phospho-S6
S6
+/+ -/- +/+ -/- +/+ -/- mTSC2
25 50 100 M resveratrol
phospho-S6
S6
2.4 3.0 4.2ratio-/-
+/+ratio
-/-
+/+
2.1 2.9 1.5ratio-/-
+/+ratio
-/-
+/++/+ -/- +/+ -/- +/+ -/- mSIRT1

149
with each other. As shown in Figure 4.17 immunoprecipitation of endogenous TSC2 resulted in
co-immunoprecipitation of endogenous SIRT1 (A) and conversely, TSC2 was co-
immunoprecipitated with SIRT1 (B).
Figure 4.17 Endogenous SIRT1 and TSC2 Co-immunoprecipitate in HeLa cells
A. HeLa cells were either mock-treated or leucine deprived for 1hr. Whole cell extracts were used to
immunoprecipitate endogenous TSC2. Endogenous SIRT1 was probed using anti-SIRT1 antibody by western blot
analysis of the immunoprecipitated extracts. (B) Endogenous SIRT1 was immunoprecipitated from whole cell
extracts of cells either mock-treated or treated for 1 hr with 0.5 mM H2O2 or leucine deprived media. Endogenous
TSC2 was probed using anti-TSC2 antibody by western blot analysis of the immunoprecipitated extracts.
A
B
Treat: -leu none H2O2 none
IP: SIRT1 SIRT1 SIRT1 IgG
WB: TSC2
WB: SIRT1
IP: IgG TSC2 TSC2 --25ug Input--
Treat: none none -leu none -leu
WB: SIRT1
WB: TSC2
A
B
Treat: -leu none H2O2 none
IP: SIRT1 SIRT1 SIRT1 IgG
WB: TSC2
WB: SIRT1
IP: IgG TSC2 TSC2 --25ug Input--
Treat: none none -leu none -leu
WB: SIRT1
WB: TSC2

150
To further confirm the association of SIRT1 and TSC2, tagged versions of SIRT1 and
TSC2 proteins were over-expressed in HeLa cells. Cells were then treated with no treat, growth
(200nM insulin) or stress (-leucine) conditions or with SIRT1 activatior, resveratrol (100 M) or
inhibitor, nicotinamide (10mM). As shown in Figure 4.18, epitope tagged SIRT1 co-
immunoprecipitated with TSC2 (A) and vice-versa (B), verifying the association of TSC2 and
SIRT1 regardless of stress or growth condition and SIRT1’s catalytic activity.
Figure 4.18 Exogenously expressed SIRT1 and TSC2 co-immunoprecipate in HeLa cells
HeLa cells were co-transfected with pcDNA6-flag-SIRT1 and pcDNA6-HA-flag-TSC2 expression plasmids. 24 hrs
post transfection, the cells were either mock-treated or treated with 200nM insulin, –leucine media, 100 M
resveratrol or 10mM NAM for 1 hr. SIRT1 and TSC2 were co-immunoprecipitated by the epitope tag antibody as
indicated and the immunoprecipitated extracts were analysed for SIRT1 and TSC2 by western blot analysis.
Treat: none ins -leu none res NAM 25ug input
Treat: ins -leu none res NAM none blank 25ug input
IP: -------------- Flag-TSC2 -------------- IgG blank input
IP: IgG ----------------- SIRT1 --------------- input
WB: HA (TSC2)
WB: Flag (SIRT1)
WB: SIRT1
WB: HA (TSC2)
A
B
Treat: none ins -leu none res NAM 25ug input
Treat: ins -leu none res NAM none blank 25ug input
IP: -------------- Flag-TSC2 -------------- IgG blank input
IP: IgG ----------------- SIRT1 --------------- input
WB: HA (TSC2)
WB: Flag (SIRT1)
WB: SIRT1
WB: HA (TSC2)
A
B

151
Since SIRT1 and TSC2 associated with each other, we attempted to examine if TSC2 is
an acetylated protein by immunoprecipitating TSC2 and probing for acetyl-lysine (data not
shown). Our results did not show any significant acetylation of TSC2. However, we can not rule
out the possibility that TSC2 or any other protein in the complex was acetylated in response to
stress or growth conditions. Also, interestingly, our co-immunoprecipitation data showed slightly
enhanced association of mTOR and SIRT1 under stress condition (-leu) when compared to
growth condition (Insulin).

152
4.5 DISCUSSION
SIRT1 is known to play a role in lifespan extension, age related diseases and cellular stress
response by regulating various targets involved in aging related pathways such as caloric
restriction and insulin/IGF-1 signaling. mTOR signaling which is a downstream component of
the insulin/IGF-1 signaling as well as some other growth, nutrient and stress related signaling
pathways, has been implicated in a wide spectrum of human diseases and in longevity in lower
organisms.
Rapamycin and related inhibitors of the TOR signaling pathway, are being considered as
a potential drug against a number of physiological conditions that are more prevalent in older
age, such as cancer, type 2 diabetes, cardiovascular and neurological disorders. Soon after its
discovery in the early 1970s, rapamycin was shown to be a potent anti-cancer drug. Numerous
human cancers have been shown to contain mutations in genes that encode components of the
P13K-mTOR signaling network [106]. By inhibiting mTOR signaling, rapamycin suppresses cell
proliferation, tumor angiogenesis and cellular resistance to the hypoxic tumor micro-
environment [105,128,296]. In insulin-resistant diabetes, rapamycin inhibits the sustained
activation of mTOR signaling, a crucial event in IRS irresponsiveness to insulin, thereby
restoring IRS sensitivity to insulin [272]. Rapamycin also inhibits adipocyte differentiation and
fat accumulation by inhibiting mTOR mediated expression and activity of PPAR- [51,159],
thereby contributing to leanness of animals, which is one of the physiological changes elicited in
diet restricted longer living animals. Cardiac hypertrophy, the leading cause of heart failure, is
characterized at a cellular level by increase in cell size and protein synthesis. It has been shown
that inhibition of mTOR by rapamycin prevents cardiac hypertrophy in mouse models.
Moreover, stress-induced cardiac hypertrophy has been shown to be mTOR dependent [85,208].

153
Various mTOR inhibitors are being considered for a number of human neurological disorders
such as Huntington’s, Alzheimer’s and Parkinson’s diseases. It has been shown that rapamycin
induces autophagic responses to clear up neurotoxic peptides and attenuate neurodegeneration in
these diseases [19,186,250].
Interestingly, SIRT1 and its activator resveratrol have also been implicated in the
diseases of aging: cancer, metabolic syndromes and neurological disorders. SIRT1 has been
shown to have both oncogenic as well as tumor suppressor properties. On one hand, by acting as
an anti-apoptotic factor through p53, Ku70, Foxo, HIC and E2F, SIRT1 prevents cell death and
promotes tumorigenesis [34,48,55,198,216,302,305], while on the other hand it sensitizes breast
and prostate cancer cells to TNF -induced apoptosis by inhibiting NF-κB [91]. It has also been
shown to deacetylate the androgen receptor, thereby suppressing its potentially oncogenic
signaling and protecting prostate cancer cells from growing in response to dihydrotestosterone
[88]. Metabolic syndromes (diabetes, hypertension and cardiovascular diseases) are often age
related disorders which result from dysregulated metabolism leading to aberrant glucose and
lipid homeostasis. By promoting fat mobilization [241], insulin secretion [27,217,255] and
inhibiting glycolysis [255], SIRT1 may potentially play a role in treating these metabolic
syndromes. A growing list of evidence suggests SIRT1’s neuro-protective functions. SIRT1 has
been shown to be involved in NAD+ dependent axonal protection [7]. The NAD+ biosynthetic
enzyme (NMNAT1), which activates SIRT1 is responsible for delayed axonal degeneration in
Wallerian degeneration slow mice. SIRT1 has been shown to reduce neurotoxicity in
Alzheimer’s disease by activating -secretase activity and protecting against A -neurotoxicity
by inhibiting NF-κB signaling [46,248]. Furthermore, the SIRT1 activator, resveratrol reduces

154
neuronal cell death in Huntington disease model, whereas SIRT1 inhibitor sirtinol blocks it
[236].
Thus, SIRT1 and mTOR signaling show an uncanny relationship not only with regards to
promoting longevity, but also with regards to their roles in many age related physiological
responses and diseases. It appears that these two proteins act in opposite ways to regulate aging
and related diseases. While it still remains to be elucidated as to how these two proteins regulate
longevity in mammals, the inverse relationship of these proteins with regards to each others’
roles in regulating the aging processes indicate a potential link between the two. In our study, we
demonstrate for the first time that these two proteins, involved intricately in cellular processes
related to stress resistance, cell survival and longevity, are indeed interconnected.
Coordinated increases in both cell number and cell size contribute to the growth of an
organ or whole organism [58]. Fingar et al. showed that cell growth and cell cycle progression
are separable and distinct processes in mammalian cells and that growth to appropriate cell size
requires mTOR- and PI3K-dependent signals [77]. Whereas in yeast the control of cell size
seems primarily to reflect nutrient conditions, in multicellular organisms both nutrients and
growth factor signals coordinate cell, organ, and organismal growth. Regulation of cell size by
mTOR through translation regulation and ribosome biogenesis via S6K1 and 4EBP1 is an
evolutionarily conserved function of TOR. We observed that the SIRT1 knock-out mouse
embryonic fibroblasts (MEFs) showed larger cell size and mass when compared to the wild-type
MEFs. Since mTOR is known to regulate cell size in organisms ranging from yeast, flies, mice to
mammalian cells, we investigated the mTOR activity in wild-type and SIRT1 null MEFs. By
examining the downstream substrates of mTOR known to regulate cell size and mass, S6K1 and
4EBP1, we demonstrated that the SIRT1 null MEFs have higher mTOR signaling.

155
Normal adult kidney has been shown to have low mTOR activity. Hyperactivity of
mTOR is considered to be the cause for polycystic kidney disease, a common cause of renal
failure, which results from mutation in the large transmembrane protein polycistin-1. It is
believed that the cytoplasmic tail of polycystin-1, which interacts with TSC2, in turn interacts
with mTOR, keeping it in an inactive form [215,274]. To confirm if mTOR signaling is
increased in response to absences of SIRT1 in vivo, we examined SIRT1 heterozygous or
homozygous null mouse kidney tissue for mTOR activity. Consistent with the data in MEFs, we
observed higher phosphorylation of the mTOR substrates in SIRT1+/- and -/- kidney tissues,
suggesting that SIRT1 negatively regulates mTOR signaling in vivo. Interestingly, SIRT1 has
been shown to have protective functions in kidney by inhibiting TGF and oxidative stress
induced apoptosis of glomerular mesangial cells by acting through Smad7 and p53, respectively
[170,171]. Our results indicating that SIRT1 suppresses mTOR activity could be another novel
mechanism by which SIRT1 may be involved in conferring protection to renal cells against
damage and disease.
We also demonstrated that SIRT1 downregulates mTOR in human cells and that the total
protein levels of the important mTOR pathway proteins such as TSC1, TSC2, mTOR, Raptor
and Rheb are not affected by absence of SIRT1 suggesting that SIRT1 probably does not
regulate the mTOR signaling by affecting the mTOR pathway protein expression. mTOR
signaling is activated by growth factors and nutrients, and inactivated by stress and starvation.
We further demonstrate that even under stress conditions such as leucine starvation, when mTOR
signaling is expected to be downregulated, SIRT1 depleted cells show higher mTOR activity,
indicating that SIRT1 may be a crucial factor for maintaining normal mTOR signaling in
response to growth or stress signals.

156
Rapamycin, the specific inhibitor of mTOR complex-1 is being considered as a
therapeutic chemical in diseases or conditions that are caused by aberrant mTOR activity.
Rapamycin is believed to inhibit the active mTOR-raptor complex, thus inhibiting mTOR kinase
activity for its downstream substrates S6K1 and 4EBP1. We found that while SIRT1’s absence
resulted in upregulation of mTOR activity, rapamycin treatment abrogated the upregulated
mTOR signaling in wild-type as well as SIRT1 depleted HeLa cells and mouse embryonic
fibroblasts. This suggests that SIRT1 potentially imparts its regulation on mTOR signaling
upstream of the point where rapamycin acts, that is upstream to mTOR complex-1. Interestingly,
TSC2, which acts in an inhibitory TSC1/TSC2 complex upstream of mTOR complex-1, acts
similar to SIRT1 in that, TSC2 null MEFs have been shown to have larger cell size and mass
[244,245,258], and TSC2 null MEFs are sensitive to rapamycin as well as the wild-type MEFs
suggesting that SIRT1 may potentially mediate its effect on mTOR through the TSC1/2 complex.
SIRT1 is a NAD+ dependent deacetylase whose catalytic activity has been shown to be
responsible for most of its functions. We therefore investigated if the same was true for SIRT1
mediated regulation of mTOR signaling. Using the chemical activator and inhibitor of SIRT1 in
HeLa and 293T cells, we demonstrated that the catalytic activity of SIRT1 was critical for
regulating mTOR signaling. Also, the control-RNAi HeLa cells showed upregulated mTOR
activity similar to SIRT1-RNAi HeLa cells when treated with the SIRT1 inhibitor nicotinamide
(NAM), confirming that SIRT1 regulates mTOR activity through its deacetylase function. Since,
our results suggested that SIRT1’s decetylase function is important for mTOR signaling, we also
attempted to examine if TSC2 is an acetylated protein. Our analysis by western blotting TSC2
immuno-precipitated lysates for anti-lysine antibody could not detect acetylation of TSC2.

157
However, it cannot be ruled out that TSC2, or any other protein in the complex, is an acetylated
protein and a potential substrate for SIRT1.
Since TSC2 null MEFs show high mTOR activity, similar to the SIRT1 null MEFs, we
investigated if the SIRT activator (resveratrol) could suppress the upregulated mTOR activity in
TSC2 null MEFs and SIRT1 inhibitor could block it. Our result showed that while the SIRT1
activator could not suppress upregulated mTOR activity in TSC2 null MEFs, the SIRT1 inhibitor
could actually increase mTOR activity in the TSC2 positive wild-type MEFs. However, the
upregulated mTOR ativity in TSC2 null MEFs was not further enhanced by SIRT1 inhibitor,
indicating that SIRT1 potentially acts through the TSC1-TSC2 complex to downregulate mTOR
signaling. Furthermore, since, resveratrol has been reported to show SIRT1 independent effects
on insulin-signaling by acting through the LKB-AMPK and MAPK-ERK pathways [66,325], we
investigated whether the effect of resveratrol on mTOR activity in our experiments were through
SIRT1 or independent of SIRT1. Using resveratrol in wild-type and SIRT1 null MEFs, we
demonstrated that the suppressive effect of resveratrol on mTOR activity was, at least in part,
through SIRT1. Our results show that while resveratrol could suppress mTOR activity in wild-
type MEFs, it could not do so in SIRT1 null MEFs, showing SIRT1 was needed for resveratrol’s
action. Furthermore, in a dose response experiment, we demonstrate that at higher doses,
reveratrol can suppress mTOR activity even in the absence of SIRT1, which is consistent with
the fact that resveratrol feeds in to mTOR signaling through multiple pathways, SIRT1 being one
of them. The same dose of resveratrol (50 M), however, could not suppress upregulated mTOR
in TSC2 null MEFs, again consistent with the fact that the mTOR inhibitory complex is
regulated by multiple parallel upstream pathways, such as via AMPK and REDD1. Our data in
SIRT1 depleted HeLa cells demonstrate that SIRT1 downregulates the mTOR signaling
158
irrespective of stress type, indicating its crucial role in maintenance of optimum mTOR signaling
in response to extracellular stimuli. The effect of high dose resveratrol has been shown under no
stress condition in MEFs. It is, however, possible that SIRT1 may play a more important role in
regulating mTOR under stress conditions, and hence the effect of resveratrol under stress
conditions may potentially be fully dependent on SIRT1. Also, it is conceivable that the potential
role of SIRT1 in regulating mTOR signaling may vary qualitatively depending on the specific
stress stimuli, thereby either regulating mTOR signaling fully or in part by itself.
After confirming that SIRT1 mediates its effect on mTOR signaling through TSC2, we
asked if SIRT1 and TSC2 associate with each other in mammalian cells. Results from our co-
immunoprecipitation experiments using both endogenous as well as epitope tagged exogenously
expressed proteins showed that SIRT1 and TSC2 associate with each other in HeLa cells.
Furthermore, we observed that this association was present regardless of stress or growth
condition, which may indicate that SIRT1 potentially plays a constitutive role in maintaining the
correct signaling through mTOR complex-1 by sensing growth or stress stimuli. We also
observed that the chemical activator or inhibitor of SIRT1 deacetylase activity also did not have
an effect on the SIRT1-TSC2 association indicating that the catalytic activity of SIRT1 may be
needed after its association with TSC2 and potentially to the mTORC1-inhibitory TSC1/2
complex.
Thus we propose a novel SIRT1 mediated regulation of the mTOR complex-1. We
showed that SIRT1 downregulates mTOR signaling in human and mouse cells. SIRT1 binds to
TSC2 and requires TSC2 for its inhibitory role on the mTOR pathway. We propose a model
whereby SIRT1 is crucial for sensing stress stimuli to inhibit mTOR and potentially functions by

159
deacetylating members of the TSC1/2 complex to inhibit mTOR signaling in response to stress
conditions.
Figure 4.19 Proposed model for SIRT1 mediated regulation of mTOR
SIRT1 is important for sensing the extra-cellular stress response to down-regulate mTOR signaling when conditions
are not favorable. SIRT1 associates with TCS2 and down-regulates mTOR signaling potentially by deacetylating the
components of the inhibitory TSC1/2 complex.

160
The role of both mTOR and SIRT1 in aging diseases as well as in regulating insulin
signaling suggested a potential overlap between SIRT1 and mTOR signaling mediated lifespan
extension. We demonstrate for the first time that these two important pathways involved in aging
and related diseases are interconnected. The novel role of SIRT1 in regulating mTOR signaling
which regulates growth and proliferation could be potentially interesting from a therapeutic point
of view. SIRT1 is known to be a pro-cell survival factor due to its many protective functions.
Regulation of the mTOR could be another mechanism by which SIRT1 potentially plays a role
against stress-induced apoptosis and aberrant cell growth under unfavorable conditions. We
believe that the role of SIRT1 in regulating mTOR signaling could also be crucial in
understanding SIRT1’s role in mammalian aging processes. Even though SIRT1 is known to
regulate the insulin signaling pathway in worms to promote longevity, it is not clear how exactly
SIRT1 mediates longevity like effects in mammals. Our discovery that SIRT1 acts at a crucial
regulatory point; TSC1/2 complex in the mTOR pathway, is one step towards the elucidation of
SIRT1’s direct role in regulating the insulin-signaling pathway in mammals in response to stress
stimuli and potentially longevity.

161
5.0 OVERALL DISCUSSION AND CONCLUSIONS
This dissertation focuses on the protein SIRT1, which is a decetylase enzyme that regulates a
wide range of cellular processes by de-acetylating various protein substrates. These various
protein substrates that SIRT1 regulates mediate a myriad of cellular processes ranging from
metabolism, growth and differentiation, development, endocrine signaling and apoptosis. SIRT1
is also known as a lifespan determinant in lower organisms, potentially acting through calorie
restriction. Although, SIRT1 has not been directly shown to regulate lifespan in mammals,
various studies in knock-out mouse models suggest that SIRT1 may play an important role in
cell survival and longevity. Further studies identifying various SIRT1 associating proteins are
important for elucidating the various functions of SIRT1 and its role in stress resistance and
survival in mammalian systems. In this study, we identified three novel interacting-partners for
SIRT1 using a yeast-two hybrid system and co-immunoprecipitation. Furthermore, we showed
that, by interacting with these novel binding partners, SIRT1 modulates three independent
signaling pathways, which can potentially affect cellular stress response and survival.
5.1 TLE1: A NOVEL BINDING PARTNER FOR SIRT1
TLE1 is one of the four TLE (Transducin-Like Enhancer of split) genes that encode human
transcriptional repressors homologous to the Drosophila corepressor groucho [285]. TLE

162
proteins are temporally expressed in embryogenesis where they are involved in developmental
processes including neurogenesis, somitogenesis (body patterning), osteogenesis and
hematopoesis [43,287,319]. Gro/TLE bind to a wide variety of transcription factors (including
Hairy/HES, Runx, Lef/Tcf, and Nkx proteins) and regulate many signaling pathways such as
Notch and Wnt signaling. Aberrant activities of some of these pathways are implicated in human
cancers, such as Notch in Acute Lymphocytic Leukaemia [312], Wnt in colorectal cancer [20]
and Runx in Acute Myeloid Leukaemia [197]. The inhibitory role of TLE1 in Wnt signaling and
other cell fate determination signals is dependent on phosphorylation status and involves histone
deacetylase activity [29,44,129,227]. In our study, we discovered that the human TLE1 interacts
with the class III histone deacetylase, SIRT1. Data from our laboratory suggested that SIRT1
repressed NF-κB activity. Interestingly, Tetsuka et al. demonstrated that TLE1 and the amino-
terminal enhancer of split (AES), a shorter Groucho-related protein lacking the WD40 repeats,
bind p65 subunit and inhibit NF-κB transcriptional activity [293]. Since it was shown that
inhibition of NF-κB activity derepresses expression of the bone morphogenetic protein-4 gene,
indicating a putative role of vertebrate NF-κB in transcriptional repression, e.g [36], it was
speculated that if NF-κB acts as an active repressor in vertebrates, it is likely that there are
additional repressor binding sites and the respective DNA-binding
proteins. This was based on
the fact that in Drosophila, recruitment of Groucho is obligatory but is not sufficient for
Dorsal-
mediated repression. The Drosophila NF-κB (Dorsal)-mediated repression requires additional
repression elements in the proximity of the Dorsal binding sites and the binding of other DNA-
binding repressor proteins to these elements. Although, SIRT1 does not bind DNA directly, it
binds and regulates a number of histone proteins and transcription factors. HES1 and Hairy are
two such bHLH domain-containing DNA-binding transcription factors, that are associated and

163
regulated by both SIRT1 and TLE1 [78,79,237,288]. Also, SIRT1 and TLE1 both are known to
bind histone proteins, e.g Histone 3 and 4 [235]. Thus, it was possible that SIRT1 could act as
the additional repression element that helps the Gro/TLE1 mediated NF-κB repression. We
investigated if the interaction of SIRT1 and TLE1 was relevant to regulation of NF-κB
transcriptional activity. We found that both SIRT1 and TLE1 could repress TNF induced NF-
κB activity individually, but when these proteins were coexpressed, the repression on NF-κB
activity was further enhanced. While our investigation was going on, another group [320]
reported that SIRT1 represses NF-κB by deacetylating and inhibiting the transactivation domain
of p65. While we had observed that depletion of SIRT1 leads to a robust increase in TNF
induced NF-κB activity, we had not seen any effect of inhibition of SIRT1’s catalytic activity on
the same. By using a catalytic mutant of SIRT1, we showed that inhibition of NF-κB activity was
well achieved regardless of the sanctity of the catalytic core domain of SIRT1. To confirm this
result, we used a 270 a.a long amino-terminal fragment (1-270a.a) of SIRT1, which did not
possess the catalytic domain, and demonstrated that the amino-terminal 270 a.a fragment of
SIRT1 protein was sufficient to repress NF-κB activity. Co-expression of TLE1 with either of
these catalytic mutants of SIRT1, further enhanced the repression in the same way as it did for
the wild-type SIRT1 protein, indicating that TLE1 cooperates with SIRT1 to mediate repression
of NF-κB transcriptional activity. The importance of the presence of both SIRT1 and TLE1 for
repression of NF-κB activity was further demonstrated in knock-down experiments, where we
knocked-down either SIRT1 or TLE1 in HeLa cells by using shRNAi, and showed that depletion
of one protein affects the NF-κB repression mediated by the other. Thus, we demonstrated a
novel SIRT1 associating protein, TLE1, which plays a critical role in SIRT1 mediated repression
of NF-κB signaling, potentially through a novel deacetylase-independent mechanism.

164
While mounting evidence has documented the widespread importance of Gro/TLE-
mediated repression in different biological contexts, relatively little is known about the
mechanisms underlying Gro/TLE-mediated transcriptional repression. Characterization of
proteins that directly or indirectly associate with the Gro/TLE family of proteins is important for
insights into the mechanisms of Gro/TLE-mediated repression. Gro-interacting proteins have
been grouped into two categories: the first category comprises the sequence-specific
transcription factors that are responsible for the direct recruitment of Gro/TLE proteins to the
DNA, and the second category consists of proteins that functionally contribute to Gro/TLE-
repression activity. Evidence show that the TLE1 homologs in lower organisms; Drosophila and
yeast, bind with proteins, such as Rpd3[44], Sin3, RbAP48 [52] and Ssn6 [100,251,300], which
act either as histone deacetylase or an adaptor between TLE1 and DNA binding complexes.
Similarly, changes in the phosphorylation status of TLE1 proteins have been documented to
correlate with its repressional activity [129], indicating the importance of post-translational
modification by signaling pathways on TLE1 mediated repression. We propose that SIRT1 could
potentially be a second category TLE1 regulator. SIRT1 may regulate TLE1 mediated
repression, either through its deacetylase activity or by acting as a scaffold protein, thus
functioning to facilitate TLE1’s recruitment to histones, transcriptional machinery or to other
proteins of the TLE1 co-repressor complex.
Groucho (Gro)/TLE transcriptional corepressors are involved in a variety of
developmental mechanisms, including neuronal differentiation. In particular, Gro/TLE1 interacts
with forkhead transcription factor brain factor 1 (BF-1; also termed FoxG1) to regulate neuronal
differentiation during cerebral cortex development and represses transcription together with
Gro/TLE1[318]. Interestingly, SIRT1 deacetylates the mammalian Forkhead transcription factors
165
to regulate a variety of cellular processes. Also, while it has been shown that SIRT1 plays a role
in embryogenesis and developmental processes, the mechanism of SIRT1’s action in the same is
not fully understood. Given the well established role of TLE1 in developmental processes, the
interaction between SIRT1-TLE1 could potentially be relevant to regulation of development and
other processes affected by TLE corepressors. The potential broader impact of SIRT-TLE1
interaction in regulating different cellular processes can be elucidated by further investigation.
5.2 SIRT1: A NOVEL REGULATOR OF EUKARYOTIC INITIATION FACTOR 2-
ALPHA PHOSPHORYLATION AND STRESS RESPONSE
SIRT1 is known to regulate cellular stress response by acting through a number of proteins
which predominantly function as transcription factors, such as: p53, FOXO proteins, NF-κB and
E2F1. SIRT1’s role in longevity is believed to be linked with its role in regulating cellular stress
responses. We discovered that SIRT1 interacts with the eukaryotic translation initiation factor,
eIF2 . This is the first time that SIRT1 has been shown to interact with a protein involved in
translation regulation, as oppose to most of its targets that regulate gene expression at the
transcriptional level. Furthermore, eIF2 is a translation regulatory protein which plays a critical
role during cellular stress response. Given SIRT1’s established role in protecting cells under
stress conditions and our observation that SIRT1 associates with eIF2 , we asked if SIRT1
mediated its functions during stress response by regulating translation. Since phosphorylation of
eIF2 is the critical step through which eIF2 plays a role in stress response, we investigated if
SIRT1 affects phosphorylation of eIF2 under various stress conditions. Using SIRT1 knock-
down cell lines, we showed that depletion of SIRT1 is directly correlated with the upregulation
166
of eIF2 phosphorylation in response to various different stress conditions. Interestingly, the
eIF2 phosphorylation was much more significant in SIRT1 depleted cells and was more
sustained when compared to wild-type cells. However, CHOP, a downstream effector of the
stress response pathway was expressed much later in SIRT1 deficient cells compared to SIRT1
positive cells. Delayed expression of the downstream proteins in the stress response pathway can
lead to impaired stress response, which in turn can cause lethality. Consistent with this, the
SIRT1 depleted cells showed significantly more sensitivity to oxidative stress induced by two
different agents; paraquat and H2O2. Since SIRT1 is also known to protect cells from oxidative
stress by regulating the Forkhead transcription factors, we examined if the increased sensitivity
of the SIRT1 null cells in response to oxidative stress was due to blocked translation caused by
delayed CHOP expression resulting in consistently upregulated eIF2 phosphorylation. By using
a translation inhibitory drug, we show that indeed the higher survival of the SIRT1 positive cells
in response to oxidative stress was potentially due to recovery of translation in later phase of
stress response, as inhibition of translation in wild-type cells affected their survival, making them
similarly sensitive to the SIRT1 deficient cells.
Since phosphorylation of eIF2 by specific kinases is critical to cellular stress response,
we investigated if induction of stress or phosphorylation status of eIF2 affects eIF2 -SIRT1
association. Using two different stress treatments and mutant eIF2 , that were either
phosphorylation incompetent or phosphorylation mimetic, we demonstrated that SIRT1-eIF2
association was not dependent on stress condition or eIF2 phosphorylation. SIRT1, which is a
deacetylase enzyme associated with eIF2 and affected eIF2 phosphorylation. Hence we
further investigated if SIRT1’s deacetylase activity plays a role in SIRT1- eIF2 association.
Our results demonstrated that SIRT1 associates with eIF2 regardless of its catalytic activity.

167
Also, we could not detect eIF2 acetylation under stress or no stress condition. These
observations suggest that SIRT1 may associate with eIF2 as a scaffold protein to regulate
eIF2 mediated stress response. Furthermore, SIRT1 may potentially be important with regards
to the de-phosphorylation process of eIF2 , rather than regulating eIF2 phosphorylation.
Further studies examining the impact of SIRT1- eIF2 association with regards to the activity of
the protein phosphatase1 (PP1) holoenzyme that dephosphorylates eIF2 could provide
important details about regulation of eIF2 phosphorylation by SIRT1. Notably, in our studies
regarding SIRT1-TLE1 interaction and its role in NF-κB mediated transcription, we have
demonstrated that SIRT1 may have a functional role independent of its catalytic activity.
Although we do not rule out the possibility of SIRT1’s deacetylase action to be involved in its
regulation of eIF2 phosphorylation or de-phosphorylation, the deacetylase independent
functions of SIRT1 should also be kept in mind while investigating for the mechanism involved
in SIRT1 mediated eIF2 phosphorylation and stress response.
Genomic and proteomic profiling of cells have documented a lack of correlation between
the mRNA level and protein levels of numerous genes [39,107,131,222,249], indicating that
post-transcriptional and translational control may be more important for regulating gene
expression. This may be especially relevant in situations where immediate and rapid responses
are needed for survival, such as in pathogenic infection, chemical insult, nutrient deprivation and
alike. SIRT1 has been documented to be a determinant of longevity in lower organisms and
mammals. It is believed to function through sensing energy as well as regulating stress
responses. Conceivably, SIRT1 may potentially regulate survival responses that involve
immediate attention along with ones that are more constitutive. Our studies identified a novel
binding partner for SIRT1: eIF2 , a translation regulatory factor. Notably, SIRT1’s association

168
with eIF2 not only marks a new category of SIRT1 substrates, but also demonstrates that
SIRT1 may help the survival processes by regulating gene expression at multiple steps in
response to endogenous and exogenous stresses.
5.3 SIRT1: A REGULATOR OF THE TARGET OF RAPAMYCIN PATHWAY
The mammalian target of rapamycin (mTOR) regulates cell growth and metabolism in response
to diverse environmental cues, such as growth factors, nutrients, energy and stress. In the past 5
years, growing body of evidence has suggested a role of mTOR in longevity. Partial inhibition of
TOR function has been shown to result in significant increase in lifespan in yeast, worms and
flies [141,150,151,303]. Although, the mechanism of TOR’s action on lifespan is not known, it is
speculated that inhibition of mTOR increases lifespan by mimicking calorie restriction [202].
Incidentally, SIRT1 is known to sense energy, nutrients and stress status of cells, thereby
regulating metabolism and stress response. Furthermore, SIRT1 has been shown to mediate
lifespan extension due to calorie restriction in yeast, worms, flies and potentially mice. The
coincidental involvement of SIRT1 and mTOR in regulating metabolism, stress and energy
responses, longevity, and age related diseases, hints towards a possible link between the
functions and/or activities of these two proteins in regulating various cellular processes.
We demonstrated here that SIRT1 and mTOR are indeed interconnected, whereby SIRT1
negatively regulates mTOR signaling. Investigating an initial observation in our laboratory, that
SIRT1 knock-out mouse embryonic fibroblasts show larger cell morphology compared to wild-
type cells, we sought after the pathway that is widely known to be responsible for regulating cell
growth and size, namely the mTOR signaling pathway. We discovered that SIRT1 depletion in

169
mouse tissue, and human and mouse cells resulted in higher mTOR activity, as shown by
phosphorylation of the well characterized mTOR substrates: S6K, S6 and 4EBP1. Since growth
factor, amino acid stress and hypoxia have been documented to downregulate mTOR activity, we
tested if these stress conditions affected mTOR signaling in SIRT1 depleted cells. Our results
showed that mTOR signaling is upregulated in SIRT1 depleted cells despite of stress conditions,
indicating the importance of SIRT1 in downregulation of mTOR signaling in response to
unfavorable conditions. Notably, SIRT1 depletion did not result in alteration of the expression
levels of the proteins involved in mTOR signaling, such as mTOR, TSC1, TSC2, Rheb or
Raptor. Using an mTOR complex-1 specific inhibitor rapamycin, we further demonstrated that
the regulation of mTOR signaling by SIRT1 is upstream to the mTOR-complex-1, as rapamycin
could successfully abrogate mTOR signaling in both wild-type and SIRT1 depleted cells. Also,
we demonstrated that SIRT1’s catalytic activity was important in regulating mTOR activity. We
showed that the SIRT1 activator, resveratrol, inhibited mTOR signaling in a SIRT1-dependent
manner, whereas treatment of control SIRT1 positive cells with SIRT1 inhibitor, nicotinamide,
resulted in upregulated mTOR activity, similar to that observed in SIRT1 depleted cells.
TSC1-TSC2 complex is the most prominent upstream inhibitor of mTOR signaling,
which integrates several upstream signaling cues, such as growth factor, energy, stress and
possibly amino acids. In response to specific stimuli, such as hormones, low energy, low nutrient
or hypoxia, specific kinases and regulatory proteins, such as Akt, AMPK and REDD, activate or
inhibit the TSC2 protein of the TSC1-TSC2 complex, thereby regulating mTOR signaling.
Hence, we investigated if SIRT1’s inhibitory role on mTOR signaling was mediated through the
main mTOR inhibitory complex, TSC1-TSC2. Using SIRT1 activator and inhibitor in TSC2
knock-out cells, we demonstrated that these chemicals could not regulate mTOR signaling in the
170
absence of TSC2, indicating that SIRT1 indeed requires TSC2 for down-regulation of mTOR
signaling. Given our observations that SIRT1 acted upstream of mTORC1 and needed TSC2 for
its action, we suspected that SIRT1 may associate with the TSC1-TSC2 complex to regulate
mTOR signaling. Consistent with this, we finally demonstrated that SIRT1 associates with TSC2
in human cells. We further attempted to examine if TSC2 is an acetylated protein that is
regulated by SIRT1’s catalytic activity, but failed to detect acetylation of TSC2 under stress or
growth condition. Even though we could not detect acetylation of TSC2, our results do not rule
out the possibility that SIRT1 may potentially regulate other proteins of the mTOR regulatory
complexes, in order to mediate its effect.
Further studies on specific signals that modulate TSC2 activity can give critical
information with regards to SIRT1 mediated regulation of mTOR signaling. While regulation of
TSC2 in response to growth factor/hormones and energy stress is known to be regulated by Akt
and AMPK respectively, it is not yet known as to how REDD regulates TSC2 in response to
oxidative stress. It has been documented that REDD1 acts downstream to Akt and upstream of
TSC1/2 complex to downregulate mTOR signaling in an LKB independent manner. Given that
SIRT1 is known to regulate oxidative stress response by regulating the forkhead transcription
factor and our finding that it potentially regulates cellular stress response by regulating
translation (Chapter 3), investigating the potential role of SIRT1 in REDD1 mediated
downregulation of mTOR signaling could be very relevant. Interestingly, AMPK, which
phosphorylates and activates TSC2 in response to energy stress, is believed to activate SIRT1
through the activation of nicotinamide phosphoribosyltransferase (Nampt), a NAD+ salvage
pathway enzyme. Nampt overexpression or activation increases the [NAD+]/ [NADH] ratio,
which in turn induces SIRT1 activity, thereby placing AMPK upstream to SIRT1. Although

171
REDD1 has been shown to act independent of LKB1-AMPK signaling to downregulate
mTORC1, prolonged hypoxia can lead to energy depletion, thereby potentially interlinking the
REDD1 and AMPK regulation on mTOR signaling. Since SIRT1 is well documented in the
regulation of both energy and stress response, it will be potentially worthwhile to investigate if
REDD1 mediates regulation of mTOR signaling in response to energy and/ or oxidative stress
signals through SIRT1.
It was recently documented that eIF2 phosphorylation leads to activation of
PI3K/Akt/mTOR pathway. Although we detected upregulated eIF2 phosphorylation and its
downstream effects in SIRT1 depleted cells (as mentioned in Chapter 3), we did not observe
measurable upregulation of Akt in SIRT1 depleted cells. Moreover, while looking for the
upstream factor that SIRT1 was regulating to mediate mTOR signaling, we did not detect any
measurable difference in the levels of AMPK activity either with regards to presence or absence
of SIRT1. The above observation could be explained by our results suggesting that SIRT1
regulates mTOR signaling at the level of TSC2, which is downstream to both AMPK and Akt.
Given that SIRT1 and mTOR signaling are both implicated widely in age related diseases
and longevity, our discovery of SIRT1 as a regulator of mTOR signaling is very relevant to the
ongoing investigation with regards to elucidating the role of these two proteins in longevity.
Notably, while inhibition of mTOR signaling increases longevity, activation of SIRT1 is
important for lifespan extention. This is consistent with our observations that SIRT1 acts as a
negative regulator of mTOR pathway. Further investigation on the impact of SIRT1 mediated
regulation of mTOR signaling may open potential avenues in the field of aging research and
related diseases such as neurodegenerative and metabolic disorders, as well as cancer.

172
5.4 CLOSING REMARKS
The presented study demonstrates interaction of the human sirtuin protein, SIRT1, with three
novel binding partners: TLE1, eIF2 and TSC2. While TLE1-SIRT1 interaction was
demonstrated to be important for NF-κB mediated gene transcription, the other two SIRT1
interacting proteins, eIF2 and TSC2, play a role in translation regulation. This latter fact
provides compelling evidence for a novel aspect of the function of SIRT1: its role in translation
regulation.
Figure 5.1 Three novel aspects of SIRT1 function in regulating cellular stress response and aging
SIRT1 affects cellular senescence by regulating p53 and PML. SIRT1 improves cellular resistance to stress by
acting through the stress responsive proteins; the forkhead transcription factors (FOXO), E2F, p53, and Ku70.
SIRT1 also protects against neuronal toxicity and degeneration. Here we show that SIRT1 regulates cellular stress
Active SIRT1
p53, PML
NF-κB
A -
neurotoxicity
&
inflammation
senescence
Axonal
degeneration
(Bax) Ku70
E2F Stress
resistance
Stress
resistance
eIF2
phosphorylationmTOR
Cell growth and
proliferation
&
Ageing
SIRT1-TLE1SIRT1–TSC2
SIRT1–eIF2
Foxo
p53
Active SIRT1
p53, PML
NF-κB
A -
neurotoxicity
&
inflammation
senescence
Axonal
degeneration
(Bax) Ku70
E2F Stress
resistance
Stress
resistance
eIF2
phosphorylation
Stress
resistance
eIF2
phosphorylationmTOR
Cell growth and
proliferation
&
Ageing
mTOR
Cell growth and
proliferation
&
Ageing
SIRT1-TLE1SIRT1-TLE1SIRT1–TSC2SIRT1–TSC2
SIRT1–eIF2SIRT1–eIF2
Foxo
p53

173
response by three additional and novel mechanisms, by interacting with TLE1, eIF2 and TSC2 and regulating the
pathways controlled by these proteins.
SIRT1 has been implicated in various processes that play a role during cellular stress.
Our results have demonstrated three novel regulatory mechanisms that are independently
affected by SIRT1 to potentially impact cellular stress response and survival. We showed that
SIRT1 regulates NF-κB, an important regulator of immune response and inflammation, and
eIF2 , a critical regulator of stress response, thereby, directly playing a role in cellular stress
response. The mTOR pathway is a critical regulator of cell growth and proliferation in response
to growth or stress signals, thereby playing an important role in cancer. Hence, by regulating the
mTOR pathway, SIRT1 plays a role in cellular growth in response to stress thereby, potentially
regulating cancer. This thesis thus demonstrates, for the first time, the direct regulation of these
pathways by SIRT1, and lays grounds for a better understanding of SIRT1’s role in cancer and
aging.

174
BIBLIOGRAPHY
1. Al-Regaiey, K.A., Masternak, M.M., Bonkowski, M., Sun, L., and Bartke, A. 2005.
Long-lived growth hormone receptor knockout mice: interaction of reduced insulin-like
growth factor i/insulin signaling and caloric restriction. Endocrinology 146(2): 851-860.
2. Alcendor, R.R., Gao, S., Zhai, P., Zablocki, D., Holle, E., Yu, X., Tian, B., Wagner,
T., Vatner, S.F., and Sadoshima, J. 2007. Sirt1 regulates aging and resistance to
oxidative stress in the heart. Circ Res 100(10): 1512-1521.
3. Alcendor, R.R., Kirshenbaum, L.A., Imai, S., Vatner, S.F., and Sadoshima, J. 2004.
Silent information regulator 2alpha, a longevity factor and class III histone deacetylase, is
an essential endogenous apoptosis inhibitor in cardiac myocytes. Circ Res 95(10): 971-
980.
4. Anastasiou, D. and Krek, W. 2006. SIRT1: linking adaptive cellular responses to aging-
associated changes in organismal physiology. Physiology (Bethesda) 21: 404-410.
5. Anekonda, T.S. 2006. Resveratrol--a boon for treating Alzheimer's disease? Brain Res
Rev 52(2): 316-326.
6. Aparicio, O.M., Billington, B.L., and Gottschling, D.E. 1991. Modifiers of position
effect are shared between telomeric and silent mating-type loci in S. cerevisiae. Cell
66(6): 1279-1287.
7. Araki, T., Sasaki, Y., and Milbrandt, J. 2004. Increased nuclear NAD biosynthesis and
SIRT1 activation prevent axonal degeneration. Science 305(5686): 1010-1013.
8. Arking, R., Force, A.G., Dudas, S.P., Buck, S., and Baker, G.T., 3rd. 1996. Factors
contributing to the plasticity of the extended longevity phenotypes of Drosophila. Exp
Gerontol 31(6): 623-643.

175
9. Aronson, B.D., Fisher, A.L., Blechman, K., Caudy, M., and Gergen, J.P. 1997.
Groucho-dependent and -independent repression activities of Runt domain proteins. Mol
Cell Biol 17(9): 5581-5587.
10. Austad, S.N. 1989. Life extension by dietary restriction in the bowl and doily spider,
Frontinella pyramitela. Exp Gerontol 24(1): 83-92.
11. Bae, N.S., Swanson, M.J., Vassilev, A., and Howard, B.H. 2004. Human histone
deacetylase SIRT2 interacts with the homeobox transcription factor HOXA10. J Biochem
(Tokyo) 135(6): 695-700.
12. Barger, J.L., Walford, R.L., and Weindruch, R. 2003. The retardation of aging by
caloric restriction: its significance in the transgenic era. Exp Gerontol 38(11-12): 1343-
1351.
13. Baur, J.A., Pearson, K.J., Price, N.L., Jamieson, H.A., Lerin, C., Kalra, A., Prabhu,
V.V., Allard, J.S., Lopez-Lluch, G., Lewis, K., Pistell, P.J., Poosala, S., Becker, K.G.,
Boss, O., Gwinn, D., Wang, M., Ramaswamy, S., Fishbein, K.W., Spencer, R.G.,
Lakatta, E.G., Le Couteur, D., Shaw, R.J., Navas, P., Puigserver, P., Ingram, D.K.,
de Cabo, R., and Sinclair, D.A. 2006. Resveratrol improves health and survival of mice
on a high-calorie diet. Nature 444(7117): 337-342.
14. Baur, J.A. and Sinclair, D.A. 2006. Therapeutic potential of resveratrol: the in vivo
evidence. Nat Rev Drug Discov 5(6): 493-506.
15. Beal, M.F. 2005. Mitochondria take center stage in aging and neurodegeneration. Ann
Neurol 58(4): 495-505.
16. Bedalov, A. and Simon, J.A. 2004. Neuroscience. NAD to the rescue. Science
305(5686): 954-955.
17. Berdichevsky, A., Viswanathan, M., Horvitz, H.R., and Guarente, L. 2006. C.
elegans SIR-2.1 interacts with 14-3-3 proteins to activate DAF-16 and extend life span.
Cell 125(6): 1165-1177.
18. Bereshchenko, O.R., Gu, W., and Dalla-Favera, R. 2002. Acetylation inactivates the
transcriptional repressor BCL6. Nat Genet 32(4): 606-613.

176
19. Berger, Z., Ravikumar, B., Menzies, F.M., Oroz, L.G., Underwood, B.R., Pangalos,
M.N., Schmitt, I., Wullner, U., Evert, B.O., O'Kane, C.J., and Rubinsztein, D.C.
2006. Rapamycin alleviates toxicity of different aggregate-prone proteins. Hum Mol
Genet 15(3): 433-442.
20. Bienz, M. and Clevers, H. 2000. Linking colorectal cancer to Wnt signaling. Cell
103(2): 311-320.
21. Bitterman, K.J., Anderson, R.M., Cohen, H.Y., Latorre-Esteves, M., and Sinclair,
D.A. 2002. Inhibition of silencing and accelerated aging by nicotinamide, a putative
negative regulator of yeast sir2 and human SIRT1. J Biol Chem 277(47): 45099-45107.
22. Blander, G. and Guarente, L. 2004. The Sir2 family of protein deacetylases. Annu Rev
Biochem 73: 417-435.
23. Bluher, M., Kahn, B.B., and Kahn, C.R. 2003. Extended longevity in mice lacking the
insulin receptor in adipose tissue. Science 299(5606): 572-574.
24. Bodnar, A.G., Ouellette, M., Frolkis, M., Holt, S.E., Chiu, C.P., Morin, G.B., Harley,
C.B., Shay, J.W., Lichtsteiner, S., and Wright, W.E. 1998. Extension of life-span by
introduction of telomerase into normal human cells. Science 279(5349): 349-352.
25. Bohni, R., Riesgo-Escovar, J., Oldham, S., Brogiolo, W., Stocker, H., Andruss, B.F.,
Beckingham, K., and Hafen, E. 1999. Autonomous control of cell and organ size by
CHICO, a Drosophila homolog of vertebrate IRS1-4. Cell 97(7): 865-875.
26. Bordone, L., Cohen, D., Robinson, A., Motta, M.C., van Veen, E., Czopik, A., Steele,
A.D., Crowe, H., Marmor, S., Luo, J., Gu, W., and Guarente, L. 2007. SIRT1
transgenic mice show phenotypes resembling calorie restriction. Aging Cell.
27. Bordone, L., Motta, M.C., Picard, F., Robinson, A., Jhala, U.S., Apfeld, J.,
McDonagh, T., Lemieux, M., McBurney, M., Szilvasi, A., Easlon, E.J., Lin, S.J., and
Guarente, L. 2006. Sirt1 regulates insulin secretion by repressing UCP2 in pancreatic
beta cells. PLoS Biol 4(2): e31.
28. Bouras, T., Fu, M., Sauve, A.A., Wang, F., Quong, A.A., Perkins, N.D., Hay, R.T.,
Gu, W., and Pestell, R.G. 2005. SIRT1 deacetylation and repression of p300 involves
lysine residues 1020/1024 within the cell cycle regulatory domain 1. J Biol Chem
280(11): 10264-10276.
177
29. Brantjes, H., Roose, J., van De Wetering, M., and Clevers, H. 2001. All Tcf HMG
box transcription factors interact with Groucho-related co-repressors. Nucleic Acids Res
29(7): 1410-1419.
30. Braunstein, M., Rose, A.B., Holmes, S.G., Allis, C.D., and Broach, J.R. 1993.
Transcriptional silencing in yeast is associated with reduced nucleosome acetylation.
Genes Dev 7(4): 592-604.
31. Breese, C.R., Ingram, R.L., and Sonntag, W.E. 1991. Influence of age and long-term
dietary restriction on plasma insulin-like growth factor-1 (IGF-1), IGF-1 gene expression,
and IGF-1 binding proteins. J Gerontol 46(5): B180-187.
32. Britton, J.S., Lockwood, W.K., Li, L., Cohen, S.M., and Edgar, B.A. 2002.
Drosophila's insulin/PI3-kinase pathway coordinates cellular metabolism with nutritional
conditions. Dev Cell 2(2): 239-249.
33. Brugarolas, J., Lei, K., Hurley, R.L., Manning, B.D., Reiling, J.H., Hafen, E.,
Witters, L.A., Ellisen, L.W., and Kaelin, W.G., Jr. 2004. Regulation of mTOR
function in response to hypoxia by REDD1 and the TSC1/TSC2 tumor suppressor
complex. Genes Dev 18(23): 2893-2904.
34. Brunet, A., Sweeney, L.B., Sturgill, J.F., Chua, K.F., Greer, P.L., Lin, Y., Tran, H.,
Ross, S.E., Mostoslavsky, R., Cohen, H.Y., Hu, L.S., Cheng, H.L., Jedrychowski,
M.P., Gygi, S.P., Sinclair, D.A., Alt, F.W., and Greenberg, M.E. 2004. Stress-
dependent regulation of FOXO transcription factors by the SIRT1 deacetylase. Science
303(5666): 2011-2015.
35. Brush, M.H., Weiser, D.C., and Shenolikar, S. 2003. Growth arrest and DNA damage-
inducible protein GADD34 targets protein phosphatase 1 alpha to the endoplasmic
reticulum and promotes dephosphorylation of the alpha subunit of eukaryotic translation
initiation factor 2. Mol Cell Biol 23(4): 1292-1303.
36. Bushdid, P.B., Brantley, D.M., Yull, F.E., Blaeuer, G.L., Hoffman, L.H., Niswander,
L., and Kerr, L.D. 1998. Inhibition of NF-kappaB activity results in disruption of the
apical ectodermal ridge and aberrant limb morphogenesis. Nature 392(6676): 615-618.
37. Byfield, M.P., Murray, J.T., and Backer, J.M. 2005. hVps34 is a nutrient-regulated
lipid kinase required for activation of p70 S6 kinase. J Biol Chem 280(38): 33076-33082.

178
38. Cavallo, R.A., Cox, R.T., Moline, M.M., Roose, J., Polevoy, G.A., Clevers, H., Peifer,
M., and Bejsovec, A. 1998. Drosophila Tcf and Groucho interact to repress Wingless
signalling activity. Nature 395(6702): 604-608.
39. Celis, J.E., Kruhoffer, M., Gromova, I., Frederiksen, C., Ostergaard, M., Thykjaer,
T., Gromov, P., Yu, J., Palsdottir, H., Magnusson, N., and Orntoft, T.F. 2000. Gene
expression profiling: monitoring transcription and translation products using DNA
microarrays and proteomics. FEBS Lett 480(1): 2-16.
40. Chan, C.B., Saleh, M.C., Koshkin, V., and Wheeler, M.B. 2004. Uncoupling protein 2
and islet function. Diabetes 53 Suppl 1: S136-142.
41. Chen, D. and Guarente, L. 2007. SIR2: a potential target for calorie restriction
mimetics. Trends Mol Med 13(2): 64-71.
42. Chen, D., Steele, A.D., Lindquist, S., and Guarente, L. 2005. Increase in activity
during calorie restriction requires Sirt1. Science 310(5754): 1641.
43. Chen, G. and Courey, A.J. 2000. Groucho/TLE family proteins and transcriptional
repression. Gene 249(1-2): 1-16.
44. Chen, G., Fernandez, J., Mische, S., and Courey, A.J. 1999. A functional interaction
between the histone deacetylase Rpd3 and the corepressor groucho in Drosophila
development. Genes Dev 13(17): 2218-2230.
45. Chen, I.Y., Lypowy, J., Pain, J., Sayed, D., Grinberg, S., Alcendor, R.R., Sadoshima,
J., and Abdellatif, M. 2006. Histone H2A.z is essential for cardiac myocyte hypertrophy
but opposed by silent information regulator 2alpha. J Biol Chem 281(28): 19369-19377.
46. Chen, J., Zhou, Y., Mueller-Steiner, S., Chen, L.F., Kwon, H., Yi, S., Mucke, L., and
Gan, L. 2005. SIRT1 protects against microglia-dependent amyloid-beta toxicity through
inhibiting NF-kappaB signaling. J Biol Chem 280(48): 40364-40374.
47. Chen, L.F. and Greene, W.C. 2004. Shaping the nuclear action of NF-kappaB. Nat Rev
Mol Cell Biol 5(5): 392-401.
48. Chen, W.Y., Wang, D.H., Yen, R.C., Luo, J., Gu, W., and Baylin, S.B. 2005. Tumor
suppressor HIC1 directly regulates SIRT1 to modulate p53-dependent DNA-damage
responses. Cell 123(3): 437-448.

179
49. Cheng, H.L., Mostoslavsky, R., Saito, S., Manis, J.P., Gu, Y., Patel, P., Bronson, R.,
Appella, E., Alt, F.W., and Chua, K.F. 2003. Developmental defects and p53
hyperacetylation in Sir2 homolog (SIRT1)-deficient mice. Proc Natl Acad Sci U S A
100(19): 10794-10799.
50. Chiang, G.G. and Abraham, R.T. 2005. Phosphorylation of mammalian target of
rapamycin (mTOR) at Ser-2448 is mediated by p70S6 kinase. J Biol Chem 280(27):
25485-25490.
51. Cho, H.J., Park, J., Lee, H.W., Lee, Y.S., and Kim, J.B. 2004. Regulation of adipocyte
differentiation and insulin action with rapamycin. Biochem Biophys Res Commun 321(4):
942-948.
52. Choi, C.Y., Kim, Y.H., Kwon, H.J., and Kim, Y. 1999. The homeodomain protein NK-
3 recruits Groucho and a histone deacetylase complex to repress transcription. J Biol
Chem 274(47): 33194-33197.
53. Chua, K.F., Mostoslavsky, R., Lombard, D.B., Pang, W.W., Saito, S., Franco, S.,
Kaushal, D., Cheng, H.L., Fischer, M.R., Stokes, N., Murphy, M.M., Appella, E.,
and Alt, F.W. 2005. Mammalian SIRT1 limits replicative life span in response to
chronic genotoxic stress. Cell Metab 2(1): 67-76.
54. Clancy, D.J., Gems, D., Harshman, L.G., Oldham, S., Stocker, H., Hafen, E.,
Leevers, S.J., and Partridge, L. 2001. Extension of life-span by loss of CHICO, a
Drosophila insulin receptor substrate protein. Science 292(5514): 104-106.
55. Cohen, H.Y., Miller, C., Bitterman, K.J., Wall, N.R., Hekking, B., Kessler, B.,
Howitz, K.T., Gorospe, M., de Cabo, R., and Sinclair, D.A. 2004. Calorie restriction
promotes mammalian cell survival by inducing the SIRT1 deacetylase. Science
305(5682): 390-392.
56. Coleman, M.P. and Perry, V.H. 2002. Axon pathology in neurological disease: a
neglected therapeutic target. Trends Neurosci 25(10): 532-537.
57. Colombani, J., Raisin, S., Pantalacci, S., Radimerski, T., Montagne, J., and Leopold,
P. 2003. A nutrient sensor mechanism controls Drosophila growth. Cell 114(6): 739-749.
58. Conlon, I. and Raff, M. 1999. Size control in animal development. Cell 96(2): 235-244.
180
59. Connor, J.H., Weiser, D.C., Li, S., Hallenbeck, J.M., and Shenolikar, S. 2001.
Growth arrest and DNA damage-inducible protein GADD34 assembles a novel signaling
complex containing protein phosphatase 1 and inhibitor 1. Mol Cell Biol 21(20): 6841-
6850.
60. Crespo, J.L., Diaz-Troya, S., and Florencio, F.J. 2005. Inhibition of target of
rapamycin signaling by rapamycin in the unicellular green alga Chlamydomonas
reinhardtii. Plant Physiol 139(4): 1736-1749.
61. Crespo, J.L. and Hall, M.N. 2002. Elucidating TOR signaling and rapamycin action:
lessons from Saccharomyces cerevisiae. Microbiol Mol Biol Rev 66(4): 579-591, table of
contents.
62. Dai, J.M., Wang, Z.Y., Sun, D.C., Lin, R.X., and Wang, S.Q. 2007. SIRT1 interacts
with p73 and suppresses p73-dependent transcriptional activity. J Cell Physiol 210(1):
161-166.
63. Daitoku, H., Hatta, M., Matsuzaki, H., Aratani, S., Ohshima, T., Miyagishi, M.,
Nakajima, T., and Fukamizu, A. 2004. Silent information regulator 2 potentiates
Foxo1-mediated transcription through its deacetylase activity. Proc Natl Acad Sci U S A
101(27): 10042-10047.
64. Dali-Youcef, N., Lagouge, M., Froelich, S., Koehl, C., Schoonjans, K., and Auwerx,
J. 2007. Sirtuins: the 'magnificent seven', function, metabolism and longevity. Ann Med
39(5): 335-345.
65. Dames, S.A., Mulet, J.M., Rathgeb-Szabo, K., Hall, M.N., and Grzesiek, S. 2005. The
solution structure of the FATC domain of the protein kinase target of rapamycin suggests
a role for redox-dependent structural and cellular stability. J Biol Chem 280(21): 20558-
20564.
66. Dasgupta, B. and Milbrandt, J. 2007. Resveratrol stimulates AMP kinase activity in
neurons. Proc Natl Acad Sci U S A 104(17): 7217-7222.
67. Dehni, G., Liu, Y., Husain, J., and Stifani, S. 1995. TLE expression correlates with
mouse embryonic segmentation, neurogenesis, and epithelial determination. Mech Dev
53(3): 369-381.
68. Denu, J.M. 2003. Linking chromatin function with metabolic networks: Sir2 family of
NAD(+)-dependent deacetylases. Trends Biochem Sci 28(1): 41-48.

181
69. -. 2005. The Sir 2 family of protein deacetylases. Curr Opin Chem Biol 9(5): 431-440.
70. Dowell, P., Otto, T.C., Adi, S., and Lane, M.D. 2003. Convergence of peroxisome
proliferator-activated receptor gamma and Foxo1 signaling pathways. J Biol Chem
278(46): 45485-45491.
71. Dubnicoff, T., Valentine, S.A., Chen, G., Shi, T., Lengyel, J.A., Paroush, Z., and
Courey, A.J. 1997. Conversion of dorsal from an activator to a repressor by the global
corepressor Groucho. Genes Dev 11(22): 2952-2957.
72. Dunn, S.E., Kari, F.W., French, J., Leininger, J.R., Travlos, G., Wilson, R., and
Barrett, J.C. 1997. Dietary restriction reduces insulin-like growth factor I levels, which
modulates apoptosis, cell proliferation, and tumor progression in p53-deficient mice.
Cancer Res 57(21): 4667-4672.
73. Edinger, A.L. and Thompson, C.B. 2002. Akt maintains cell size and survival by
increasing mTOR-dependent nutrient uptake. Mol Biol Cell 13(7): 2276-2288.
74. Feng, Z., Zhang, H., Levine, A.J., and Jin, S. 2005. The coordinate regulation of the
p53 and mTOR pathways in cells. Proc Natl Acad Sci U S A 102(23): 8204-8209.
75. Fernandez, J., Bode, B., Koromilas, A., Diehl, J.A., Krukovets, I., Snider, M.D., and
Hatzoglou, M. 2002. Translation mediated by the internal ribosome entry site of the cat-
1 mRNA is regulated by glucose availability in a PERK kinase-dependent manner. J Biol
Chem 277(14): 11780-11787.
76. Fernandez, J., Yaman, I., Sarnow, P., Snider, M.D., and Hatzoglou, M. 2002.
Regulation of internal ribosomal entry site-mediated translation by phosphorylation of the
translation initiation factor eIF2alpha. J Biol Chem 277(21): 19198-19205.
77. Fingar, D.C., Salama, S., Tsou, C., Harlow, E., and Blenis, J. 2002. Mammalian cell
size is controlled by mTOR and its downstream targets S6K1 and 4EBP1/eIF4E. Genes
Dev 16(12): 1472-1487.
78. Fisher, A. and Caudy, M. 1998. The function of hairy-related bHLH repressor proteins
in cell fate decisions. Bioessays 20(4): 298-306.

182
79. Fisher, A.L., Ohsako, S., and Caudy, M. 1996. The WRPW motif of the hairy-related
basic helix-loop-helix repressor proteins acts as a 4-amino-acid transcription repression
and protein-protein interaction domain. Mol Cell Biol 16(6): 2670-2677.
80. Flier, J.S. 2004. Obesity wars: molecular progress confronts an expanding epidemic. Cell
116(2): 337-350.
81. Ford, E., Voit, R., Liszt, G., Magin, C., Grummt, I., and Guarente, L. 2006.
Mammalian Sir2 homolog SIRT7 is an activator of RNA polymerase I transcription.
Genes Dev 20(9): 1075-1080.
82. Ford, J., Jiang, M., and Milner, J. 2005. Cancer-specific functions of SIRT1 enable
human epithelial cancer cell growth and survival. Cancer Res 65(22): 10457-10463.
83. Fraga, M.F., Ballestar, E., Villar-Garea, A., Boix-Chornet, M., Espada, J., Schotta,
G., Bonaldi, T., Haydon, C., Ropero, S., Petrie, K., Iyer, N.G., Perez-Rosado, A.,
Calvo, E., Lopez, J.A., Cano, A., Calasanz, M.J., Colomer, D., Piris, M.A., Ahn, N.,
Imhof, A., Caldas, C., Jenuwein, T., and Esteller, M. 2005. Loss of acetylation at
Lys16 and trimethylation at Lys20 of histone H4 is a common hallmark of human cancer.
Nat Genet 37(4): 391-400.
84. Frescas, D., Valenti, L., and Accili, D. 2005. Nuclear trapping of the forkhead
transcription factor FoxO1 via Sirt-dependent deacetylation promotes expression of
glucogenetic genes. J Biol Chem 280(21): 20589-20595.
85. Frey, N., Katus, H.A., Olson, E.N., and Hill, J.A. 2004. Hypertrophy of the heart: a
new therapeutic target? Circulation 109(13): 1580-1589.
86. Frye, R.A. 1999. Characterization of five human cDNAs with homology to the yeast
SIR2 gene: Sir2-like proteins (sirtuins) metabolize NAD and may have protein ADP-
ribosyltransferase activity. Biochem Biophys Res Commun 260(1): 273-279.
87. -. 2000. Phylogenetic classification of prokaryotic and eukaryotic Sir2-like proteins.
Biochem Biophys Res Commun 273(2): 793-798.
88. Fu, M., Liu, M., Sauve, A.A., Jiao, X., Zhang, X., Wu, X., Powell, M.J., Yang, T.,
Gu, W., Avantaggiati, M.L., Pattabiraman, N., Pestell, T.G., Wang, F., Quong, A.A.,
Wang, C., and Pestell, R.G. 2006. Hormonal control of androgen receptor function
through SIRT1. Mol Cell Biol 26(21): 8122-8135.

183
89. Fulco, M., Schiltz, R.L., Iezzi, S., King, M.T., Zhao, P., Kashiwaya, Y., Hoffman, E.,
Veech, R.L., and Sartorelli, V. 2003. Sir2 regulates skeletal muscle differentiation as a
potential sensor of the redox state. Mol Cell 12(1): 51-62.
90. Gan, L., Han, Y., Bastianetto, S., Dumont, Y., Unterman, T.G., and Quirion, R.
2005. FoxO-dependent and -independent mechanisms mediate SirT1 effects on IGFBP-1
gene expression. Biochem Biophys Res Commun 337(4): 1092-1096.
91. Gao, F., Cheng, J., Shi, T., and Yeh, E.T. 2006. Neddylation of a breast cancer-
associated protein recruits a class III histone deacetylase that represses NFkappaB-
dependent transcription. Nat Cell Biol 8(10): 1171-1177.
92. Gao, X., Zhang, Y., Arrazola, P., Hino, O., Kobayashi, T., Yeung, R.S., Ru, B., and
Pan, D. 2002. Tsc tumour suppressor proteins antagonize amino-acid-TOR signalling.
Nat Cell Biol 4(9): 699-704.
93. Gerhart-Hines, Z., Rodgers, J.T., Bare, O., Lerin, C., Kim, S.H., Mostoslavsky, R.,
Alt, F.W., Wu, Z., and Puigserver, P. 2007. Metabolic control of muscle mitochondrial
function and fatty acid oxidation through SIRT1/PGC-1alpha. EMBO J 26(7): 1913-
1923.
94. Ghosh, H.S., Spencer, J.V., Ng, B., McBurney, M.W., and Robbins, P.D. 2007. Sirt1
interacts with transducin-like enhancer of split-1 to inhibit nuclear factor kappaB-
mediated transcription. Biochem J 408(1): 105-111.
95. Ghosh, S. and Karin, M. 2002. Missing pieces in the NF-kappaB puzzle. Cell 109
Suppl: S81-96.
96. Giannakou, M.E., Goss, M., Junger, M.A., Hafen, E., Leevers, S.J., and Partridge,
L. 2004. Long-lived Drosophila with overexpressed dFOXO in adult fat body. Science
305(5682): 361.
97. Giannakou, M.E. and Partridge, L. 2004. The interaction between FOXO and SIRT1:
tipping the balance towards survival. Trends Cell Biol 14(8): 408-412.
98. Glass, D.J. 2005. A signaling role for dystrophin: inhibiting skeletal muscle atrophy
pathways. Cancer Cell 8(5): 351-352.

184
99. Gottlieb, S. and Esposito, R.E. 1989. A new role for a yeast transcriptional silencer
gene, SIR2, in regulation of recombination in ribosomal DNA. Cell 56(5): 771-776.
100. Grbavec, D., Lo, R., Liu, Y., Greenfield, A., and Stifani, S. 1999. Groucho/transducin-
like enhancer of split (TLE) family members interact with the yeast transcriptional co-
repressor SSN6 and mammalian SSN6-related proteins: implications for evolutionary
conservation of transcription repression mechanisms. Biochem J 337 ( Pt 1): 13-17.
101. Grbavec, D., Lo, R., Liu, Y., and Stifani, S. 1998. Transducin-like Enhancer of split 2,
a mammalian homologue of Drosophila Groucho, acts as a transcriptional repressor,
interacts with Hairy/Enhancer of split proteins, and is expressed during neuronal
development. Eur J Biochem 258(2): 339-349.
102. Grbavec, D. and Stifani, S. 1996. Molecular interaction between TLE1 and the
carboxyl-terminal domain of HES-1 containing the WRPW motif. Biochem Biophys Res
Commun 223(3): 701-705.
103. Guarente, L. 2000. Sir2 links chromatin silencing, metabolism, and aging. Genes Dev
14(9): 1021-1026.
104. Guarente, L. and Kenyon, C. 2000. Genetic pathways that regulate ageing in model
organisms. Nature 408(6809): 255-262.
105. Guba, M., von Breitenbuch, P., Steinbauer, M., Koehl, G., Flegel, S., Hornung, M.,
Bruns, C.J., Zuelke, C., Farkas, S., Anthuber, M., Jauch, K.W., and Geissler, E.K. 2002. Rapamycin inhibits primary and metastatic tumor growth by antiangiogenesis:
involvement of vascular endothelial growth factor. Nat Med 8(2): 128-135.
106. Guertin, D.A. and Sabatini, D.M. 2005. An expanding role for mTOR in cancer. Trends
Mol Med 11(8): 353-361.
107. Gygi, S.P., Rochon, Y., Franza, B.R., and Aebersold, R. 1999. Correlation between
protein and mRNA abundance in yeast. Mol Cell Biol 19(3): 1720-1730.
108. Haigis, M.C. and Guarente, L.P. 2006. Mammalian sirtuins--emerging roles in
physiology, aging, and calorie restriction. Genes Dev 20(21): 2913-2921.
109. Haigis, M.C., Mostoslavsky, R., Haigis, K.M., Fahie, K., Christodoulou, D.C.,
Murphy, A.J., Valenzuela, D.M., Yancopoulos, G.D., Karow, M., Blander, G.,

185
Wolberger, C., Prolla, T.A., Weindruch, R., Alt, F.W., and Guarente, L. 2006.
SIRT4 inhibits glutamate dehydrogenase and opposes the effects of calorie restriction in
pancreatic beta cells. Cell 126(5): 941-954.
110. Hallows, W.C., Lee, S., and Denu, J.M. 2006. Sirtuins deacetylate and activate
mammalian acetyl-CoA synthetases. Proc Natl Acad Sci U S A 103(27): 10230-10235.
111. Hara, K., Maruki, Y., Long, X., Yoshino, K., Oshiro, N., Hidayat, S., Tokunaga, C.,
Avruch, J., and Yonezawa, K. 2002. Raptor, a binding partner of target of rapamycin
(TOR), mediates TOR action. Cell 110(2): 177-189.
112. Harding, H.P., Calfon, M., Urano, F., Novoa, I., and Ron, D. 2002. Transcriptional
and translational control in the Mammalian unfolded protein response. Annu Rev Cell
Dev Biol 18: 575-599.
113. Harding, H.P., Novoa, I., Zhang, Y., Zeng, H., Wek, R., Schapira, M., and Ron, D.
2000. Regulated translation initiation controls stress-induced gene expression in
mammalian cells. Mol Cell 6(5): 1099-1108.
114. Harding, H.P., Zhang, Y., Bertolotti, A., Zeng, H., and Ron, D. 2000. Perk is essential
for translational regulation and cell survival during the unfolded protein response. Mol
Cell 5(5): 897-904.
115. Harding, H.P., Zhang, Y., Zeng, H., Novoa, I., Lu, P.D., Calfon, M., Sadri, N., Yun,
C., Popko, B., Paules, R., Stojdl, D.F., Bell, J.C., Hettmann, T., Leiden, J.M., and
Ron, D. 2003. An integrated stress response regulates amino acid metabolism and
resistance to oxidative stress. Mol Cell 11(3): 619-633.
116. Harley, C.B., Futcher, A.B., and Greider, C.W. 1990. Telomeres shorten during
ageing of human fibroblasts. Nature 345(6274): 458-460.
117. Harrington, L.S., Findlay, G.M., Gray, A., Tolkacheva, T., Wigfield, S., Rebholz, H.,
Barnett, J., Leslie, N.R., Cheng, S., Shepherd, P.R., Gout, I., Downes, C.P., and
Lamb, R.F. 2004. The TSC1-2 tumor suppressor controls insulin-PI3K signaling via
regulation of IRS proteins. J Cell Biol 166(2): 213-223.
118. Hay, N. and Sonenberg, N. 2004. Upstream and downstream of mTOR. Genes Dev
18(16): 1926-1945.

186
119. Hayflick, L. 1965. The Limited in Vitro Lifetime of Human Diploid Cell Strains. Exp
Cell Res 37: 614-636.
120. Heitman, J., Movva, N.R., and Hall, M.N. 1991. Targets for cell cycle arrest by the
immunosuppressant rapamycin in yeast. Science 253(5022): 905-909.
121. Heltweg, B., Gatbonton, T., Schuler, A.D., Posakony, J., Li, H., Goehle, S.,
Kollipara, R., Depinho, R.A., Gu, Y., Simon, J.A., and Bedalov, A. 2006. Antitumor
activity of a small-molecule inhibitor of human silent information regulator 2 enzymes.
Cancer Res 66(8): 4368-4377.
122. Hernick, M. and Fierke, C.A. 2005. Zinc hydrolases: the mechanisms of zinc-
dependent deacetylases. Arch Biochem Biophys 433(1): 71-84.
123. Holcik, M., Yeh, C., Korneluk, R.G., and Chow, T. 2000. Translational upregulation
of X-linked inhibitor of apoptosis (XIAP) increases resistance to radiation induced cell
death. Oncogene 19(36): 4174-4177.
124. Holliday, R. 1989. Food, reproduction and longevity: is the extended lifespan of calorie-
restricted animals an evolutionary adaptation? Bioessays 10(4): 125-127.
125. Holz, M.K. and Blenis, J. 2005. Identification of S6 kinase 1 as a novel mammalian
target of rapamycin (mTOR)-phosphorylating kinase. J Biol Chem 280(28): 26089-
26093.
126. Holzenberger, M., Dupont, J., Ducos, B., Leneuve, P., Geloen, A., Even, P.C.,
Cervera, P., and Le Bouc, Y. 2003. IGF-1 receptor regulates lifespan and resistance to
oxidative stress in mice. Nature 421(6919): 182-187.
127. Howitz, K.T., Bitterman, K.J., Cohen, H.Y., Lamming, D.W., Lavu, S., Wood, J.G.,
Zipkin, R.E., Chung, P., Kisielewski, A., Zhang, L.L., Scherer, B., and Sinclair, D.A. 2003. Small molecule activators of sirtuins extend Saccharomyces cerevisiae lifespan.
Nature 425(6954): 191-196.
128. Hudson, C.C., Liu, M., Chiang, G.G., Otterness, D.M., Loomis, D.C., Kaper, F.,
Giaccia, A.J., and Abraham, R.T. 2002. Regulation of hypoxia-inducible factor 1alpha
expression and function by the mammalian target of rapamycin. Mol Cell Biol 22(20):
7004-7014.

187
129. Husain, J., Lo, R., Grbavec, D., and Stifani, S. 1996. Affinity for the nuclear
compartment and expression during cell differentiation implicate phosphorylated
Groucho/TLE1 forms of higher molecular mass in nuclear functions. Biochem J 317 ( Pt
2): 523-531.
130. Hwangbo, D.S., Gershman, B., Tu, M.P., Palmer, M., and Tatar, M. 2004.
Drosophila dFOXO controls lifespan and regulates insulin signalling in brain and fat
body. Nature 429(6991): 562-566.
131. Ideker, T., Thorsson, V., Ranish, J.A., Christmas, R., Buhler, J., Eng, J.K.,
Bumgarner, R., Goodlett, D.R., Aebersold, R., and Hood, L. 2001. Integrated genomic
and proteomic analyses of a systematically perturbed metabolic network. Science
292(5518): 929-934.
132. Imai, S., Armstrong, C.M., Kaeberlein, M., and Guarente, L. 2000. Transcriptional
silencing and longevity protein Sir2 is an NAD-dependent histone deacetylase. Nature
403(6771): 795-800.
133. Imai, Y., Kurokawa, M., Tanaka, K., Friedman, A.D., Ogawa, S., Mitani, K.,
Yazaki, Y., and Hirai, H. 1998. TLE, the human homolog of groucho, interacts with
AML1 and acts as a repressor of AML1-induced transactivation. Biochem Biophys Res
Commun 252(3): 582-589.
134. Ingle, L.W., T. and Banta, A.M. 1937. A study of longevity, growth, reproduction and
heart rate in Daphnia longispina as influenced by limitations of quantity of food. J Exp
Zool 76: 325-352.
135. Inoki, K., Corradetti, M.N., and Guan, K.L. 2005. Dysregulation of the TSC-mTOR
pathway in human disease. Nat Genet 37(1): 19-24.
136. Inoki, K., Li, Y., Xu, T., and Guan, K.L. 2003. Rheb GTPase is a direct target of TSC2
GAP activity and regulates mTOR signaling. Genes Dev 17(15): 1829-1834.
137. Ivy, J.M., Hicks, J.B., and Klar, A.J. 1985. Map positions of yeast genes SIR1, SIR3
and SIR4. Genetics 111(4): 735-744.
138. Jacinto, E., Loewith, R., Schmidt, A., Lin, S., Ruegg, M.A., Hall, A., and Hall, M.N.
2004. Mammalian TOR complex 2 controls the actin cytoskeleton and is rapamycin
insensitive. Nat Cell Biol 6(11): 1122-1128.

188
139. Jackson, M.D., Schmidt, M.T., Oppenheimer, N.J., and Denu, J.M. 2003. Mechanism
of nicotinamide inhibition and transglycosidation by Sir2 histone/protein deacetylases. J
Biol Chem 278(51): 50985-50998.
140. Jeong, J., Juhn, K., Lee, H., Kim, S.H., Min, B.H., Lee, K.M., Cho, M.H., Park,
G.H., and Lee, K.H. 2007. SIRT1 promotes DNA repair activity and deacetylation of
Ku70. Exp Mol Med 39(1): 8-13.
141. Jia, K., Chen, D., and Riddle, D.L. 2004. The TOR pathway interacts with the insulin
signaling pathway to regulate C. elegans larval development, metabolism and life span.
Development 131(16): 3897-3906.
142. Jiang, H.Y. and Wek, R.C. 2005. GCN2 phosphorylation of eIF2alpha activates NF-
kappaB in response to UV irradiation. Biochem J 385(Pt 2): 371-380.
143. -. 2005. Phosphorylation of the alpha-subunit of the eukaryotic initiation factor-2
(eIF2alpha) reduces protein synthesis and enhances apoptosis in response to proteasome
inhibition. J Biol Chem 280(14): 14189-14202.
144. Jiang, H.Y., Wek, S.A., McGrath, B.C., Lu, D., Hai, T., Harding, H.P., Wang, X.,
Ron, D., Cavener, D.R., and Wek, R.C. 2004. Activating transcription factor 3 is
integral to the eukaryotic initiation factor 2 kinase stress response. Mol Cell Biol 24(3):
1365-1377.
145. Jiang, H.Y., Wek, S.A., McGrath, B.C., Scheuner, D., Kaufman, R.J., Cavener,
D.R., and Wek, R.C. 2003. Phosphorylation of the alpha subunit of eukaryotic initiation
factor 2 is required for activation of NF-kappaB in response to diverse cellular stresses.
Mol Cell Biol 23(16): 5651-5663.
146. Jiang, J.C., Jaruga, E., Repnevskaya, M.V., and Jazwinski, S.M. 2000. An
intervention resembling caloric restriction prolongs life span and retards aging in yeast.
Faseb J 14(14): 2135-2137.
147. Jimenez, G., Paroush, Z., and Ish-Horowicz, D. 1997. Groucho acts as a corepressor
for a subset of negative regulators, including Hairy and Engrailed. Genes Dev 11(22):
3072-3082.
148. Ju, B.G., Solum, D., Song, E.J., Lee, K.J., Rose, D.W., Glass, C.K., and Rosenfeld,
M.G. 2004. Activating the PARP-1 sensor component of the groucho/ TLE1 corepressor
189
complex mediates a CaMKinase IIdelta-dependent neurogenic gene activation pathway.
Cell 119(6): 815-829.
149. Kaeberlein, M., McVey, M., and Guarente, L. 1999. The SIR2/3/4 complex and SIR2
alone promote longevity in Saccharomyces cerevisiae by two different mechanisms.
Genes Dev 13(19): 2570-2580.
150. Kaeberlein, M., Powers, R.W., 3rd, Steffen, K.K., Westman, E.A., Hu, D., Dang, N.,
Kerr, E.O., Kirkland, K.T., Fields, S., and Kennedy, B.K. 2005. Regulation of yeast
replicative life span by TOR and Sch9 in response to nutrients. Science 310(5751): 1193-
1196.
151. Kapahi, P., Zid, B.M., Harper, T., Koslover, D., Sapin, V., and Benzer, S. 2004.
Regulation of lifespan in Drosophila by modulation of genes in the TOR signaling
pathway. Curr Biol 14(10): 885-890.
152. Kataoka, H., Bonnefin, P., Vieyra, D., Feng, X., Hara, Y., Miura, Y., Joh, T.,
Nakabayashi, H., Vaziri, H., Harris, C.C., and Riabowol, K. 2003. ING1 represses
transcription by direct DNA binding and through effects on p53. Cancer Res 63(18):
5785-5792.
153. Kaufman, R.J., Scheuner, D., Schroder, M., Shen, X., Lee, K., Liu, C.Y., and
Arnold, S.M. 2002. The unfolded protein response in nutrient sensing and
differentiation. Nat Rev Mol Cell Biol 3(6): 411-421.
154. Kazemi, S., Mounir, Z., Baltzis, D., Raven, J.F., Wang, S., Krishnamoorthy, J.L.,
Pluquet, O., Pelletier, J., and Koromilas, A.E. 2007. A novel function of eIF2alpha
kinases as inducers of the phosphoinositide-3 kinase signaling pathway. Mol Biol Cell
18(9): 3635-3644.
155. Kennedy, B.K., Austriaco, N.R., Jr., Zhang, J., and Guarente, L. 1995. Mutation in
the silencing gene SIR4 can delay aging in S. cerevisiae. Cell 80(3): 485-496.
156. Kenyon, C. 2005. The plasticity of aging: insights from long-lived mutants. Cell 120(4):
449-460.
157. Kenyon, C., Chang, J., Gensch, E., Rudner, A., and Tabtiang, R. 1993. A C. elegans
mutant that lives twice as long as wild type. Nature 366(6454): 461-464.

190
158. Kim, D.H., Sarbassov, D.D., Ali, S.M., King, J.E., Latek, R.R., Erdjument-Bromage,
H., Tempst, P., and Sabatini, D.M. 2002. mTOR interacts with raptor to form a
nutrient-sensitive complex that signals to the cell growth machinery. Cell 110(2): 163-
175.
159. Kim, J.E. and Chen, J. 2004. regulation of peroxisome proliferator-activated receptor-
gamma activity by mammalian target of rapamycin and amino acids in adipogenesis.
Diabetes 53(11): 2748-2756.
160. Kimura, K.D., Tissenbaum, H.A., Liu, Y., and Ruvkun, G. 1997. daf-2, an insulin
receptor-like gene that regulates longevity and diapause in Caenorhabditis elegans.
Science 277(5328): 942-946.
161. Kirkwood, T.L., Kapahi, P., and Shanley, D.P. 2000. Evolution, stress, and longevity.
J Anat 197 Pt 4: 587-590.
162. Kitamura, Y.I., Kitamura, T., Kruse, J.P., Raum, J.C., Stein, R., Gu, W., and Accili,
D. 2005. FoxO1 protects against pancreatic beta cell failure through NeuroD and MafA
induction. Cell Metab 2(3): 153-163.
163. Klar, A.J., Fogel, S., and Macleod, K. 1979. MAR1-a Regulator of the HMa and
HMalpha Loci in SACCHAROMYCES CEREVISIAE. Genetics 93(1): 37-50.
164. Klass, M. and Hirsh, D. 1976. Non-ageing developmental variant of Caenorhabditis
elegans. Nature 260(5551): 523-525.
165. Klass, M.R. 1977. Aging in the nematode Caenorhabditis elegans: major biological and
environmental factors influencing life span. Mech Ageing Dev 6(6): 413-429.
166. Kobayashi, Y., Furukawa-Hibi, Y., Chen, C., Horio, Y., Isobe, K., Ikeda, K., and
Motoyama, N. 2005. SIRT1 is critical regulator of FOXO-mediated transcription in
response to oxidative stress. Int J Mol Med 16(2): 237-243.
167. Koop, K.E., MacDonald, L.M., and Lobe, C.G. 1996. Transcripts of Grg4, a murine
groucho-related gene, are detected in adjacent tissues to other murine neurogenic gene
homologues during embryonic development. Mech Dev 59(1): 73-87.
168. Koubova, J. and Guarente, L. 2003. How does calorie restriction work? Genes Dev
17(3): 313-321.

191
169. Kultz, D. 2005. Molecular and evolutionary basis of the cellular stress response. Annu
Rev Physiol 67: 225-257.
170. Kume, S., Haneda, M., Kanasaki, K., Sugimoto, T., Araki, S., Isono, M., Isshiki, K.,
Uzu, T., Kashiwagi, A., and Koya, D. 2006. Silent information regulator 2 (SIRT1)
attenuates oxidative stress-induced mesangial cell apoptosis via p53 deacetylation. Free
Radic Biol Med 40(12): 2175-2182.
171. Kume, S., Haneda, M., Kanasaki, K., Sugimoto, T., Araki, S., Isshiki, K., Isono, M.,
Uzu, T., Guarente, L., Kashiwagi, A., and Koya, D. 2007. SIRT1 inhibits transforming
growth factor beta-induced apoptosis in glomerular mesangial cells via Smad7
deacetylation. J Biol Chem 282(1): 151-158.
172. Kuzmichev, A., Margueron, R., Vaquero, A., Preissner, T.S., Scher, M., Kirmizis,
A., Ouyang, X., Brockdorff, N., Abate-Shen, C., Farnham, P., and Reinberg, D.
2005. Composition and histone substrates of polycomb repressive group complexes
change during cellular differentiation. Proc Natl Acad Sci U S A 102(6): 1859-1864.
173. Labinskyy, N., Csiszar, A., Veress, G., Stef, G., Pacher, P., Oroszi, G., Wu, J., and
Ungvari, Z. 2006. Vascular dysfunction in aging: potential effects of resveratrol, an anti-
inflammatory phytoestrogen. Curr Med Chem 13(9): 989-996.
174. Lagouge, M., Argmann, C., Gerhart-Hines, Z., Meziane, H., Lerin, C., Daussin, F.,
Messadeq, N., Milne, J., Lambert, P., Elliott, P., Geny, B., Laakso, M., Puigserver,
P., and Auwerx, J. 2006. Resveratrol improves mitochondrial function and protects
against metabolic disease by activating SIRT1 and PGC-1alpha. Cell 127(6): 1109-1122.
175. Lakowski, B. and Hekimi, S. 1998. The genetics of caloric restriction in Caenorhabditis
elegans. Proc Natl Acad Sci U S A 95(22): 13091-13096.
176. Landry, J., Slama, J.T., and Sternglanz, R. 2000. Role of NAD(+) in the deacetylase
activity of the SIR2-like proteins. Biochem Biophys Res Commun 278(3): 685-690.
177. Landry, J., Sutton, A., Tafrov, S.T., Heller, R.C., Stebbins, J., Pillus, L., and
Sternglanz, R. 2000. The silencing protein SIR2 and its homologs are NAD-dependent
protein deacetylases. Proc Natl Acad Sci U S A 97(11): 5807-5811.
178. Langley, E., Pearson, M., Faretta, M., Bauer, U.M., Frye, R.A., Minucci, S., Pelicci,
P.G., and Kouzarides, T. 2002. Human SIR2 deacetylates p53 and antagonizes
PML/p53-induced cellular senescence. Embo J 21(10): 2383-2396.
192
179. Lee, S., Comer, F.I., Sasaki, A., McLeod, I.X., Duong, Y., Okumura, K., Yates, J.R.,
3rd, Parent, C.A., and Firtel, R.A. 2005. TOR complex 2 integrates cell movement
during chemotaxis and signal relay in Dictyostelium. Mol Biol Cell 16(10): 4572-4583.
180. Leevers, S.J., Weinkove, D., MacDougall, L.K., Hafen, E., and Waterfield, M.D.
1996. The Drosophila phosphoinositide 3-kinase Dp110 promotes cell growth. Embo J
15(23): 6584-6594.
181. Legube, G. and Trouche, D. 2003. Regulating histone acetyltransferases and
deacetylases. EMBO Rep 4(10): 944-947.
182. Leibiger, I.B. and Berggren, P.O. 2006. Sirt1: a metabolic master switch that modulates
lifespan. Nat Med 12(1): 34-36; discussion 36.
183. Lemieux, M.E., Yang, X., Jardine, K., He, X., Jacobsen, K.X., Staines, W.A.,
Harper, M.E., and McBurney, M.W. 2005. The Sirt1 deacetylase modulates the
insulin-like growth factor signaling pathway in mammals. Mech Ageing Dev 126(10):
1097-1105.
184. Leon, C. and Lobe, C.G. 1997. Grg3, a murine Groucho-related gene, is expressed in
the developing nervous system and in mesenchyme-induced epithelial structures. Dev
Dyn 208(1): 11-24.
185. Levanon, D., Goldstein, R.E., Bernstein, Y., Tang, H., Goldenberg, D., Stifani, S.,
Paroush, Z., and Groner, Y. 1998. Transcriptional repression by AML1 and LEF-1 is
mediated by the TLE/Groucho corepressors. Proc Natl Acad Sci U S A 95(20): 11590-
11595.
186. Li, X., Alafuzoff, I., Soininen, H., Winblad, B., and Pei, J.J. 2005. Levels of mTOR
and its downstream targets 4E-BP1, eEF2, and eEF2 kinase in relationships with tau in
Alzheimer's disease brain. Febs J 272(16): 4211-4220.
187. Li, Y., Corradetti, M.N., Inoki, K., and Guan, K.L. 2004. TSC2: filling the GAP in the
mTOR signaling pathway. Trends Biochem Sci 29(1): 32-38.
188. Lin, K., Dorman, J.B., Rodan, A., and Kenyon, C. 1997. daf-16: An HNF-3/forkhead
family member that can function to double the life-span of Caenorhabditis elegans.
Science 278(5341): 1319-1322.

193
189. Lin, S.J., Defossez, P.A., and Guarente, L. 2000. Requirement of NAD and SIR2 for
life-span extension by calorie restriction in Saccharomyces cerevisiae. Science
289(5487): 2126-2128.
190. Lin, S.J., Ford, E., Haigis, M., Liszt, G., and Guarente, L. 2004. Calorie restriction
extends yeast life span by lowering the level of NADH. Genes Dev 18(1): 12-16.
191. Lin, S.J., Kaeberlein, M., Andalis, A.A., Sturtz, L.A., Defossez, P.A., Culotta, V.C.,
Fink, G.R., and Guarente, L. 2002. Calorie restriction extends Saccharomyces
cerevisiae lifespan by increasing respiration. Nature 418(6895): 344-348.
192. Lin, S.Y. and Elledge, S.J. 2003. Multiple tumor suppressor pathways negatively
regulate telomerase. Cell 113(7): 881-889.
193. Liszt, G., Ford, E., Kurtev, M., and Guarente, L. 2005. Mouse Sir2 homolog SIRT6 is
a nuclear ADP-ribosyltransferase. J Biol Chem 280(22): 21313-21320.
194. Lithgow, G.J. and Kirkwood, T.B. 1996. Mechanisms and evolution of aging. Science
273(5271): 80.
195. Long, X., Lin, Y., Ortiz-Vega, S., Yonezawa, K., and Avruch, J. 2005. Rheb binds and
regulates the mTOR kinase. Curr Biol 15(8): 702-713.
196. Long, X., Ortiz-Vega, S., Lin, Y., and Avruch, J. 2005. Rheb binding to mammalian
target of rapamycin (mTOR) is regulated by amino acid sufficiency. J Biol Chem
280(25): 23433-23436.
197. Lund, A.H. and van Lohuizen, M. 2002. RUNX: a trilogy of cancer genes. Cancer Cell
1(3): 213-215.
198. Luo, J., Nikolaev, A.Y., Imai, S., Chen, D., Su, F., Shiloh, A., Guarente, L., and Gu,
W. 2001. Negative control of p53 by Sir2alpha promotes cell survival under stress. Cell
107(2): 137-148.
199. Ma, L., Chen, Z., Erdjument-Bromage, H., Tempst, P., and Pandolfi, P.P. 2005.
Phosphorylation and functional inactivation of TSC2 by Erk implications for tuberous
sclerosis and cancer pathogenesis. Cell 121(2): 179-193.

194
200. Mair, W., Goymer, P., Pletcher, S.D., and Partridge, L. 2003. Demography of dietary
restriction and death in Drosophila. Science 301(5640): 1731-1733.
201. Mallo, M., Franco del Amo, F., and Gridley, T. 1993. Cloning and developmental
expression of Grg, a mouse gene related to the groucho transcript of the Drosophila
Enhancer of split complex. Mech Dev 42(1-2): 67-76.
202. Martin, D.E. and Hall, M.N. 2005. The expanding TOR signaling network. Curr Opin
Cell Biol 17(2): 158-166.
203. Martin, G.M., Austad, S.N., and Johnson, T.E. 1996. Genetic analysis of ageing: role
of oxidative damage and environmental stresses. Nat Genet 13(1): 25-34.
204. Mattison, J.A., Roth, G.S., Lane, M.A., and Ingram, D.K. 2007. Dietary restriction in
aging nonhuman primates. Interdiscip Top Gerontol 35: 137-158.
205. Maytin, E.V., Ubeda, M., Lin, J.C., and Habener, J.F. 2001. Stress-inducible
transcription factor CHOP/gadd153 induces apoptosis in mammalian cells via p38
kinase-dependent and -independent mechanisms. Exp Cell Res 267(2): 193-204.
206. McBurney, M.W., Yang, X., Jardine, K., Hixon, M., Boekelheide, K., Webb, J.R.,
Lansdorp, P.M., and Lemieux, M. 2003. The mammalian SIR2alpha protein has a role
in embryogenesis and gametogenesis. Mol Cell Biol 23(1): 38-54.
207. McCay, C.M. 1935. The effect of retarded growth upon the length of life and upon
ultimate size. J Nutr 10: 63-79.
208. McMullen, J.R., Sherwood, M.C., Tarnavski, O., Zhang, L., Dorfman, A.L., Shioi,
T., and Izumo, S. 2004. Inhibition of mTOR signaling with rapamycin regresses
established cardiac hypertrophy induced by pressure overload. Circulation 109(24):
3050-3055.
209. Meijer, A.J. and Codogno, P. 2004. Regulation and role of autophagy in mammalian
cells. Int J Biochem Cell Biol 36(12): 2445-2462.
210. Meijer, H.A. and Thomas, A.A. 2002. Control of eukaryotic protein synthesis by
upstream open reading frames in the 5'-untranslated region of an mRNA. Biochem J
367(Pt 1): 1-11.

195
211. Michishita, E., Park, J.Y., Burneskis, J.M., Barrett, J.C., and Horikawa, I. 2005.
Evolutionarily conserved and nonconserved cellular localizations and functions of human
SIRT proteins. Mol Biol Cell 16(10): 4623-4635.
212. Miyasaka, H., Choudhury, B.K., Hou, E.W., and Li, S.S. 1993. Molecular cloning and
expression of mouse and human cDNA encoding AES and ESG proteins with strong
similarity to Drosophila enhancer of split groucho protein. Eur J Biochem 216(1): 343-
352.
213. Morris, J.Z., Tissenbaum, H.A., and Ruvkun, G. 1996. A phosphatidylinositol-3-OH
kinase family member regulating longevity and diapause in Caenorhabditis elegans.
Nature 382(6591): 536-539.
214. Mostoslavsky, R., Chua, K.F., Lombard, D.B., Pang, W.W., Fischer, M.R., Gellon,
L., Liu, P., Mostoslavsky, G., Franco, S., Murphy, M.M., Mills, K.D., Patel, P., Hsu,
J.T., Hong, A.L., Ford, E., Cheng, H.L., Kennedy, C., Nunez, N., Bronson, R.,
Frendewey, D., Auerbach, W., Valenzuela, D., Karow, M., Hottiger, M.O., Hursting,
S., Barrett, J.C., Guarente, L., Mulligan, R., Demple, B., Yancopoulos, G.D., and
Alt, F.W. 2006. Genomic instability and aging-like phenotype in the absence of
mammalian SIRT6. Cell 124(2): 315-329.
215. Mostov, K.E. 2006. mTOR is out of control in polycystic kidney disease. Proc Natl Acad
Sci U S A 103(14): 5247-5248.
216. Motta, M.C., Divecha, N., Lemieux, M., Kamel, C., Chen, D., Gu, W., Bultsma, Y.,
McBurney, M., and Guarente, L. 2004. Mammalian SIRT1 represses forkhead
transcription factors. Cell 116(4): 551-563.
217. Moynihan, K.A., Grimm, A.A., Plueger, M.M., Bernal-Mizrachi, E., Ford, E., Cras-
Meneur, C., Permutt, M.A., and Imai, S. 2005. Increased dosage of mammalian Sir2 in
pancreatic beta cells enhances glucose-stimulated insulin secretion in mice. Cell Metab
2(2): 105-117.
218. Muth, V., Nadaud, S., Grummt, I., and Voit, R. 2001. Acetylation of TAF(I)68, a
subunit of TIF-IB/SL1, activates RNA polymerase I transcription. Embo J 20(6): 1353-
1362.
219. Nakae, J., Cao, Y., Daitoku, H., Fukamizu, A., Ogawa, W., Yano, Y., and Hayashi,
Y. 2006. The LXXLL motif of murine forkhead transcription factor FoxO1 mediates
Sirt1-dependent transcriptional activity. J Clin Invest 116(9): 2473-2483.

196
220. Napper, A.D., Hixon, J., McDonagh, T., Keavey, K., Pons, J.F., Barker, J., Yau,
W.T., Amouzegh, P., Flegg, A., Hamelin, E., Thomas, R.J., Kates, M., Jones, S.,
Navia, M.A., Saunders, J.O., DiStefano, P.S., and Curtis, R. 2005. Discovery of
indoles as potent and selective inhibitors of the deacetylase SIRT1. J Med Chem 48(25):
8045-8054.
221. Nayagam, V.M., Wang, X., Tan, Y.C., Poulsen, A., Goh, K.C., Ng, T., Wang, H.,
Song, H.Y., Ni, B., Entzeroth, M., and Stunkel, W. 2006. SIRT1 modulating
compounds from high-throughput screening as anti-inflammatory and insulin-sensitizing
agents. J Biomol Screen 11(8): 959-967.
222. Nishizuka, S., Charboneau, L., Young, L., Major, S., Reinhold, W.C., Waltham, M.,
Kouros-Mehr, H., Bussey, K.J., Lee, J.K., Espina, V., Munson, P.J., Petricoin, E.,
3rd, Liotta, L.A., and Weinstein, J.N. 2003. Proteomic profiling of the NCI-60 cancer
cell lines using new high-density reverse-phase lysate microarrays. Proc Natl Acad Sci U
S A 100(24): 14229-14234.
223. Nobukuni, T., Joaquin, M., Roccio, M., Dann, S.G., Kim, S.Y., Gulati, P., Byfield,
M.P., Backer, J.M., Natt, F., Bos, J.L., Zwartkruis, F.J., and Thomas, G. 2005.
Amino acids mediate mTOR/raptor signaling through activation of class 3
phosphatidylinositol 3OH-kinase. Proc Natl Acad Sci U S A 102(40): 14238-14243.
224. North, B.J., Marshall, B.L., Borra, M.T., Denu, J.M., and Verdin, E. 2003. The
human Sir2 ortholog, SIRT2, is an NAD+-dependent tubulin deacetylase. Mol Cell 11(2):
437-444.
225. Novoa, I., Zeng, H., Harding, H.P., and Ron, D. 2001. Feedback inhibition of the
unfolded protein response by GADD34-mediated dephosphorylation of eIF2alpha. J Cell
Biol 153(5): 1011-1022.
226. Nusbaum, T.J. and Rose, M.R. 1999. The effects of nutritional manipulation and
laboratory selection on lifespan in Drosophila melanogaster. J Gerontol A Biol Sci Med
Sci 54(5): B192-198.
227. Nuthall, H.N., Husain, J., McLarren, K.W., and Stifani, S. 2002. Role for Hes1-
induced phosphorylation in Groucho-mediated transcriptional repression. Mol Cell Biol
22(2): 389-399.
228. Ogg, S., Paradis, S., Gottlieb, S., Patterson, G.I., Lee, L., Tissenbaum, H.A., and
Ruvkun, G. 1997. The Fork head transcription factor DAF-16 transduces insulin-like
metabolic and longevity signals in C. elegans. Nature 389(6654): 994-999.

197
229. Ohsawa, S. and Miura, M. 2006. Caspase-mediated changes in Sir2alpha during
apoptosis. FEBS Lett 580(25): 5875-5879.
230. Oldham, S. and Hafen, E. 2003. Insulin/IGF and target of rapamycin signaling: a TOR
de force in growth control. Trends Cell Biol 13(2): 79-85.
231. Ota, H., Akishita, M., Eto, M., Iijima, K., Kaneki, M., and Ouchi, Y. 2007. Sirt1
modulates premature senescence-like phenotype in human endothelial cells. J Mol Cell
Cardiol.
232. Ota, H., Tokunaga, E., Chang, K., Hikasa, M., Iijima, K., Eto, M., Kozaki, K.,
Akishita, M., Ouchi, Y., and Kaneki, M. 2006. Sirt1 inhibitor, Sirtinol, induces
senescence-like growth arrest with attenuated Ras-MAPK signaling in human cancer
cells. Oncogene 25(2): 176-185.
233. Pagans, S., Pedal, A., North, B.J., Kaehlcke, K., Marshall, B.L., Dorr, A., Hetzer-
Egger, C., Henklein, P., Frye, R., McBurney, M.W., Hruby, H., Jung, M., Verdin,
E., and Ott, M. 2005. SIRT1 regulates HIV transcription via Tat deacetylation. PLoS
Biol 3(2): e41.
234. Pahl, H.L. 1999. Activators and target genes of Rel/NF-kappaB transcription factors.
Oncogene 18(49): 6853-6866.
235. Palaparti, A., Baratz, A., and Stifani, S. 1997. The Groucho/transducin-like enhancer
of split transcriptional repressors interact with the genetically defined amino-terminal
silencing domain of histone H3. J Biol Chem 272(42): 26604-26610.
236. Parker, J.A., Arango, M., Abderrahmane, S., Lambert, E., Tourette, C., Catoire, H.,
and Neri, C. 2005. Resveratrol rescues mutant polyglutamine cytotoxicity in nematode
and mammalian neurons. Nat Genet 37(4): 349-350.
237. Paroush, Z., Finley, R.L., Jr., Kidd, T., Wainwright, S.M., Ingham, P.W., Brent, R.,
and Ish-Horowicz, D. 1994. Groucho is required for Drosophila neurogenesis,
segmentation, and sex determination and interacts directly with hairy-related bHLH
proteins. Cell 79(5): 805-815.
238. Partridge, L. and Gems, D. 2002. Mechanisms of ageing: public or private? Nat Rev
Genet 3(3): 165-175.

198
239. Pende, M., Um, S.H., Mieulet, V., Sticker, M., Goss, V.L., Mestan, J., Mueller, M.,
Fumagalli, S., Kozma, S.C., and Thomas, G. 2004. S6K1(-/-)/S6K2(-/-) mice exhibit
perinatal lethality and rapamycin-sensitive 5'-terminal oligopyrimidine mRNA translation
and reveal a mitogen-activated protein kinase-dependent S6 kinase pathway. Mol Cell
Biol 24(8): 3112-3124.
240. Pesole, G., Liuni, S., Grillo, G., and Saccone, C. 1997. Structural and compositional
features of untranslated regions of eukaryotic mRNAs. Gene 205(1-2): 95-102.
241. Picard, F., Kurtev, M., Chung, N., Topark-Ngarm, A., Senawong, T., Machado De
Oliveira, R., Leid, M., McBurney, M.W., and Guarente, L. 2004. Sirt1 promotes fat
mobilization in white adipocytes by repressing PPAR-gamma. Nature 429(6993): 771-
776.
242. Pillai, J.B., Isbatan, A., Imai, S., and Gupta, M.P. 2005. Poly(ADP-ribose)
polymerase-1-dependent cardiac myocyte cell death during heart failure is mediated by
NAD+ depletion and reduced Sir2alpha deacetylase activity. J Biol Chem 280(52):
43121-43130.
243. Porcu, M. and Chiarugi, A. 2005. The emerging therapeutic potential of sirtuin-
interacting drugs: from cell death to lifespan extension. Trends Pharmacol Sci 26(2): 94-
103.
244. Potter, C.J., Huang, H., and Xu, T. 2001. Drosophila Tsc1 functions with Tsc2 to
antagonize insulin signaling in regulating cell growth, cell proliferation, and organ size.
Cell 105(3): 357-368.
245. Potter, C.J. and Xu, T. 2001. Mechanisms of size control. Curr Opin Genet Dev 11(3):
279-286.
246. Pruitt, K., Zinn, R.L., Ohm, J.E., McGarvey, K.M., Kang, S.H., Watkins, D.N.,
Herman, J.G., and Baylin, S.B. 2006. Inhibition of SIRT1 reactivates silenced cancer
genes without loss of promoter DNA hypermethylation. PLoS Genet 2(3): e40.
247. Qiao, L. and Shao, J. 2006. SIRT1 regulates adiponectin gene expression through
Foxo1-C/enhancer-binding protein alpha transcriptional complex. J Biol Chem 281(52):
39915-39924.
248. Qin, W., Yang, T., Ho, L., Zhao, Z., Wang, J., Chen, L., Zhao, W., Thiyagarajan,
M., MacGrogan, D., Rodgers, J.T., Puigserver, P., Sadoshima, J., Deng, H., Pedrini,

199
S., Gandy, S., Sauve, A.A., and Pasinetti, G.M. 2006. Neuronal SIRT1 activation as a
novel mechanism underlying the prevention of Alzheimer disease amyloid
neuropathology by calorie restriction. J Biol Chem 281(31): 21745-21754.
249. Rajasekhar, V.K. and Holland, E.C. 2004. Postgenomic global analysis of translational
control induced by oncogenic signaling. Oncogene 23(18): 3248-3264.
250. Ravikumar, B., Vacher, C., Berger, Z., Davies, J.E., Luo, S., Oroz, L.G., Scaravilli,
F., Easton, D.F., Duden, R., O'Kane, C.J., and Rubinsztein, D.C. 2004. Inhibition of
mTOR induces autophagy and reduces toxicity of polyglutamine expansions in fly and
mouse models of Huntington disease. Nat Genet 36(6): 585-595.
251. Redd, M.J., Arnaud, M.B., and Johnson, A.D. 1997. A complex composed of tup1 and
ssn6 represses transcription in vitro. J Biol Chem 272(17): 11193-11197.
252. Reiling, J.H. and Hafen, E. 2004. The hypoxia-induced paralogs Scylla and Charybdis
inhibit growth by down-regulating S6K activity upstream of TSC in Drosophila. Genes
Dev 18(23): 2879-2892.
253. Revollo, J.R., Grimm, A.A., and Imai, S. 2004. The NAD biosynthesis pathway
mediated by nicotinamide phosphoribosyltransferase regulates Sir2 activity in
mammalian cells. J Biol Chem 279(49): 50754-50763.
254. Riddle, D.L., Swanson, M.M., and Albert, P.S. 1981. Interacting genes in nematode
dauer larva formation. Nature 290(5808): 668-671.
255. Rodgers, J.T., Lerin, C., Haas, W., Gygi, S.P., Spiegelman, B.M., and Puigserver, P.
2005. Nutrient control of glucose homeostasis through a complex of PGC-1alpha and
SIRT1. Nature 434(7029): 113-118.
256. Rogina, B. and Helfand, S.L. 2004. Sir2 mediates longevity in the fly through a
pathway related to calorie restriction. Proc Natl Acad Sci U S A 101(45): 15998-16003.
257. Rogina, B., Helfand, S.L., and Frankel, S. 2002. Longevity regulation by Drosophila
Rpd3 deacetylase and caloric restriction. Science 298(5599): 1745.
258. Rosner, M., Hofer, K., Kubista, M., and Hengstschlager, M. 2003. Cell size regulation
by the human TSC tumor suppressor proteins depends on PI3K and FKBP38. Oncogene
22(31): 4786-4798.

200
259. Roux, P.P., Ballif, B.A., Anjum, R., Gygi, S.P., and Blenis, J. 2004. Tumor-promoting
phorbol esters and activated Ras inactivate the tuberous sclerosis tumor suppressor
complex via p90 ribosomal S6 kinase. Proc Natl Acad Sci U S A 101(37): 13489-13494.
260. Rudra, D. and Warner, J.R. 2004. What better measure than ribosome synthesis?
Genes Dev 18(20): 2431-2436.
261. Ruvinsky, I., Sharon, N., Lerer, T., Cohen, H., Stolovich-Rain, M., Nir, T., Dor, Y.,
Zisman, P., and Meyuhas, O. 2005. Ribosomal protein S6 phosphorylation is a
determinant of cell size and glucose homeostasis. Genes Dev 19(18): 2199-2211.
262. Sakamoto, J., Miura, T., Shimamoto, K., and Horio, Y. 2004. Predominant expression
of Sir2alpha, an NAD-dependent histone deacetylase, in the embryonic mouse heart and
brain. FEBS Lett 556(1-3): 281-286.
263. Sarbassov, D.D., Ali, S.M., Kim, D.H., Guertin, D.A., Latek, R.R., Erdjument-
Bromage, H., Tempst, P., and Sabatini, D.M. 2004. Rictor, a novel binding partner of
mTOR, defines a rapamycin-insensitive and raptor-independent pathway that regulates
the cytoskeleton. Curr Biol 14(14): 1296-1302.
264. Sarbassov, D.D. and Sabatini, D.M. 2005. Redox regulation of the nutrient-sensitive
raptor-mTOR pathway and complex. J Biol Chem 280(47): 39505-39509.
265. Sasaki, T., Maier, B., Bartke, A., and Scrable, H. 2006. Progressive loss of SIRT1
with cell cycle withdrawal. Aging Cell 5(5): 413-422.
266. Sauve, A.A. and Schramm, V.L. 2003. Sir2 regulation by nicotinamide results from
switching between base exchange and deacetylation chemistry. Biochemistry 42(31):
9249-9256.
267. Schalm, S.S. and Blenis, J. 2002. Identification of a conserved motif required for mTOR
signaling. Curr Biol 12(8): 632-639.
268. Schmelzle, T. and Hall, M.N. 2000. TOR, a central controller of cell growth. Cell
103(2): 253-262.
269. Schwer, B., Bunkenborg, J., Verdin, R.O., Andersen, J.S., and Verdin, E. 2006.
Reversible lysine acetylation controls the activity of the mitochondrial enzyme acetyl-
CoA synthetase 2. Proc Natl Acad Sci U S A 103(27): 10224-10229.

201
270. Senawong, T., Peterson, V.J., Avram, D., Shepherd, D.M., Frye, R.A., Minucci, S.,
and Leid, M. 2003. Involvement of the histone deacetylase SIRT1 in chicken ovalbumin
upstream promoter transcription factor (COUP-TF)-interacting protein 2-mediated
transcriptional repression. J Biol Chem 278(44): 43041-43050.
271. Senawong, T., Peterson, V.J., and Leid, M. 2005. BCL11A-dependent recruitment of
SIRT1 to a promoter template in mammalian cells results in histone deacetylation and
transcriptional repression. Arch Biochem Biophys 434(2): 316-325.
272. Shah, O.J., Wang, Z., and Hunter, T. 2004. Inappropriate activation of the
TSC/Rheb/mTOR/S6K cassette induces IRS1/2 depletion, insulin resistance, and cell
survival deficiencies. Curr Biol 14(18): 1650-1656.
273. Shi, T., Wang, F., Stieren, E., and Tong, Q. 2005. SIRT3, a mitochondrial sirtuin
deacetylase, regulates mitochondrial function and thermogenesis in brown adipocytes. J
Biol Chem 280(14): 13560-13567.
274. Shillingford, J.M., Murcia, N.S., Larson, C.H., Low, S.H., Hedgepeth, R., Brown, N.,
Flask, C.A., Novick, A.C., Goldfarb, D.A., Kramer-Zucker, A., Walz, G., Piontek,
K.B., Germino, G.G., and Weimbs, T. 2006. The mTOR pathway is regulated by
polycystin-1, and its inhibition reverses renal cystogenesis in polycystic kidney disease.
Proc Natl Acad Sci U S A 103(14): 5466-5471.
275. Shimokawa, I., Higami, Y., Tsuchiya, T., Otani, H., Komatsu, T., Chiba, T., and
Yamaza, H. 2003. Life span extension by reduction of the growth hormone-insulin-like
growth factor-1 axis: relation to caloric restriction. Faseb J 17(9): 1108-1109.
276. Shore, D., Squire, M., and Nasmyth, K.A. 1984. Characterization of two genes required
for the position-effect control of yeast mating-type genes. Embo J 3(12): 2817-2823.
277. Sinclair, D.A. 2002. Paradigms and pitfalls of yeast longevity research. Mech Ageing
Dev 123(8): 857-867.
278. Sinclair, D.A. and Guarente, L. 1997. Extrachromosomal rDNA circles--a cause of
aging in yeast. Cell 91(7): 1033-1042.
279. Smith, E.M., Finn, S.G., Tee, A.R., Browne, G.J., and Proud, C.G. 2005. The
tuberous sclerosis protein TSC2 is not required for the regulation of the mammalian
target of rapamycin by amino acids and certain cellular stresses. J Biol Chem 280(19):
18717-18727.

202
280. Smith, J.S., Brachmann, C.B., Celic, I., Kenna, M.A., Muhammad, S., Starai, V.J.,
Avalos, J.L., Escalante-Semerena, J.C., Grubmeyer, C., Wolberger, C., and Boeke,
J.D. 2000. A phylogenetically conserved NAD+-dependent protein deacetylase activity
in the Sir2 protein family. Proc Natl Acad Sci U S A 97(12): 6658-6663.
281. Sohal, R.S. and Weindruch, R. 1996. Oxidative stress, caloric restriction, and aging.
Science 273(5271): 59-63.
282. Solomon, J.M., Pasupuleti, R., Xu, L., McDonagh, T., Curtis, R., DiStefano, P.S.,
and Huber, L.J. 2006. Inhibition of SIRT1 catalytic activity increases p53 acetylation
but does not alter cell survival following DNA damage. Mol Cell Biol 26(1): 28-38.
283. Sommer, M., Poliak, N., Upadhyay, S., Ratovitski, E., Nelkin, B.D., Donehower,
L.A., and Sidransky, D. 2006. DeltaNp63alpha overexpression induces downregulation
of Sirt1 and an accelerated aging phenotype in the mouse. Cell Cycle 5(17): 2005-2011.
284. St-Pierre, J., Drori, S., Uldry, M., Silvaggi, J.M., Rhee, J., Jager, S., Handschin, C.,
Zheng, K., Lin, J., Yang, W., Simon, D.K., Bachoo, R., and Spiegelman, B.M. 2006.
Suppression of reactive oxygen species and neurodegeneration by the PGC-1
transcriptional coactivators. Cell 127(2): 397-408.
285. Stifani, S., Blaumueller, C.M., Redhead, N.J., Hill, R.E., and Artavanis-Tsakonas, S.
1992. Human homologs of a Drosophila Enhancer of split gene product define a novel
family of nuclear proteins. Nat Genet 2(2): 119-127.
286. Sun, C., Zhang, F., Ge, X., Yan, T., Chen, X., Shi, X., and Zhai, Q. 2007. SIRT1
Improves Insulin Sensitivity under Insulin-Resistant Conditions by Repressing PTP1B.
Cell Metab 6(4): 307-319.
287. Swingler, T.E., Bess, K.L., Yao, J., Stifani, S., and Jayaraman, P.S. 2004. The
proline-rich homeodomain protein recruits members of the Groucho/Transducin-like
enhancer of split protein family to co-repress transcription in hematopoietic cells. J Biol
Chem 279(33): 34938-34947.
288. Takata, T. and Ishikawa, F. 2003. Human Sir2-related protein SIRT1 associates with
the bHLH repressors HES1 and HEY2 and is involved in HES1- and HEY2-mediated
transcriptional repression. Biochem Biophys Res Commun 301(1): 250-257.

203
289. Tanno, M., Sakamoto, J., Miura, T., Shimamoto, K., and Horio, Y. 2007.
Nucleocytoplasmic shuttling of the NAD+-dependent histone deacetylase SIRT1. J Biol
Chem 282(9): 6823-6832.
290. Tanny, J.C., Dowd, G.J., Huang, J., Hilz, H., and Moazed, D. 1999. An enzymatic
activity in the yeast Sir2 protein that is essential for gene silencing. Cell 99(7): 735-745.
291. Tatar, M., Bartke, A., and Antebi, A. 2003. The endocrine regulation of aging by
insulin-like signals. Science 299(5611): 1346-1351.
292. Tee, A.R. and Blenis, J. 2005. mTOR, translational control and human disease. Semin
Cell Dev Biol 16(1): 29-37.
293. Tetsuka, T., Uranishi, H., Imai, H., Ono, T., Sonta, S., Takahashi, N., Asamitsu, K.,
and Okamoto, T. 2000. Inhibition of nuclear factor-kappaB-mediated transcription by
association with the amino-terminal enhancer of split, a Groucho-related protein lacking
WD40 repeats. J Biol Chem 275(6): 4383-4390.
294. Tissenbaum, H.A. and Guarente, L. 2001. Increased dosage of a sir-2 gene extends
lifespan in Caenorhabditis elegans. Nature 410(6825): 227-230.
295. Tolkunova, E.N., Fujioka, M., Kobayashi, M., Deka, D., and Jaynes, J.B. 1998. Two
distinct types of repression domain in engrailed: one interacts with the groucho
corepressor and is preferentially active on integrated target genes. Mol Cell Biol 18(5):
2804-2814.
296. Treins, C., Giorgetti-Peraldi, S., Murdaca, J., Semenza, G.L., and Van Obberghen,
E. 2002. Insulin stimulates hypoxia-inducible factor 1 through a phosphatidylinositol 3-
kinase/target of rapamycin-dependent signaling pathway. J Biol Chem 277(31): 27975-
27981.
297. Um, S.H., Frigerio, F., Watanabe, M., Picard, F., Joaquin, M., Sticker, M.,
Fumagalli, S., Allegrini, P.R., Kozma, S.C., Auwerx, J., and Thomas, G. 2004.
Absence of S6K1 protects against age- and diet-induced obesity while enhancing insulin
sensitivity. Nature 431(7005): 200-205.
298. van der Horst, A., Tertoolen, L.G., de Vries-Smits, L.M., Frye, R.A., Medema, R.H.,
and Burgering, B.M. 2004. FOXO4 is acetylated upon peroxide stress and deacetylated
by the longevity protein hSir2(SIRT1). J Biol Chem 279(28): 28873-28879.

204
299. Vaquero, A., Scher, M., Lee, D., Erdjument-Bromage, H., Tempst, P., and Reinberg,
D. 2004. Human SirT1 interacts with histone H1 and promotes formation of facultative
heterochromatin. Mol Cell 16(1): 93-105.
300. Varanasi, U.S., Klis, M., Mikesell, P.B., and Trumbly, R.J. 1996. The Cyc8 (Ssn6)-
Tup1 corepressor complex is composed of one Cyc8 and four Tup1 subunits. Mol Cell
Biol 16(12): 6707-6714.
301. Vattem, K.M. and Wek, R.C. 2004. Reinitiation involving upstream ORFs regulates
ATF4 mRNA translation in mammalian cells. Proc Natl Acad Sci U S A 101(31): 11269-
11274.
302. Vaziri, H., Dessain, S.K., Ng Eaton, E., Imai, S.I., Frye, R.A., Pandita, T.K.,
Guarente, L., and Weinberg, R.A. 2001. hSIR2(SIRT1) functions as an NAD-
dependent p53 deacetylase. Cell 107(2): 149-159.
303. Vellai, T., Takacs-Vellai, K., Zhang, Y., Kovacs, A.L., Orosz, L., and Muller, F.
2003. Genetics: influence of TOR kinase on lifespan in C. elegans. Nature 426(6967):
620.
304. Vowels, J.J. and Thomas, J.H. 1992. Genetic analysis of chemosensory control of dauer
formation in Caenorhabditis elegans. Genetics 130(1): 105-123.
305. Wang, C., Chen, L., Hou, X., Li, Z., Kabra, N., Ma, Y., Nemoto, S., Finkel, T., Gu,
W., Cress, W.D., and Chen, J. 2006. Interactions between E2F1 and SirT1 regulate
apoptotic response to DNA damage. Nat Cell Biol 8(9): 1025-1031.
306. Wang, X., Li, W., Williams, M., Terada, N., Alessi, D.R., and Proud, C.G. 2001.
Regulation of elongation factor 2 kinase by p90(RSK1) and p70 S6 kinase. Embo J
20(16): 4370-4379.
307. Wang, Y., Oh, S.W., Deplancke, B., Luo, J., Walhout, A.J., and Tissenbaum, H.A.
2006. C. elegans 14-3-3 proteins regulate life span and interact with SIR-2.1 and DAF-
16/FOXO. Mech Ageing Dev 127(9): 741-747.
308. Wang, Y. and Tissenbaum, H.A. 2006. Overlapping and distinct functions for a
Caenorhabditis elegans SIR2 and DAF-16/FOXO. Mech Ageing Dev 127(1): 48-56.
205
309. Warner, J.R. 1999. The economics of ribosome biosynthesis in yeast. Trends Biochem
Sci 24(11): 437-440.
310. Weindruch, R. and Walford, R.L. 1982. Dietary restriction in mice beginning at 1 year
of age: effect on life-span and spontaneous cancer incidence. Science 215(4538): 1415-
1418.
311. Weindruch, R., Walford, R.L., Fligiel, S., and Guthrie, D. 1986. The retardation of
aging in mice by dietary restriction: longevity, cancer, immunity and lifetime energy
intake. J Nutr 116(4): 641-654.
312. Weng, A.P., Ferrando, A.A., Lee, W., Morris, J.P.t., Silverman, L.B., Sanchez-
Irizarry, C., Blacklow, S.C., Look, A.T., and Aster, J.C. 2004. Activating mutations of
NOTCH1 in human T cell acute lymphoblastic leukemia. Science 306(5694): 269-271.
313. Wood, J.G., Rogina, B., Lavu, S., Howitz, K., Helfand, S.L., Tatar, M., and Sinclair,
D. 2004. Sirtuin activators mimic caloric restriction and delay ageing in metazoans.
Nature 430(7000): 686-689.
314. Yang, S.R., Wright, J., Bauter, M., Seweryniak, K., Kode, A., and Rahman, I. 2007.
Sirtuin regulates cigarette smoke-induced proinflammatory mediator release via
RelA/p65 NF-kappaB in macrophages in vitro and in rat lungs in vivo: implications for
chronic inflammation and aging. Am J Physiol Lung Cell Mol Physiol 292(2): L567-576.
315. Yang, T., Fu, M., Pestell, R., and Sauve, A.A. 2006. SIRT1 and endocrine signaling.
Trends Endocrinol Metab 17(5): 186-191.
316. Yang, Y., Hou, H., Haller, E.M., Nicosia, S.V., and Bai, W. 2005. Suppression of
FOXO1 activity by FHL2 through SIRT1-mediated deacetylation. Embo J 24(5): 1021-
1032.
317. Yang, Y.P., Liang, Z.Q., Gu, Z.L., and Qin, Z.H. 2005. Molecular mechanism and
regulation of autophagy. Acta Pharmacol Sin 26(12): 1421-1434.
318. Yao, J., Lai, E., and Stifani, S. 2001. The winged-helix protein brain factor 1 interacts
with groucho and hes proteins to repress transcription. Mol Cell Biol 21(6): 1962-1972.
319. Yao, J., Liu, Y., Lo, R., Tretjakoff, I., Peterson, A., and Stifani, S. 2000. Disrupted
development of the cerebral hemispheres in transgenic mice expressing the mammalian

206
Groucho homologue transducin-like-enhancer of split 1 in postmitotic neurons. Mech
Dev 93(1-2): 105-115.
320. Yeung, F., Hoberg, J.E., Ramsey, C.S., Keller, M.D., Jones, D.R., Frye, R.A., and
Mayo, M.W. 2004. Modulation of NF-kappaB-dependent transcription and cell survival
by the SIRT1 deacetylase. Embo J 23(12): 2369-2380.
321. Young, D.A. and Nickerson-Nutter, C.L. 2005. mTOR--beyond transplantation. Curr
Opin Pharmacol 5(4): 418-423.
322. Yu, T.T., McIntyre, J.C., Bose, S.C., Hardin, D., Owen, M.C., and McClintock, T.S.
2005. Differentially expressed transcripts from phenotypically identified olfactory
sensory neurons. J Comp Neurol 483(3): 251-262.
323. Zabolotny, J.M. and Kim, Y.B. 2007. Silencing Insulin Resistance through SIRT1. Cell
Metab 6(4): 247-249.
324. Zhang, H., Cicchetti, G., Onda, H., Koon, H.B., Asrican, K., Bajraszewski, N.,
Vazquez, F., Carpenter, C.L., and Kwiatkowski, D.J. 2003. Loss of Tsc1/Tsc2
activates mTOR and disrupts PI3K-Akt signaling through downregulation of PDGFR. J
Clin Invest 112(8): 1223-1233.
325. Zhang, J. 2006. Resveratrol inhibits insulin responses in a SirT1-independent pathway.
Biochem J 397(3): 519-527.
326. -. 2007. The direct involvement of SirT1 in insulin-induced insulin receptor substrate-2
tyrosine phosphorylation. J Biol Chem 282(47): 34356-34364.
327. Zhao, X., Sternsdorf, T., Bolger, T.A., Evans, R.M., and Yao, T.P. 2005. Regulation
of MEF2 by histone deacetylase 4- and SIRT1 deacetylase-mediated lysine
modifications. Mol Cell Biol 25(19): 8456-8464.