Embed Size (px)
Citation preview

Yong Cao, Jyh-Hone Wang
Department of Industrial and Manufacturing EngineeringUniversity of Rhode Island, Kingston, RI
A Driving Simulation Based Study on the Effects of
Road Marking Luminance Contrast on Driving Safety
Sponsored by Rhode Island Department of Transportation

Outlines
IntroductionMethodologyResults and AnalysisConclusion

Introduction
Road markings serve to regulate, guide, and channelize traffic and supplement other traffic-control devices.Drivers rely more on retroreflective road marking during nighttime than daytime.

Introduction- Road Marking Colors and Configurations
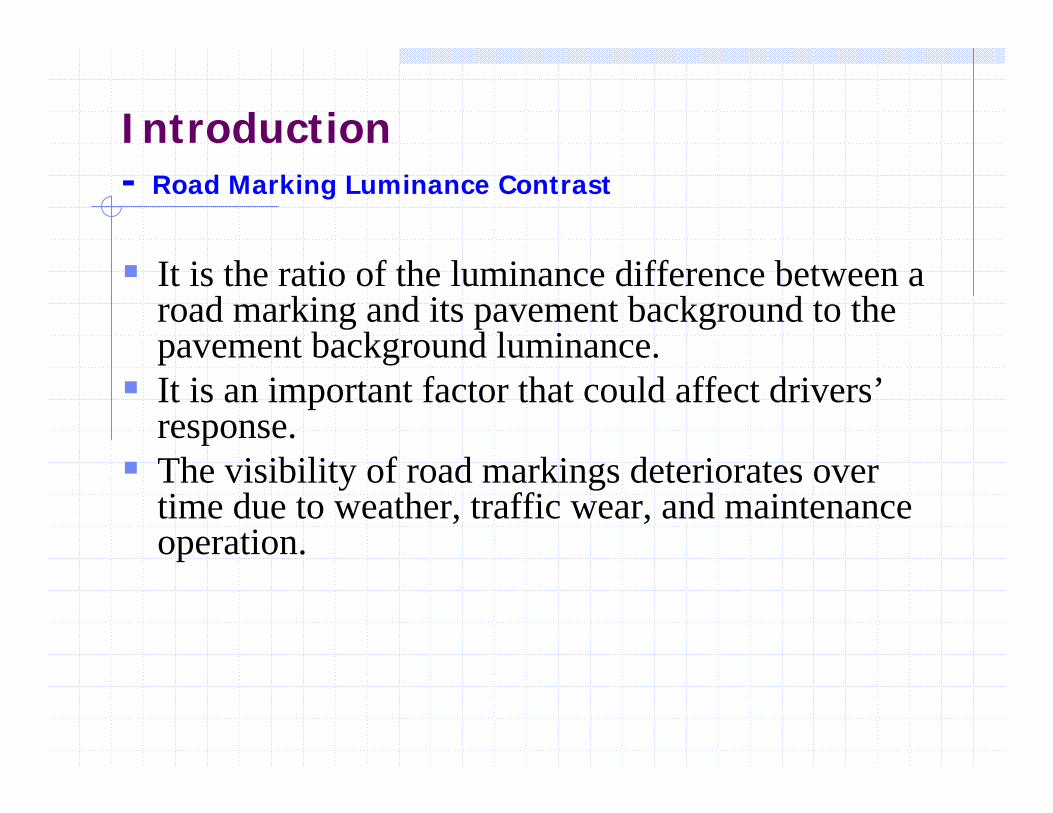
It is the ratio of the luminance difference between a road marking and its pavement background to the pavement background luminance.It is an important factor that could affect drivers’ response.The visibility of road markings deteriorates over time due to weather, traffic wear, and maintenance operation.
Introduction- Road Marking Luminance Contrast

Introduction- Objectives
Investigate the effects of luminance contrast of road marking on drivers’ responses.Investigate the demographic impact on drivers’responses.Recommend the timing of repair or repaint on road markings based on its luminance contrast condition.

Methodology- Experiment Design
The factors and levels in the experiment

The subjects
36 subjects were recruited.Gender - 18 males, 18 females. Age - 12 in 20~40 yrs. age group,
12 in 41~60 yrs. age group, & 12 in > 60 yrs. Age group.
All had driving experience on interstate highways and were currently holding valid RI driver’s licenses.
Methodology- Experiment Design

The statistical model
T = µ + C + S + C×S + A + G + A×G + ε
where:
T – subjects’ response time in second;µ – overall mean, in second;C – road marking luminance contrast;S – driving speed, in mph;A – subjects’ age;G – subjects’ gender;ε – error.
Methodology- Experiment Design
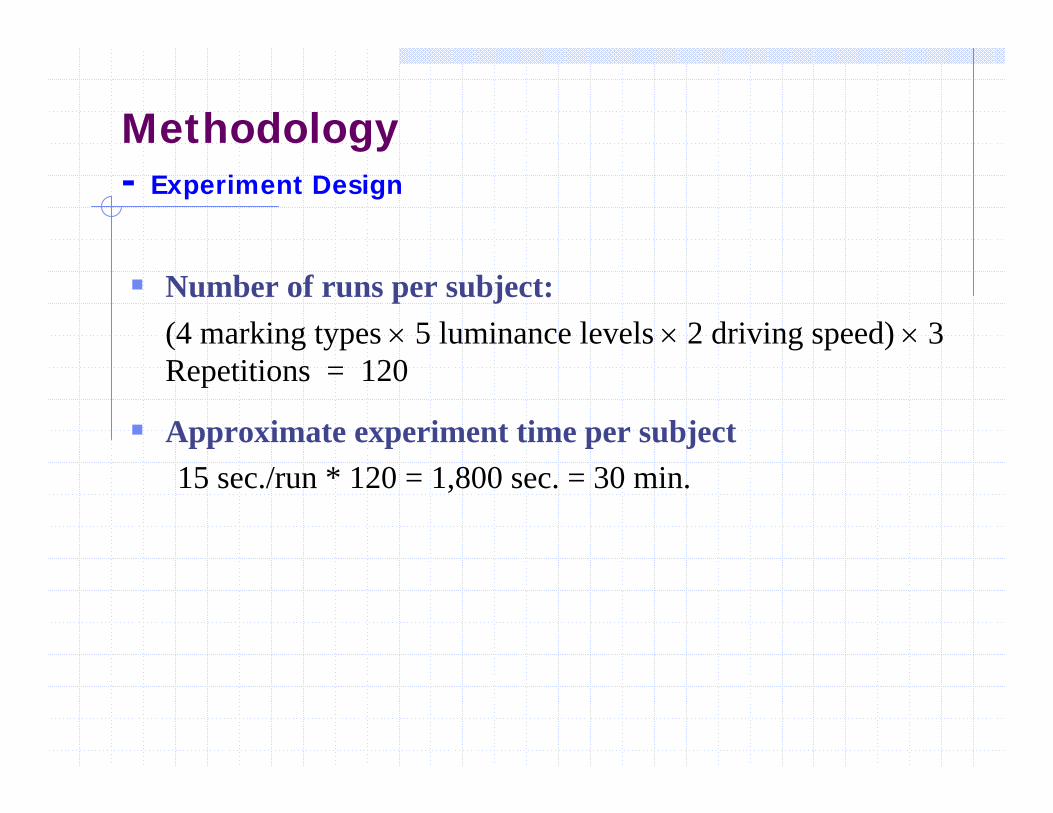
Number of runs per subject:(4 marking types × 5 luminance levels × 2 driving speed) × 3 Repetitions = 120
Approximate experiment time per subject15 sec./run * 120 = 1,800 sec. = 30 min.
Methodology- Experiment Design
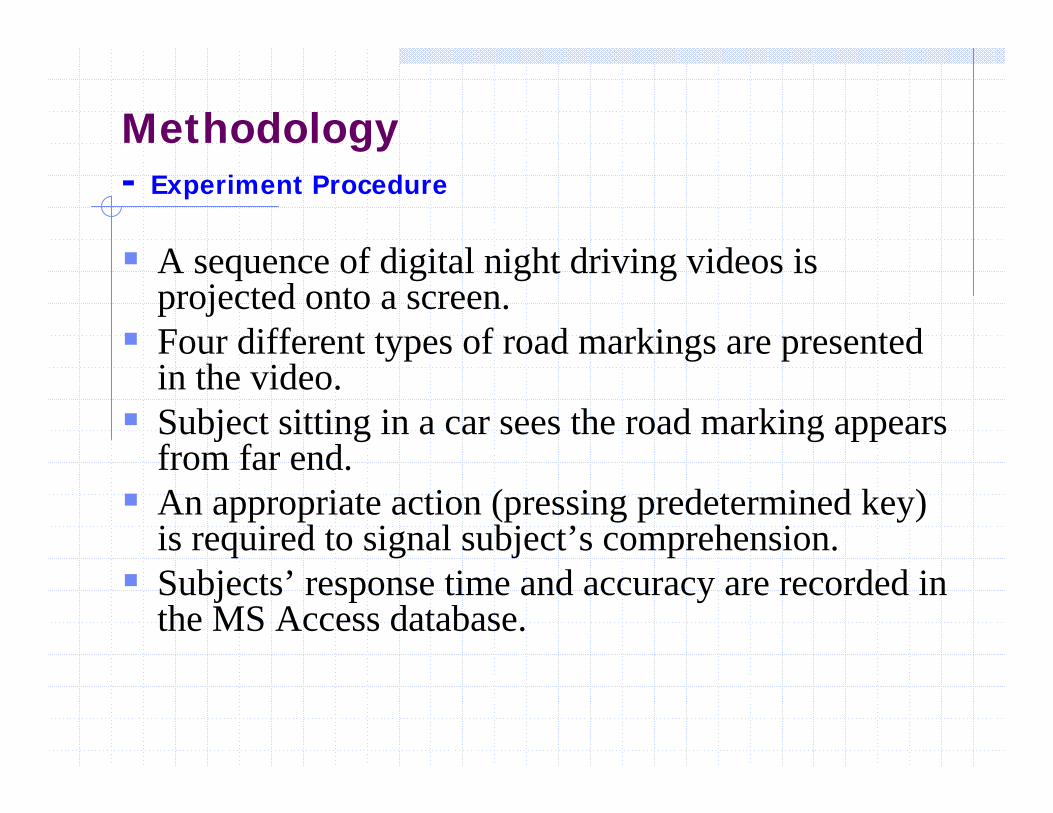
A sequence of digital night driving videos is projected onto a screen.Four different types of road markings are presented in the video.Subject sitting in a car sees the road marking appears from far end.An appropriate action (pressing predetermined key) is required to signal subject’s comprehension.Subjects’ response time and accuracy are recorded in the MS Access database.
Methodology- Experiment Procedure
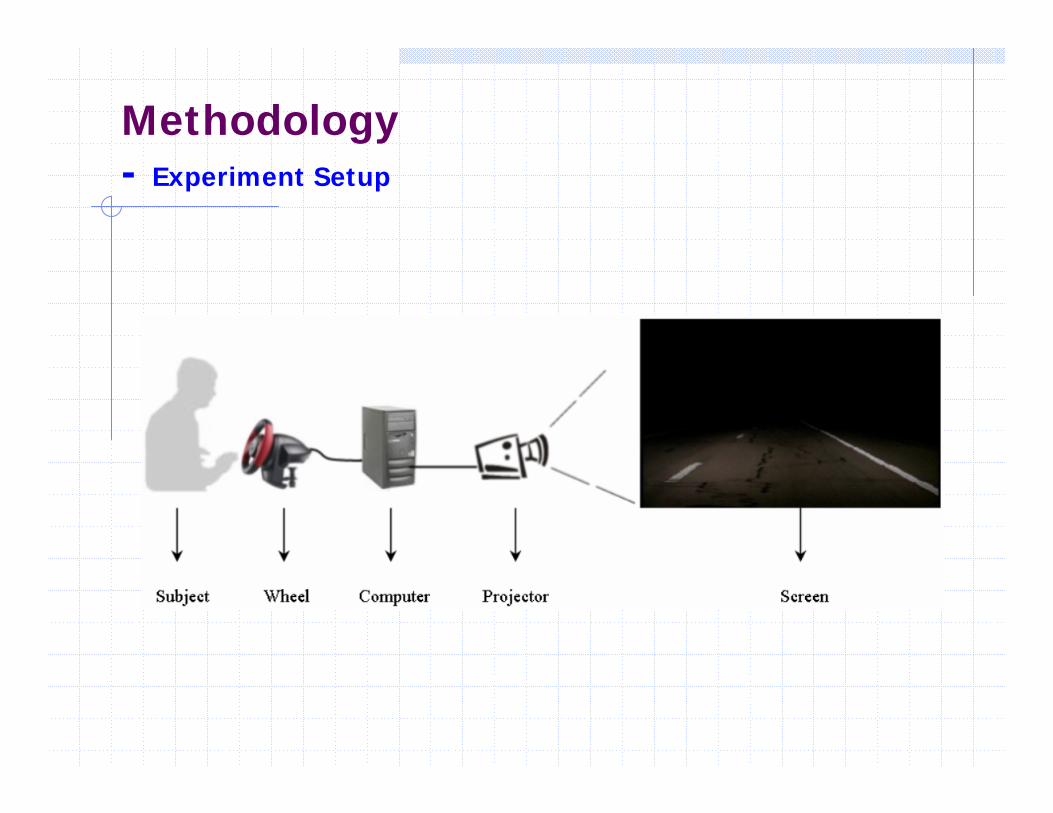
Methodology- Experiment Setup

Methodology- Video Stimuli
Four marking configurations used in the experiment
White single White single Yellow skip & Yellow doubleskip line solid line solid lines solid lines
Methodology- Video Stimuli
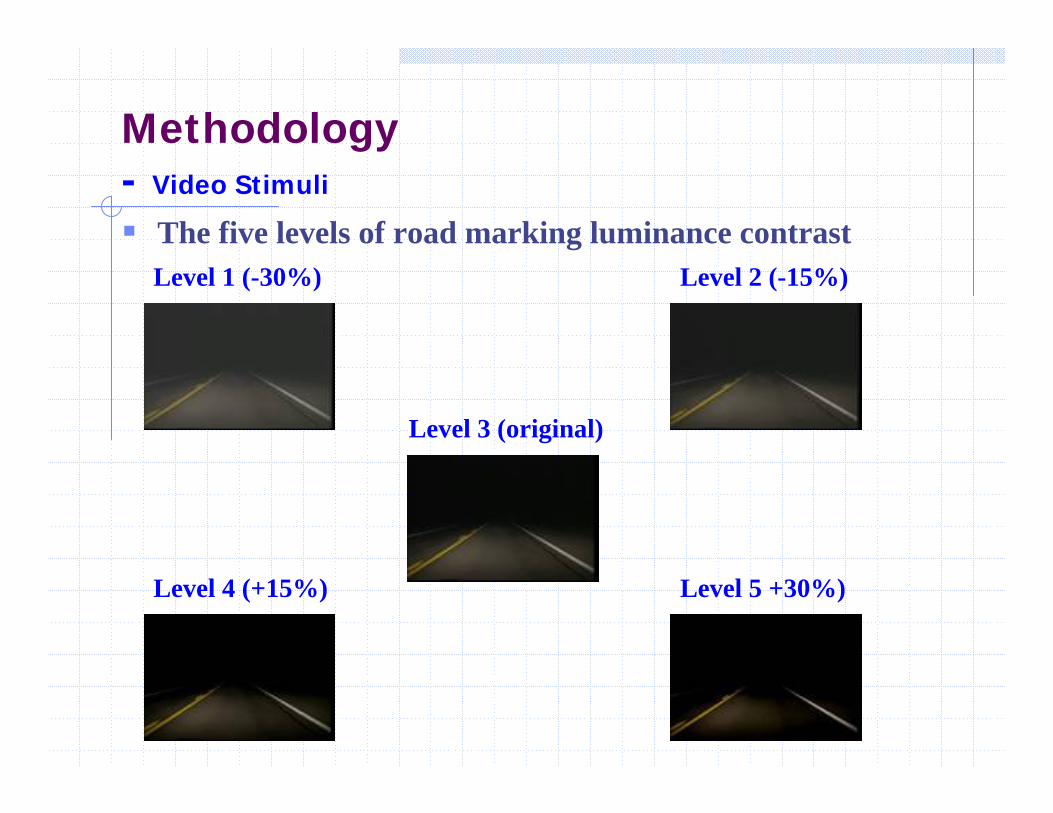
The five levels of road marking luminance contrast
Level 3 (original)
Level 2 (-15%)Level 1 (-30%)
Level 4 (+15%) Level 5 +30%)
Methodology- Video Stimuli
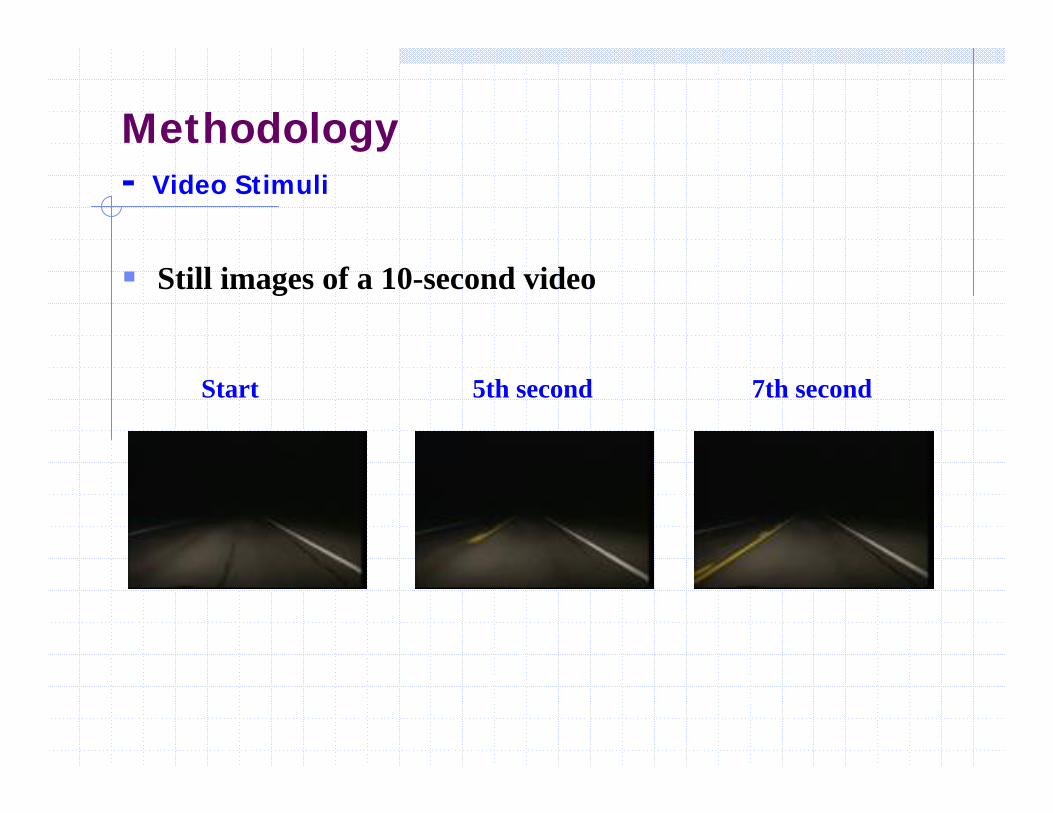
Still images of a 10-second video
Start 5th second 7th second
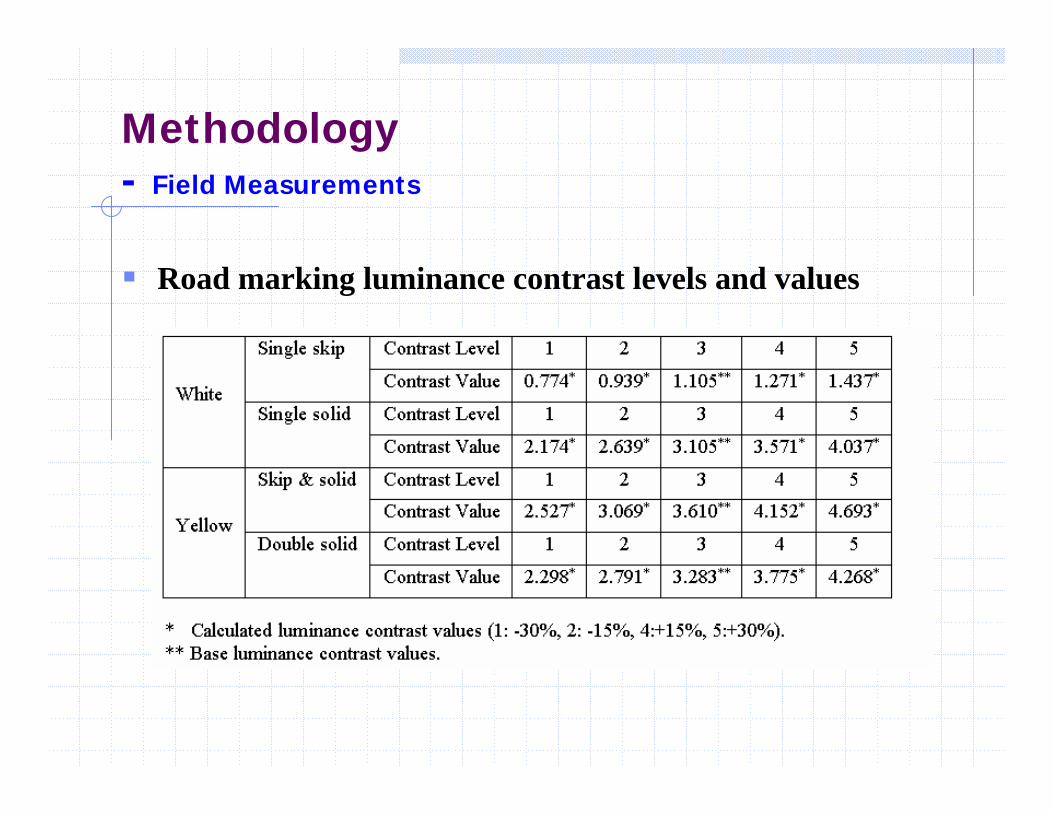
Methodology- Field Measurements
Road marking luminance contrast levels and values

Results and Analysis- The ANOVA table on Response Time
ANOVA based on response time for white single skip marking
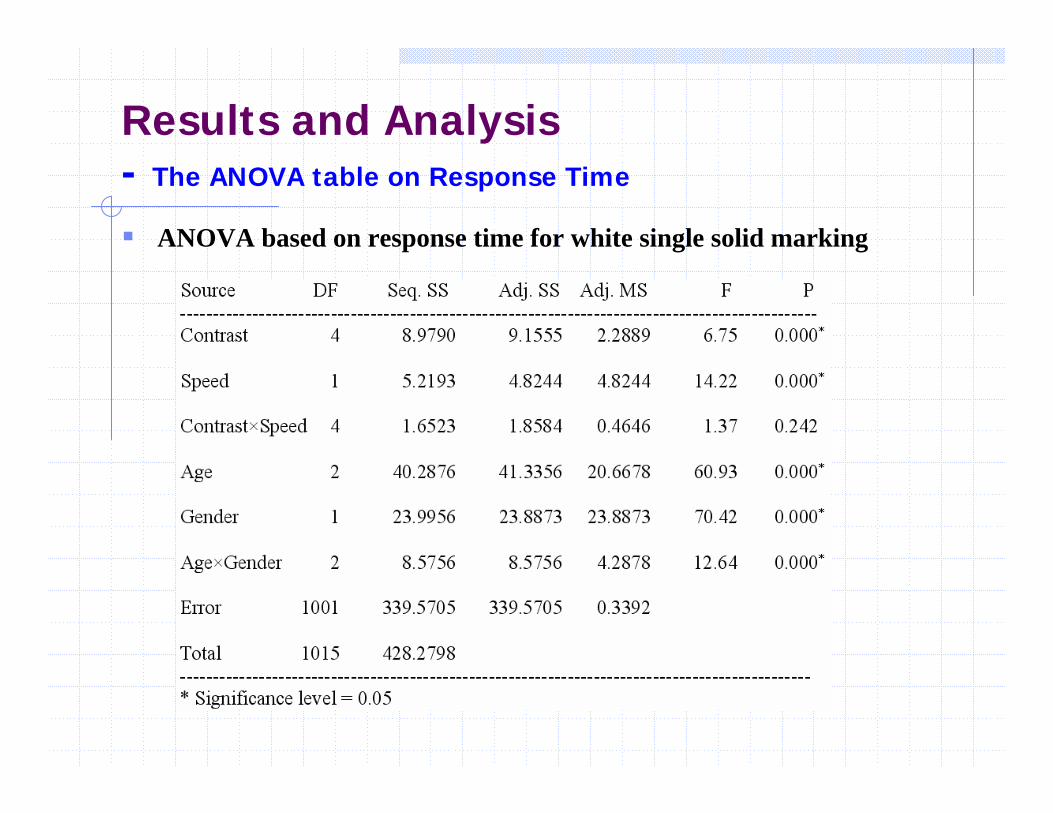
Results and Analysis- The ANOVA table on Response Time
ANOVA based on response time for white single solid marking

Results and Analysis- The ANOVA table on Response Time
ANOVA based on response time for yellow skip and solid marking

Results and Analysis- The ANOVA table on Response Time
ANOVA based on response time for yellow double solid marking
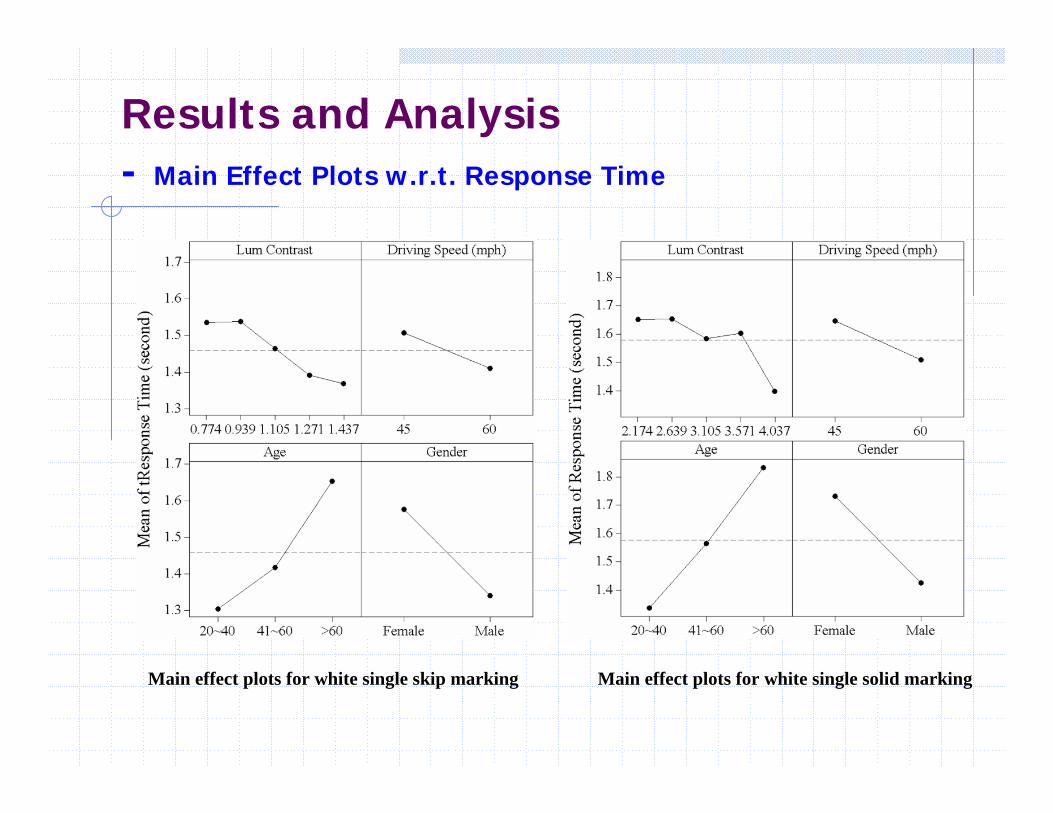
Results and Analysis- Main Effect Plots w.r.t. Response Time
Main effect plots for white single skip marking Main effect plots for white single solid marking
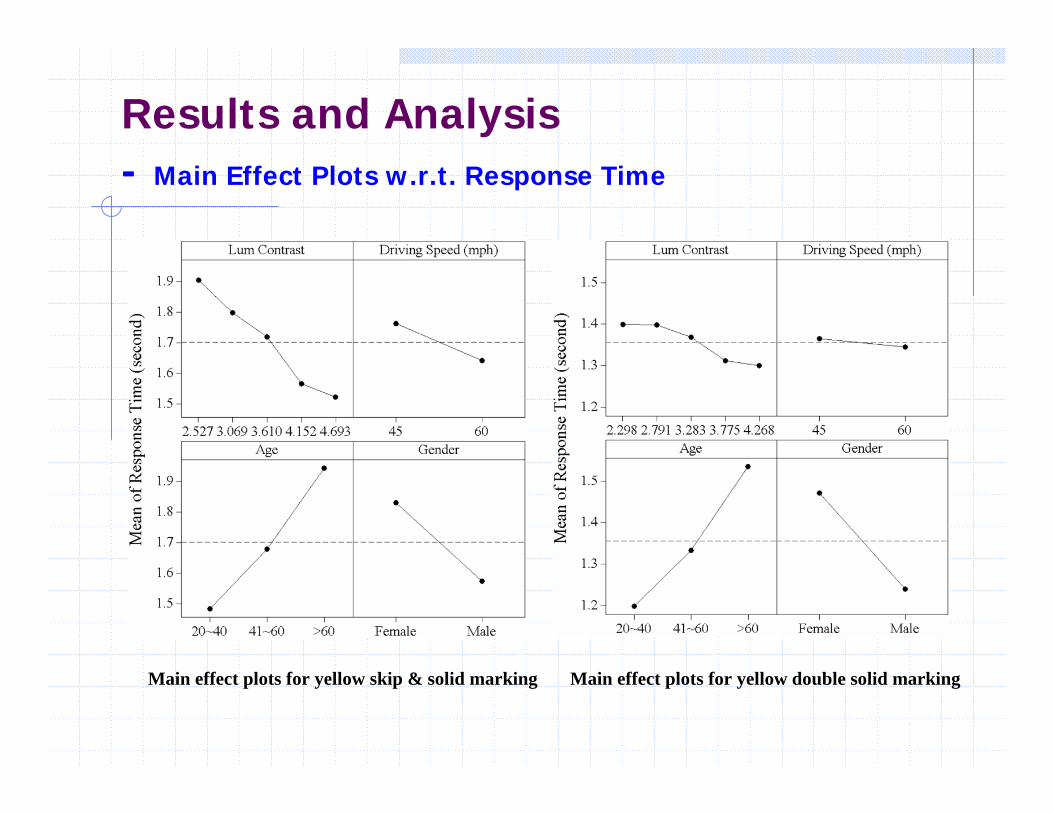
Results and Analysis- Main Effect Plots w.r.t. Response Time
Main effect plots for yellow skip & solid marking Main effect plots for yellow double solid marking
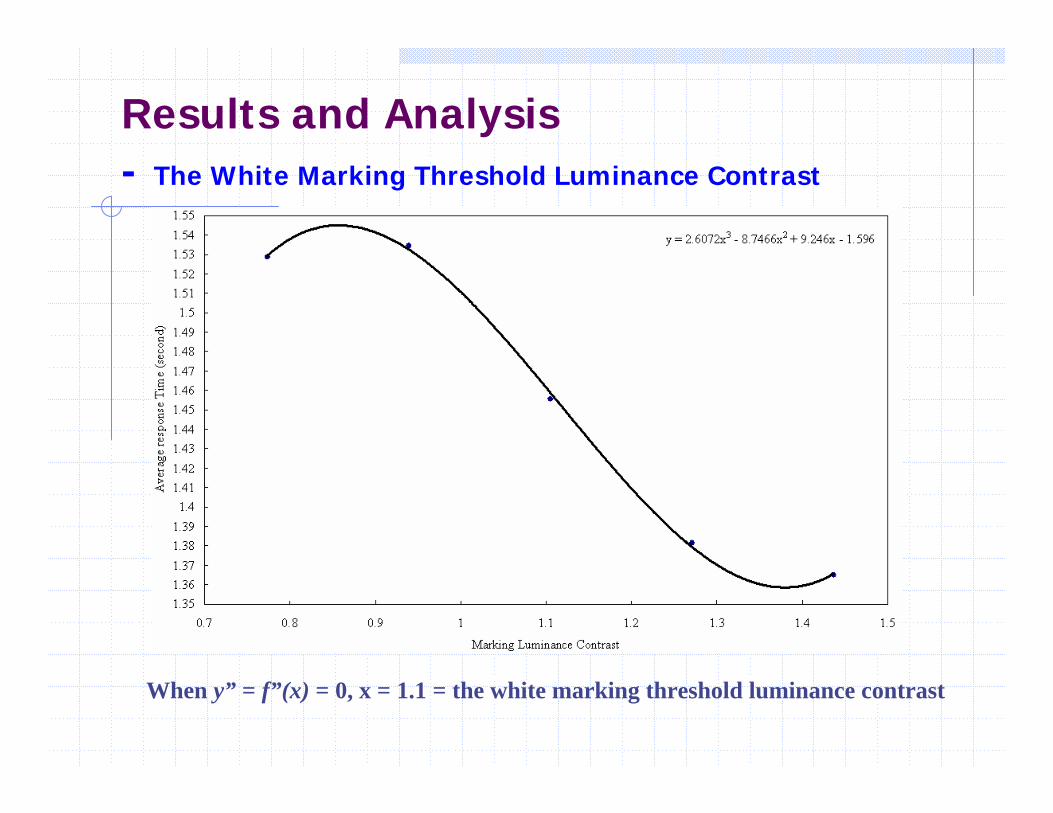
Results and Analysis- The White Marking Threshold Luminance Contrast
When y” = f”(x) = 0, x = 1.1 = the white marking threshold luminance contrast

Results and Analysis- The Yellow Marking Threshold Luminance Contrast
y = 0.0311x3 - 0.3306x2 + 0.954x + 1.0944R2 = 0.9916
1.51.521.541.561.581.6
1.621.641.661.681.7
1.721.741.761.781.8
1.821.841.861.881.9
1.92
2.5 2.6 2.7 2.8 2.9 3 3.1 3.2 3.3 3.4 3.5 3.6 3.7 3.8 3.9 4 4.1 4.2 4.3 4.4 4.5 4.6 4.7
Marking Luminance Contrast
Ave
rage
Res
pons
e Ti
me
(sec
ond)
The yellow marking threshold luminance contrast = 3.3~3.5
y = 0.05x3 - 0.5009x2 + 1.5741x - 0.1826R2 = 0.9933
1.29
1.3
1.31
1.32
1.33
1.34
1.35
1.36
1.37
1.38
1.39
1.4
1.41
2.2 2.3 2.4 2.5 2.6 2.7 2.8 2.9 3 3.1 3.2 3.3 3.4 3.5 3.6 3.7 3.8 3.9 4 4.1 4.2 4.3
Marking Luminance Contrast
Ave
rage
Res
pons
e Ti
me
(sec
ond)

Subjects’ response time drop with the increment of road marking luminance contrast, but at different rates in different contrast segments.
White markings are more visible than yellow markings.
Driving at higher speed get faster responses.
Older subjects take the longest responses while younger subjects take the least.
Female subjects respond a little bit slower than males.
The threshold luminance contrast values for white and yellow road marking are estimated to be 1.1 and 3.3~3.5 respectively. When road markings’ contrast values are below these thresholds, a repair or repaint on road markings might be needed.
Conclusion

The above conclusions are based on the driving simulation experiment under lowbeam headlight at night on dry straight and flat road conditions.
Many other factors, such as road marking width, location, material, road alignment, and weather were not considered in this study.
To better understand the effects of road marking luminance contrast on driving safety under these factors, further studies that can better simulate real driving scenario are required.
Final Remarks


![JYhhgjl l`]jeg jYh`aim] ;ghjghja l D]](https://img.dokumen.tips/doc/110x75/5f0b6fae7e708231d4308275/jyhhgjl-ljeg-jyhaim-ghjghja-l-d-.jpg)