Embed Size (px)
Citation preview

A density functional theory study of the adsorption behaviour of CO2 on Cu2OsurfacesAbhishek Kumar Mishra, Alberto Roldan, and Nora H. de Leeuw Citation: The Journal of Chemical Physics 145, 044709 (2016); doi: 10.1063/1.4958804 View online: http://dx.doi.org/10.1063/1.4958804 View Table of Contents: http://scitation.aip.org/content/aip/journal/jcp/145/4?ver=pdfcov Published by the AIP Publishing Articles you may be interested in CO2 adsorption on TiO2(101) anatase: A dispersion-corrected density functional theory study J. Chem. Phys. 135, 124701 (2011); 10.1063/1.3638181 Structure and activity relationship for CO and O 2 adsorption over gold nanoparticles using density functionaltheory and artificial neural networks J. Chem. Phys. 132, 174113 (2010); 10.1063/1.3369007 Coadsorption of CO and NO on the Cu 2 O ( 111 ) surface: A periodic density functional theory study J. Chem. Phys. 131, 174503 (2009); 10.1063/1.3251055 The adsorption of CO on charged and neutral Au and Au 2 : A comparison between wave-function based anddensity functional theory J. Chem. Phys. 128, 124302 (2008); 10.1063/1.2834693 Density functional theory study of C H x ( x = 1 – 3 ) adsorption on clean and CO precovered Rh(111)surfaces J. Chem. Phys. 127, 024705 (2007); 10.1063/1.2751155
Reuse of AIP Publishing content is subject to the terms: https://publishing.aip.org/authors/rights-and-permissions. Downloaded to IP: 128.41.35.117 On: Mon, 17 Oct
2016 15:01:07

THE JOURNAL OF CHEMICAL PHYSICS 145, 044709 (2016)
A density functional theory study of the adsorption behaviour of CO2on Cu2O surfaces
Abhishek Kumar Mishra,1,2,a) Alberto Roldan,3 and Nora H. de Leeuw2,3,a)1Research & Development, University of Petroleum and Energy Studies (UPES), Bidholi,Dehradun 248007, India2Department of Chemistry, University College London, 20 Gordon Street, London WC1H 0AJ, United Kingdom3School of Chemistry, Cardiff University, Main Building, Park Place, Cardiff CF10 3AT, United Kingdom
(Received 13 May 2016; accepted 1 July 2016; published online 29 July 2016)
Copper has many applications, particularly in electro-catalysis, where the oxidation state of thecopper electrode plays a significant role in the selectivity towards products. Although copper-basedmaterials have clear potential as catalysts in the reduction of CO2 and conversion to products,fundamental understanding of CO2 adsorption and activation on different copper oxide surfacesis still limited. We have used DFT+U methodology to study the surface reconstruction of thethree most exposed (111), (110), and (001) surfaces of Cu2O with different possible termina-tions. Considering several adsorbate geometries, we have investigated CO2 adsorption on fivedifferent possible terminations and proposed eight different configurations in which CO2 binds withthe surface. Similar to earlier findings, CO2 binds weakly with the most stable Cu2O(111):Osurface showing no molecular activation, whereas a number of other surfaces, which can appearin the Cu2O particles morphology, show stronger binding as well as activation of the CO2 mole-cule. Different CO2 coverages were studied and a detailed structural and electronic charge anal-ysis is presented. The activation of the CO2 molecule is characterized by structural transforma-tions and charge transfer between the surface and the CO2 molecule, which is further confirmedby considerable red shifts in the vibrational frequencies. C 2016 Author(s). All article content,except where otherwise noted, is licensed under a Creative Commons Attribution (CC BY) license(http://creativecommons.org/licenses/by/4.0/). [http://dx.doi.org/10.1063/1.4958804]
I. INTRODUCTION
Copper is a unique metal owing to its ability to selectivelyproduce hydrocarbons through the electro-reduction of CO2,1,2
where the oxidation state of the Cu electrode plays animportant role in the product selectivity. The direct reductionof CO2 to methanol (CH3OH) is known to occur on oxidizedCu electrodes, which show an increase in the methanolformation by an order of magnitude compared to metalliccopper.3 The surface structure of oxidized copper resemblesthe Cu2O (111)4,5 surface and it reduces CO2 to CH3OH atrates remarkably higher than either air-oxidized or anodizedCu.5 In addition, our recent density functional theory (DFT)based calculations of CO2 hydrogenation on the most stable(111) surface of Cu2O show that it is a suitable catalystfor CO2 conversion to formate and formic acid under mildconditions.6 Surface analysis of these oxides, before and afterthe reaction, shows mixed oxidation states (Cu2O, Cu4O3, andCuO) depending on the method of preparation.7 Recently,it has been demonstrated that CuO–Cu2O nanorod arraysprepared on Cu substrates can drive the efficient solar photo-conversion of CO2 to methanol.8
The catalytic process is affected considerably by thecatalyst structure, with different shapes and surface arrange-
a)Electronic addresses: [email protected], [email protected], and [email protected]
ments having a large impact on the catalyst’s activity andstability. Furthermore, surface structures and crystallographicfacets of metal oxides have been found to control thegas sensing properties of metal oxide-based sensors.9–11 Bycontrolling the size and morphology, one can fine tune thestrength of surface adsorption and reactivity to meet thestringent selectivity and activity requirements in a catalyticprocess. For example, our recent investigations of CO2activation on a number of Cu() oxide surfaces revealed thatsurface structures have significant effects on CO2 activationand binding energies.12
The most exposed surfaces of Cu2O are the (111), (110),and (001),13 with the (111) surface the most stable andmost studied among these surfaces.14–19 However, shape-controlled synthesis of Cu2O crystals has been investigatedwidely and a variety of morphologies has been synthesisedsuccessfully.20–25 Recently, a study by Sun et al. on the crystalfacet-dependent effect of polyhedral Cu2O micro-crystals,that exposed different Miller index facets, showed that thecatalytic performance can be enhanced by high-index facets,26
Furthermore, copper() oxide nano clusters have been studiedrecently to understand the methanol formation through DFTbased calculations.27
The adsorption of molecules on a catalyst surface is thefirst step in their activation and conversion in any catalyticprocess. CO2 adsorption on the Cu2O(111) surface has beeninvestigated by Wu et al.,18,19 and Bendavid and Carter,28 using
0021-9606/2016/145(4)/044709/13 145, 044709-1 © Author(s) 2016.
Reuse of AIP Publishing content is subject to the terms: https://publishing.aip.org/authors/rights-and-permissions. Downloaded to IP: 128.41.35.117 On: Mon, 17 Oct
2016 15:01:07
044709-2 Mishra, Roldan, and de Leeuw J. Chem. Phys. 145, 044709 (2016)
DFT calculations. Wu et al.,19 investigated CO2 adsorptionon the Cu2O(111) surface, using the standard generalizedgradient approximation (GGA) and identified that CO2 bindsas a linear molecule in a tilted configuration to the surface, withits oxygen atom coordinated to a coordinatively unsaturatedsurface copper atom, releasing an adsorption energy of 26.8kJ/mol. However, it is now well known that pure GGAcan lead to considerable errors when calculating reactionswhere 3d-metal oxides are oxidized by means other than byoxygen. Reaction energies for these processes become moreaccurate when the so-called DFT+U method is applied.29
Bendavid and Carter28 recently investigated CO2 adsorptionon the Cu2O(111) using the DFT+U method and showed viacomparison to adsorption energies derived by standard DFTthat the U parameter is necessary. Their choice of U = 6eV was based on their earlier work,30 where they determinedand compared different values of U to earlier DFT+U studieson Cu2O and CuO.31–33 The selection of their U value wasbased solely on its accuracy to predict the equilibrium latticeconstant for Cu2O. However, experimentally it is found thatcopper oxide surfaces consist of mixed Cu2O and CuO surfacespecies, whereas molecule interactions can also alter theoxidation state of the copper oxide surface, i.e., through−OH groups.30 Therefore, we recently determined a single Uparameter to describe adequately both Cu2O and CuO in termsof experimental properties.12 In the present work, we haveemployed DFT with this Hubbard U correction to explore CO2adsorption on different non-polar stoichiometric terminationsof the (111), (110), and (001) surfaces of Cu2O. We firstdescribe the reconstruction of the different surfaces and theirelectronic properties, followed by a detailed discussion of theCO2 adsorption behaviour.
II. COMPUTATIONAL DETAILS
All the calculations were performed using the ViennaAb initio Simulation Package (VASP) with plane-wave basisset.34–37 We have employed plane-wave DFT+U38 with thePBE39,40 exchange-correlation functional and the formalism ofDudarev et al.38 The different Cu2O surfaces were obtained bythe METADISE code,41 providing different non-polar surfaceterminations.42 At the base of the surface simulation cell, twolayers of atoms were fixed at their optimised bulk positions tosimulate the bulk phase of the Cu2O. Above these two layers,the surface is represented by three layers of atoms, whosepositions are allowed to change freely during optimization. Ineach case, the vacuum region above the surface was 12 Å, i.e.,large enough to avoid interactions between the periodic slabs.We sampled (1 × 1) and (2 × 2) supercells with 5 × 5 × 1 and3 × 3 × 1 Monkhorst and Pack43 k-point mesh, respectively.Such dense grids and a truncation kinetic energy of 450 eV forthe plane waves ensured an accurate description of propertiesthat are influenced by sharp features in the density of states.A total convergence better than 10−5 was reached and theinteratomic forces were minimized to 0.01 eV/Å for structuralrelaxation calculations.
The surface energies of the relaxed slabs were obtainedusing a combination of calculations for the relaxed andunrelaxed surfaces. After surface relaxation, the top and
bottom surfaces are not equivalent and therefore we alsoneed to consider the unrelaxed surface energy (γu) in orderto calculate the final surface energy of the relaxed surface.The unrelaxed surface energy is the surface energy before anysurface optimisation and is calculated as
γu =Eslab,u − nEbulk
2A, (1)
where Eslab,u is the energy of the unrelaxed slab, nEbulk isthe energy of an equal number of bulk atoms, and A is thesurface area of one side of the slab. Using this value, it is thenpossible to calculate the relaxed surface energy (γr) from thetotal energy of the relaxed slab.
The relaxed surface energy, γr , is given by
γr =Eslab,r − nEbulk
A− γu, (2)
where Eslab,r is the energy of the relaxed slab.The equilibrium morphology of a Cu2O particle (ignoring
higher Miller indices) was constructed using Wulff’smethod,44 which requires that the distance to a given surfacefrom the center of the particle is proportional to the surfaceenergy.
While modelling the CO2 molecule, we have also usedthe implementation of the DFT-D2 approach described byGrimme45 to account for long-range dispersion forces. Theisolated molecule was modelled in the centre of a big cell withbroken symmetry and lattice constants of 20 Å, sampling onlythe gamma-point of the Brillouin zone with the same accuracyparameters described for the surfaces.
The adsorption energy per molecule was calculated fromthe relation
Eads = Esurf+mol − (Esurf + Emol), (3)
where Esurf+mol is the total energy of the adsorbate-substratesystem, Esurf is the energy of the naked surface slab, andEmol is the energy of the isolated CO2 molecule. Withinthis definition, a negative adsorption energy indicates anexothermic process.
III. RESULT AND DISCUSSION
In a recent work, we found that a value of Ueff = 7 eVresults in the accurate reproduction of the structural parametersof Cu2O and a proper description of the Cu() oxide.12 Atthis Ueff value, we found the lattice parameter of Cu2O tobe 4.270 Å, which is very close to the experimental valueof 4.2696 Å.46 Other structural parameters were also foundto be in close agreement with the experimental values.46 Wehave therefore modelled the different Cu2O surfaces usingthe same Ueff value and employing the same bulk structuralparameters.12
A. Surface reconstructions
In this section (Sec. III A), we have described indetail the reconstruction of the different terminations ofthree low-index Cu2O surfaces: (111), (110), and (001). We
Reuse of AIP Publishing content is subject to the terms: https://publishing.aip.org/authors/rights-and-permissions. Downloaded to IP: 128.41.35.117 On: Mon, 17 Oct
2016 15:01:07
044709-3 Mishra, Roldan, and de Leeuw J. Chem. Phys. 145, 044709 (2016)
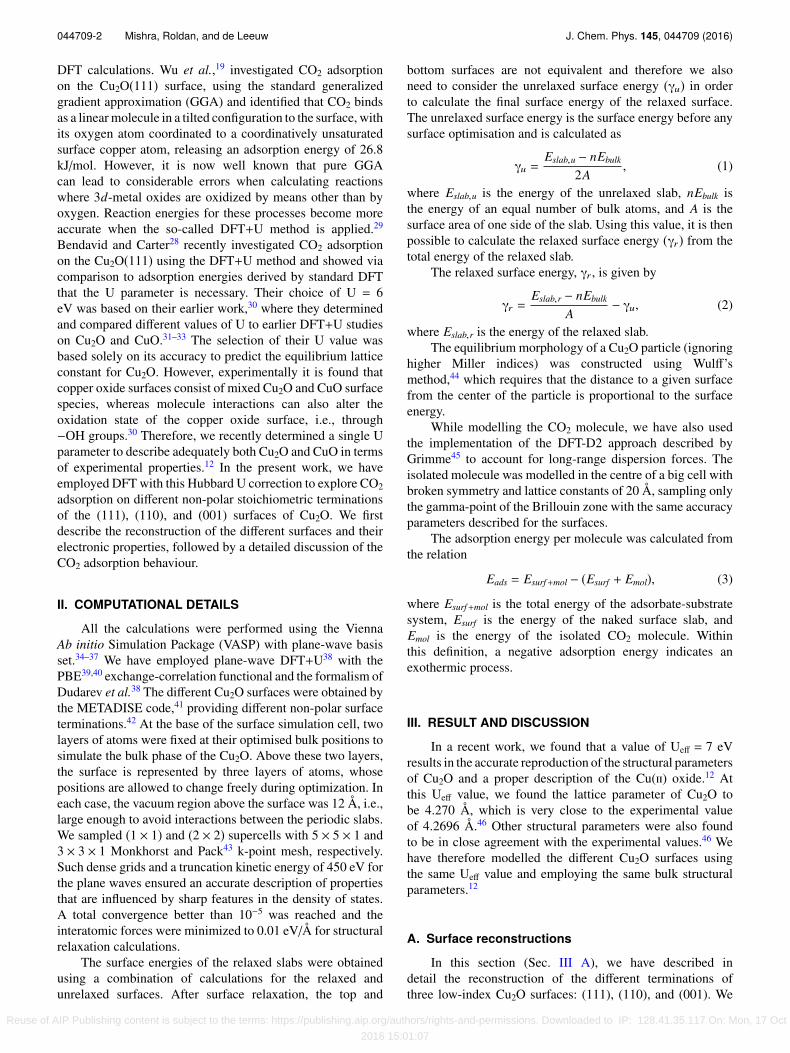
FIG. 1. The Wulff morphology of Cu2O particle determined from calculatedsurface energies.
have calculated the surface energies of the different surfaceterminations from Equation (2) and determined the Wulffmorphology44 of the Cu2O crystal, as shown in Fig. 1. Thecalculated surface energies (γr), the work functions, andthe electronic band gaps of the different surfaces are listedin Table I.
1. Cu2O(111) surface
a. (111):O. In agreement with Soon et al.,47 we foundthat the most stable surface is the stoichiometric non-polaroxygen-terminated (111) surface, (111):O, with a surfaceenergy of 1.08 J/m2. The work function calculated withDFT+U is 4.98 eV, which is close to the experimental rangeof 4.62-4.84 eV.48 This surface consists of four distinct typesof atoms: unsaturated (singly coordinated) surface copperatoms CuCUS, outermost surface oxygens OSUF, saturatedcopper atoms with linear O–Cu–O bond symmetry CuCSA,and sub-surface oxygens that are 4-fold coordinated OSUB(Fig. 2). The unsaturated copper atoms (CuCUS) act as Lewisacid sites, where most of the surface reactions are believed totake place.49
After relaxation, the distance of the CuCSA atoms to OSUFatoms decreases from 1.85 to 1.82 Å, but increases to the OSUBatom to 1.86 Å. As a result, these CuCSA atoms become moreexposed. The top CuCUS atoms also move outwards so that thevertical bond length between CuCUS and the topmost O atomsfound in the second trilayer increases from 1.85 to 1.91 Å,
TABLE I. The calculated relaxed surface energies (γr), work functions (φ),and the bandgaps (Eg) of different Cu2O surfaces.
Surface γr (J/m2) φ (eV) Eg (eV)
(111):O 1.08 4.98 0.78(111):Cu 1.92 5.10 . . .(110):Cu 1.24 5.41 0.30(110):Cu–O 1.54 4.39 0.15(100):Cu 1.62 4.54 . . .
FIG. 2. The Cu2O(111):O terminated relaxed surface side view (a) and topview (b). We have shown a (2×2) cell in side view with periodic images ofatoms for clearer visualization of bonding in all surface figures. Blue and redballs indicate Cu and O atoms, respectively, in all figures. The bond lengthvalues are in Å.
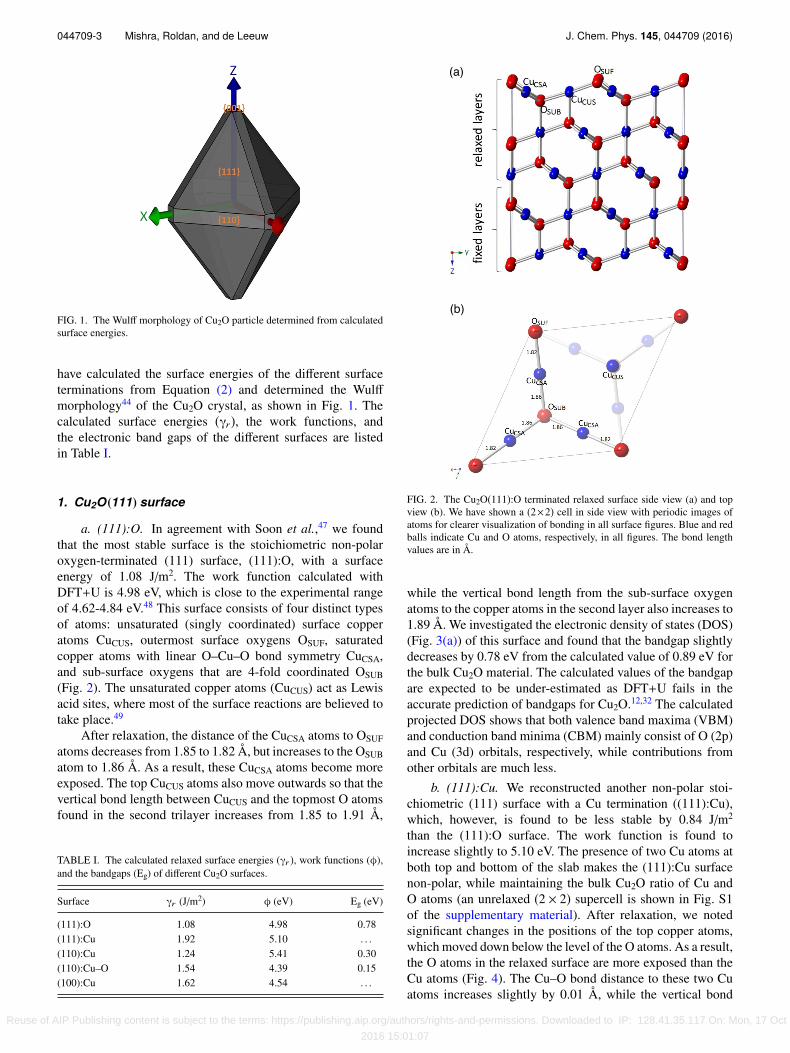
while the vertical bond length from the sub-surface oxygenatoms to the copper atoms in the second layer also increases to1.89 Å. We investigated the electronic density of states (DOS)(Fig. 3(a)) of this surface and found that the bandgap slightlydecreases by 0.78 eV from the calculated value of 0.89 eV forthe bulk Cu2O material. The calculated values of the bandgapare expected to be under-estimated as DFT+U fails in theaccurate prediction of bandgaps for Cu2O.12,32 The calculatedprojected DOS shows that both valence band maxima (VBM)and conduction band minima (CBM) mainly consist of O (2p)and Cu (3d) orbitals, respectively, while contributions fromother orbitals are much less.
b. (111):Cu. We reconstructed another non-polar stoi-chiometric (111) surface with a Cu termination ((111):Cu),which, however, is found to be less stable by 0.84 J/m2
than the (111):O surface. The work function is found toincrease slightly to 5.10 eV. The presence of two Cu atoms atboth top and bottom of the slab makes the (111):Cu surfacenon-polar, while maintaining the bulk Cu2O ratio of Cu andO atoms (an unrelaxed (2 × 2) supercell is shown in Fig. S1of the supplementary material). After relaxation, we notedsignificant changes in the positions of the top copper atoms,which moved down below the level of the O atoms. As a result,the O atoms in the relaxed surface are more exposed than theCu atoms (Fig. 4). The Cu–O bond distance to these two Cuatoms increases slightly by 0.01 Å, while the vertical bond
Reuse of AIP Publishing content is subject to the terms: https://publishing.aip.org/authors/rights-and-permissions. Downloaded to IP: 128.41.35.117 On: Mon, 17 Oct
2016 15:01:07
044709-4 Mishra, Roldan, and de Leeuw J. Chem. Phys. 145, 044709 (2016)
FIG. 3. Electronic DOS of Cu2O (a) (111):O and (b) (111):Cu terminatedsurfaces with Fermi-level set to zero.
FIG. 4. The Cu2O(111):Cu terminated relaxed surface side (a) and top view(b). The bond length values are in Å.
distance to the top O atoms from Cu atoms in the second layerdecreases slightly by 0.01 Å. Other Cu–O bond distances inthe second and third layers remain unchanged. We observeda finite number of states near the Fermi level in the electronicDOS of this surface and hence propose that this surface isconducting (Fig. 3(b)).
2. Cu2O(110) surface
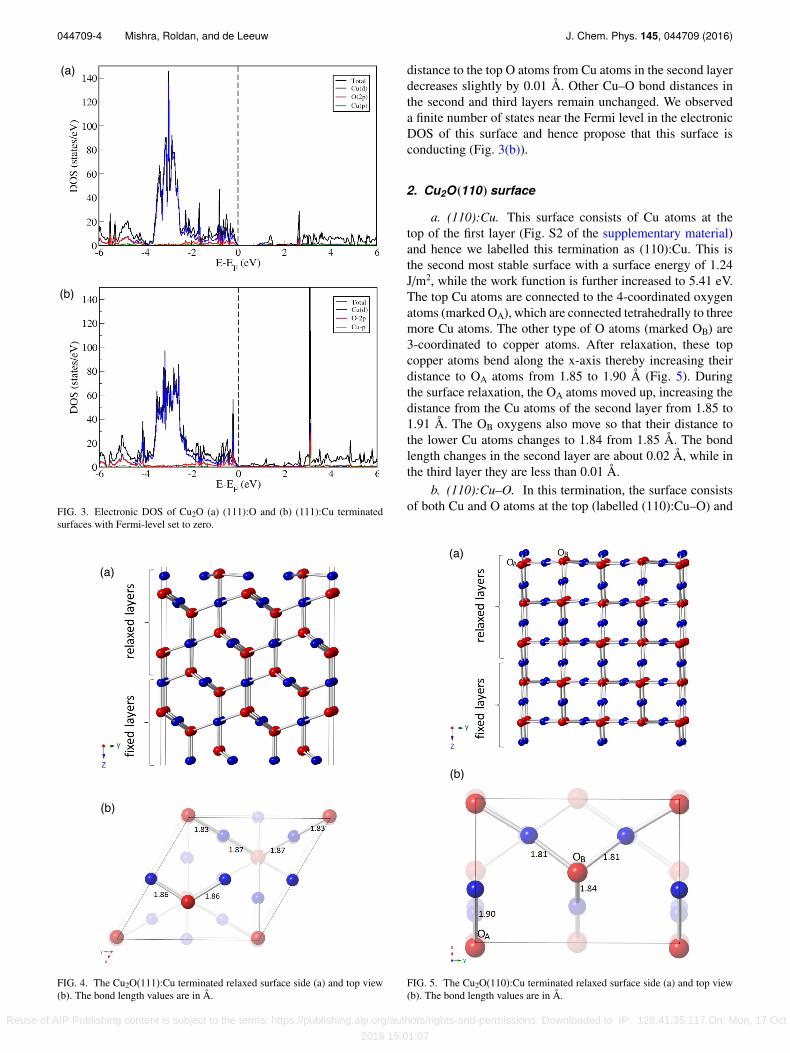
a. (110):Cu. This surface consists of Cu atoms at thetop of the first layer (Fig. S2 of the supplementary material)and hence we labelled this termination as (110):Cu. This isthe second most stable surface with a surface energy of 1.24J/m2, while the work function is further increased to 5.41 eV.The top Cu atoms are connected to the 4-coordinated oxygenatoms (marked OA), which are connected tetrahedrally to threemore Cu atoms. The other type of O atoms (marked OB) are3-coordinated to copper atoms. After relaxation, these topcopper atoms bend along the x-axis thereby increasing theirdistance to OA atoms from 1.85 to 1.90 Å (Fig. 5). Duringthe surface relaxation, the OA atoms moved up, increasing thedistance from the Cu atoms of the second layer from 1.85 to1.91 Å. The OB oxygens also move so that their distance tothe lower Cu atoms changes to 1.84 from 1.85 Å. The bondlength changes in the second layer are about 0.02 Å, while inthe third layer they are less than 0.01 Å.
b. (110):Cu–O. In this termination, the surface consistsof both Cu and O atoms at the top (labelled (110):Cu–O) and
FIG. 5. The Cu2O(110):Cu terminated relaxed surface side (a) and top view(b). The bond length values are in Å.
Reuse of AIP Publishing content is subject to the terms: https://publishing.aip.org/authors/rights-and-permissions. Downloaded to IP: 128.41.35.117 On: Mon, 17 Oct
2016 15:01:07
044709-5 Mishra, Roldan, and de Leeuw J. Chem. Phys. 145, 044709 (2016)
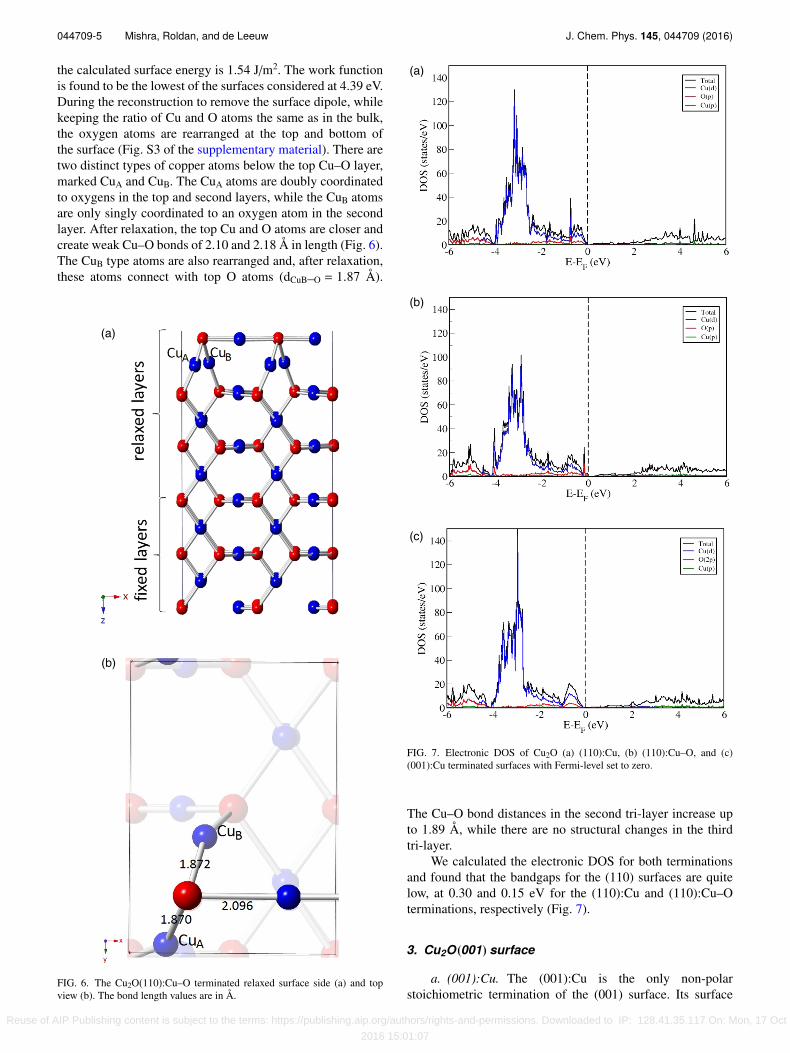
the calculated surface energy is 1.54 J/m2. The work functionis found to be the lowest of the surfaces considered at 4.39 eV.During the reconstruction to remove the surface dipole, whilekeeping the ratio of Cu and O atoms the same as in the bulk,the oxygen atoms are rearranged at the top and bottom ofthe surface (Fig. S3 of the supplementary material). There aretwo distinct types of copper atoms below the top Cu–O layer,marked CuA and CuB. The CuA atoms are doubly coordinatedto oxygens in the top and second layers, while the CuB atomsare only singly coordinated to an oxygen atom in the secondlayer. After relaxation, the top Cu and O atoms are closer andcreate weak Cu–O bonds of 2.10 and 2.18 Å in length (Fig. 6).The CuB type atoms are also rearranged and, after relaxation,these atoms connect with top O atoms (dCuB–O = 1.87 Å).
FIG. 6. The Cu2O(110):Cu–O terminated relaxed surface side (a) and topview (b). The bond length values are in Å.
FIG. 7. Electronic DOS of Cu2O (a) (110):Cu, (b) (110):Cu–O, and (c)(001):Cu terminated surfaces with Fermi-level set to zero.
The Cu–O bond distances in the second tri-layer increase upto 1.89 Å, while there are no structural changes in the thirdtri-layer.
We calculated the electronic DOS for both terminationsand found that the bandgaps for the (110) surfaces are quitelow, at 0.30 and 0.15 eV for the (110):Cu and (110):Cu–Oterminations, respectively (Fig. 7).
3. Cu2O(001) surface
a. (001):Cu. The (001):Cu is the only non-polarstoichiometric termination of the (001) surface. Its surface
Reuse of AIP Publishing content is subject to the terms: https://publishing.aip.org/authors/rights-and-permissions. Downloaded to IP: 128.41.35.117 On: Mon, 17 Oct
2016 15:01:07

044709-6 Mishra, Roldan, and de Leeuw J. Chem. Phys. 145, 044709 (2016)
FIG. 8. The Cu2O(001):Cu terminated relaxed surface side (a) and top view(b). The bond length values are in Å.
energy is calculated at 1.62 J/m2, which is 0.46 J/m2 largerthan the surface energy of the most stable Cu2O(111):Osurface, while the work function is 4.54 eV. This surfaceconsists of Cu atoms in the top layer connected to oxygenatoms below, which in turn are connected to two copper atomsin the layer below (Fig. S4 of the supplementary material). Wenoted that after relaxation, the top Cu atoms moved down andbecame less exposed and the Cu–O bond distance increasedfrom 1.85 to 1.88 Å (Fig. 8). Cu atoms in the second layermove up to shorten the bond length to oxygen atoms in thetop layer from 1.85 to 1.83 Å. We also noted that the Cu–Obond distance in all other relaxed surfaces increases from 1.85Å and varies from 1.86 to 1.88 Å. With finite states nearthe Fermi level, this surface is also found to be conducting(Fig. 7).
FIG. 9. The CO2 molecule adsorbed on the Cu2O(111):O terminated surface.Black balls indicate C atom of CO2 molecule, green balls indicate O atoms ofthe molecule, while blue and red balls denote the surface Cu and O atoms inall the figures.
B. CO2 adsorption
1. Cu2O(111) surface
a. (111):O surface. A (1 × 1) slab (a = b = 6.04 Å)consists of 20 copper and 10 oxygen atoms. We first consideredthe (1 × 1) cell of the (111) surface for CO2 adsorptionand investigated a number of initial configurations withdifferent orientations of the CO2 molecule. We found thatthe CO2 molecule moved away from the (111):O surfacefor all configurations, except where we placed it near thecoordinatively unsaturated surface copper, CuCUS. In thisconfiguration one of the oxygen atoms, O1, of the CO2molecule binds weakly with this CuCUS copper atom, asshown in Fig. 9. The CO2 molecule remains almost linearwith an angle of 176.9◦. The distance between the oxygenatom O1 of the CO2 molecule and CuCUS is found to be 2.05 Å,and the C–O bond between C and this O1 atom is slightlystretched at 1.19 Å, while the C–O2 bond length is found tobe around 1.17 Å. Cu–O bond lengths in the slab also changeslightly as a result of CO2 adsorption, where the vertical bonddistance between CuCUS (coordinated to the O1 atom of theCO2 molecule) and the topmost O atom found in the secondtrilayer shortens from 1.91 to 1.88 Å. The adsorption energyin this configuration is −51.0 kJ/mol.
In order to assess the effect of CO2 coverage, we repeatedour calculation by placing one CO2 molecule in a (2 × 2)supercell; we found that the adsorption energy increasesto −56.1 kJ/mol, but with negligible changes in the CO2geometry. Adsorption geometries of the CO2 molecule on
TABLE II. The adsorption energies and the characteristic parameter valuesof the CO2 adsorbed geometry in the (1×1) and the (2×2) supercell of theCu2O(111):O surface.
SupercellEads
(kJ/mol)∠CO2
(deg)dC–O1
(Å)dC–O2
(Å)dO1–CuCUS
(Å)
(1×1) −51.0 176.9 1.19 1.17 2.05(2×2) −56.1 178.3 1.18 1.18 2.05
Reuse of AIP Publishing content is subject to the terms: https://publishing.aip.org/authors/rights-and-permissions. Downloaded to IP: 128.41.35.117 On: Mon, 17 Oct
2016 15:01:07
044709-7 Mishra, Roldan, and de Leeuw J. Chem. Phys. 145, 044709 (2016)
TABLE III. Vibrational frequencies (cm−1) and Bader charges (e−) comparison of the atoms in the adsorbed CO2molecule and the Cu2O(111):O surface atoms bonded with the molecule to that of the atoms in the isolated CO2molecule and the bare surface in the (1×1) cell.
Atoms and vibrational modes C O1 O2 CuCUS υas υs υb
Adsorbed CO2 molecule 2.08 −1.07 −1.02 0.50 2332 1292 567Isolated CO2 molecule 2.08 −1.04 −1.04 . . . 2355 1316 632Bare surface . . . . . . . . . 0.44 . . . . . . . . .
both (1 × 1) and (2 × 2) supercell are given in Table II.Our calculated geometrical parameters of the adsorbed CO2molecule and the binding energies are in reasonable agreementwith the recent work of Bendavid et al., where they usedsimilar DFT(D)+U (6 eV) methodology and found ∠CO2 tobe 177.1◦and an adsorption energy of −36.4 kJ/mol.28 Thissmall change in adsorption energy value is expected as wehave not included entropy and enthalpy energy corrections inour calculated adsorption energies.
A Bader charge analysis of the (1 × 1) cell (Table III)shows that the oxygen atom O1 of the CO2 molecule (bondedto the coordinatively unsaturated surface copper CuCUS) gains0.03e−, resulting from a small charge transfer from the surfacecopper atom CuCus, which becomes more oxidized after CO2adsorption. This very small charge transfer between the surfaceand the CO2 molecule, as well as small changes in vibrationalfrequencies (Table III) indicates weak activation of the CO2molecule.
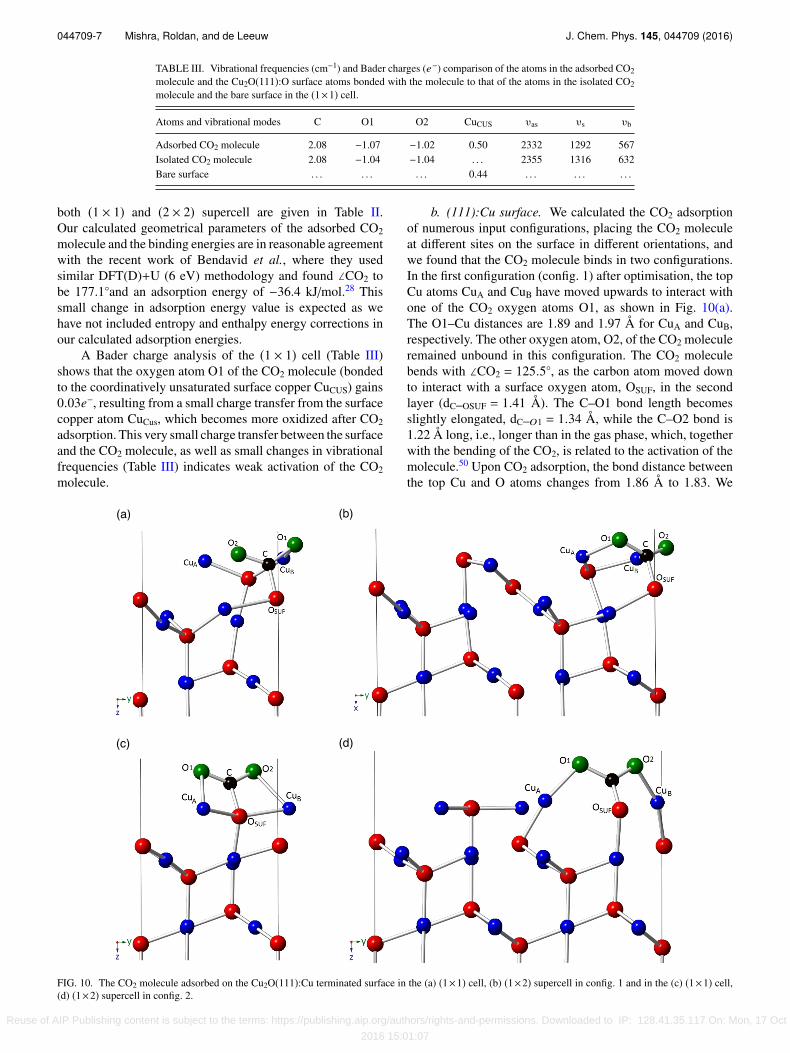
b. (111):Cu surface. We calculated the CO2 adsorptionof numerous input configurations, placing the CO2 moleculeat different sites on the surface in different orientations, andwe found that the CO2 molecule binds in two configurations.In the first configuration (config. 1) after optimisation, the topCu atoms CuA and CuB have moved upwards to interact withone of the CO2 oxygen atoms O1, as shown in Fig. 10(a).The O1–Cu distances are 1.89 and 1.97 Å for CuA and CuB,respectively. The other oxygen atom, O2, of the CO2 moleculeremained unbound in this configuration. The CO2 moleculebends with ∠CO2 = 125.5◦, as the carbon atom moved downto interact with a surface oxygen atom, OSUF, in the secondlayer (dC–OSUF = 1.41 Å). The C–O1 bond length becomesslightly elongated, dC–O1 = 1.34 Å, while the C–O2 bond is1.22 Å long, i.e., longer than in the gas phase, which, togetherwith the bending of the CO2, is related to the activation of themolecule.50 Upon CO2 adsorption, the bond distance betweenthe top Cu and O atoms changes from 1.86 Å to 1.83. We
FIG. 10. The CO2 molecule adsorbed on the Cu2O(111):Cu terminated surface in the (a) (1×1) cell, (b) (1×2) supercell in config. 1 and in the (c) (1×1) cell,(d) (1×2) supercell in config. 2.
Reuse of AIP Publishing content is subject to the terms: https://publishing.aip.org/authors/rights-and-permissions. Downloaded to IP: 128.41.35.117 On: Mon, 17 Oct
2016 15:01:07
044709-8 Mishra, Roldan, and de Leeuw J. Chem. Phys. 145, 044709 (2016)
TABLE IV. The adsorption energies and the characteristic parameter values of the CO2 adsorbed geometry in the(1×1) and the (1×2) supercell of the Cu2O(111):Cu surface in config. 1 and config. 2.
Supercell Eads (kJ/mol) ∠CO2 (deg) dC–O1 (Å) dC–O2 (Å) dO1–CuA (Å) dO1–CuB (Å) dC–OSUF (Å)
Config. 1
(1×1) −117.1 125.5 1.34 1.22 1.89 1.97 1.41(1×2) −161.5 129.0 1.27 1.27 1.91 1.90 1.42
Config. 2
(1×1) −97.1 133.2 1.26 1.26 2.14 2.14 1.44(1×2) −232.6 119.2 1.30 1.30 1.85 1.85 1.32
noted that the surface oxygen atoms, which were connectedin a vertical linear manner to Cu and O atoms in the secondand third layer, respectively, bend towards the CO2 moleculewith loss of linearity. The adsorption energy calculated in thisconfiguration is −117.1 kJ/mol.
We noted that due to the orientation of the CO2 molecule,the lateral distance in the x-direction between the CO2molecule and its periodic image is 6.04 Å, while in they-direction, it is only 3.80 Å. Hence, to minimize the effectof the periodic images on the CO2 adsorption, we carried outcalculations on a (1 × 2) supercell. At this lower coverage,CO2 adsorbs in a slightly different manner, as the top surfaceCu atoms (CuA and CuB) interact with both CO2 oxygen atomsat distances of 2.03 Å and 2.01 Å, respectively (Fig. 10(b)). Asa result, the CuA and CuB bond lengths with oxygen atoms inthe surface change to 1.91 and 1.90 Å, respectively. Becauseof the lower coverage of CO2 molecules on the surface, othersurface Cu atoms (further away from the CO2 molecule) bendinwards to bind to O atoms in the second layer, as shown inFig. 10(b). As expected, the adsorption energy increases toabout −161.5 kJ/mol. Similar to the (1 × 1) cell configuration,the C atom of the CO2 molecule bends towards a surfaceoxygen atom OSUF in the second layer (dC–OSUF = 1.42 Å).The angle of the adsorbed CO2 molecule is 129.0◦ and bothC–O bond lengths are 1.27 Å. We have given parametersof the CO2 adsorption geometries in the (1 × 1) and (1 × 2)simulation cells in Table IV.
Bader charge analysis of the (1 × 2) supercell showscharge transfer between the CO2 molecule and the surface, asboth molecular oxygens O1 and O2 gain 0.08e− and 0.07e−
charge densities, respectively. This charge transfer originatesmainly from the interacting surface copper atoms CuA andCuB, which become more positively charged after adsorption.The OSUF atom bound to the molecule also gains 0.11e− chargedensity (Table V). We also note some charge redistribution
on the Cu2O surface as a result of CO2 adsorption. Baderanalysis indicates the CO2 molecule as a chemisorbed anionon the surface, in agreement with the molecular orbitaloccupation and bending of the molecule. This activation ofthe CO2 molecule is also reflected in terms of changes inthe vibrational frequencies of the molecule, as asymmetric(υas) and symmetric (υs) stretching modes change to 1560and 1200 cm−1 from their values of 2355 and 1316 cm−1,respectively, in the isolated gas phase molecule (Table V).
In a different configuration (config. 2), CO2 binds to the(111):Cu terminated surface through its C atom to a surfaceoxygen atom (dC–OSUF = 1.44 Å), while both oxygen atomsof the molecule bind to CuA and CuB (dO–Cu = 2.14 Å),as shown in Fig. 10(c). The CO2 molecule again bends to∠CO2 = 133.2◦, while the Cu–O–Cu angle in the surfaceis about 145.4◦. We found the surface Cu–O bonds to beslightly more stretched with bond distances of 1.98 Å.The adsorption energy at this coverage is −97.1 kJ/mol,which is slightly less than the same coverage in config. 1.Similar to config. 1, we also investigated a lower coverageof CO2 at the surface in a (1 × 2) supercell (Fig. 10(d)). Atthis coverage, after CO2 adsorption, surface rearrangementtakes place where copper atoms CuA and CuB break theirbonds with the OSUF atom to form new bonds to surfaceoxygen atoms nearby, as well as bind to both CO2 oxygenatoms (dO–Cu = 1.85 Å). The carbon atom binds morestrongly to surface atom OSUF (dC–OSUF = 1.32 Å) as theCO2 angle changes to ∠CO2 = 119.0◦, and we noted that∠O1–C–OSUF and ∠O2–C–OSUF are ∼120.0◦. The adsorptionenergy increases to −232.6 kJ/mol (Table IV). Despite thislarge adsorption energy, Bader charge comparison (Table V)of the free CO2 molecule with that in the adsorbed geometryshows that there is very little charge transfer, although largecharge redistribution takes place among the surface atomsbonded to the molecule. OSUF atom gains 0.23e− charge
TABLE V. Vibrational frequencies (cm−1) and Bader charges (e−) comparison of the atoms in the adsorbed CO2molecule and the Cu2O(111):Cu surface atoms bonded with the molecule in the (1×2) supercell to that of theatoms in the isolated CO2 molecule and the bare surface in config. 1 and config. 2.
Atoms and vibrational modes C O1 O2 CuA CuB OSUF υas υs υb
After CO2 adsorption (config. 1) 2.02 −1.12 −1.11 0.54 0.55 −1.03 1560 1200 748After CO2 adsorption (config. 2) 2.09 −1.06 −1.07 0.56 0.58 −1.15 1395 1257 858Isolated CO2 molecule 2.08 −1.04 −1.04 . . . . . . . . . 2355 1316 632Bare surface . . . . . . . . . 0.41 0.40 −0.92 . . . . . . . . .
Reuse of AIP Publishing content is subject to the terms: https://publishing.aip.org/authors/rights-and-permissions. Downloaded to IP: 128.41.35.117 On: Mon, 17 Oct
2016 15:01:07

044709-9 Mishra, Roldan, and de Leeuw J. Chem. Phys. 145, 044709 (2016)
FIG. 11. The CO2 molecule adsorbed on the Cu2O(110):Cu terminated surface in the (a) (1×1) cell and in the (b) (1×2) supercell.
density, while CuA and CuB both lose 0.16e− and 0.17e−
in charge densities, respectively. This charge redistributiontogether with the change in the surface results in a CO3
−
like-species on the (111):Cu surface (Fig. 10(d)). Unstablesurfaces are often highly reactive, which is exemplified by thisbehaviour of the (111):Cu surface. This strong activation of theCO2 molecule is further confirmed by considerable changesin the vibrational modes of the adsorbed CO2 molecule,where asymmetric stretch (υas), symmetric stretch (υs), andbending (υb) frequencies change to 1395, 1257, and 858 cm−1,respectively, from their original values of 2355, 1316, and632 cm−1 in the isolated gas phase molecule.
2. Cu2O(110) surface
a. (110):Cu. For this surface, we first considered a(1 × 1) unit cell and tried different initial configurations withseveral orientations of the CO2 molecule, but we found onlyone configuration in which CO2 binds to the surface. Here,CO2 binds strongly (Eads = −100 kJ/mol) in a configurationwhere the molecule bends to bind with an oxygen atom inthe second layer (dC–OSUF = 1.45 Å), while its oxygen atomsO1 and O2 bind to surface atoms, CuA and CuB, at 1.97 Å(Fig. 11(a)). We noted that the CO2 molecule is activated withan angle of ∠CO2 = 128.0◦. From Fig. 11(a), we observe thatthe distance between the CO2 molecule and its image in thex-direction is 4.3 Å, while in the y-direction it is only 3.78 Å.We therefore repeated the calculations of all the differentconfigurations in (2 × 1) and (1 × 2) supercells.
Keeping the same input orientations, we first assessed theeffect of a lower CO2 coverage by placing one moleculein a (2 × 1) supercell and found that Eads increased to−105.0 kJ/mol, while in the (1 × 2) supercell, Eads increased to−116.7 kJ/mol. This increase in Eads was expected because ofthe small distance between the CO2 molecule and its periodicimage in the y-direction in the (1 × 1) cell. Because of thesignificant difference in Eads in the (1 × 2) supercell comparedto the (2 × 1) supercell, we have limited our discussion onlyto the more favourable (1 × 2) supercell system. In the (1 × 2)supercell, the carbon atom of the molecule binds strongly tothe surface oxygen atom (dC–OSUF = 1.42 Å), while CuA–O1and CuB–O2 bond lengths reduce to 1.89 Å (Fig. 11(b)). Wehave given geometrical parameters of the adsorbed geometry
of the (1 × 1) and (1 × 2) supercells in Table VI. Baderanalysis of the (1 × 2) supercell (Table VII) shows chargetransfer between the oxygen atoms of CO2 and surface copperatoms. Oxygen atoms O1 and O2 gain 0.05 and 0.06e−,respectively, while both surface copper atoms CuA and CuBlose 0.12e−. There is a very small charge transfer to thecarbon atom of the CO2 molecule of ∼0.01e−. This amountof charge transfer is consistent with the charge transfer inthe (111):Cu surface, where the molecule’s oxygen gains∼0.08e− and surface copper atoms lose charge of ∼0.15e−.Here also, frequencies for asymmetric stretch (υas), symmetricstretch (υs), and bending (υb) vibrations change to 1639, 1247,and 808 cm−1, indicating activation of the CO2 molecule onthe (110):Cu surface. In all other configurations considered,the CO2 molecule does not bind to the copper oxidesurface.
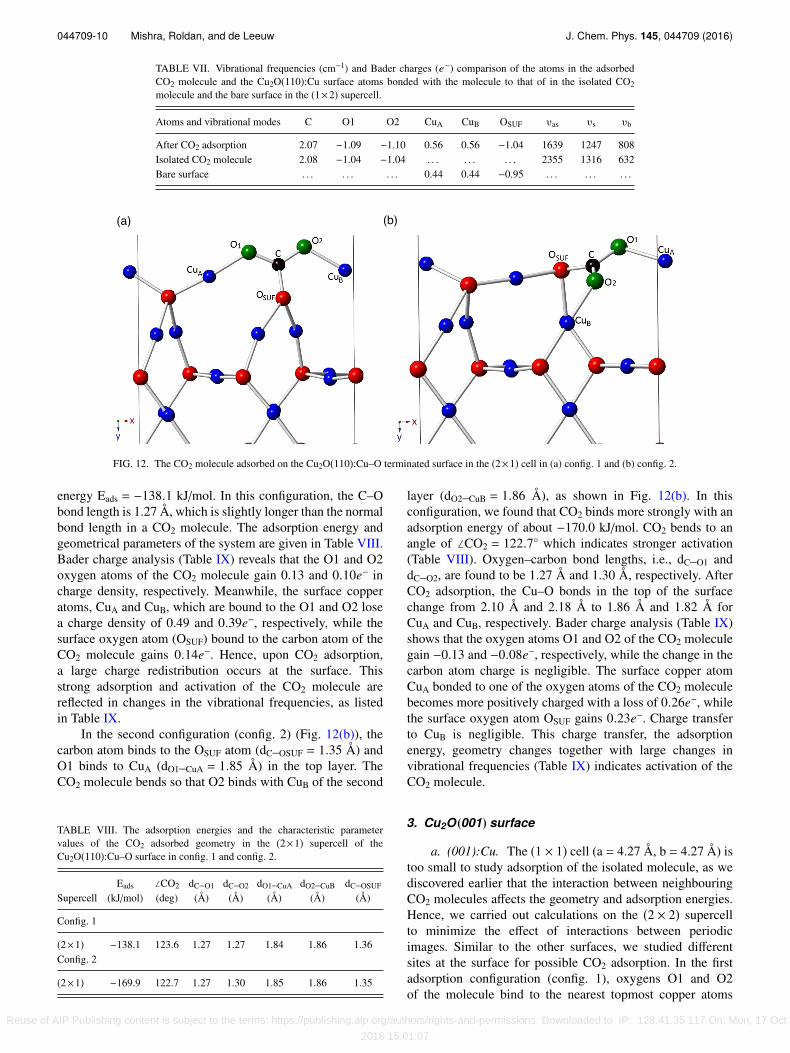
b. (110):Cu–O. Here again, we carried out calculationson a (2 × 1) supercell, exploring different configurations forCO2 to bind with the surface. In the first configuration(config. 1), after placing the CO2 molecule parallel to theCu–O–Cu linear bond in the top layer, we found that thisbond breaks when Cu atoms move up to bind to oxygenatoms of the CO2 molecule, while the carbon atom bendsdown to bind to the oxygen atom of the top surface layer(dC–OSUF = 1.36 Å), as shown in Fig. 12(a). One of the CO2oxygen atoms (O1) binds to one of the nearest Cu atoms(CuA) in the top layer with a bond distance dO1–CuA = 1.84 Å,while the second oxygen (O2) binds to another surface copperatom with a bond distance dO2–CuB = 1.86 Å, causing theCu–O distances of CuA and CuB to their neighbouring surfaceoxygen atoms to change from 2.10 and 2.18 Å to 1.83 and1.84 Å, respectively. The CO2 molecule bends to an angleof ∠CO2 = 123.6◦ and adsorbs strongly with an adsorption
TABLE VI. The adsorption energies and the characteristic parameter valuesof the CO2 adsorbed geometry in the (1×1) and the (1×2) supercell of theCu2O(110):Cu surface.
SupercellEads
(kJ/mol)∠CO2
(deg)dC–O1
(Å)dC–O2
(Å)dO1–CuA
(Å)dO1–CuB
(Å)dC–OSUF
(Å)
(1×1) −100.4 128.0 1.26 1.26 1.97 1.97 1.45(1×2) −116.7 126.2 1.26 1.26 1.89 1.89 1.42
Reuse of AIP Publishing content is subject to the terms: https://publishing.aip.org/authors/rights-and-permissions. Downloaded to IP: 128.41.35.117 On: Mon, 17 Oct
2016 15:01:07
044709-10 Mishra, Roldan, and de Leeuw J. Chem. Phys. 145, 044709 (2016)
TABLE VII. Vibrational frequencies (cm−1) and Bader charges (e−) comparison of the atoms in the adsorbedCO2 molecule and the Cu2O(110):Cu surface atoms bonded with the molecule to that of in the isolated CO2molecule and the bare surface in the (1×2) supercell.
Atoms and vibrational modes C O1 O2 CuA CuB OSUF υas υs υb
After CO2 adsorption 2.07 −1.09 −1.10 0.56 0.56 −1.04 1639 1247 808Isolated CO2 molecule 2.08 −1.04 −1.04 . . . . . . . . . 2355 1316 632Bare surface . . . . . . . . . 0.44 0.44 −0.95 . . . . . . . . .
FIG. 12. The CO2 molecule adsorbed on the Cu2O(110):Cu–O terminated surface in the (2×1) cell in (a) config. 1 and (b) config. 2.
energy Eads = −138.1 kJ/mol. In this configuration, the C–Obond length is 1.27 Å, which is slightly longer than the normalbond length in a CO2 molecule. The adsorption energy andgeometrical parameters of the system are given in Table VIII.Bader charge analysis (Table IX) reveals that the O1 and O2oxygen atoms of the CO2 molecule gain 0.13 and 0.10e− incharge density, respectively. Meanwhile, the surface copperatoms, CuA and CuB, which are bound to the O1 and O2 losea charge density of 0.49 and 0.39e−, respectively, while thesurface oxygen atom (OSUF) bound to the carbon atom of theCO2 molecule gains 0.14e−. Hence, upon CO2 adsorption,a large charge redistribution occurs at the surface. Thisstrong adsorption and activation of the CO2 molecule arereflected in changes in the vibrational frequencies, as listedin Table IX.
In the second configuration (config. 2) (Fig. 12(b)), thecarbon atom binds to the OSUF atom (dC–OSUF = 1.35 Å) andO1 binds to CuA (dO1–CuA = 1.85 Å) in the top layer. TheCO2 molecule bends so that O2 binds with CuB of the second
TABLE VIII. The adsorption energies and the characteristic parametervalues of the CO2 adsorbed geometry in the (2×1) supercell of theCu2O(110):Cu–O surface in config. 1 and config. 2.
SupercellEads
(kJ/mol)∠CO2
(deg)dC–O1
(Å)dC–O2
(Å)dO1–CuA
(Å)dO2–CuB
(Å)dC–OSUF
(Å)
Config. 1
(2×1) −138.1 123.6 1.27 1.27 1.84 1.86 1.36Config. 2
(2×1) −169.9 122.7 1.27 1.30 1.85 1.86 1.35
layer (dO2–CuB = 1.86 Å), as shown in Fig. 12(b). In thisconfiguration, we found that CO2 binds more strongly with anadsorption energy of about −170.0 kJ/mol. CO2 bends to anangle of ∠CO2 = 122.7◦ which indicates stronger activation(Table VIII). Oxygen–carbon bond lengths, i.e., dC–O1 anddC–O2, are found to be 1.27 Å and 1.30 Å, respectively. AfterCO2 adsorption, the Cu–O bonds in the top of the surfacechange from 2.10 Å and 2.18 Å to 1.86 Å and 1.82 Å forCuA and CuB, respectively. Bader charge analysis (Table IX)shows that the oxygen atoms O1 and O2 of the CO2 moleculegain −0.13 and −0.08e−, respectively, while the change in thecarbon atom charge is negligible. The surface copper atomCuA bonded to one of the oxygen atoms of the CO2 moleculebecomes more positively charged with a loss of 0.26e−, whilethe surface oxygen atom OSUF gains 0.23e−. Charge transferto CuB is negligible. This charge transfer, the adsorptionenergy, geometry changes together with large changes invibrational frequencies (Table IX) indicates activation of theCO2 molecule.
3. Cu2O(001) surface
a. (001):Cu. The (1 × 1) cell (a = 4.27 Å, b = 4.27 Å) istoo small to study adsorption of the isolated molecule, as wediscovered earlier that the interaction between neighbouringCO2 molecules affects the geometry and adsorption energies.Hence, we carried out calculations on the (2 × 2) supercellto minimize the effect of interactions between periodicimages. Similar to the other surfaces, we studied differentsites at the surface for possible CO2 adsorption. In the firstadsorption configuration (config. 1), oxygens O1 and O2of the molecule bind to the nearest topmost copper atoms
Reuse of AIP Publishing content is subject to the terms: https://publishing.aip.org/authors/rights-and-permissions. Downloaded to IP: 128.41.35.117 On: Mon, 17 Oct
2016 15:01:07

044709-11 Mishra, Roldan, and de Leeuw J. Chem. Phys. 145, 044709 (2016)
TABLE IX. Vibrational frequencies (cm−1) and Bader charges (e−) comparison of the atoms in the adsorbedCO2 molecule and the Cu2O(110):Cu–O surface atoms bonded with the molecule to that of in the isolated CO2molecule and the bare surface in config. 1 and config. 2 of (2×1) supercell.
Atoms and vibrational modes C O1 O2 CuA CuB OSUF υas υs υb
After CO2 adsorption (config. 1) 2.07 −1.14 −1.17 0.91 0.81 −1.03 1580 1291 869After CO2 adsorption (config. 2) 2.07 −1.17 −1.12 0.53 0.69 −1.12 1508 1250 851Isolated CO2 molecule 2.08 −1.04 −1.04 . . . . . . . . . 2355 1316 632Bare surface . . . . . . . . . 0.42 0.42 −0.89 . . . . . . . . .
FIG. 13. The CO2 molecule adsorbed on the Cu2O(001):Cu terminated surface in the (2×2) cell in (a) config. 1 and (b) config. 2.
CuA and CuB with bond distances of 1.85 and 1.87 Å,respectively (Fig. 13(a)). The CO2 molecule bends to anangle of 121.5◦ as the carbon atom moves down to bind withthe nearest available oxygen atom (OSUF) of the top layerwith a bond length dC–OSUF of 1.35 Å. Upon CO2 adsorption,the bond between CuB and OSUF is broken, as shown inFig. 8(a). The adsorption energy, Eads, calculated for thisconfiguration is −138 kJ/mol. Carbon–oxygen bond lengthsin the CO2 molecule are found to be 1.29 and 1.28 Å forO1 and O2, respectively. Copper–oxygen bond lengths in thesurface for CuA and CuB change from 1.88 to 1.84 Å and 1.86Å, respectively (Table X). Bader charge analysis (Table XI)shows significant charge transfer between the CO2 moleculeand the surface atoms. After CO2 adsorption, both O1 and O2oxygens of the CO2 molecule lose charge density of 0.24e−
and 0.22e−, respectively, while surface copper atoms CuAand CuB which bind to these two oxygen atoms lose chargedensity of 0.12 and 0.10e−, respectively. However, the carbon
atom gains 0.56e− after binding to surface oxygen atom OSUF,which loses 0.12e−. Hence, charge transfer has occurred tothe CO2 molecule from nearby surface atoms. As shown inTable XI, we note considerable changes in the frequencies ofthe different vibrational modes (υas = 1509, υs = 1281, andυb = 869 cm−1) of the activated CO2 molecule on this surface.
In another configuration (config. 2) the CO2 moleculeremains almost parallel to the surface, as shown in Fig. 13(b).The carbon atom binds to a top oxygen atom (OSUF)(dC–OSUF = 1.32 Å), while one oxygen (O1) of the CO2molecule binds to surface copper atoms CuA and CuB, withbond lengths 1.95 and 1.91 Å, respectively. The second oxygenatom (O2) of the molecule binds to another surface copperatom, CuC with a bond length of 1.91 Å. In the adsorbed CO2molecule we find O–C bond lengths of 1.32 and 1.27 Å foroxygen atoms O1 and O2, respectively, and the CO2 angle is∠CO2 = 121.7◦. The adsorption energy in this configurationis −98.7 kJ/mol, which is almost 40 kJ/mol less than in the
TABLE X. The adsorption energies and the characteristic parameter values of the CO2 adsorbed geometry in the(2×2) supercell of Cu2O(001):Cu surface in config. 1 and config. 2.
SupercellEads
(kJ/mol)∠CO2
(deg)dC–O1
(Å)dC–O2
(Å)dO1–CuA
(Å)dO1–CuB
(Å)dO2–CuB
(Å)dO2–CuC
(Å)dC–OSUF
(Å)
Config. 1
(2×2) −138.1 121.5 1.29 1.28 1.85 . . . 1.87 . . . 1.35
Config. 2
(2×2) −98.7 121.7 1.32 1.27 1.95 1.91 . . . 1.91 1.32
Reuse of AIP Publishing content is subject to the terms: https://publishing.aip.org/authors/rights-and-permissions. Downloaded to IP: 128.41.35.117 On: Mon, 17 Oct
2016 15:01:07

044709-12 Mishra, Roldan, and de Leeuw J. Chem. Phys. 145, 044709 (2016)
TABLE XI. Vibrational frequencies (cm−1) and Bader charges (e−) comparison of the atoms in the adsorbed CO2molecule and Cu2O(001):Cu surface atoms bonded with the molecule to that of in the isolated CO2 molecule andthe bare surface in config. 1 and config. 2 of (2×2) supercell.
Atoms and vibrational modes C O1 O2 CuA CuB CuC OSUF υas υs υb
After CO2 adsorption (config. 1) 1.52 −0.80 −0.82 0.46 0.44 . . . −0.77 1509 1281 869After CO2 adsorption (config. 2) 1.86 −0.96 −1.11 0.59 0.61 0.65 −0.93 1461 1242 875Isolated CO2 molecule 2.08 −1.04 −1.04 . . . . . . . . . . . . 2355 1316 632Bare surface . . . . . . . . . 0.34 0.34 0.51 −0.89 . . . . . . . . .
FIG. 14. The variation of CO2 activation (∠OCO) (a) and adsorption energy (Eads) (b) with surface energies of different surfaces. For the sake of simplicity wehave plotted only lowest coverage values of only those configurations that show strongest binding with CO2.
first configuration (Table X). The Bader charge analysis showscharge redistribution, with oxygen O1 losing 0.08e− chargedensity, while the CuA and CuB atoms also lose 0.25e− and0.27e−, respectively. Oxygen atom O2 gains 0.07e− chargedensity after binding to surface copper atom CuC, which loses0.14e−. Charge transfer also occurs between surface oxygenatom, OSUF and the C atom which gains 0.22e−, while OSUFgains 0.04e− (Table XI). Here again, we note considerablechanges in the vibrational frequencies of the adsorbed CO2molecule, as shown in Table XI.
C. CO2 adsorption trends in copper oxides
We noted that the activation of the CO2 molecule isrelated to the adsorption energy, as shown in Fig. 14(a),where we considered the molecule’s angle as a measureof its activation.50 Furthermore, the adsorption energy, Eads,depends almost linearly on the surface stability (Fig. 14(b)):The most stable (111):O surface shows weak adsorption(approximately −56 kJ/mol) and the CO2 molecule remainslinear, while the least stable (111):Cu surface shows thestrongest binding (Eads = −233 kJ/mol) with the CO2 moleculebent to 119.2◦. The second most stable surface, (110):Cu,shows an adsorption energy of approximately −117 kJ/mol,while the (001):Cu surface, binds the CO2 molecule withthe release of ∼138 kJ/mol, with the CO2 molecule bendingto 126.2 and 121.5◦, respectively. This trend is similar tothat found in CO2 adsorption on CuO surfaces, where themost stable surface, (111), shows weak binding of the CO2molecule compared with other low index surfaces, whichcause significant CO2 activation.11
IV. SUMMARY AND CONCLUSIONS
Using DFT+U methodology, we have studied thereconstructions of the (111), (110), and (001) surfacesand proposed different non-polar terminations. We furtheranalysed the structural geometries, energetics, and electronicproperties for the process of carbon dioxide adsorption todifferent stoichiometric Cu2O surfaces, at different coverages.While the CO2 adsorption to stoichiometric Cu2O(111):Ois weak, causing no significant changes to the geometryor electronic structure of the adsorbate, CO2 adsorption toall other surfaces is energetically favourable. The (110):Cusurface, which is only less stable by ∼0.16 J/m2 compared tothe most stable (111):O surface, shows adsorption energiesup to approximately −117 kJ/mol, while the third most stable(110):Cu–O surface exhibits strong chemisorption of the CO2molecule, releasing∼170 kJ/mol. We found that CO2 coverageaffects the adsorption energy as Eads increases for all surfacesat lower coverage, where CO2 is found to be chemisorbed asthe CO2
− anion. The Cu2O(111) surface with Cu terminationis found to be the least stable surface and a detailed structuraland Bader charge analysis shows that the CO2 molecule affectsthe surface geometry, rearranging itself to resemble a [CO3]−species on the surface.
Activation of carbon dioxide is the most importantstep in its conversion into valuable chemicals and largestructural transformations and significant charge transferbetween different surfaces and the CO2 molecule demonstratethat Cu2O is capable of activating CO2. For all the bentCO2 configurations, we note a significant red-shift on theC–O symmetric (υs) and asymmetric (υas) stretching modesrelative to the linear gas phase molecule, indicating that the
Reuse of AIP Publishing content is subject to the terms: https://publishing.aip.org/authors/rights-and-permissions. Downloaded to IP: 128.41.35.117 On: Mon, 17 Oct
2016 15:01:07

044709-13 Mishra, Roldan, and de Leeuw J. Chem. Phys. 145, 044709 (2016)
CO2 molecule is considerably activated. It is worth noting,however, that our calculations are valid only at 0 K andonly stoichiometric surfaces were considered in the presentstudy. Nevertheless, the results presented in this paper providefundamental mechanistic insights into CO2 activation onstoichiometric (111), (110), and (001) surfaces, which will stillbe relevant to our general understanding of CO2 adsorptionby Cu2O, as the different surfaces studied here include a widevariety of the kind of surface sites, that can be expected tooccur on experimental surfaces.
SUPPLEMENTARY MATERIAL
The reconstructed unrelaxed surface structures of(111):Cu, (110):Cu, (110):CuO–O, and (001):Cu are givenas Figs. S1–S4 in the supplementary material, respectively.
ACKNOWLEDGMENTS
This work was carried out as part of the Engineeringand Physical Sciences Research Council (EPSRC) “4CU”programme grant, aimed at sustainable conversion of carbondioxide into fuels, led by The University of Sheffieldand carried out in collaboration with University CollegeLondon, University of Manchester, and Queens UniversityBelfast. The authors acknowledge the EPSRC for supportingthis work financially (Grant Nos. EP/K001329/1 andEP/K035355/1). Via our membership of the UK’s HECMaterials Chemistry Consortium, which is funded by EPSRC(Grant No. EP/L000202), this work used the ARCHERUK National Supercomputing Service (http://www.archer.ac.uk). The authors also acknowledge the use of the IRIDISHigh Performance Computing Facility, and associated supportservices at the University of Southampton, in the completionof this work. N.H.d.L. thanks the Royal Society for an IndustryFellowship.
1Y. Hori, in Modern Aspects of Electrochemistry, edited by C. Vayenas, R.White, and M. Gamboa-Aldeco (Springer, New York, 2008), Vol. 42, Chap.3, pp. 89–189.
2M. Gattrell, N. Gupta, and A. Co, J. Electroanal. Chem. 594, 1 (2006).3J. Szanyi and D. W. Goodman, Catal. Lett. 10, 383 (1991).4T. Matsumoto, R. A. Bennett, P. Stone, T. Yamada, K. Domen, and M.Bowker, Surf. Sci. 471, 225 (2001).
5S. Y. Lee, N. Mettlach, N. Nguyen, Y. M. Sun, and J. M. White, Appl. Surf.Sci. 206, 102 (2003).
6A. K. Mishra and N. H. de Leeuw, “Mechanistic insights into the Cu(I) oxide-catalyzed conversion of CO2 to fuels and chemicals: A DFT approach,” J.CO2 Util. (in press).
7M. Le, M. Ren, Z. Zhang, P. T. Sprunger, R. L. Kurtz, and J. C. Flake,J. Electrochem. Soc. 158, E45 (2011).
8G. Ghadimkhani, N. R. de Tacconi, W. Chanmanee, C. Janaky, and K.Rajeshwar, Chem. Commun. 49, 1297 (2013).
9C. Wang, L. Yin, L. Zhang, D. Xiang, and R. Gao, Sensors (Basel) 10, 2088(2010).
10O. Lupan, V. Cretu, V. Postica, N. Ababii, O. Polonskyi, V. Kaidas, F. Schütt,Y. K. Mishra, E. Monaico, I. Tiginyanu, V. Sontea, T. Strunskus, F. Faupel,and R. Adelung, Sens. Actuators, B 224, 434 (2016).
11V. Cretu, V. Postica, A. K. Mishra, M. Hoppe, I. Tiginyanu, Y. K. Mishra, L.Chow, N. H. de Leeuw, R. Adelung, and O. Lupan, J. Mater. Chem. 4, 6527(2016).
12A. K. Mishra, A. Roldan, and N. H. de Leeuw, J. Phys. Chem. C 120, 2198(2016).
13Z. K. Zheng, B. B. Huang, Z. Y. Wang, M. Guo, X. Y. Qin, X. Y. Zhang, P.Wang, and Y. Dai, J. Phys. Chem. C 113, 14448 (2009).
14B. Z. Sun, W. K. Chen, and Y. J. Xu, J. Chem. Phys. 133, 154502 (2010).15C. Li, F. Wang, S. F. Li, Q. Sun, and Y. Jia, Phys. Lett. A 374, 2994
(2010).16B. Z. Sun, W. K. Chen, X. Wang, Y. Li, and C. H. Lu, Chin. J. Inorg. Chem.
24, 340 (2008).17W.-K. Chen, B.-Z. Sun, X. Wang, and C.-H. Lu, J. Theor. Comput. Chem.
7, 263 (2008).18H. Wu, N. Zhang, Z. Cao, H. Wang, and S. Hong, Int. J. Quantum Chem.
112, 2532 (2012).19H. Wu, N. Zhang, H. Wang, and S. Hong, Chem. Phys. Lett. 568-569, 84
(2013).20Y. Tan, X. Xue, Q. Peng, H. Zhao, T. Wang, and Y. Li, Nano Lett. 7, 3723
(2007).21M. Pang and H. C. Zeng, Langmuir 26, 5963 (2010).22Y. Sui, W. Fu, H. Yang, Y. Zeng, Y. Zhang, Q. Zhao, Y. Li, X. Zhou, Y. Leng,
M. Li, and G. Zou, Cryst. Growth Des. 10, 99 (2009).23X. Zhao, Z. Bao, C. Sun, and D. Xue, J. Cryst. Growth 311, 711 (2009).24S. Sun, F. Zhou, L. Wang, X. Song, and Z. Yang, Cryst. Growth Des. 10, 541
(2009).25S. Sun, C. Kong, S. Yang, L. Wang, X. Song, B. Ding, and Z. Yang,
CrystEngComm 13, 2217 (2011).26S. Sun, X. Song, Y. Sun, D. Deng, and Z. Yang, Catal. Sci. Technol. 2, 925
(2012).27E. L. Uzunova, N. Seriani, and H. Mikosch, Phys. Chem. Phys. 17, 11088
(2015).28L. I. Bendavid and E. A. Carter, J. Phys. Chem. C 117, 26048 (2013).29L. Wang, T. Maxisch, and G. Ceder, Phys. Rev. B 73, 174112 (2006).30L. Y. Isseroff and E. A. Carter, Phys. Rev. B 85, 235142 (2012).31M. Nolan and S. D. Elliott, Phys. Chem. Chem. Phys. 8, 5350 (2006).32D. O. Scanlon, B. J. Morgan, and G. W. Watson, J. Chem. Phys. 131, 124703
(2009).33C. E. Ekuma, V. I. Anisimov, J. Moreno, and M. Jarrell, Eur. Phys. J. B 87,
23 (2014).34G. Kresse and J. Hafner, Phys. Rev. B 47, 558 (1993).35G. Kresse and J. Hafner, Phys. Rev. B 49, 14251 (1994).36G. Kresse and J. Furthmüller, Comput. Mater. Sci. 6, 15 (1996).37G. Kresse and J. Furthmüller, Phys. Rev. B 54, 11169 (1996).38S. L. Dudarev, G. A. Botton, S. Y. Savrasov, C. J. Humphreys, and A. P.
Sutton, Phys. Rev. B 57, 1505 (1998).39J. P. Perdew, K. Burke, and M. Ernzerhof, Phys. Rev. Lett. 77, 3865 (1996).40J. P. Perdew, K. Burke, and M. Ernzerhof, Phys. Rev. Lett. 78, 1396
(1997).41G. W. Watson, E. T. Kelsey, N. H. de Leeuw, J. D. Harris, and S. C. Parker,
J. Chem. Soc., Faraday Trans. 92, 433 (1996).42P. W. Tasker, J. Phys. C: Solid State Phys. 12, 4977 (1979).43H. J. Monkhorst and J. D. Pack, Phys. Rev. B 13, 5188 (1976).44G. Wulff, Z. Kristallogr. 34, 449 (1901).45S. Grimme, J. Comput. Chem. 27, 1787 (2006).46A. Werner and H. D. Hochheimer, Phys. Rev. B 25, 5929 (1982).47A. Soon, M. Todorova, B. Delley, and C. Stampfl, Phys. Rev. B 75, 125420
(2007).48J. A. Assimos and D. Trivich, Phys. Status Solidi A 26, 477 (1974).49B. Z. Sun, W. K. Chen, X. Wang, and C. H. Lu, Appl. Surf. Sci. 253, 7501
(2007).50H. J. Freund and M. W. Roberts, Surf. Sci. Rep. 25, 225 (1996).
Reuse of AIP Publishing content is subject to the terms: https://publishing.aip.org/authors/rights-and-permissions. Downloaded to IP: 128.41.35.117 On: Mon, 17 Oct
2016 15:01:07