Embed Size (px)
Citation preview
SETC2013
JSAE 20139130 / SAE 2013-32-9130
A demonstration of emissions’ behaviour of various handheld engines including investigations on particulate matter
Cécile Favre, John May, Dirk Bosteels Association for Emissions Control by Catalyst (AECC) AISBL
Jürgen Tromayer, Gerd Neumann Institute for Internal Combustion Engines and Thermodynamics (IVT), Graz University of Technology
Copyright © 2013 SAE Japan and Copyright © 2013 SAE International
ABSTRACT
To get an overview of the emission situation in the field of small non-road mobile machinery powered by various types of SI engines, the Association for Emissions Control by Catalyst (AECC), together with the Institute for Internal Combustion Engines and Thermodynamics (IVT) of Graz University of Technology, conducted a customized test program. The main goal for this campaign was to derive information regarding the emissions of regulated gaseous components (following European Directive 97/68/EC) as well as particulate matter. With regard to the big variety of different engines that are available on the European and North-American market, the most representative ones had to be chosen. This resulted in a pool of test devices to cover different engine working principles (2-Stroke and 4-Stroke), technological standards (low-cost and professional tools) and different emissions control strategies (advanced combustion and exhaust gas aftertreatment). The test results illustrate a wide range of emissions’ behaviour depending on engine technologies and testing conditions and can serve as a database of in-field emissions of small handheld applications. Particulate matter emissions were also measured in terms of mass and number and their chemical composition was evaluated via Thermo-Gravimetric Analysis of the PM deposit.
INTRODUCTION
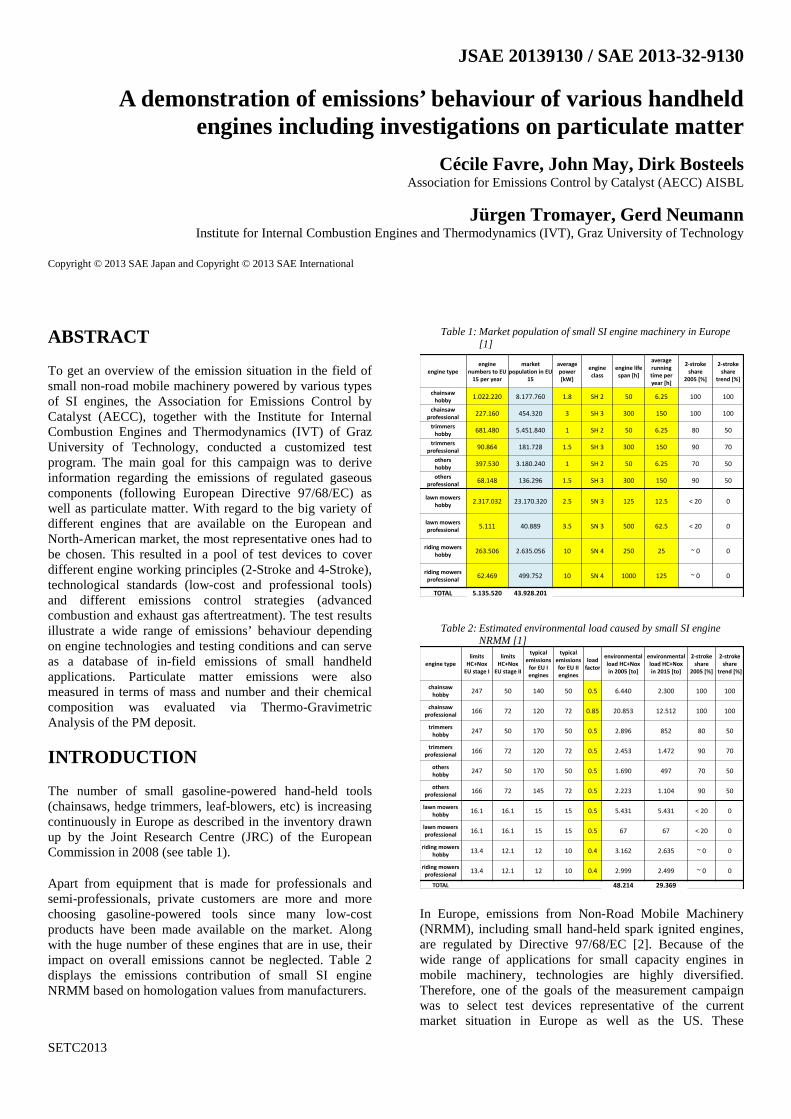
The number of small gasoline-powered hand-held tools (chainsaws, hedge trimmers, leaf-blowers, etc) is increasing continuously in Europe as described in the inventory drawn up by the Joint Research Centre (JRC) of the European Commission in 2008 (see table 1).
Apart from equipment that is made for professionals and semi-professionals, private customers are more and more choosing gasoline-powered tools since many low-cost products have been made available on the market. Along with the huge number of these engines that are in use, their impact on overall emissions cannot be neglected. Table 2 displays the emissions contribution of small SI engine NRMM based on homologation values from manufacturers.
Table 1: Market population of small SI engine machinery in Europe [1]
Table 2: Estimated environmental load caused by small SI engine NRMM [1]
In Europe, emissions from Non-Road Mobile Machinery (NRMM), including small hand-held spark ignited engines, are regulated by Directive 97/68/EC [2]. Because of the wide range of applications for small capacity engines in mobile machinery, technologies are highly diversified. Therefore, one of the goals of the measurement campaign was to select test devices representative of the current market situation in Europe as well as the US. These
engine typeengine
numbers to EU 15 per year
marketpopulation in EU
15
average power [kW]
engineclass
engine life span [h]
average running time per year [h]
2-strokeshare
2005 [%]
2-strokeshare
trend [%]
chainsawhobby 1.022.220 8.177.760 1.8 SH 2 50 6.25 100 100
chainsawprofessional 227.160 454.320 3 SH 3 300 150 100 100
trimmershobby 681.480 5.451.840 1 SH 2 50 6.25 80 50
trimmersprofessional 90.864 181.728 1.5 SH 3 300 150 90 70
othershobby 397.530 3.180.240 1 SH 2 50 6.25 70 50
othersprofessional 68.148 136.296 1.5 SH 3 300 150 90 50
lawn mowershobby 2.317.032 23.170.320 2.5 SN 3 125 12.5 < 20 0
lawn mowersprofessional 5.111 40.889 3.5 SN 3 500 62.5 < 20 0
riding mowershobby 263.506 2.635.056 10 SN 4 250 25 ~ 0 0
riding mowersprofessional 62.469 499.752 10 SN 4 1000 125 ~ 0 0
TOTAL 5.135.520 43.928.201
engine typelimits
HC+NoxEU stage I
limitsHC+Nox
EU stage II
typicalemissions
for EU Iengines
typicalemissionsfor EU IIengines
loadfactor
environmentalload HC+Noxin 2005 [to]
environmentalload HC+Noxin 2015 [to]
2-strokeshare
2005 [%]
2-strokeshare
trend [%]
chainsawhobby 247 50 140 50 0.5 6.440 2.300 100 100
chainsawprofessional 166 72 120 72 0.85 20.853 12.512 100 100
trimmershobby 247 50 170 50 0.5 2.896 852 80 50
trimmersprofessional 166 72 120 72 0.5 2.453 1.472 90 70
othershobby 247 50 170 50 0.5 1.690 497 70 50
othersprofessional 166 72 145 72 0.5 2.223 1.104 90 50
lawn mowershobby 16.1 16.1 15 15 0.5 5.431 5.431 < 20 0
lawn mowersprofessional 16.1 16.1 15 15 0.5 67 67 < 20 0
riding mowershobby 13.4 12.1 12 10 0.4 3.162 2.635 ~ 0 0
riding mowersprofessional 13.4 12.1 12 10 0.4 2.999 2.499 ~ 0 0
TOTAL 48.214 29.369

SETC2013
machines were operated on an engine test bench under steady-state conditions according to the regulatory test procedure using two engine set-points. Gaseous emissions in each of the two operating points were measured over a certain time. To get more detailed information on the potential formation of emissions as well as the engine stability, several relevant parameters like gaseous emissions, fuel consumption and temperatures were recorded over the whole test duration. Emissions of particulate matter were also measured in terms of mass and number, using a gravimetric measurement method and a particle counter respectively, as defined in current European legislations for emissions from on-road Heavy-duty engines and Light-duty vehicles. Finally, collected particulate matter samples were subjected to a Thermo Gravimetric Analysis (TGA) to identify the mass fraction of organic and elemental carbon. Test results illustrate a wide range of emissions’ behaviour depending on engine technologies and testing conditions and can serve as a database for in-field emissions of small hand-held applications.
LEGISLATIVE BOUNDARY CONDITIONS FOR NON ROAD MOBILE MACHINERY
According to Annex I, section 1 of [2], the European Directive 1997/68/EC applies to all engines to be installed in non-road mobile machinery (NRMM) and to secondary engines fitted into vehicles intended for passenger or goods transport on the road.(…)
Additionally, in order to be covered by this Directive, the engines have to be installed in machinery which meets the following specific requirements:
A. intended and suited, to move, or to be moved with or without road, and with
(i) a C.I. engine having a net power* that is higher than or equal to 19 kW but not more than 560 kW and that is operated under intermittent speed rather than a single constant speed; or
(ii) a C.I. engine having a net power* that is higher than or equal to 19 kW but not more than 560 kW and that is operated under constant speed. Limits only apply from 31 December 2006; or
(iii) a petrol fuelled S.I. engine having a net power* of not more than 19 kW; or (…)
*shall mean the power in ‘EEC kW’ obtained on the test bench at the end of the crankshaft, or its equivalent, measured in accordance with the EEC method of measuring the power of internal combustion engines for road vehicles as set out in Directive 80/1269/EEC (…).
The aim of the investigations shown in this paper was to focus on SI engines as described in A.(iii) that are used for hand-held applications such as chainsaws, brushcutters, leaf blowers etc., which are defined in Article 2 of [2] as follows:
— hand-held engine shall mean an engine that meets at least one of the following requirements:
(a) the engine must be used in a piece of equipment that is carried by the operator throughout the performance of its intended function(s);
(b) the engine must be used in a piece of equipment that must operate multipositionally, such as upside down or sideways, to complete its intended function(s);
(c) the engine must be used in a piece of equipment for which the combined engine and equipment dry weight is under 20 kilograms and at least one of the following attributes is also present:
(i) the operator must alternatively provide support or carry the equipment throughout the performance of its intended function(s);
(ii) the operator must provide support or attitudinal control for the equipment throughout the performance of its intended function(s);
(iii) the engine must be used in a generator or a pump
Furthermore, Article 9a of [2] divides SI engines into different classes:
Main class S: small engines with a net power ≤ 19 kW
The main class S shall be divided into two categories:
H: engines for hand-held machinery
N: engines for non-hand-held machinery
In addition to this classification, 3 sub-categories of SH engines are defined:
Table 3: SH class definition [2]
Class/category Displacement [cm³]
Class SH:1 < 20
Class SH:2 ≥ 20
< 50
Class SH:3 ≥ 50
According to section 3.5 of Annex IV of [2], for type-approval of small SI engines used in hand-held equipment, the so called engine dyno test cycle “G3” (see table 4) applies.

SETC2013
Table 4: G3 cycle specification [2]
Test Cycle G3
Mode number 1 2
Engine speed Rated speed Low-idle speed
Load [%] 100 0
Weighting factor 0.85 0.15
This means that the test engine has to be operated in two modes (idle and Wide Open Throttle - WOT). Each mode sampling time shall be at least 180 s. The exhaust emission concentration values shall be measured and recorded for the last 120 s of the respective sampling time. For each measuring point, the mode length shall be of sufficient duration to achieve thermal stability of the engine prior to the start of sampling. All components may optionally be measured directly in the dilution tunnel, or by sampling into a bag and subsequent measurement of the concentration in the sampling bag.
After receiving the emission concentrations, the values have to be weighted according to Equation 1 shown below:
Equation 1: Calculation of reference performance
The reference power is calculated out of the operation points by using the given weighting factors. In case of the G3 cycle, mode 1 means idle operation resulting in zero power output on the crankshaft. Consequently, the reference engine power becomes the power under WOT operation multiplied by the corresponding factor of 0.85.
Equation 2: Calculation of individual gas mass
The gas mass of each individual gaseous component can be calculated from the measurements at idle and WOT which are both multiplied by their respective weighting factors (15% for idle and 85% for WOT). The sum of both is then divided by the reference power. Apart from the regulated components, the PM and PN values were also measured and the evaluation was done following the same weighting procedure, which leads to the mass of particulates per kWh and the number of particles per kWh respectively. The fuel consumption evaluation was done in the same way. Thereby, a common basis for results comparison could be established.
Equation 3: Calculation of fuel consumption
The regulatory limits for gaseous emissions are defined separately for classes SH:1/2 and SH:3, and two different
stages exist. For both SH:1/2 and SH:3 categories of machines, the stage II emissions limits came into effect in 2007/2008. Hence, all the measurement results shown in the further content were compared to these stage II values, which are shown in table 5.
The regulated values for gaseous components are specified in g/kWh and they are related to engine power in the two steady-state operation points as described above. Basically, there is a limit for CO and the sum of HC and NOx but, in addition, the NOx output must not exceed 10 g/kWh.
Table 5: Emission limits for SH-classified machines [2]
Stage II limits
Class CO [g/kWh]
HC + NOx [g/kWh]
NOx [g/kWh]
SH:1 805 50
10 SH:2
SH:3 603 72
SELECTION OF TEST DEVICES
Due to the diversified market situation in the field of hand-held tools powered by small capacity SI engines, the selection of representative test carriers was an important issue. To achieve a significant results database, the selection was done with the objective to cover:
- Different working principles 2-stroke and 4-stroke
- Different technological levels Professional tools and low cost machines
- Different emission reduction strategies Advanced combustion / mixture preparation concepts and exhaust gas aftertreatment
Thus, the six test devices that were chosen for the intended measurements are listed with their specifications in table 6:
Table 6: Selected test carriers
There are two 4-stroke engines and four 2-stroke engines, since the market is dominated by 2-strokes due to their good
ID engine type specifications max. / idlespeed
ratedspeed
mixturepreparation
oil/fuelmixture ratio catalyst
4 strokedry sump lubricated
Displ. [𝐜𝐦𝟑]: 25.0 max. 11.0007.000 carburetor
dry sumplubrication
10W30NO
Power [kW]: 0.74 idle 2.800
4 strokefuel/oil mixture lubricated
Displ. [𝐜𝐦𝟑]:
Power [kW]:
28.4 max. 10.2008.000 carburetor synthetic oil 1:50 NO
0.96 idle 2.800
2 strokefuel/oil mixture lubricated
Displ. [𝐜𝐦𝟑]:
Power [kW]:
22.0 max. 9.0007.900 carburetor synthetic oil 1:50 wiremesh
catalyst0.62 idle 2.800
2 stroke fuel/oil mixture lubricated
Displ. [𝐜𝐦𝟑]:
Power [kW]:
45 max. 8.0008.000 carburetor
synthetic oil 1:50wiremesh
catalyst1.41 idle 2.800 mineral oil 1:50
2 strokefuel/oil mixture lubricated
stratified scavening
Displ. [𝐜𝐦𝟑]:
Power [kW]:
59.0 max. 13.00010.000 carburetor synthetic oil 1:50 NO
3.4 idle 2.800
2 strokefuel/oil mixture lubricated
fuel injection system
Displ. [𝐜𝐦𝟑]:
Power [kW]:
72.2 max. 10.1009.500 fuel injection synthetic oil 1:50 NO
4.03 idle 2.500
1
2
3
4
5
6

SETC2013
power-to-weight ratio and their low complexity. The displacements reach from 22 cm³ up to 72 cm³, covering a power output from 0.74 kW to 4 kW. The selected 4-strokes, which are both used in brushcutter applications, are using different lubrication principles. Engine #1 is equipped with a separate dry sump oil circuit, whilst engine #2 uses a mixture-based lubrication concept. In engine #2, the air/fuel/oil mixture is pumped throughout the whole engine, since the intake port is connected to the crankcase by a bypass bore. This system helps to keep the additional costs for a 4-stroke low. Furthermore, the machine can be refueled with the standard oil/fuel mixture used for 2-stroke engines. Both 4-stroke powered machines are intended for semi-professional use. They are not equipped with any exhaust gas aftertreatment device and use a carburetor for mixture preparation. Engine #3 is taken out of a brushcutter and engine #4 is powering a chainsaw. Both are representatives of the low-cost technology segment. These carbureted engines are not using any advanced combustion principle or mixture preparation concept and they are equipped with a wiremesh catalyst for exhaust gas aftertreatment. Device #4 is an Asian-imported tool. As an example of the professional tools range, engines #5 and #6 were chosen. They are both high-performance 2-strokes, #5 is powering a chainsaw and #6 a power cutter. Engine #5 uses a stratified scavenging process and engine #6 is equipped with a fuel injection system for mixture preparation.
Particulate matter emissions of engines #2 to #6 are expected to be impacted by oil. Basically, all manufacturers recommend the use of fully synthetic oils on their 2-strokes and mixture-lubricated 4-strokes. But, especially in the case of low-cost tools, most customers will not buy more expensive advanced lubricants and will use cheap mineral oils instead. In order to run a fair comparison of the different engines in terms of emissions, a single advanced biodegradable synthetic oil was used for all tests. In addition, one test with a mineral oil was conducted on the low-cost engine #4. This measurement was intended to evaluate the influence of oil on exhaust emissions.
TEST BENCH SETUP AND MEASUREMENT PROCEDURE
According to the Directive on emissions measurement of hand-held equipment that has been described above, the machines have to be tested on an engine dyno. The setup that was used (see figure 1) contains a flexible test rig designed to be able to carry different types of power tools. In this configuration the open end of the crankshaft with its original flywheel clutch is connected to a flexible clutch, followed by an intermediate shaft and a torque measurement flange that is screwed to the shaft of an electric brake (DC motor/generator, Pmax = 20kW, Tmax = 38 Nm, nmax = 11.800 rpm) The actuation of the throttle plate is done by a stepper motor. The exhaust gas is collected by an open CVS system. Hand-held machines are usually equipped with a flywheel clutch that engages at speeds higher than idle. This clutch was used also for the test bench runs, otherwise the inertia mass of the brake rotor has to be accelerated and decelerated by the machine continuously due to the speed irregularities in idle. By means of this configuration, impacts on idle operation caused by the test bench setup can be eliminated.
Since there is no connection between the crankshaft and the brake at low engine speeds, the engine speed has to be detected on the machine itself. This was done by measuring the trigger pulses of the ignition system.
Figure 1:
Engine dyno setup
The following parameters were measured over the whole running time:
- torque, power, engine speed
- fuel consumption
- spark plug seat temperature
- exhaust gas temperature at exhaust muffler
- emission concentration (diluted)
For the measurement of gaseous emissions, a Constant Volume Sampling method has to be applied. This means that the exhaust gas is sucked into a dilution tunnel where it is mixed with fresh air. For the measurement campaign, an open CVS configuration was chosen (see figure 2).
Figure 2: Exhaust gas sampling scheme
A roots blower is sucking a constant volumetric flow through the system. The exhaust gas as well as the dilution air are sucked into the CVS right after the tailpipe of the engine’s exhaust. Using such an open setup, impacts on the engine behaviour resulting from decreased backpressure in the exhaust system can be avoided. This can guarantee a situation as close as possible to in-field engine operation. After a certain pipe length, the gas passes a standard dilution tunnel to enable a homogeneous mixture of exhaust gas and ambient air. Out of the tunnel, the different probes are taken.

SETC2013
One is led over a conventional analyzer for CO, CO2, HC and NOx, which measures concentrations continuously. This continuous data was recorded to check the stability over engine run time. A partial flow of diluted exhaust gas as well as ambient air is also pumped into sampling bags for an overall evaluation of emissions. To be able to run the two-point test at once, two sets of bags were used. Apart from the gaseous composition measurement, probes for the particulate matter detection were added. An additional pump was installed to suck a portion of the gas through a positive displacement gas meter and the filter plate collecting particles for the gravimetric analysis (PM). To measure the number of particles (PN) emitted, a partial flow was lead through a Condensation Particle Counter (TSI™ 3010). In front of the particle counter, a dilution unit was used to achieve PN concentrations within the effective range of the analyzer. The system also included a heated evaporation tube to remove volatiles and measure dry and stable particles according to the PMP protocol defined in UN Regulation 83 [3].
The engines were operated with unleaded gasoline (RON 95) using the manufacturer’s carburetor setup without modifications. Fuel specifications are displayed in table 7:
Table 7: Test fuel specifications
Test fuel specifications
C 84.5 [%]
H 12.85 [%]
O 2.65 [%]
S <0.001 [%]
density 759.6 [kg/m³]
H:C ratio 1.81 -
O:C ratio 0.0235 -
calorific value 47.97 [MJ/kg]
After setting up the test bench equipment, adapting the machines and fitting all required sensors, the engines were subjected to a run-in procedure. They were all operated at WOT for at least 5 hours. During this procedure, the engine power was monitored and the engines were assumed to be completely run in once the power level was stabilized. The engines were then tested to measure their respective maximum power outputs and the corresponding engine speeds. Those maximum power output and engine speed were then used to establish the appropriate operating conditions of the G3 emissions test cycle.
The different levels of rated speed and power that were measured for the six engines can be seen in figure 3. Generally, the nominal values provided by the manufacturers (see table 6) are in accordance with the measured data.
Figure 3:
Determination of WOT power output and rated speed
The test schedule with regard to emissions was the following:
(1) Testing all test devices with full synthetic oil
- 2 measurements of PM with EMFAB™ filter plates and PN (CPC)
- 1 measurement of PM with TISSUQUARTZ™ filter plates and PN (CPC)
- 3 measurements of gaseous emissions of HC, CO, and NOx
(2) Testing one single test device with mineral oil
- 1 measurement of PM with TISSUQUARTZ™ filter plates and PN (CPC)
- 1 measurement of gaseous emissions of HC, CO, and NOx
(3) Testing two selected test devices with full synthetic oil
- 2 measurements of PM size distribution (SMPS)
- 2 measurements of gaseous emissions of HC, CO, and NOx
In the base program (1) all engines were analyzed in terms of gaseous emissions and particulate matter (mass and number). At least two measurements were conducted to check for repeatability. If they were both similar, the whole testing and measurement procedure was considered stable and reproducible enough to obtain valid results. During these two initial tests, particulate matter deposit was collected on EMFABTM filter plates which are used in standardized automotive tests. But these filter plates do not allow a Thermo Gravimetric Analysis as they are coated with PTFE which would be oxidized under high temperature. Therefore, additional tests with uncoated TISSUQUARTZ™ filter plates were conducted to obtain PM samples suitable for the TGA. During all tests the particle number measurement was done. Test series (2) was focusing on the impact of the lubricant to be used. The primary focus was on the chemical composition of the particulate deposit. Hence, this test was carried out using TISSUQUARTZ™ filter plates that allow for TGA.
Based on the results of the first tests, two representative test devices were chosen for a particulate size distribution
engi
ne p
ower
[kW
]
0.0
0.5
1.0
1.5
2.0
2.5
3.0
3.5
4.0
4.5
5.0
engine speed [rpm]0 2000 4000 6000 8000 10000 12000
engine power at rated speed
5
6
42
1 3idle speed

SETC2013
measurement (3) using a SMPS system. During this run, the synthetic oil was used. Before starting the measurements, sampling times had to be determined. This was done as displayed in figure 4. The engine speed and the temperatures of exhaust gas and spark plug seat were used to monitor thermal stability. After starting the engine and an initial idle period of 100 seconds, a WOT phase was applied to warm up the engine until temperatures reached stable values. Then the engine was operated in idle again and sampling started as soon as temperatures tended to stay constant. Both, sampling of PM and bag filling were started simultaneously but the PM collection time was extended to obtain enough mass of deposit. It turned out that the sampling time for PM was 10 minutes. This PM sampling time was then used for all further tests. As soon as the idle measurement was finished, the engine was operated under WOT and sampling started again after reaching thermal stability of the system.
Figure 4:
Determination of sampling times
Due to the fact that all engines except #1 are lubricated by an oil/fuel mixture, some influence on particulate matter measurement was expected from the sampling method, especially in terms of oil droplets possibly counted as particles. In absence of specific regulatory procedure to measure particle emissions from hand-held tools, the automotive standard was used [3]. The temperature of the heated tube used to remove volatiles adsorbed on particles is set to 350°C in the light-duty UN Regulation 83 [3]; this means a gas temperature of about 200°C. The impact of pre-heating on the particulate number measured was evaluated by comparing different temperatures of the evaporation tube (see figure 5).
Figure 5:
Evaporation temperature and particulate number
The maximum technically achievable temperature of the system used was 500°C (i.e. 300°C gas). Within this range (350-500°C), no significant impact on particulate numbers
was noticed. It is expected that an impact can only be measured at much higher gas temperatures when oil droplets are effectively removed. Further tests were conducted using the regulatory standard setup of 350°C.
RESULTS
In a first step, the fuel consumption was estimated to evaluate the efficiency of the different engine concepts. To ensure that there is no influence on the mixture preparation coming from the measurement system, a servo controlled positive displacement meter (AVL SORE PLU 110™ ) was used. This measurement unit does not create a pressure drop in the fuel line which is very important for carbureted engines. Additionally, the fuel consumption was calculated by means of a carbon balance based on the emission values measured in the sampling bags. The difference between calculated fuel mass flow and the measured values was within the range of +/-3% for all results, so the system accuracy for both the fuel flow monitoring as well as the emissions evaluation was considered appropriate.
Figure 6:
Fuel consumption results
Figure 6 displays the specific fuel consumption values in g/kWh. The highest fuel consumption is achieved by the standard 2-stroke engines (#3 and 4), most likely as a result from the higher scavenging losses. Next in line are the 4-strokes (#1 and 2). The two professional 2-strokes show the best results due to the advanced combustion (#5) and fuel metering (#6). A direct correlation between the level of complexity in engine layout and the efficiency can be observed. To get an insight on the combustion conditions, the A/F-ratio is an important parameter. Due to the fact that most of the tested engines are 2-strokes, the A/F-ratio could not be measured by means of an oxygen sensor. It was therefore calculated out of the CO/CO2 ratio in the exhaust gas, based on the Brettschneider equation [4]. It has to be noted that the calculation is only valid for rich combustion (λ<1).
engi
nesp
eed
[rpm
]
0
1000
2000
3000
4000
5000
6000
7000
8000
9000
10000
time [s]100 400 700 1000 1300 1600 1900 2200
exha
ust g
as te
mpe
ratu
re [°
C]
0
100
200
300
400
500
600
700sp
ark
plug
sea
t tem
pera
ture
[°C
]
0
50
100
150
200
250
engine speed exhaust gas temperature spark plug seat temperature
IDLE WOT
PM sampling PM sampling
engi
ne st
art
war
mup
bag
sam
plin
g
bag
sam
plin
g
0
2000
4000
6000
8000
10000
12000
0 10 20 30 40 50 60 70 80 90 100
PN [#
/cm
³] 6
000
lpm
dill
utio
n
time [s]
evaporation tube temperature 350°C ( 220°C gas temperature)evaporation tube temperature 500°C ( 300°C gas temperature)
0
100
200
300
400
500
600
700
fuel
cons
umpt
ion
[g/k
Wh]
Average fuel consumption [g/kWh]
1 2 3 4 5 6

SETC2013
Figure 7:
λ-values (calculated)
Figure 7 shows that all tested engines operated under rich conditions. The comparison shows the values for WOT and idle for each test device. The rich tuning of engines relates to the power output and thermal stress at WOT and to stability at idle. The low-cost 2-stroke (#4) shows the richest combustion at WOT (~λ=0.7), followed by the machine with stratified scavenging (#5) below λ=0.8. The other engines show comparable λ-values at WOT between 0.8 and 0.9. The error bars observed on engines #3 and #4 show that they are less controlled than the others.
Figure 8 provides information on the weighted specific CO emissions. The lowest CO values are achieved by one of the 2-strokes with catalyst (#3) and the 2-stroke with fuel injection system (#6). Engines #1, #2 and #5 are similar in terms of CO emissions.
Figure 8:
Specific CO emissions (weighted)
Basically, CO emissions can be linked to the A/F-ratio except for engine #3 where catalytic conversion helps reduce CO emissions. Machine #4 produces the highest
amount of CO. Despite the presence of a catalyst, the markedly rich tuning of the engine does not provide enough oxygen for sufficient CO conversion.
HC emissions results are illustrated in figure 9. 4-strokes have a clear advantage due to their reduced scavenging losses. HC control can be observed in the exhaust of engine #3 fitted with an oxidation catalyst. Both, the advanced scavenging process (#5) as well as the improved mixture preparation (#6) have a positive impact on scavenging losses and therefore reduce HC emissions. Again, engine #4 is performing the worst with such a rich exhaust that its oxidation catalyst cannot work properly.
Figure 9:
Specific HC emissions (weighted)
Figure 10:
Specific NOx emissions (weighted)
The comparatively low NOx emissions (figure 10) correspond to the typical behaviour of 2-stroke and 4-stroke engines operating in rich combustion mode. The 2-strokes produce much lower NOx which may be due to the internal EGR effects. Engines #3 and # 4 show the lowest values. All engines meet the legislative target of 10 g/kWh.
0,0
0,1
0,2
0,3
0,4
0,5
0,6
0,7
0,8
0,9
1,0
air/
fuel
ratio
calc
ulat
ed[-]
Calculated λ-values
IDLE
IDLE
IDLE
IDLE
IDLE
IDLE
WO
T
WO
T
WO
T
WO
T
WO
T
WO
T1 2 3 4 5 61 2 3 4 5 6
0
100
200
300
400
500
600
CO e
miss
ions
[g/k
Wh]
Average CO emissions [g/kWh]
1 2 3 4 5 6
0
10
20
30
40
50
60
HC e
miss
ions
[g/k
Wh]
Average HC emissions [g/kWh]
1 2 3 4 5 6
0
1
2
3
4
5
6
NO
xem
issio
ns[g
/kW
h]
Average NOx emissions [g/kWh]
1 2 3 4 5 6

SETC2013
Figure 11:
Specific HC+NOx emissions (weighted)
The regulated sum of HC+NOx emissions is shown in figure 11. The comparatively higher NOx values of the 4-strokes are compensated by the low HC emissions. The contribution of NOx to the HC+NOx sum is limited to 1 to 30%. Catalyst-equipped 2-stroke engine #3, with its lower values of both HC and NOx, shows good results too. The other engines produce significantly more HC+NOx whereas the worst result is achieved by the low-cost engine (#4). Error bars in figures 10 to 12 indicate that emissions are controlled in a comparatively less repeatable manner in engine #3. This could be an issue for long term stability of the system. Figure (14) shows how CO and HC+NOx emissions measurement results compare to regulatory Stage II limits.
Figure 12:
Specific emissions and legislative limits
Stage II limits for SH:1/2 apply to engines #1 to #4 while Stage II limits for SH:3 apply to engine #5 and 6. Almost all test devices meet the legislative targets of SH:1/2, even though #5 and #6 are homologated for SH:3. The low-cost machine (#4) is borderline, slightly exceeding the limits of HC+NOx. The best performance is achieved by the dry sump lubricated 4-stroke engine (#1).
As an open CVS setup was used, the background particle concentration had to be monitored to ensure the reliability of results. A baseline background sampling test showed that the number of particles as well as the PM deposited were far below the engines emissions levels and therefore could be neglected.
Figure 13:
Specific PM emissions (weighted)
The results of the particulate mass measurements (figure 13) show big differences amongst engine categories. The unit used in figure 13 allows for a direct comparison to PM standards in place in Europe for other applications (e.g. Stage IIIB and IV limits for NRMM CI engines is 25 mg/kWh) The dry sump lubricated 4-stroke (#1) produces the lowest amount by far; this may be explained by the separation of fuel and oil. Next in line are the 2-strokes with exhaust gas aftertreatment (#3 and 4) which indicates that there is a certain reduction of particles, or of the more heavy volatiles adsorbed onto PM, taking place in the catalyst. Finally, all the engines with mixture lubrication (#2, #5 and #6) produce much higher PM emissions.
Figure 14:
Specific PN emissions (weighted)
0
10
20
30
40
50
60
Average HC+NOx emissions [g/kWh]HC
+NO
xem
issio
ns[g
/kW
h]
1 2 3 4 5 6
HC
+ N
Ox
[g/k
Wh]
0
5
10
15
20
25
30
35
40
45
50
55
60
65
70
75
CO [g/kWh]0 100 200 300 400 500 600 700 800
SH 3 Limit
SH 1/25
6
2
1
3
4
0
200
400
600
800
1000
1200
1400
1600
PM e
miss
ions
[mg/
kWh]
Average PM emissions [mg/kWh]
1 2 3 4 5 6
1E+11
1E+12
1E+13
1E+14
1E+15
Average PN emissions [#/kWh]
PN e
miss
ions
[#/k
Wh]
1 2 3 4 5 6

SETC2013
PN results in figure 14 show that engine #1 also produces the lowest number of particles (2x10¹²/kWh). These values are one order of magnitude lower than for the second-best engine #3. The low-cost engine (#4) is no more at the same level as #3 when it comes to PN control. It produces almost the same number of particles (> 1014/kWh) as engines #2 and #6 which are not equipped with a catalyst. Engine #5 with stratified scavenging emits lower PN, at similar level to the catalyst-equipped engine #3 (~ 1013/kWh).
Figure 15:
Absolute PN for idle and WOT
To get a feel for how many particles are absolutely produced by these machines, the PN values per hour of engine operation are shown in figure 15 for idle as well as for WOT. It can be seen that the difference between the lowest and the highest value is about 3 orders of magnitude. The most important information that can be derived out of this graph is the ratio between particulate numbers during idle and full load operation at rated speed. The level of particles produced during 1 hour of operation is at least the same or even significantly higher in idle than during operation under load. This clearly points out the insufficiencies of the combustion at idle mode.
In figure 16, PM results are plotted against PN results. It shows that there is no particular correlation between the mass and number of particles.
As described in the measurement setup section, one aim of the test program was to evaluate the impact of oil on PM emissions. In that context, test device #4 was operated both with a fully synthetic oil as well as a mineral oil. Results are displayed in figure 17. Using mineral oil almost doubled the PM, but the already high PN remained identical. The conclusion that can be drawn out of these results is that the oil type is mainly influencing the particle size, not the number. For a detailed insight on these effects, an additional SMPS measurement would be of interest.
Figure 16:
Specific particulate mass and number emissions matrix (weighted)
Figure 17:
PM and PN comparison based on oil quality
Two of the engines were then tested for particle size distribution using a Scanning Mobility Particle Sizer. These tests had to be done separately from the main measurement campaign because of different dilution ratios that are required. Engines #2 and #3 were chosen since they differ in working principle and exhaust gas aftertreatment. The results graph (figure 18) shows the particle size distributions for engine #2 (in orange) and #3 (in grey), both for idle and WOT operation mode. Particles emitted during idle are smaller than during WOT operation for both engines whereas the difference is much bigger for engine #3. Generally, particles emitted by the mixture lubricated 4-stroke (#2) are bigger than the ones emitted by the 2-stroke with catalyst (#3). The correlating PN values for all 4 SMPS graphs can be seen in figure 15. There is no clear evidence whether the difference in mean particle size relates to the different combustion processes or to the catalytic oxidation. This could be further investigated.
PN e
mis
sion
s W
OT
[#/h
]
1011
1012
1013
1014
1015
1016
PN emissions IDLE [#/h]1011 1012 1013 1014 1015 1016
Absolute PN emissions
5
6
4
2
13
PN e
mis
sion
s [#
/kW
h]
1011
1012
1013
1014
1015
PM [mg/kWh]0 250 500 750 1000 1250 1500
Average PN & PM emissions
5
6
4
2
1
3
0
100
200
300
400
500
600
700
800
PM e
miss
ions
[mg/
kWh]
PM & PN with different oil quality
full
synt
hetic
oil
min
eral
oil
1E+11
1E+12
1E+13
1E+14
1E+15
full
synt
hetic
oil
min
eral
oil
PN e
miss
ions
[#/k
Wh]
4 4 4 4

SETC2013
Figure 18:
Particle size distribution results
As mentioned earlier, in addition to gravimetric and particle number measurements, one objective of the test campaign was to evaluate the composition of particulate matter. The particulate composition analysis was conducted by an external laboratory where the samples were supplied immediately after testing. The mineral oil PM samples were included too. To determine the volatile soot particles, the loaded filters were rolled up and placed in a pre-weighed quartz boat. Then the boat was weighed again and the sample weight could be calculated as the difference between second and first weighing. Thereafter, the loaded boat was placed in a sealable, heatable quartz tube. Nitrogen 5.0 (50 l/h) was passed through the tube. Successive, the following temperatures were set: Room temperature, 50, 100, 150, 200, 250, 300, 350, 400, 450 and 500 °C. After reaching the set value each temperature was held for 15 minutes. Subsequently, the sample was cooled in a nitrogen flow and weighed. The difference between two successive weighings corresponds to the volatile share in the respective soot temperature window. After determining the weight at 500 °C, the loaded boat was removed from the quartz tube and the soot was burned for two hours at 600 °C in air in a box furnace. Then the laden boat was weighed again. Finally, the amount of dry black carbon could be derived out of the weight before and after the soot combustion. Pyrolysis effects during the volatile share determination can be ruled out because the temperature in the nitrogen atmosphere was not increased above 500 °C. The resulting weight shares of Organic Carbon (OC) and Elemental Carbon (EC) evaluated by TGA are shown for idle (figure 19) and WOT (figure 20).
EC weight shares are only about 10 to 20 % in idle and 10% at WOT. This can result from the high amount of unburned fuel in the exhaust gas due to comparatively poor combustion as well as from the oil coming from the mixture lubrication. However, the dry sump lubricated engine (#1) shows a similar behaviour. Differences in weight shares between EC and OC are even bigger for WOT than for idle. At WOT the EC/OC distribution characteristics of the different engines become quite similar. Using the mineral oil increased the content of OC compared to synthetic oil.
Figure 19:
TGA results (idle)
Figure 20:
TGA results (WOT)
SUMMARY/CONCLUSIONS
6 state-of-the-art engines of Small Hand-Held equipment available in the EU and/or the US have been evaluated in terms of gaseous and particulate matter emissions. The selected pool of tools covered a wide range of technologies so as to obtain a diversified results database. By means of initial tests that served to evaluate the stability of results, a test and measurement equipment setup was established, showing good repeatability with regard to gaseous emissions as well as particulate mass and particulate number.
All engines met the EU-applicable Stage II emission limits with some margin except for the low-cost Asian-imported product that was slightly exceeding the permitted values. Regulated emissions do not directly relate to engine technology and combustion principle (2-stroke vs. 4-stroke). The level of pollutants mainly depends on the technology that is used for improvement
0E+00
5E+06
1E+07
2E+07
2E+07
3E+07
3E+07
4E+07
4E+07
5E+07
5E+07
1 10 100 1000
[dw
/dlo
gDp]
Size distribution (SMPS) - IDLE & WOT
diameter [nm]
accumulationnucleation
IDLE
WOT
32
0
10
20
30
40
50
60
70
80
90
100
TGA analysis IDLE
mas
sfra
ctio
n[%
]
EC OC
min
eral
oil
min
eral
oil
1 2 3 4 5 6 1 2 3 4 5 6 44
0
10
20
30
40
50
60
70
80
90
100
TGA analysis WOT
mas
sfra
ctio
n[%
]
EC OC
1 2 3 4 5 6 1 2 3 4 5 6 44
min
eral
oil
min
eral
oil

SETC2013
of combustion and mixture preparation or the use of catalyst.
Stage II emissions levels can be reached without catalyst. Catalysts can help reduce further HC and CO emissions provided that the engine does not operate under too rich conditions. Leaner conditions can lead to exothermal reactions in the catalyst and need to be considered in the design of the system. A long-term evaluation of the durability of emissions control systems was not part of that test campaign but could be of interest.
Particulate mass and number results were high due to the rich operation of the engines. The separation of fuel and oil as in the 4-stroke engine #1 with dry sump lubrication strongly helps reducing both particulate mass and number. In general, PM and PN results were equivalent or higher than for typical diesel engines without DPF. One of the main challenges fur future engine development activities in the field of NRMM will be the control of particulate matter emissions, provided future legislation tackles the issue. With regard to the oil and unburned fuel in the exhaust gas it can be assumed that measurement results would be influenced by the sampling method (evaporation and heating). The tests reported on in the present paper were conducted as close as possible to existing automotive PMP standards. The effect of using an open CVS setup on the particle emissions can be neglected, which was evaluated by taking background samples (see page 8).
A catalyst can help to reduce particulate matter, mainly its mass.
Additional tests with different oil quality were conducted. A direct impact on the particulate matter could be observed, but only on the mass and chemical composition not on the number.
Two of the engines were further tested to evaluate the size distribution of particles. The particles emitted by the engine with catalyst were smaller than the ones emitted by the engine without catalyst but the difference may also be related to the different combustion process of the two engines evaluated.
A Thermo Gravimetric Analysis of the PM deposit on the filter plates gave an insight on the mass shares of Elemental Carbon (EC) and Organic Carbon (OC). The high shares of OC (between 70% and 90%) are an indicator of the influence of oil and unburned fuel in the exhaust gas, again. Further analysis to evaluate the content of oil in the OC fraction could be of interest.
REFERENCES
1. 2007 Technical Review of the NRMM Directive 1997/68/EC as amended by Directives 2002/88/EC and 2004/26/EC, European Commission Joint Research Centre
2. Directive 97/68/EC of the European Parliament and of the Council on the approximation of the laws of the Member States relating to measures against the
emission of gaseous and particulate pollutants from internal combustion engines to be installed in non-road mobile machinery, European Commission
3. UNECE Regulation No. 83, Rev.1/Add.82/Rev.4, Annex 4a – Appendix 5, http://live.unece.org/fileadmin/DAM/trans/main/wp29/wp29regs/r083r4e.pdf.
4. „Berechnung des Lambda-Wertes nach Brettschneider“ (BOSCH TECHNISCHE BERICHTE, Band 6 (1979), Laufnr. 50277
CONTACT INFORMATION
Graz University of Technology Institute for Internal Combustion Engines & Thermodynamics (IVT) http://ivt.tugraz.at/
Inffeldgasse 19 A-8010 Graz AUSTRIA
Jürgen TROMAYER [email protected] +43 (0)316 873 30166
DEFINITIONS/ABBREVIATIONS
CI .............................Compression Ignition
CPC ..........................Condensation Particle Counter
CVS ..........................Constant Volume Sampling
EC ............................Elemental Carbon
EMFAB™ ..............A trademark of Pall Life Sciences Preferred filters for diesel exhaust and stack emission testing. Consist of pure borosilicate glass microfibers reinforced with woven glass cloth and bonded with PTFE
NRMM .....................Non-Road Mobile Machinery
OC ............................Organic Carbon
PM ............................Mass of Particulate Matter
PMP .........................Particulate Measurement Program
PN ............................Number of Particles
SI ..............................Spark Ignition
SMPS .......................Scanning Mobility Particle Sizer
TGA .........................Thermo Gravimetric Analysis
TISSUQUARTZ™ .A trademark of Pall Life Sciences Filter plates uniquely designed for air monitoring in high temperatures and aggressive atmospheres. Consist of binder-free pure quartz.
WOT .......................Wide Open Throttle