Embed Size (px)
Citation preview

1
A Computational Model for Multi-Instrument Music Transcription CS229 Final Project Report, Autumn 2013
Zhengshan Shi, Tony Yang, Huijie Yu
kittyshi, tyang90, huijie @ stanford.edu
Abstract
The aim of our project is to build a model for multi-instrument music transcription. Automatic music transcription is the process of converting an audio wave file into some form of music notes representations. We propose a two-step process for an automatic multi-instrument music transcription system including timbre classification and source separation using probabilistic latent component analysis. 1. Introduction
Automatic Music Transcription for polyphonic music is a difficult task in digital signal processing given the fact that frequency partials of notes from different instrument will mix up the spectrogram and is thus difficult to segregate. Different approaches have been proposed in order to get pitch information, including multi-pitch analysis using human auditory periphery (Klaupuri 2008), and source separation. In the project, we propose a new two-step method using a pre-processing stage of instrument classification along with a traditional statistical approach of source seperation for decoding the incoming music signal. Given a sound mixture of an instrument ensemble (for example, a flute-cello duet), our system is expected to recognize and generate the music transcriptions (in forms of a note matrix) for each instrument voice respectively.
The whole project is divided into two parts. First, we implement the instrument classification stage in a supervised setting. Training models of different instrument spectral characteristics are used for estimating the component in a sound file assuming that they are unknown. Second, based on the result from the instrument classification, we pick up corresponding basis vectors from a pre-trained basis-vector library and implement the source separation. In order to get the note matrix for each instrument layer from a polyphonic music piece, we implement the PLCA (Probabilistic Latent Component Analysis) algorithm
for source separation basing on a statistical analysis of the training data. We take a supervised learning approach in building such model to apply to our training data, and the model is updated in an iterative process through construction. Furthermore, we smooth the separated temporal matrix to get the note matrix as a form of music transcription. The whole process is illustrated in the following flow chart:
Fig.1 Flow Chart
2. Stage I : Instrument Classification
We use the Mel-Frequency Cepstral Coefficient (MFCC) as representations for instrument timbre features. By comparing the feature vectors, we comprise the classification method that categorizes a piece music played by unknown instruments to match a known instrument in the training data set. And we’re using K-nearest-neighbor classifier and softmax regression for the classification process.
Fig.2 Process of feature (MFCC) extraction

2
2.1 Feature Extraction – MFCC
A first step of our approach of music transcription is instrument classification. Timbre is a multi-dimensional sound perception which enables us to distinguish the difference between multiple instrument classes and sound quality. Timbre spaces project the sound file into a low-dimensional space which describes the spectral envelope of musical instruments. We choose the MFCC feature, which is widely used in speech recognition. We performed a discrete cosine transform to the mel-scaled log frequency spectrum, and took the first 15 coefficients that captures best the spectral shape and envelope of a musical instrument as the feature vector. Our time frame is chosen to be 1-second long, meaning that a 15-dimensional feature vector is extracted for each second of the audio wave file.
Fig.3 MFCC for the training set 2.2 Training and Testing Process
There are two classification algorithms implemented in this stage, K-nearest neighbors (K-NN) and softmax regression. Both algorithms treat the feature vectors as points in a 15-dimensional space, and we label each training feature vector with a number corresponding to an instrument type. For the testing process, we divide the testing data into 1-second long frames, and each of them is represented by a 15-dimensional feature vector. We then evaluate each of the testing vectors (1-second long frames) independently, and take the most frequent guess as the overall estimation for that piece of testing data.
The K-NN algorithm measures the Euclidean distance between the testing vector and all training
vectors. Then we listed the K (we tested the case of K=1, 10 and 20) nearest neighbors of the testing vector and claim it has the same instrument type as the majority of its K nearest neighbors.
The softmax regression builds a hypothesis based on the training set of feature vectors, and then each of the testing vectors is evaluated by the hypothesis. We then take the most probable guess to estimate the instrument category of that testing vector.
After categorizing each testing feature vector independently, we combine the classification results of all testing vectors for a single piece of solo music (in our case, we group 50 feature vectors for a 50-second piece of music) and claim that the current piece of music is played by the instrument type which corresponds to the majority of the 50 feature vectors. The results are evaluated by calculating the “hit ratio”, i.e., the ratio of feature vectors that provides us the correct instrument type, which was judged by musicians. 3. Stage II: Source separation using PLCA
The PLCA algorithm does a non-negative matrix factorization on the audio spectrum (V), and decomposes it into a spectral basis matrix (W) and temporal weight matrix (H). Each column in the audio spectrum V is the frequency distribution of the piece of music at a certain time frame, and we name it 𝑃! 𝑓 . Each column of the spectral basis matrix W is composed of a set of spectral basis vectors represented by 𝑃 𝑓 𝑧 , and each column of the spectral basis matrix is a spectral basis vector. The spectral basis vector 𝑃 𝑓 𝑧 is the frequency distribution of a pitch played by one instrument. Each column of the temporal weight matrix H is a distribution of weights 𝑃! 𝑧 for spectral basis vectors at a certain time frame, so when we multiply the weights on the spectral basis vectors and take the sum of the products, we will get one column of the audio spectrum. In mathematical notation, we have:
𝑃! 𝑓 = 𝑃(𝑓|𝑧)𝑃! 𝑧!
To get the spectral basis vectors 𝑃(𝑓|𝑧) and their respective weights 𝑃! 𝑧 , we use an EM approach that estimates the posterior distribution 𝑃! 𝑧|𝑓 in the E step, with 𝑃! 𝑧 and 𝑃(𝑓|𝑧) in the M step. In mathematical notation, we have:

3
E-step:
𝑃! 𝑧|𝑓 = 𝑃(𝑓|𝑧)𝑃! 𝑧𝑃(𝑓|𝑧)𝑃! 𝑧!
M-step:
𝑃! 𝑧 = 𝑃! 𝑓 𝑃! 𝑧|𝑓!
𝑃! 𝑓 𝑃! 𝑧|𝑓!!
𝑃 𝑓|𝑧 = 𝑃! 𝑓 𝑃! 𝑧|𝑓!
𝑃! 𝑓 𝑃! 𝑧|𝑓!!
The incoming audio signal is first transformed
into an audio spectrum through Short-Time Fourier Transform (STFT), with FFT length of 2048, hop size of 512 and a sampling frequency of 44100 samples per second, which gives us a time resolution of 11.6ms.
The initial spectral basis vectors are fixed –they are extracted from a pre-trained library of basis vectors for different instruments and pitches according to the instrument label detected in the first stage. In the construction of the basis vector library, notes from a frequency range of C2 to C4 played by 10 different instruments were synthesized using Cakewalk Sonar. We keep 2-3 seconds for each note, and perform a STFT on the basis note to extract the spectral feature vector as the basis vectors.
Once we load the spectral basis vectors into the algorithm, temporal weights and spectral basis vectors are iteratively updated based on the original audio spectrum. The resulted temporal weight matrix H represents the notes played by an instrument along the time axis. Since the probability of a pitch shift in a short amount of time frames is low, to eliminate the system’s over-sensitivity to transients and noise in the temporal matrix, we implement a moving average filter to smooth the detected pitch among neighboring frames. 4. Evaluation
We were having two testing cases for instrument classifications. Test case I includes music pieces from 6 different solo instrument types, and test case 2 includes three solo instruments and two instrument ensembles. The hit ratio of instrument classification with two different algorithms were characterized in the following table.
Test Case I:
Hit Ratio flute clarinet trombone cello piano violin
K-NN 0.98 0.70 0.96 1.00 0.80 1.00
Softmax 0.86 0.86 1.00 1.00 0.66 0.96
Test Case II:
Hit Ratio flute clarinet cello flute+cello clarinet+piano
K-NN 0.96 0.70 1.00 0.98 0.56
Softmax 0.86 0.86 1.00 1.00 0.58
Based on our preliminary result of instrument
classification, we see that our algorithm was more robust on string instrument (cello & violin). A possible reason for that is that string instruments have a smoother spectral envelope, which makes the feature extraction part more accurate than the woodwind family. Since our aim for the final project is to separate a duet of a woodwind + string combination, the algorithm for detecting the woodwind + string case works efficiently.
After the pre-processing instrument classification stage, we apply PLCA algorithm on a piece of duet music played by flute and cello. We take the first 4.2 seconds of the music, and the spectrum is generated with STFT. Then we combine our synthesized basis vectors into a spectral basis matrix. The calculated temporal weights matrix represents the notes played by an instrument. The temporal weights for the first five basis vectors is illustrated in the following figure, with the horizontal axis for time, and vertical axis for intensity.
Fig.4 Temporal weighted matrix for Cello part
4
Fig. 5.1 Separated Cello Note Matrix
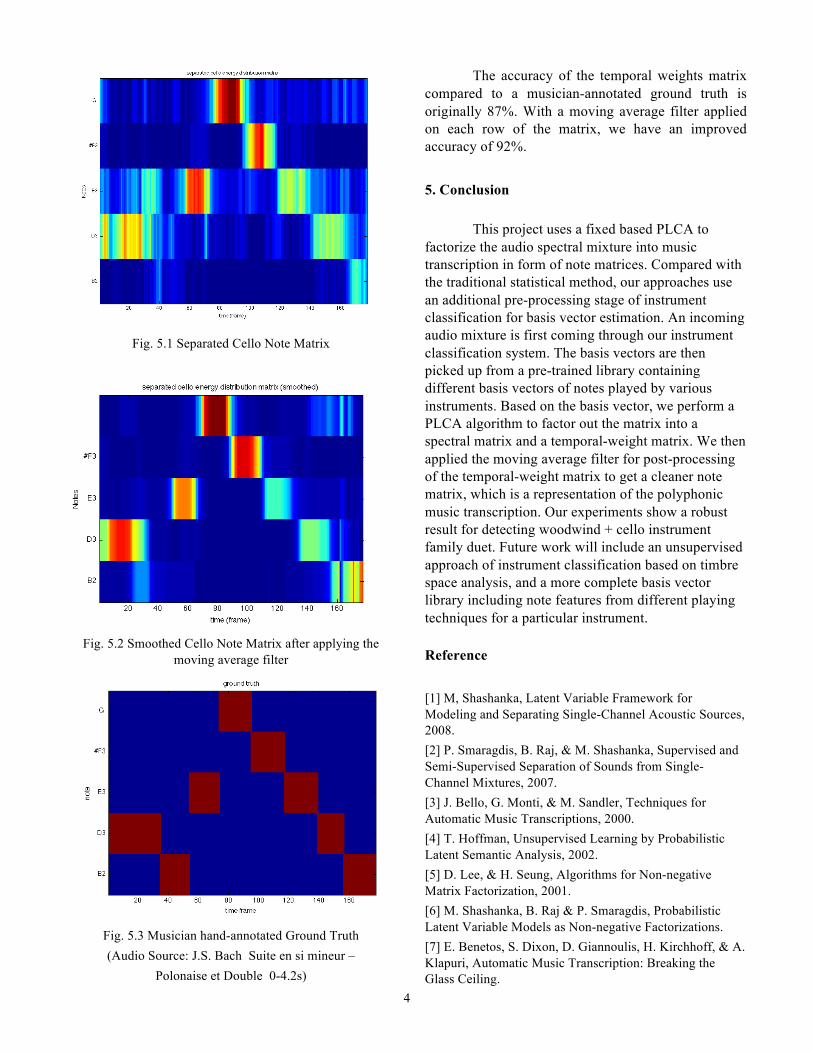
Fig. 5.2 Smoothed Cello Note Matrix after applying the
moving average filter
Fig. 5.3 Musician hand-annotated Ground Truth (Audio Source: J.S. Bach Suite en si mineur –
Polonaise et Double 0-4.2s)
The accuracy of the temporal weights matrix compared to a musician-annotated ground truth is originally 87%. With a moving average filter applied on each row of the matrix, we have an improved accuracy of 92%. 5. Conclusion
This project uses a fixed based PLCA to factorize the audio spectral mixture into music transcription in form of note matrices. Compared with the traditional statistical method, our approaches use an additional pre-processing stage of instrument classification for basis vector estimation. An incoming audio mixture is first coming through our instrument classification system. The basis vectors are then picked up from a pre-trained library containing different basis vectors of notes played by various instruments. Based on the basis vector, we perform a PLCA algorithm to factor out the matrix into a spectral matrix and a temporal-weight matrix. We then applied the moving average filter for post-processing of the temporal-weight matrix to get a cleaner note matrix, which is a representation of the polyphonic music transcription. Our experiments show a robust result for detecting woodwind + cello instrument family duet. Future work will include an unsupervised approach of instrument classification based on timbre space analysis, and a more complete basis vector library including note features from different playing techniques for a particular instrument. Reference [1] M, Shashanka, Latent Variable Framework for Modeling and Separating Single-Channel Acoustic Sources, 2008. [2] P. Smaragdis, B. Raj, & M. Shashanka, Supervised and Semi-Supervised Separation of Sounds from Single-Channel Mixtures, 2007. [3] J. Bello, G. Monti, & M. Sandler, Techniques for Automatic Music Transcriptions, 2000. [4] T. Hoffman, Unsupervised Learning by Probabilistic Latent Semantic Analysis, 2002. [5] D. Lee, & H. Seung, Algorithms for Non-negative Matrix Factorization, 2001. [6] M. Shashanka, B. Raj & P. Smaragdis, Probabilistic Latent Variable Models as Non-negative Factorizations. [7] E. Benetos, S. Dixon, D. Giannoulis, H. Kirchhoff, & A. Klapuri, Automatic Music Transcription: Breaking the Glass Ceiling.


![CS229 Project: 3-D Image segmentation using Recursive ...cs229.stanford.edu/...3DImageSegmentationUsingRecursiveNeuralN… · So we explore how a Recursive Neural Network (RNN) Algorithm[2]](https://img.dokumen.tips/doc/110x75/5b5fdcac7f8b9a7f038ba94b/cs229-project-3-d-image-segmentation-using-recursive-cs229-so-we-explore.jpg)