Embed Size (px)
Citation preview

A Compendium
of 45 Trout Stream Habitat
Development Evaluations
in Wisconsin During 1953-1985
Technical Bulletin No. 162 Department of Natural Resources Madison, Wisconsin
I I • v
~~· -----------------------------------------------

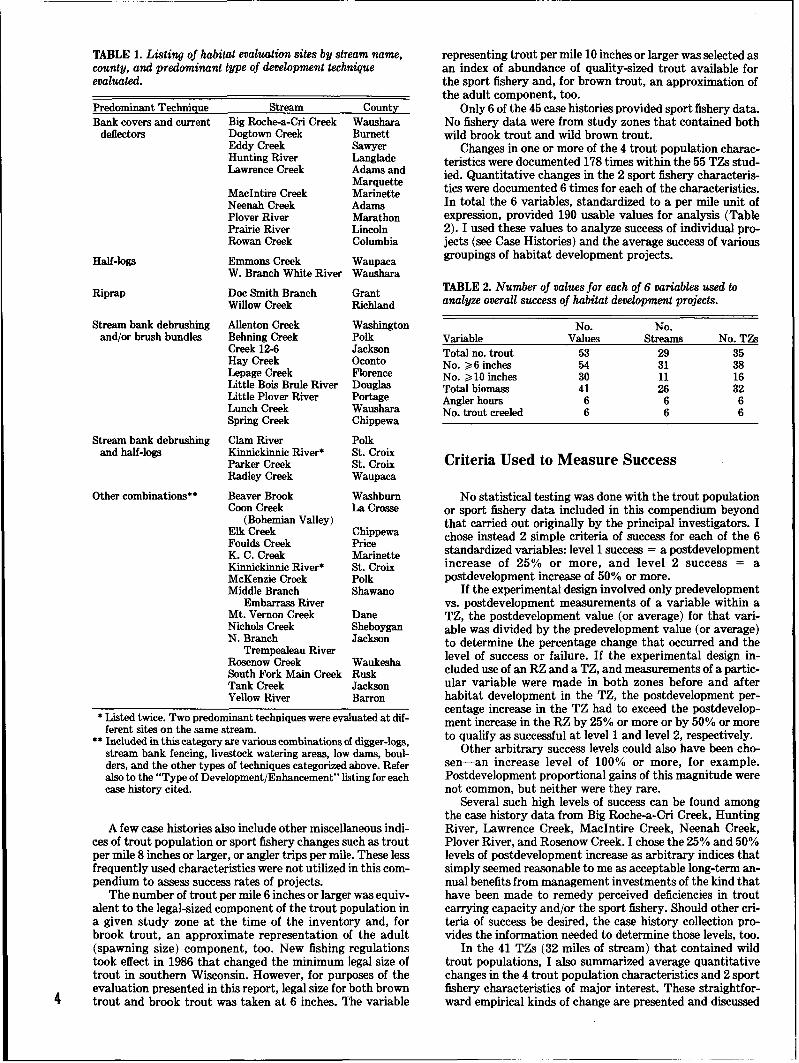
COVER: Traditional bank cover structure
ABSTRACT------------A standard case history format was devised to summarize 45 trout stream habitat
evaluations carried out by Wisconsin Department of Natural Resources (DNR) fishery management and research biologists on 41 streams distributed among 29 counties during 1953-85. Thirty-three of these case histories are based on unpublished documents supplied from files of fish managers. Data were gathered from 55 treatment zones (TZs) averaging 0.84 mile long and 20 reference zones (RZs) averaging 0.74 mile long. Wild trout were dominant or solely present in 49 of the 55 TZs.
"Success" of each project was judged on the basis of percentage changes within TZs for each of 6 possible variables standardized to "per mile" quantities. These 6 variables were: total number of trout, number 6 inches or larger (legal size), number 10 inches or larger (quality size), total biomass, angler hours, and angler harvest.
Two arbitrary levels of success were set: Ievell = postdevelopment variable increases of 25% or more, and level 2 = increases of 50o/o or more. Only 2 case histories provided information on the percentage change for aU 6 variables, and only 6 of the 45 projects included creel census data. AU projects provided a total of 190 measurements of change in the standardized variables chosen to categorize success levels.
Approximately 60% of the quantified changes in the 6 standard variables exceeded success level 1 after habitat development; 43% exceeded success level 2. Postdevelopment abundance of legal-sized trout was at least 25°/o greater than predevelopment abundance in 59% of the TZs where this variable was quantified. Success rate at level 2 was 31%. Abundance of quality-sized trout was measured in fewer TZs (primarily those containing brown trout), and success rates for this trout population characteristic were higher: 74% at Ievell and 61% at level2. For projects involving allopatric populations or wild brook trout (Salvelinus fontiDalis) or wild brown trout (Salmo trulta), success rates were similar, but in sympatric situations brown trout responded much more positively than did brook trout to habitat development.
The habitat development te(hniques employed were grouped into 6 categories based on the predominant techniques. Of these 6 categories, the "Wisconsin-style" bank cover and current detector category generally produced the best success rates regardless of the species of trout present in the 10 TZs represented. Stream bank debrushing, sometimes in combination with installation of brush bundles, was very elrective in a few TZs but scored low in overall success rates for aU 9 TZs. Projects initiated after 1977 (post-trout-stamp era) were slightly more successful than projects initiated prior to 1977.
At least one trout population variable improved after development in 93% of 41 TZs containing wild trout. Approximately 72% of the 185 measurements of change among the 4 standardized population variables in these zones were positive, 26% were negative, and 2% showed no average change from predevelopment to postdevelopment periods.
Average empirical postdevelopment changes for the populations of wild trout in 41 TZs included a 21 o/o increase in number of trout (to 1,940/mile), a 35% increase in legal-sized trout (to 828/mile), a 56% increase in quality-sized trout (to i56/mile), and a 49% increase in biomass (to 2421bs/mile).
In 4 TZs where creel census was carried out before and after development, angler use increased an average of79% (to 590 hours/mile), and harvest increased an average of 41% (to 281/mile).
More attention should be given in future evaluations to improve experimental design by including several annual observations of selected variables in paired RZs and TZs before and after habitat development in the TZs. Special emphasis is needed on more frequent inclusion of season-long creel census studies, despite their high cost, so that changes in trout carrying capacity after habitat development can be more accurately assessed.
KEY WORDS: Trout, trout streams, habitat evaluations, habitat alterations, fisheries management, fisheries research.

A Compendium of 45 Trout Stream Habitat -----Development Evaluations in Wisconsin During 1953-1985-----
by Robert L. Hunt
Technical Bulletin No. 162 Department of Natural Resources
P.O. Box 7921, Madison, Wisconsin 53707
1988
CONTENTS----------2 INTRODUCTION
3 METHODS
Source Documents, 3 Variables Used to Measure Change, 3 Criteria Used to Measure Success, 4 Cost Analysis, 5
5 SUCCESS OF HABITAT DEVELOPMENT PROJECTS
Success Rates by Time Periods, 5 Success Rates by Variable, 6 Success Rates by Trout Species, 6 Success Rates in TZs Holding Wild Brook and Wild Brown Trout, 6 Success Rates by Type of Development, 7 Empirical Changes in Trout Population and Sport Fishery Variables, 8
11 FISHERY MANAGEMENT AND RESEARCH IMPLICATIONS
13 CASE HISTORIES
70 GLOSSARY OF HABITAT DEVELOPMENT TECHNIQUES
76 APPENDIX
80 LITERATURE CITED

2
INTRODUCTION-------------------Government-sponsored programs in Wisconsin to manip
ulate physical features of trout streams to restore or improve trout carrying capacity and sport fisheries began in the mid-1930s. These programs were funded largely by federal agencies responsible for creating jobs during a nationwide economic depression. The projects subsequently undertaken on many Wisconsin trout streams were well-intentioned, but most lacked a solid biological basis for planning and implementation, and no provisions were made to evaluate biological benefits of the work done. Unfortunately, few of these projects provided long-lasting fishery benefits. Flimsy construction of instream devices and/or poor placement of structures in relation to hydraulic principles of stream flow were the main reasons for failure.
About 1950 the Wisconsin Department of Natural Resources (DNR) initiated its own trout habitat development program. This program was based on knowledge gained from observing the results of previous federal efforts in Wisconsin and other states as well as from the pioneering work in trout stream improvement methods by the neighboring Michigan Department of Natural Resources.
By 1959 DNR-sponsored projects had been completed on 10 Wisconsin trout streams and initiated on another 15 streams. The next year the first DNR manual on trout habitat development methods was published (O'Donnell and Threinen 1960).
Formal DNR research to evaluate trout habitat development projects was initiated in 1954 on 4 Wisconsin streams: Black Earth and Mt. Vernon creeks in Dane County, Big Roche-a-Cri Creek in Adams and Waushara counties, and McKenzie Creek in Polk County. These research studies, in terms of experimental design, sampling procedures, and improvement techniques, subsequently influenced implementation of a more detailed long-term evaluation on the upper mile of Lawrence Creek in Adams County. This research project utilized predevelopment data on the trout population and sport fishery gathered during 1961-63 (as part of another research investigation of fishing regulations). The project continued through 1964, a year of intensive installation of bank covers and current deflectors, plus 6 more years of postdevelopment study (1965-70).
The Lawrence Creek evaluation eventually yielded the most thorough and insightful assessment of a trout habitat development project done to date in Wisconsin (Hunt 1969, 1971, 1976). Key components of that assessment included: ( 1) long-term monitoring of trout populations in an undeveloped reference zone (RZ) as well as in a developed treatment zone (TZ); (2) reliable measurements of angler use and harvest from both kinds of study zones before and after development, acquired via a compulsory registration-type creel census; and (3) detailed maps of changes in stream morphometry.
The year 1967 marked another significant event in the history of trout stream habitat management in Wisconsin, namely the publication of Guidelines for Management of Trout Stream Habitat in Wisconsin, authored by DNR research biologists R. J. White and 0. M. Brynildson. Both the research based on Lawrence Creek, then in progress, and ongoing evaluations on the other 4 research-selected streams contributed to the solid biological foundation for this habitat management manual. It quickly became, and still remains, the reference "bible" on principles and techniques for enhancing trout stream habitat in Wisconsin and, indeed, in North America.
Several procedures are used to restore and improve trout
stream habitats in Wisconsin. The most common techniques used in or adjacent to streams include current (wing) deflectors, several types of bank cover devices, half-logs, rock riprap, midchannel placement of boulders (boulder retards), removal or thinning of woody stream bank vegetation (particularly alder brush), in-channel brush bundles, and stream bank fencing to exclude livestock. These techniques are briefly defined and illustrated in the glossary accompanying this report. Removal of beaver dams (and beaver) is also a widespread practice and a particularly high-priority procedure at present.
Impetus to carry out such trout habitat management projects was greatly accelerated in 1977 when state legislation was passed that required anglers (ages 16-65) fishing for trout in inland waters to purchase a trout stamp annually. Revenue received from sales of these trout stamps was earmarked exclusively for trout habitat development projects.
During the first 7 years (1978-84) that such funding was available, 103 trout stamp projects were approved at an average cost of $26,640. Annual revenue available to the DNR to fund trout habitat management increased six-fold, from only $65,000 in 1976 to an annual average of $425,000 during 1978-84.
Published habitat evaluations and information on techniques used in Wisconsin to enhance living conditions for trout in streams include reports by Frankenberger and Fassbender (1967), Frankenberger (1968), Lowry (1971), White (1972), Hunt (1978, 1979, 1982, 1985), Les (1980), and Klingbiel (1981), plus those previously cited. In addition to these published reports, an unknown number of unpublished evaluations exist in the files of DNR fish managers as part of their station records for waters under their management jurisdiction.
In October 1985 I undertook a study to analyze DNR habitat development evaluations. This study was initiated as part of a larger DNR effort to internally review the agency's trout habitat management program. Results of my analysis are presented in this compendium report. It is the first major effort to pull together both published and unpublished evaluations. It also represents the first major effort to: (1) standardize reporting of results from trout habitat evaluations in Wisconsin; (2) objectively quantify the "success" of such projects; and (3) interpret, based on the overview that this collection of published and unpublished documents provides, management implications from an important era of trout fishery management.
Scarcity of such a collection of evaluations is a nationwide fisheries management concern. Hall and Baker (1982), for example, in their review of literature dealing with rehabilitation and enhancement of salmonid habitat, state that their task was "made more difficult by the scarcity of written documentation of past work" (p. 1). They hoped that one outcome of their review efforts would be an "increased awareness of the need to evaluate and document all projects-even those that are unsuccessful," since valuable lessons may be learned from some of the apparent failures.
Reeves and Roelofs ( 1982) similarly stress, in their review on techniques for improving salmonid habitats in the Pacific Northwest and Alaska, that more "results-both successes and failures-must be [made more] readily available" (p. 29). They also wisely called for better cooperation "between research and management agencies" to achieve more consistently successful rehabilitation and enhancement of salmonid habitats (p. 27).

METHODS------------------------Source Documents
In October 1985 a memorandum was distributed to 41 DNR fish managers requesting them to provide me with copies from their files of unpublished evaluations of trout habitat development projects done by them or their predecessors. Managers were specifically encouraged to forward evaluations the results of which could be interpreted as "unsuccessful" or inconclusive, as well as results from successful projects. In addition, I pulled together information on DNR evaluations of trout habitat development from published reports.
Using a standard format, case history summaries were prepared for 45 evaluations of 41 streams in 29 counties (Fig. 1). Biological and physical data were evaluated from a total of 55 treatment zones (TZs) averaging 0.84 mile in length and 20 reference zones (RZs) averaging 0.74 mile in length. Total length of all study zones was 60.8 miles. Evaluations were carried out over a 32-year period, 1953-85.
Source documents for these evaluations include 12 published reports, 33 internal DNR memoranda, and 11 personal communications memoranda. Several of these source documents provide information on more than one evaluation site or stream. All source documents are on file at the Cold Water Group Headquarters, DNR, Rt. 1, Box 589, Waupaca, WI 54981.
All investigators reported that trout population data were derived from mark-recapture procedures utilizing electrofishing gear, with 3 case history exceptions (2 TZs on Behning Creek, 1 TZ on S. Fork Main Creek, and 1 TZ on Willow Creek). For these 3 exceptions, the principal investigators assumed very high electrofishing efficiencies for the single-run inventories made.
Data gathered from source documents encompassed a wide range of variables. In preparation for designing my compendium format and analyzing case history data, I categorized source documents in the following ways:
L_
( 1) By time periods: • 22 evaluations initiated prior to 1977 (pre-trout
stamp) • 23 evaluations initiated in 1977 or later
(2) By the kind of trout present in the study zones: • wild brook trout (Salvelinus fontinalis)-13
streams, 14 TZs • wild brown trout (Salmo trutta)-13 streams, 20
TZs • wild brook and wild brown trout-10 streams, 14
TZs • wild brook, wild brown, and wild rainbow trout
(Salmo gairdneri)-1 stream, 1 TZ • wild and domestic brook trout-1 stream, 2 TZs • wild and domestic brown trout-1 stream, 2 TZs • domestic brown trout-2 streams, 2 TZs
(3) By the predominant type of habitat development technique applied (Table 1): • bank covers and current deflectors--10 streams, 13
TZs • haH-logs only-2 streams, 2 TZs • rock riprap only-2 streams, 2 TZs • stream bank debrushing and/or brush bundles--9
streams, 10 TZs • stream bank de brushing and haH -logs--4 streams,
10 TZs
• other combinations of techniques--15 streams, 18 TZs
(4) By the principal investigators and kinds of experimental design utilized: • 9 evaluations by DNR fishery research biologists
• 5 designs based on data collected from RZs and TZs, before and after development
• 4 designs based on data collected from TZs only, before and after development
• 36 evaluations by DNR fish management biologists • 13 designs based on data collected from RZs and
TZs, before and after development • 22 designs based on data collected only from
TZs, before and after development • 1 design that provided data only from the TZ
after development
Variables Used to Measure Change
Four population variables and 2 sport fishery variables were chosen for comparison and standardization to "per mile" units of expression. The 4 population variables included as often as possible in each case history were: total number of trout, number that were 6 inches or larger, number that were 10 inches or larger, and total biomass. The 2 sport fishery variables selected and standardized were the number of angler hours and the number of trout creeled (harvested). Only 2 of the source documents provided information on all 6 variables.
FIGURE I. Locations of the 29 counties and 41 streams where trout habitat development projects were evaluated. 3
4
TABLE 1. Listing of habitat evaluation sites by stream name, county, and predominant type of development technique evaluated.
Predominant Technique Bank covers and current
deflectors
Half-logs
Rip rap
Stream bank debrushing and/or brush bundles
Stream bank debrushing and half-logs
Other combinations**
Stream Big Roche-a-Cri Creek Dogtown Creek Eddy Creek Hunting River Lawrence Creek
Maclntire Creek Neenah Creek Plover River Prairie River Rowan Creek
Emmons Creek W. Branch White River
Doc Smith Branch Willow Creek
Allenton Creek Behning Creek Creek 12-6 Hay Creek Lepage Creek Little Bois Brule River Little Plover River Lunch Creek Spring Creek
Clam River Kinnickinnic River* Parker Creek Radley Creek
Beaver Brook Coon Creek
(Bohemian Valley) Elk Creek Foulds Creek K. C. Creek Kinnickinnic River* McKenzie Creek Middle Branch
Embarrass River Mt. Vernon Creek Nichols Creek N. Branch
Trempealeau River Rosenow Creek South Fork Main Creek Tank Creek Yellow River
County Waushara Burnett Sawyer Langlade Adams and Marquette Marinette Adams Marathon Lincoln Columbia
Waupaca Waushara
Grant Richland
Washington Polk Jackson Oconto Florence Douglas Portage Waushara Chippewa
Polk St. Croix St. Croix Waupaca
Washburn La Crosse
Chippewa Price Marinette St. Croix Polk Shawano
Dane Sheboygan Jackson
Waukesha Rusk Jackson Barron
*Listed twice. Two predominant techniques were evaluated at different sites on the same stream.
•• Included in this category are various combinations of digger-logs, stream bank fencing, livestock watering areas, low dams, boulders, and the other types of techniques categorized above. Refer also to the "Type of DevelopmentjEnhancement"listing for each case history cited.
A few case histories also include other miscellaneous indices of trout population or sport fishery changes such as trout per mile 8 inches or larger, or angler trips per mile. These less frequently used characteristics were not utilized in this compendium to assess success rates of projects.
The number of trout per mile 6 inches or larger was equivalent to the legal-sized component of the trout population in a given study zone at the time of the inventory and, for brook trout, an approximate representation of the adult (spawning size) component, too. New fishing regulations took effect in 1986 that changed the minimum legal size of trout in southern Wisconsin. However, for purposes of the evaluation presented in this report, legal size for both brown trout and brook trout was taken at 6 inches. 'I'he variable
representing trout per mile 10 inches or larger was selected as an index of abundance of quality-sized trout available for the sport fishery and, for brown trout, an approximation of the adult component, too.
Only 6 of the 45 case histories provided sport fishery data. No fishery data were from study zones that contained both wild brook trout and wild brown trout.
Changes in one or more of the 4 trout population characteristics were documented 178 times within the 55 TZs studied. Quantitative changes in the 2 sport fishery characteristics were documented 6 times for each of the characteristics. In total the 6 variables, standardized to a per mile unit of expression, provided 190 usable values for analysis (Table 2). I used these values to analyze success of individual projects (see Case Histories) and the average success of various groupings of habitat development projects.
TABLE 2. Number of values for each of 6 variables used to analyze overall success of habitat development projects.
No. No. Variable Values Streams No.T~
Total no. trout 53 29 35 No. :;::.6 inches 54 31 38 No. :;::.10 inches 30 11 16 Total biomass 41 26 32 Angler hours 6 6 6 No. trout creeled 6 6 6
Criteria Used to Measure Success
No statistical testing was done with the trout population or sport fishery data included in this compendium beyond that carried out originally by the principal investigators. I chose instead 2 simple criteria of success for each of the 6 standardized variables: Ievell success = a postdevelopment increase of 25% or more, and level 2 success = a postdevelopment increase of 50% or more.
If the experimental design involved only predevelopment vs. postdevelopment measurements of a variable within a TZ, the postdevelopment value (or average) for that variable was divided by the predevelopment value (or average) to determine the percentage change that occurred and the level of success or failure. If the experimental design included use of an RZ and a TZ, and measurements of a particular variable were made in both zones before and after habitat development in the TZ, the postdevelopment percentage increase in the TZ had to exceed the postdevelopment increase in the RZ by 25% or more or by 50% or more to qualify as successful at Ievell and level2, respectively.
Other arbitrary success levels could also have been chosen-an increase level of 100% or more, for example. Postdevelopment proportional gains of this magnitude were not common, but neither were they rare.
Several such high levels of success can be found among the case history data from Big Roche-a-Cri Creek, Hunting River, Lawrence Creek, Maclntire Creek, Neenah Creek, Plover River, and Rosenow Creek. I chose the 25% and 50% levels of postdevelopment increase as arbitrary indices that simply seemed reasonable to me as acceptable long-term annual benefits from management investments of the kind that have been made to remedy perceived deficiencies in trout carrying capacity andjor the sport fishery. Should other criteria of success be desired, the case history collection provides the information needed to determine those levels, too.
In the 41 TZs (32 miles of stream) that contained wild trout populations, I also summarized average quantitative changes in the 4 trout population characteristics and 2 sport fishery characteristics of major interest. These straightforward empirical kinds of change are presented and discussed

in relation to the type of development carried out in the TZs and in relation to species-specific and mixed species responses. Data for the empirical summaries were not utilized for TZs containing trout of domestic origin, from the single TZ (Little Bois Brule River) that held wild brook, wild brown, and wild rainbow trout, or from the TZ on South Fork Main Creek where only postdevelopment data were collected.
This section of the compendium provides, therefore, an alternative analysis of trout population and fishery responses to habitat development that is independent of my arbitrary choice of 2 levels of percentage change to judge successful outcomes.
In a few source documents, some investigators also measured empirical changes in physical characteristics of their study zones. These changes are reviewed within the individual case history reports, but I did not summarize or use this documentation to judge success or failure of development projects.
Cost Analysis
Few of the published and unpublished source documents provided information on financial expenditures to implement a habitat development project, and no costs are cited in this compendium. One major effort to summarize and interpret such costs in Wisconsin has been published (Klingbiell981), but a more comprehensive, updated, and technique-specific assessment would be useful, particularly if it could include costs of projects covering evaluations of the kind included in this compendium. However, necessary prerequisites would include more consistent statewide procedures for cost accounting and agreement on what costs should be included in a development project.
SUCCESS OF HABITAT DEVELOPMENT PROJECTS-----------------------
Among the 190 trout population and fishery values analyzed, the percentage change after development was positive and great enough to reach the Ievell criterion of success at a 60% rate (i.e., 114 of the 190 indices improved by at least 25%). The rate of success at level2 was 43% (Table 3). Success of individual habitat development projects, as measured by the 6 standardized variables, is indicated in the case history summary for each stream and is summarized in Appendix Table 1.
Success Rates by Time Periods
Of the 45 case histories cited, 22 were initiated prior to 1977 (pre- trout-stamp era). These 22 evaluations provided 111 measurements of a percentage change in one or more of the 6 criteria selected to assess postdevelopment success (Table 3). Approximately 58% of the percentage increases in the TZs for these 111 measurements reached Ievell success, and 41% of the postdevelopment changes reached level 2.
Success rates were slightly better for projects initiated after 1977 (Table 3).
TABLE 3. Arbitrary success rates of 190 measurements of 4 trout population variables and it sport fishery variables derived from 45 habitat development proiects during it time periods of proiect initiation. Levell (Ll) success = it5% increase and level it (Lit) success = 50% increase.
No. No. Case Percentage
Time History Change % Successful Period* Evaluations Measurements L1 L2 Before 1977 22 111 58** 41** After 1977 23 79 63 47 Combined 45 190 60 43
*Licensed anglers between ages 16-65 were required to purchase a Wisconsin trout stamp to fish inland trout lakes and trout streams effective 1 July 1977. By legislative action, revenue raised from purchase of such stamps was designated for funding trout habitat development projects. The time periods retleet pretrout-stamp vs. post-trout-stamp eras for funding DNR projects to restore and improve trout habitat.
**Interpretation example: 58% of 111 measurements of the percentage changes showed at least a 25% increase in the treatment zones after habitat improvement; 41% of the 111 measurements showed at least a 50% increase. 5

6
Success Rates by Variable
In Table 4 the same 190 indices of success or failure are summarized for each of the 6 standardized variables and for 2 time periods. For projects initiated prior to 1977, success rates at levels 1 and 2 were lower for total number of trout and for the number 10 inches or larger in comparison to success rates achieved among projects initiated after 1977. For number of trout 6 inches or larger and for total biomass, success rates for pre-1977 projects were higher at level 1 but lower at level 2.
For all projects reviewed, success at the 25% increase level was achieved for 53% of 53 measurements of the percentage change in total number of trout in TZs after development, for 59% of 54 measurements of change in total number of trout 6 inches or larger, for· 73% of 30 measurements of change in total number of trout 10 inches or larger, and for 56% of 41 measurements of change in total biomass.
Four (67%) of the 6 creel census studies showed 50% or greater increases in angler use and harvest in the TZs after habitat improvement.
Success Rates by Trout Species
Fourteen TZs contained only wild brook trout, and 20 TZs held only wild brown trout. Habitat development was not consistently more beneficial to either species (Table 5).
Brook trout and brown trout experienced similar success rates at level1 for total number of trout per mile, but at the second level of success, habitat development projects on brook trout streams were more successful at increasing total population densities. Projects on brown trout streams, however, were more successful in producing increased numbers of legal-sized trout.
Changes in abundance of brown trout 10 inches or larger were documented in 19 TZs. In 12 of those study zones postdevelopment abundance increased by at least 25%, and in 9 zones increases exceeded 50%.
Creel census data were collected on 4 brook trout streams and 2 brown trout streams where some kind of habitat development was also carried out and evaluated (Append. Table 2). Angler use and harvest increased in the TZs by at least 50% on 3 of the 4 brook trout streams and 1 of the 2 brown trout streams. Harvest of brook trout increased 96% in the TZ on Big Roche-a-Cri Creek, despite a 12% decrease in angler hours after development. Conversely, a 183% increase in angler hours in the TZ on the Little Plover River was linked to only a 6% increase in harvest of brook trout after development.
Success Rates in TZs Holding Wild Brook and Wild Brown Trout
Fourteen TZs receiving habitat development contained populations of wild brook and wild brown trout (Table 6). In these TZs wild brown trout generally benefitted more than wild brook trout.
Postdevelopment changes in abundance of legal-sized trout of both species were determined in 8 of the 14 TZs. Legal-sized brook trout increased after development by at least 25% in only 2 of the 8 TZs. Legal-sized brown trout were at least 50% more abundant in all 8 zones.
Level 1 success was exceeded by 43% of the population variables measured for brook trout but by 83% of the population variables measured for sympatric brown trout. At the 50% increase level of response to development, wild brook trout coexisting with brown trout were even less successful at taking advantage of improved habitat.
TABLE 4. Arbitrary success rates for 4 trout population variables and 2 sport fishery variables, summarized by 2 time periods and 2 levels of success. Levell ( Ll) success = 25% increase and level 2 ( L2) success = 50% increase.
Total No. No. Trout/Mile No. Trout/Mile Lbs Angler No. Trout TroutLMile ;;.6 Inches ;;.10 Inches TroutLMile HoursLMile CreeledLMile
Time No. %Sue. No. %Sue. No. %Sue. No. %Sue. No. %Sue. No. %Sue. Period* Meas.** L1 L2 Meas. L1 L2 Meas. L1 L2 Meas. L1 L2 Meas. L1 L2 Meas. L1 L2 Before 1977 34 47" 32" 29 66 31 17 65 53 21 57 48 5 60 60 5 60 60 After 1977 19 63 42 25 52 32 13 85 69 20 55 50 1 100 100 1 100 100 Combined 53 53 36 54 59 31 30 73 60 41 56 49 6 67 67 6 67 67
• Time periods reflect pre-trout-stamp (before 1977) and post-trout-stamp (after 1977) eras of funding habitat improvement projects. ** Number of measurements.
• Interpretation example: 47% of 34 measurements of the percentage change in no. trout/mile in treatment zones showed f.lOstdevelopment increases of at least 25%; 32% of the 34 measurements showed at least a 50% increase.
TABLE 5. Arbitrary success rates for 4 trout population variables and 2 sport fishery variables, summarized separately for wild brook trout and wild brown trout. Data are from treatment zones (TZs) where only 1 of the 2 species was present during the evaluatio11S. Levell (Ll) success = 25% increase and level2 (L2) success = 50% increase.
No. No. Total No. Trout/Mile Trout/Mile Lbs Angler No. Trout All6
TroutLMile ;;.6 Inches ;;.10 Inches TroutLMile HoursLMile CreeledLMile Variables
Trout Max. No. %Sue. No. %Sue. No. %Sue. No. %Sue. No. %Sue. No. %Sue. No. %Sue. Species No. TZ<l Meas.* L1 L2 Meas. L1 L2 Meas.L1 L2 Meas.L1 L2 Meas. L1 L2 Meas.L1 L2 Meas. L1 L2 Brook 14 13 54 46 14 43 29 1 100100 14 50 42 4 75 75 4 75 75 48 54 46 Brown 20** 22** 55 23 21 57 33 19 63 47 18 44 33 2 50 50 2 50 50 86 55 35
*Number of measurements. **No data on total number of brown trout/mile were cited for the TZ on the Plover River, but 2 sets of postdevelopment data for this variable
were utilized from 3 TZ<l. Number of measurements, therefore, exceeded the maximum number of TZ<l containing brown trout.

TABLE 6. Arbitrary success rates for 4 trout population variables, summarized separately for wild brook trout, wild brown trout, and both species, Data are from 14 treatment zones (TZs) where both ~pecies were present during evaluations. Levell (Ll) success = 25% increase and level2 (L2) success = 50% increase.*
Total No. No. Trout/Mile No. Trout/Mile Lbs TroutLMile ;.6 Inches ;.10 Inches TroutLMile All Variables
Trout No. %Sue. No. %Sue. No. %Sue. No. %Sue. No. %Sue. S!!ecies Meas.** L1 L2 Meas. L1 L2 Meas. Ll L2 Meas. Ll L2 Meas. Ll L2 Brook 9 56 56 8 25 25 8 13 13 15a 60 33 40 43 33 Brown 9 56 56 8 100 100 8 88 88 15a 87 87 40 83 83 Combined 9 44 33 8 100 88 8 75 75 15a 73 40 40 72 55
* There was no creel census information available from TZ<! having both wild brook trout and wild brown trout present in sympatry.
**Number of measurements. a Two time periods of data on lbs trout/mile were utilized from the TZ on the Kinnickinnic River, i.e., lbsjmile in April
before and after habitat development and lbsfmile in October before and after habitat development. All other TZ., provided one measurement of success per TZ.
Success Rates by Type of Development
Table 7 provides a collation of success rates categorized by the predominant type of habitat development. Only the 4 trout population characteristics are tabulated for success or failure. The well-known bank cover and current deflector technique that was pioneered in Wisconsin to improve trout habitat produced excellent results among projects initiated before and after 1977. A total of 40 percentage changes in some population variable was determined on 10 streams where the bank cover/current deflector technique was featured. Success at levell was achieved at an 85% rate (34 of 40). At level2 the achievement rate was 78% (31 of 40). Development projects of this type were slightly more successful after 1977.
The technique of stream bank debrushing and/or brush bundles produced rather disappointing results based on data from 9 TZs. Levell success was observed for only 34% of 32 variables quantified, and only 28% of the postdevelopment changes in trout populations showed increases to level 2.
For all types of development projects evaluated, post-1977 projects were more successful than pre-1977 projects at both levels of arbitrary success selected to judge changes in trout population characteristics.
Among all 45 case histories and 178 documented changes in trout populations in the TZs, 59% of the postdevelopment changes reached levell, and 42% reached level2.
Table 8 provides a more detailed analysis of success rates categorized by both the predominant type of development technique employed and by trout species present. A particularly important insight that this table provides, which is not evident in Table 7, is the contrast in success rates for wild brook trout in the presence and absence of wild brown trout.
In TZs holding only wild brook trout (allopatry) and where intensive habitat development was carried out by installing bank covers and current deflectors, 18 of 19 population variables increased after development by at least 50%. In TZs where similar development was done, but where wild brook trout and wild brown trout were both present (sympatry), only 2 of the 18 population characteristics for brook trout improved by 50% or more. In these same TZs, however, 17 of 18 characteristics of brown trout populations showed postdevelopment gains of at least 50%.
Superior performance by wild brown trout in sympatry with wild brook trout is probably a reflection of at least 2 factors: (1) direct interspecific competition in which brown trout dominate and occupy the best habitat niches available (Fausch and White 1981, Waters 1983), and (2) greater angler exploitation of brook trout (Avery 1983). This exploitation is exacerbated if angler use increases when TZs are made more attractive to anglers. Unfortunately, from the perspective of present DNR trout management philosophy, which
TABLE 7. Arbitrary success rates for 4 trout population vari-ables, summarized by the predominant type of habitat develop-ment applied in the treatment zones (TZs) and by 2 time periods.* Levell (Ll) success = 25% increase and level2 ( L2) success = 50% increase.
Predominant Type No. % Successful of Habitat Develol!ment Meas.** Ll L2 Bank covers and
current deflectors Before 1977 16 75a 62" After 1977 24 92 88 Combined 40 85 78
Half-logs Before 1977 14 43 36 After 1977 0 Combined 14 43 36
Riprap Before 1977 2 0 0 After 1977 2 100 50 Combined 4 50 25
Stream bank debrushing and/or brush bundles
Before 1977 23 49 35 After 1977 9 11 11 Combined 32 38 28
Stream bank debrushing and half-logs
Before 1977 20 70 40 After 1977 17 53 12 Combined 37 62 27
Other combinations Before 1977 26 58 31 After 1977 25 52 40 Combined 51 55 35
All types of improvement Before 1977 101 57 39 After 1977 77 61 45 Combined 178 59 42
* The population variables measured included one or any combina-tion of: total no. trout/mile, no. trout/mile ;.6 inches, no. trout/ mile ;.10 inches, and totallbs trout/mile.
**Number of measurements. a Interpretation example: On streams receiving bank covers and
current deflectors, 75% of 16 measurements of population vari-abies made in TZ., where evaluation began before 1977 showed postdevelopment percentage increases of at least 25%; 62% of the percentage increases exceeded 50%. 1

8
TABLE 8. Arbitrary success rates for 4 trout population f!ariables, summarized by the type of habitat def!elopment applied in the treatment zones (TZs) and by the category of trout species present.* Levell (Ll) success = 25% increase and level2 (L2) success = 50% increase.
Trout Species Single species present Wild brook Wild brown Domestic
brown
Two species present Wild brook Wild brown Combined
Wild brookb Domestic
brookb Combined
Wild brown Domestic
brown Combined
Three speeies present Wild brook Wild brown Wild rainbow All combined
Bank Covers and Current
Denectors
No. %Sue. Meas.** L1 L2
19 95" 95" 12 67 67
18 17 11 18 100 94 18 89 72
Half-1~
No. %Sue. Meas. L1 L2
16 38 31
Stream Bank De brushing
and/or Brush RockRi~ra~ Bundles
No. %Sue. No. %Sue. Meas. L1 L2 Meas. L1 L2
19 36 21 2 100 50 8 25 25
2 0 0 2 50 50
4 50 50
1 0 0 1 100 100 1 100 100 1 100 100
Stream Bank De brushing Other All Structure
and Half-1~ Combinations · Tx:Qes
No. %Sue. No. %Sue. No. %Sue. Meas. L1 L2 Meas. L1 L2 Meas. L1 L2
18 44 39 56 59 52 38 58 26 15 60 27 91 54 33
4 25 25
1 100 0 21 57 52 40 40 33 1 100 100 21 71 71 40 83 83 1 100 0 21 52 43 40 72 55
4 50 50
1 100 100 1 100 100
1 100 100 1 100 100 1 100 100 1 100 100
1 0 0 1 100 100 1 100 100 1 100 100
* The population variables measured were: total no. trout, no. ~ 6 inches, no. ~ 10 inches, and total biomass. •• Number of measurements.
• Interpretation example: On streams receiving bank covers and current deflectors, 95% of 19 measurements of population variables in TZs holding only wild brook trout showed postdevelopment percentage increases of at least 25%; 95% of the 19 measurements also showed postdevelopment percentage gains of at least 50%.
b The combination of wild and domestic brook trout was present in 2 TZs on Behning Creek, but only the combined responses of these mixed stocks were cited in the source documents for the evaluation of stream bank debrushing carried out on these 2 TZs.
stresses more attention to management of brook trout because of its endemic status, none of the present habitat development techniques appear to favor brook trout more than brown trout in sympatric situations. Species-specific regulations, providing more protection for brook trout, appear to be a better alternative than either stopping habitat development in streams holding brook and brown trout or waiting until enhancement techniques favoring brook trout are devised.
Empirical Changes in Trout Population and Sport Fishery Variables
In 13 TZs holding only wild brook trout (Table 9), average postdevelopment density of trout of all sizes increased by 15%, and average density of legal-sized brook trout increased by 37% (to 421/mile). Average postdevelopment biomass was approximately 35% greater than predevelopment biomass (104lbsfmile vs. 77 lbsjmile).
In 15 TZs holding wild brown trout only, average postdevelopment density increased by 21%, legal-sized browns increased an average of 42% (to 1,312/mile), and average biomass improved by 43% (to 402lbsfmile).
In 13 TZs holding sympatric stocks of wild brook and brown trout, average abundance of trout increased by 36%,
average abundance of those 6 inches or larger increased by 26%, and average biomass improved by 78%. For all3 population characteristics, as well as for trout per mile 10 inches or larger, brown trout showed consistently greater proportional improvements after development.
For all 41 TZs combined (31.8 miles), the average postdevelopment gains were 21% for trout of all sizes, 35% for trout 6 inches or larger, 56% for trout 10 inches or larger, and 49% for trout biomass (Fig. 2). In the 4 TZs where creel census was carried out before and after habitat development, there was an average increase of 79% in angler use (to 590 hours/mile), and harvest increased by an average of 41% (to 281 trout/mile) (Fig. 2).
Table 10 provides empirical summaries for wild brook trout in TZs grouped by 3 principal types of habitat development applied. Four TZs (3.9 miles) featured bank covers and current deflectors, 5 TZs (1.6 miles) featured stream bank debrushing and brush bundles, and 4 TZs (3.6 miles) received some other combination of development techniques.
The Wisconsin-style bank cover/current deflector technique produced excellent results in 4 TZs where the average number of trout present at inventory time increased by 160% (to 1,695/mile), and the average abundance of legalsized brook trout increased by 229% (to 615/mile). Average biomass showed a 230% improvement (to 155lbsjmile).
Debrushing/brush bundle projects were associated with much smaller percentage improvements in brook trout pop-

TABLE 9. Average empirical values for 4 characteristics of wild trout populations in 33 treatment zones before and after habitat development and the percentage change 4fter development.
Length Total No. Trout/Mile N o./Mile ;;. 6 Inches No./Mile ;;.10 Inches Lbs Trout/Mile Trout No. No. of TZs % % % % S11ecies Streams TZs (miles) Predev. Postdev. Change Predev. Postdev. Change Predev. Postdev. Change Predev. Postdev. Chanze Brook only 12 13 9.1 1,290 1,480 +15 307 421 +37 77 104 +35
Brown only 11 15 16.4 2,185 2,633 +21 925 1,312 +42 131 178 +36 282 402 +43
Brook and brown 10 13 6.3
Brook 383 465 +21 363 324 -11 5 2 -60 55 50 -9 Brown 584 847 +45 313 529 +69 45 119 +164 83 196 +136 Combined 967 1,312 +36 676 853 +26 50 121 +142 138 246 +78
Total 33 41 31.8 Average 1,609 1,940 +21 613 828 +35 100 157 +57 162 242 +49
TABLE 10. Average empirical values for 3 characteristics of wild brook trout populations in 13 treatment zones before and after habitat development and the percentage change after development. Trootment zones are grouped according to the predominant type of habitat development applied.
Length Total No. Trout/Mile No./Mile ;;.6 Inches Lbs Trout/Mile Predominant Type No. of TZs % % % of Habitat Develo11ment TZs (miles) Predev. Postdev. Change Predev. Postdev. Change Predev. Postdev. Change Bank covers/current deflectors 4 3.9 651 1,695 +160 187 615 +229 47 155 +230
Debrushingjbrush bundles 5 1.6 1,789 1,840 +3 382 445 +16 91 106 +16
Other combinations 4 3.6 1,308 827 -37 334 198 -41 90 53 -41
TABLE 11. Average empirical values for 4 characteristics of wild brown trout populations in 15 treatment zones before and after habitat development and the percentage change after development. Treatment zones a.re grouped according to the predominant type of habitat development applied.
Predominant Length Total No. Trout/Mile N o./Mile ;;. 6 Inches No./Mile ;;.10 Inches Lbs Trout/Mile Type of Habitat No. of TZs % % % % Develo11ment TZs (miles) Predev. Postdev. Change Predev. Postdev. Change Predev. Postdev. Change Predev. Postdev. Change Bank covers/current
deflectors 2 1.3 207 778 +276 191
De brushing/brush bundles 1 0.5 2,102 2,440 +16 849
Debrushing/half-logs 5 2.6 4,517 4,706 +4 1,417
Rock riprap 1 1.1 392 528 +35
Half-logs 1 0.5 1,264 2,229 +76
Other combinations 5 10.4 1,203 1,842 +53
AVG. PERCENTAGE INCREASE AFTER HABITAT DEVELOPMENT 10 20 30
TOTAL TROIJT/MILE
Tl'lOlJTIMLE ~10 NCt£5
TOTAL L B SIMILE
ANGLER tiClUlSIMILE
TROIJT CREELED/MILE
FIGURE 2. Average percentage increase in 4 trout population variables and 2 sport fishery variables measured in 6 treatment zones containing wild brook trout and/or wild brown trout.
452
777
626 +228 61 114 +87
1,285 +51 78 142 +82 279 279 0
1,777 +25 208 248 +19 390 492 +26
28 52 +86
1,327 +194 40 114 +185 110 316 +187
997 +28 189 341 +80
ulation characteristics. In the TZs where other combinations of techniques were used, brook trout declined in average abundance and average biomass.
In Table 11 quantitative changes in wild brown trout populations are categorized by 6 types of habitat development. All6 kinds of techniques were associated with positive changes in postdevelopment standing stocks. The most impressive gains in total number and number 6 inches or larger were recorded in TZs where bank covers and current defl.eetors were installed-an average 276% increase in total number per mile and an average 228% increase in legal-sized brown trout per mile.
Empirical changes in mixed populations of wild brook and brown trout were grouped according to 3 predominant types of development: 6 TZs where bank covers and current deflectors were installed, 1 TZ where stream banks were de brushed, and 6 TZs where a variety of techniques were employed to improve trout habitat (Table 12).
The number of legal-sized trout per mile was measured in all 6 TZs receiving bank cover/current deflector development. On average, postdevelopment abundance of brook 9

10
trout declined in these zones by 23%, whereas postdevelopment abundance of legal brown trout increased by an average of 87%. For both species combined there was an average gain of 19% (to 829/mile).
The same pattern was true for biomass in 5 of the 6 TZs receiving bank covers/current deflectors where biomass was determined before and after development. Average biomass of brook trout declined by 8%, but average biomass of brown trout increased by 197%. For both species combined, there was a 103% improvement after development (to 290 lbsjmile).
Postdevelopment changes in mixed populations were also generally positive in the 6 TZs where other combinations of techniques were applied. The parameter, trout per mile 6 inches or larger, was tracked in all 6 of these TZs for both species. Brook trout increased an average of 25%, brown trout an average of 52%, and both species an average of 45%. Biomass change by species was measured in only 3 of the 6 TZs. In these 3 there was an average 19% decline in biomass of brook trout but a 54% gain in biomass of brown
trout. For both species combined, the change was a positive 33% (to 172lbsjmile).
At least one of the trout population variables measured before and after habitat development showed a positive postdevelopment change in 10 of 13 TZs containing only wild brook trout, in all 15 TZs containing only wild brown trout, and in all 13 TZs containing mixed populations of these 2 species (Table 13).
In the "brook trout only" TZs, 22 of 39 (56%) population variables increased after development, and 16 of 39 ( 41%) decreased. One of the measured variables showed no quantitative average change.
In the "brown trout only" TZs, 39 of 47 (83%) population variables improved, and only 7 (15%) were lower, on average, after development.
In all41 TZs containing wild trout, 72% of the 185 measurements of change in population variables were positive, 26% were negative, and 2% showed no average change from predevelopment to postdevelopment periods.
TABLE 12. A11erage empirical flalues for 4 characteristics of mixed populations of wild brook trout and wild brown trout in 13 treatment zones before and after habitat detJelopment and the percentage change after development. Treatment zones are grouped according to the predominant type of habitat detJelopment applied.
Predominant Length Total No. TroutLMile No.LMile ~6 Inches No.LMile ~10 Inches Lbs TroutLMile Type of Habitat No. of TZs % % % % Develo:Qment TZs (miles) Predev. Postdev. Change Predev. Postdev. Change Predev. Postdev. Change Predev. Postdev. Change Bank covers/current
deflectors 6 2.9 Brook 490 902 +84 427 330 -23 4 2 -50 66 61 -8 Brown 193 1,025 +431 267 499 +87 46 129 +180 77 229 +197 Combined 683 1,927 +182 694 829 +19 50 131 +162 143 290 +103
De brushing/bundles 1 0.5 Brook 549 684 +25 Brown 11 47 +327 Combined 560 731 +31
Other combinations 6 3.0 Brook 365 392 +7 162 202 +25 9 3 -67 37 30 -19 Brown 649 817 +26 420 639 +52 41 66 +61 92 142 +54 Combined 1,014 1,209 +19 582 841 +45 50 69 +38 129 172 +33
TABLE 13. Summary of the positifle and negatifle changes obsertJed in 185 variables characterizing wild trout populations inhabiting 41 treatment zones after completion of habitat de11elopment. Variables and treatment zones are grouped by species composition.
No. (and%) TZs Showing No. Trout
One or More Population No. (and%) Variables That: No. No. Positive Negative Variables Increased Decreased No
S~ies Com:Qosition Streams TZs Change Change Measured After Dev. After Dev. Change Brook only 12 13 10(77) 7(54) 39 22(56) 16(41) 1(3)
Brown only 11 15 15(100) 3(20) 47 39(83) 7(15) 1(2)
Brook and brown 10 13 Brook 7(54) 9(69) 31 12(39) 18(58) 1(3) Brown 12(92) 1(8) 34 31(91) 2(6) 1(3) Combined 13(100) 4(31) 34 29(85) 5(15) 0
Total (and Avg. %) 33 41 57(93) 24(34) 185 133(72) 48(26) 4(2)

FISHERY MANAGEMENT AND RESEARCH IMPLICATIONS----
This compendium partially fills a long-neglected gap in DNR efforts to track results achieved by a major fisheries management program. Some 45 case histories of the consequences of habitat development projects on Wisconsin's trout streams are now consolidated under one cover, including 33 previously unpublished evaluations. The package is impressive in terms of the number of evaluations. It probably represents the largest such collection from any state or, indeed, from any combination of agency sources. However, geographic distributional gaps in evaluation of this major fisheries management program still remain. Lacking are case history evaluations from several counties where substantial sums of money have been spent to implement trout habitat development projects. Have we been remiss in not recognizing the need to more fully evaluate on a broad geographic basis this major management thrust? Or is the time frame a factor, since accelerated funding for this program has been in place only since 1977?
At least part of the answer to these questions lies in the responses received from some fish managers to my original request for input. Several fish managers responded to this statewide memorandum request for file data with replies that evaluations were in progress, in accordance with recent internal DNR guidelines to assess trout population responses during the third and fifth postdevelopment yearsyears that had not yet arrived. Other responses reported that field phases of evaluations had been completed but data collections had not yet been analyzed.
Completion of evaluations that are in progress or awaiting analysis and write-up will help to substantially fill in many of the present distributional gaps and should also provide representative examples for techniques not included in the present compilation of evaluations.
To maximize the usefulness of these future evaluations, however, their inclusion in some kind of second edition of this compendium would be necessary. Perhaps if the present
compendium proves sufficiently useful to DNR fish managers and fishery administrators, a long-range strategy of updating its contents at regular 5-10 year intervals would also be desirable.
Although little mention is made of individual case histories in the results portion of this compendium, I encourage readers to examine these case history summaries. One or more may be useful to specific investigative needs or interests. For example, a fish manager contemplating first-time application of a habitat development technique may find it helpful to get some idea of the kind of results to expect by reviewing a case history or two for a similar application or physically similar stream (Table 1, Append. Table 3). Follow-up contact with a principal investigator might also provide additional guidance.
Selected case histories could also help individual managers interpret their evaluation results, whether a given technique is new or familiar, by providing background perspective from regionally similar streams. Trout streams in Wisconsin are known to vary considerably in potential carrying capacity from region to region, due to differences in basic productivity, water temperature regimes, spawning potential for trout, impacts of angler harvest, and a host of other biotic and abiotic factors. Managers could benefit, therefore, by reviewing case history evaluations from their region of the state, even if the specific development techniques differ.
Such region-specific comparisons of evaluations is a topic I would rank as particularly important to pursue if the present collection of case histories could be augmented with 20-30 more such summaries. In preparing this compendium, I did attempt some preliminary analyses of project results for a given technique within geographic regions, initially by comparing the northern half of the state with the southern half. But even with this very broad grouping of evaluations by technique and region, the data sets were quite small. Ad- 11

12
ditional classification, according to the species of trout involved and whether those trout were wild or domestic, further reduced subsample size. I decided that reporting any regionally focused summaries was not worthwhile for the purposes of this compendium. However, I still recommend that individual managers consider use of appropriate case histories in this compendium based on the combination of geographic location and technique, a combination that could provide them with planning guidance when a project is to be initiated and interpretative assistance when project results are evaluated.
Particularly distinctive attributes characterize 3 of the 45 case histories, attributes that could influence future applications of habitat development techniques and the manner in which evaluations are conducted.
The Foulds Creek case history is distinctive because the principal investigator, Jeffrey Roth, went beyond quantification of the abundance and biomass of brook trout to include the same parameters for 2 nontarget species common in many Wisconsin trout streams, creek chub (Semotilus atromaculatus) and white sucker (Catostomus commersoni). The total number of both creek chubs and white suckers increased in the TZ after completion of habitat development, but the numbers of fish over 5.0 inches declined. Biomass of both species also declined. Roth's efforts to determine how habitat development influences such nontarget species of fish is an area of investigation that deserves more frequent attention in future evaluations.
The evaluation of habitat development on a portion of the Little Bois Brule River is characterized by 2 distinctive features. This case history is the only one in the compendium that includes trout population data on changes in abundance of rainbow trout in a TZ. Although this species of trout is much less common in Wisconsin streams than are brook trout or brown trout, little management or research attention has been directed to documenting how either domestic or wild stocks of rainbow trout (in allopatry or sympatry) respond to various types of habitat development.
The second unusual feature of the Little Bois Brule River case history is its emphasis on enhancing trout habitat to benefit anadromous salmonids, in this case brown trout and rainbow trout returning from Lake Superior. The principal investigator, Steven Schram, was particularly pleased that stream bank debrushing and installation of brush bundles in the TZ resulted in greatly increased amounts of exposed gravel substrate, which was subsequently used by spawning anadromous brown and rainbow trout. Postdevelopment abundance of age 0 stocks of both species greatly increased in the TZ. Such positive re~ults from this stream should encourage habitat development on other tributary streams to Lake Superior that are utilized by anadromous salmonids.
The third unusual case history is the evaluation on the Yellow River conducted by Rick Cornelius. The sympatric combination of wild brook trout and wild brown trout was present in 10 of the 43 streams and 14 of the 55 TZs included in this compendium. The Yellow River evaluation represents the only example where brook trout increased proportionately more than did brown trout after habitat development, and this happened in both TZs that were part of this evaluation. Unfortunately, there was no evidence gathered that would help to explain the exception to the "rule" that brook trout tend to benefit less than brown trout when both species are present in a TZ. There was nothing unusual about the techniques applied or the intensity of application, and brook trout seemed to fare better than did brown trout despite suspicions by the principal investigator that angler use and harvest increased in both TZs after completion of the habitat development project.
Case history evaluations weak in experimental design dominate the present compendium, and they were given the· same importance as those reports based on more comprehen-
sive evaluations in determining relative success rates. This bias should be kept in mind when readers reflect upon reported composite results. Many of the evaluations now in progress appear to be based on better experimental design and, hopefully, any new evaluations being planned will also incorporate more rigorous design. I am, therefore, optimistic that a better foundation for deriving more confident and more useful conclusions about the effectiveness and versatility of trout habitat management will be available in the near future.
There is, however, one weakness in experimental design that needs special attention if it is to be rectified. This weakne& is the lack of reliable creel census information on angler use and harvest before and after habitat development.
Several of the principal investigators commented in their source documents that greatly increased use and harvest were suspected in TZs after development, but they had no hard data to validate their suppositions. Documented postdevelopment reductions or modest increases in standing stocks in some TZs may have been caused by increased harvest, not depression of trout carrying capacity.
Reliable creel census studies are, admittedly, expensive to conduct. However, until more such studies are incorporated into evaluations of trout habitat development projects, a definitive picture of the statewide impact of such development on stream trout fisheries will not be possible. Particularly high priority should be given to one or more predevelopmentjpostdevelopment creel census studies associated with paired RZs and TZs containing wild brook trout and wild brown trout.
High priority should also be given to new research or management evaluations on streams where angler harvest could be experimentally delayed by imposing temporary refuge status conditions. Alternatively, the confounding impacts of harvest on measurements of enhanced trout carrying capacity could be greatly reduced by applying some type of catch and release regulations for a few years.
Future applications of specific habitat development techniques could also be sharpened by initiating a series of follow-up evaluations on some of the streams referred to in this compendium, especially those where good experimental designs were used. Such reactivated evaluations could be invaluable in determining long-term management consequences. Perhaps some projects initially thought to be unsuccessful were not evaluated long enough to detect gradual improvements in trout carrying capacity and restabilization of trout populations, while other projects may have provided shortterm benefits that were not sustained in the long run. Few government agencies involved in trout stream habitat management have the opportunity that the Wisconsin DNR now has to investigate such long-term ramifications of one of the important trout fishery management tools.
If DNR funds continue to be inadequate to carry out more frequent and more detailed evaluations, including creel census, perhaps serious thought should also be given to modifying present restrictions on how trout stamp funds can be spent. An annual investment of 5-10% of such revenue to evaluate the results achieved by the remaining 90-95% may be "an idea whose time has come."
With the thought in mind that an updated version of this compendium may eventually be justified, I solicit from interested readers any suggestions for improvements for a second edition. Suggestions regarding 2 features are especially encouraged:
(1) How might the present standard format for summarizing case histories be modified to make it more useful?
(2) What other simple and broadly applicable indices of success could be used to judge results obtained from a habitat development project?

CASE HISTORIES----Stream Allenton Creek Beaver Brook Behning Creek Big Roche-a-Cri Creek Clam River Coon Creek (Bohemian Valley) Creek 12-6 Doc Smith Branch Dogtown Creek Eddy Creek Elk Creek Emmons Creek Foulds Creek Hay Creek Hunting River-station 1 Hunting River-station 2 K. C. Creek Kinnickinnic River Kinnickinnic River Lawrence Creek Lepage Creek Little Bois Brule River Little Plover River Lunch Creek Maclntire Creek McKenzie Creek Middle Branch Embarrass River Mt. Vernon Creek Neenah Creek-station 1 Neenah Creek-station 2 Nichols Creek North Branch Trempealeau River Parker Creek Plover River Prairie River-section 35 Prairie River-Trantow station Radley Creek Rosenow Creek Rowan Creek South Fork Main Creek Spring Creek Tank Creek West Branch White River Willow Creek Yellow River
Principal Investigator(s) J. Holzer S. Johannes R. Cornelius R. White R. Cornelius L. Frankenberger J. Talley, T. Babros R.Kerr S. Johannes F. Pratt D. Erickson R. Hunt J. Roth T. Thuemler A. Hauber A. Hauber T. Thuemler B. Apelgren L. Frankenberger R. Hunt T. Thuemler S. Schram R. Hunt R. Hunt T. Thuemler R. White, G. Lowry R. Langhurst C. Brynildson S. Ironside S. Ironside J. Nelson J. Talley, T. Babros R. Hunt A. Hauber A. Hauber A. Hauber R. Hunt R. Schumacher T.Larson F. Pratt R. Hunt J. Talley, T. Babros R. Hunt R.Kerr R. Cornelius
Page 14 15 16 17 18 19 20 21 22 23 24 25 Z6 27 28 29 30 31 32 34 36 37 38 40 42 44 45 46 48 49 50 51 52 53 54 56 57 59 60 63 64 65 66 67 68 13

14
ALLENTON CREEK Washington County
Domestic Brown Trout
DESCRIPTION OF STREAM: 2.5 miles total length, 2.5 miles trout water, 6ft average width, 15 ftjmile average gradient, 290 ppm total alkalinity
TYPE OF DEVELOPMENT/ENHANCEMENT: Stream bank debrushing
STUDY PERIOD AND DESIGN: One 0.95-mile TZ and one 0.52-mile RZ upstream from the TZ. Brown trout in the study zones were censused in August 1974 and April1976. The April estimate was made prior to the annual stocking of legal-sized yearling brown trout. Stream banks were debrushed during January-February 1974. Physical data on changes in the study zones were reported based on 5 crosschannel transect sites where water depth and bottom contours were determined in 1974 and 1976.
PRINCIPAL INVESTIGATOR: James Holzer
SUMMARY OF FINDINGS: The natural marsh meadow RZ held 5 times as many domestic brown troutjmile as the TZ in August 1974, and about 3 times as many in August 1976. Average postdevelopment size of trout in the 2 study zones differed substantially, however, in favor of the TZ. Consequently, proportional changes in biomass from 1974 to 1976 were much different than the proportional changes seen in the abundance of trout present (Fig. 3).
The TZ held 56% less biomass than the RZ in 1974 but in April 1976, after development, the TZ held 61% more pounds of brown trout/mile than the RZ.
Brown trout in the TZ in April 1974 averaged 1.0 lb. Those in the RZ had an average weight of 0.2 lb.
At 4 cross-section sites monitored in the TZ, average stream width decreased by 30% after debrushing (from 26.2 ft to 18.4 ft). Average depth, however, did not increase as anticipated. The dense growth of woody vegetation in the TZ prior to debrushing apparently produced a damming effect that impounded stream flow and increased normal depth.
SOURCE DOCUMENT Holzer, J. A., Wis. Dep. Nat. Resour., intradep. memo. toR. F. Winnie, 17 January 1977.
300
~ 200 ::il
~ f-z :;:: 1E 100 CD
-65%
PRE POST DEVELOPMENT
No./M\LE
0REFERENCE ZONE
Efj TREATMENT ZONE
PRE POST DEVELOPMENT
LBS/MILE
300
LJJ ...J
2oo::il ;:::: => 0 a:: fz
~ 100(/')
CD ...J
FIGURE 3. Abundance and biomass of domestic brown trout in the reference zone and treatment zone on Allenton Creek before (August 197 4) and after ( April1976) habitat development.

BEAVER BROOK Washburn County
Wild Brook Trout and Wild Brown Trout
DESCRIPTION OF STREAM: 3.5 miles total length, 3.5 miles trout water, 13ft average width, 37 ft/mile average gradient, 109 ppm total alkalinity
TYPE OF DEVELOPMENT/ENHANCEMENT: Stream bank de brushing, brush bundles, bank covers, current deflectors, and riprap
STUDY PERIOD AND DESIGN: One 0.50-mile TZ and one adjacent upstream 0.37-mile RZ. Standing stocks of age I+ trout were measured in early July of 1974 and 1975. Stream bank debrushing was carried out during the summers of 1974-75, bank covers were installed during 1976-79, and additional bank covers, current deflectors, brush bundles, and riprap were added during 1980. Postdevelopment assessments of standing stocks were made in July of 1981-83. TZ changes in average width and surface area were based on measurements made in 1974 and 1983.
PRINCIPAL INVESTIGATOR: Stanley Johannes
SUMMARY OF FINDINGS: Wild age I+ brook trout (total no. trout/mile) were 25% more abundant in the TZ after habitat development, but there was a 91% increase in average abundance of age I+ brook trout in theRZfrom 1974-75 to 1981-83 (Table 14). Legal-sized brook trout increased in both study zones (by 45% in the RZ and by 65% in the TZ).
Three indices of changes in standing stocks of wild brown trout were compared in the 2 study zones for the 1974-75 and 1981-83 periods (Table 14). Changes were proportionately greater in the TZ than in the RZ for total number of age I+ brown trout/mile (a 125% increase in the TZ vs. a 2% decrease in the RZ), legal-sized trout/mile (up 125% in the TZ and up 44% in the RZ), and quality-sized trout/mile (a 107% improvement in the TZ and only an 8% improvement in the RZ).
Prior to habitat development, the TZ held more age I+ brook trout than brown trout (862/mile vs. 780/mile). After development, brown trout were dominant in the TZ (1,076 brook trout/mile vs. 1,297 brown trout/mile).
Trout 6 inches or larger (both species combined) were 35% more abundant in the RZ than in the TZ during 1974-75. This relationship was reversed during 1981-83 despite a 45% average increase in legal-sized trout in the RZ. This increase was more than offset by an average gain of 98% in the TZ, so that during midsummer the TZ held 2% more legalsized trout than the RZ for the 3-year period (1981-83).
Brown trout 10 inches or larger were more common in the RZ than in the TZ during the predevelopment period (146/ mile vs. 96/mile ). After habitat development, the TZ held 26% more quality-sized brown trout/mile than did the RZ (199/mile vs. 158/mile).
Except for changes in relative abundance of age I + brook trout, the TZ showed much greater gains in standing stocks of brook trout and brown trout than the RZ. and brown trout fared better in the developed TZ than brook trout (Fig. 4).
Average width of the TZ was reduced by 27% after development (from 16.0 ft to 11.7 ft). Surface area decreased from 0.96 acre to 0.71 acre.
SOURCE DOCUMENT Johannes, S. 1., Wis. Dep. Nat. Resour., intradep. memo. to R. L. Hunt, 9 October 1985.
TABLE 14. Average abundance of wild brook trout and wild brown trout in the reference zone and treatment zone on Bea-ver Brook in July before (197.1,.-75) and after (1981-83) habitat development.
Trout Population Study Predev. Postdev. •;. S2ecies Characteristic* Zone Avg. Avg. Change Brook Total no./mile RZ 489 932 +91
TZ 862 1,076 +25
No./mile RZ 227 330 +45 ;;.6 inches
TZ 432 713 +65
Brown Total no./mile RZ 2,170 2,125 -2 TZ 780 1,297 +66
No./mile RZ 1,070 1,545 +44 ;;.6 inches
TZ 532 1,197 +125
No./mile RZ 146 158 +8 ;;.10 inches
TZ 96 199 +107
Combined Total no./mile RZ 2,659 3,057 +15 TZ 1,642 2,373 +45
No.jmile RZ 1,297 1,875 +45 ;;.6 inches
TZ 964 1,910 +98
* No data reported for brook trout ;;.10 inches.
(POSTDEVELOPMENT AVG.) PERCENTAGE CHANGE PREDEVELOPMENT AVG.
-50
Total No/mile
No/mile <:6inches
BROWN TROUT
Total No./mile
No/mile <:6inches
No/mile <:IOinches
50 100 150 200
0REFERENCE ZONE
I'JTREATMENT ZONE
+!25
+125
FIGURE 4. Percentage change in abundance of age I+ wild brook trout and wild brown trout in the reference zone and treatment zone on Beaver Brook in July, before (197.1,.-75) and after ( 1981-83) habitat development.
15

16
BEHNING CREEK Polk County
Wild and Domestic Brook Trout
DESCRIPTION OF STREAM: 0.9 mile total length, 0.9 mile trout water, 6ft average width, 2ft/mile average gradient, 86 ppm total alkalinity
TYPE OF DEVELOPMENT/ENHANCEMENT: Stream bank debrushing
STUDY PERIOD AND DESIGN: Two TZs, a 0.14-mile zone established in 1975 (TZ 1) and a 0.11-mile zone established in 1976 (TZ 2). No RZ. No quantitative data were collected on changes in the physical habitat. Woody stream bank vegetation was removed from both banks of the TZs during the winters of 1975-76 and 1976-77. Six postdevelopment inventories were made in TZ 1 beginning in the spring after development (1976-81), and 5 postdevelopment inventories were made in TZ 2 during 1977-81. The first trout population assessment in each zone, soon after de brushing, is classified as a "predevelopment" measure in the "Summary of Findings" below.
Trout population estimates were based on one-run electrofishing collections, not mark-recapture estimates. Collecting efficiency in this small stream (base flow about 2 cfs during sampling periods) was believed to be excellent.
PRINCIPAL INVESTIGATOR: Rick Cornelius
SUMMARY OF FINDINGS: In TZ 1, abundance of brook trout in the spring declined during the first 3 postdevelopment years and then increased during the 4th and 5th years, but postdevelopment abundance never reached the predevelopment density of 257/mile (Fig. 5). Average postdevelopment abundance for legal trout was 68% below the predevelopment density of 200/mile.
In TZ 2, different trends evolved. Postdevelopment abundance of brook trout increased initially, declined in 1979, and then increased in 1980 and 1981. Average postdevelopment density was 666/mile, a value 56% greater than the predevelopment density of 427/mile (Fig. 6). Legal-sized brook trout increased in TZ 2 during the first postdevelopment year followed by 3 years of lower densities. The 4-year postdevelopment average density of 175 legal-sized trout/ mile was 92% greater than the predevelopment density of 91/mile.
Evaluation was complicated by the stocking of 2,000 (approximately 1,500/mile) age 0 domestic brook trout in May 1979 to bolster the low densities of wild brook trout observed during electrofishing inventories in both study zones in April. Potential contributions of survivors from this introduction were not quantified separately from wild brook trout when population estimates were made in the spring of 1980 and 1981.
Trout habitat appeared to be greatly improved in both study zones based on qualitative observations of decreased channel width, increased depth, increased aquatic vegetation, and more gravel substrate. Increased angler use was suspected due to improved fishing conditions.
SOURCE DOCUMENTS Cornelius, R., Wis. Dep. Nat. Resour., intradep. memo. to the District Director, 21 February 1981.
Cornelius, R., Wis. Dep. Nat. Resour., pers. comm. toR. Hunt, n.d.
300
~ ::;: • ' _J
a: 0.. s \!) 200 0 z 12 0.. <J) •-36" ~ UJ _J
:i ;::: 100 => 0 a: t-
"' 0 0 a: CD
1976 1977 1978 1979 1980 1981 1977-81 AVG.
PREDEVELOPMENTt- POSTDEVELOPMENT-t
FIGURE 5. Abundance of wild and domestic brook trout in treatment zone 1 on Behning Creek in April-May before (1976) and after (1977-81) habitat de1Jelopment. Percentage change from prede1Jelopment is indicated next to the postde1Jelopment average.
1,200
~ ::;- 1,000 _J
a: ~ ~ 800 ~ a: g; ~ 600
~ :i ;::: 400
~ 5 200 0
!E
•
0
1977 1978 1979 1980 1981
PREDEVELOPMENTJ4- POST DEVELOPMENT +f 1978-81
AVG.
FIGURE 6. Abundance of wild and domestic brook trout in treatment zone 2 on Behning Creek in April-May before (1977) and after (1978-81) habitat de1Jelopment. Percentage change from predevelopment is indicated next to the postde1Jelopment a1Jerage.

BIG ROCHE-A-CRI CREEK Waushara County
Wild Brook Trout
DESCRIPTION OF STREAM: 15.0 miles total length, 15.0 miles trout water, 17ft average width, 7 ftjmile average gradient, 140 ppm total alkalinity
TYPE OF DEVELOPMENT /ENHANCEMENT: Bank covers and current deflectors
STUDY PERIOD AND DESIGN: Habitat development was carried out over 60% of a 6.7-mile portion of the stream during a 7-year period (1956-62). Eight TZs and 4 RZs were established. This compendium report covers only one 1.16-mile TZ where development was done during 1961-62. Comparisons of physical and biological data involving an RZ are included in the primary source document. TZ vs. RZ comparisons resulting from this long-term study are too complex to summarize in the brief format of this compendium.
Trout population data for the TZ covered here were collected in April of 1959-60, 1963-66, and 1975. Physical characteristics of the TZ, measured before and after development, included midchannel depth, average width, and the width:depth ratio. Creel census studies were conducted during 3 predevelopment years (1957-59) and 2 postdevelopment years (1963-64).
PRINCIPAL INVESTIGATOR: Ray White
SUMMARY OF FINDINGS: Postdevelopment midchannel length of the TZ increased by 11% as a result of enhancing the meander pattern of the channel with bank covers and current deflectors. Average width was reduced by 18% (from 21.7 ft to 17.9 ft), and the depth:width ratio of the TZ channel increased by 143% (from 0.07 to 0.17). These physical changes were all considered beneficial to trout carrying capacity.
Abundance of age I+ brook trout (total no. trout/mile) in April increased from a predevelopment average of 394/ mile to a postdevelopment average of 457/mile for the 1963-66 period, a 16% increase. In April1975, 13 years after completion of development, the TZ held 1,976 age I+ brook trout or 402% more than the predevelopment average (Fig. 7). Brook trout 6 inches or larger and 8 inches or larger showed even more dramatic short-term and long-term improvements compared with predevelopment averages.
Changes in biomass were also dramatic, with an average 159% increase during the initial 3-year postdevelopment phase (from 17lbs/mile to 44lbs/mile) and an 859% jump to 163 lbs/mile in April1975.
Average angler use during 2 years of the postdevelopment period declined from 3-year predevelopment averages. Trips/mile in the TZ were 17% lower and hours/mile were 12% lower (Append. Table 2). Average harvest, however, increased by 96% after development (from 96/mile before to 188/mile after), and catch rate obviously improved greatly, too.
SOURCE DOCUMENTS White, R. J.
1972. Responses of trout populations to habitat change in Big Roche-a-Cri Creek, Wisconsin. Univ. of Wis., Madison. PhD Thesis. 278 pp.
White, R. J. and R. L. Hunt 1969. Regularly occurring fluctuations in year class
strength of two brook trout populations. Trans. Wis. Acad. Sci., Arts, and Lett. 57:135-53.
Wisconsin Department of Natural Resources 1975. Unpubl. Cold Water Res. Group waters inventory
file.
+402"
1,500
01959-60 PREDEVELOPMENT AVG.
~1963-66 POSTDEVELOPMENT AVG.
ml!JI975 POSTDEVELOPMENT
~10 INCHES
FIGURE 7. Number and biomass of wild brook trout in a 1.2-mile treatment zone on Big Roche-a-Cri Creek before (1959-60) and after (1963-66 and 1975) habitat deoolopment.
17

18
CLAM RIVER Polk County
Wild Brook Trout and Wild Brown Trout
DESCRIPTION OF STREAM: 22.8 miles total length, 17.5 miles trout water, 20 ft average width, 15 ft/mile average gradient, 22 ppm total alkalinity
TYPR OF DEVELOPMENT/ENHANCEMENT: Stream bank debrushing and half-logs
STUDY PERIOD AND DESIGN: One 0.47-mile TZ. No RZ. Trout in the TZ were inventoried in July 1978, just prior to initiation of habitat development. Woody vegetation was removed from both stream banks and 100 half-logs (213/mile) were installed. Follow-up inventories of trout in the TZ were made in July 1979 and 1980, August 1981, and July 1982. Abundance of age 0 trout was not estimated. Data are presented in the summary below for age I+ trout 6 inches or larger and 8 inches or larger. Changes in physical features of the TZ were not quantified.
PRINCIPAL INVESTIGATOR: Rick Cornelius
SUMMARY OF FINDINGS: Both trout species benefitted from habitat development, with brown trout showing the gre;lter responses (Table 15). The 4-year postdevelopment average number of legal-sized brook trout exceeded the predevelopment value by 25%. For legal-sized brown trout, the average gain was 327%. Brook trout, however, was the numerically dominant species before and after development, accounting for 98% of all legal-sized trout present in July 1978 and an average of 94% of those present in July or August of 1979-82.
For all trout 8 inches or larger, brook trout accounted for 93% of the predevelopment total of 55/mile and 77% of the postdevelopment average of 109/mile.
SOURCE DOCUMENT Cornelius, R., Wis. Dep. Nat. Resour., intradep. memo. to R. Hunt, 14 February 1984.
TABLE 15. Abundance of wild brook trout and wild brown trout in the treatment zone on the Clam River in July-August before ( 1978) and after ( 1979-82) habitat development.
Trout Predev. Postdev. % Po11ulation Characteristic Sl!!!£ies Value Avg. Change No./mile ~6 inches Brook 549 684 +25
Brown 11 47 +327 Combined 560 731 +31
No./mile ~8 inches Brook 51 84 +65 Brown 4 25 +525 Combined 55 109 +98

COON CREEK (BOHEMIAN VALLEY) La Crosse County
Wild and Domestic Brown Trout
DESCRIPTION OF STREAM: 30.1 miles total length, 9.0 miles trout water, 12 ft average width, 40 ft/mile average gradient, 224 ppm total alkalinity
TYPE OF DEVELOPMENT/ENHANCEMENT: Fencing, riprap, bank covers, current deflectors, and 3 flood control dams in headwater tributaries
STUDY PERIOD AND DESIGN: Two adjacent TZs established in 1955. No RZ. Habitat development was carried out in upstream, 2.6-mile TZ 2 (section B) during 1955-57. The 3 flood control dams were installed in 1959 after it appeared that the 1955-57 development effort showed no benefits because of the destruction of physical habitat and spawning sites due to flooding. Development in 0.75-mile TZ 1 (section A) was carried out during 1964.
Trout population inventories were conducted each spring and fall during 1958-67. These inventories provide comparisons of predevelopment vs. postdevelopment standing stocks in TZ 1 but only a long-term postdevelopment trend for standing stocks in TZ 2. Domestic brown trout, stocked annually, were all marked prior to release. Consequently, separate estimates were made of surviving domestic trout and wild trout in each study zone. Population estimates included wild age 0 individuals in the fall and age I or older individuals in the spring.
No data on changes in the physical quality of the study zones are included in the source document.
PRINCIPAL INVESTIGATOR: Ludwig Frankenberger
SUMMARY OF FINDINGS: TZ 1 supported very sparse populations of wild and domestic brown trout during the spring and fall of 1960-63 (Table 16). Virtually all of the domestic brown trout stocked after the spring census in this zone either were caught by anglers during the first few weeks of the fishing season in May, moved out, or died.
Dramatic percentage increases in abundance of wild brown trout occurred in this zone after habitat development was completed in 1964 but average densities remained lowonly 59 trout/mile in the spring and 75 trout/mile in the fall of 1965-67. A few more domestic trout were also present during the postdevelopment phase, but densities remained very low.
A major focus of the discussion in the source document concerns the reduction of flood impacts on trout habitat through the combination of flood control dams and instream additions of bank covers and current deflectors. The higher densities of wild and domestic brown trout observed in TZ 2 during 1960-67 are attributed to this combination of management activities.
SOURCE DOCUMENT
Frankenburger, L. and R. Fassbender 1967. Evaluation of the effects of the habitat management
program and the watershed planning program on the brown trout fishery in Bohemian Valley Creek, La Crosse County. Wis. Dep. Nat. Resour. Fish Manage. Rep. No.16. 19 pp.
TABLE 16. Abundance of wild and domestic brown trout in Coon Creek (Bohemian Valley) in the spring and fall before (1960-63) and after (1965-67) habitat def!elopment in treatment zone 1 and after def!elopment only (1960-67) in treatment zone 2.
No./Mile in S~rinK No./Mile in Fall Type of Predev. Postdev. % Predev. Postdev. %
Stud~ Zone Brown Trout AVK· AvK. Chanie AVK· AVK· ChanKe Treatment zone 1 Wild 6 59 +883 4 75 + 1,775
(section A) Domestic 2 9 +350 2 12 +500 Combined 8 68 +750 6 87 + 1,350
Treatment zone 2 Wild -· 185 247 (section B) Domestic 40 56
Combined 225 303
• No data available. 19

20
CREEK 12-6 Jackson County
Wild Brook Trout
DESCRIPTION OF STREAM: 3.3 miles total length, 3.3 miles trout water, 8ft average width, 20ft/mile average gra~ dient, 11 ppm total alkalinity
TYPE OF DEVELOPMENT/ENHANCEMENT: Stream bank debrushing and brush bundles
STUDY PERIOD AND DESIGN: One 0.33~mile TZ estab~ lished in 1980. No RZ. Brook trout in the TZ were invent~ ried in April1980, yielding the only predevelopment ind~x. Habitat development began a few days later and was com~ pleted during 1980. Postdevelopment surveys of the stand~ ing stocks of trout in the TZ were made in April of 1981, 1982, and 1984. Several physical characteristics of the TZ were measured before and after habitat development.
PRINCIPAL INVESTIGATORS: James Talley and Timothy Babros
SUMMARY OF FINDINGS: Postdevelopment biomass of brook trout in the TZ declined steadily throughout the 1981 ~ 84 period from the predevelopment level of 55 lbs/mile (Fig. 8). The ~year postdevelopment average biomass of 36 lbs/
, mile represented a 35% decline from the predevelopment value, and the last measure, made in April1984, was 42% less than the predevelopment value.
Abundance of legal~ized brook trout increased the first year of the postdevelopment period by 13%, then declined by 44%, and then increased by 45%, but abundance in 1982 and in 1984 was lower than the predevelopment level of 195/ mile. The average number of legal~sized trout present in April for the postdevelopment period was 10% less than the predevelopment value.
There was a slight improvement (4%) in the average number of age I + brook trout of all sizes present after devel~ opment, and 2 of the 3 postdevelopment densities exceeded the predevelopment density.
Postdevelopment physical changes included 19% de~ creases in average width and surface area, a 45% increase in area of gravel substrate, little change in the quantity of aquatic macrophytes (which remained sparsely present), a 340% improvement in underbank hiding cover for trout, and, surprisingly, a 14% decrease in average depth.
SOURCE DOCUMENT
Babros, T. E., Wis. Dep. Nat. Resour., intradep. memo. to R. L. Hunt, 20 December 1985.
700
600
~500 0.. <(
~
~ 400 3E f:: ~ 300 1-
"' ~ 200
100
~ e+4" • •
~ •-35"
0 VES 1980 1981 1982 1984
DEVEr:MENT ~/Jf~
0-10"
1981-84 AVG,
60 ..J a:
50 !lc ?; w ..J
40 :;,:
~ 30~
"' 0 0 a:
20 ::: m ..J
10
FIGURE 8. Abundance and biomass of age I+ wild brook trout in the treatment zone on Creek 1 ~..(J in April before (1980) and after ( 1981-84) removal of woody stream bank vegetation. Percentage change from predevelopment is ind~ cated next to the·postdevelopment average.
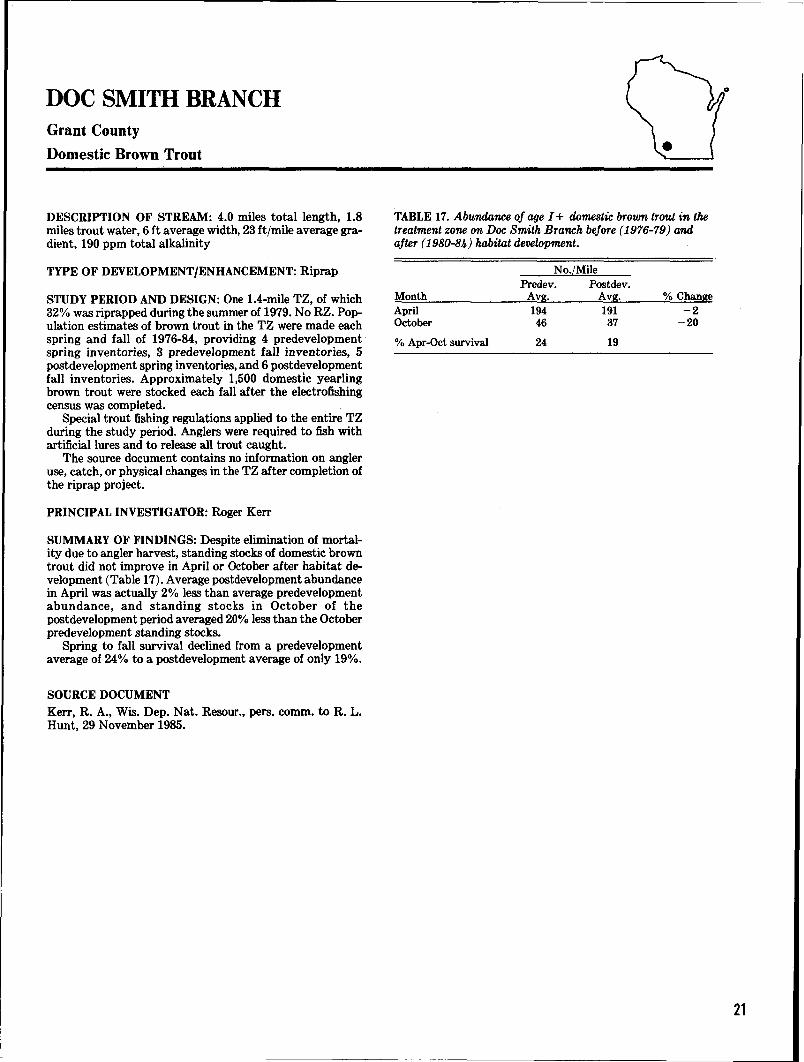
DOC SMITH BRANCH Grant County
Domestic Brown Trout
DESCRIPTION OF STREAM: 4.0 miles total length, 1.8 miles trout water, 6ft average width, 23ft/mile average gradient, 190 ppm total alkalinity
TYPE OF DEVELOPMENT/ENHANCEMENT: Riprap
STUDY PERIOD AND DESIGN: One 1.4-mile TZ, of which 32% was riprapped during the summer of 1979. No RZ. Population estimates of brown trout in the TZ were made each spring and fall of 1976-84, providing 4 predevelopment spring inventories, 3 predevelopment fall inventories, 5 postdevelopment spring inventories, and 6 postdevelopment fall inventories. Approximately 1,500 domestic yearling brown trout were stocked each fall after the electrofishing census was completed.
Special trout fishing regulations applied to the entire TZ during the study period. Anglers were required to fish with artificial lures and to release all trout caught.
The source document contains no information on angler use, catch, or physical changes in the TZ after completion of the riprap project.
PRINCIPAL INVESTIGATOR: Roger Kerr
SUMMARY OF FINDINGS: Despite elimination of mortality due to angler harvest, standing stocks of domestic brown trout did not improve in April or October after habitat development (Table 17). Average postdevelopment abundance in April was actually 2% less than average predevelopment abundance, and standing stocks in October of the postdevelopment period averaged 20% less than the October predevelopment standing stocks.
Spring to fall survival declined from a predevelopment average of 24% to a postdevelopment average of only 19%.
SOURCE DOCUMENT Kerr, R. A., Wis. Dep. Nat. Resour., pers. comm. toR. L. Hunt, 29 November 1985.
TABLE 17. Abundance of age I+ domestic broum trout in the treatment zone on Doc Smith Branch before (1976-79) and after ( 1980-8.1,.) habitat development.
No./Mile Predev. Postdev.
Month Avg. Avg. %Change April 194 191 -2 October 46 37 -20
% Apr-Oct survival 24 19
21

22
DOGTOWN CREEK Burnett County
Wild Brook Trout
DESCRIPTION OF STREAM: 3.0 miles total length, 3.0 miles trout water, 15ft average width, 9ft/mile average gradient, 41 ppm total alkalinity
TYPE OF DEVELOPMENT/ENHANCEMENT: Bank covers, current deflectors, and riprap
STUDY PERIOD AND DESIGN: One 1.1-mile TZ. No RZ. Habitat development was started in July 1978, a "predevelopment" trout population estimate was made in September 1978, and habitat development was completed in October 1979. Postdevelopment surveys of standing stock were made each September of 1979-84. The September 1979 survey is deleted in this compendium as part of the postdevelopment series. Quantified physical changes include average width, average depth, and surface area of the TZ. Trout population estimates include age 0 stocks in 1978, 1980, and 1981.
PRINCIPAL INVESTIGATOR: Stanley Johannes
SUMMARY OF FINDINGS: Average postdevelopment abundance of wild brook trout at least 4 inches long (age I+) increased in the TZ by 18% (Table 18). Legal-sized brook trout increased in average abundance by 105%, and biomass of age I+ brook trout present in September showed a 65% improvement after development.
Legal-sized brook trout were more abundant during all 5 years of the postdevelopment phase than they were in 1978, and the 2 highest densities of such trout were observed the last 2 years of monitoring (Fig. 9).
Age 0 brook trout were present at a density of 2,900/mile prior to habitat development. Average postdevelopment abundance for 1980-81 was 1,640/mile, a decrease of 43%.
Average channel width decreased by 49% after development (from 21.2 ft to 10.8 ft), and average water depth increased by 72% (from 7.1 inches to 12.2 inches). Surface area changed from 2.9 acres to 1.5 acres.
SOURCE DOCUMENT Johannes, S. 1., Wis. Dep. Nat. Resour., intradep. memo. to R. L. Hunt, 9 October 1985.
TABLE 18. Abundance and biomass of age I+ wild brook trout in the treatment zone on Dogtown Creek in September before ( 1978) and after ( 1980-84) habitat de1Jelopment.
PoJ:!ulation Characteristic No.jmile ~4 inches No.jmile ~6 inches Totallbsjmile
a: ~ :;: w li::200 w (I)
?;
!3 150 ::t: u ?;
% 100 w ..J
~ ..... 50 a a: I-
0
Predev. Value 294
59 17
Postdev. % Avg. Change 348 +18 121 +105 28 +65
" 0 0 a:
1978 1980 1981 1982 1983 1984 1980-84
CD PREDEVELDPMENT~POSTDEVELOPMENT~ AVG.
FIGURE 9. Abundance of wild brook trout ~6 inches in the treatment zone on Dogtown Creek in September before (1978) and after (1980-84) habitat de1Jelopment. Percentage change from prede1Jelopment is indicated next to the postde1Jelopment a1Jerage.

EDDY CREEK Sawyer County
Wild Brook Trout
DESCRIPTION OF STREAM: 3.5 miles total length, 3.5 miles trout water, 8 ft average width, 126 ft/mile average gradient, 69 ppm total alkalinity
TYPE OF DEVELOPMENT/ENHANCEMENT: Bank covers and current deflectors
STUDY PERIOD AND DESIGN: One 0.61-mile TZ. No RZ. One predevelopment inventory of age I+ brook trout was carried out in August 1977, habitat development occurred during 1979-80, and 2 postdevelopment trout population inventories were conducted in August of 1983-84. No comparative data on physical changes in the TZ are provided in the source document. A voluntary creel census was attempted during the 1984 trout fishing season. Questionnaires and a collection box were provided near the main public parking lot.
PRINCIPAL INVESTIGATOR: Frank Pratt
SUMMARY OF FINDINGS: Yearling or older brook trout (total no. trout/mile) increased from a predevelopment density of 236/mile to a postdevelopment average density of 394/mile, a 67% increase (Fig. 10). Legal-sized brook trout increased from a predevelopment density of only 70/mile to a postdevelopment average density of 227/mile, a 224% improvement. Biomass of the standing stock in the TZ rose from 30 lbs/mile prior to habitat development to an average 77 lbs/mile after development, an improvement of 155%.
For all3 indices of the standing stock, 1984 values were substantially greater than 1983 values.
Only 5 age 0 brook trout were captured during electrofishing operations in August 1977, too few to allow calculation of an abundance estimate for this age group. In August 1983 enough age 0 brook trout were captured, marked, and recaptured to yield an abundance estimate of 579/mile. The next year, however, there again appeared to be a failure in the year class survival. Only 9 age 0 brook trout were captured, and no estimate was made.
SOURCE DOCUMENT
Pratt, F. B., Wis. Dep. Nat. Resour., intradep. memo. to G. G. Bever, 16 May 1985.
tn ::::> (!)
~ ~ w ...J
500
400
~ 300 ...... en ID ...J -o c: c w ...J
~ 200 ;:::: ::::> 0 a: 1-~ 0 0 a: ID
100
•+67%
• 0+224%
TROUT/MILE~ 6/NCHES
0 ~MILE 4 Habitat development
1979-80
4+155%
1977 1983 1984 1983-84 AVG.
FIGURE 10. Abundance and biomass of age I+ wild brook trout in the treatment zone on Eddy Creek in August before (1977) and after (1983-84) habitat development~ Percentage change from predevelopment is indicated next to the postdevelopment average.
23
24
ELK CREEK Chippewa County
Wild Brown Trout
DESCRIPTION OF STREAM: 10.8 miles total length, 10.8 miles trout water, 15 ft average width, 11 ft/mile average gradient, 27 ppm total alkalinity
TYPE OF DEVELOPMENT/ENHANCEMENT: Stream bank debrushing, half-logs, bank covers, current deflectors, and riprap·
STUDY PERIOD AND DESIGN: Six electrofishing stations were combined to form one 2.12-mile TZ. No RZ. Habitat development was carried out during 1979-82. Abundance and biomass of sublegal and legal-sized trout were determined in each station in August 1978. Postdevelopment determinations of abundance and biomass were made in August 1982. No quantitative data on physical changes in the TZ are reported in the source document.
PRINCIPAL INVESTIGATOR: Douglas Erickson
SUMMARY OF FINDINGS: Short-term responses of the wild brown trout population in the TZ were favorable following development (Table 19). The number of trout of all sizes present in August 1982 was 36% higher than the predevelopment density ( 4,318/mile vs. 3,175/mile ). Postdevelopment abundance of legal-sized brown trout decreased by 7% (from 1,393/mile to 1,301/mile). Biomass of the August 1982 standing stock was equivalent to 332 lbs/ mile, about the same as prior to habitat development.
SOURCE DOCUMENT Kurz, J., Wis. Dep. Nat. Resour., intradep. memo. toR. Hunt, 8 July 1986.
TABLE 19. Abundance and biomass of wild brown trout in the treatment zone on Elk Creek before (1978) and after (1982) habitat development.
Population Characteristic Total no./mile No./mile ~6 inches Totallbs/mile
Predev. Value 3,175 1,393
333
Postdev. Avg. 4,318 1,301
332
% Change
+36 -7
0

EMMONS CREEK Waupaca County
Wild Brown Trout
DESCRIPTION OF STREAM: 6.2 miles total length, 5.8 miles trout water, 17 ft average width, 170 ppm total alkalinity
TYPE OF DEVELOPMENT/ENHANCEMENT: Half-logs
STUDY PERIOD AND DESIGN: One 0.19-mile TZ and one adjacent upstream 0.34-mile RZ. Electrofishing inventories of trout in the study zones were made each April and October of 1976-81. Sixty half-logs were installed at a density of 330/mile in late April 1978. Several were readjusted later that year to improve functional performance.
PRINCIPAL INVESTIGATOR: Robert Hunt
SUMMARY OF FINDINGS: Most of the half-logs functioned effectively after installation and early adjustments. Four years after installation functional capacity was 83% of maximum. Only 1 of 60 could not be located.
Despite the additional useful hiding/resting cover for trout provided by the half-logs in the TZ, only one positive postdevelopment change was documented in the standing stock (Table 20).
Average abundance of quality-sized brown trout (10 inches or larger) in October increased from 500/mile for 1976-77 to 868/mile for 1978-81, a 74% increase. During the same time ;>eriods, there was an average decrease of 28% in the abundance of quality-sized brown trout in the RZ.
Average abundance of age I + trout (total no. trout/mile) in April, age 0+ trout (total no. trout/mile) in October, legal-sized trout in April and October, and biomass of trout present in April and October all decreased in both study zones, but in every case declines were greater in the TZ than in the RZ.
No causes for the unexpected declines in either zone were identified. Increased angler harvest, both legal and illegal, was suspected but not verified.
SOURCE DOCUMENT
Hunt, R. L. 1982. An evaluation of half-logs to improve brown trout
habitat in Emmons Creek. Wis. Dep. Nat. Resour. Res. Rep. No.l16. 8 pp.
TABLE 20. Abundance and biomass of wild brown trout in the reference zone and treatment zone on Emmons Creek in April and October before ( April1976-April1978) and after (Octo-ber 1978-April1981) habitat development.
Population Study Predev. Postdev. % Characteristic Month Zone Avg. Avg. Change Total no./mile Apr RZ 6,487 4,885 -25
TZ 11,200 9,421 -26
Oct RZ 9,364 6,962 -26 TZ 16,273 8,995 -45
No.jmile ;;:.6 inches Apr RZ 2,231 1,607 -28 TZ 4,263 2,668 -37
Oct RZ 4,103 2,077 -49 TZ 8,137 3,668 -55
No.jmile ;;:.10 inches Apr RZ 272 164 -40 TZ 589 157 -73
Oct RZ 474 341 -28 TZ 500 868 +74
Totallbs/mile Apr RZ 237 174 -27 TZ 219 147 -33
Oct RZ 344 248 -28 TZ 299 202 -32
25

26
FOULDS CREEK Price County
Wild Brook Trout
DESCRIPTION OF STREAM: 5.3 miles total length, 5.3 miles trout water, 11ft average width, 5 ft/mile average gradient, 60 ppm total alkalinity
TYPE OF DEVELOPMENT/ENHANCEMENT: Stream bank debrushing, brush bundles, bank covers, and current deflectors
STUDY PERIOD AND DESIGN: One 2.5-mile TZ. No RZ. A predevelopment survey of the trout population was made in May 1978. A postdevelopment follow-up was made in May 1983. White suckers and creek chubs were also censused before and after habitat development, which was initiated in 1979 and completed in 1983. No data on physical changes in the TZ are included in the source document. Baseflow discharge was approximately 1.5-2.0 cfs when fish populations were censused.
PRINCIPAL INVESTIGATOR: Jeffrey Roth
SUMMARY OF FINDINGS: Postdevelopment abundance and biomass of brook trout improved substantially in the TZ of this small stream (Table 21). Abundance of brook trout over 3 inches (age I+) increased by 141% (from 300/mile to 722/mile), and biomass was 54% greater after development (from 26lbs/mile to 40 lbsjmile).
Legal-sized brook trout increased in number after development by 11%, but the number 8 inches or larger decreased by 58%. Greatly increased angler use and harvest were suspected but not quantified.
Postdevelopment growth of brook trout probably improved. Age II brook trout averaged 5.2 inches in May 1978 vs. 5.9 inches in May 1983, and average length of age III stocks increased from 7.5 inches in 1978 to 8.3 inches in 1983.
Abundance of both white suckers and creek chubs increased after development (by 98% and 31%, respectively), but biomass of each species declined by 29%. Small individuals of both species increased, but biomass declined because there were fewer individuals of both species 5 inches or larger (Table 21).
As a result of the improvement seen in abundance and biomass of brook trout, despite probable increased harvest, 1.0 mile of Foulds Creek was reclassified from Class II to Class I, thus removing it from the list of waters dependent on stocking of domestic trout to sustain a fishery.
SOURCE DOCUMENT Gottwald, P. J., Wis. Dep. Nat. Resour., intradep. memo. to the District Director, 8 Apri11985.
TABLE 21. Abundance and biomass of wild brook trout, white sucker, and creek chub in the treatment zone on Foulds Creek before ( 1978) and after ( 1983) trout habitat development.
Population Predev. Postdev. % Fish S2ecies Characteristic Value Value Change Brook trout Total no.jmile 300 722 +141
No.jmile ~6 inches 124 138 +11 No./mile ~8 inches 24 10 -58 Totallbsjmile 26 40 +54
White sucker Total no./mile 259 512 +98 No.jmile ~5 inches 108 63 -42 Totallbs/mile 21 15 -29
Creek chub Total no.jmile 274 360 +31 No./mile ~5 inches 130 61 -53 Totallbsjmile 14 10 -29

HAY CREEK Oconto County
Wild Brook Trout
DESCRIPTION OF STREAM: 10.8 miles total length, 10.8 miles trout water, 6 ft average width, 123 ppm total alkalinity
TYPE OF DEVELOPMENT /ENHANCEMENT: Stream bank debrushing
STUDY PERIOD AND DESIGN: One 0.19-mile TZ and one adjacent downstream 0.19-mile RZ. Brook trout in the study zones were censused in June 1982, about 2 months before stream banks were cleared of woody vegetation. Age 0 brook trout were common in the study zones but were not estimated in June 1982 or in July 1984, when a postdevelopment census was made. Physical changes in the study zones are not reported in the source document.
PRINCIPAL INVESTIGATOR: Thomas Thuemler
SUMMARY OF FINDINGS: Results from the postdevelopment survey of standing stocks of brook trout in the 2 study zones were disappointing. Age I+ brook trout (total no. trout/mile) declined by 34% in the TZ and by 11% in the RZ. Legal-sized brook trout increased by 19% in the TZ, but there was also a 34% increase in the RZ. Biomass stayed about the same in the TZ and increased by 6% in the RZ (Table 22).
SOURCE DOCUMENTS Thuemler, T., Wis. Dep. Nat. Resour., intradep. memo. to the District Director, 18 February 1983. Heizer, R. E., Wis. Dep. Nat. Resour., pers. comm. toR. L. Hunt, 21 October 1985.
TABLE 22. Abundance and biomass of age I+ wild brook trout in the reference zone and treatment zone on Hay Creek before (June 1982) and after (July 1984) habitat development.
Study Predev. Postdev. % PoQulation Characteristic Zone Value Value Change Total no.jmile TZ 1,079 711 -34
RZ 1,021 913 -11
No.jmile ;;.6 inches TZ 226 268 +19 RZ 200 267 +34
Totallbs/mile TZ 51 51 0 RZ 66 70 +6
27

----------------- -----------------------------------------,
28
HUNTING RIVER-STATION 1 Langlade County
Wild and Domestic Brook Trout, Wild and Domestic Brown Trout
DESCRIPTION OF STREAM: 15.6 miles total length, 15.6 miles trout water, 44 ft average width, 85 ppm total alkalinity
TYPE OF DEVELOPMENT/ENHANCEMENT: Skyhook bank covers, current deflectors, and boulder retards
STUDY PERIOD AND DESIGN: One 0.70-mile TZ. No RZ. Trout in the TZ were censused in June 1979. Habitat development occurred in August 1979. A postdevelopment census of the standing stock followed in June 1982. Abundance and biomass data included in the source document only cover trout 6 inches or larger. All trout 10 inches or larger were wild, as were most of those in the 6-10 inch range. No changes in physical features of the TZ are reported in the source document.
PRINCIPAL INVESTIGATOR: Alan Hauber
SUMMARY OF FINDINGS: Number of brook trout 6 inches or larger increased by 26%, and biomass increased by 20% after development. Legal-sized brown trout increased in number by 91% and in biomass by 88% after development (Table 23).
The TZ had 34% more brown trout than brook trout before development and 103% more after development.
One brook trout over 10 inches was collected in the TZ in 1979. No brook trout of this size were found in 1982. Abundance of brown trout 10 inches or larger (all wild) jumped from 27/mile in 1979 to 58/mile in 1982.
The most impressive proportional change was a 575% increase in the number of brown trout 14 inches or larger (all wild)-4/mile before development and 27/mile after development.
Brown trout accounted for 70% of the predevelopment biomass of 82lbs/mile and 78% of the postdevelopment biomass of 139 lbsjmile.
SOURCE DOCUMENT Hauber, A. B., Wis. Dep. Nat. Resour., pers. comm. toR. L. Hunt, 10 October 1985.
TABLE 23. Abundance and biomass of wild and domestic brook trout and wild and domestic brown trout in the station 1 treatment zone on the Hunting River in June before (1979) and after ( 1982) habitat def!elopment.
Population Trout Predev. Postdev. % Characteristic S~ies Value Value Change No.jmile ;;>6 inches Brook 166 209 +26
Brown 223 425 +91 Combined 389 634 +63
No.jmile ;;.10 inches* Brook 1 0 -100 Brown 27 58 +115 Combined 28 58 +107
No./mile ;;>14 inches* Brook 0 0 0 Brown 4 27 +575 Combined 4 27 +575
Lbs/mile** Brook 25 30 +20 Brown 58 109 +88 Combined 83 139 +67
• Wild trout only. ** Lbs/mile includes only trout ;;. 6 inches.

HUNTING RIVER-STATION 2 Langlade County
Wild and Domestic Brook Trout, Wild and Domestic Brown Trout
DESCRIPTION OF STREAM: 15.6 miles total length, 15.6 miles trout water, 44 ft average width, 85 ppm total alkalinity
TYPE OF DEVELOPMENT/ENHANCEMENT: Skyhook bank covers, current deflectors, and boulder retards
STUDY PERIOD AND DESIGN: One 0.52-mile TZ. No RZ. Trout in the TZ were censused in June 1979, about 2 months before habitat development was started. Development was completed that summer. A census was conducted in June 1982, 3 years after development. A 5-year postdevelopment census was also done in 1985, but results were not available for this compendium. The source document provides data on abundance and biomass of trout 6 inches or larger. All trout 6 inches or larger were wild, as were most of those in the 6-10 inch range. No changes in physical features of the TZ are reported in the source document.
PRINCIPAL INVESTIGATOR: Alan Hauber
SUMMARY OF FINDINGS: Brook trout 6 inches or larger declined in number by 14% and in biomass by 24% after development. Legal-sized brown trout, on the other hand, increased in number by 99% and in biomass by 143% after development (Table 24). Brown trout were present at about the same density as brook trout in 1979, but in 1982 brown trout were more than twice as numerous as brook trout and accounted for 85% of the total postdevelopment biomass of 186 lbsjmile.
No brook trout over 10 inches were found in the TZ before or after development. Brown trout in this size category (all wild) numbered 46/mile before development and 7 4/mile after development.
An impressive 320% increase was documented in the abundance of brown trout 14 inches or larger (all wild)from 10/mile in 1979 to 42/mile in 1982.
SOURCE DOCUMENT Hauber, A. B., Wis. Dep. Nat. Resour., pers. comm. to R. L. Hunt, 10 October 1985.
TABLE 24. Abundance and biomass of wild and domestic brook trout and wild and domestic brown trout in the station fl treatment zone on the Hunting River in June before (1979) and after ( 198fl) habitat development.
Population Trout Predev. Postdev. % Characteristic S~ies Value Value Change No./mile ;;.6 inches Brook 208 180 -14
Brown 212 422 +99 Combined 420 602 +43
No./mile ;;.10 inches* Brook 0 0 0 Brown 46 74 +61 Combined 46 74 +61
No./mile ;;.14 inches* Brook 0 0 0 Brown 10 42 +320 Combined 10 42 +320
Lbs/mile** Brook 37 28 -24 Brown 65 158 +143 Combined 102 186 +82
* Wild trout only. •• Lbsjmile includes only trout ;;.6 inches.
29
30
K. C. CREEK Marinette County
Wild Brook Trout and Wild Brown Trout
DESCRIPTION OF STREAM: 6.7 miles total length, 6.0 miles trout water, 12 ft average width, 106 ppm total alkalinity
TYPE OF DEVELOPMENT/ENHANCEMENT: Stream bank debrushing, bank covers, and current deflectors
STUDY PERIOD AND DESIGN: One 0.76-mile TZ. No RZ. Age I+ trout were censused in the TZ in June 1976just prior to initiation of habitat development, which was completed in 1978. A postdevelopment census of trout was made in August 1982. Changes in average width and surface area of the TZ were quantified.
PRINCIPAL INVESTIGATOR: Thomas Thuemler
SUMMARY OF FINDINGS: Age I+ brook trout (total no. trout/mile) declined by 71% but age I+ brown trout increased by 82% from 1976 to 1982. For the 2 species combined there was a 7% decline after development (Table 25).
Legal-sized brook trout declined by 83%; legal-sized brown trout increased by 71%. Together there was a 16% decline after development.
For quality-sized trout (10 inches or larger), the postdevelopment increase in abundance of brown trout more than offset the postdevelopment decrease in brook trout, so that together there was an overall 38% improvement in the number of trout 10 inches or larger (from 50/mile to 69/ mile).
An 83% decrease in biomass of brook trout was accompanied by a 65% increase in postdevelopment biomass of brown trout. For both species combined, biomass increased by 7% after development (from 121lbs/mile to 130 lbsjmile).
Average width of the TZ decreased by 31% (from 16.0 ft to 11.1 ft) after development. Surface area decreased from 1.47 acres to 1.02 acres.
SOURCE DOCUMENT Thuemler, T. L., Wis. Dep. Nat. Resour., pers. comm. to R. L. Hunt, n.d.
TABLE 25. Abundance and biomass of wild brook trout and wild brown trout in the treatment zone on K. C. Creek before (June 1976) and after (August 1982) habitat development.
Population Trout Predev. Postdev. % Characteristic SJ2ecies Value Value Change Total no.(mile Brook 241 71 -71
Brown 172 313 +82 Combined 413 384 -7
No.(mile "'6 inches Brook 216 36 -83 Brown 168 287 +71 Combined 384 323 -16
No.(mile "'10 inches Brook 9 3 -67 Brown 41 66 +61 Combined 50 69 +38
Totallbs(mile Brook 47 8 -83 Brown 74 122 +65 Combined 121 130 +7

KINNICKINNIC RIVER St. Croix County
Wild Brown Trout
DESCRIPTION OF STREAM: 25.0 miles total length, 15.0 miles trout water, 20ft average width, 6ft/mile average gradient, 163 ppm total alkalinity
TYPE OF DEVELOPMENT /ENHANCEMENT: Half-logs and stream bank debrushing
STUDY PERIOD AND DESIGN: Five TZs ranging in length from 0.12 mile to 0.25 mile with a combined length of 0.98 mile. No RZ. Habitat development was carried out during winter periods in 1972-77. For each zone a "predevelopment" census was made of the resident brown trout population the first April after development. Census efforts were repeated for 2, 3, or 4 successive Aprils to collect "postdevelopment" observations. Functional performance of half-logs was assessed in one of the TZs only (Fuller section).
PRINCIPAL INVESTIGATOR: Bert Apelgren
SUMMARY OF FINDINGS: Postdevelopment abundance of wild brown trout improved in 3 of 5 TZs for trout of all sizes (Table 26). There was a modest 6% average improvement for the 5 study zones. Postdevelopment abundance of legalsized trout increased in all 5 study zones. Increases ranged from 16% to 83% and averaged 41%. Quality-sized trout (10 inches or larger) also increased in all 5 TZs by proportions of 1% to 79%. The average improvement was 34%.
Changes in relative biomass were positive in all 5 study zones, varying from 6% to 103% and averaging 51%.
In the Fuller section TZ, which provided the longest series of postdevelopment observations, abundance (Fig. 11) and biomass (Fig. 12) of brown trout showed steady improvements from April 1974-April 1977. Functional performance of the half-logs installed in the Fuller section was excellent in the short term. Approximately 88% of 69 halflogs installed during the winter of 1978-79 were fully functional approximately one year later.
SOURCE DOCUMENTS Apelgren, B. J., Wis. Dep. Nat. Resour., pers. comm. to R. L. Hunt, 27 January 1977. Apelgren, B. J., Wis. Dep. Nat. Resour., intradep. memo. to G. K. Jackelen, 11 March 1980. Stewart, S., Wis. Dep. Nat. Resour., pers. comm. toR. L. Hunt, 5 July 1984.
7,000
TOTAL No.IM/LE 6,000
5,000
4,000
3,000
2,000
• ~ 0+83%
~OUT/frilL£ it 6/NCHES
0
1,000
A
/--- A+79% ~ROUT/frilL£ it /0 INCHES
1973 1974 1975 1976 1977 1974-77 PREDEVELOPMENT .... POSTDEVELOPMENT+j AVG.
FIGURE 11. Abundance of wild brown trout in the Fuller section treatment zone on the Kinnickinnic River in April before ( 1973) and after ( 197 4-77) habitat development. Percentage change from predevelopment is indicated next to the postdevelopment average.
1,200
...J
~1,000 ~ UJ d :; 800
~ if >- 600 z ~ a: ~ 400
A
"' ...J
200
1973 1974 1975 1976 1977 1974-77 PREDEVELOPMENTI-+-POSTDEVELOPMENT--1 AVG.
FIGURE 12. Biomass of wild brown trout in the Fuller section treatment zone on the Kinnickinnic River in April before ( 1973) and after ( 197 4-77) habitat development. Percentage change from predevelopment is indicated next to the postdevelopment average.
TABLE 26. Abundance and biomass of wild brown trout in 5 treatment zones on the Kinnickinnic River in April before and after habitat development.
No./Mile No.iMile ;;.6 Inches No.iMile ;;<10 Inches LbsiMile Length Predev. Postdev. Predev. Postdev. % Predev. Postdev. % Predev. Postdev. % Predev. Postdev. %
Treatment Zone (miles) Year Years Avs. Avs. Chanse Avs. Avs. Chanse Avs. Avs. Chanse Avs. Avs. Chanse Fuller 0.24 1973 1974-79 3,025 4,772 +8 1,450 2,659 +83 396 708 +79 461 938 + 103
Purfeerst 0.12 1975 1976-78 7,242 6,900 -5 2,283 3,672 +61 542 930 +72 742 1,207 +63
Gibson no.l 0.25 1974 1975-78 3,916 5,164 +32 1,952 2,715 +39 460 638 +39 555 897 +62
Gibson no. 2 0.23 1976 1978-79 5,039 6,780 +35 3,561 4,145 +16 1,030 1,036 +1 927 1,300 +40
Gibson no. 3 0.14 1977 1978-79 7,021 4,265 -39 2,214 2,939 +33 343 407 +19 659 698 +6
Average 5,249 5,576 +6 2,292 3,226 +41 554 744 +34 669 1,008 +51 31

32
KINNICKINNIC RIVER St. Croix County
Wild Brook Trout and Wild Brown Trout
DESCRIPTION OF STREAM: 25.0 miles total length, 15.0 miles trout water, 20ft average width, 6ft/mile average gradient, 163 ppm total alkalinity
TYPE OF DEVELOPMENT/ENHANCEMENT: Stream bank fencing followed by planting of trees, construction of cattle-watering sites, and installation of bank covers, current deflectors, digger-logs, and riprap
STUDY PERIOD AND DESIGN: One 1.4-mile TZ and and one adjacent downstream 0.7-mile RZ. Habitat development was carried out over an 8-year period (1950-57). Trout populations were inventoried in both study zones starting in 1953. April inventories were made in 1953, 1954, and 1956-60. October estimates were conducted in 1953 and 1955-60. For the purposes of this compendium, data on standing stocks of trout obtained during 1953-57 will be classified as "predevelopment phase" data. The 1958-60 period will be considered the "postdevelopment phase." Postdevelopment changes in substrate composition in the TZ are reported in the source document, but the methodology used is not described.
Length frequency data from trout population assessments made in April were summarized into 2 categories: trout less than 5.5 inches and trout 5.5 inches or larger. To expedite comparisons with other evaluations included in this compendium, these 2 size categories will be interpreted as "sublegal" and "legal-sized" (6 inches). The 5.5 inch breaking point was used because it conveniently separated most age I trout from older age groups. An adjustment upward to 6 inches is probably biologically reasonable based on the additional growth likely to occur during April and early May, when the fishing season opened.
PRINCIPAL INVESTIGATOR: Ludwig Frankenberger
SUMMARY OF FINDINGS: Average abundance in April of wild brook trout and wild brown trout less than 6 inches increased in both study zones from the predevelopment period (1953-57) to the postdevelopment period (1958-60), but the proportional increase was much greater in the TZ for both species and greater for brook trout than for brown trout. Average density of brook trout in the TZ jumped from 43/mile to 566/mile, a 1,216% increase (Table 27). In the RZ improvement averaged 44%. Average density of brown trout less than 6 inches increased by 110% in the TZ (from 115/ mile to 241/mile) and by 107% in the RZ (from 205/mile to 425/mile).
Brook trout of legal size increased in average abundance by 70% in the TZ but decreased by 48% in the RZ. Legalsized brown trout increased in number by an average of 70% in the TZ and declined by an average of 20% in the RZ.
During the predevelopment years the RZ consistently held more legal-sized brook trout and brown trout in April than the TZ (Fig. 13, 14). During the 3 years of postdevelopment assessment, the TZ supported more legal-sized brook trout in April all 3 years and more legal-sized brown trout in April in 2 of 3 years, compared with the RZ.
Population densities of brook trout in October also improved in the TZ after completion of habitat development. Sublegal brook trout increased an average of 219% in the TZ
and 41% in the RZ. Legal-sized brook trout present in October were 55% more numerous in the TZ after development, compared with an 11% decline in the RZ.
Sublegal brown trout present in October declined after development of the TZ by an average of 45%. In the RZ this size category of brown trout increased by 109% for comparable groupings of October observations.
For brown trout of legal size, there was an average gain of 90% in October densities in the TZ vs. a 41% gain in the RZ.
Postdevelopment changes reported in substrate composition within the TZ should have benefitted trout carrying capacity along with the enhancements provided by greater quantities of hiding/resting cover provided by the bank covers and current deflectors. Gravel substrate increased from 10% of the total predevelopment substrate to 25% of the total postdevelopment substrate.
SOURCE DOCUMENT Frankenberger, L.
1968. Effects of habitat management on trout in a portion of the Kinnickinnic River, St. Croix County, Wisconsin. Wis. Dep. Nat. Resour. Fish Manage. Rep. No. 22. 14 pp.
TABLE 27. Abundance of wild brook trout and wild brown trout in the treatment zone and reference zone on the Kinnickinnic River in April and October before (1953-57) and after (1958-60) habitat development.
Trout Population Study Predev. Postdev. % SQecies Characteristic Month Zone Avg. Avg. Change Brook No.jmile <6 inches Apr TZ 43 566 +1,216
RZ 87 125 +44
No.jmile ~6 inches Apr TZ 189 321 +70 RZ 276 143 --;48
I Brown No.jmile <6 inches Apr TZ 115 241 +110
RZ 205 425 +107
No.(mile ~6 inches Apr TZ 352 600 +70 RZ 781 623 -20
Brook No.fmile <6 inches Oct TZ 258 824 +219 RZ 253 356 +41
No.(mile ~6 inches Oct TZ 201 312 +55 RZ 170 152 -11
Brown No.(mile <6 inches Oct TZ 310 169 -45 RZ 465 972 +109
No.(mile ~6 inches Oct TZ 223 423 +90 RZ 458 647 +41
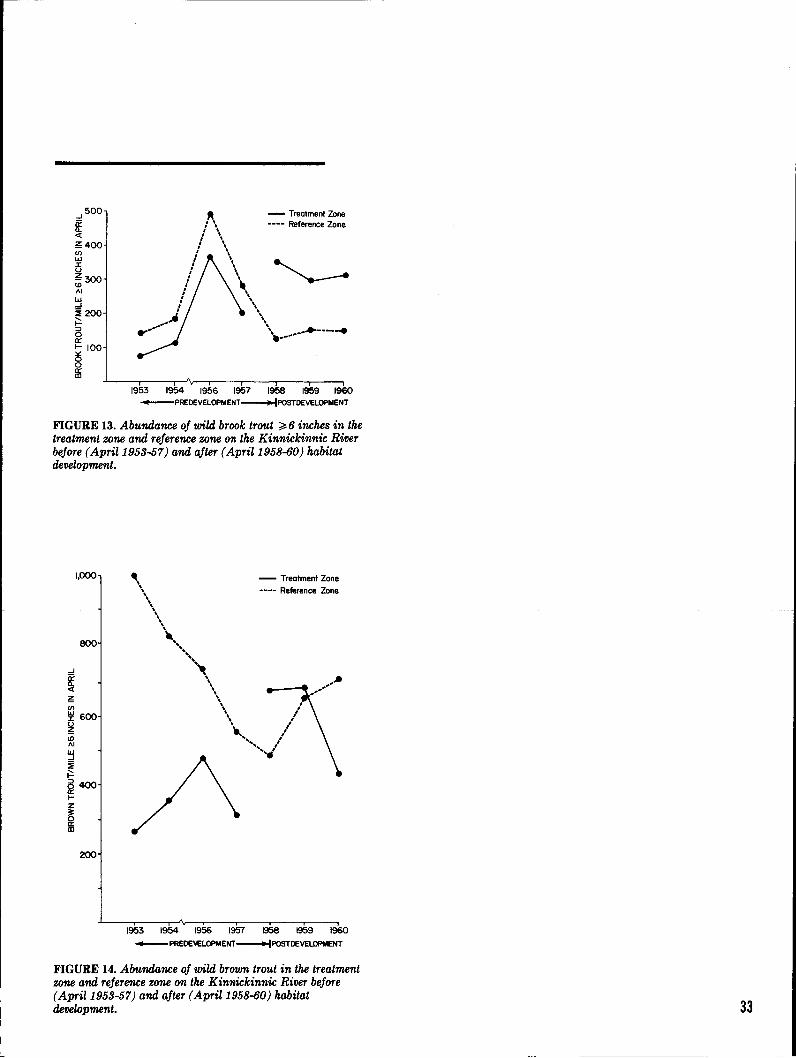
-' 500
if <t ;!1;400 CJ)
w 0 ~300 /\I
w -' :ll200 ;::: 5 a: 1- 100 a a;
- Treatment Zone ---- Reference Zone
1953 1954 1956 1957 1958 1959 1960 ~PREDEVELOPMENT~POSTDEVELOPMENT
FIGURE 13. Abundance of wild brook trout ~ 6 inches in the treatment zone and reference zone on the Kinnickinnic Rifler before (April1953-57) and after (April1958-60) habitat deflelopment.
1,000 - Treatment Zone
---- Reference Zone
800
200
1953 1954 1956 1957 1958 1959 1960
-PREOEVELOPMENT----+IPOSTOEVELOPMENT
FIGURE 14. Abundance of wild brown trout in the treatment zone and reference zone on the Kinnickinnic Rifler before (April1953-57) and after (April1958-60) habitat deflelopment. 33
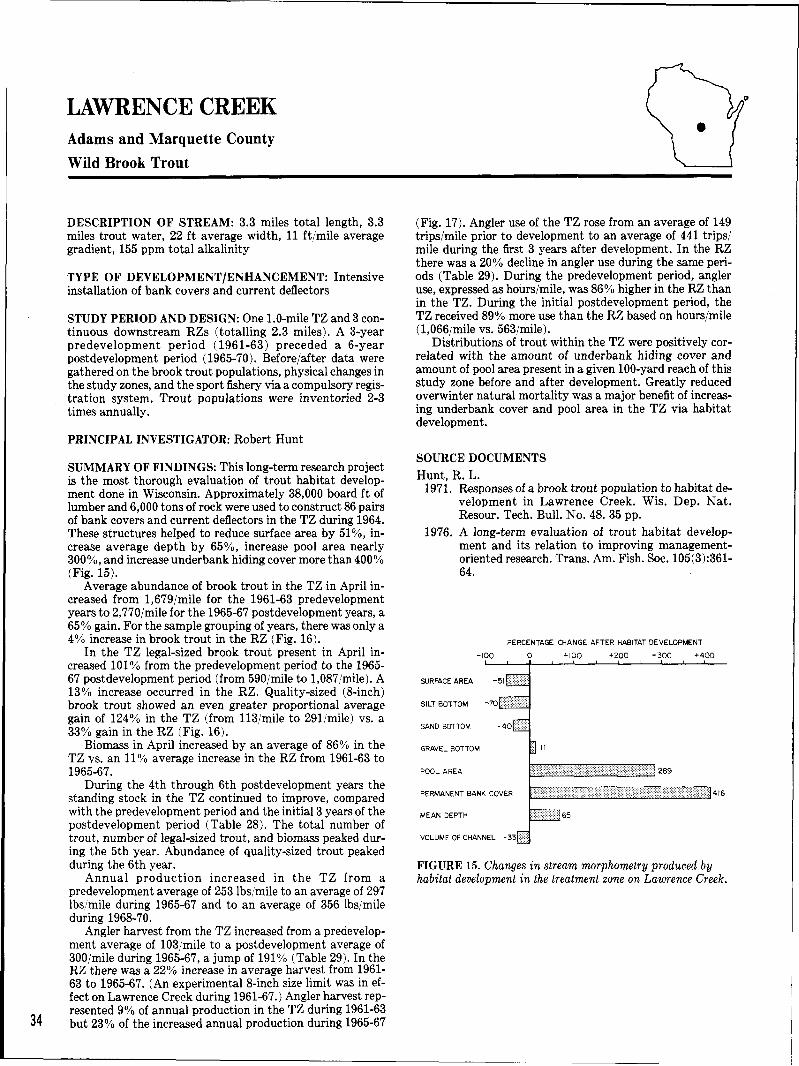
34
LAWRENCE CREEK Adams and Marquette County
Wild Brook Trout
DESCRIPTION OF STREAM: 3.3 miles total length, 3.3 miles trout water, 22 ft average width, 11 ft/mile average gradient, 155 ppm total alkalinity
TYPE OF DEVELOPMENT/ENHANCEMENT: Intensive installation of bank covers and current deflectors
STUDY PERIOD AND DESIGN: One 1.0-mile TZ and 3 continuous downstream RZs (totalling 2.3 miles). A 3-year predevelopment period (1961-63) preceded a 6-year postdevelopment period (1965-70). Before/after data were gathered on the brook trout populations, physical changes in the study zones, and the sport fishery via a compulsory registration system. Trout populations were inventoried 2-3 times annually.
PRINCIPAL INVESTIGATOR: Robert Hunt
SUMMARY OF FINDINGS: This long-term research project is the most thorough evaluation of trout habitat development done in Wisconsin. Approximately 38,000 board ft of lumber and 6,000 tons of rock were used to construct 86 pairs of bank covers and current deflectors in the TZ during 1964. These structures helped to reduce surface area by 51%, increase average depth by 65%, increase pool area nearly 300%, and increase underbank hiding cover more than 400% (Fig.15).
Average abundance of brook trout in the TZ in April increased from 1,679/mile for the 1961-63 predevelopment years to 2,770/mile for the 1965-67 postdevelopment years, a 65% gain. For the sample grouping of years, there was only a 4% increase in brook trout in the RZ (Fig. 16).
In the TZ legal-sized brook trout present in April increased 101% from the predevelopment period to the 1965-67 postdevelopment period (from 590/mile to 1,087/mile). A 13% increase occurred in the RZ. Quality-sized (8-inch) brook trout showed an even greater proportional average gain of 124% in the TZ (from 113/mile to 291/mile) vs. a 33% gain in the RZ (Fig. 16).
Biomass in April increased by an average of 86% in the TZ vs. an 11% average increase in the RZ from 1961-63 to 1965-67.
During the 4th through 6th postdevelopment years the standing stock in the TZ continued to improve, compared with the predevelopment period and the initial 3 years of the postdevelopment period (Table 28). The total number of trout, number of legal-sized trout, and biomass peaked during the 5th year. Abundance of quality-sized trout peaked during the 6th year.
Annual production increased in the TZ from a predevelopment average of 253lbs/mile to an average of 297 lbs/mile during 1965-67 and to an average of 356 lbs/mile during 1968-70.
Angler harvest from the TZ increased from a predevelopment average of 103/mile to a postdevelopment average of 300/mile during 1965-67, a jump of 191% (Table 29). In the RZ there was a 22% increase in average harvest from 1961-63 to 1965-67. (An experimental 8-inch size limit was in effect on Lawrence Creek during 1961-67.) Angler harvest represented 9% of annual production in the TZ during 1961-63 but 23% of the increased annual production during 1965-67
(Fig. 17). Angler use of the TZ rose from an average of 149 trips/mile prior to development to an average of 441 trips/ mile during the first 3 years after development. In the RZ there was a 20% decline in angler use during the same periods (Table 29). During the predevelopment period, angler use, expressed as hours/mile, was 86% higher in the RZ than in the TZ. During the initial postdevelopment period, the TZ received 89% more use than the RZ based on hours/mile (1,066/mile vs. 563/mile).
Distributions of trout within the TZ were positively correlated with the amount of underbank hiding cover and amount of pool area present in a given 100-yard reach of this study zone before and after development. Greatly reduced overwinter natural mortality was a major benefit of increasing underbank cover and pool area in the TZ via habitat development.
SOURCE DOCUMENTS
Hunt, R. L. 1971. Responses of a brook trout population to habitat de
velopment in Lawrence Creek. Wis. Dep. Nat. Resour. Tech. Bull. No. 48. 35 pp.
1976. A long-term evaluation of trout habitat development and its relation to improving managementoriented research. Trans. Am. Fish. Soc. 105(3):361-64.
PERCENTAGE CHANGE AFTER HABITAT DEVELOPMENT
-100 0 +100 +200 +300 +400
SURFACE AREA
SILT BOHOM
SAND BCTTOM
GRAVEL BOTTOM
POOL AREA
PERMANENT BANK COVER
MEAN DEPTH
VOLUME OF CHANNEL
FIGURE 15. Changes in stream morphometry produced by habitat development in the treatment zone on Lawrence Creek.

TOTAL No /MILE NoJMILE 2:6 INCHES
D PREDEVELOPMENT
D POSTDEVELOPMENT
NoJMILE 2:8 INCHES
FIGURE 16. Changes in the standing stocks of wild brook trout in the treatment zone and reference zone on Lawrence Creek before (1961...()3) and after (1965-67) habitat development in 1964.
253 LBS/MILE PRODUCED
PREDEVELOPMENT
297 LBS/MILE PRODUCED
POST DEVELOPMENT
FIGURE 17. Changes in average annual production and average annual angler harvest for the treatment zone on Lawrence Creek before (1961...()3) and after (1965...()7) habitat development in 1964.
TABLE 2S. Number and biomass of wild brook trout in the treatment zone on Lawrence Creek each April of 1961-70. Instream development was carried out during 1964.
Study Phase Predev.
Develop.
Postdev.
3-year means
No. Brook Trout/Mile April of:
1961 1962 1963
Total 989
2,143 1,906
1964 1,721
1965 2,568 1966 3,197 1967 2,546 1968 3,888 1969 4,161 1970 4,140
1961-63 1,679 1965-67* 2,770 1968-70** 4,063
~6 Inches 269 657 696
998
916 1,131 1,213 1,420 1,766 1,538
540 1,087 1,575
~8 Inches 34
125 182
204
221 378 274 365 354 453
113 291 391
Total Lbs/Mile
61 152 161
228
201 262 235 347 370 332
125 233 350
* All four 1965-67 means are significantly different at P < 0.05 from 1961-63 means.
** First, second, and fourth 1968-70 means are significantly different at P < 0.05 from 1965-67 means. Third value significance = P < 0.10.
TABLE 29. Creel census data from Lawrence Creek before (1961...()3) and after (1965...()7) habitat development.
Predev. Postdev. % Census Statistic Avg. Avg. Change Trips/mile
Treatment zone 149 441 +196 Reference zone 284 228 -20
Hours/mile Treatment zone 371 1,066 +187 Reference zone 691 563 -19
Brook trout creeled (No.jmile ~8 inches)
Treatment zone 103 300 +191 Reference zone 212 258 +22
35
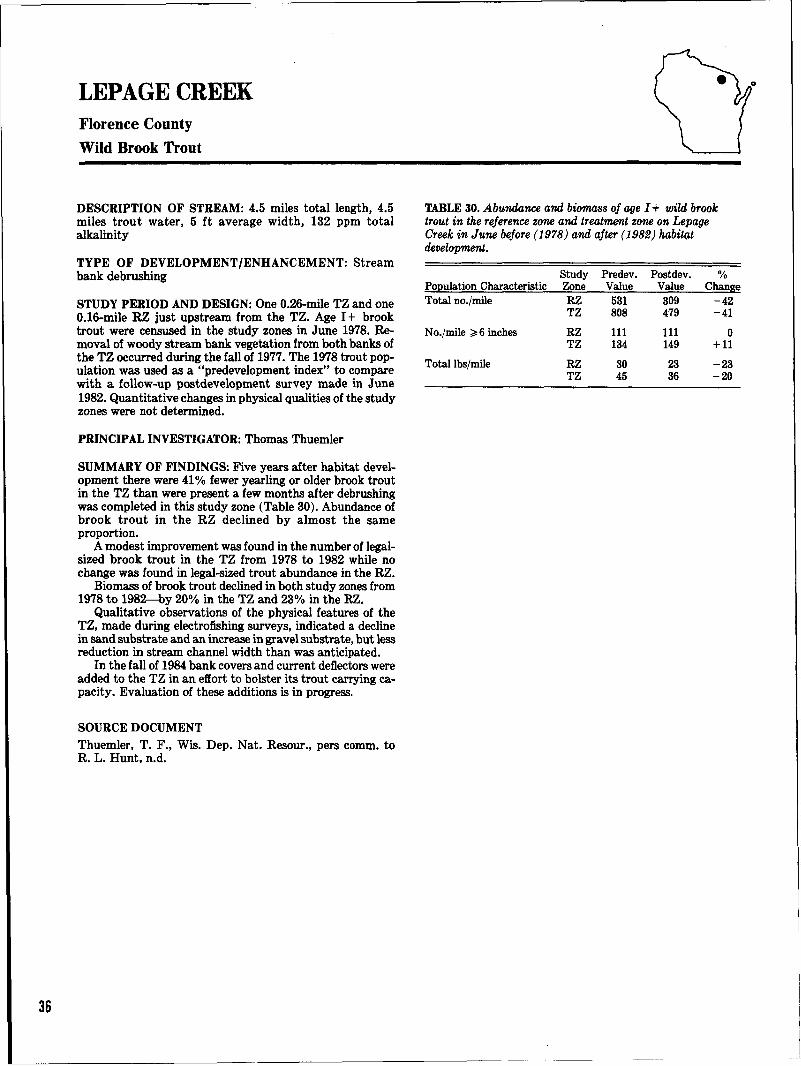
36
LEPAGE CREEK Florence County
Wild Brook Trout
DESCRIPTION OF STREAM: 4.5 miles total length, 4.5 miles trout water, 5 ft average width, 132 ppm total alkalinity
TYPE OF DEVELOPMENT /ENHANCEMENT: Stream bank debrushing
STUDY PERIOD AND DESIGN: One 0.26-mile TZ and one 0.16-mile RZ just upstream from the TZ. Age I+ brook trout were censused in the study zones in June 1978. Removal of woody stream bank vegetation from both banks of the TZ occurred during the fall of 1977. The 1978 trout population was used as a "predevelopment index" to compare with a follow-up postdevelopment survey made in June 1982. Quantitative changes in physical qualities of the study zones were not determined.
PRINCIPAL INVESTIGATOR: Thomas Thuemler
SUMMARY OF FINDINGS: Five years after habitat development there were 41% fewer yearling or older brook trout in the TZ than were present a few months after debrushing was completed in this study zone (Table 30). Abundance of brook trout in the RZ declined by almost the same proportion.
A modest improvement was found in the number of legalsized brook trout in the TZ from 1978 to 1982 while no change was found in legal-sized trout abundance in the RZ.
Biomass of brook trout declined in both study zones from 1978 to 1982--by 20% in the TZ and 23% in the RZ.
Qualitative observations of the physical features of the TZ, made during electrofishing surveys, indicated a decline in sand substrate and an increase in gravel substrate, but less reduction in stream channel width than was anticipated.
In the fall of 1984 bank covers and current deflectors were added to the TZ in an effort to bolster its trout carrying capacity. Evaluation of these additions is in progress.
SOURCE DOCUMENT Thuemler, T. F., Wis. Dep. Nat. Resour., pers comm. to R. L. Hunt, n.d.
TABLE 30. Abundance and biomass of age I+ wild brook trout in the reference zone and treatment zone on Lepage Creek in June before (1978) and after (1982) habitat development.
Study Predev. Postdev. % Po2ulation Characteristic Zone Value Value Change Total no./mile RZ 531 309 -42
TZ 808 479 -41
No./mile ;;.6 inches RZ 111 111 0 TZ 134 149 +11
Totallbs/mile RZ 30 23 -23 TZ 45 36 -20

LITTLE BOIS BRULE RIVER Douglas County
Wild Brook Trout, Wild Brown Trout, and Wild Rainbow Trout
DESCRIPTION OF STREAM: 2.8 miles total length, 2.8 miles trout water, 17 ft average width, 20 ft/mile average gradient, 66 ppm total alkalinity
TYPE OF DEVELOPMENT/ENHANCEMENT: Stream bank debrushing and brush bundles
STUDY PERIOD AND DESIGN: One 0.64-mile TZ consisting of 4 sampling stations and one 0.19-mile RZ just below the TZ. Predevelopment physical measurements of the study zones and trout population estimates were made in August 1978. Habitat development efforts proceeded through the summers of 1979-81 (by volunteer labor). Regrowth of woody vegetation was cut during the summer of 1979-81. Postdevelopment collections of physical and biological data were made in August 1983.
PRINCIPAL INVESTIGATOR: Stephen Schram
SUMMARY OF FINDINGS: Stream bank debrushing and placement of brush bundles in the stream triggered several beneficial changes in the physical attributes of the TZ. Mean width decreased by 49% (from 28.2 ft to 14.2 ft), mean depth increased by 44% (from 10.8 inches to 15.6 inches), and gravel substrate increased in area by 204% (from 3,463 ft 2 to 10,520 ft2 ). Gravel substrate comprised only 3% of the total predevelopment substrate in the TZ but 15% after development. Underbank cover increased but the gain was not quantified.
Postdevelopment abundance of brook trout declined in the TZ by 36%. This species remained the least abundant trout species before and after development (Table 31). No brook trout were collected in the RZ in 1978 or 1983.
Abundance of brown trout increased by 37% in the TZ and decreased by 58% in the RZ from 1978 to 1983.
Rainbow trout showed the greatest postdevelopment gain in the TZ, a 328% increase in the no. trout/mile, and it became the most abundant of the 3 trout species. Rainbow trout also moved into first place in the RZ, where there was a 167% increase in this species from 1978 to 1983.
For all 3 species of trout combined there was a 101% increase in numerical density in the TZ, while in the shorter RZ there was an overall 1% decline.
The Little Bois Brule River is utilized by anadromous brown trout and rainbow trout on their spawning runs from Lake Superior. Expansion of gravel substrate in the TZ was therefore considered to be a major positive benefit. A few age 0 rainbow trout were collected in the TZ during the predevelopment survey, but too few were captured to make a mark/recapture estimate. In 1983, 2 years after completion of development, age 0 rainbow trout were present at a density of 815/mile and accounted for 54% of all rainbow trout in the TZ. Yearling rainbow trout were 10 times more abundant in the TZ in 1983 than in 1978.
Age 0 brown trout were also too few in number to census in the TZ in 1978 but in August 1983 their abundance was equivalent to 870/mile. Abundance of yearling brown trout rose from 84/mile in 1978 to 138/mile in 1983 in the TZ.
SOURCE DOCUMENT Rieckhoff, J. L., Wis. Dep. Nat. Resour., intradep. memo. to the District Director, 30 December 1983.
TABLE 31. Abundance of age 0+ wild brook trout, wild brown trout, and wild rainbow trout in the treatment zone and reference zone on the Little Bois Brule Rif!er in August before ( 1978) and after ( 1983) habitat deoolopment.
Study Predev. Postdev. % Trout Sl!ecies Zone Value Value Change Brook TZ 143 92 -36
RZ 0 0 0
Brown TZ 829 1,132 +37 RZ 1,063 447 -58
Rainbow TZ 280 1,198 +328 RZ 363 968 +167
Combined TZ 1,252 2,522 +101 RZ 1,426 1,415 -1
37

38
LITTLE PLOVER RIVER Portage County
Wild Brook Trout
DESCRIPTION OF STREAM: 6.9 miles total length, 3.2 miles trout water, 11 ft average width, 135 ppm total alkalinity
TYPE OF DEVELOPMENT/ENHANCEMENT: Stream bank debrushing
STUDY PERIOD AND DESIGN: One 0.45-mile TZ and one 0.45-mile RZ with 2 stations, one just below the TZ and one just above it. The predevelopment phase of study covered September 1970 through April 1973. Two postdevelopment periods were involved, May 1973-December 1977 and January 1981-December 1983. The second postdevelopment period was initiated because uncontrollable changes in natural annual stream flow during the 1974-77 period of the initial postdevelopment phase interfered with the planned evaluation of habitat development. This 4-year period was characterized by a progressively severe drought, which reduced stream flow to levels well below normal. Stream flow gradually returned to more normal conditions during 1978-80, so the evaluation was resumed for a 3-year period in January 1981.
Brook trout populations in the study zones were censused each April and September of 1970-77 and 1981-83. Several physical features of the stream channel were quantified in the study zones before and after stream bank debrushing, water temperatures were monitored during April-September periods at the boundaries of the TZ, and stream discharge was monitored continuously throughout the study at a U.S.G.S. gauging station on the stream about 2.4 miles below the RZ.
A partial season-long creel census was conducted during the 1970 and 1972 predevelopment years and the 1976 postdevelopment year. During 1973-75 the study zones were in "refuge status"-no fishing was permitted, in an effort to allow the trout population in the TZ to respond to the habitat development carried out during April-May 1973.
This study was part of a larger investigation of stream bank debrushing involving Lunch Creek and Spring Creek during 1970-77 and Lunch Creek during 1981-83.
PRINCIPAL INVESTIGATOR: Robert Hunt
SUMMARY OF FINDINGS: Postdevelopment quality of the trout habitat in the TZ improved in several ways from the summer of 1970 to the summer of 1983. Stream channel width decreased by 10%, average water depth increased by 60%, and water volume increased by 46%. Aquatic plants flourished from virtual absence in 1970 to coverage of 37% of the substrate in the TZ in 1983. A negative change observed was reduction in the area of gravel substrate by 88% (Fig. 18).
Maximum water temperature at the lower boundary of the TZ was elevated by 5 F (to 68 F) during the first postdevelopment summer, by 3.5 F the 2nd summer, by 2 F the 3rd and 4th summers, by 1.5 F the 5th summer, and by 1 F the 8th, 9th, and lOth summers.
Despite enhancement of trout habitat in the TZ, the brook trout population failed to improve during the 10-year postdevelopment period of monitoring, based on comparing population trends in the TZ with those occurring concur-
rently in the RZ. In both study zones abundance and biomass of brook trout varied in remarkably close synchrony with changes in stream discharge (Fig.l9-21). Moreover, declines in abundance and biomass of brook trout in the TZ during 197 4-77 were generally more severe than those occurring in the RZ, and when stream flow regimes recovered to more normal conditions during 1981-83, recovery of standing stock in the RZ was better than recovery of standing stock in the TZ (Fig. 22, 23).
Angler use increased in the TZ almost 200% after development (1970-72 average vs. 1976) based on hours of fishing effort (from 238 hours/mile to 674 hoursjmile), but the number of trout harvested increased only 6% (Append. Table 2). Angling pressure increased in the RZ by about the same proportion, but harvest increased by 47%.
About the only apparent benefit to the brook trout population in the TZ during the postdevelopment period was improved growth. Average April-September growth in length improved 14% for age 0 and 23% for age I.
Despite one of the most detailed evaluations of trout habitat development done in Wisconsin, no causes were identified to "explain" the failure of standing stocks of brook trout in the TZ to improve during the postdevelopment period. Reduced recruitment of age 0 trout from the main spawning area of the stream, located above the study zones, may have been an important cause, but potential changes in such recruitment were not quantified.
SOURCE DOCUMENTS
Hunt, R. L. 1979. Removal of woody streambank vegetation to im
prove trout habitat. Wis. Dep. Nat. Resour. Tech. Bull. No. 115. 36 pp.
1985. A follow-up assessment of removing woody streambank vegetation along two Wisconsin trout streams. Wis. Dep. Nat. Resour. Res. Rep. No.l37. 23 pp.
PERCENTAGE CHANGE AFTER HABITAT DEVELOPMENT
-100 0 100
SURFACE AREA
SILT BOTTOM
SAND BOTTOM
MEAN DEPTH
MEAN WIDTH
VOLUME OF CHANNEL
FIGURE 18. Changes in stream morphometry of the treatment zone on the Little Plover River from 1970 to 1983. Habitat development was carried out in 1973.

300
a: • IJJ lD r"' 0.815•• 73 :!! w .74 li: w 00 200 ~ w _J •• 83 :E 75 ;:::. e70 ::> 72 ft .71 t- 100
"' 0 0 .82 0:: <D ear (f) .76 <D _J .77
2 4 6 8 10 12 14 MEAN JUNE -AUGUST STREAM FLOW IN REFERENCE ZONE (CFSl
FIGURE 19. Relation of summer discharge to fall trout carrying capacity in the reference zone of the Little Plover River during 1970-77 and 1981-83.
r=0.921 ..
2 4 6 8 10 12 14 MEAN JUNE -AUGUST STREAM FLOW IN TREATMENT ZONE (CFSJ
FIGURE 20. Relation of summer discharge to fall trout carrying capacity in the treatment zone on the Little Plover River during 1970-77 and 1981-83.
14
12 ,23-YE~~ r
----------- ~~- ---~~-10
1961 1963 1965 1967 1969 1971 1973 1975 1977 1979 1981 1983
FIGURE 21. Mean annual discharge of the Little Plover River at the U.S.G.S. gauging station near the Hoover Avenue bridge during the 23-year, 1961-83 period.
~ 1,400 ::E w 1-f!J 1,200
- TREATMENT ZONE ----· REFERENCE ZONE
"' ;;;; :;] 1,100 J: u ;;;;
800 "' " w _J
:E 600 i" ;::) 0 tt: 400 >-
" 0 0
"' 200 "'
d PREOEVELOPMENT POSTDEVELOPMENT
FIGURE 22. Number of wild brook troutjmile ?6 inches in September in the reference zone and treatment zone of the Little Plover River before ( 1970-72) and after ( 1973-83) removal of woody stream bank vegetation in the treatment zone. No observations were made during the 3-year, 1978-80 period.
'j
~200 t;
~ s ro
"' ro ..J
-TREATMENT ZONE ----- REFERENCE ZONE
1974 1975
POSTDEVELOPMENT
1983
FIGURE 23. Pounds of wild brook troutjmile in September in the reference zone and treatment zone on the Little Plover River before (1970-72) and after (1973-83) habitat development. No observations were made during the 3-year, 1978-80 period. 39

40
LUNCH CREEK Waushara County
Wild Brown Trout
DESCRIPTION OF STREAM: 10.8 miles total length, 10.8 miles trout water, 8ft average width, 6ft/mile average gradient, 165 ppm total alkalinity
TYPE OF DEVELOPMENT/ENHANCEMENT: Stream bank debrushing
STUDY PERIOD AND DESIGN: One 0.54-mile TZ and one 0.78-mile RZ immediately below the TZ. A 3-year predevelopment phase of study began in 1971. Removal of woody vegetation from both banks of the TZ was carried out during the winter of 1973-74. A 4-year postdevelopment investigation was conducted during 1974-77 and another 3-year postdevelopment study was conducted during 1981-83. The 1981-83 study was initiated after annual stream flow had recovered from the 1974-77 drought cycle, which interfered with the earlier postdevelopment evaluation.
Brown trout populations in the study zones were monitored each April and September to determine abundance and biomass of age I + trout in April and age 0 + trout in September. Several physical features of the study zones were quantified before and after development in the TZ. Water temperatures were monitored during May-September periods at the boundaries of the TZ.
This study was part of a larger investigation involving similar evaluations of stream bank debrushing on Spring Creek and the Little Plover River.
PRINCIPAL INVESTIGATOR: Robert Hunt
SUMMARY OF FINDINGS: The TZ provided better habitat for trout 10 years after removal of woody vegetation than it did prior to removal (1983 vs. 1973). Average water depth increased, stream banks encroached to narrow the channel width, rooted aquatic vegetation increased, and the area of exposed gravel substrate changed from near zero prior to development to coverage of 10% of the TZ in September 1983 (Table 32).
May-September water temperatures in the TZ were slightly altered by reduction of woody vegetation shading the stream bank. During 2 summers of predevelopment monitoring (1972-73), maximum water temperatures at the lower end of the TZ were 5 F and 3 Flower than at the upper end of the TZ (Table 33). During the postdevelopment summers (1974-77, 1981-83), maximum summer temperatures recorded at the downstream boundary of the TZ dif-
fered 2 F or less from the maximum temperature recorded the same summers at the upper boundary. In no summer, however, was the summer maximum higher at the downstream boundary.
Several improvements were observed in standing stocks of brown trout in the TZ after development, based on comparisons between the 1971-73 predevelopment period and the second postdevelopment period of study, 1981-83 (Table 34). These positive changes included abundance of legalsized brown trout in April (up 29%) and September (up 51%) and abundance of quality-sized brown trout (10 inches or larger) in April (up 10%) and September (up 82%).
During the 1971-73 predevelopment period, the TZ held 3% fewer legal-sized brown trout/mile and 50% fewer quality-sized brown trout/mile than did the RZ in September (Fig. 24). During the 1981-83 postdevelopment period, the TZ held 34% more legal-sized brown trout/mile and 19% more quality-sized brown trout/mile than did the RZ in September.
Growth of ages 0-III brown trout in the TZ during AprilSeptember periods improved after stream bank debrushing, relative to concomitant growth increments achieved by similar age groups in the unmanaged RZ.
SOURCE DOCUMENTS Hunt, R. L.
1979. Removal of woody streambank vegetation to improve trout habitat. Wis. Dep. Nat. Resour. Tech. Bull. No. 115. 36 pp.
1985. A follow-up assessment of removing woody streambank vegetation along two Wisconsin trout streams. Wis. Dep. Nat. Resour. Res. Rep. No. 137. 23 pp.
TABLE 32. Characteristics of the treatment zone and reference zone on Lunch Creek before and after removal of woody vegetation in the treatment zone.
Mid channel Surface Mean Mean Channel Aquatic Bottom Type Study Length Area Depth Width Volume Macrophytes• (%Total Zone Bottom)*
Stud~ Phase Date Zone (miles) (acres) (ft) (ft) (ft 3) (ft 2
) Sand Silt Gravel Peat Cobble Predevelopment Sep 1971 TZ 0.54 0.88 0.98 13.5 37,560
RZ 0.78 1.02 1.23 10.7 54,644
Postdevelopment &>p 1983 TZ 0.54 0.84 1.00 12.5 35,625 4,007 71.2 14.2 10.3 3.7 0.6 RZ 0.80 1.13 1.04 11.0 48,698 3,057 70.7 27.6 0.2 1.5 0.0
• Postdevelopment period only. Generic composition of aquatic macrophytes on file at Cold Water Research Group headquarters.

TABLE 33. Maximum, minimum, and mean water tempera-tures (F) at the upper and lower boundaries of the treatment zone on Lunch Creek for the 5-montk, May-September periods of 1972-73,1974-77, and 1981-83.
Maximum Minimum Mean Stud~ Phase U212er Lower U!!~r Lower U122er Lower Predevelopment
1972 74 69 45 44 60 57 1973 71 68 44 42 59 56
Postdevelopment 1974 70 70 44 42 59 56 1975 72 70 45 42 60 56 1976 73 71 40 40 59 57 1977 73 72 46 41 61 58
1981 69 68 40 42 56 56 1982 68 68 49 49 55 55 1983 68 88 42 44 56 56
1,400
ffi 1,200 CD :::E w t-~ 1,000 IJ)
::!': w ...J 800 :i ~ 0
600 cr t-z ~ cr 400 CD
DEVELOPMENT
TROUT 2:6 INCHES
• TREATMENT ZONE
D REFERENCE ZONE
DEVELOPMENT
TROUT l: 10 INCHES
FIGURE 24. Average number of legal-sized wild brown trout/ mile and quality-sized ( ~ 10 inches) wild brown troutjmile in September in the treatment zone and reference zone on Lunch Creek before (1971-73) and after (1981-83) habitat development.
TABLE 34. Average number and biomass of wild brown trout in the treat-ment zone and reference zone on Lunch Creek in April and September before (1971-73) and after (1981-83) habitat development.
Probability of Significant
Change Population Study Predev. Postdev. % Favoring the Characteristic Month Zone Avs. Avs. Chanse TZ
Total no.(mile Apr TZ 2,634 1,980 -25 p < 0.05 RZ 850 1,246 +47
Sep TZ 2,102 2,440 +16 p < 0.55 RZ 1,067 1,206 +13
No.(mile Apr TZ 585 752 +29 p < 0.26 ;;;.6 inches RZ 406 445 +10
Sep TZ 849 1,285 +51 p < 0.01 RZ 875 962 +10
No./mile Apr TZ 73 80 +10 p < 0.19 ;;;.10 inches RZ 72 49 -32
Sep TZ 78 142 +82 p < 0.02 RZ 157 119 -24
Totallbs/mile Apr TZ 279 217 -22 p < 0.12 RZ 127 126 -1
Sep TZ 279 279 0 p < 0.67 RZ 204 194 -5
41

42
MaciNTIRE CREEK Marinette County
Wild Brook Trout and Wild Brown Trout
DESCRIPTION OF STREAM: 6.5 miles total length, 6.5 miles trout water, 14 ft average width, 126 ppm total alkalinity
TYPE OF DEVELOPMENT/ENHANCEMENT: Intensive installation of bank covers and current deflectors
STUDY PERIOD AND DESIGN: One TZ that varied in length from 0.34 mile to 0.43 mile as the study progressed. No RZ. Predevelopment inventories of trout in the TZ were made in July of 1970 and 1971. Habitat development was carried out during the summers of 1972 and 1973. Postdevelopment trout population estimates were made in July of 1975 and 1980 and in August of 1982 and 1984. Age 0 trout were excluded. No data on physical changes are included in the source document.
PRINCIPAL INVESTIGATOR: Thomas Thuemler
SUMMARY OF FINDINGS: During the postdevelopment period, total number of brook trout increased in average abundance by 84% compared to the predevelopment period (Table 35). Brown trout showed a much greater proportional jump ( 431%) after development and also became the more numerous of the 2 trout species. Brown trout accounted for only 28% of the predevelopment standing stocks but an average of 53% of the postdevelopment standing stocks.
The average number of legal-sized brook trout declined by 21% after development. Legal-sized brown trout increased an average of 102%. Brown trout comprised 54% of the standing stocks of legal-sized trout present prior to development and 75% of the postdevelopment standing stocks of legal trout.
Biomass of age I+ brook trout improved by 40% after development (from 77 lbs/mile to 108 lbs/mile), while biomass of age I+ brown trout shot up an average 490% (from 59 lbsjmile to 348 lbsjmile).
The buildup of age I+ trout was continuous during the postdevelopment period for both species (Fig. 25). For trout of legal size, however, the postdevelopment trend was downward from a 1975 peak for brook trout (Fig. 26). Legal-sized brown trout increased in abundance throughout the postdevelopment phase, reaching a peak density of 570/mile in August 1984.
Quality-sized brook trout (8 inches or larger) declined during the postdevelopment years by an average of 48% (from 31/mile to 16/mile). Quality-sized brown trout (10 inches or larger) increased dramatically from zero in 1970-71 to an average 46/mile during the 4 years of postdevelopment monitoring.
SOURCE DOCUMENTS
Thuemler, T. F., Wis. Dep. Nat. Resour., memo. to H. Graham and G. York, 29 August 1984.
Thuemler, T. F., Wis. Dep. Nat. Resour., pers. comm. toR. Hunt, n.d.
TABLE 35. Abundance and biomass of age I+ wild brook trout and wild brown trout in the treatment zone on M aci ntire Creek before (July 1970-71) and after (July 1975,1980 and August 1982, 1984) habitat development.
Population Trout Predev. Characteristic SQecies Avg. Total no.(mile Brook 490
Brown 193 Combined 683
No.(mile ;:;.6 inches Brook 138 Brown 165 Combined 303
No.(mile ;:;>8 inches Brook 31
No.(mile ;:;>10 inches Brown 0
Totallbs/mile Brook 77 Brown 59 Combined 136
2,500
2,000 w _J
~ ;::: 1,500 :::> 0 0:: t-
1,000
500 0
•
Postdev. % Avg. Change 902 +84
1,025 +431 1,927 +182
109 -21 333 +102 442 +46
16 -48
46 +4,600
108 +40 348 +490 456 +235
BROWN TROUT
•+431% 0+84%
1970-71 1975 1980 1982 1984 1975-84 AVG. AVG.
PREDEVELOPMENTl-POSTDEVELOPMENT -f FIGURE 25. Abundance of age I+ wild brook trout and wild brown trout in the treatment zone on Macintire Creek before ( 1970-71) and after ( 1975-84) habitat development. Percentage change from predevelopment is indicated next to the postdevelopment average.
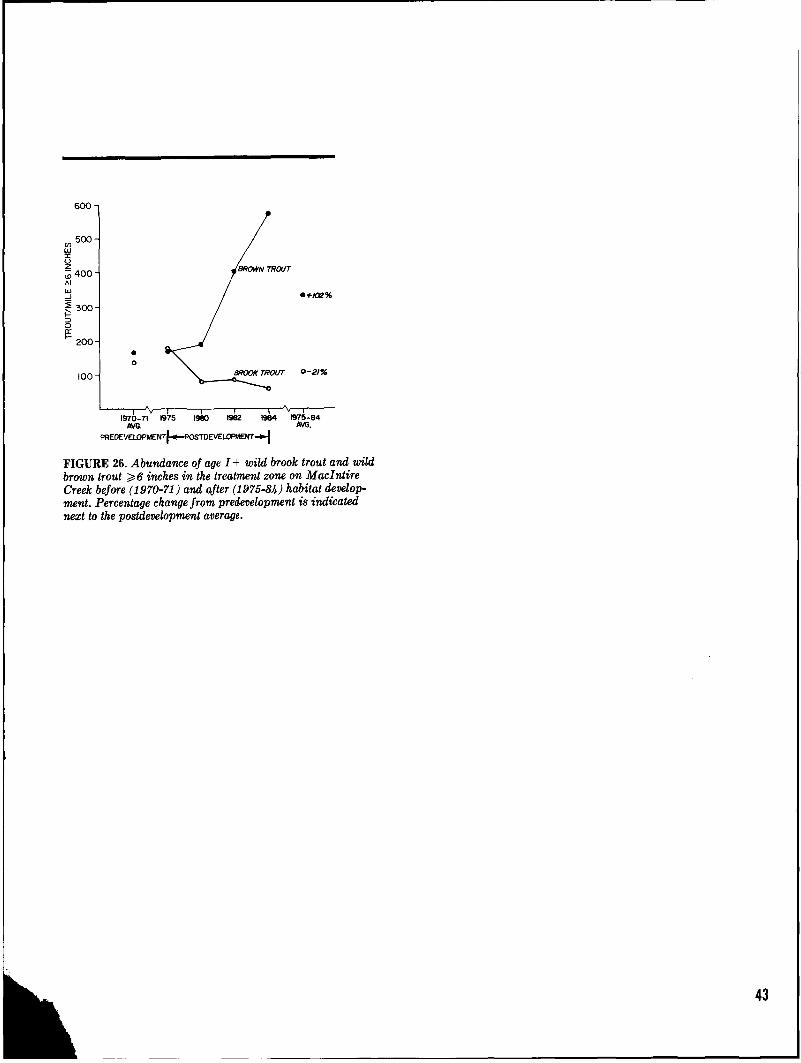
600
500 (/)
LLJ :r u z Uj400
"' LLJ _J
~300 ;:::. :::> 0 a:: r- 200
BROWN TROUT
1970-71 1975 1980 1982 1984 1975-84 /IWG. AVG.
PREDEVELOPMEmf-POSTDEVELOPMENT-+-j
FIGURE 26. Abundance of age I+ wild brook trout and wild brown trout ?:;6 inches in the treatment zone on Maclntire Creek before (1970-71) and after (1975-84) habitat development. Percentage change from predevelopment is indicated next to the postdevelopment average.
43

44
McKENZIE CREEK Polk County
Wild Brown Trout
DESCRIPTION OF STREAM: 6.6 miles total length, 6.6 miles trout water, 10 ft average width, 15 ft/mile average gradient, 99 ppm total alkalinity
TYPE OF DEVELOPMENT/ENHANCEMENT: Bank covers, current deflectors, low-head dams, brush bundles, boulders, and riprap
STUDY PERIOD AND DESIGN: Six sections of different lengths were studied for different periods of time during 1957-64. For purposes of this compendium, I have selected the 4 sections A-D to represent a single continuous TZ of 3.5 miles. No RZ. Trout in the TZ were censused each October of 1957-64. Habitat development was carried out during the summers of 1958-59. Summaries of standing stocks of brown trout in the TZ were reported by age groupings rather than, or in addition to, size groupings.
A partial season-long creel census was conducted throughout the predevelopment 1957 trout fishing season and again throughout the postdevelopment 1963 fishing season. Changes in physical features of the TZ are not included in the source document.
Only data on wild brown trout are included in this compendium. Domestic brown trout and wild and domestic brook trout were also present in the stream.
PRINCIPAL INVESTIGATORS: Ray White and Gerald Lowry
SUMMARY OF FINDINGS: Postdevelopment abundance of age 0 + brown trout in the TZ in October increased by an average of 38% (Table 36). Age 0 trout increased from a predevelopment density of 600/mile to a postdevelopment average density of 816/mile, a 36% gain. Yearling and older brown trout numbered 398/mile prior to development and 560/mile after development, a 41% improvement (yearlings or older are approximately equivalent to legal-sized trout).
Density of age I+ trout during all 5 postdevelopment years was always greater than the predevelopment density in October by at least 14%, and the 2 highest densities observed occurred the last 2 postdevelopment years (Fig. 27). For those 2 years the densities of age I + brown trout were 633/mile and 614/mile, exceeding the predevelopment density by 59% and 54%, respectively.
Survival of age 0 trout may have improved during the postdevelopment years because of the additions of brush bundle covers installed as part of the total habitat development process. Annual survival rates of age I + stocks remained fairly constant.
Growth rates of various age groups appeared to be density-dependent and therefore indirectly linked to habitat development, which contributed to increased density of these stocks.
Angler use (Append. Table 2) declined slightly from 1957 to 1963 (457 hours(acre vs. 400 hours/acre) but harvest increased slightly (190 trout/mile vs. 197 trout(mile). Use may have declined in response to angler awareness of a reduction in the annual stocking rate of domestic brook trout near the upper end of the TZ, from 5,550 in 1957 to only 1,000 in 1963. Catch rate for trout creeled improved a bit after development, from 0.42 trout(hr in 1957 (predevelopment creel census) to 0.49 trout/hour in 1963.
SOURCE DOCUMENT
Lowry, G. R. 1971. Effect of habitat alteration on brown trout in Mc
Kenzie Creek, Wisconsin. Wis. Dep. Nat. Resour. Res. Rep. No. 70. 27 pp.
TABLE 36. Abundance of wild brown trout in the treatment zone on McKenzie Creek in October before (1957) and after ( 1960-64) habitat development.
Population Predev. Postdev. % Characteristic Value Avg. Change No.jmile age 0 600 816 +36 No./mile age I+ 398 560 +41 Total no.jmile 999 1,376 +38
700
a:: w <C 600 g u 0
BROWN TROUT •+41%
z w 500 ...J :!! ~400 0 • a:: I-z ~300 a:: <C
;!:. w 200 (!)
<!
100
1957 1960 1961 1962 1963 1964 1960-64 AVG.
PREDEVELOPMENTl-POSTDEVELOPMENT-1
FIGURE 27. Abundance of age I+ wild brown trout in the treatment zone on McKenzie Creek in October before (1957) and after ( 1960-64) habitat development. Percentage change from predevelopment is indicated next to the postdevelopment average.

MIDDLE BRANCH EMBARRASS RIVER Shawano County
Wild Brook Trout
DESCRIPTION OF STREAM: 38.2 miles total length, 38.2 miles trout water, 42 ft average width, 130 ppm total alkalinity
TYPE OF DEVELOPMENT/ENHANCEMENT: Bank covers, current deflectors, half-logs, and riprap
STUDY PERIOD AND DESIGN: One 0.31-mile TZ. No RZ. Age I+ brook trout were censused in July 1978. Habitat development was done in the lower half of the TZ in 1979 and in the upper half in 1981. A postdevelopment inventory of brook trout in the TZ was made in August 1985. No data are included in the source document relating to quantitative changes in physical characteristics of the TZ.
PRINCIPAL INVESTIGATOR: Ross Langhurst
SUMMARY OF FINDINGS: Results of the postdevelopment census were disappointing. The TZ had 24% fewer age I+ brook trout (total no. trout/mile), 49% fewer legal-sized brook trout, and 26% less biomass (Table 37). Qualitative observations suggested greatly increased angler use in the TZ after development and several beneficial physical changes.
SOURCE DOCUMENT
Langhurst, R. W., Wis. Dep. Nat. Resour., pers. comm. to T. L. Thuemler, n.d.
TABLE 37. Abundance and biomass of wild brook trout in the treatment zone on the Middle Branch Embarrass River before (July 1978) and after (August 1985) habitat development.
Population Predev. Postdev. % Characteristic Value Value Change Total no./mile 848 646 -24 No./mile ~6 inches 265 135 -49 Total lbs/mile 61 45 -26
45

MT. VERNON CREEK Dane County
Wild Brown Trout*
DESCRIPTION OF STREAM: 7.0 miles total length, 7.0 miles trout water, 10 ft average width, 18 ft/mile average gradient, 239 ppm total alkalinity
TYPE OF DEVELOPMENT/ENHANCEMENT: A variety of habitat enhancement procedures were employed from at least 1961 through 1982 including stream bank fencing, construction of cattle and machinery crossings, removal of large trees (mostly willows), dumped gravel for spawning sites, bank covers, and current deflectors.
STUDY PERIOD AND DESIGN: At least 14 trout population surveys were made in the spring or fall during 1956-82. These surveys covered 19 stations grouped into several study sections totalling 6.1 miles of streams. Stations included developed as well as undeveloped areas. Trout population data were summarized in a variety of station groupings often unrelated to habitat development evaluations.
From the records available, it was not possible to follow trout population trends before and after habitat development in one or more stations or to track long-term trends in one or more of the developed stations. However, in the summary below, data are cited that provide examples of postdevelopment changes in some stations treated as TZs vs. other stations used as RZs. Long-term trends for the entire 6.1-mile study zone are also reviewed. No data are included in the source documents on physical changes in various stations.
Season-long creel census studies were conducted during the 1979-80 fishing seasons but findings were not interpreted in relation to habitat development.
PRINCIPAL INVESTIGATOR: Clifford Brynildson
SUMMARY OF FINDINGS: Trout population data collected in September of 1965 and 1966 provide comparisons of standing stocks of wild brown trout in all developed stations (designated here as the TZ) vs. all undeveloped stations (designated as the RZ). By 1965 approximately 2.0 miles of the 6.1-mile reach had received some kind of habitat development. By 1966 the developed stations totalled 2.67 miles.
Relative abundance of wild brown trout was 53% greater in the TZ than in the RZ in September 1965 and 160% greater in September 1966. Biomass was only 4% greater in the TZ in 1965 but 66% greater in 1966 (Fig. 28). Both abundance and biomass increased from 1965 to 1966 in the TZ. In the RZ the number and biomass of brown trout declined from 1965 to 1966. Thus, interzone and intrazone comparisons support the probability that habitat development was beneficial.
Another series of RZ vs. TZ comparisons involving fewer stations is summarized in Figure 29 based on trout population data collected in April 1972 and 1976. The RZ represents 0.83 mile of stream in stations 4-6. The TZ covers 0.78 mile of stream in stations 7-10. Habitat development in the TZ was concentrated in the 1964-66 period when fencing, bank covers, and current deflectors were added, and some older structures were repaired.
46 * Data on sparse stocks of domestic trout not considered.
In April of both 1972 and 1976 more brown trout were present in the TZ than in the RZ. Biomass was also higher in the TZ-only 4% higher in 1972 but 85% greater in 1976. In both study zones abundance and biomass of trout improved from 1972 to 1976, but the gains were much more impressive in the TZ. Wild brown trout increased from 717/mile to 1,713/mile in the TZ, a 139% improvement. In the RZ there was only a 7% improvement (from 522/mile to 557/mile). Biomass improved in the TZ by 193% from 1972 to 1976. The RZ biomass gain was 64%.
By the end of 1982 most of the 6.1-mile study area had received some kind of habitat development. The periodic inventories of trout in this long study area reflect a generally steady improvement in both number and biomass accompanying the steady increase in the proportion of the study zone influenced by habitat development. A clear cause-effect relationship between development and trout abundance or biomass cannot be established because of inadequate chronological recording of development done in various stations and subsequent standing stocks in those stations. However, circumstantial evidence for a cause-effect relationship is strong. Table 38 and Figures 30 and 31 summarize this evidence based on a series of trout population assessments covering a 24-year period of April inventories and a 17 -year period of September inventories.
In April1980 this long study zone held 960% more wild brown trout than it did in 1956 (Table 38) and a 602% greater biomass (Fig. 30). In September 1982 the study zone held 1,043% more wild brown trout than it did in September 1965 (Table 38), and biomass had increased by 418% (Fig. 31).
Other factors that may have contributed to the long-term trends of improved abundance and biomass of wild brown trout include discontinuation of stocking domestic trout, increased public control of land adjacent to the stream, and few severe floods in recent years during January-February when trout fry are emerging.
SOURCE DOCUMENTS Brynildson, C., Wis. Dep. Nat. Resour., intradep. memo. to waters file, 24 January 1967, 21 December 1967, and 11 November 1976. Brynildson, C., Wis. Dep. Nat. Resour., intradep. memo. to A. E. Ehly, 21 November 1972. Warren, J., Wis. Dep. Nat. Resour., intradep. memo. to D. Morrissette, 17 November 1980, 18 December 1981, and 24 November 1982.

a:: UJ (]) ::;: UJ 1-a. UJ (/)
~ UJ ...J ~ ' ~ 0 a::
400
I- 200
I 0 ...J :!:
160%
0 REFERENCE ZONE
lj TREATMENT ZONE
150 a:: UJ (])
::;: UJ
125 ti: UJ (/)
!?: 100~
~ ;::: :::>
75 ~ z :;::
50~ (])
9 25 30
(/) (])
...J
FIGURE 28. Abundance and biomass of wild brown trout in a reference zone and treatment zone on Mt. Vernon Creek in September of 1965-66.
...J
~ z ~ 1,500
:E 5 0
~ z ~I l!i 0 ...J :!:
500
4-208" 0 REFERENCE ZONE
• TREAT'-ENT ZONE
FIGURE 29. Abundance and biomass of wild brown trout in a reference zone and treatment zone on Mt. Vernon Creek in April of 1972 and 1976.
400 ...J
~if ~~ 300 moW ...J:!
30~200 (/):::> mo ...Ja::
I-100
Habitat Development throughout 1961-80 Period
1956 1965 1972 1973 1976 1979 1980
FIGURE 30. Biomass of wild brown trout in a 6.1-mile portion of Mt. Vernon Creek in April1956-80.
500
100
Habitat Development throughout 1961-82 Period
1965 1966 1967 1978 1979 1980 1982
FIGURE 31. Biomass of wild brown trout in a 6.1-mile portion of Mt. Vernon Creek in September 1965-82 .
TABLE 38. Abundance and biomass of wild brawn trout in a 6.1-mile portion of Mt. Vernon Creek in April1956-80 and September 1965-82.
Year No.LMile LbsLMile
April 1956 138 47 1965 334 102 1972 438 148 1973 314 133 1976 1,143 245 1979 994 247 1980 1,463 330
September 1965 194 91 1966 197 97 1967 110 80 1978 1,387 207 1979 1,742 291 1980 1,742 324 1982 2,218 471 47

48
NEENAH CREEK-STATION 1 Adams County
Wild Brown Trout
DESCRIPTION OF STREAM: 42.8 miles total length, 6.0 miles trout water, 9ft average width, 12 ftjmile average gradient, 160 ppm total alkalinity
TYPE OF DEVELOPMENT/ENHANCEMENT: Stream bank de brushing, brush bundles, polyethylene sandbag bank covers, and polyethylene sandbag current deflectors
STUDY PERIOD AND DESIGN: One 0.65-mile TZ. No RZ. A predevelopment census of trout was carried out in July 1980. Habitat development was done during 1982. Postdevelopment census of the standing stocks were made in August 1983 and 1984. Age 0 trout were not censused. No data on biomass or physical changes are cited in the source document.
PRINCIPAL INVESTIGATOR: Scot Ironside
SUMMARY OF FINDINGS: Wild brown trout 4 inches or larger, 6 inches or larger, and 10 inches or larger increased in average abundance by 191%, 151%, and 75%, respectively, after development. Abundance of brown trout 14 inches or larger declined by 43% from 1980 to 1983-84 (Table 39).
SOURCE DOCUMENT
Smith, R. H., Wis. Dep. Nat. Resour., intradep. memo. to J. G. Brasch, 17 September 1984.
TABLE 39. Abundance of wild brown trout in the treatment zone on Neenah Creek (station 1) before (July 1980) and after (August 1983-84) habitat development.
Population Predev. Postdev. % Characteristic Value Avg. Change No./mile ~4 inches 364 1,058 +191 No./mile ~6 inches 334 840 +151 No./mile ~ 10 inches 93 163 +75 No.;mile ~ 14 inches 21 12 -43

NEENAH CREEK-STATION 2 Adams County
Wild Brown Trout
DESCRIPTION OF STREAM: 42.8 miles total length, 6.0 miles trout water, 9ft average width, 12 ftjmile average gradient, 160 ppm total alkalinity
TYPE OF DEVELOPMENT/ENHANCEMENT: Stream bank debrushing, brush bundles, polyethylene sandbag bank covers, and polyethylene sandbag current deflectors
STUDY PERIOD AND DESIGN: One 0.63-mile TZ. No RZ. A trout population estimate was conducted in the TZ in July 1980. Habitat development was accomplished during 1983. Postdevelopment inventories of standing stocks were made in August 1983 and 1984. Age I+ trout were included in the estimates. The August 1983 estimate is excluded from this compendium as inappropriate for a postdevelopment index. No biomass data or physical data are presented in the source document.
PRINCIPAL INVESTIGATOR: Scot Ironside
SUMMARY OF FINDINGS: Approximately one year after completion of habitat development, all size groupings of wild brown trout showed dramatic increases in the TZ (Table 40). Percentage increases were inversely related to size. Postdevelopment gains in brown trout 10 inches or larger and 14 inches or larger probably reflect immigration rather than within-zone recruitment due to enhanced survival and/ or growth. Whether due to immigration or within-zone recruitment, the presence of more quality-sized trout can be inferred as an indication of their preference for the managed habitat in the TZ.
SOURCE DOCUMENT Smith, R. H., Wis. Dep. Nat. Resour., intradep. memo. to J. G. Brasch, 17 September 1984.
TABLE 40. Abundance of wild brown trout in the treatment zone on Neenah Creek (station 2) before (July 1980) and after (August 1984) habitat development.
Population Predev. Postdev. % Characteristic Value Value Change No.jmile ~4 inches 49 495 +910 No.jmile ~ 6 inches 48 411 +756 No.jmile ~10 inches 29 65 +124 No.fmile ~14 inches 6 11 +83
49

50
NICHOLS CREEK Sheboygan County
Wild Brown Trout
DESCRIPTION OF STREAM: 3.3 miles total length, 3.3 miles trout water, 9ft average width, 33ft/mile average gradient, 278 ppm total alkalinity
TYPE OF DEVELOPMENT/ENHANCEMENT: Stream bank debrushing, brush bundles, half-logs, bank covers, and current deflectors
STUDY PERIOD AND DESIGN: Two TZs, 0.25-mile TZ 1 (station 2) and 0.19-mile TZ 2 (station 4). One 0.13-mile RZ downstream from the TZs. Trout habitat development was carried out during the summer of 1980-81 in the 2 TZs. A predevelopment census of trout was made in the RZ and in TZ 2 in the fall of 1979. A postdevelopment census was done in the fall of 1983 in all3 study zones. Several physical characteristics of the study zones were quantified before (1979) and after (1984) development. Data on the sparse populations of wild brook trout in the study zones are not included in the source document.
Only trout population data for TZ 2 and the RZ are used in this compendium.
PRINCIPAL INVESTIGATOR: John Nelson
SUMMARY OF FINDINGS: Abundance and biomass of brown trout increased in both study zones from 1979 to 1983 but increases were substantially greater in TZ 2 than in the RZ (Table 41). The major spawning and age 0 nursery areas are located in the RZ, hence the much higher population densities in this zone both years. The RZ held 560% more trout/mile in fall of 1979 and 360% more trout/mile in fall of 1982.
Legal-sized brown trout increased in number by 109% in TZ 2 after development (from 540/mile to 1,131/mile). An increase of 32% occurred in the number of legal-sized brown trout in the RZ from 1979 to 1983. In both years, however, the RZ held superior densities of legal-sized trout.
The same pattern of change characterized population biomass in the 2 study zones-proportionately greater percentage improvement in TZ 2 but empirically superior biomass in the RZ both years.
Average width of TZ 2 decreased by 18%, and average depth increased by 50% after development. Aquatic macrophytes increased in the TZ after development, as expected, but gravel substrate did not increase, an unexpected result.
SOURCE DOCUMENT Nelson, J. E., Wis. Dep. Nat. Resour., intradep. memo. to E. R. &humacher, 2 January 1985.
TABLE 41. Abundance and biomass of wild brown trout in treatment zone 2 and the reference zone on Nichols Creek before ( 1979) and after ( 1983) habitat development.
Population Study Predev. Postdev. % Characteristic Zone Value Value Change Total no.fmile TZ 871 1,500 +72
RZ 5,405 6,917 +28
No./mile ~6 inches TZ 540 1,131 +109 RZ 2,540 3,355 +32
Total lbs/mile TZ 129 320 +148 RZ 597 806 +35

NORTH BRANCH TREMPEALEAU RIVER Jackson County
Wild Brook Trout and Wild Brown Trout
DESCRIPTION OF STREAM: 7.2 miles total length, 7.2 miles trout water, 11 ft average width, 29 ft/mile average gradient, 22 ppm total alkalinity
TYPE OF DEVELOPMENT/ENHANCEMENT: Fencing, bank-sloping, riprap, and bank covers
STUDY PERIOD AND DESIGN: One TZ established in 1964 at 0.36 mile and extended in 1979 to cover a total of 0.61 mile. No RZ. A portion of the TZ was fenced in 1965 to exclude livestock, and some bank covers were installed. Debrushing was carried out on another portion that year. Bank-sloping, riprap, and additional bank covers were added in 1979 when the TZ was lengthened. Bank covers previously installed were also repaired or replaced.
Six trout population estimates were made in the TZ at various times of the year. Three of these were made in August of 1977, 1983, and 1984. These provide the best set of comparative data to assess the value of the development done in 1979.
PRINCIPAL INVESTIGATORS: James Talley and Timothy Babros
SUMMARY OF FINDINGS: Average width of the TZ decreased by 10% (from 15.4 ft to 13.9 ft) and average water depth increased by 65% (from 7.2 inches to 11.9 inches) from 1979 to 1983.
Average postdevelopment abundance of age 0 + brook trout in August increased by 77% and that of brown trout increased by 34% (Table 42). Brown trout experienced a greater positive postdevelopment gain in abundance of legalsized individuals, up 76% from the predevelopment level (325/mile vs. 185/mile). Legal-sized brook trout were 9% more abundant after development (255/mile vs. 235/mile before development).
Postdevelopment biomass of brook trout in August declined an average of 12% from the predevelopment level, whereas the average postdevelopment biomass of brown trout increased by 8% over the predevelopment level.
Brook trout accounted for 56% of all trout present in August 1977 and an average of 51% of all trout present in August of 1983-84.
SOURCE DOCUMENT Babros, T. E., Wis. Dep. Nat. Resour., intradep. memo. to R. L. Hunt, 17 January 1986.
TABLE 42. Abundance and biomass of age 0 + wild brook trout and wild brown trout in the treatment zone on the North Branch Trempealeau River in August before (1977) and after (1983-84) habitat development.
Population Trout Predev. Postdev. % Characteristic SQecies Value Avg. Change Total no./mile Brook 779 834 +7
Brown 604 810 +34 Combined 1,383 1,644 +19
No./mile ?6 inches Brook 235 255 +9 Brown 185 325 +76 Combined 420 580 +38
Total lbs/mile Brook 56 49 -12 Brown 109 118 +8 Combined 165 167 +1
51

52
PARKER CREEK St. Croix County
Wild Brown Trout
DESCRIPTION OF STREAM: 2.8 miles total length, 2.8 miles trout water, 7ft average width, 12ft/mile average gradient, 162 ppm total alkalinity
TYPE OF DEVELOPMENT/ENHANCEMENT: Stream bank debrushing, brush bundles, and half-logs
STUDY PERIOD AND DESIGN: Two adjacent TZs. No RZ. The upper 0.45-mile TZ (TZ 1) received stream bank debrushing and placement of 122 brush bundles/mile in the channel. The lower 0.43-mile TZ (TZ 2) also received de brushing of its stream banks and installation of 105 brush bundles/mile, plus addition of 174 half-logs/mile. The study was designed to determine whether placement of half-logs in TZ 2 prior to debrushing would provide synergistic benefits to trout carrying capacity in combination with debrushing and addition of brush bundles. Trout in the study zones were censused in April and September 1981-82, prior to development during fall1982, and in April and September 1983-85. Several physical qualities of the study zones were quantified in 1981 and 1984. Water temperatures were monitored during April-September periods each year of the study. (Refer also to the companion study on Radley Creek.)
PRINCIPAL INVESTIGATOR: Robert Hunt
SUMMARY OF FINDINGS: Some of the postdevelopment changes detected in physical characteristics of the TZs were beneficial to trout carrying capacity and some were not (Table 43). Average depth increased modestly in both TZs, and aquatic vegetation increased greatly in both TZs, changes that should have bolstered carrying capacity. However, area of gravel substrate declined in both TZs while silt substrate increased rather than decreased as predicted, despite narrowing and deepening of the stream channel in both zones.
Summer water temperatures did not increase after removal of woody vegetation shading the stream channels.
Of the 75 half-logs installed in TZ 2, 73 were still partially functional2 years later, and 37 were 100% functional. Overall efficiency was measured at 66% (percent of space still usable beneath the logs).
Average postdevelopment abundance of age I+ brown trout (total no. trout/mile) in April was 15% lower in TZ 1 and 1% lower in TZ 2 compared with predevelopment averages (Table 44). Average postdevelopment abundance of age 0 + brown trout in September increased by 5% in TZ 1 but decreased by 13% in TZ 2 from predevelopment averages.
Legal-sized brown trout showed average postdevelopment increases of 24% in April and 39% in September in TZ 1, but in TZ 2 average decreases of 5% in April and 4% in September were observed.
Quality-sized brown trout (10 inches or larger) declined an average of 1% in TZ 1 and an average of 11% in TZ 2 in April after development. September averages for this size category improved by 5% in TZ 1 and declined by 16% in TZ 2.
No evidence was obtained to support the hypothesis of the study that half-logs and brush bundles were more beneficial to trout carrying capacity than brush bundles alone. There was also no strong evidence from either TZ that any of the 3 habitat development techniques were beneficial to the
trout population in terms of the number and biomass present after development. A few positive changes were produced in physical qualities of the TZs, and growth of age groups 0, I, and II improved significantly in both study zones.
SOURCE DOCUMENT Hunt, R. L.
1986. An evaluation of brush bundles and half-logs to enhance carrying capacity of two brown trout streams. pp. 31-62 in J. G. Miller, J. A. Arway, and R. F. Carline, eds. Fifth trout stream habitat improvement workshop. Penn. Fish Comm., Harrisburg. 265 pp.
TABLE 43. Percentage change in several characteristics of the 2 treatment zones on Parker Creek before (1981) and after (1984) habitat development.
Zone Characteristic Surface area Average depth Average thalweg depth Average width Water volume Silt substrate Sand substrate Gravel substrate Rubble substrate Peat substrate Area of aquatic vegetation
% Change After Habitat Development
TZ 1 TZ 2 +2
+18 +17 +3
+21 +125 -19 -17
+167 +100 +414
-1 +4
+14 -2 +3
+71 +15 -36
+150 0
+87
TABLE 44. Number and biomass of wild brown trout in the 2 treatment zones on Parker Creek in April and September before ( 1981-82) and after (1983-85) habitat development.
Population Characteristic Total no./mile
No./mile ;;,6 inches
No.jmile ;;,10 inches
Totallbs/mile
Study Month Zone
Sep TZ 1 TZ2
Apr TZ 1 TZ2
Sep TZ 1 TZ2
Apr TZ 1 TZ2
Sep TZ 1 TZ2
Apr TZ 1 TZ2
Sep TZ 1 TZ2
Apr TZ 1 TZ2
Predev. Postdev. % Avg. Avg. Change 8,878 9,299 +5
13,134 11,369 -13
6,260 5,335 -15 6,081 6,010 -1
1,334 1,852 +39 1,944 1,869 -4
1,648 2,041 +24 1,988 1,895 -5
179 188 +5 245 207 -16
202 201 -1 209 186 -11
410 509 +24 578 574 -1
468 507 +8 470 502 +7

PLOVER RIVER Marathon County
Wild Brook Trout and Wild Brown Trout
DESCRIPTION OF STREAM: 51.5 miles total length, 25.1 miles trout water, 64 ft average width, 169 ppm total alkalinity
TYPE OF DEVELOPMENT/ENHANCEMENT: Bank covers and current deflectors
STUDY PERIOD AND DESIGN: One 0.56-mile TZ and one adjacent upstream 0.13-mile RZ. Installation was carried out during 1973-74. A "predevelopment" inventory of trout in the study zones was conducted in October 1974 when habitat development was almost completed. A postdevelopment assessment of the standing stocks was made in October 1977. No data on physical changes in the study zones are provided in the source document.
PRINCIPAL INVESTIGATOR: Alan Hauber
SUMMARY OF FINDINGS: From October 1974 to October 1977 legal-sized brook trout declined by 2% in the RZ and by 7% in the TZ (Table 45). Brown trout, which were less abundant than brook trout in 1974, increased in both study zones from 1974 to 1977 but proportionately more so in the TZ than in the RZ. Relative abundance was up 216% in the TZ vs. 52% in the RZ.
Brook trout 8 inches or larger decreased by 17% in the RZ but increased 128% in the TZ from 1974 to 1977. Brown trout in this size category increased in both study zones but to a much greater degree in the TZ than in the RZ.
No brown trout 14 inches or larger were present in the RZ in October of 1974 or 1977. In the TZ such high quality trout numbered 19/mile in 1974 (before development) and 67/mile in 1977, a 253% gain after development. Estimates for both years were made at the end of the fishing season.
SOURCE DOCUMENT Hauber, A., Wis. Dep. Nat. Resour., pers. comm. toR. Hunt, 8 September 1978.
TABLE 45. Abundance of wild brook trout and wild brown trout in the reference zone and treatment zone on the Plover River in October before (1971,.) and after ( 1977) habitat development.
Reference Zone Treatment Zone Population Trout Predev. Postdev. % Predev. Postdev. % Characteristic S~ies Value Value Change Value Value Change No./mile Brook 1,069 1,046 -2 535 495 -7
~6 inches Brown 207 315 +52 178 563 +216 Combined 1,276 1,361 +7 713 1,058 +48
No./mile Brook 185 154 -17 57 130 +128 ~8 inches Brown 92 154 +67 127 381 +200
Combined 277 308 +11 184 511 +178
No.jmile Brown 0 0 0 19 67 +253 ~14 inches
53

54
PRAffiiE RIVER-SECTION 35 Lincoln County
Wild Brook Trout and Wild Brown Trout
DESCRIPTION OF STREAM: 30.9 miles total length, 30.9 miles trout water, 64 ft average width, 77 ppm total alkalinity
TYPE OF DEVELOPMENT/ENHANCEMENT: Skyhook bank covers, current deflectors, and boulder retards
STUDY PERIOD AND DESIGN: One 0.33-mile TZ and one adjacent upstream 0.19-mile RZ. One predevelopment inventory of trout in the study zones was made in June 1982. Habitat development followed in August 1982, and one postdevelopment inventory of standing stocks was made in June 1985. Population estimations included trout over 4 inches (age I+), but only data for trout 6 inches or larger are reported in the source document. Physical changes are not reported. Another assessment, 5 years after development, was carried out in 1987, but summary data were not available in time to include in this case history.
PRINCIPAL INVESTIGATOR: Alan Hauber
SUMMARY OF FINDINGS: Postdevelopment abundance and biomass of legal-sized brook trout declined in both study zones from predevelopment levels (Table 46). The RZ held proportionately more brook trout/mile and biomass/mile than the TZ did in 1982 and 1985 although differences between zones were less in 1985 (Fig. 32).
The standing stock of brown trout in the RZ in 1985 was also less than in 1982, and biomass declined, too (Table 46). In the TZ, however, brown trout increased in number and weight after development. Abundance of legal-sized brown trout increased 4%, the number 10 inches or larger increased 73%, the number 14 inches or larger increased 220%, and biomass was up 53%.
Relative densities and biomass of brown trout in the 2 study zones shifted markedly from 1982 to 1985 as a result of declines in the RZ and increases in the TZ (Fig. 33). The TZ held 12% fewer legal-sized brown trout/mile than the RZ in 1982. In 1985 relative abundance was 25% greater in the TZ. The TZ held 8% fewer brown trout/mile 10 inches or larger than the RZ in 1982, but in 1985 there were 459% more brown trout/mile of this size in the TZ than in the RZ.
Biomass of brown trout was about the same in the 2 study zones in 1982 (163 lbs/mile). By 1985 biomass had declined to 70 lbs/mile in the RZ. In the TZ, however, 3 years after completion of the habitat development project biomass of brown trout had increased to 250 lbsjmile, a value 257% greater than the contemporary biomass in the RZ.
SOURCE DOCUMENT Hauber, A. B., Wis. Dep. Nat. Resour., intradep. memo. to M. 0. Johnson, October 1985.
TABLE 46. Abundance and biomass of wild brook trout and wild brown trout in the reference zone and section 35 treatment zone on the Prairie River before (June 1982) and after (June 1985) habitat development.
Trout Population Study Predev. Postdev. % S2ecies Characteristic Zone Value Brook No.jmile ;;,6 inches RZ 1,310
TZ 971
No.jmile ;;, 10 inches RZ 10 TZ 6
Lbsjmile* RZ 160 TZ 117
Brown No./mile ;;,6 inches RZ 824 TZ 728
No./mile ;;, 10 inches RZ 131 TZ 120
No.jmile ;;, 14 inches RZ 5 TZ 15
Lbs/mile* RZ 163 TZ 163
Combined No./mile ;;,6 inches RZ 2,134 TZ 1,699
No.jmile ;;, 10 inches RZ 141 TZ 126
Lbs/mile* RZ 323 TZ 280
* Lbs/mile includes only trout ;;, 6 inches.
1,400
1,200 w z ::J
~ 1,000 w _j
:E 800 ;:::
::0 0 oc r-
" 0 600
0 oc (IJ
400
200
D REFERENCE ZONE
LJ TREATMENT ZONE
Value 846 671
5 3
106 96
606 760
37 207
0 48
70 250
1,452 1,431
42 210
176 346
No /MILE ~61NCHES
No./MILE ~IOINCHES
LBS/MILE
Change -35 -31
-50 -50
-34 -18
-26 +4
-72 +73
-100 +220
-57 +53
-32 -16
-70 +67
-46 +24
150 ~ ::; ;:::
100 6 oc ,...
"' 50 8 a: (IJ
(f)
"' _j
FIGURE 32. Abundance and biomass of wild brook trout in the reference zone and treatment zone on the Prairie River in June before ( 1982) and after ( 1985) habitat development.

1,000 w z ~ ~ 800
w _J
:E f:: 600 :::> 0 0:: >--z 3:
400 0 0:: (D
200
-12"
~ +25"
PRE POST DEVELOPMENT
No./MILE ~GINCHES
D REFERENCE ZONE
~~TREATMENT ZONE
0" 1\
+257"
No./MILE 2:10 INCHES
LBS/MILE
w z :::>
250 ~ (f) w :r:
200 ~ U>
" 150 'j ~ ' >--:::>
100 ~ tz 3:
50~ (D
(f) (D _J
FIGURE 33. Abundance and biomass of wild brown trout in the reference zone and treatment zone on the Prairie River .n June before ( 1982) and after ( 1985) habitat development.
55

56
PRAIRIE RIVER-TRANTOW STATION Lincoln County
Wild Brook Trout and Wild Brown Trout
DESCRIPTION OF STREAM: 30.9 miles total length, 30.9 miles trout water, 64 ft average width, 77 ppm total alkalinity
TYPE OF DEVELOPMENT/ENHANCEMENT: Skyhook bank covers, current deflectors, and boulder retards
STUDY PERIOD AND DESIGN: One 0.34-mile TZ and one 0.26-mile RZ located about 0.5 mile above the TZ. Trout in the study zones were censused in June 1978, prior to initiation of habitat development, and again in July 1981 and July 1983. Data in the source document refer to trout 6 inches or larger. No changes in physical features of the study zones are reported.
PRINCIPAL INVESTIGATOR: Alan Hauber
SUMMARY OF FINDINGS: Brook trout 6 inches or larger declined in the TZ by an average 40% and increased in the RZ by an average 81% from 1978 to 1981-83 (Table 47). Legal-sized brown trout increased on average in both study zones during the study period-up 138% in the RZ and up 426% in the TZ.
Brook trout 10 inches or larger increased proportionately more in the RZ than in the TZ, while the opposite response occurred for brown trout in this size category.
In the size grouping of brown trout 14 inches or larger, there was a stupendous increase in the TZ after development-from only 3/mile to 96/mile.
Prior to development the TZ contained a biomass of 116 lbs/mile (both species combined), about 32% less biomass than in the RZ. After development the TZ held 322lbs/mile, 3% more lbs/mile than the RZ, despite a substantial increase in biomass in the RZ from 1978 to 1981-83.
SOURCE DOCUMENT Hauber, A. B., Wis. Dep. Nat. Resour., pers. comm. toR. L. Hunt, 10 October 1985.
TABLE 47. Abundance and biomass of wild brook trout and wild brown trout in the reference zone and Trantow station treatment zone on the Prairie River before (June 1978) and after (July 1981, 1983) habitat development.
Trout Population Study Predev. Postdev. % S~ecies Characteristic Zone Value Avg. Change Brook No.fmile ~6 inches RZ 660 1,194 +81
TZ 542 327 -40
N o./mile ~ 10 inches RZ 0 29 +2,900 TZ 12 6 -50
Lbs/mile* RZ 94 162 +72 TZ 75 44 -41
Brown No./mile ~6 inches RZ 230 547 +138 TZ 93 489 +426
No./mile ~10 inches RZ 59 105 +78 TZ 38 260 +584
No./mile ~ 14 inches RZ 12 37 +208 TZ 3 96 +3,100
Lbs/mile* RZ 76 150 +97 TZ 41 278 +578
Combined No./mile ~6 inches RZ 890 1,741 +96 TZ 635 816 +29
No./mile ~ 10 inches RZ 59 134 +127 TZ 50 266 +432
Lbs/mile* RZ 170 312 +84 TZ 116 322 +178
* Lbs/mile includes only trout ~ 6 inches.

RADLEY CREEK Waupaca County
Wild Brown Trout
DESCRIPTION OF STREAM: 6.8 miles total length, 6.8 miles trout water, 14 ft average width, 145 ppm total alkalinity
TYPE OF DEVELOPMENT/ENHANCEMENT: Stream bank debrushing, brush bundles, and half-logs
STUDY PERIOD AND DESIGN: Two adjacent TZs (numbered TZ 2 and TZ 3) established in 1979, each 0.36 mile long. One adjacent upstream 0.11-mile RZ (numbered RZ 1) established the same year. Half-logs (175/mile) were installed in TZ 2 in April1981. Stream banks were debrushed and brush bundles (94/mile) were installed in April-May 1981 in TZ 2 and TZ 3. This stream was one of 2 (see Parker Creek case history) chosen to test the hypothesis that addition of half-log structures just prior to stream bank de brushing (with some of the cut material used to construct brush bundles) would benefit the trout population more than stream bank debrushing and additions of brush bundles alone (no half-logs).
Predevelopment physical data characterizing the 3 study zones were collected in October 1979. Comparative postdevelopment data were obtained in October 1984. Standing stocks were censused in the study zones each April of 1979-81, the predevelopment phase, and each April of 1983-85, the postdevelopment phase. Censuses included age I+ trout. Water temperatures were monitored year-round during 1979-85 at 2 sites.
PRINCIPAL INVESTIGATOR: Robert Hunt
SUMMARY OF FINDINGS: From 1979 to 1984 physical quality of the trout habitat in the RZ generally deteriorated. Stream width increased, average depth decreased, water volume decreased, and underbank hiding/resting cover for trout decreased. Positive changes included slight increases in gravel substrate and aquatic macrophytes (Table 48).
In both' TZs all physical features quantified in 1979 and 1984 changed in ways that should have bolstered trout carrying capacity, except for a 16% decrease in the area of gravel substrate in TZ 2. The most dramatic changes occurred in the abundance of aquatic vegetation, which increased in area more than 2,000% in TZ 2 and more than 3,000% in TZ 3. During the predevelopment survey, aquatic plants covered only 1% of the total substrate in each TZ. At the time of the postdevelopment survey, aquatic macrophytes covered 19% of the substrate in TZ 2 and 35% of the substrate in TZ 3.
Annual postdevelopment water temperature regimes in TZ 2 and TZ 3 did not change much from annual predevelopment patterns, except for a 3-4 F increase in the maximum summer water temperature at the lower boundary of TZ 3 the first summer after ramoval of stream bank woody vegetation. Maximum water temperature that summer (1981) reached 66 F, well within the tolerable range for brown trout.
Average postdevelopment indices of abundance and biomass of brown trout in the TZs significantly improved compared with predevelopment average values, while abundance and biomass of brown trout in the RZ generally declined (Table 49). The average number of trout present in
RZ 1 declined by 5% from 1979-81 to 1983-85. In TZ 2 there was an average increase of 28%, and in TZ 3 the increase was 37%. Average biomass declined by 5% in RZ 1, but a 35% average increase was registered in TZ 2 and a 50% average increase was observed in TZ 3 after development.
Legal-sized brown trout and quality-sized (10 inches or larger) brown trout also showed substantial gains in both TZs after development (Fig. 34).
Trout carrying capacity of both TZs clearly benefitted from the 1981 habitat development. But there was no evidence-based on changes in standing stocks each Aprilthat trout carrying capacity improved more in TZ 2 (where both half-logs and brush bundles were installed) than in TZ
, 3 (where no half-logs were installed). The half-logs placed in TZ 2 functioned effectively during
the postdevelopment period. Twenty-three of 62 installed were judged to be 100% functional after 4 years. Average usefulness in providing shelter for trout was approximately 77% of the maximum potential capacity.
SOURCE DOCUMENT Hunt, R.L.
1986. An evaluation of brush bundles and half-logs to enhance carrying capacity of two brown trout streams. pp. 31-62 in J. G. Miller, J. A. Arway, and R. F. Carline, eds. Fifth trout stream habitat improvement workshop. Penn. Fish Comm., Harrisburg. 265 pp.
TABLE 48. Percentage changes in several characteristics of the reference zone and 2 treatment zones on Radley Creek before ( 1979) and after ( 1984) habitat development.
Zone Characteristic Surface area Average depth Average thalweg depth Average width Water volume Gravel substrate Underbank cover Area of aquatic vegetation
% Change After Habitat Development
RZ 1 TZ 2 TZ3 +7 -7 -3 +4 -4 +8
-12 +28
-4 +19 +19 -7
+11 -16 +26
+2,343
-5 +30 +22 -6
+21 +387 +41
+3,383
Continued em next page 57

58
Radley Creek. Continued
TABLE 49. Number and biomass of wild brown trout in the reference zone and 2 treatment zones on Radley Creek in April before ( 1979-81) and after (1983-85) habitat development.
Population Study Predev. Postdev. % Characteristic Zone Avg. Avg. Change Total no.jmile RZ 1 1,372 1,310 -5
TZ2 2,702 3,462 +28* TZ3 2,294 3,147 +37*
No.jmile :;,6 inches RZ 1 483 506 +5 TZ2 618 903 +46* TZ3 538 822 +53*
No.jmile :;, 10 inches RZ 1 67 53 -21 TZ2 41 58 +41 TZ3 36 51 +42
Total lbs/mile RZ 1 128 121 -5 TZ2 168 227 +35* TZ3 143 214 +50*
* The percentage change for the TZ is significantly different at the P < 0.05 level from the percentage change for the RZ.
PERCENTAGE CHANGE (POSTDEVELOPMENT AVG.) PREDEVELOPMENT AVG.
-40 -20 0 +20 +40 +50
TOTAL No./MILE
D Reference Zone I
f23 Treatment Zone 2
[[] Treatme-rt Zone 3
No./ MILE ~6 INCHES
TOTAL LBS/MILE
FIGURE 34. Percentage change in average abundance and biomass of wild brown trout present in reference zone 1, treatment zone 2, and treatment zone 3 on Radley Creek before (April1979-81) and after (April1983-85) habitat development.

ROSENOW CREEK Waukesha County
Wild Brook Trout and Wild Brown Trout
DESCRIPTION OF STREAM: 3.6 miles total length, 3.6 miles trout water, 4ft average width, 5 ft/mile average gradient, 279 ppm total alkalinity
TYPE OF DEVELOPMENT/ENHANCEMENT: Stream bank debrushing, brush bundles, half-logs, bank covers, and current deflectors
STUDY PERIOD AND DESIGN: One 0.35-mile TZ. No RZ. Trout in the TZ were inventoried in Aprill981. Habitat development was carried out during 1983. Standing stocks of trout were censused again in April of 1984 and 1985.
PRINCIPAL INVESTIGATOR: Randy Schumacher
SUMMARY OF FINDINGS: The TZ held only 14 brook trout/mile and 360 brown trout/mile in April 1981 (Table 50). Average postdevelopment densities of these species increased to 71 brook trout/mile (407% increase) and 762 brown trout/mile (112% increase). Postdevelopment abundance of brook trout declined from 91/mile in 1984 to 51/mile in 1985 (Fig. 35). Total number of brown trout increased from 360/mile in 1981 to 494/mile in 1984 and 1,024/mile in 1985.
Legal-sized brown trout ( 6 inches or larger) numbered 282/mile in 1981, 414/mile (47% increase) in 1984, and 600/ mile (an additionall13% increase) in Aprill985 (Fig. 35).
Average biomass of brook trout improved by 386% after development (Table 50). Average biomass of brown trout improved by 97% after development.
SOURCE DOCUMENTS Schumacher, E. R., Wis. Dep. Nat. Resour, intradep. memo. to the District Director, 3 June 1981. Schumacher, E. R., Wis. Dep. Nat. Resour, intradep. memo. to J. L. McNelly, 30 January and 12 July 1985.
~-~ ~~~- -~ ---------
TABLE 50. Abundance and biomass of wiut brook trout and wild brown trout in the treatment zone on Rosenow Creek in April before ( 1981) and after ( 1984-85) habitat development.
Population Characteristic Total no.jmile
No./mile :;;,6 inches
Totallbs/mile
*No estimate.
1,200
1,000
..J 0: Q.
< 800 ~ "-! ..J :ii ...... 600 1-::> 0 a: 1-
400
200
• 0
Trout Predev. Postdev. S2ecies Value Avg.
Brook 14 71 Brown 360 762 Combined 374 833
Brook * 67 Brown 282 507 Combined 282 574
Brook 7 34 Brown 94 185 Combined 101 219
•+112%
£t::: O•SO% TROUT ~6/NCHES
BROOK TROUT --- 6+407%
1981 1984 1985 1984-85 AI/G. PREDEVELOPMENT I POSTDEVELOPMENT
% Change +407 +112 +123
+80 +104
+386 +97
+117
FIGURE 35. Abundance of wiut brook trout and wild brown trout in the treatment zone on Rosenow Creek in April before ( 1981) and after ( 1984-85) habitat development. Percentage change from predevelopment is indicated next to the postdevelopment average.
59

60
ROWAN CREEK Columbia County
Wild Brown Trout
DESCRIPTION OF STREAM: 10.6 miles total length, 10.6 miles trout water, 10 ft average width, 12 ft/mile average gradient, 260 ppm total alkalinity
TYPE OF DEVELOPMENT/ENHANCEMENT: Stream bank sloping, bank covers, and current deflectors
STUDY PERIOD AND DESIGN: One 1.33-mile TZ and one 0.19-mile RZ just upstream from the TZ. Trout population estimates were made once (1975) prior to development and for 7 years (1978-84) after development. Estimates were made in September or October. Habitat development was initiated in 1976 and continued each year through 1983. Trout population data from 1984 represent the only "clean" postdevelopment year of census for the entire TZ. A partial season-long creel census of trout anglers was conducted during 1979. It is one of the few censuses on Wisconsin trout streams that includes angler use and harvest data on portions of stream that have received habitat development and portions that have not. Data were collected from station 2 (0.38 mile long) and station 3 (1.14 miles long). Station 3 was part of the TZ but development within station 3 itself was not initiated until after 1979. Station 2, also a part of the TZ, received habitat development prior to 1979.
PRINCIPAL INVESTIGATOR: Tim Larson
SUMMARY OF FINDINGS: During the 8 years of habitat development, abundance and biomass of brown trout fluctuated greatly in both the TZ and RZ. Year-to-year changes in relative biomass were different in the 2 zones during 1978-80 but very similar during 1981-84 (Fig. 36). Abundance of age 0 brown trout tended to fluctuate widely in both zones from fall to fall and generally in synchrony from year to year (Fig. 37). Brown trout of "quality size" (10 inches or larger) also varied greatly in abundance from year to year in both study zones, and variations were similar in the 2 zones (Fig. 38).
Presence or absence of strong year classes of age 0 brown trout strongly influenced trend lines for abundance of trout of all sizes in each zone (Fig. 39). Abundance of legal-sized trout in the TZ was also influenced strongly by abundance of age 0 trout the previous fall. Such a relationship was much less apparent for the RZ (Fig. 37, 40).
In both study zones, standing stocks of brown trout improved on the average for the 1978-84 period compared with the 1975 predevelopment standing stock in each zone. However, percentage improvements in 5 population parameters were always greater in the RZ than in the TZ (Fig. 41). For example, the average biomass present in the TZ during 1978-84 exceeded the biomass present in the fall of 1975 by 66%. However, in the RZ there was a 191% improvement for the same time periods.
This long-term assessment of standing stocks of trout in a TZ and RZ highlights the difficulties of evaluating impacts of habitat development vs. natural fluctuations in wild trout populations. In addition, interpretation was complicated by high angler exploitation.
During the 1979 trout fishing season, "developed" station 2 received 181% greater angler use than "undeveloped" station 3 (955 hours/mile vs. 340 hours/mile), and harvest was 476% greater in station 2 (570 trout/mile vs. 99 trout/mile)
(Append. Table 2). Catch rate for trout creeled was 100% greater in developed station 2 than in undeveloped station 3 (0.60 trout/hour vs. 0.29 trout/hour).
Harvest data such as these, if typical for the Rowan Creek fishery during 1978-84, necessitate a different judgment and perspective on the merits of habitat management efforts in the TZ. If harvest had been nearly equal in developed vs. undeveloped reaches of the combined study zones, 200-300 more legal-sized trout/mile would have been present in the developed zone when fall population inventories were made. These additional trout would be more than enough to shift proportional increases in abundance and biomass in favor of the TZ rather than the RZ in some of the long-term trends illustrated in Figures 36-41.
SOURCE DOCUMENTS Larson, T.
1982. Characteristics of the sport fishery of Rowan Creek and the impact of fishing on the wild brown trout population. Wis. Dep. Nat. Resour. Fish Manage. Rep. No. 112. 15 pp.
Larson, T., Wis. Dep. Nat. Resour., intradep. memo. to waters file, 29 January 1982 and 4 January 1985.
400
300
200
100
• 0
._._ TREATMENT ZONE 0.·•·0 REFERENCE ZONE
o------·-0.-------o''"'
/ /
•'
!976 j.I•------"H~AB"_!'ITA~T~DE~VEO!!LOP=MEO"'.NT'._!P~ER~IO'!!._D -----...J
1975 1978 1979 1980 1981 1982 1983
e+/91%
0+66%
1984 1978-84 AVG.
PREDEVELOPMENTI POSTDEVELOPMENT-----
FIGURE 36. Biomass of wild brown trout in the reference zone and treatment zone on Rowan Creek in SeptemberOctober before (1975 ), during ( 1978-83 ), and after ( 1984) habitat development. Percentage change from predevelopment is indicated next to the postdevelopment average.

<r 3,000 -TREATMENT ZONE <>----o REFERENCE ZONE ~
g
~ 2,500
~
''/\ .. /p " ~ 2,000 UJ
~ w _J
:E 1,500 ;:,
'''/ ~
z 1,000 ! \ : ~~ I
0
~ 500
• 0
ffi II> 0
19761• HABITAT DEVELOPMENT PERIOD
1975 1978 1979 1980 1981 1982 1983 1984 1978-84 AVG.
PREDEVEI..CPMENT POSTDEVELOPMENT·-----,..J
FIGURE 37. Abundance of age 0 wild brown trout in the reference zone and treatment zone on Rowan Creek in September-October before (1975), during (1978-83), and after ( 198.1,.) habitat development. Percentage change from predevelopment is indicated next to the postdevelopment average.
~300 ~
.._......TREATMENT ZONE
<>·•-<> REFERENCE ZONE
iii li: w UJ
~ UJ
'1!200 ·~63%
o.-208% ~ 0
" w _J
:E ;:, •
' '
I ~100 tz
/ -~
~ iB
<>-.............. -o., ... "'
0
19761-1 ·~---"":::ABI::..:l',~T_,O€VE=LDPME=o=N,_,T_.::PERI=OO,_ __ -t, I
1975 1978 1979 1980 1981 1982 1983 1984 1978-84 f!WG.
PREDEVELDPMENTI+-----POSTDEVELOI'MENT-----1
FIGURE 38. Abundance of wild brown trout ~ 10 inches in the reference zone and treatment zone on Rowan Creek in September-October before (1975), during (1978--83), and after {198.1,.) habitat development. Percentage change from predevelopment is indicated next to the postdevelopment average.
<r w II>
-TREATMENT ZONE <>··-<> REFERENCE ZONE
g 3,000 P. u ? <r
"' II>
" "' t-o..
"' UJ
'. '. ' . ' . i \ p
': \, /
:;!;·2,000 '~~:'/ I \_ ..... ·~-0+/93"
"' _J
:i! ;::: ::> 0
f" z
' ' ' ' ------d ~ 1,000 • <r ID
0
1975 1978 1979 1980 1981 1982 1983 1984 1978-84 IlliG.
PREDEVELOPMENTfr-oo>------POSTDEVELOPMENT------J
FIGURE 39. Abundance of wild brown trout in the reference zone and treatment zone on Rowan Creek in SeptemberOctober before {1975), during {1978-83), and after (198.1,.) habitat development. Percentage change from predevelopment is indicated next to the postdevelopment average.
ffi 1,500 -TREATMENT ZONE <>··-<> REFERENCE ZONE ~
<r
"' II>
" ~ f!j 1,000
P. UJ
~ UJ
"' J: u ~
"' AI
"' _J
:E ;:, ::> 0 <r t-z ~
ril Ill
500
•
o·······"r······"'·----··
'. ' . ' . ' . // \\ ' . ' .
/ \
.o-------·"/ \
l~'761-'l ___ _,HA,B"-'rt"'~T'-'D""EV"-"E""LO"-PM""EN"'-T'-'PE""-"RIOD""-----1
e+//3%
o+/16%
1975 1978 1979 1980 1981 1982 1983 1984 1978-84 f!WG
PREDEVELOPMENTf-------POSTDEVELOPMENT·-----1
FIGURE 40. Abundance of wild brown trout ~6 inches in the reference zone and treatment zone on Rowan Creek in September-October before (1975), during {1978--83), and after ( 198.1,.) habitat development. Percentage change from predevelopment is indicated next to the postdevelopment average.
61
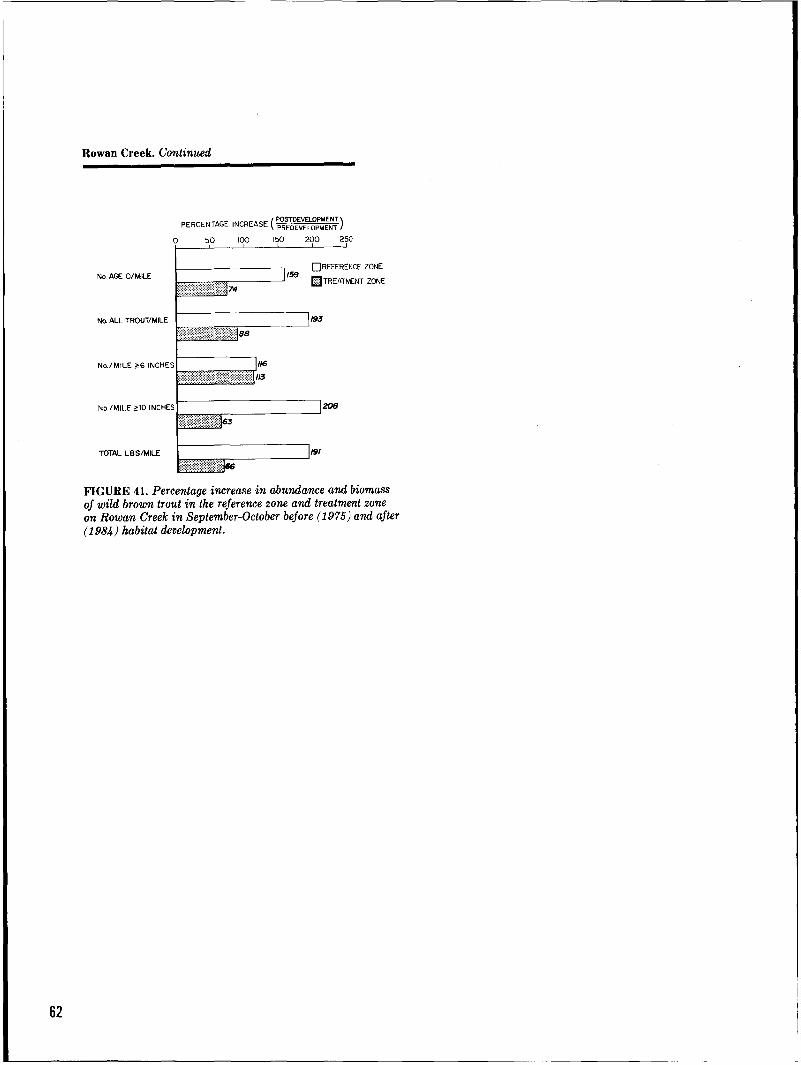
62
Rowan Creek. Continued
TOTAL LBS/MILE
0 REFERENCE ZONE
lii!JTREATrvENT ZONE
FIGURE 41. Percentage increase in abundance and biomass of wild brown trout in the reference zone and treatment zone on Rowan Creek in September-October before (1975) and after (1984) habitat development.

SOUTH FORK MAIN CREEK Rusk County
Wild Brook Trout
DESCRIPTION OF STREAM: 16.4 miles total length, 6.5 miles trout water, 20 ft average width, 11 ft/mile average gradient, 102 ppm total alkalinity
TYPE OF DEVELOPMENT/ENHANCEMENT: Fencing, cattle and machinery crossings, bank covers, current deflectors, half-logs, and stream bank debrushing
STUDY PERIOD AND DESIGN: One 3.1-mile TZ (stations 2 and 3) and one 2.9-mile RZ (stations 1 and 4). Habitat development in the TZ was concentrated in 2 periods, 1966-67 and 1979-81. Some rebuilding of bank covers, current deflectors, and fences was done during 1979-81 along with new development to add more fencing, half-logs, and debrushing.
Single-run electrofishing surveys of trout populations in the study zones were conducted during 1961-62, 1966-68, 1976, and 1978. In August 1982 mark-recapture population estimates were made. A partial season-long creel census was also carried out during 1982.
No trout population data providing predevelopment vs. postdevelopment comparisons are cited in the source document. Comparisons are made between the TZ and RZ in the source document and in the summary of findings presented below.
PRINCIPAL INVESTIGATOR: Frank Pratt
SUMMARY OF FINDINGS: Anglers overwhelmingly preferred to fish in the TZ by a ratio of 7 trips/mile in the TZ to every trip/mile in the RZ (Append. Table 2). Harvest of brook trout was 79% greater in the TZ and catch/hour for trout creeled was 13 times greater than in the RZ (Fig. 42).
The biomass of brook trout removed from the TZ during the 1982 fishing season was 77% greater than the midseason biomass of legal-sized brook trout in this zone (260 lbsjmile vs. 147lbsjmile). Biomass harvested from the RZ was equivalent to one-third of the midseason biomass of legal-sized trout present (30 lbsjmile vs. 90 lbsjmile).
Despite the massive differences in the number and pounds of trout harvested from the 2 study zones, the TZ held 48% more legal-sized brook trout/mile than did the RZ (867/mile vs. 585/mile) and 144% more brook trout/mile 10 inches or larger (22/mile vs. 9/mile) in August 1982 (Table 51).
Relative abundance of all sizes of brook trout in the TZ, including age 0, was 250% greater than in the RZ in August 1982 (Table 51). Density of age 0 trout observed in station 3 of the TZ is one of the highest known for wild age 0 trout in a Wisconsin stream at midsummer or fall (4,700/acre).
SOURCE DOCUMENT Gottwald, P. J., Wis. Dep. Nat. Resour., intradep. memo. to D. A. Jacobson, 30 June 1983.
'"' 0
~ [I)
0 z <{
UJ ....J 5E ' (f)
0:: ::> 0 :r: 0:: UJ ....J <.9 z <{
+643%
ANGLER HOJRS
D REFERENCE ZONE
[±j TREATMENT ZONE
+1240%
TROUT CREELED
HARVEST/ HOUR
1.2
0:: ::> 0 :r: ;:::: (f) UJ > 0:: <{ :r: 0:: UJ ....J <.9 z <{
FIGURE 42. Angler use, harvest, and harvest rate in the reference zone and treatment zone on South Fork Main Creek during the 1982 trout fishing season.
TABLE 51. Abundance and biomass of wild brook trout in the reference zone and treatment zone on South Fork Main Creek in August 1982.
Population Characteristic No./mile age 0 No.jmile age I Total no.jmile No.jmile ;:,6 inches No.fmile ;:,10 inches Lbs/mile*
Reference Zone 3,865
704 4,569
585 9
90
Treatment Zone
14,807 1,165
15,972 867
22 147
* Lbsfmile includes only trout ;;:, 6 inches.
% Difference (TZ/RZ)
+283 +65
+250 +48
+144 +63
63

64
SPRING CREEK Chippewa County
Wild Brook Trout
DESCRIPTION OF STREAM: 4.6 miles total length, 2.3 miles trout water, 5 ft average width, 33 ft/mile average gradient, 55 ppm total alkalinity
TYPE OF DEVELOPMENT/ENHANCEMENT: Stream bank debrushing
STUDY PERIOD AND DESIGN: One 0.34-mile TZ and one 0.55-mile RZ immediately below the TZ. The study period on this stream covered a 3-year predevelopment phase (1971-73) and a 4-year postdevelopment phase (1974-77). Brook trout in the study zones were censused each April and October. Water temperatures were monitored during AprilSeptember at the boundaries of the TZ during 1972, 1973, 1976, and 1977. Midchannellength, average width, average depth, channel volume, and surface area were quantified before (June 1972) and after (October 1976) stream banks were debrushed during April-May 1973.
This study was part of a larger investigation evaluating stream bank debrushing on 3 streams: Lunch Creek, Little Plover River, and Spring Creek.
PRINCIPAL INVESTIGATOR: Robert Hunt
SUMMARY OF FINDINGS: Postdevelopment morphometry changes in the TZ included increased average depth (74%), increased water volume (86%), increased average width (4%), and greatly increased abundance of rooted aquatic vegetation. Maximum summer water temperatures in the TZ were not detectably increased after removal of stream bank vegetation. Maximum temperatures at the lower boundary of the TZ were 2 F higher than at the upper boundary during the predevelopment and postdevelopment years of monitoring.
Gross changes in the standing stock of brook trout in the TZ after development were all positive, whereas the same characteristics of the standing stock showed negative changes in the RZ from 1971-73 to 1974-77 (Table 52). Average abundance of legal-sized brook trout in April increased by 26% in the TZ and decreased by 17% in the RZ ..
Before habitat development the TZ had an average of 1% fewer legal-sized trout/mile in October than the RZ (Fig. 43). During the 3 years following development, the TZ held an average of 98% more legal-sized trout/mile in October than the RZ.
Average growth of age 0 and age I stocks also improved in the TZ during each April-October period of the postdevelopment phase despite increased densities of trout present. Average length of age 0 stocks was 4% greater in the TZ than in the RZ after development, whereas the RZ held a 3% advantage prior to development. For age I stocks the change was from 5% better growth in the RZ before development to 21% better growth in the TZ after development.
SOURCE DOCUMENT
Hunt, R. L. 1979. Removal of woody streambank vegetation to im
prove trout habitat. Wis. Dep. Nat. Resour. Tech. Bull. No. 115. 36 pp.
TABLE 52. Average number and biomass of wild brook trout in the treatment zone and reference zone on Spring Creek in April and October before ( 1971-73) and after ( 197 4-77) habitat development.
Population Study Predev. Postdev. % Characteristic Month Zone Avg. Avg. Change Total no.jmile Apr TZ 2,335 2,818
RZ 1,834 1,521
Oct TZ 3,051 4,105 RZ 2,531 2,020
No.jmile Apr TZ 813 1,023 ~6 inches RZ 725 603
Oct TZ 820 1,251 RZ 824 640
Totallbsjmile Apr TZ 162 194 RZ 143 115
Oct TZ 168 258 RZ 170 130
300 D REFERENCE ZONE
• TREATMENT ZONE
+98%
BEFORE AFTER
+21 -17
+35 -20
+26 -17
+53 -22
+20 -20
+54 -24
Probability of Significant
Change Favoring TZ
p < 0.20
p < 0.05
p < 0.05
p < 0.05
p < 0.10
p < 0.05
FIGURE 43. Average number of legal-sized wild brook trout (;:, 6 inches) per mile present in October in the treatment zone and reference zone on Spring Creek before (1971-73) and after ( 197 4-77) habitat development.

TANK CREEK Jackson County
Wild Brook Trout and Wild Brown Trout
DESCRIPTION OF STREAM: 5.0 miles total length, 5.0 miles trout water, 10.5 ft average width, 18 ftjmile average gradient, 10 ppm total alkalinity
TYPE OF DEVELOPMENT /ENHANCEMENT: Stream bank fencing, stream bank debrushing, brush bundles, halflogs, riprap, stumps, bank covers, and current deflectors
STUDY PERIOD AND DESIGN: Two TZs and one RZ established in 1977. The 0.28-mile RZ (RZ 2) was located between 0.45-mile TZ 1 and 0.34-mile TZ 3. Stream banks in both TZs were cleared of woody vegetation during 1978, and brush bundles were installed at a rate of 381/mile. Three years later bank covers, current deflectors, and riprap were added to TZ 1, and TZ 3 received additions of half-logs, stumps, riprap, bank covers, and current deflectors.
Predevelopment data on stream morphometry and standing stocks of trout ht the study zones were collected in 1977. Comparable postdevelopment data were collected in 1980 and for 3 successive years, 1983-85. In the summary below I have not included data for 1980, when habitat development was in progress.
PRINCIPAL INVESTIGATORS: James Talley and Timothy Babros
SUMMARY OF FINDINGS: Both TZs decreased in average width and surface area and increased in average depth from 1977 to 1985, changes which should have benefitted trout carrying capacity. Concurrently, the RZ increased in average width, surface area, and average depth (Table 53) and remained difficult to fish because of dense growth of woody stream bank vegetation.
Wild brook trout accounted for at least 96%, 97%, and 93% of the trout present in TZ 1, RZ 2, and TZ 3, respectively, during 1983-85. By weight, brook trout accounted for at least 71%, 82%, and 66% of the total biomass of trout in the study zones each April of 1983-85. There was no evidence that dominance of brook trout in the study zones declined in favor of brown trout as a result of changes in the TZs after habitat development. In April1985 brown trout accounted for a relatively high proportion of the total biomass in TZ 3, but this was primarily due to the contribution of 2large individuals of this species.
Standing stocks of trout in the TZs and in the RZ declined in quantity and quality during the 1983-85 period compared with 1977 (Table 54). The decline in number of trout/mile (both species combined) was greatest in TZ 3 (58%) and least in TZ 1 (38% ). Legal-sized trout declined an average of 48% in TZ 1, an average of 25% in RZ 2, and an average of 42% in TZ 3.
Increased angler use and harvest were suspected but not quantified in the TZs after fishing conditions were improved by removing woody stream bank vegetation.
SOURCE DOCUMENT Babros, T. E., Wis. Dep. Nat. Resour., intradep. memo. to. R. L. Hunt, 9 January 1986.
TABLE 53. Physical dimensions of 2 treatment zones and a reference zone on Tank Creek before (1977) and after ( 1983-85) habitat improvement.
Study Predev. Postdev. % Zone Characteristic Zone Value Avg. Change Average width (ft) TZ 1 13.7 9.8 -28
RZ2 12.9 13.9 +8 TZ3 13.3 11.4 -14
Average depth (inches) TZ 1 6.2 13.2 +113 RZ2 7.6 9.4 +24 TZ3 9.2 10.7 +16
Surface area (acres) TZ 1 0.38 0.26 -32 RZ2 0.44 0.48 +9 TZ3 0.54 0.47 -13
TABLE 54. Number and biomass of trout in April in 2 treat-ment zones and a reference zone on Tank Creek before (1977) and after ( 1983-85) habitat development.*
Population Study Predev. Postdev. % Characteristic Zone Value Avg. Change Total no./mile TZ 1 1,109 692 -38
RZ2 2,384 1,383 -42 TZ3 2,973 1,248 -58
No.jmile ;;;.6 inches TZ 1 467 241 -48 RZ2 686 515 -25 TZ3 481 279 -42
Totallbs/mile TZ1 123 52 -58 RZ2 181 77 -57 TZ3 148 73 -51
* Data for brook trout and brown trout combined. Brook trout predominated in all 3 study zones.
65

66
WEST BRANCH WHITE RIVER W aushara County
Wild Brown Trout
DESCRIPTION OF STREAM: 5.4 miles total length, 5.4 miles trout water, 17 ft average width, 5 ft/mile average gradient, 170 ppm total alkalinity
TYPE OF DEVELOPMENT/ENHANCEMENT: Half-logs
STUDY PERIOD AND DESIGN: One 0.45-mile TZ. No RZ. A 3-year (1971-73) predevelopment phase was followed by a 3-year (1974-76) postdevelopment phase. Half-logs were installed at a density of 315/mile in the TZ during the winter of 1973-74. About 20% of the half-logs were repositioned a few months after installation to improve their usefulness. Electrofishing operations were carried out each April and October of 1971-76.
PRINCIPAL INVESTIGATOR: Robert Hunt
SUMMARY OF FINDINGS: For April counts during the postdevelopment phase, age I+ brown trout increased an average 76%, legal-sized brown trout increased an average 194%, quality-sized brown trout (10 inches or larger) increased an average 528%, and biomass was 187% greater (Table 55).
Age 0 + brown trout present in October were 35% less abundant in the TZ after development, but legal-sized trout, quality-sized trout, and biomass in October all showed postdevelopment improvements. Brown trout 10 inches or larger appeared to benefit the most from the addition of halflogs to the TZ, and standing stocks of legal-sized and quality-sized trout present in April seemed to benefit more from this kind of habitat development than trout in these size categories present in October (Fig. 44). Half-logs may have been more useful in providing hiding/resting cover for trout through the winter, reflected by improved standing stocks in April, than during the spring and summer, reflected by less improved changes in standing stocks in October.
SOURCE DOCUMENTS Hunt, R. L.
1978. Instream enhancement of trout habitat. pp. 19-27 in K. Hashagen, ed. Proc. Nat. Symp. on Wild Trout Manage. Calif. Trout Inc., San Francisco. 69 pp.
Hunt, R. L., unpubl. data filed at Wis. Dep. Nat. Resour., Cold Water Group waters file.
TABLE 55. Average number and average biomass of wild brown trout in the t reatment zone on the West Branch White River in April and October before ( 1971-73) and after (1974-76) installat ion of half-logs.
Population Predev. Postdev. % Characteristic Avg. Avg. Change Total no.jmile
Apr 1,264 2,229 +76 Oct 5,451 3,560 -35
No.jmile ;:,6 inches Apr 452 1,327 +194 Oct 553 771 +39
No./mile ;:,10 inches Apr 40 251 +528 Oct 135 304 +125
Totallbsjmile Apr 110 316 +187 Oct 239 291 +22
PERCENTAGE INCREASE c;,~i~~i~~M~~r;r !~_-) 0 100 200 300 400 500 600
TROUT ~6 INCHES l;nj 39 IN OCTOBER L.CJ
FIGURE 44. Percentage increase in the average number of legal-sized wild brown trout ( ~ 6 inches) and quality-sized brown trout (~10 inches) in the treatment zone on West Branch White River after habitat development.

WILLOW CREEK Richland County
Wild Brown Trout
DESCRIPTION OF STREAM: 18.4 miles total length, 16.9 miles trout water, 20 ft average width, 15 ftjmile average gradient, 219 ppm total alkalinity
TYPE OF DEVELOPMENT/ENHANCEMENT: Riprap
STUDY PERIOD AND DESIGN: One 1.1-mile TZ. No RZ. Approximately 0.7 mile of riprapping was carried out in the fall of 1981 to reduce erosion along 30% of the total length of both stream banks. Age I+ brown trout were censused in the TZ in July of 1979-81, prior to development, and in July of 1984-85, after development. Data presented below, taken from the source document, apply to trout 6 inches or larger in the TZ. Biomass calculations were not made. Changes in physical features of the TZ were not quantified. Trout population inventories were based on single-run electrofishing surveys.
PRINCIPAL INVESTIGATOR: Roger Kerr
SUMMARY OF FINDINGS: Predevelopment abundance of legal-sized brown trout in July increased from 294/mile in 1979 to 569/mile in 1980 and then declined to 312/mile in 1981 (Fig. 45). During the 2 years of postdevelopment monitor~ng, legal-sized brown trout numbered 503/mile in 1984 and 553/mile in 1985. Averages for the predevelopment and postdevelopment periods of observation differed by 35% in favor of the postdevelopment phase.
Brown trout 12 inches or larger increased from a predevelopment average of 28/mile to a postdevelopment average of 52/mile, representing an 86% change.
The TZ held an average of only 1 brown trout over 15 inches prior to development. The postdevelopment average was7.
SOURCE DOCUMENT Kerr, R. A., Wis. Dep. Nat. Resour., pers. comm. toR. L. Hunt, 29 November 1985.
600
100
0PREDEVELOPMENT
BljPOSTDEVELOPMENT
TROUT/MILE i?l2 INCHES
~-------o---_Lo o-L___.,
+86%
~ 1979 1980 1981 1984 1985 2:61NCH 2:121NCH
PREDEVELOPMENT POSTDEVELOPMENT IWG. AVG.
FIGURE 45. Number of wild brown troutjmile ~6 inches and ~12 inches in the treatment zone on Willow Creek before ( 1979-81) and after ( 1984-85) habitat development.
67

68
YELLOW RIVER Barron County
Wild Brook Trout and Wild Brown Trout
DESCRIPTION OF STREAM: 33.1 miles total length, 9.1 miles trout water, 27ft average width, 7ft/mile average gradient, 88 ppm total alkalinity
TYPE OF DEVELOPMENT/ENHANCEMENT: Stream bank debrushing, half-logs, bank covers, and current deflectors
STUDY PERIOD AND DESIGN: Two TZs established in 1976, 0.38-mile TZ 1 and 0.42-mile TZ 2, located about 0.4 mile downstream from TZ 1. No RZ. Habitat development in TZ 1 consisted of stream bank de brushing and addition of half-logs during the winter of 1977-78 and construction of bank covers and current deflectors during the summers of 1980-82. Half-logs were added to TZ 2 in the winter of 1977-78; bank covers and current deflectors were constructed during the summer of 1981.
Trout population estimates were made in the study zone in April and June 1977, June 1978, July 1979, and August 1981-84. Estimates included trout 4 inches or larger (age I+). Physical changes in the study zones were not determined.
PRINCIPAL INVESTIGATOR: Rick Cornelius
SUMMARY OF FINDINGS: In TZ 1 the number of age I+ brook trout (total no. trout/mile) increased during 1978-79 (after debrushing and addition of half-logs) by 19%, compared with abundance in April1977. This species continued to increase in average summer abundance after additional habitat development work in this study zone, showing a 75% increase from 1977 to 1981-84. Average abundance of legalsized brook trout also improved progressively after initiation of development. There was a 114% improvement during 1978-79 and a 172% improvement during 1981-84 (Table 56, Fig. 46).
The average number of age I + brown trout, the numerically dominant species, decreased in TZ 1 during the first postdevelopment period by 41%, from 1,466/mile in 1977 to an average of 862/mile during 1978-79. Average abundance of brown trout improved in this TZ during the second postdevelopment period to 1,207 mile, but this average density was still 18% less than the initial predevelopment density (Table 56).
In TZ 2 responses of the 2 trout species after habitat development were quite different from those observed in TZ 1. Looking at all sizes combined, brook trout declined in TZ 2 after development, while brown trout increased during the first postdevelopment period and then declined during the second postdevelopment period to a level similar to the predevelopment density in this zone (Table 56).
Legal-sized brook trout and brown trout both increased in average abundance in TZ 2 during the first postdevelopment period (Table 56, Fig. 47). Average abundance of such trout remained greater than predevelopment densities during the second postdevelopment period, too, but densities of legal-sized trout were not quite as good during 1982-83 as they were during 1978-81.
This evaluation, like most of those included in the compendium, did not include any predevelopment or postdevelopment measurements of angler use and harvest.
The principal investigator could only speculate that use and harvest greatly increased in both TZs after habitat development was initiated due to the better fishing conditions provided and the public's greater awareness of management efforts to enhance the trout fishery.
SOURCE DOCUMENT Schweiger, J. E., Wis. Dep. Nat. Resour., intradep. memo. to D. A. Jacobson, 26 November 1984.
1,600 I"' 1-a ~ 1·5 I c: .e I~ l"u
COMBINED 12 ~~~ 1,400 1:8 I §-8
I~~ l ... i 16 5! I c: • j.O..:.. I"" t;; 1 eo lal (.)
i3 1,200 I""' I I~] I ~ I"'" I I • I I LJ.J 0 z I I :;:) 1,000 I I ..., :i: I I
~ I I
BOO I
~ I a I
!?: I I
~ 600 I I I ...J I I
400 I I I I I
BROOK TROUT 200 I I I I
• I
1977 197B 1979 1981 1982 1983 1984
PREDEVELOPMENTJ • POSTDEVELOPMENT ·I FIGURE 46. Abundance of legal-sized wild brook trout ( ~6 inches) and legal-sized wild brown trout ( ~ 6 inches) in treat-ment zone 1 on the Yellow River during 1977-84.

800 I~ IB I~ li!
700
Iii 5soo :::> <( I w z :::> .., 500 ~ w ...J
~ ;::::: 400
~ .. ...J (3300 w
0
...J
200
100
• 1977 1978 1979 1981 1982 1983
PREDEVELOPMENTf-POSTDEVELOPMENT~
FIGURE 47. Abundance of legal-sized wild brook trout (~6 inches) and legal-sized wild brown trout ( ~ 6 inches) in treatment zone 2 on the Yellow River during 1977-83.
TABLE 56. Abundance and biomass of age I+ wild brook trout and wild brown trout in 2 treatment zones on the Yellow River before (1977) and after habitat development.*
%Change First Second First Second
Population Study Predev. Postdev. Postdev. Postdev. Postdev. Characteristic Zone Value Avg. Avg. Phase Phase Total no.jmile TZ1
Brook 112 133 196 +19 +75 Brown 1,466 862 1,207 -41 -18 Combined 1,578 995 1,403 -37 -11
No.(mile ~6 inches TZ1 Brook 43 92 117 +114 +172 Brown 1,057 623 1,040 -41 -2 Combined 1,110 715 1,157 -35 +5
Total no./mile TZ2 Brook 183 153 106 -16 -42 Brown 512 593 512 +16 0 Combined 695 746 618 +7 -11
No.jmile ~6 inches TZ2 Brook 43 110 92 +156 +114 Brown 295 521 479 +77 +62 Combined 338 631 571 +87 +69
• First postdevelopment period = 1978-79 for TZ 1 and 1978-81 for TZ 2. Second postdevelopment period = 1981-84 for TZ 1 and 1982-83 for TZ 2. 69

GLOSSARY OF HABITAT DEVELOPMENT TECHNIQUES---------------------Bank Cover/Current Deflector Structures
This dual-purpose structure has evolved during the past 40 years in Wisconsin to a place of backbone preeminence among the variety of techniques used to improve trout stream habitats. Several variations in construction procedures and materiais have also evolved for differing regional stream conditions, but the basic design, purpose, and pattern of installation have remained stable.
Typical construction begins by securely embedding pairs of 5-ft-long wooden pilings in the stream bottom. Pilings are most commonly "jetted" in place using a pressurized jet of water to bore a hole in the substrate for each piling.
"Stringer planks" of green-cut hardwood are then nailed underwater to each pair of pilings. These planks extend at right angles from the natural stream bank. Green hardwood planks are then nailed on top of the stringer planks and parallel with the natural stream bank to complete an underwater wooden platform. Width of the platform varies considerably, depending on the degree of stream channel narrowing that is desired. A width of 3-5 ft is common.
Next the deck is covered with stones. Larger stones are carefully placed along the outside edge to provide a solid wall. The stones, in turn, are covered with dirt and seeded or sodded to complete construction of a new stream bank. The new stream bank provides overhanging cover for trout to utilize in combination with adequate water depth. Adequate depth is assured by building the structures in pairs on opposite sides of the stream, slightly overlapping at the downstream end of one structure and the upstream end of the next structure on the opposite side of the channel. Stream flow, confined by the artificially narrowed banks, scours a pool under most of the length of each structure. Then flow is directed across channel toward the next structure in an accentuated meander pattern.
g 'j
)
'fi· .. · U>
/.:JC~: .~-· .. \. \' .ciif'. ~ · .. ··· 'ic:-:~'
,~~~\.. --~~-~ "' " -..... -~~ f/J ':rAPr
~~,){J{f ~"-,.:5':<..:::"\1fo \:(r '"7
../;:"'' ::"i, ·."• /;) r,~ c:~ . ·-:J.~I,?..._,, .p;_ ~
~--<:r:l' · :·: · · ·\\ · · Traditienal bank cover structures ~ showing placement on opposite stream
70 J banks (top view).
Two substitute processes using materials other than rock have been used to fill on top of the wooden platforms. One procedure utilizes polyethylene sandbags (16 inches x 29 inches). The sandbags are filled on-site with streambed materials and piled 2 rows deep and 2 rows high on the outside edge of the platform. The bags are then covered with dirt and seeded down or sodded over.
The second procedure involves use of 8-ft x 4-ft x 8-inch polyethylene grids consisting of a series of honeycomb cells (commercially known as geoweb). Once the grid has been anchored in place on a wooden platform, the cells are filled with streambed material. Dirt, seed, or sod completes the artificial stream bank. To prevent erosion of cell material from the underside, a synthetic mat of polypropylene ( typar) is laid on the wooden platform to provide a waterresistant seal before geoweb grids are installed.
Continu.ed on page 72

' '
; . ba s substituted for Polyethylene saruf ~f bank cover . k in constructwn filled on s~te. roc S ndbags are struc/JI,re. a
: nd mat rid ( geoweb) ~ Polyethylene ~ ed for rock tn
(typar) s~bstttuiank cover structure. constructwn of 71

72
Bank Cover/Current Deftector Structures Continued
Several variations in construction procedures have also been devised to use prefabricated wooden platforms for bank cover/current deflector structures. Platforms are constructed in a standard size, transported to the stream, and joined together in the stream at each structure site to form a new, artificial stream bank support system.
Where stream substrate has been difficult to penetrate, the problem of installing pilings has been solved by using reinforcement rods positioned through the comers of prefabricated platforms ("lunker structures"). More drastically, heavy excavation equipment is used to dig a new channel in the stream bottom. Where the latter technique is used, prefabricated platforms are partially cantilevered out over the excavated channel to create "skyhook covers." Excavated material is then used to cover the back half of each platform, providing a counterbalance weight and, when piled up high enough, a new stream bank as well. These structures, too, are finished off with dirt, seed, or sod to simulate a natural grassy bank. Large boulders are commonly placed in the excavated channels to provide midchannel resting and feeding sites.
"Lunker structure."
/ /
"Skyhook Coller."
\

Riprap
This simple and economical technique is normally used to repair and stabilize eroded stream banks. Some narrowing of the stream channel is also accomplished, and hiding cover for trout is enhanced by the interstitial spaces between rocks. The larger and more irregular in shape the rock used, the better. Quarried rock, therefore, has advantages over fieldstone.
Most riprap projects are carried out in regions of Wisconsin that have erosion problems related to agricultural land use in the watershed. In these regions, access to reaches of stream with badly eroded banks is usually good, even for heavy equipment and du~p trucks, especially after the ground has been well frozen.
Under such conditions, installation begins by using heavy equipment to slope the eroded banks to an approximate 30-45 degree profile. Truckloads of rock are then dumped down the slope to create a base extending about 5 ft out from the bank and 5 ft to the top of the bank edge. Earthen material pulled back in the sloping process is then pushed back toward the stream to partially cover the top edge of the riprap, hastening recovery of more esthetic appearances.
1--- -.:.. :-::-- -1-::--1--- I -
'~
Steps in riprap installation.
73

74
Stream Bank Debrushing and/or Brush Bundles
During the early 1970s the cutting of woody vegetation along Wisconsin trout streams was focused on small, densely shaded streams. Most commonly the "problem" vegetation was speckled alder brush (Alnus sp.). Initial removal efforts consisted of cutting nearly 100% of the woody vegetation from both stream banks along 30-ft-wide strips. Healthy, larger trees, if sparse in distribution, were bypassed. None of the cut brush was utilized to build brush bundles for in-channel placement.
Starting in the late 1970s, and as a quickly established "standard practice" thereafter, stream bank debrushing has tended to be less intensive, and much of the cut brush is put to good use in construction of brush bundles.
Brush bundles vary in size, placement locations, and design, but the most common procedure is to locate them on the lower inside edges of bends where deposition of streamborne materials most naturally occurs. Bundles placed here accelerate the deposition process and speed up establishment of stable encroaching banks that help to concentrate stream flow along the outside bends, deepen the stream channel, and increase undercut banks. Undercut banks provide most of the hiding cover for trout in small streams.
11. ·;Xf
\~ ' ' /
\ 'ff . . (ff;.;,Y \ I;/ r:·~.~
,l;/lj/10
Brush bundles.
Brush bundles placed along the shallow side of stream channels also provide additional cover for small trout and attachment substrate for invertebrates.
One simple technique to create a brush bundle consists of placing 3 wooden stakes in a triangular configuration just at the tip of an inside bend. Each stake sticks above the water 3-4 ft. Cut brush is then deposited within the triangle area, with the butt ends facing upstream. Several butts are lashed together with synthetic cord and tied to the upstream stake. An anchoring cord is also tied across the brush from one of the lower stakes to the other to help consolidate the brush mass and provide additional stability.
If large dead or undesired trees have also been removed, portions of the main trunk can be positioned along the outside edges of brush bundles to provide longer functional life to the bundle and help deflect stream flow to the opposite, outside bend.
Along excessively wide and shallow reaches of stream that tend to carry above-normal sediment loads, brush mats have also been used effectively. Such mats consist of interwoven, crisscrossed brushy material. A series of tie-down cords and stakes are used to compact and stabilize each mat.
Occasional refurbishing of brush bundles or addition of new bundles is an option worth pursuing where shallow water habitat for young trout is a high-priority need, if sufficient material is available to cut near the stream.
Brush mats.

Half-logs
These simple, economical structures are used to provide hiding-resting-security cover for yearling and older trout in reaches of stream having sparse in-stream cover. They are not primarily designed to prevent or repair damage due to erosion of stream banks or to function as stream flow deflectors. Half-logs function best when installed on stable substrates.
Excellent siting locations include the margins of major flow concentrations in "runs" or "flat water" reaches, in or near the edges of pools, and tied in at the head or tail of good natural cover for adult trout. Placing half-logs at these locations also extends the value of such sites.
To date, the most common material used for half-logs is green-cut oak. Sections 8-10 ft long, cut longitudinally, provide 2 half-logs. Width should exceed 1 ft if possible. Halfinch holes are bored near the ends of each half-log, and 6-ft lengths of 1/2-inch reinforcement rod are inserted through
Half-log. Inset shows position of halflogs in stream.
the holes. Spacer blocks about 6 inches square are then slipped onto each rod, resting against the flat side of the log. The spacers function to hold the half-log up off the stream bottom so trout can slip underneath.
Half-logs should be positioned almost parallel with stream flow so that "dead water space" is provided beneath the log. Rods are driven into the bottom until about 6 inches of rod still protrude above the log. This tip is then bent over in a downstream direction to anchor the log against the bottom. Rods can be prepared with a welded washer cap on top and then pounded in flush with the log.
One common modification of the traditional half-log technique is to substitute slab-logs if such slabs can be obtained in adequate lengths and widths.
Whether half-logs or slab-logs are used, the final product should be entirely submerged to retard rotting. Slab-logs, because they tend to be thinner, have special utility in providing midchannel cover in shallow reaches where trout spawn.
f~ ': I,
l i i !
,, II ,, ,, ,, ,, ,, :' ,,
Slab-log. Inset shows construction details.
75

...... en
APPENDIX TABLE 1. Alphabetical index of case history streams, number of study zones, trout population variables, and sport fishery variables measured in the study > zones, and 2 levels of success for these variables in the treatment zones ( TZs) after habitat development. Levell ( Ll) success = 25% increase and level 2 ( L2) success = 50% increase. ~
PostdeveloQment Success in Treatment Zones ~ Total PoQulation Variables SQort Fisher:t: Variables ~
Total No.(Mile No.(Mile Total Angler No. Trout z No. Stud:t: Zones No.LMile ~6 Inches ~10 Inches LbsLMile HoursLMile CreeledLMile Stream Count:t: Trout SQecies Present RZs TZs L1 L2 L1 L2 L1 L2 L1 L2 L1 L2 L1 L2 ~ Allenton Cr. Washington domestic brown 1 1 No No Yes Yes ~ Beaver Br. Washburn wild brook, 1 1 Yes No Yes No Yes Yes
~ wild brown Behning Cr. Polk domestic and 0 2
TZ 1 wild brook No No No No TZ2 Yes Yes Yes Yes
Big Roche-a-Cri Cr. Waushara wild brook 0 1 Yes Yes Yes Yes Yes Yes No No Yes Yes Clam R. Polk wild brook, 0 1 Yes No
wild brown Coon Cr. La Crosse domestic and 0 2
(Bohemian Valley) wild brown TZ 1 Yes Yes TZ2 Yes Yes
Creek 12-6 Jackson wild brook 0 1 No No No No Doc Smith Br. Grant domestic brown 0 1
AprTZ No No Oct TZ No No
Dogtown Cr. Burnett wild brook 0 1 Yes Yes Yes Yes Yes Yes Eddy Cr. Sawyer wild brook 0 1 Yes Yes Yes Yes Yes Yes Elk Cr. Chippewa wild brook 0 1 Yes No No No No No Emmons Cr. Waupaca wild brown 1 1
AprTZ No No No No No No No No Oct TZ No No No No Yes Yes No No
Foulds Cr. Price wild brook 0 1 Yes Yes No No Yes Yes Hay Cr. Oconto wild brook 1 1 No No No No No No Hunting R. Lang lade wild brook, 0 2
Sta. 1 TZ wild brown Yes Yes Yes Yes Yes Yes Sta. 2 TZ Yes No Yes Yes Yes Yes
K. C. Cr. Marinette wild brook, 0 1 No No No No Yes No No No wild brown
Kinnickinnic R. St. Croix wild brown 0 5 Fuller TZ Yes Yes Yes Yes Yes Yes Yes Yes Gibson no. 1 TZ Yes No Yes No Yes No Yes Yes Gibson no. 2 TZ Yes No No No No No Yes No Gibson no. 3 TZ No No Yes No No No No No Purfeerst TZ No No Yes Yes Yes Yes Yes Yes
Kinnickinnic R. St. Croix wild brook, 1 1 AprTZ wild brown Yes Yes Yes Yes Oct TZ No No Yes No
Lawrence Cr. Adams and wild brook 1 1 Yes Yes Yes Yes Yes Yes Yes Yes Yes Yes Marquette
Lepage Cr. Florence wild brook 1 1 No No No No No No Little Bois Brule R. Douglas wild brook, wild 1 1 Yes Yes
brown, wild rainbow
Little Plover R. Portage wild brook 1 1 No No No No
- - -~-

APPENDIX TABLE 1. Continued.
Postdevelo11ment Success in Treatment Zones Total Po~ulation Variables S12ort Fisher;E Variables
Total No./Mile No./Mile Total Angler No. Trout No. Stud;E Zones No.LMile ;?;6 Inches ;?;10 Inches LbsLMile HoursLMile CreeledLMile
Stream Count;E Trout S~ies Present RZs TZs L1 L2 L1 L2 L1 L2 L1 L2 L1 L2 L1 L2 Lunch Cr. Waushara wild brown 1 1
AprTZ No No No No Yes Yes No No SepTZ No No No No Yes Yes No No
Macintire Cr. Marinette wild brook, 0 1 Yes Yes Yes No Yes Yes Yes Yes wild brown
McKenzie Cr. Polk wild brown 0 1 Yes No Yes No No No No No Mid. Br. Shawano wild brook 0 1 No No No No No No
Embarrass R. Mt. Vernon Cr. Dane wild brown 1 1 Yes Yes Yes Yes Neenah Cr. Adams wild brown 0 2
Sta. 1 TZ Yes Yes Yes Yes Yes Yes Sta. 2 TZ Yes Yes Yes Yes Yes Yes
Nichols Cr. Sheboygan wild brown 1 1 Yes No Yes Yes Yes Yes N. Br. Jackson wild brook, 0 1 No No Yes No No No
Trempealeau R. wild brown Parker Cr. St. Croix wild brown 0 2
TZ 1 No No No No No No No No TZ2 No No No No No No No No
Plover R. Marathon wild brook, 1 1 Yes No Yes Yes wild brown
Prairie R. Lincoln wild brook, 2 2 Sec. 35 TZ wild brown No No Yes Ye13 Yes Yes Trantow sta. TZ No No Yes Yes Yes Yes
Radley Cr. Waupaca wild brown 1 2 Sta. 2 TZ Yes No Yes No Yes No Yes No Sta. 3 TZ Yes No Yes Yes Yes No Yes Yes
Rosenow Cr. Waukesha wild brook, 0 1 Yes Yes Yes Yes Yes Yes wild brown
Rowan Cr. Columbia wild brown 1 1 No No No No No No No No Yes Yes Yes Yes S. Fork Main Cr. Rusk wild brown 1 1 Yes Yes Yes No Yes Yes Yes Yes Yes Yes Yes Yes Spring Cr. Chippewa wild brook 1 1
AprTZ Yes No Yes No Yes No Oct TZ Yes Yes Yes Yes Yes Yes
Tank Cr. Jackson wild brook 1 2 TZ 1 No No No No No No TZ3 No No No No No No
W. Br. WhiteR. Waushara wild brown 0 1 AprTZ Yes Yes Yes Yes No No Yes Yes Oct TZ No No Yes No Yes Yes No No
Willow Cr. Richland wild brown 0 1 Yes No Yes Yes Yellow R. Barron wild brook, 0 2
TZ 1 wild brown No No No No TZ2 No No Yes Yes
Total 20 55 Yes 28 19 32 17 22 18 23 20 3 3 4 4 No 25 34 22 37 8 12 17 20 2 2 1 1

APPENDIX TABLE 2. Summaries of results from creel census investigations on portions of 6 Wisconsin trout streams where trout habitat development projects have been conducted.
Principal Predev. Postdev. %Change Investigator Stream Wild SQecies Item Mean Mean (Postdev.[Predev.)
R. Hunt Lawrence Cr. Brook trout Trips/mile 149 441 +196 (section A) Hours/mile 371 1,066 +187
No./mile creeled 103 300 +191 Lbsjmile creeled 23 68 +196
R. Hunt Little Plover R. Brook trout Trips/mile 132 530 +302 Hours/mile 238 674 +183 No.jmile creeled 414 438 +6 Lbs/mile creeled 66 62 -6
G. Lowry McKenzie Cr. Brown trout Trips/mile 160 158 -1 Hours/mile 457 400 -12 No.,imile creeled 190 197 +4
R. White Big Roche-a-Cri Cr. Brook trout Trips/mile 90 75 -17 Hours/mile 251 221 -12 No./mile creeled 96 188 +96
%Change RZValue TZValue (TZiRZ)
T. Larson* Rowan Cr. Brown trout Hours/mile 340 955 +181 No./mile creeled 99 570 +476
F. Pratt** S. Fk. Main Cr. Brook trout Trips/mile 42 314 +648 Hours/mile 147 1,092 +643 No.jmile creeled 85 1,139 +1,240 Lbs/mile creeled 30 260 +767
* 1979 fishing season. Reference zone (RZ) = 1.14 miles (station 3), treatment zone (TZ) = 0.38 mile (station 2). ** 1982 fishing season. Reference zone (RZ) = 2.9 miles (stations 1 and 4), treatment zone (TZ) = 3.1 miles (stations 2
and 3).
78

APPENDIX TABLE 3. Summary of physical and chemical characteristics of the 41 trout streams covered in the case history section of this report.
Stream Characteristics Treatment Zones Length Average
Total Trout Average Average Total Total Length Width Length Water Width Gradient Alkalinity of TZs of TZs
Stream (miles) (miles) (ft) (ft/mile) (QQm) (miles)* (ft)** Allenton Cr. 2.5 2.5 6 15 290 1.5 26 Beaver Brook 3.5 3.5 13 37 109 0.5 16 Behning Cr. 0.9 0.9 6 2 86 0.2 6 Big Roche-a-Cri Cr. 15.0 15.0 17 7 140 1.2 20 ClamR. 22.8 17.5 20 15 22 0.5 20 Coon Cr.
(Bohemian Valley) 30.1 9.0 12 40 224 2.7 Creek 12-6 3.3 3.3 8 20 11 0.3 7 Doc Smith Br. 4.0 1.8 6 23 190 1.4 12 Dogtown Cr. 3.0 3.0 15 9 41 1.1 21 Eddy Cr. 3.5 3.5 8 16 69 0.6 19 Elk Cr. 10.8 10.8 15 11 27 2.1 23 Emmons Cr. 6.2 5.8 17 170 0.2 19 Foulds Cr. 5.3 5.3 11 5 60 2.5 10 Hay Cr. 10.8 10.8 6 123 0.2 9 Hunting R.-station 1 15.6 15.6 44 85 0.7 60 Hunting R.-station 2 15.6 15.6 44 85 0.5 60 K. C. Cr. 6.7 6.0 12 106 0.8 16 Kinnickinnic R. 25.0 15.0 20 6 163 1.0 28 Kinnickinnic R. 25.0 15.0 20 6 163 1.4 28 Lawrence Cr. 3.3 3.3 22 11 155 1.0 23 Lepage Cr. 4.5 4.5 5 132 0.3 7 Little Bois Brule R. 2.8 2.8 17 20 66 0.6 28 Little Plover R. 6.9 3.2 11 135 0.4 14 Lunch Cr. 10.8 10.8 8 6 165 0.5 13 Maclntire Cr. 6.5 6.5 14 126 0.4 13 McKenzie Cr. 6.6 6.6 10 15 99 3.5 18 Mid. Br. Embarrass R. 38.2 38.2 42 130 0.3 25 Mt. Vernon Cr. 7.0 7.0 10 18 239 18 Neenah Cr.-station 1 42.8 6.0 9 12 160 0.6 22 Neenah Cr.-station 2 42.8 6.0 9 12 160 0.6 17 Nichols Cr. 3.3 3.3 9 33 278 0.4 13 N. Br. Trempealeau R. 7.2 7.2 11 29 22 0.6 15 Parker Cr. 2.8 2.8 7 12 162 0.9 17 Plover R. 51.5 25.1 64 169 0.6 Prairie R.-section 35 30.9 30.9 64 77 0.5 60 Prairie R.-Trantow
station 30.9 30.9 64 77 0.6 72 Radley Cr. 6.8 6.8 14 145 0.7 12 Rosenow Cr. 3.6 3.6 4 5 279 0.3 17 Rowan Cr. 10.6 10.6 10 12 260 1.3 13 S. Fork Main Cr. 16.4 6.5 20 11 102 3.1 26 Spring Cr. 4.6 2.3 5 33 55 0.3 9 Tank Cr. 5.0 5.0 11 18 10 0.8 13 W. Br. WhiteR. 5.4 5.4 17 5 170 0.4 21 Willow Cr. 18.4 16.9 20 15 219 1.1 16 Yellow R. 33.1 9.1 27 7 88 0.8 20
* Total length of treatment zones rounded to tenth of a mile. ** Average width before habitat development.
• Not applicable; see case history.
79

80
LITERATURE CITED---------Documents used in preparing the case histories are not included in the Literature Cited. See individual case histories for a list of these documents.
AVERY, E. L. 1983. Population dynamics of wild trout
and associated sport fisheries in two northern Wisconsin streams. Wis. Dep. Nat. Resour. Tech. Bull. No. 141. 31 pp.
FAUSCH, K. D. AND R. J. WHITE 1981. Competition between brook trout
(Salvelinus jontinalis) and brown trout (Salmo trutta) for positions in a Michigan stream. Can. J. Fish. and Aquat. Sci. 38:1220-27.
FRANKENBERGER,L. 1968. Effects of habitat management on
trout in a portion of the Kinnickinnic River, St. Croix County, Wisconsin. Wis. Dep. Nat. Resour. Fish Manage. Rep. No. 22. 14 pp.
FRANKENBERGER,L.ANDR. FASSBENDER
1967. Evaluation of the effects of the habitat management program and the watershed planning program on the brown trout fishery in Bohemian Valley Creek, La Crosse County. Wis. Dep. Nat. Resour. Fish Manage. Rep. No. 16. 19 pp.
HALL, J. D. AND C. 0. BAKER 1982. Rehabilitating and enhancing
stream habitat: 1. Review and evaluation. Gen. Tech. Rep. PNW-138. Part 12 in Influence of forest and rangeland management on anadromous fish habitat in western North America. U.S. Dep. Agric. For. Serv. 29 pp.
HUNT, R. L. 1969. Effects of habitat alteration on pro
duction, standing crops and yield of brook trout in Lawrence Creek, Wisconsin. pp. 281-312 in T. G. Northcote, ed. Symposium on salmon and trout in streams. H. R. McMillan Lectures in Fisheries. Univ. of B. C., Vancouver. 388 pp.
1971. Responses of a brook trout population to habitat development in Lawrence Creek. Wis. Dep. Nat. Resour. Tech. Bull. No. 48. 35 pp.
1976. A long-term evaluation of trout habitat development and its relation to improving management-oriented research. Trans. Am. Fish. Soc. 105(3):361-64.
1978. Instream enhancement of trout habitat. pp. 19-27 inK. Hashagen, ed. Proc. Nat. Symp. on Wild Trout Manage. Calif. Trout Inc., San Francisco. 69 pp.
1979. Removal of woody streambank vegetation to improve trout habitat. Wis. Dep. Nat. Resour. Tech. Bull. No. 115. 36 pp.
1982. An evaluation of half-logs to improve brown trout habitat in Emmons Creek. Wis. Dep. Nat. Resour. Res. Rep. No. 116. 8 pp.
1985. A follow-up assessment of removing woody streambank vegetation along two Wisconsin trout streams. Wis. Dep. Nat. Resour. Res. Rep. No. 137. 23 pp.
KLINGBIEL, J. H. 1981. The relative benefits of habitat de
velopment and trout stocking. Wis. Dep. Nat. Resour. Fish Manage. Admin. Rep. No. 10. 32 pp.
LES, B. L. 1980. Wisconsin trout stream habitat
management. Wis. Dep. Nat. Resour. Fish Manage. Publ. 60000-4D03028-80. 5 pp.
LOWRY, G. R. 1971. Effect of habitat alteration on
brown trout in McKenzie Creek, Wisconsin. Wis. Dep. Nat. Resour. Res. Rep. No. 70. 27 pp.
O'DONNELL, D. J. AND C. W. THREINEN 1960. Fish habitat development. Wis.
Conserv. Dep. Publ. No. 231. 15 pp.
REEVES, G. H. AND T. D. ROELOFS 1982. Rehabilitating and enhancing
stream habi~at: 2. Field applications. Gen. Tech. Rep. PNW-140. Part 13 in Influence of forest and rangeland management on anadromous fish habitat in western North America. U.S. Dep. Agric. For. Serv. 38 pp.
WATERS, T. F. 1983. Replacement of brook trout by
brown trout over 15 years in a Minnesota stream: production and abundance. Trans. Am. Fish. Soc. 112:137-46.
WHITE, R. J. 1972. Responses of trout populations to
habitat change in Big Roche-a-Cri Creek, Wisconsin. Univ. of Wis., Madison. PhD Thesis. 278 pp.
WHITE, R. J. AND 0. M. BRYNILDSON 1967. Guidelines for management of
trout stream habitat in Wisconsin. Wis. Dep. Nat. Resour. Tech. Bull. No. 39. 64 pp.

ACKNOWLEDGMENTS
Special appreciation is extended to each DNR fish manager who supplied me with unpublished file data or reports on evaluations of trout stream habitat development projects. Their cooperation is also acknowledged for review and approval of the case histories for which they were listed as principal investigators.
Larry Claggett, Bureau of Fisheries Management, suggested, after reviewing a preliminary draft, that I add the data incorporated into Tables 9-13 and related discussion. Thanks, Larry, for that important contribution.
Peer review and suggestions for modifying content and style were provided by Bureau of Research personnel Lyle Christenson, Eugene Lange, and Ed Avery.
This research was supported in part by funds provided by the Federal Aid in Fish Restoration Act under Dingell-Johnson project F-83-R. This technical report is the final report for Study No. 413
About the Author
Robert L. Hunt is supervisor of the Wisconsin DNR trout research unit (Cold Water Group), a position he has held for 21 of his 30 years as a fisheries research biologist with the DNR. His mailing address is Department of Natural Resources, Route 1, Box 589, Waupaca, WI 54981.
Production Credits Betty Les, Technical Editor Donna Mears, Production Editor Wendy McCown, Copy Editor Richard Burton, Graphic Artist Ruth King, Illustrator M. Foley, S. Schultz, C. Nelson,
C Warren, I Stassi, Word Processors

TECHNICAL BULLETINS (1983-1988)
~CD ::DO Ill 0 (I) Q) ,. 0. X .'0
0. -~ Ill 0. C.OU) ~ • g N 3
8: • ... Q)
:E :I -No. 138 Limnological characterstics of No. 151 Ruffed grouse habitat relation-
Wisconsin lakes. (1983) Richard ships in aspen and oak forests of A. Lillie and John W. Mason central Wisconsin. (1984) John F.
A survey of the mussel densities in Kubisiak
No. 139 Pool 10 of the Upper Mississippi No. 152 Distribution and relative abun-River (1982). Randall E. Duncan dance of fishes in Wisconsin. V. and Pamella A. Thiel Grant & Platte, Coon & Bad Axe,
No. 140 Distribution and relative abun-and LaCrosse river basins. (1985)
dance of fishes in Wisconsin. II. Don Fago
zn c.o 0 oo 0 -~i 0 z :I CoO Ill .,_ 5" -o- c:
::u8 ~
Ul !!. ~::D w ..... ::D ~.! 0 Q) ..... CoO oc 0 • c: • ~ - 0
l Q) CoO
Black, Trempealeau, and Buffalo No. 153 Phosphorus reduction via meta-river basins. (1983) Don Fago limnetic injection in Bullhead
No: 141 Population dynamics of wild trout Lake, Wisconsin. (1985) Richard
and associated sport fisheries in P. Narf
two northern Wisconsin streams. No. 154 Sexual maturity and fecundity of (1983) Ed L. Avery brown trout in central and north-
No. 142 Assessment of a daily limit of two ern streams. (1985) Ed. L. Avery
trout on the sport fishery at Me- No. 155 Distribution and relative abun-Gee Lake, Wisconsin. (1984) Rob- dance of fishes in Wisconsin. VI. ert L.Hunt Sheboygan, Manitowoc, and Twin
No. 143 Distribution and relative abun-river basins. (1985) Don Fago
dance of fishes in Wisconsin. III. No. 156 Aquatic community interactions Red Cedar river basin. (1984) Don of submerged macrophytes. (1985) Fago Sandy Engel
No. 144 Population ecology of woodcock in No. 157 An evaluation of beach nourish-Wisconsin. (1984) Larry Gregg ment on the Lake Superior shore.
No. 145 Duck breeding ecology and bar-(1985) John W. MasoQ, Melvin H.
vest characteristics on Grand Albers, and Edmund M. Brick
River Marsh Wildlife Area. (1984) No. 158 Distribution and movement of William E. Wheeler, Ronald C. Canada geese in response to man-Gatti, and Gerald A. Bartelt agement changes in east central
No. 1"46 Impacts of a floodwater-retarding Wisconsin, 1975-1981. (1986) Scott R. Craven, Gerald A. Bar-
structure on year class strength telt, Donald H. Rusch, and Robert and production by wild brown E. Trost trout in a Wisconsin coulee stream. ( 1984) Oscar M. Brynildson and No. 159 Distribution and relative abun-CliJford L. Brynildson dance of fishes in Wisconsin. VII.
No. 147 Distribution and relative abun-St. Croix River basin. (1986) Don
dance of fishes in Wisconsin. IV. Fa go
Root, Milwaukee, Des Plaines, No. 160 Population dynamics of stocked and Fox River basins. (1984) Don adult muskellunge ( Esox masqui-Fa go nongy) in Lac Court OreiUes, Wi£..
No. 148 An 8-inch length limit on small-consin, 1961-1977. (1986) John
mouth bass: effects on the sport Lyons and Terry Margenau
fishery and population of small- No. 161 Fish species assemblages in south-mouth bass and yellow perch in western Wisconsin streams with Nebish Lake, Wisconsin. (1984) implications for smallmouth bass Steven L. Serns management. (1988) John Lyons,
No. 149 Food habits of adult yellow perch Anne M. Forbes, and Michael D.
and smallmouth bass in Nebish Staggs
Lake, Wisconsin. (1984) Steven L. No. 162 A compendium of 45 trout stream Serns and Michael Hoff habitat development evaluations
No. 150 Aquatic organisms in acidic envi-in Wisconsin during 1953-1985.
ronments: a literature review. (1988) Robert L. Hunt
(1984) Joseph M. Eilers, Gregory J. Lien, and R ichard G. Berg
Copies of the above publications and a complete list of all technical bulletins in the series are available from the Bureau of Research, Department of Natural Resources, Box 7921, Madi-son, WI 53707.
,...,.. . ,..,... nn vu~o..• ; ,"'•luL uu