Embed Size (px)
Citation preview

Bull Trout Distribution, Movements and Habitat Use
in the Walla Walla River Basin
2002-2003 Annual Progress Report
Prepared by:
Darren G. Gallion
Donald R. Anglin
Marshall Barrows
Courtney Newlon
Tad J. Kisaka
Department of the Interior
U.S. Fish and Wildlife Service
Columbia River Fisheries Program Office
1211 SE Cardinal Court, Suite 100
Vancouver, WA 98683
8 March 2015

2
Table of Contents
Table of Contents .............................................................................................................................2
List of Figures ..................................................................................................................................3
List of Tables ...................................................................................................................................5
Acknowledgements ..........................................................................................................................6
Abstract ............................................................................................................................................7
Introduction ......................................................................................................................................8
Background ......................................................................................................................................9
Study Area .....................................................................................................................................11
Study Objectives ............................................................................................................................12
Methods..........................................................................................................................................13
Distribution ........................................................................................................................... 13 Movements ............................................................................................................................ 14 Habitat Suitability ................................................................................................................. 15
Water Temperature ............................................................................................................... 18
Results and Discussion ..................................................................................................................20
Distribution ........................................................................................................................... 20 Movements ............................................................................................................................ 22 Habitat Suitability ................................................................................................................. 25
Water Temperature ............................................................................................................... 29
Plans for 2004 ................................................................................................................................35
References ......................................................................................................................................37

3
List of Figures
Figure 1. Map of the Walla Walla Basin showing the Touchet River, Mill Creek, and Walla
Walla River subbasins, and the Umatilla National Forest. ......................................... 10
Figure 2. Map of the 2002-2003 study area depicting 30 kilometers of the SFWWR and
mainstem WWR. Stream segments that were sampled to determine bull trout
distribution during 2003 are identified. ...................................................................... 12
Figure 3. Map of the South Fork Walla Walla River redd survey area showing reaches 1
through 7, Reser Creek, and Skiphorton Creek where surveys were conducted during
2002-2003. .................................................................................................................. 15
Figure 4. Geodimeter model 600 used to collect bathymetric data in a 200 meter stream
segment of the South Fork Walla Walla River. .......................................................... 18
Figure 5. Map showing the two river reaches surveyed during the TIR flight on 13 August
2003. The locations of instream sensors used to ground truth radiant temperatures
derived from TIR images are also shown. The sensor locations are labeled by river
mile (rm). .................................................................................................................... 19
Figure 6. Stream Segments in the SFWWR and mainstem WWR snorkeled during 2003 and
locations of bull trout observed................................................................................... 21
Figure 7. Relative frequency of habitat unit use by bull trout, and habitat unit availability in the
South Fork Walla Walla River. ................................................................................... 22
Figure 8. Number of bull trout captured and the corresponding number of days fished per
month at the Day Road trap site from 13 August through 23 December 2003. ......... 23
Figure 9. Fork lengths and average number of Chinook salmon captured per day at the Day
Road trap site by month from August through December 2003. ................................ 23
Figure 10. Fork lengths and average number of O.mykiss captured per day at the Day Road trap
site separated by month from August through December, 2003. ............................... 24
Figure 11. Relative frequency of depths at bull trout redd locations and frequency of available
depths in the SFWWR spawning area. ....................................................................... 26
Figure 12. Relative frequency of mean column velocities at bull trout redd locations and
frequency of available mean column velocities in the SFWWR spawning area. ....... 26
Figure 13. Relative frequency of dominant substrate size classes at bull trout redd locations and
frequency of available dominant substrate size classes in the SFWWR spawning area.
..................................................................................................................................... 27

4
Figure 14. Relative frequency of percent fines at bull trout redd locations in the SFWWR
spawning area.............................................................................................................. 28
Figure 15. Distribution of dominant substrate size classes for a 200 m stream segment of the
SFWWR. ..................................................................................................................... 28
Figure 16. Median channel water temperatures versus river mile for the SFWWR. Surface water
inflow sampled during the survey is labeled at rm 5.1. .............................................. 30
Figure 17. TIR/color video image showing the SFWWR (13.0°C) at rm 5.1. An apparent inflow
(12.0°C) was detected along the right bank (looking downstream)............................ 30
Figure 18. TIR/Color video image mosaic showing the confluence of the South Fork (15.0°C)
and North Fork (20.0°C) Walla Walla rivers on 13 August 2003. ............................. 31
Figure 19. Median channel water temperatures versus river mile for the WWR, WA/OR along
with the location of surface water inflows. ................................................................. 32
Figure 20. TIR/color video image showing a relatively abrupt transition in radiant temperatures
from ≈17.8°C at location “A” to ≈16.6°C at location “B”.......................................... 33
Figure 21. TIR/color video image pair showing a cool water seep detected at rm 42.9. Seeps of
this nature indicate the occurrence of shallow, sub-surface flow through the channel.
..................................................................................................................................... 34
Figure 22. TIR/color video image pair showing an example of cool water (24.3°C) emerging
from within the floodplain at river mile 28.0. The location of the cooler water at the
downstream end of the gravel bar suggests shallow, sub-surface flow as its source. . 35

5
List of Tables
Table 1. Substrate types and particle sizes used to classify dominant and subdominant
substrates at bull trout redd locations and adjacent non-use locations. ...................... 16
Table 2. Percent fines codes and classification descriptions for conditions at bull trout redd
locations and adjacent non-use locations. ................................................................... 16
Table 3. Summary of the river reaches surveyed with TIR and color video on 13 August 2003.
..................................................................................................................................... 20
Table 4. Length and weight data collected from bull trout, Chinook salmon, and O. mykiss
captured at the Day Road screw trap site on the Walla Walla River from 13 August
through 23 December 2003. Length and weight ranges are in parentheses. .............. 22
Table 5. Tributary temperatures for the Walla Walla River, WA/OR. ..................................... 33

6
Acknowledgements
Funding for this work was provided by the U.S. Fish and Wildlife Service (FWS). We
would like to thank Gayle Zydlewski of the FWS, Abernathy Fish Technology Center for
providing technical advice and support for the passive integrated transponder arrays installed in
the Basin. Brian Mahoney and Mike Lambert (Confederated Tribes of the Umatilla Indian
Reservation) worked cooperatively with us during screw trap operations and provided local
assistance on several occasions. We thank Clark and Lyla Lampson for allowing us to operate a
screw trap on their property. We would like to thank FWS employees Bao Le and Jonathan
Miller for field assistance, Steve Haeseker for assistance with sampling design and analysis, and
Henry Yuen for assistance with SAS. Tim Bailey provided information and allowed us to obtain
our Scientific Take Permit along with Laura Tesler and Mary Hanson (Oregon Department of
Fish and Wildlife). NOAA take permits were obtained from Leslie Schaeffer.

7
Abstract
A better understanding of bull trout Salvelinus confluentus life history strategies is
necessary to identify corrective actions that will make progress toward recovery in the Walla
Walla Basin. This report describes studies conducted by the U.S. Fish and Wildlife Service
(FWS) from 2002 through 2003 on the lower South Fork Walla Walla River (SFWWR), and
mainstem Walla Walla River (WWR) with the goal of obtaining detailed information on bull
trout life history to assist with development and evaluation of recovery actions. These studies
were designed to describe seasonal distribution and movements, and to determine the physical
conditions that comprise suitable habitat for bull trout.
We conducted snorkel surveys in segments of the SFWWR and WWR during July to
describe the summer distribution of bull trout. Bull trout were observed as far downstream as
Nursery Bridge Dam. Stream habitat between Harris County Park (SFWWR) and the
Oregon/Washington state line (WWR) was visually delineated into riffle, race, and pool habitat
types. Bull trout distribution among the three habitat types were compared with habitat
availability to determine if bull trout preferred a particular type of habitat so that future sampling
could be stratified. Our observations suggested bull trout prefer pool habitat.
To better understand seasonal movements of bull trout, we operated a rotary screw trap to
monitor dispersal into downstream areas. Results indicated that downstream movement occurred
from October through December. A passive integrated transponder detection array was installed
at the East Bank Nursery Bridge fish ladder to describe bull trout movement patterns into the
impacted river segment downstream from the Little Walla Walla Irrigation Diversion. No bull
trout were detected at the array.
Bull trout redd surveys were conducted in the SFWWR by the Oregon Department of
Fish and Wildlife and the FWS to obtain an annual index of abundance, and to identify redd sites
for development of a spawning habitat suitability model. The cumulative number of bull trout
redds enumerated over six surveys during 2002 was 330. The cumulative number of bull trout
redds enumerated over five surveys during 2003 was 362. We measured depth at 316 redd
locations and mean column velocity, substrate composition, and percent fines at 319 redd
locations to assess suitable bull trout spawning habitat. Bull trout selected slightly shallower
depths, and slower velocities for redd sites relative to what was generally available. The greatest
contrast between microhabitat use and availability was bull trout selection of smaller substrate
sizes than were generally available. Bathymetric surveys were conducted on a 200 m reach of
the SFWWR to create a two-dimensional flow model that could be used in the development of a
spawning habitat suitability model. Elevation and substrate data were collected at 1,564 points
for the model.
We contracted an airborne thermal infrared (TIR) remote sensing survey on the SFWWR
and WWR to determine the presence and distribution of cold water refugia.. TIR survey data
were successfully collected along the entire length of the WWR, and on the lower 10 miles of the
SFWWR. Cool water inflow from springs, seeps and tributaries was detected at several locations.

8
Introduction
Bull trout Salvelinus confluentus were officially listed as a Threatened Species under the
Endangered Species Act (ESA) in 1998. The U.S. Fish and Wildlife Service (FWS)
subsequently issued a Draft Recovery Plan for the Umatilla-Walla Walla Recovery Unit (U.S.
Fish and Wildlife Service 2002, Chapter 10). The goal of bull trout recovery planning in the
Umatilla-Walla Walla Recovery Unit is to describe courses of action necessary for the ultimate
delisting of this species, and to ensure the long-term persistence of self-sustaining, complex
interacting groups of bull trout distributed across the species’ native range (U.S. Fish and
Wildlife Service 2004, Chapter 10-revised). To meet this overall goal, the FWS has identified
four recovery objectives which establish the basis for work conducted by the Columbia River
Fisheries Program Office (CRFPO) in the Walla Walla Basin:
Maintain current distribution of bull trout within the Core Areas and re-establish bull
trout in previously occupied habitats,
Maintain stable or increasing trends in abundance of bull trout,
Restore and maintain suitable habitat conditions for all bull trout life history stages and
strategies, and
Conserve genetic diversity and provide the opportunity for genetic exchange.
Bull trout, which are native to the Walla Walla Basin, exhibit two different life history
strategies. Fluvial (migratory) bull trout spawn in headwater streams and juveniles rear in these
streams for one to four years before migrating downstream as subadults to larger mainstem areas,
and possibly to the Columbia River where they grow and mature, returning to the tributary
stream to spawn (Fraley and Shepard 1989). This pattern can also be observed in the adfluvial
life history strategy with the primary difference being subadult migration to a lake rather than
larger mainstem river areas. Downstream migration of subadults generally occurs during the
spring, although it can occur throughout the year (Hemmingsen et al. 2002). These migratory
forms occur in areas where conditions allow for movement from upper watershed spawning
streams to larger downstream waters that contain greater foraging opportunities (Dunham and
Rieman 1999). Stream-resident bull trout also occur in the Walla Walla Basin, and they
complete their entire life cycle in the tributary streams where they spawn and rear. Resident and
migratory forms of bull trout may be found living together for portions of their life cycle,
however it is unknown if they can give rise to one another (Rieman and McIntyre 1993). Bull
trout size is variable depending on life history strategy. Resident adult bull trout tend to be
smaller than fluvial adult bull trout (Goetz 1989). Under appropriate conditions, bull trout
regularly live to 10 years, and under exceptional circumstances, reach ages in excess of 20 years.
They normally reach sexual maturity in four to seven years (Fraley and Shepard 1989; McPhail
and Baxter 1996).
When compared to other North American salmonids, bull trout have more specific habitat
requirements. The habitat components that shape bull trout distribution and abundance include
water temperature, cover, channel form and stability, valley form, spawning and rearing

9
substrates, and migratory corridors (U.S. Fish and Wildlife Service 1998). Throughout their
lives, bull trout require complex forms of cover, including large woody debris, undercut banks,
boulders, and pools (Fraley and Shepard 1989; Watson and Hillman 1997). Juveniles and adults
frequently inhabit side channels, stream margins, and pools with suitable cover (Sexauer and
James 1997). McPhail and Baxter (1996) reported that newly emerged fry are secretive and hide
in gravel along stream edges and in side channels. They also reported that juveniles are found in
pools, riffles, and runs where they maintain focal sites near the bottom, and that they are strongly
associated with instream cover, particularly overhead cover. Bull trout have been observed
overwintering in deep beaver ponds or pools containing large woody debris (Jakober 1995).
Habitat degradation and fragmentation (Fraley and Shepard 1989), barriers to migration (Rieman
and McIntyre 1995), and reduced instream flows have all contributed to the decline in bull trout
populations in the Columbia Basin.
In summary, bull trout need adequate streamflows and the corresponding habitat for each
of the different life history functions at specific times of the year in order to persist in the Walla
Walla Basin. Instream flows and the associated habitat must be adequate to provide spawning
opportunities, rearing opportunities, cover, forage, seasonal movement, migration opportunities,
and overwintering refugia.
Background
The Walla Walla Basin in northeastern Oregon (OR) and southeastern Washington (WA)
is a tributary of the Columbia River that drains an area of 4,553 km2. The Walla Walla Basin is
comprised of the Touchet River Subbasin, the Mill Creek Subbasin, and the Walla Walla River
Subbasin. The primary headwater tributaries originate in the Blue Mountains and include the
North and South Forks of the Walla Walla River, upper Mill Creek, and the North Fork, South
Fork, and Wolf Fork of the Touchet River (Figure 1). The Walla Walla Basin historically
supported a number of anadromous and resident native salmonid populations including spring
and fall Chinook salmon (Oncorhynchus tshawytscha), chum salmon (O. keta), coho salmon (O.
kisutch), redband trout (O. mykiss subpopulation), bull trout (S. confluentus), mountain whitefish
(Prosopium williamsoni), and summer steelhead (O. mykiss) (Northwest Power and Conservation
Council 2004). Currently, steelhead are the only remaining native anadromous salmonid
population in the Walla Walla Basin. A supplementation program for spring Chinook salmon
was initiated by the Confederated Tribes of the Umatilla Indian Reservation (CTUIR) in 2000 in
the South Fork Walla Walla River (SFWWR) using outplanted adults to initiate spawning. The
current plan is to continue supplementation using spring releases of spring Chinook hatchery
smolts. Populations of native redband trout, bull trout, and mountain whitefish still persist in the
Walla Walla Basin.

10
Figure 1. Map of the Walla Walla Basin showing the Touchet River, Mill Creek, and Walla
Walla River subbasins, and the Umatilla National Forest.
CRFPO bull trout studies were focused on the Walla Walla River Subbasin in 2002-2003
with the goal of collecting and analyzing life history data to assist in assessing the relative merit
of potential action strategies in making progress towards meeting the recovery goal outlined in
the Draft Recovery Plan (U.S. Fish and Wildlife Service 2004) for the recovery and delisting of
bull trout. Specifically CRFPO studies were designed to address the following Recovery Plan
objectives:
Restore and maintain suitable habitat conditions for all bull trout life history
stages and strategies, and
Conserve genetic diversity and provide opportunity for genetic exchange.
To make progress on the habitat objective, a number of steps may be required. A
fundamental step should be to determine the physical conditions that comprise suitable bull trout
habitat. A subsequent step should be application of these habitat “criteria” to current conditions
in the Walla Walla Basin to determine whether suitable habitat conditions are present.
Following this evaluation, potential changes in current conditions that may be needed, or actions
Harris County Park

11
to improve bull trout habitat in the Basin should be identified. And finally, implementation of
those changes and/or actions should be pursued on a prioritized basis.
The recovery objective that describes genetic diversity could be accomplished by
maintaining physical connectivity among local populations of bull trout to facilitate gene flow
and genetic exchange. As the Recovery Plan discusses, connectivity consists of maintaining the
fluvial component of each local population which includes providing conditions that allow
fluvial adults to effectively move between spawning and wintering areas, and ensuring that
movement of both fluvial adult and subadult bull trout can occur, at least seasonally, between
local populations within each Core Area in the Recovery Unit. This includes establishing the
physical conditions necessary for up- and downstream fish passage, and providing a continuum
of suitable physical habitat to ensure the persistence of fluvial lifestages and to provide the
opportunity for genetic exchange.
The general approach CRFPO used to plan studies in the Walla Walla Basin consisted of
the following three steps:
Identify data needed to assess if criteria for recovery objectives are being
achieved;
To that end, design and implement studies to describe bull trout distribution,
movement, and seasonal habitat use patterns;
Use the data and analyses from these studies to assist in guiding actions that will
make progress towards bull trout recovery.
Study Area
Our study area in 2002-2003 included the SFWWR from Harris County Park downstream
to the mainstem WWR, and the mainstem WWR downstream to the OR/WA state line, a
distance of approximately 30 river kilometers (Figure 2).

12
Figure 2. Map of the 2002-2003 study area depicting 30 kilometers of the SFWWR and
mainstem WWR. Stream segments that were sampled to determine bull trout distribution during
2003 are identified.
Study Objectives
Recovery objectives and criteria from Chapter 10 of the revised Draft Recovery Plan
(U.S. Fish and Wildlife Service 2004) were the basis for our specific study objectives in 2002-
2003. Bull trout populations in the Walla Walla Basin consist of both resident and fluvial, or
migratory life history strategies. Resident bull trout in the upper Walla Walla River local
population are primarily located in the SFWWR upstream from Harris County Park where
impacts are minimal. Thus, our study objectives were designed to address the fluvial portion of
this population. In addition, it is the fluvial portion of the population that enables interaction
between local populations to provide the opportunity for genetic exchange. This has been
referred to as connectivity, or “connecting” local populations of bull trout within a Core Area, as
well as metapopulations of bull trout among Core Areas. In order to make progress towards
these recovery objectives, the temporal and spatial distribution of the two relevant life history
stages (adult, subadult) for fluvial bull trout were required.
13
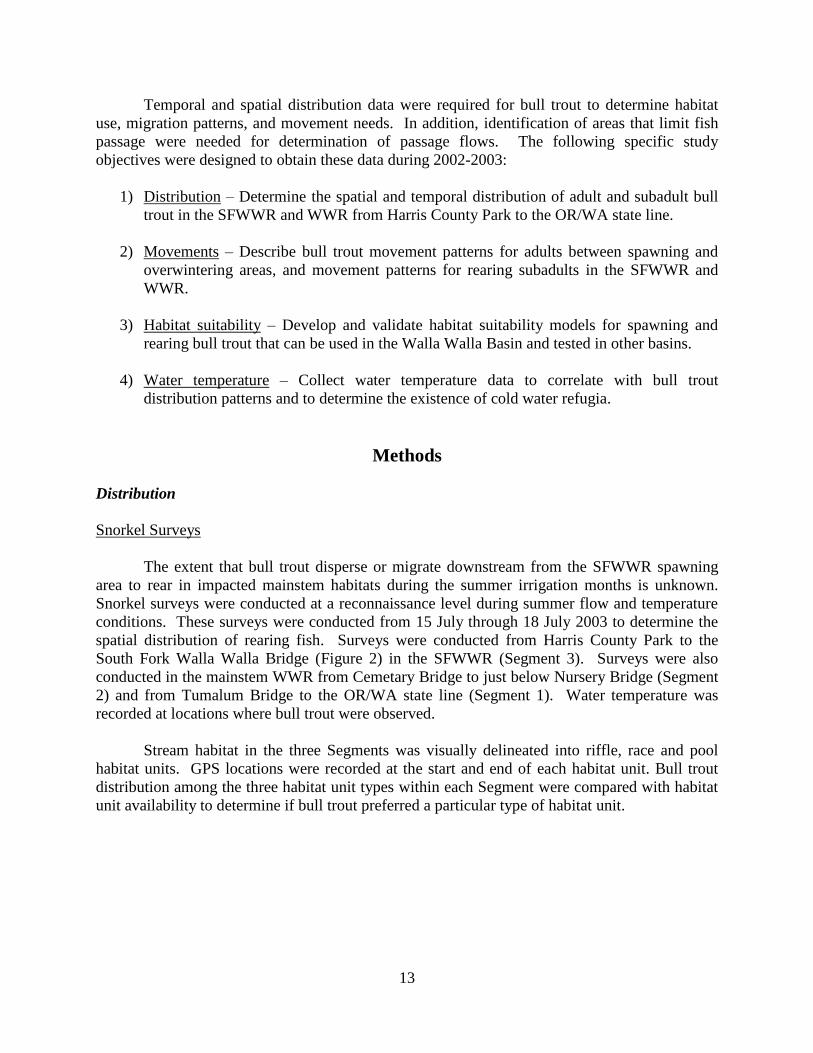
Temporal and spatial distribution data were required for bull trout to determine habitat
use, migration patterns, and movement needs. In addition, identification of areas that limit fish
passage were needed for determination of passage flows. The following specific study
objectives were designed to obtain these data during 2002-2003:
1) Distribution – Determine the spatial and temporal distribution of adult and subadult bull
trout in the SFWWR and WWR from Harris County Park to the OR/WA state line.
2) Movements – Describe bull trout movement patterns for adults between spawning and
overwintering areas, and movement patterns for rearing subadults in the SFWWR and
WWR.
3) Habitat suitability – Develop and validate habitat suitability models for spawning and
rearing bull trout that can be used in the Walla Walla Basin and tested in other basins.
4) Water temperature – Collect water temperature data to correlate with bull trout
distribution patterns and to determine the existence of cold water refugia.
Methods
Distribution
Snorkel Surveys
The extent that bull trout disperse or migrate downstream from the SFWWR spawning
area to rear in impacted mainstem habitats during the summer irrigation months is unknown.
Snorkel surveys were conducted at a reconnaissance level during summer flow and temperature
conditions. These surveys were conducted from 15 July through 18 July 2003 to determine the
spatial distribution of rearing fish. Surveys were conducted from Harris County Park to the
South Fork Walla Walla Bridge (Figure 2) in the SFWWR (Segment 3). Surveys were also
conducted in the mainstem WWR from Cemetary Bridge to just below Nursery Bridge (Segment
2) and from Tumalum Bridge to the OR/WA state line (Segment 1). Water temperature was
recorded at locations where bull trout were observed.
Stream habitat in the three Segments was visually delineated into riffle, race and pool
habitat units. GPS locations were recorded at the start and end of each habitat unit. Bull trout
distribution among the three habitat unit types within each Segment were compared with habitat
unit availability to determine if bull trout preferred a particular type of habitat unit.

14
Movements
Rotary Screw Trap
A five-foot (1.52 m) diameter rotary screw trap (E. G. Solutions Inc. Corvallis, OR) was
fished from 13 August to 23 December 2003 to characterize the magnitude and timing of bull
trout dispersal or downstream migration from the SFWWR spawning area. A suitable site to
deploy the screw trap, and landowner permission for access were not accomplished in time to
begin sampling during the spring of 2003, hence the summer start date. Rotary screw traps have
been useful in monitoring salmonid migrations and have been used effectively to capture bull
trout in Mill Creek (Hemmingsen et al. 2001).
The screw trap was deployed at a site in the WWR near Day Road (rkm 80.5),
approximately four rkm downstream from the forks, and was operated intermittently in
coordination with CTUIR personnel. Operations were interrupted several times as a result of
severe flow conditions, trap damage and repair, and limited personnel availability. The trap was
checked daily when it was sampling to monitor streamflow and debris conditions, as well as to
process any fish that were captured. During high flows, the cone was raised and the trap was
secured to the bank to avoid damage from debris. The screw trap was fished at the head of a
swift pool that offered little room for adjustment in high flow situations. However, the trap site
was only accessible through private land which protected the equipment from vandalism.
Captured fish were removed from the screw trap live box with a dip net. Bull trout,
Chinook salmon, and O. mykiss were anesthetized in a bath of 40mg/L MS-222 (tricaine
methanesulfonate), scanned for passive integrated transponder (PIT) tags, and measured for
weight and length. We planned to tag bull trout with 23 mm PIT tags if possible. The CTUIR
tagged Chinook salmon and O. mykiss that were of sufficient size with 12 mm PIT tags when
possible. We also planned to conduct sampling efficiency tests for bull trout in order to expand
the samples to the estimated total number of individuals that may have passed the trap site.
PIT Tag Detection Arrays
During September/October 2003, we installed a full-duplex PIT tag interrogation system
(Destron Fearing 1001) at the East Bank adult fish ladder at Nursery Bridge Dam. This site
provided an additional downstream data collection point for bull trout PIT tagged in the SFWWR
by other researchers. Ambient electrical noise was high at the site, so aluminum shields were
installed around the screen cleaning motors in an attempt decrease noise interference with the
PIT tag transceiver. Additionally, an EMI (electro-magnetic interference) noise filter was
installed in November on the screen cleaning motor control panel. Data on the system and any
PIT tag detections were logged to a desktop computer equipped with Minimon software (Pacific
States Marine Fisheries Commission). The interrogation system computer was linked by phone
to the internet allowing data to be automatically uploaded to PTAGIS, a regional online database
website, every six hours. Routine inspection and maintenance was performed to ensure reliable
data collection and system operation. Occasionally, informal PIT tag efficiency tests were
conducted, which consisted of holding a PIT tag at varying distances away from the inside of the
rectangular antenna frame to determine if there were any “holes” in the detection field.

15
Habitat Suitability
Redd Surveys
Multiple-pass spawning ground surveys were conducted by the Oregon Department of
Fish and Wildlife (ODFW) and FWS biologists on the SFWWR, Reser Creek, and Skiphorton
Creek (Figure 3) to obtain an annual index of abundance. Redd surveys were conducted from 19
August through 29 October 2002, and from 2 September through 29 October 2003. Surveyors
began at either the upstream or downstream end of a reach and walked/waded through the reach
enumerating redds, recording redd size, and recording estimated lengths of adults seen within the
reach. Bull trout redds were categorized into small (<0.5m), medium (0.5-1.5m) or large
(>1.5m) size classes in an attempt to identify resident and migratory redds. Bull trout redds were
assigned a unique number and marked with flagging to avoid counting redds multiple times and
to identify individual redd locations. These marked locations provided the opportunity to return
later to measure habitat variables used by spawning bull trout.
Figure 3. Map of the South Fork Walla Walla River redd survey area showing reaches 1
through 7, Reser Creek, and Skiphorton Creek where surveys were conducted during 2002-2003.

16
Spawning Habitat Suitability Model
During fall 2002 and 2003, we measured microhabitat variables at bull trout redds, and at
nearby locations that were not used for spawning to obtain use and non-use data to develop a
spawning habitat suitability model. Data were collected from 23 through 28 October 2002 and
from 27 through 31 October 2003 at previously flagged redds in reaches 1 through 7 (Figure 3)
of the SFWWR. Microhabitat variables determine the suitability of any particular location in the
stream for a bull trout redd. Surrounding mesohabitat conditions may be important in some
areas, but in the SFWWR where conditions are generally pristine, mesohabitat variables were
continuous, uniform, and of good quality. As a result, we focused our data collection on
microhabitat variables.
Surveyors measured the water depth and mean column velocity at the upstream edge of
the redd pit with a top-set wading rod and a Marsh-McBirney Flo-Mate Model 2000 flow meter.
When measuring water velocities in eddies, the flow meter sensor was pointed directly into the
current, just as a fish would be oriented (Rantz 1982). Surveyors then classified dominant and
subdominant substrate size and percent fines at the redd. Substrate was categorized into six
classes by diameter (Table 1), and percent fines was categorized into four classes (Table 2).
Table 1. Substrate types and particle sizes used to classify dominant and subdominant substrates
at bull trout redd locations and adjacent non-use locations.
Substrate Type Particle size (cm) Particle size (inch)
Sand <0.64 <.25
Pebble 0.65 – 2.54 0.25 – 1.0
Small Gravel 2.55 – 5.08 1.0 – 2.0
Large Gravel 5.09 – 7.62 2.0 – 3.0
Cobble 7.63 – 15.24 3.0 – 6.0
Boulder >15.24 >6.0
Table 2. Percent fines codes and classification descriptions for conditions at bull trout redd
locations and adjacent non-use locations.
Code Description
1 0 to 25 percent of visible substrate <0.64 cm
2 26 to 50 percent of visible substrate <0.64 cm
3 51 to 75 percent of visible substrate <0.64 cm
4 76 to 100 percent of visible substrate <0.64 cm
During 2002, only use data were collected at bull trout redds. During 2003 non-use data
were also collected. Following data collection at the redd location, a non-use point was
determined by pacing a random distance (one to six steps upstream or downstream and one to six
steps toward either stream bank) away from the redd, where data collection was repeated.

17
Analytical methods included an examination of bull trout preferences for depth, velocity,
substrate, and percent fines. To determine bull trout preference for specific ranges of
microhabitat variables, we compared empirical data on the ranges of the variables that were
actually used at redd sites to the overall availability of the variables. Availability data were
collected on transects within 15 stream reaches between Harris County Park and Reser Creek by
Utah State University (Budy et al. 2005). We compared frequency distributions of the
microhabitat variables at redd sites to frequency distributions for overall availability of the
variables to determine if spawning bull trout were selecting specific conditions at frequencies
that were different than the frequencies of overall availability.
Hydraulic Model
Bathymetric surveys were conducted on a 200-m reach of the SFWWR from 29
September through 31 October 2002. This stream segment is located approximately 0.4 km
upstream of the SFWWR and Skiphorton Creek confluence (Figure 3). Bathymetric survey data
will be required to create a two-dimensional flow model that will be used in the development of
a habitat suitability model. Latitude, longitude and elevation were established at several
benchmarks surrounding the study area using a Trimble RTK GPS receiver. A Geodimeter
model 600 total station (Figure 4) was positioned over the benchmark and back-sighted to
another benchmark to establish a location and direction for the instrument. Survey crews
consisted of one instrument person operating the total station and one rod person holding a
survey rod with a 360º prism. Individual bathymetric data points were then collected at
approximately 1-m intervals across the width of the river and extended beyond the wetted width
up the bank to approximately 1 m above the water surface elevation. In addition to location and
elevation data, substrate and percent fines data were collected at each survey point. Surveyors
classified dominant and subdominant substrate size and percent fines as previously described in
Table 1 and Table 2.

18
Figure 4. Geodimeter model 600 used to collect bathymetric data in a 200 meter stream
segment of the South Fork Walla Walla River.
Water Temperature
Water temperatures were measured with a field thermometer at bull trout locations during the
snorkel surveys to correlate the pattern of temperatures with bull trout distribution between the
SFWWR headwater area and the mainstem WWR near state line.
Thermal Infrared Remote Sensing Surveys
The FWS contracted with Watershed Sciences, LLC (WS) to conduct airborne thermal
infrared (TIR) remote sensing surveys on the SFWWR and WWR to determine if cold water
refugia were present as a result of either spring or groundwater interaction with the surface
water, or hyporheic flow activity. Both TIR and color video imagery were collected in order to
characterize the thermal regime of the surveyed area. The airborne surveys were conducted on
13 August 2003 (Figure 5, Table 3). Images were collected with TIR (8-12µ) and visible-band
cameras attached to a gyro-stabilized mount on the underside of a helicopter. The two sensors
were aligned to represent the same ground area, and the helicopter was flown longitudinally
along the stream channel with the sensors looking straight down. Thermal infrared images were
recorded directly from the sensor to an on-board computer in a format in which each pixel
contained a measured radiance value. The recorded images maintained the full 12-bit dynamic

19
range of the sensor. The individual images were referenced with time and position data provided
by a global positioning system (GPS).
A consistent altitude above ground level was maintained in order to preserve the scale of
the imagery throughout the survey. The ground width and spatial resolution represented by the
TIR image vary based on the flight altitudes. The flight altitude is selected prior to the flight
based on the channel width and morphology. During the flight, images were collected
sequentially with approximately 40% vertical overlap. The flight was conducted in the mid-
afternoon in order to capture heat-of-the-day conditions.
Figure 5. Map showing the two river reaches surveyed during the TIR flight on 13 August
2003. The locations of instream sensors used to ground truth radiant temperatures derived from
TIR images are also shown. The sensor locations are labeled by river mile (rm).

20
Table 3. Summary of the river reaches surveyed with TIR and color video on 13 August 2003.
River
Reach
Survey
Date
Survey
Time
(24 hr)
Survey Extent River
Miles
Image
Width
Meter (ft)
TIR Image
Pixel Size
Meter (ft)
WWR 13 Aug 13:59-
15:26
Mouth to
SFWWR
49.8 193 (635) 0.61 (1.98)
SFWWR 13 Aug 15:26-
15:45
SFWWR mouth
to Elbow Creek
10.7 193 (635) 0.61 (1.98)
For each surveyed stream, WS deployed instream data loggers prior to the survey to
ground truth (i.e. verify accuracy) the TIR data. The instream data loggers were located at
intervals of 10 river miles or less over the survey route. The SFWWR was instrumented with
two sensors; one in the upper reaches at Harris County Park and the other closer to its mouth.
Five sensors were deployed in the WWR with relatively uniform distribution (as access allowed).
Meteorological data including air temperature and relative humidity were recorded using
a portable weather station (Onset) located at Harris County Park. A detailed description of the
methods used for data processing can be found in Faux (2003).
Results and Discussion Distribution
Snorkel Surveys
A total of 67 bull trout were observed while conducting snorkel surveys to determine bull
trout distribution (Figure 6). Nearly all of the observations (n=66) were within the lower
SFWWR in Segment 3. One bull trout was observed in Segment 2 just below Nursery Bridge
Dam. No bull trout were observed in the lower Segment 1.

21
Figure 6. Stream Segments in the SFWWR and mainstem WWR snorkeled during 2003 and
locations of bull trout observed.
Water temperature data collected at 39 bull trout observation locations in the SFWWR
ranged from 10.6 to 20.0 °C with an average of 13.4 °C. The temperature at the single
observation below Nursery Bridge Dam was 20.0 °C. The observation of only a single bull trout
in the two downstream Segments was likely correlated with the pattern of increasing water
temperatures in the downstream direction.
We compared habitat unit use with availability in the SFWWR where most of the
observations occurred to determine if bull trout preferred one type of habitat unit (riffle, race or
pool) over another. Of the bull trout that were observed, 27% were in riffles, 54% were in races,
and 18% were in pools (Figure 7). Riffle, race, and pool habitat occurred at a frequency of 46%,
52%, and 2%, respectively. Pool habitat units were used more frequently than available
suggesting bull trout selected for pool habitat. Riffle habitat units were used less frequently than
available, possibly suggesting avoidance. Race habitat units were used at a frequency similar to
their availability.

22
Figure 7. Relative frequency of habitat unit use by bull trout, and habitat unit availability in the
South Fork Walla Walla River.
Movements
Rotary Screw Trap
We captured five bull trout, 3,135 Chinook salmon, and 1,371 O. mykiss in the rotary screw trap
(Table 4). The trap sampled successfully for 63 of 130 days from 13 August to 23 December
2003. No previously PIT tagged bull trout were captured. Captures of previously PIT tagged
Chinook salmon and O.mykiss totaled 595 and 98, respectively. No 23 mm PIT tags were
available on the days that the bull trout were captured, thus none were PIT tagged. The CTUIR
PIT tagged 2,205 Chinook salmon and 480 O. mykiss with 12 mm PIT tags during the sampling
period. Sufficient numbers of bull trout were not captured to calculate a trap efficiency estimate.
Table 4. Length and weight data collected from bull trout, Chinook salmon, and O. mykiss
captured at the Day Road screw trap site on the Walla Walla River from 13 August through 23
December 2003. Length and weight ranges are in parentheses.
Species Mean length (mm) Mean weight (g) Total # captured
Bull trout
Chinook salmon
O. mykiss
206.8 (123-375)
86.1 (48-118)
89.6 (40-233)
211.5 (18.0-659.0)
6.0 (1.4-46.0)
8.2 (0.4-139.0)
5
3135
1371
Of the five bull trout captured, four were likely subadult fish (≤ 325 mm), and one was a
larger adult fish (> 325 mm). The number of bull trout captured was not sufficient to establish a
pattern of movement, although the sampling effort and catch during November suggested the
possibility of more downstream movement activity during that month (Figure 8).

23
0
1
2
3
August September October November December
Month
Nu
mb
er
of
fish
0
5
10
15
20
25
30
Nu
mb
er
of
days f
ish
hed
per
mo
nth
Bull trout
Number of Days Fished
Figure 8. Number of bull trout captured and the corresponding number of days fished per month
at the Day Road trap site from 13 August through 23 December 2003.
Chinook salmon and O. mykiss were caught throughout the trapping period at the Day
Road trap site. Length-frequency distributions indicated the majority of Chinook salmon were in
the 70 mm length interval in August and September (Figure 9). The highest frequency length
group increased to 80 mm and was constant from October through December, although the
samples were more evenly distributed among multiple length groups.
0
2
4
6
8
10
12
14
16
18
20
40 50 60 70 80 90 100 110 120
Fork length (mm)
Av
era
ge
nu
mb
er
of
ch
ino
ok
pe
r d
ay August
September
October
November
December
Figure 9. Fork lengths and average number of Chinook salmon captured per day at the Day
Road trap site by month from August through December 2003.

24
Length frequency data for O. mykiss indicated movement of smaller fish, primarily in the
40 to 70 mm intervals, from August through October (Figure 10). These fish were likely young-
of-year (YOY), or in the 0+ age category. In November and December, average fish size
increased, and two higher frequency size groups were observed, possibly indicating movement of
a second age group of 1+ fish along with the YOY fish.
0
1
2
3
4
5
6
7
8
9
40 60 80 100 120 140 160 180 200 220 240
Fork length (mm)
Av
era
ge
nu
mb
er
of
O. m
yk
iss
pe
r d
ay
August
September
October
November
December
Figure 10. Fork lengths and average number of O.mykiss captured per day at the Day Road trap
site separated by month from August through December, 2003.
The five-foot rotary screw trap allowed us to sample for bull trout in variable and
difficult river conditions during the 2003 trapping season where other methods were not feasible,
although the sampling efficiency of the effort was unknown. The Day Road trap site provided
protection from vandalism, but offered limited adjustability to deal with high water velocities
through the trap and the debris load, both of which caused equipment damage. Relatively few
(n=5) bull trout were captured with the screw trap and no bull trout were recaptured. As such,
data were insufficient to assess movement patterns past the Day Road trap site. It is unclear
whether the screw trap deployment configuration reduced capture efficiency, or if the movement
of bull trout past the trap site was small. Sub-adult bull trout behavior during downstream
movement is largely unknown; however, rearing studies have indicated that older juveniles and
adults are primarily bottom dwellers and often are associated with coarse substrates such as large
cobbles and boulders (Fraley and Shepard 1989). The tendency of bull trout to be bottom-
oriented may have contributed to low trap efficiency at the Day Road trap site.
Our goal is to monitor bull trout movement during all seasons to determine when time
periods of “active migration” occur. Hemmingsen et al. (2002) found that downstream
movement of smaller bull trout in Mill Creek occurred year-round, but they operated a screw trap
much closer to the known spawning area. For the next screw trap deployment, we plan to

25
identify an alternative site that is more conducive to expanded screw trap operations throughout
all seasons.
PIT Tag Detection Arrays
The East Bank fish ladder PIT detection array at Nursery Bridge Dam operated a total of
79 days between 3 October and 31 December 2003. No bull trout were detected during this time
period. Fall bull trout movements are most likely downstream, with both subadults and adults
moving into rearing and overwintering habitat that was too warm during the summer.
Downstream migrant fish passing Nursery Bridge Dam can either pass over the spillway or
through the ladders, and depending on discharge levels, spillway passage may be more likely.
Upstream movements of bull trout in the spring documented by Bronson and Duke (2004) will
be the most likely time period for detecting PIT tagged bull trout in the East Bank fish ladder at
Nursery Bridge Dam. A total of 31 PIT tagged juvenile spring Chinook salmon were detected in
the East Bank fish ladder during the sampling period.
Installation of the aluminum shields around the screen cleaning motors did not noticeably
decrease ambient noise, but installation of the EMI filter did attenuate noise allowing consistent
detections of 12 mm PIT tags. When efficiency tests were conducted, the East Bank fish ladder
antenna was found to be 100% efficient when the screen cleaning motors were not operational,
and slightly less when the motors were operational.
Habitat Suitability
Redd Surveys
Redd surveys conducted in the SFWWR and tributaries on six occasions resulted in a
total of 330 bull trout redds during 2002. The cumulative number of bull trout redds enumerated
over five surveys during 2003 was 362. These totals were not as high as the 2001 redd count
(483), but they were higher than the 10-year average from 1994-2003 (287 redds).
Spawning Habitat Suitability Model
Depth measurements were collected at 316 bull trout redd locations identified during
spawning ground surveys. Measurements of mean column velocity, substrate composition, and
percent fines were collected at 319 redd locations. The availability of microhabitat variables was
characterized at 1,433 individual points in the SFWWR spawning area by Utah State University
researchers (Budy et al. 2005).
We found that 96% of the depths measured at bull trout redd sites ranged from 0.2 to 0.6
m, and the average depth was 0.28 m (Figure 11). Similarly, 90% of the depths measured for
overall availability ranged from 0.2 to 0.6 m, but the average depth was 0.36 m (Figure 11). The
primary difference between the two data sets was the higher frequency of redd sites in shallower
depths compared to depths that were available.

26
Figure 11. Relative frequency of depths at bull trout redd locations and frequency of available
depths in the SFWWR spawning area.
We found that 95% of the mean column velocities measured at bull trout redd sites
ranged from 0.2 to 0.6 m/s, and the average mean column velocity was 0.20 m/s (Figure 12). In
contrast, we found that only 49% of the velocities measured for overall availability ranged from
0.2 to 0.6 m/s, and the average available velocity was 0.64 m/s (Figure 12). Bull trout appear to
be selecting for lower velocity areas for spawning compared to the overall distribution of
velocities in the SFWWR spawning area.
Figure 12. Relative frequency of mean column velocities at bull trout redd locations and
frequency of available mean column velocities in the SFWWR spawning area.

27
We found that 84% of the dominant substrate sizes measured at bull trout redd sites were
in the pebble and small gravel categories (Figure 13). In contrast, only 18% of the available
dominant substrate sizes were in the pebble and small gravel categories (Figure 13). Bull trout
appear to prefer smaller substrate sizes for redd construction and spawning, possibly because of
the ease of excavation of smaller materials in the lower velocity conditions typical of bull trout
redd sites.
Figure 13. Relative frequency of dominant substrate size classes at bull trout redd locations and
frequency of available dominant substrate size classes in the SFWWR spawning area.
Ninety-three percent of the percent fines values measured at bull trout redd sites fell
within the 0-25% category (Figure 14). No percent fines availability information was collected
for the SFWWR spawning area. This outcome was not surprising considering bull trout, like
other salmonids, rely on good water circulation through the substrates in their redds for waste
removal and oxygenation of incubating eggs.

28
Figure 14. Relative frequency of percent fines at bull trout redd locations in the SFWWR
spawning area.
Hydraulic Model
Location and elevation data, as well as substrate and percent fines data were collected at
1,564 points in the 200 m stream segment of the SFWWR selected for this modeling effort.
Fifty-one percent of the dominant substrate sizes measured in the stream segment were in the
cobble and boulder categories (Figure 15).
Figure 15. Distribution of dominant substrate size classes for a 200 m stream segment of the
SFWWR.

29
These data will be used in the future to develop a 2-dimensional flow model for this
section of the SFWWR spawning area, which in turn, will be used for development and
evaluation of a spawning habitat suitability model, and spawning habitat simulations.
Water Temperature
Water temperature data were limited to field measurements during snorkel surveys, and
generally showed an increasing pattern in the downstream direction. Temperatures in the
SFWWR ranged from 10.6 to 20.0 °C with an average of 13.4 °C. More comprehensive,
continuous data will be available in the future from a network of thermographs that we will
install next year.
Thermal Infrared Remote Sensing Surveys
South Fork Walla Walla River
Median radiant water temperatures were plotted versus river mile (rm) for the SFWWR
(Figure 16). The profile shows the location and temperature of the single surface water inflow
sampled during the analysis.
At the upstream end of the survey (rm 10.8), radiant temperatures in the SFWWR were
relatively cool at 11.8°C. Stream temperatures warmed slightly in the downstream direction
reaching ≈13.6°C at river mile 8.4 and then appeared to cool again reaching ≈12.7°C at rm 7.7.
The source of cooling was not apparent from the imagery. However, visual inspection of the
temperature profile in relation to the 7.5' USGS topographic map shows a general transition from
a canyon reach to a less confined, lower gradient valley reach. A change in morphology in
relation to the apparent decrease in stream temperature suggests an area of ground water
upwelling. Between rm 7.7 and 3.2, water temperatures in the SFWWR remained relatively
constant at 13.2°C (±0.5°C). Local variations along the profile were within the noise level
(±0.5°C) typical of TIR remote sensing and should not be used to draw conclusions on localized
heating or cooling. An inflow source was detected and sampled within this reach at rm 5.1.
Although the source was classified as a spring, the inflow occurs within a side channel and its
source is difficult to identify (Figure 17). It was only slightly cooler (12.0°C) than the adjacent
river temperature (13.0°C).

30
Figure 16. Median channel water temperatures versus river mile for the SFWWR. Surface
water inflow sampled during the survey is labeled at rm 5.1.
Figure 17. TIR/color video image showing the SFWWR (13.0°C) at rm 5.1. An apparent inflow
(12.0°C) was detected along the right bank (looking downstream).
Water temperatures in the SFWWR exhibited a general warming trend between rm 3.2
and the North Fork confluence. Overall, stream temperatures along this reach had a net increase
of ≈2.1°C (13.2°C to 15.3°C). Within this reach, longitudinal heating was observed between rm
3.2 and 2.5, and again between rm 1.2 and the NF confluence. A local maximum of ≈14.7°C
was observed at rm 2.5. However, an instream data logger at river mile 2.5 recorded

31
temperatures of 14.3°C at the time of the survey. The small spike in the profile is within
characteristic noise levels and most likely represents an artifact of the remote sensing rather than
an actual maximum. At the confluence, the North Fork was ≈5.0°C warmer than the South Fork
(Figure 18).
Figure 18. TIR/Color video image mosaic showing the confluence of the South Fork (15.0°C)
and North Fork (20.0°C) Walla Walla rivers on 13 August 2003.
Walla Walla River
Median radiant stream water temperatures of the WWR were plotted versus river mile
(Figure 19). The location of sampled surface water inflows (i.e. tributaries, springs, and side
channels) are illustrated on the plot by river mile, and are listed in Table 5 by river mile and
name.
Downstream of the North and South Fork confluence, water temperatures increased from
≈15.1°C at the confluence (rm 50.7) to ≈18.0°C at rm 49.6. The rapid longitudinal heating
(≈2.6°C/mile) through this reach may at least partially reflect the downstream mixing of flows
from the forks. At rm 49.2, stream temperatures decreased to 16.6°C. The imagery at this
location showed a relatively abrupt transition in temperature just downstream of county road 525

32
crossing (at Joe West Bridge), however, the source of cooling was not apparent from the imagery
(Figure 20). The magnitude of the decrease (>1.0°C) suggests that the decrease at this location is
valid.
Figure 19. Median channel water temperatures versus river mile for the WWR, WA/OR along
with the location of surface water inflows.

33
Figure 20. TIR/color video image showing a relatively abrupt transition in radiant temperatures
from ≈17.8°C at location “A” to ≈16.6°C at location “B”.
Table 5. Tributary temperatures for the Walla Walla River, WA/OR.
Tributary Name km Mile
Tributary o
C
Walla Walla River o
C
Difference o
C
Lake Wallula (RB) 1.5 0.9 22.2 23.5 -1.3
Unnamed Tributary (LB) 2.6 1.6 24.8 24.1 0.7
Smiths Harbor Inlet (RB) 3.2 2.0 24.1 23.3 0.8
Side Channel (LB) 9.1 5.6 27.3 25.4 1.9
Touchet River (RB) 31.2 19.4 25.1 24.1 1.0
East Little Walla Walla
River (LB) 60.3 37.5 19.9 22.4 -2.5
Yellowhawk Creek (RB) 61.6 38.3 20.5 22.6 -2.1
Spring (LB) 67.5 42.0 20.0 22.8 -2.8
Spring (LB) 68.9 42.8 20.4 22.6 -2.2
Spring (LB) 70.4 43.7 15.7 20.8 -5.1
Couse Creek (LB) 75.8 47.1 20.6 17.5 3.10
South Fork Walla Walla
River (LB) 81.4 50.6 14.9 15.1 -0.20

34
Stream temperatures increased by ≈5.9°C between rm 49.2 and 43.0. The reach, which
included the town of Milton-Freewater, exhibited an average downstream heating rate of
≈1.0°C/mile and represented one of two reaches where sustained longitudinal heating was
observed. A second warming reach was observed between rm 34.3 and 28.3 where stream
temperatures increased from ≈21.9°C to ≈26.3°C, an average rate of 0.7°C/mile.
Between the two warming reaches (river miles 43.0 and 34.3), water temperatures in the
WWR remained relatively constant at 21.9°C (±1.0°C) with areas of localized warming and
cooling. Three tributary inflows contributed to the localized cooling observed at river miles
41.3, 38.4, and 37.6. In addition, two spring inflows were sampled within this reach and,
although labeled as springs, they more accurately represent cool water seeps that emerge from
the channel substrate. These inflows more importantly signify the occurrence of hyporheic flow,
which likely buffers heating within this reach (Figure 21).
Figure 21. TIR/color video image pair showing a cool water seep detected at rm 42.9. Seeps of
this nature indicate the occurrence of shallow, sub-surface flow through the channel.
Between rm 28.3 and 5.2, water temperatures in the WWR remained above ≈23.0°C with
localized areas of heating and cooling. The Touchet River was the only surface water inflow
detected through this reach and it contributed water that was warmer than the mainstem. In
streams with warm temperatures and relatively low flows, sub-surface inputs can result in a high
degree of local variability along the profile. The TIR images showed areas of cool water within
the channel floodplain, and interpretation of these images suggests that much of the spatial
temperature variability in the lower 28 miles of the WWR was the result of localized sub-surface
inflows followed by longitudinal heating of the surface water (Figure 22).
A general cooling trend was observed between river mile 5.2 and the river mouth at Lake
Wallula. The processes driving this cooling trend were not apparent from the imagery.

35
Figure 22. TIR/color video image pair showing an example of cool water (24.3°C) emerging
from within the floodplain at river mile 28.0. The location of the cooler water at the downstream
end of the gravel bar suggests shallow, sub-surface flow as its source.
Plans for 2004
We intend to further investigate the spatial and temporal distribution of bull trout in
relation to water temperatures. We plan to conduct more thorough snorkel surveys throughout
the summer and fall to gain a better understanding of distribution as water temperatures change.
Thermographs will be deployed to monitor stream temperatures throughout the year and we plan
to investigate the importance of cold water inflows identified from TIR data.
To remedy screw trapping difficulties associated with elevated flows and debris loads at
the Day Road site, an alternative sampling site will be investigated. Limited data about bull trout
movements was obtained by operating the screw trap at the Day Road trap site from August to
December. We will attempt to operate the screw trap from January to July depending on
personnel availability.
In addition to the existing PIT detection array at the East Bank fish ladder at Nursery
Bridge Dam, we will investigate installation of an additional array at the West Bank ladder.
Monitoring of both ladders would likely detect most upstream migrants that are PIT tagged.
Video monitoring of the East Bank ladder is conducted by the CTUIR. We will also investigate
installation of a video system in the West Bank ladder to monitor movements of fish that are not
PIT tagged.
We will continue conducting redd surveys and collecting spawning habitat suitability
data. We may also begin collecting rearing habitat suitability data at observed bull trout
locations while conducting snorkel surveys.

36
Lastly, we will install a stream gage at Harris County Park. Monitoring river stage will
assure that spawning habitat suitability data will be collected under the same conditions that were
present when the redds were constructed.

37
References
Bronson, J. and B. Duke. 2004. Walla Walla River Fish Passage Operations Program, 2002-2003
Annual Report, Project No. 200003300, 35 electronic pages, (BPA Report DOE/BP-
00012779-2).
Budy, P., R. Al-Chokhachy, K. Homel, and G. P. Thiede. 2005. Bull trout population
assessment in northeastern Oregon: a template for recovery planning. Annual Progress
Report for 2004. USGS Utah Cooperative Fish and Wildlife Research Unit, Utah State
University, Logan, Utah.
Dunham, J.B. and B.E. Rieman. 1999. Metapopulation structure of bull trout: Influences of
physical, biotic, and geometrical landscape characteristics. Ecological Applications 9: 642-
655.
Faux, R. N. 2003. Aerial surveys in the Walla Walla River Basin: Thermal infrared and color
videography. Report to the U.S Fish & Wildlife Service, Columbia River Fisheries Program
Office.
Fraley, J. J. and B. B. Shepard. 1989. Life history, ecology and population status of migratory
bull trout (Salvelinus confluentus) in the Flathead Lake and River system, Montana.
Northwest Science 63:133-143.
Goetz, F. 1989. Biology of the bull trout. United States Department of Agriculture, Forest
Service, Willamette National Forest, literature review, Eugene, Oregon.
Hemmingsen, A. R., B. L. Bellerud, S. L. Gunckel, and P. J. Howell. 2001. Bull trout life
history, genetics, habitat needs, and limiting factors in central and northeast Oregon, 1998
Annual Report. Bonneville Power Administration, Portland, Oregon.
Hemmingsen, A. R., S. L. Gunckel, P. M. Sankovich, and P. J. Howell. 2002. Bull trout life
history, genetics, habitat needs, and limiting factors in central and northeast Oregon, 2001
Annual Report. Bonneville Power Administration, Portland, Oregon.
Jakober, M. J. 1995. Autumn and winter movement and habitat use of resident bull trout and
westslope cutthroat trout in Montana. Master's thesis, Montana State University, Bozeman,
1995.
McPhail, J.D. and J. Baxter. 1996. A Review of bull trout (Salvelinus confluentus) life-history
and habitat use in relation to compensation and improvement opportunities. Fisheries
Management Report No. 104. Department of Zoology, U.B.C., Vancouver, B.C.
Northwest Power and Conservation Council. 2004. Walla Walla Subbasin Plan.
Rantz, S. E. 1982. Measurement and Computation of Streamflow. USGS Water Supply Paper
2175. http://water.usgs.gov/pubs/wsp/wsp2175/index.html.

38
Rieman, B. E. and J. D. McIntyre. 1993. Demographic and habitat requirements for
conservation of bull trout. United States Department of Agriculture, Forest Service,
Intermountain Research Station, General Technical Report INT-302, Ogden, Utah.
Rieman, B.E. and J.D. McIntyre. 1995. Occurrence of bull trout in naturally fragmented habitat
patches of varied size. Transactions of the American Fisheries Society. 124:285-296.
Sexauer, H.M. and P.W. James. 1997. Microhabitat use by juvenile bull trout in four streams
located in the eastern Cascades, Washington. Pp. 361-370 in Friends of the Bull Trout
Conference Proceedings (Mackay, W.C., M.K. Brewin, and M. Monita, eds.). Bull Trout
Task Force (Alberta), c/o Trout Unlimited Canada, Calgary, AB.
U.S. Fish and Wildlife Service. 1998. Klamath River and Columbia River bull trout population
segments: status summary. Prepared by the Service's bull trout listing team.
U.S. Fish and Wildlife Service. 2002. Chapter 10, Umatilla-Walla Walla Recovery Unit,
Oregon and Washington. 165 p. In: U.S. Fish andWildlife Service. Bull Trout (Salvelinus
confluentus) Draft Recovery Plan. Portland, Oregon.
U.S. Fish and Wildlife Service. 2004. Unpublished revised draft. Chapter 10, Umatilla-Walla
Walla Recovery Unit, Oregon and Washington. 160 p. May 10, 2004.
Watson, G. and T. W. Hillman. 1997. Factors affecting the distribution and abundance of bull
trout: an investigation at hierarchical scales. North American Journal of Fisheries
Management 17:237–252.