Embed Size (px)
Citation preview

A COMPARISON OF THE DISC BEHAVIOR PROFILING TOOL AND THE
PERSONAL INTERESTS, ATTITUDES AND VALUES REPORT
by
Larry A. Smith
CALVIN LATHAN, Ed.D., Faculty Mentor and Chair
SAMUEL NATALE, Ph.D., Committee Member
BRIAN POLDING, Ph.D., Committee Member
Bill Reed, Ph.D., Acting Dean, School of Business & Technology
A Dissertation Presented in Partial Fulfillment
Of the Requirements for the Degree
Doctor of Philosophy
Capella University
June 2009
UMI Number: 3359712
INFORMATION TO USERS
The quality of this reproduction is dependent upon the quality of the copy
submitted. Broken or indistinct print, colored or poor quality illustrations and
photographs, print bleed-through, substandard margins, and improper
alignment can adversely affect reproduction.
In the unlikely event that the author did not send a complete manuscript
and there are missing pages, these will be noted. Also, if unauthorized
copyright material had to be removed, a note will indicate the deletion.
______________________________________________________________
UMI Microform 3359712 Copyright 2009 by ProQuest LLC
All rights reserved. This microform edition is protected against unauthorized copying under Title 17, United States Code.
_______________________________________________________________
ProQuest LLC 789 East Eisenhower Parkway
P.O. Box 1346 Ann Arbor, MI 48106-1346

© Larry Smith, 2009
Abstract
This study investigated the relationship between DISC – a behavioral preference
assessment tool – and PIAV – a personal interest, attitude, and value preference
assessment tool. The objective of this study was to determine if there were correlations
and differences between DISC and PIAV scores. The sample consisted of 600 assessment
results obtained from the database of a behavioral consultant – 300 sales professionals
and 300 executives. The results showed there were significant (p < .05) correlations
between DISC and PIAV scores. In addition, there were significant (p < .05) differences
between the DISC and PIAV scores for men and women and sales professionals and
executives.
The homogeneity of the sample limits the ability to generalize beyond men and women
sales professionals and executives. Future studies are needed to determine whether
differences and similarities exist between more heterogeneous groups.

iii
Acknowledgments
I want to thank my committee for their guidance and support during this process:
Dr. Calvin Lathan, School of Business and Technology; Dr. Samuel Natale, School of
Business and Technology; and Dr. Brian Polding. As my mentor, Dr. Lathan’s
dedication, positive attitude, and coaching proved to be instrumental in achieving this
goal.
I would also like to thank Judy Suiter with Competitive Edge, Inc. for her support
and assistance.

iv
Table of Contents
Acknowledgments………………………………………………………………...iv
List of Tables ……………………………………………………………………viii
List of Figures ……………….…………………………………………………... ix
CHAPTER 1. INTRODUCTION
Introduction to the Problem……………………………………………………….1
Background of the Study………………………………………………………….3
Statement of the Problem…………………………………………………………4
Purpose of the Study……………………………………………………………...5
Rationale………………………………………………………………………….5
Research Questions……………………………………………………………….5
Significance of the Study…………………………………………………………6
Definition of Terms………………………………………………………………7
Assumptions and Limitations…………………………………………………….8
Nature of the Study………………………………………………………………9
Organization of the Remainder of the Study…………………………………….9
CHAPTER 2. LITERATURE REVIEW
Introduction………………………………………………………………………11
Classical Conditioning…………………………………………………………...12
Operant Conditioning…………………………………………………………….13
Cognitive Theory………………………………………………………………...14
Cognitive Behavioral Theory…………………………………………………….15
Humanistic Theory………………………………………………………………16
v
Kohlberg’s Moral Development Theory………………………………………...18
Ethics of Care Theory……………………………………………………………21
Utilitarian Theory………………………………………………………………..22
Kantian Theory…………………………………………………………………..22
John Rawls’ Theory of Justice…………………………………………………..22
The DISC Behavioral Profiling Tool……………………………………………23
DISC History……………………………………………………………………23
DISC Assessment……………………………………………………………….26
DISC in the Literature…………………………………………………………..26
Personal Interests, Attitudes, and Values Report (PIAV)………………………31
PIAV History……………………………………………………………………32
PIAV in the Literature…………………………………………………………..33
Summary………………………………………………………………………...38
CHAPTER 3. METHODOLOGY………………………………………………………40
Research Design………………………………………………………………….40
Sample……………………………………………………………………………41
Instrumentation / Measures………………………………………………………41
Validity and Reliability…………………………………………………………..42
Data Collection…………………………………………………………………..42
Data Analysis…………………………………………………………………….43
Ethical Considerations…………………………………………………………...45
CHAPTER 4. RESULTS………………………………………………………………..48
Introduction……………………………………………………………………...48
vi
Description of the Data………………………………………………………….50
Data Analysis……………………………………………………………………61
Addressing the Research Questions and Hypotheses…………………………...75
Summary………………………………………………………………………...80
CHAPTER 5. DISCUSSION, IMPLICATIONS, AND RECOMMENDATIONS
Summary and Discussion of the Results………………………………………..82
Implications……………………………………………………………………..90
Recommendations………………………………………………………………93
Conclusion………………………………………………………………………94
REFERENCES……………………………………………………………………........96
APPENDIX. Raw Data………………………………………………………………..106
vii
List of Tables
Table 1. Summary of the Sample……………………………………………………….50
Table 2. Means and Standard Deviations for DISC…………………………………….53
Table 3. Ranking of Mean DISC Scores………………………………………………..55
Table 4. Means and Standard Deviations for PIAV…………………………………….56
Table 5. Ranking of Mean PIAV Scores………………………………………………..58
Table 6. Correlation Matrix for all the Dependent Variables…………………………...60
Table 7. Test of Independence…………………………………………………………..63
Table 8. Levene’s Test of Equality of Error Variances………………………………….74
Table 9. Correlation Between DISC and PIAV Scores………………………………….76
Table 10. Test of Between-Subjects Effects for DISC and PIAV……………………….77
Table 11. Test of Between-Subjects Effects for PIAV and Gender…………………….78
Table 12. Test of Between-Subjects Effects for DISC and Profession…………………..79
Table 13. Test of Between-Subjects Effects for PIAV and Profession………………….80

viii
List of Figures
Figure 1. DISC Map…………………………………………………………………......42
Figure 2. Histogram of DISC D Scores………………………………………………....64
Figure 3. Histogram of DISC I Scores………………………………………………......65
Figure 4. Histogram of DISC S Scores……………………………………………….....66
Figure 5. Histogram of DISC C Scores………………………………………………….67
Figure 6. Histogram of PIAV Theoretical Scores……………………………………….68
Figure 7. Histogram of PIAV Utilitarian Scores………………………………………...69
Figure 8. Histogram of PIAV Aesthetic Scores…………………………………………70
Figure 9. Histogram of PIAV Social Scores…………………………………………….71
Figure 10. Histogram of PIAV Individualistic Scores…………………………………..72
Figure 11. Histogram of PIAV Traditional Scores……………………………………...73
1
CHAPTER 1. INTRODUCTION
Introduction to the Problem
Communication is vital to building business relationships and to building
organizations. Understanding the behavioral styles and values of oneself and of others is
the beginning to communication and to relationship building. Covey (2004) stated:
“When we listen with the intent to understand others, rather than with the intent to reply,
we begin true communication and relationship building” (p. 153). Understanding others
is made more difficult in a diverse business environment where business communication
involves transactions among diverse individuals.
Schein (1996) identified three distinct management cultures that form as a result
of work experience: the operator culture, the engineering culture, and the executive
culture. Each of these management cultures forms beliefs and behaviors as a result of
their unique experience and responsibilities. This research will focus on the beliefs and
behaviors of sales professionals from the operator culture compared to executives from
the executive culture.
Sales professionals learn much of what they need to be effective from experience
and from interacting with others within the organization. Sales professionals tend to be
pragmatic and often act to override policy that is more theoretical than practical. As
members of the operator culture, sales professionals are primarily concerned with
operational efficiency (Schein, 1996). Schein noted that those in the operator culture had
2
a need to work with others in order to perform their jobs effectively and are concerned
with the welfare of others.
On the other side, the executive culture tends to be more concerned with the
financial results of the organization than with the welfare of its employees (Schein,
1996). Executives, who often begin their careers as operators or engineers, rise to a level
within the organization that requires them to direct so many employees that it is
impractical for them to know and care for each employee personally. Executives have
better broad vision than operators, who tend to focus more narrowly, and have the
challenge of convincing operators of the merits of their strategies; otherwise, the
operators will see little value in following the executives and will resist (Thompson,
Strickland, & Gamble, 2007).
The globalization of business has expanded the opportunities for executives and
sales professionals to work with others from different regions of the world and requires
them to be able to adapt to even greater differences in values and behaviors. Saee (2008)
points out that “most of the difficulties in international negotiations … are due to cultural
differences” (p. 310). These cultural differences are the result of discrepancies in
behavioral and value preferences (Chung, Eichenseher & Taniguchi, 2008). Those
executives and sales professionals who have insight into differences in behavioral style
and values will be in a better position to foster healthy business communications.
Communication differences between men and women also serve to further
complicate communication. Tannen (1995) argued that “women and men tend to have
different speaking styles, much like people who grow up in different cultures … [and an]
understanding of linguistic style will make managers better listeners and more effective
3
communicators …” (p. 138). Women and men need to become more flexible
communicators in order to become more effective executives.
The aim of this research is to provide additional insight into thoughts and
behaviors of men and women sales professionals and executives. The data will be from
the results of assessments commonly used in training at businesses and organizations on
interpersonal skill and communication improvement.
Background of the Study
Individuals develop patterns of behavior as a result of their life experiences and
their innate personalities. The DISC Profile is a tool to measure an individual’s natural
and adapted levels of dominance, influence, steadiness, and compliance (McKenna,
Shelton, & Darling, 2002). The adapted score reflects how one reacts in ordinary
situations; the natural score is how one reacts when encountering stressful situations
(McKenna, Shelton, & Darling, 2002). Adapted scores may vary, but natural scores tend
to remain steady over time (McKenna, Shelton, & Darling, 2002). Results of the DISC
Profile can aid in predicting how one will react when communicating with others.
In addition to behavioral style, individuals’ interests, attitudes, and values play an
integral role in how they behave in situations (Palermo & Evans, 2006). The Personal
Interests, Attitudes, and Values Report (PIAV) measures and categorizes a person’s
values into six categories: Theoretical – one who has a quest for knowledge; Utilitarian, -
one who has a desire for efficiency; Aesthetic, one who seeks beauty and harmony;
Social – one who commits to community; Individualistic – one who strives to control his

4
or her own destiny; and Traditional – one who appreciates customs and beliefs (Suiter,
2008).
This study will look into whether there are correlations and differences among
behavioral style, as determined by DISC scores, and certain cognitive processes, as
measured by the PIAV Report, for men and women sales professionals and executives.
Statement of the Problem
According to the ASTD’s 2007 State of the Industry Report, the average
expenditure per employee for training in 2006 was $1,040 (HR Focus, 2008). Improved
understanding and use of training tools may help reduce cost and improve return on the
money invested in employee training: by decreasing the time to learn; by decreasing the
need for repeat training; and by improving the results of the training. Patterns of thought
and behavior that are identified for segments of the workforce may help to develop
strategies to improve communications and interpersonal relationships.
Many organizations have restructured to use teams to increase efficiency and
effectiveness (Robbins, 2005). Teams magnify the importance of healthy
communications and interpersonal relationships. Robbins (2005) identified a “climate of
trust” to be important to the context of team (p. 239). Knowledge of differences in
behavioral style and personal interests, attitudes, and values can aid in adapting one’s
personal communication preferences to align with the communication preferences of
others on the team.
5
Purpose of the Study
The purpose of this study is to focus on a microcosm of the business community –
men and women sales professionals and executives – to determine if there are differences
in behavioral styles and personal interests, attitudes, and values. Further, the results of
this study are intended to help businesses and organizations when facilitating
communications and relationships among these segments.
Rationale
This study intends to add to the literature by identifying relationships between
men and women and sales professionals and executives in their interests, attitudes,
values, and behavioral styles. The study will also contribute information regarding how
the DISC and PIAV assessments relate. While the literature review did uncover a
plethora of research on cognition and behavior, there is relatively little research
specifically on DISC and PIAV.
This research will provide information that may be used in organizational
communications and training to help explain similarities and differences in behavioral
styles and personal interests, attitudes, and values. The findings may also help when
designing and communicating compensation packages, performance feedback, creating
workgroups, and other similar functions within businesses and organizations that require
participation and acceptance among individuals.
6
Research Questions
This study will compare the behavioral styles and personal interests, attitudes, and
values among men and women sales professionals and executives. Scores on the DISC
assessment and the PIAV assessment will be used to answer the following questions:
Question 1: Is there a relationship between personal interests, attitudes, and values
and behavioral style?
Question 2: Do men and women sales professionals and executives share
behavioral styles?
Question 3: Do men and women have different personal interests, attitudes, and
values?
Question 4: Do sales professionals and executives have different behavioral
styles?
Question 5: Do sales professionals and executives have different personal
interests, attitudes, and values?
Significance of the Study
Improved understanding of behavioral styles and personal interests, attitudes, and
values can be used to structure communications between men and women sales
professionals and executives. Denhardt and Denhardt (2006) noted “a person attuned to
the rhythmic flow of the particular situation will have an advantage in energizing others
and will be a more effective leader” (p. 63). Newman, Guy, and Mastracci outlined a few
interpersonal skills that are often necessary for today’s workers:
7
[1] Verbal judo: Used in law enforcement to describe ‘tough talk’ banter [2] Caritas: Captures the caring function in human services [3] Game face: Used in law enforcement to signify displays of toughness [4] Compassion fatigue: Used in social work to describe the burnout resulting from too much caritas [5] Emotional management: Focuses on the worker’s job to elicit the desired emotional response from the citizen [6] Professional face: Used to describe the status shield that workers don to distance themselves emotionally from the interaction; it is a role-playing function [7] Emotional chameleon: The ability to switch expressions of emotions on and off [8] Spider sense: The ability to intuit the other’s emotional state [9] Rapport: The ability to establish a deep understanding and communication with the other [10] Emotional suppression: That which is required to disregard one’s own feelings [11] Emotional mirror: The ability to reflect and adopt the emotions of the other [12] Emotional armor: The ability to gird oneself against one’s own emotional response [13] Emotional equilibrium: Refers to maintaining a balance between extremes of emotion [14] Emotional anesthesia: The lack of any emotional response; may occur after prolonged exposure to extreme emotional stimuli [15] Emotional engagement: The ability to connect with other and empathize [16] Emotional mask: That which results when workers convincingly suppress their own emotions in order to act as if they feel a contradictory emotion, or no emotion (p. 7).
This research might provide insight into relationships between behavioral styles and
personal interests, attitudes, and values and aid in improving communication and
business relationships between men and women executives and sales professionals.
Definition of Terms
Behavior: The action one expresses as a result of cognitive processes or external
stimulus (Wilson, 2007).
8
DISC: Behavioral assessment used to measure an individual’s dominance,
influence, steadiness, and compliance behaviors (Furlow, 2000). This assessment is based
on the work of William Moulton Marston in his book, The Emotions of Normal People
(Suiter, 2008).
Natural style: Behaviors exhibited when an individual is not under pressure to
adapt (Suiter, 2008).
Adapted style: Behaviors exhibited that an individual perceives is needed to adapt
to work or environmental circumstances (Suiter, 2008).
PIAV: Personal interests, attitudes, and values assessment is used to identify the
passions and values that influence one’s behavior (Furlow, 2000). The assessment is
based on the works of Eduard Spranger in his book, Types of Men (Suiter, 2008).
Assumptions and Limitations
1. There is an assumption that respondents answered truthfully to the
assessments and did not display social desirability bias.
2. This study is limited to the assessment of the type of behavioral styles
provided by the DISC instrument and the type of personal interests, attitudes,
and values provided by the PIAV instrument.
3. Limitations include generalizing beyond executives and sales professionals to
other professionals.
Nature of the Study
This study will examine how individuals’ beliefs about what is important to them
influence their behaviors. The data will be gathered from the database of a consultant
9
company with twenty years of experience in working with businesses and organizations
to facilitate communications and teamwork. The psychometric instruments used are the
DISC assessment based on the works of Marston, and the PIAV assessment based on the
works of Spranger. Both self-assessments require respondents to choose answers that
most closely resemble how they would think and act in certain circumstances. This study
will select results from men and women sales professionals and executives to determine
if relationships exist: between behaviors and personal interests, attitudes, and values;
between men and women sales professionals and executives; and between all sales
professionals and executives. The dependent variables will be DISC results and PIAV
results; the independent variables will be gender and professional occupation. The factual
data to be collected on individuals will be gender and occupation.
Organization of the Remainder of the Study
Chapter 1 includes the introduction to the problem, background of the study,
statement of the problem, purpose of the study, rationale for the study, research
questions, significance of the study, definition of terms, assumptions and limitations, and
nature of the study. Chapter 2 reviews the literature on behavioral theory, cognitive
theory, cognitive-behavioral theory, humanistic theory, moral development theory,
ethical theory, DISC literature, and PIAV literature. The purpose of chapter 2 is to
provide the reader with a background in the theories of behavior and cognition. Chapter 3
outlines the methodology for the study. Chapter 4 will present the findings of the study
using the Statistical Package for the Social Sciences (SPSS) software. Chapter 5 will

10
discuss the implications for the field of organization and management and
recommendations for future research.

11
CHAPTER 2. LITERATURE REVIEW
Introduction
Industrial Psychology is based on “a thoroughgoing analysis of the psychological
factors of work in its many forms” (Brotherton, 1996, p. 50) While Scientific
Management considers the organization, industrial psychology focuses entirely on the
individual (Millward, 2005). Industrial psychologists study and work with “(1) Personnel
Selection; (2) Performance Appraisal; (3) Training Employees and Managers; (4)
Motivation, Attitudes, and Job Satisfaction; (5) Leadership and Supervision; (6)
Communication and Organizational Behavior; (7) Fatigue, Monotony, and Working
Conditions; (8) Accidents and Safety; (9) Engineering Psychology; (10) and Consumer
Psychology” (Peters, 1968, p. 118). Psychology applied to business processes can
facilitate communications and interpersonal relationships.
The literature review for this study provides a background into psychological,
developmental, and ethical theory to help the reader relate theory to individuals’ personal
interests, attitudes, and values as well as how these may influence patterns of behavior.
The literature search resulted in finding two dissertations on DISC and numerous studies
published in refereed journals on behavioral style and values. The scarcity of studies
comparing DISC and PIAV may be an opportunity for further research.

12
Theory
Classical Conditioning
Organizations strive to find methods to motivate employees to adopt behaviors
that are consistent with organizational goals and that result in increased productivity.
Pavlov (1927) explained how behavior can be manipulated by linking a desired behavior
with an existing behavior to achieve an anticipated response. Pavlov’s classical
conditioning theory was based on his experiments with dogs’ unconditional response
(salivation) to an unconditional stimulus (meat powder). Pavlov was able to train the dogs
to respond (conditional response) to a bell (conditioned stimulus) by associating the bell
with the meat powder. This landmark study suggested that new behavior can be created
when an individual links the new behavior with an already established stimulus.
Shimp (1991) explained that classical conditioning in individuals occurs when
connections among events in ones’ environment are made. A study of classical
conditioning in advertising found that an individual’s attitude concerning the conditioned
stimulus is influenced by awareness of the process (Priluck & Till, 2004). When aware of
the relationship between a conditional stimulus and an unconditional stimulus,
individuals are more likely to form a favorable attitude towards the conditioned stimulus.
Studies have also demonstrated that this conditioning in humans is persistent and has
lasting effects (Baeyans, Geert, & Eelen, 1988; Grossman & Till, 1998).
Other studies of classical conditioning have been studied to determine its effect in
humans. One study found that persuasive communication can be enhanced by pairing the
message - conditioned stimulus - with another pleasant condition - unconditioned
13
stimulus (Petty, Cacioppo, Sedikides, & Strathman, 1988). Laird (1974) found that
subjects considered cartoons to be more humorous when they were smiling than when
they were frowning, suggesting individual’s expressive behavior affects the quality of
their experience. Another study found that when subjects nodded their heads vertically
they agreed with the content of a radio broadcast more than other subjects who nodded
their heads horizontally (Wells & Petty, 1980). These studies demonstrated that attitudes,
in addition to behaviors, can be affected by classical conditioning.
Operant Conditioning
B. F. Skinner (1969) expanded the field of behavioral psychology with his
research in reinforcement – operant conditioning. Operant conditioning is a variant of
behavioral theory that alters the probability of a desired response by scheduling positive
and negative reinforcement. Positive reinforcement uses a stimulant that serves to
strengthen the response; negative reinforcement uses a stimulant that strengthens the
response when the stimulant is removed (Wittig, 2002).
In operant conditioning reinforcement can be continuous, interval, or ratio
(Skinner, 1971). Continuous reinforcement provides reinforcement for every response. A
problem with continuous reinforcement is that the subject is thought to become resistant
to the reinforcement and the desired behavior will be discontinued. A regular paycheck is
an example of continuous reinforcement (Bushardt, Lambert, & Duhon, 2007).
Interval reinforcement can be fixed or variable and is thought to mitigate behavior
from becoming extinct (Skinner, 1971). When fixed, reinforcement is set for certain
times; when variable, reinforcement times differ. Ratio reinforcement can also be fixed or
14
variable (Skinner, 1971). Fixed ratios provide reinforcement when a predetermined goal
or amount of work is achieved; variable ratios provide reinforcement for differing goals
or amounts of work.
Some research has shown that variable ratios result in increased performance
(Fisher, Maines, Peffer, & Sprinkle, 2005; Fraser, 2004). Other research with sales
professionals suggested the business environment dictate whether the compensation is
continuous (salary), fixed or variable intervals (bonuses and commissions), or fixed or
variable ratios (amount of bonuses and commissions) (Shipley & Kleiner, 2005).
Cognitive Theory
A major difference between the cognitive approach and the behavioralist
approach is the cognitive approach focuses on how individuals make decisions instead of
how they react to environment stimuli (Mischel & Mishel, 1976; Bandura, 1977).
Cognition is a step that humans add between the stimulus and the response (Marston,
1928).
Cognitive psychology is concerned with the way individuals procure, assimilate,
and act on information from the environment and can be used to explain how people
develop interests, attitudes, and values (Mandler, 2007, p. 189). Aaron Beck, considered
the founder of cognitive theory, focused on thoughts as well as feelings (Weinrach,
1988). Beck studied depression and recognized three common patterns of negative
thoughts people have: negative thoughts about themselves, negative thoughts about the
world, and negative thoughts about the future (Beck, 1961). Beck found depressed people
were prone to attribute negative conditions to their own inadequacies and shortcomings.
15
Depressed people also exaggerated the magnitude of negative conditions in the world and
anticipated conditions to be even worse in the future.
Martin Seligman (1990) studied how optimists and pessimists thought about
events. Seligman identified that pessimists shared the negative thought patterns of
depressed people: pessimists felt responsible for negative events, and thought negative
events were pervasive and permanent. Optimists, on the other hand, were prone to accept
personal responsibility for positive events, but not for negative events. Optimists were
also better able to compartmentalize; for example, negative work events would not affect
their happiness at home or at social functions. Finally, optimists had a pattern of
anticipating a future that would be better than the present.
Cognitive patterns have also been found to affect managerial ethical decision-
making. Groves, Vance, and Paik (2008) studied 200 managers across multiple
organizations and industries to look at whether linear thinking, nonlinear thinking, or a
combination of the two affected their ethical decisions. Linear thinking style was defined
as a preference for “(1) attending to external, tangible data and facts, and (2) processing
this information through conscious logic and rational thinking to form knowledge,
understanding, or a decision for guiding subsequent action” while nonlinear thinking
style was defined as a preference for “(3) attending to internal feelings, impressions, and
sensations; and (4) processing this information through intuition” (p. 309). Groves,
Vance, and Paik found that balanced thinkers, those who utilized linear and nonlinear
thinking, were the ones most likely to consistently produce ethical decisions because of
their ability to consider a wider range of alternatives than either linear or nonlinear
thinkers.
16
Cognitive Behavioral Theory
Cognitive behavioral theory holds that learning can occur as the result of
unobservable stimuli (Tolman, 1932). Albert Ellis, considered to be the founder of
cognitive behavioral theory, developed rational-emotive therapy because he recognized
shortcomings of cognitive approaches (Johnson, Neilson, & Ridley, 2000). Ellis’s (1987)
rational-emotive behavior therapy combines cognition, emotion, and behavior. Rational-
emotive therapy is based on the premise that “activating events (A) do not directly cause
emotional and behavioral consequences … beliefs (B) about these events are instead the
most critical causes of feelings and actions” (Haaga & Davidson, 1993, p. 215). Tolman
theorized that random stimuli can be connected to result in a planned course of behavior.
Cognitive behavioral theory connects thoughts and emotions with behaviors.
Cognitive behavioral strategies have proven useful in self-leadership, a process
where individuals control their own behavior (Neck & Houghton, 2006). Self-leadership
uses three strategies: behavior-focused strategies, natural reward strategies, and
constructive thought pattern strategies (Manz & Neck, 2004; Manz & Sims, 2001).
Behavior-focused strategies occur when one analyzes and understands how his or her
behavior occurs. Natural reward strategies are ways an individual can use self-reward to
increase the value of goal achievement. Constructive thought pattern is the process of
challenging dysfunctional beliefs and assumptions.

17
Humanistic Theory
Humanistic psychology began in the 1950s to study the essence of being a person
(Rennie, 2007). This study took into account “cognition, emotion, feeling, will, morality,
ethics, and aesthetics, as well as intrapersonal, interpersonal, and transpersonal
relationships” (p. 1). Humanistic psychology has been used to help explain what
motivates one’s behavior.
Abraham Maslow conceptualized a theory of human motivation that considered
human needs (Maslow, 1943). Maslow’s Theory of Human Motivation recognized five
levels of needs common to all humans: physiological needs, safety needs, love needs,
esteem needs, and self-actualization. Maslow ranked these needs in order of importance:
physiological needs refer to needs such as food, water, and sleep; safety needs refer to
needs such as shelter and protection; love needs refer to the need to belong to a group that
loves; esteem needs are concerned with the need to feel confident about one’s abilities
and importance; and finally self-actualization is the fulfillment on one’s potential (Rouse,
2004). Lower level needs take precedence and must be satisfied before an individual
seeks to satisfy higher level needs. For example, one who is hungry – a physiological
need - will be motivated to satisfy this hunger before seeking a safe environment.
Douglas McGregor’s book, The Human Side of Enterprise, continued Maslow’s
view of human potential and hierarchy of needs (O’Connor & Yballe, 2007). McGregor
(1960) looked into the beliefs management has regarding employees’ attitudes and
capabilities. McGregor classified managers’ motives in dealing with employees into
Theory X and Theory Y: Theory X managers’ attitude towards employees is that they are
unmotivated; Theory Y managers’ attitude is that employees are motivated and
18
competent. McGregor’s theory is an example of humanistic theory applied to
management.
Herzberg (1968) considered what was important to motivate employees in his
two-factor theory. Herzberg’s theory was developed from the results of his qualitative
study which was conducted by interviewing engineers and accountants. From these
interviews, Herzberg determined that employees are motivated by two factors: motivation
factors such as accomplishment, recognition, responsibility, and teamwork; and hygiene
factors such as job security, salary, company policy, and management style. Motivators
tap into what employees bring to the organization and engage employees; whereas,
hygiene factors are what the company provides employees to keep them comfortable
(Utley, Westbrook & Turner, 1997).
Which approach is preferable to those seeking to change their behavioral patterns
– behavioral; cognitive; cognitive behavioral; or humanistic – has been found to vary,
depending on the individual (Helweg & Gaines, 1977). Helweg and Gaines studied
individuals’ preference for a directive approach (cognitive behavioral) or nondirective
(humanistic) approach to behavioral change and found that preference depended on the
behavioral style of the individual seeking change: those who preferred a directive
approach were found to be more dogmatic and externalized; those who preferred a
nondirective approach were less dogmatic and externalized. This study demonstrated that
grouping individuals with similar behavioral styles is preferable over grouping
individuals with differing behavioral styles.
19
Kohlberg’s Moral Development Theory
Kohlberg’s moral development theory is based on viewing moral development
progressing in a hierarchical manner (Velasquez, 2006). Kohlberg’s (1981) stages of
moral development help to explain how values are formed. Kohlberg’s theory consists of
six stages that are grouped into three levels: pre-conventional, conventional, and post-
conventional:
I. Preconventional Level
At this level, the child is responsive to cultural rules and labels of good
and bad, right or wrong, but interprets these labels either in terms of the
physical or the hedonistic consequences of action … The level is divided
into two stages:
Stage 1: The punishment-and-obedience orientation …
Stage 2: The instrument-relativist orientation …
I. Conventional Level
At this level, maintaining the expectations of the individual’s family,
group, or nation is perceived as valuable in its own right … At this level,
there are the following two stages:
Stage 3: The interpersonal concordance or ‘good boy – nice girl’
orientation …
Stage 4: The ‘law and order’ orientation …
II. Postconventional, Autonomous, or Principled Level
At this level, there is a clear effort to define moral values and principles
that have validity and application apart from the authority of the groups or

20
persons holding these principles and apart from the individual’s own
identification with these groups. This level also has two stages:
Stage 5: The social-contract, legalistic orientation, generally with
utilitarian overtones …
Stage 6: The universal-ethical-principle orientation … (Kohlberg, &
Hersh, 1977, p. 55).
Kohlberg’s theory helps one to understand how values emerge at different levels of moral
development.
Brady and Hart (2007) used Kohlberg’s moral development regarding duties,
responsibilities, ideals, goals, values, and interests to assess moral maturity in business
activity. These authors suggested identifying business behavior in terms of Kohlberg’s
stages of development is more useful than a “right or wrong” evaluation (p. 408). Rest,
Narvaez, Bebeau, and Thomas (1999) developed a three stage version of Kohlberg’s
model to make it more useful:
(1) Personal interest (Kohlberg’s original stages two and three)
(2) Maintaining norms (Kohlberg’s stage four)
(3) Postconventional thinking (Kohlberg’s stages five and six) (pp. 36-58).
During stage one, interests, attitudes, and values are concerned with self and close
associates; during stage two, one expands and becomes more concerned with society; and
during stage three, one begins to think independently (pp. 36-58).
It has been shown that individuals considered to be ethical may differ in their
judgment as to what is moral (Forsyth, 1980; Anton, 1990). Rahim, Buntzman, and White
(1999) explored the relationship of the stage of moral development and the style of
21
handling interpersonal conflict with a sample of employed business students. They found
that students in the post-conventional stage used more integrating and less dominating or
avoiding styles than conventional methods; those in the conventional stage used more
integrating and less dominating and avoiding styles than pre-conventional approaches;
conventional styles were more compromising than pre-conventional methods; and post-
conventional styles were more compromising than pre-conventional.
Gilligan (1982) argued that men and women differ in terms of moral reasoning
and that Kohlberg’s model was biased in favor of men. Others have argued that women
are more ethical than men (Sikula and Costa, 1994) and engage in more participative
management (Rosener, 1990). Kracher and Marble (2007) measured cognitive moral
development using the Sociomoral Reflective Objective Measure and found that high
femininity was associated with significantly lower cognitive moral development scores
among business professionals.
All professions have factors that are contrary to ethical standards (Izzo, 2000;
Ponemon & Gabhart, 1994). Henson and Dubinsky (1986) argued that sales positions
tend to attract people with low moral development. Others have argued that the
commissioned compensation plan causes the sales person to put their interest above the
interests of the client (Posner & Schmidt, 1984; Kurland, 1991).
Ethics of Care Theory
Gillian’s (1982) ethics of care theory allows for the inclusion of situational
variables in determining ethical behavior. Ethics of care is “an ethic that emphasizes
caring for the concrete well-being of those near to us” (Velasquez, 2006, p. 60). The
characteristics of the situation override rules and regulations (White, 1998). In ethics of
22
care, the results of the decision are more important than following formal ethical rules
(Milner, Mahaffey, Macauley & Hynes, 1999).
Ethics of care has been used to attempt to explain the differences between men
and women in making ethical situations: females typically favor care; males typically
favor rights and justice (Donleavy, 2008). Gilligan and Attanucci (1988) found that study
participants generally consider either care or rights and justice, but not both. Studies have
also confirmed a correlation among gender and moral perspective (Wark & Krebs, 1996).
There is conflicting evidence on whether there is a true gender difference in regards to
ethical decision making (Jaffee & Hyde, 1996).
Utilitarian Theory
Utilitarian ethical theory considers an action is justified if it is better than the
alternatives (Pratt, 1994). There are two types of utilitarians: act and rule utilitarian. An
act utilitarian makes decisions based on what provides the greatest social good; a rule
utilitarian considers the rule under which the action falls, even when the rule does not
lead to the greatest societal benefit (Barry, 1979).
Kantian Theory
Kant, regarded as the most prominent deontologist, based moral tests on what he
termed categorical imperatives, which included three rules: universalizability,
reversibility, and dignity (Pratt, 1994). Universalizability is described as an act that one
would consider appropriate for everyone; reversibility is when one would welcome an act

23
to be done to him; and dignity is when one acts in a manner consistent with the interests
of the other.
John Rawl’s Theory of Justice
John Rawls’ theory of justice is based on two principles: “(1) that each person has
an equal right to the most extensive basic liberties compatible with similar liberties for
all, and (2) social and economic inequalities are arranged so they are both to the greatest
benefit of the least advantaged persons, and attached to offices and positions open to all
under conditions of fair and equality of opportunity” (Helms & Hutchins, 1992, p. 38).
Rawls (1971) theory of justice differs from utilitarian justice in that it “does not interpret
the right as maximizing the good” (p. 30).
The DISC Behavioral Profiling Tool
DISC History
Grouping behavior into four categories is thought to have originated with
Hippocrates’ identification of four behavioral types: sanguine, melancholic, choleric, and
phlegmatic (Furlow, 2000). Carl Jung, believed to be the first researcher to scientifically
study behavior, labeled these four behavioral types as Intuiter, Thinker, Feeler, and
Sensor (Keirsey & Bates, 1984). Various models grouping behaviors into four categories
have been used throughout the centuries (McAlister & Darling, 2005).
Leadership studies have found that two behavioral styles – task oriented and
relationship oriented – account for a large percentage of variance in leadership behavior
24
(Fleishman, 1953; Stogdill, 1974; Vroom, 1976). How a sales manager manages has
changed from controlling, task oriented, to coaching, relationship oriented (Bridges,
1994). Studies have indicated that a relationship oriented leadership style that is dominant
and warm is best for managing salespeople (Buzzota-Lefton, 1982; Hite & Bellizi, 1986).
Shoemaker (2003) found that job clarity and satisfaction is increased when sales
managers vary their leadership style to the individual sales person. Research has also
found that equal treatment is not required for trust between managers and salespeople
(Strutton, Pelton, & Lumpkin, 1996).
The DISC model began with the theoretical work of William Moulton Marston
during the 1920s (Wilson, 2007). Marston, a Harvard trained psychologist, used the trait
approach to describe individual differences (Geier, 1979). According to Geier, Marston’s
work contributed to the advancement of applying an understanding of human behavior to
work and personal situations in four ways:
1. Marson theorized that human behavior could be studied on a two axis model
according to a person’s action in a favorable or an unfavorable environment.
2. He provided observational methods to demonstrate how four primary
emotions are related to a logical analysis of neurological results.
3. Marston introduced a hypothetical construct and provided meaningful
terminology to describe the four primary emotions.
4. He clustered traits for each of the four emotions (p. viii).
These four contributions are the basis for the DISC assessment and warrant further
elaboration.

25
The two axis model explains a person’s natural style when facing stressful
situations and a person’s adapted style when engaging in normal, non-stressful situations
(Straw, 2002). This model recognizes an individual’s ability to adapt to situations
(Marston, 1979). The two axis model explains variations in behavior depending on how
an individual interprets the environment.
Stimulus-response theory, based on the work of Pavlov (1927), demonstrated
conditioning a salivary response in dogs to the stimulus of a bell. Marston’s (1979) three-
stage model considers another step in the process, the role of the four primary emotions
in interpreting the stimulus before responding. Geier (1979) credits the three-stage model
to “assist[ing] future researchers to discover laws of behavior that permit one to predict,
control, and understand human behavior” (p. xi). Assessments are the tools used to
identify the emotions bridging the stimulus and response.
Finally, Marston (1979) provided a hypothetical construct and clustered the four
primary emotions: 1) compliance, 2) dominance, 3) inducement, 4) and submission. This
construct and clusters of traits prevents one from attributing too many assertions about
how an individual will respond in all situations (Geier, 1979). Although Marston did not
use a factor analysis to cluster traits, Geier found the following traits to correlate together
equal or greater than r=.60:
Dominance Inducement Submission Compliance
force of character persuasion easy mark resignation
daring convincing sweetness fear of god
competitive attractive gentleness humility
restless charming willingness harmony
26
Figure 1: Representative listing of trait clusters, demonstrating four projected emotions
(p. xiv).
The development of the DISC psychometric design was based on interpreting and
incorporating the work of Marston into tools to provide a measure of behavior,
temperament, and character (Ingram, 2004). It is estimated that DISC assessments have
been used by more than 30 million people since it was used by the U.S. Army for
recruitment purposes prior to World War II (Barbian, 2001).
DISC Assessment
Geirer (1992) acquired the copyright of Marston’s works in the 1960s and
founded Performax, the first commercial distributers of DISC instruments. DISC
instruments are used to measure individuals’ behavioral preferences for Dominance –
how one responds to problems or challenges; Influence – how one influences others to his
or her point of view; Steadiness – how one responds to the pace of the environment; and
Compliance – how one responds to rules and procedures (Target Training International,
2009).
DISC assessments differ from the Myers-Briggs assessment, a measure of
personality thought to remain constant, by measuring a person’s behavioral preference, a
measure an individual is thought to be able to change to adapt to circumstances (Straw,
2002). DISC assessments are used with management and sales for teambuilding,
communication, and conflict management (Inscape Publishing, 2008).
The DISC assessment requires a voluntary response from a participant to
adjectives that the participant believes best describes him or her from a five point ordered
27
response scale (Inscape Publishing, 2008). An individual’s score is weighted and used to
plot where the behavioral preferences fall. DISC indicates how an individual will react to
the environment (Suiter, 2008).
DISC in the Literature
Pay and personality
Turnasella (2002) looked into how personality can be incorporated in pay plan
design and communications. Turnasella advocated for designing and communicating the
features of compensation plans to align with the personalities of employees. For example,
compensation managers need to incorporate a different design and delivery for a plan
designed for employees with a high aversion to risk than for those with a low aversion to
risk. Turnsella recommended compensation managers make use of personality profiling
tools to help customize how to design and communicate the details of compensation
plans.
Turnasella (2002) differentiated the DISC model, based on Marston’s research on
emotional responses, from models to define personality, such as the Myers-Briggs, based
on the works of Carl Jung. Turnasella explained how DISC can be used to predict how
the four personality types differ in dealing with the environment by taking either an
active role or a passive role.
Turnasella (2002) described those who score high for Dominant (D) as
“prefer[ing] to take active roles in hostile environments … unafraid of taking risks …
initiate action … [and] love variety and crave adventure” (pp. 50-51). High-D
personalities, as Turnasella pointed out, want to have control over their rewards;
28
therefore, they should have input in establishing goals, goals should be based on
individual efforts, earning opportunities should be unlimited, and they can have pay-at-
risk to performance. Turnasella suggested communicating the challenge of the goals to
the high-D and directly pointing out how compensation plans work.
Those who score high for Influential (I) are characterized as “competitive when
striving for recognition and rewards … enjoy their freedom … [and] tend to lose
themselves in social relationships” (Turnasella, 2002, p. 54). Turnasella recommended
communications that inform high-Is of their role and how they need to work and interact
with others to meet their goals.
Unlike high-Ds and high-Is, supportive personalities (S) have a higher need for
security and stability (Turnasella, 2002). Turnasella noted that high-Ss do not do well
with the risk associated with a variable compensation plan and would be more receptive
to a plan that has historical data to support its viability. Turnasella added that these
people respond to rewards that consider seniority, loyalty, and dependability.
Finally, the compliant personality (C) is the most risk averse of the personality
types and would be least responsive to a variable compensation plan (Turnasella, 2002).
Turnasella explained that high-Cs “seek to avoid situations of ambiguity and independent
choice that could reflect negatively on them … want to follow precise instructions that do
not vary … [and] want to know all the details and proceed strictly according to the book”
(p. 57). Turnasella suggested the compensation plan be communicated in a manner that
lets the high-C know the details about how the goals are set, measured, and rewarded.
Turnasella’s (2002) research provides an example of how to anticipate the
behaviors of the different personality types when designing and communicating a

29
compensation plan. The underlying theme is that people “think differently and react
differently” (p. 59). Turnasella provided guidance on how to use DISC scores to design
and to communicate compensation plans to employees based on their behavioral
preferences.
Conflict management
Darling and Walker (2001) looked at behavioral style as a way for individuals to
understand themselves and others in order to manage conflict in a manner that serves to
minimize the cost and to maximize the benefit of conflict. The authors stated that conflict
is indicative of “differences of opinion, alternatives which needed to be considered, and
opposing points of view to be studied” (p. 230) and that if managed correctly, conflict
can aid the growth and development of the organization.
The behavioral model Darling and Walker (2001) used was based on clusters of
behaviors relating to an individual’s assertiveness and responsiveness. Darling and
Walker defined assertiveness as the directness and forcefulness with which one confronts
during conflicts; responsiveness was defined as the degree of emotional expression. Four
behavioral styles result from the combination of assertiveness and responsiveness:
“relater, analyzer, director, or socializer” (p. 232).
Relaters are less assertive and more responsive (Darling & Walker, 2001). These
individuals share traits similar to high-Ss in the DISC model. For example, the authors
described relaters as “cooperative, loyal, supportive, diplomatic, patient, easygoing,
respectful … [and] most likely to use empathy and understanding in interpersonal
problem-solving and conflict situations” (pp. 232, 234). Relaters generally like to avoid
conflict because they place high value on relationships.
30
Analyzers are less assertive and less responsive (Darling & Walker, 2001). These
individuals are recognized as “logical, thorough, serious, systematic, critical, precise,
prudent … industrious, objective and well organized … [and] self-controlled and
generally cautious people who prefer analysis over emotion” (p. 234). Analyzers share
traits common to high-Cs in the DISC model. Darling and Walker pointed out that
analyzers are reluctant to compromise in conflict situations.
Directors’ behavioral style is less responsive and more assertive (Darling &
Walker, 2001). These individuals are generally viewed as “independent, candid, decisive,
pragmatic, determined, efficient, objective … task oriented … firm and forceful … [and]
confident and competitive” (p. 234). Directors share similarities with high-Ds in the
DISC model. Darling and Walker warned that directors can be impatient and extremely
forceful in conflict situations.
Finally, the behavioral style of socializers is more responsive and more assertive
(Darling & Walker, 2001). These individuals could be described as “imaginative,
friendly, enthusiastic, outgoing, excitable, persuasive, spontaneous … tend to look at the
big picture … often take fresh, novel and creative approaches to problems … [and] are
willing to take risks in order to seize opportunities” (p. 234). Socializers are closest to
high-Is in the DISC model. Socializers often use their charm and creativity in conflict
situations.
Darling and Walker (2001) recommendations were for individuals to be adept at
recognizing their own and the behavioral style of others and to use this knowledge to
make adaptations when conflict occurs. The authors suggested the benefits to considering
behavioral style would lead to reduced conflict and tension.

31
DISC compared to the Herrmann Brain Dominance Instrument
Wilson (2007) explored the relationship between the Herrmann Brain Dominance
Instrument (HBDI) and the Extended DISC. The author’s purpose was to determine if
there was a relationship between thinking – a measure of the HBDI – and behavior – a
measure of the DISC. Wilson used a survey to accumulate and analyze expert opinion as
well as a sample set of HBDI and Extended DISC assessments.
Wilson’s (2007) results did not confirm the relationship between thinking style
and behavioral style, a theoretical relationship thought to have originated in Majjhim
Nikaya (Buddhist text): “sow a thought, reap an act” (Banerjee, 1999, p. 79). Wilson
found that: “Thinking preferences tend to be more innate, and remain stable over time;
whereas, behavior preferences are more flexible and changeable” (p. 162). Wilson also
found that individuals have distinctly different preferred behavioral styles and preferred
thinking styles.
DISC as an executive coaching tool
Ingram (2004) used DISC to measure the change in middle managers’ leadership
skills as a result of coaching. Ingram considered coaching to be successful if the
following conditions were met: “(a) lower levels of dominance, (b) higher levels of
influence, (c) higher levels of steadiness, and (d) lower levels of caution” (p. 8). Thus,
managers were coached to increase their Influencing and Social behaviors.
Ingram’s (2004) pretest found that a larger than expected number of middle
managers scored higher for a “C” style of behavior, rather than the expected “D” style.
32
The similarities between the “C” and “D” styles are that they both view their environment
as stressful; however, the “C” style is less assertive in response than is the “D” style.
The posttest found that coaching resulted in reducing “D” and “C” behavior
(Ingram, 2004). Coaching served to teach the middle managers to manage in a less
assertive manner. This study suggested that organizations that wish to move from
command-and-control to employee empowerment can benefit from coaching to change
behavioral style. DISC in this study was used as a tool to measure the effects of coaching.
Personal Interests, Attitudes and Values Report (PIAV)
PIAV History
Eduard Spranger, a German educator and philosopher who lived from 1882-1963,
described six different attitudes that make up one’s personality in his book Types of Men
(Encyclopedia Britannica Online, 2009). Spranger’s (1928) six attitudes are:
1) The Theoretical Attitude (driven by a passion for discovering TRUTH and
KNOWLEDGE). The primary motivator behind this attitude is knowledge for
the sake of knowing, continuing education and learning. People who are
motivated by this attitude take a “cognitive” approach in meeting challenges –
identifying, analyzing and clarifying problems and options.
2) The Utilitarian Attitude (driven by a passion for RETURN ON
INVESTMENT of time, talent and resources). This attitude gives focus to the
practical affairs of life. Efficient use of time and money will be of great
importance to those with this primary attitude.
33
3) The Aesthetic Attitude (driven by a passion for FORM, HARMONY,
BEAUTY, and BALANCE). People with this primary attitude look for
balance between their internal and external worlds. They seek self-realization
and self-actualization, and relate to their experiences mainly from a subjective
point of view.
4) The Social Attitude (driven by a passion to ELIMINATE HATE and
CONFLICT). Those with this primary attitude are motivated by their love of
people. They seek to promote and contribute to others’ well-being through
giving of their focus, time, talent, and resources.
5) The Traditional Attitude (driven by a passion for THE HIGHEST VALUE in
LIFE). Principles are highly important to people with this primary attitude.
They make decisions from a solid set of principles that they use as their
guiding forces in life. They will sacrifice all to be true to their belief system.
6) The Individualistic Attitude (driven by a passion for POWER). People with
this primary attitude are driven by an inherent desire to lead and control the
destiny of self and others. They strive to advance their position to attain the
highest power. Power and control is demonstrated through one of the five
values (such as Utilitarian – power through accumulation of wealth)
(Bonnstetter, 1999, p. 1).
Stewart (1999) pointed out that people possess a mixture of the different attitudes, but
tend to gravitate towards certain attitudes.
The PIAV is an assessment to determine the magnitude of each of the six attitudes
(Allport, Vernon, & Lindzey, 1960). Respondents rank order six phrases from 1=most
34
like me, to 6=least like me to derive a score for each of the six values (attitudes)
(Klassen, 2004). Klassen used a sample of 1130 responses (49.5% female and 50.5%
male) and found high reliability for all six values with Cronbach’s alpha ranging from .7
to .84. The assessment is self-administered and provides information on the relative
strength of each value (Robinson, Shaver, & Wrightsman, 1991).
PIAV in the Literature
Personal values and leadership effectiveness
Bruno and Lay (2008) evaluated the relationship between personal values balance
and leadership effectiveness in a group of Brazilian executives. The researchers used a
closed instrument of the rank order type to evaluate personal values and to identify the
predominant leadership style and effectiveness. The findings were that the executives
were more likely to have economic and theoretical personal value profiles. The study also
found that the executives were not flexible in their leadership styles and presenting styles.
The research did have a positive correlation for a balance in personal values and
leadership effectiveness.
Values congruence
Cazier, Shao, and Louis (2007) looked into the effect of value congruence and
trust on influencing consumers to share personal information. The researchers had 775
subjects rate their perceived value congruence, their trusting beliefs, and the types of
information they would be willing to disclose. The study found that value congruence
increased the trust of consumers for the organization and increased their willingness to
disclose personal information. This study demonstrated that value congruence between
35
organizations and their clients is beneficial when conducting business. The PIAV is a tool
that can aid in identifying and aligning values.
Financial planners
Bonnstetter (2006) collected data on the values, behaviors, and skills for 254
successful financial planners. Inclusion criteria were that the financial planner have 10 or
more years in the financial service industry and earn $250, 000 to $1,000,000 annually.
The subjects were separated by income into two groups: (1) those earning $250,000 to
$500,000 and (2) those earning $500,000 to $1,000,000.
Among the findings were that of those in the $500,000 to $1,000,000 group 81%
had Utiliarian above the mean and 67% had Individualistic above the mean (Bonnstetter,
2006). Among the findings for the $250,000 to $500,000 group were that 80% had
Utilitarian above the mean and 80% had Individualistic above the mean. These findings
suggest that individuals with a high Utilitarian and a high Individualistic type may be the
most suitable for the financial planning profession.
Potter (1999) also looked into the attitudes of top performing financial planners,
defined as making over $250,000 from fees and commissions, using the PIAV
assessment. Potter noted that high turnover among those entering the financial services
industry to be a costly problem approaching approximately 82 percent to 87 percent. The
purpose of identifying characteristics of those with potential was to reduce turnover in
order to save millions of dollars in recruiting and training.
Potter’s (1999) study revealed the following:
1.) The most important attitude is utilitarian.
2.) The theoretical attitude is a significant ingredient in the success formula.

36
3.) The social attitude is critical for success because it aids in building trust and
developing strong relationships (Potter, 1999, p. 8).
Potter’s results were consistent with Bonnstetter (2006) in regards to utilitarian and
theoretical attitudes being correlated with successful financial sales people.
Personal values in consumer marketing
Vinson, Scott, and Lamont (1977) looked into whether personal values can assist
marketers in determining consumer choice behavior. The researchers choose subjects
from two culturally distinct regions of the United States to determine if values are
culturally and socially learned.
Value acquisition was “arranged in a hierarchical network, [are] referred to as
global or generalized personal values, domain-specific values, and evaluations of product
attributes” (Vinson, Scott, & Lamont, 1977, p. 45). These three levels were considered to
be mutually dependent and partially consistent. This three level model was considered to
explain the cultural conditioning of value acquisition.
Global values are “more abstract and generalizable than less centrally held
beliefs” and “form the central core of an individual’s value system” (Vinson, Scott, &
Lamont, 1977, p. 45). Global values are enduring and consistent with one’s ideal self and
behavior. Individuals generally hold a few dozen global values.
Domain-specific values are acquired through experience (Vinson, Scott, &
Lamont, 1977). One’s interpretation and reaction to the environment influence the
development of domain-specific values. For example, individuals living during an
economic depression may be more likely to adopt utilitarian values than if the economy

37
were more robust. These beliefs are also relevant to social, religious, and other
environmental influences. These values are thought to number in the hundreds.
The final level in the network is product attribution beliefs and values. These
beliefs concern the desirable attributes of a product and are the basis of most of the
expectancy-value research (Vinson, Scott, & Lamont, 1977). Product attribute beliefs are
less centrally held and are estimated to be in the thousands.
The results of this study help to validate the theory that “values are centrally held
cognitive elements which stimulate motivation for behavioral response” (Vinson, Scott,
& Lamont, 1977). The researchers found that global values, domain-specific values, and
product attributes were consistent with choice of a product or service. These findings
suggest a correlation between values and behavior.
Personal values in leadership
Tickle, Brownlee, and Nailon (2005) looked into whether a link exists between
personal beliefs and the leadership behaviors associated with transformational and
transactional leadership. This study analyzed research on personal beliefs and the
transformational-transactional leadership to identify links in the areas of beliefs,
metacognition and cognition, and implications for training.
Tickle, Brownlee, and Nailon (2005) described transformational leaders as leaders
who act “as facilitators of learning in organizations, and therefore their beliefs, cognitions
and behaviors can be explored in the same manner as teachers in classroom settings” (p.
706). By contrast, transactional leadership was defined as “a performance-based system
where followers are rewarded or disciplined on the basis of work performance” (p. 706).

38
The basis of transactional leadership is an exchange between the leader and follower to
meet each others’ needs.
The researchers found a strong conceptual link between certain beliefs and
behaviors associated with transformational leadership and a strong conceptual link
between other beliefs and behaviors and transactional leadership (Tickle, Brownlee, &
Nailon, 2005). The authors suggested this research supports training to change beliefs in
order for leaders to adopt behaviors consistent with transformational leadership.
England and Lee (1974) identified seven ways values affect the behavior of
leaders while looking for patterns of values of managers in the U. S., Australia, India, and
Japan which were predictive of success:
1.) Personal value systems influence a manager’s perception of situations and
problems he faces.
2.) Personal value systems influence a manager’s decisions and solutions to
problems.
3.) Personal value systems influence the way in which a manager looks at other
individuals and groups of individuals: thus they influence interpersonal
relationships.
4.) Personal value systems influence the perception of individual and
organizational success as well as their achievement.
5.) Personal value systems set the limits for the determination of what is and what
is not ethical behavior by a manager.
6.) Personal value systems influence the extent to which a manager accepts or
resists organizational pressures and goals.
39
7.) Some personal value systems may contribute to managerial performance,
some may be irrelevant and some may be antithetical to achievement efforts
(p. 411).
England and Lee found that managers in the four different countries did share value
patterns that were predictive of success. More successful managers possessed pragmatic,
dynamic, and achievement-oriented values; less successful managers had more passive
values.
Summary
Personal interests, attitudes, and values result in patterns of thinking that may
influence one’s behavior (Malphurs, 1996; Rokeach, 1968; Rokeach, 1973).
Psychological research into cognitive and behavioral theories helps to explain how
interests, attitudes, and values influence behaviors. Moral development and ethical theory
demonstrate how individuals can attribute different meaning to the same event.
Behavioral patterns may often result as a consequence of one’s attitudes, interests, and
values.
The DISC assessment is a tool to aid in understanding and predicting how an
individual will behave, while the PIAV assessment is a tool to aid in understanding why
an individual will behave in a certain manner. These instruments are often used together
to help organizations implement training to improve relationships and communication
(Target Training International, 2008).
40
CHAPTER 3. METHODOLOGY
This study will analyze data from selected variables from the results of the DISC
behavioral assessment and the PIAV assessment. A correlation between the DISC and
PIAV dependent variables will be run and multivariate analysis of variance will be used
to develop this predictive model.
The purpose of this study is to perform a comparative analysis of the DISC
behavioral assessment tool and the Personal Interest, Attitudes, and Values (PIAV)
assessment tool in order to determine if:
1. There are relationships between DISC and PIAV scores;
2. There are differences between men and women for DISC performance;
3. There are differences between men and women for PIAV performance;
4. There are differences between sales and executives for DISC performance;
5. There are differences between sales and executives for PIAV performance.
This research might contribute information that will assist in utilizing the DISC
and PIAV to foster understanding and to enhance interpersonal relationships and
communications in business and organizational settings.
Research Design
This study is a quantitative, quasi-experimental, exploratory research design to
determine whether relationships exits between DISC and PIAV, between DISC and PIAV
for men and women, and between DISC and PIAV for sales professionals and executives.

41
Secondary data analysis of a cohort will be used for this research. The methodology that
will be used to analyze this data will determine whether any of the identified variables are
predictors of behavioral style or personal interests, attitudes, and values. Determining the
predictability of behavioral style and/or personal interests, attitudes, and values based on
the variables will either prove or disprove the stated hypotheses.
Sample
To be included in the sample, results for subjects have to satisfy the following
criteria:
1. Subjects must be recorded as a sales professional or an executive professional.
2. Results must be available for both the DISC and PIAV assessments.
3. Records must indicate whether the subject is a male or female.
Instrumentation / Measures
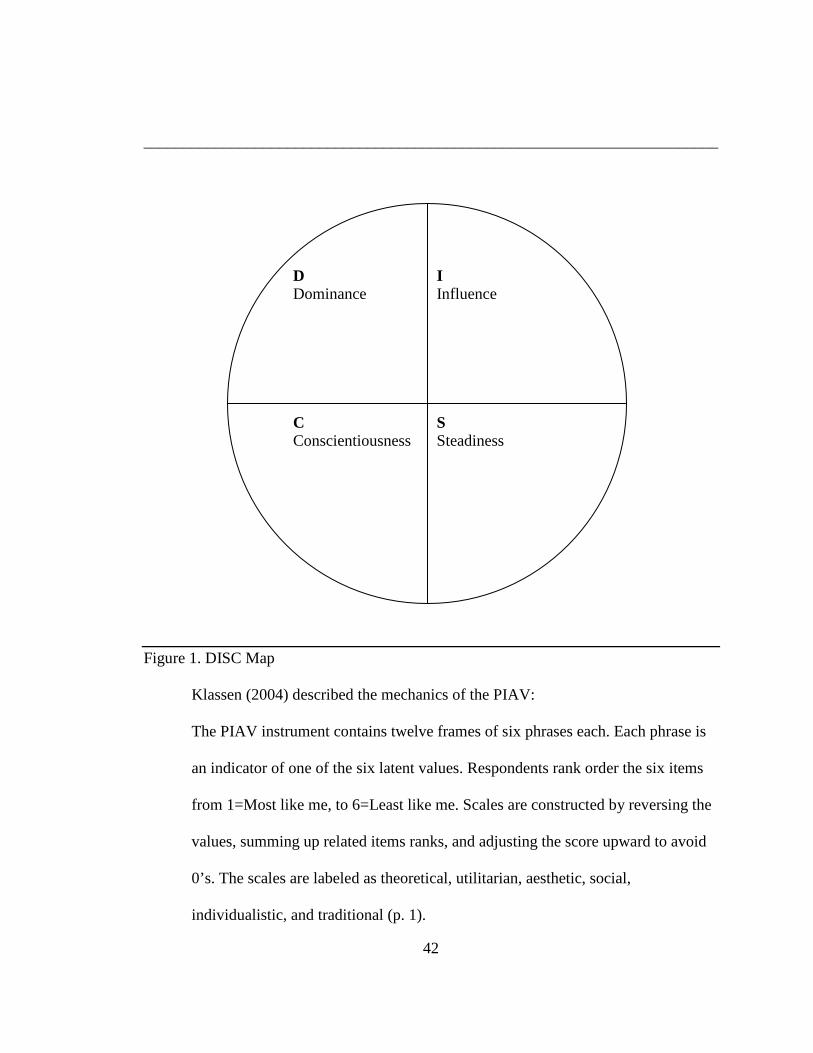
DISC is a model that measures four reference points:
1. Dominance: direct, strong-willed, and forceful
2. Influence: sociable, talkative, and lively
3. Steadiness: gentle, accommodating, and soft hearted
4. Conscientiousness: private, analytical, and logical
Each person who takes the DISC assessment is plotted on the circle, also known as the
DISC map (Inscape Publishing, 2007). Below is an example of a DISC map.
42
________________________________________________________________________
Figure 1. DISC Map
Klassen (2004) described the mechanics of the PIAV:
The PIAV instrument contains twelve frames of six phrases each. Each phrase is
an indicator of one of the six latent values. Respondents rank order the six items
from 1=Most like me, to 6=Least like me. Scales are constructed by reversing the
values, summing up related items ranks, and adjusting the score upward to avoid
0’s. The scales are labeled as theoretical, utilitarian, aesthetic, social,
individualistic, and traditional (p. 1).
D I Dominance Influence C S Conscientiousness Steadiness

43
Validity and Reliability
Validity deals with whether or not the instrument accurately measures what it
proposes to measure, while reliability deals with whether the measures are consistent and
dependable (Cresswell, 2003). Klassen (2006) tested the validity and reliability of DISC
assessment with a sample of 75,317 (45.4% female and 54.6% male) responses and
reported the instrument is accurate and reliable across a variety of populations. Reliability
for the two dimensions (adaptive and natural) for the four parallel scales (Dominant,
Influencing, Steadiness, and Compliance) ranged from .64 to .80.
Klassen (2004) tested the validity and reliability of the PIAV assessment with a
sample of 1130 responses (49.5% female and 50.5% male) and found the assessment to
be valid and reliable across a variety of populations. Reliability for all six scales had a
Cronbach alpha from .7 to .84.
Inscape Publishing, Inc. (2008) conducted an analysis of variance (ANOVA) to
determine if a difference existed between ethnicity and gender for scores on eight scales
that are located around the DiSC circle:
D measures a direct, dominant disposition …
I measures an interactive, influencing disposition …
S measures an accommodating, steady disposition …
C measures a private, conscientious disposition … (p. 3).
The results across ethnic groups and determined no significant difference (p<.05) on
seven of the eight scales. There was a statistically significant difference (p=.02) on the iS
44
scale, but this differences accounted for only 1.7% of the variance on this scale,
suggesting that the relationship of ethnicity on this scale is not meaningful.
The differences on gender were small, but larger than the differences on ethnicity
(Inscape Publishing, Inc., 2008). Women tended to score higher on the IS scale, while
men tended to score higher on the DC scale. Although statistically significant differences
(p>.05) were found on the other six scales, the differences were not large enough to be
considered practically meaningful.
Data Collection
The data for this study will be gathered electronically from the database of a
private consulting firm specializing in the DISC and the PIAV assessments. The data that
will be used for this study will be secondary. The sample will extracted from a database
of approximately 35,000 records and should result in 600 samples - 300 sales
professionals and 300 executives – that have completed both the DISC and PIAV
assessments. The data will be retrieved and entered into Excel before being transferred to
SPSS for analysis. There are no human subjects who are part of this study.
Data Analysis
There are several advantages and disadvantages using secondary data. Some of
the advantages of using secondary data are (Zikmund, 1984):
1.) It is less costly to use existing data.
2.) More data can be collected resulting in a larger sample size.
3.) The study can be completed faster.
Some of the disadvantages in using secondary data are:
45
1.) The subject matter may not be consistent with the research.
2.) The researcher has no control over the accuracy (pp. 85-90).
All statistical analyses will be performed using SPSS for Windows (SPSS 17.0,
SPSS Inc., Chicago, IL). The study sample will be described using the mean, standard
deviation, range for continuous scaled variables and frequency and percent for categorical
scaled variables. All of the analyses will be two-sided with a 5% alpha level.
There are five research hypotheses that will be analyzed:
Hypothesis H01 (Null)
There is not a relationship between DISC and PIAV scores.
Hypothesis H01 (Alternative)
There is a relationship between DISC and PIAV scores.
Hypothesis H02 (Null)
There is no difference between the scores on the DISC assessment for men and
women.
Hypothesis H02 (Alternative)
There is a difference between the scores on the DISC assessment for men and
women.
Hypothesis H03 (Null)
There is no difference between the scores on the PIAV assessment for men and
women.

46
Hypothesis H03 (Alternative)
There is a difference between the scores of the PIAV assessment for men and
women.
Hypothesis H04 (Null)
There is no difference between the scores of the DISC assessment for sales
professionals and executives.
Hypothesis H04 (Alternative)
There is a difference between the scores of the DISC assessment for sales
professionals and executives.
Hypothesis H05 (Null)
There is no difference between the scores of the PIAV assessment for sales
professionals and executives.
Hypothesis H05 (Alternative)
There is a difference between the scores of the PIAV assessment for sales
professionals and executives.
The Pearson correlation coefficient will be used to determine if relationships exist
between DISC and PIAV scores; a multivariate analysis of the variance (MANOVA) will
be completed to determine if there is a difference between gender and occupation (sales
or executive) on the DISC and PIAV assessment scores. The DISC assessment scores and
the PIAV assessment scores are the dependent variables; gender and occupation are the
independent variables. A significance level of 0.05 will be used.

47
Ethical Considerations
It will be necessary to conceal the identity of past participants to prevent
unforeseeable consequences. The data will be coded for gender and occupation, so no
names will be entered into the study. Coding the data will serve to conceal the identity of
participants in order to prevent potential discrimination because of results. These efforts
will help to protect the liberty of participants and to assure the beneficence of the
research.
Permission was granted to use the data archived in the database of the consultant
company. Subjects were informed that their results would be used for future research
when the consultant gave instructions prior to administering the assessments.

48
CHAPTER 4: RESULTS
Introduction
This chapter discusses the statistical techniques used to analyze the sample data,
descriptions of the sample, and the findings related to the study’s hypotheses. The
purpose of this study was to focus on a microcosm of the business community –men and
women sales professionals and executives – to determine if there are relationships and
differences in behavioral styles and personal interests, attitudes, and values. The data was
obtained from the DISC and PIAV assessments of sales professionals and executives.
Research Questions
The goal of the study was accomplished by examining the following five research
questions and corresponding hypotheses.
Question 1: Is there a relationship between DISC and PIAV scores?
Hypothesis H01 (Null)
There is not a relationship between DISC and PIAV scores.
Hypothesis H01 (Alternative)
There is a relationship between DISC and PIAV scores.
Question 2: Do men and women sales professionals and executives share
behavioral styles?
Hypothesis H02 (Null)
There is no difference between the scores on the DISC assessment for men and
women.
Hypothesis H02 (Alternative)
49
There is a difference between the scores on the DISC assessment for men and
women.
Question 3: Do men and women have different personal interests, attitudes, and
values?
Hypothesis H03 (Null)
There is no difference between the PIAV assessment scores for men and women.
Hypothesis H03 (Alternative)
There is a difference between the scores of the PIAV assessment for men and
women.
Question 4: Do sales professionals and executives have different behavioral
styles?
Hypothesis H04 (Null)
There is no difference between the scores of the DISC assessment for sales
professionals and executives.
Hypothesis H04 (Alternative)
There is a difference between the scores of the DISC assessment for sales
professionals and executives.
Question 5: Do sales professionals and executives have different personal
interests, attitudes, and values?
Hypothesis H05 (Null)
There is no difference between PIAV assessment scores for sales professionals
and executives.
50
Hypothesis H05 (Alternative)
There is a difference between PIAV assessment scores for sales professionals and
executives.
Description of the Data
The remainder of this chapter is divided into two sections: the first section
summarizes the description of the data; the second section describes the results of each
hypothesis in sequence. The summary and interpretation of the major findings based on
the analysis of the data is recorded in chapter 5.
The sample was obtained from the database of a consultant company located
outside of Atlanta, Georgia with over twenty years of experience administering and
training using the DISC and PIAV assessments. The sample of individuals that had scores
for both DISC and PIAV were limited to 226 sales professionals and 73 executives. The
remaining 74 sales professional and 227 executive samples were obtained by filtering
DISC results by profession and then matching them with the corresponding PIAV scores.
This process resulted in a total sample of 600 – 300 sales professional and 300 executives
– that had recorded scores for DISC and PIAV.
This method of selection, filtering and selecting based on profession, resulted in
more males than females for both sales professions and executives. Table 1 provides a
description of the sample: 451 males and 149 females: 79 female and 221 male
executives; 70 female and 230 male sales professionals. It is unclear whether the
differences in gender are the result of chance or differences in the demographics of the
consultant’s database.
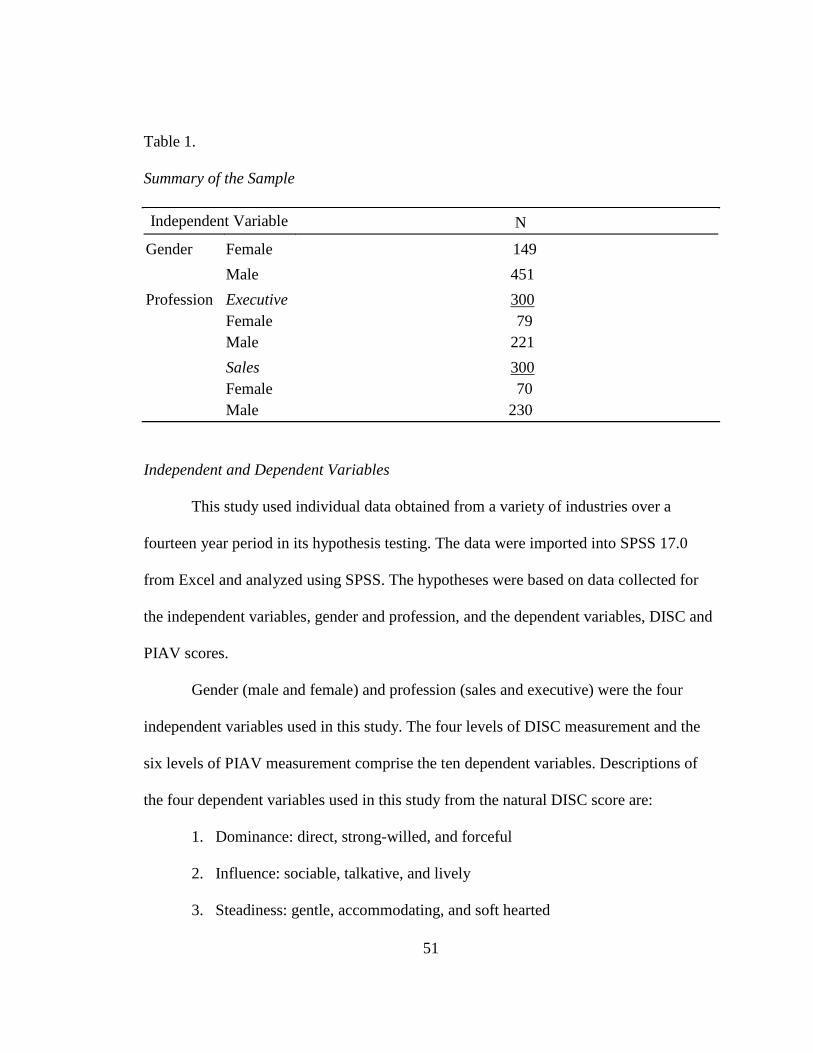
51
Table 1.
Summary of the Sample
Independent Variable N
Gender Female 149
Male 451
Profession Executive Female Male
300 79 221
Sales Female Male
300 70 230
Independent and Dependent Variables
This study used individual data obtained from a variety of industries over a
fourteen year period in its hypothesis testing. The data were imported into SPSS 17.0
from Excel and analyzed using SPSS. The hypotheses were based on data collected for
the independent variables, gender and profession, and the dependent variables, DISC and
PIAV scores.
Gender (male and female) and profession (sales and executive) were the four
independent variables used in this study. The four levels of DISC measurement and the
six levels of PIAV measurement comprise the ten dependent variables. Descriptions of
the four dependent variables used in this study from the natural DISC score are:
1. Dominance: direct, strong-willed, and forceful
2. Influence: sociable, talkative, and lively
3. Steadiness: gentle, accommodating, and soft hearted
52
4. Conscientiousness: private, analytical, and logical (Inscape Publishing, 2007)
Descriptions of the six PIAV dependent variables are:
1. Theoretical Attitude (driven by a passion for discovering truth and
knowledge). The primary motivator behind this attitude is knowledge for the
sake of knowing, continuing education and learning. People who are
motivated by this attitude take a “cognitive” approach in meeting challenges –
identifying, analyzing and clarifying problems and options.
2. The Utilitarian Attitude (driven by a passion for return on investment of time,
talent, and resources). This attitude gives focus to the practical affairs of life.
Efficient use of time and money will be of great importance to those with this
primary attitude.
3. The Aesthetic Attitude (driven by a passion for form, harmony, beauty, and
balance). People with this primary attitude look for balance between their
internal and external worlds. They seek self-realization and self-actualization,
and relate to their experiences mainly from a subjective point of view.
4. The Social Attitude (driven by a passion to eliminate hate and conflict). Those
with this primary attitude are motivated by their love of people. They seek to
promote and contribute to others’ well-being through giving of their focus,
time, talent, and resources.
5. The Traditional Attitude (driven by a passion for the highest value in life).
Principles are highly important to people with this primary attitude. They
make decisions from a solid set of principles that they use as their guiding
forces in life. They will sacrifice all to be true to their belief system.
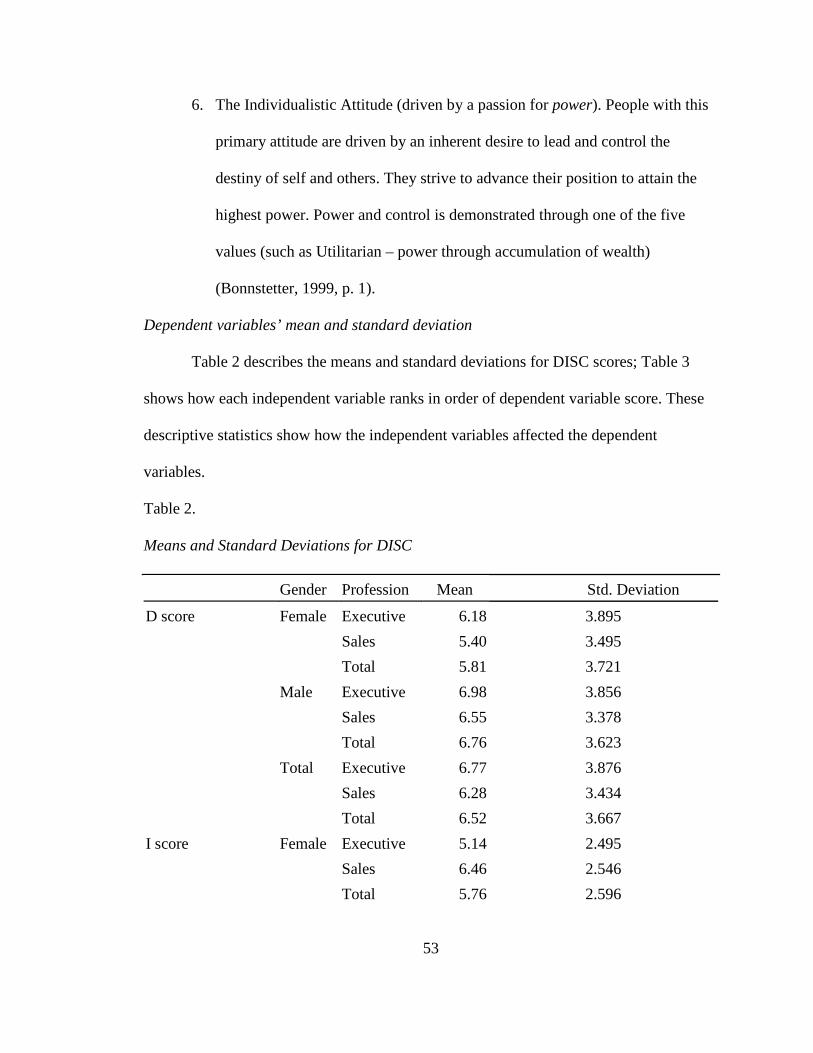
53
6. The Individualistic Attitude (driven by a passion for power). People with this
primary attitude are driven by an inherent desire to lead and control the
destiny of self and others. They strive to advance their position to attain the
highest power. Power and control is demonstrated through one of the five
values (such as Utilitarian – power through accumulation of wealth)
(Bonnstetter, 1999, p. 1).
Dependent variables’ mean and standard deviation
Table 2 describes the means and standard deviations for DISC scores; Table 3
shows how each independent variable ranks in order of dependent variable score. These
descriptive statistics show how the independent variables affected the dependent
variables.
Table 2.
Means and Standard Deviations for DISC
Gender Profession Mean Std. Deviation
D score Female Executive 6.18 3.895
Sales 5.40 3.495
Total 5.81 3.721
Male Executive 6.98 3.856
Sales 6.55 3.378
Total 6.76 3.623
Total Executive 6.77 3.876
Sales 6.28 3.434
Total 6.52 3.667
I score Female Executive 5.14 2.495
Sales 6.46 2.546
Total 5.76 2.596
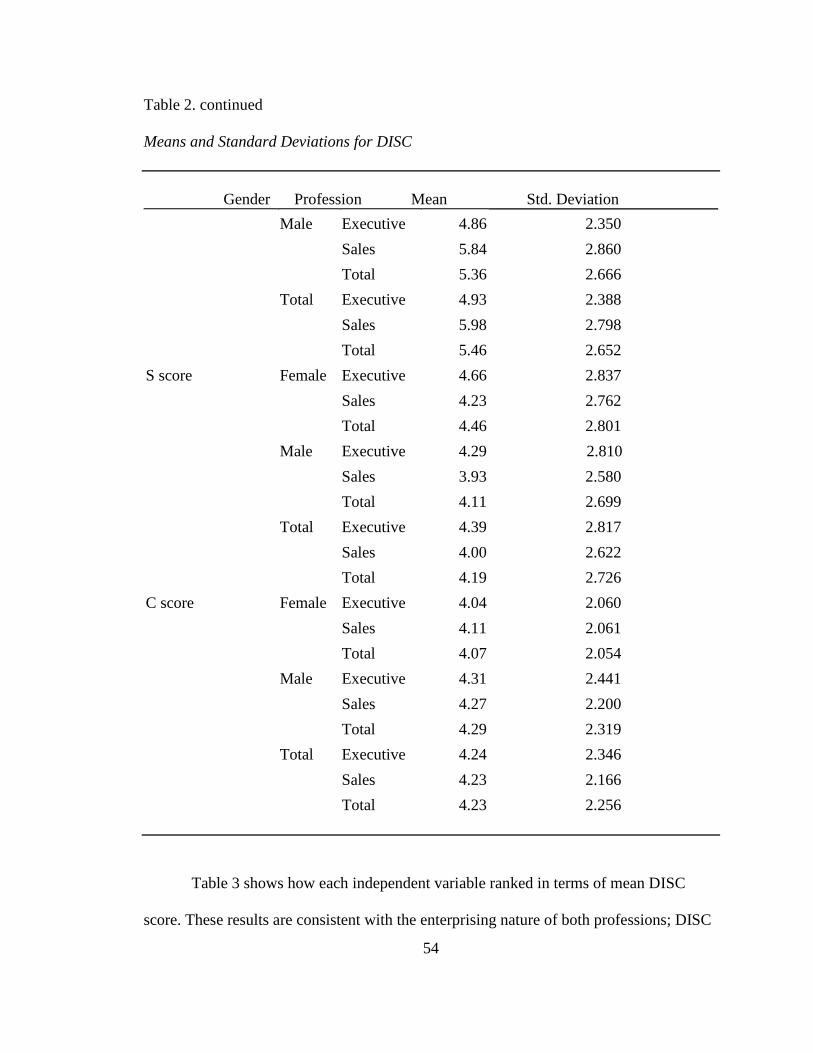
54
Table 2. continued
Means and Standard Deviations for DISC
Gender Profession Mean Std. Deviation
Male Executive 4.86 2.350
Sales 5.84 2.860
Total 5.36 2.666
Total Executive 4.93 2.388
Sales 5.98 2.798
Total 5.46 2.652
S score Female Executive 4.66 2.837
Sales 4.23 2.762
Total 4.46 2.801
Male Executive 4.29 2.810
Sales 3.93 2.580
Total 4.11 2.699
Total Executive 4.39 2.817
Sales 4.00 2.622
Total 4.19 2.726
C score Female Executive 4.04 2.060
Sales 4.11 2.061
Total 4.07 2.054
Male Executive 4.31 2.441
Sales 4.27 2.200
Total 4.29 2.319
Total Executive 4.24 2.346
Sales 4.23 2.166
Total 4.23 2.256
Table 3 shows how each independent variable ranked in terms of mean DISC
score. These results are consistent with the enterprising nature of both professions; DISC
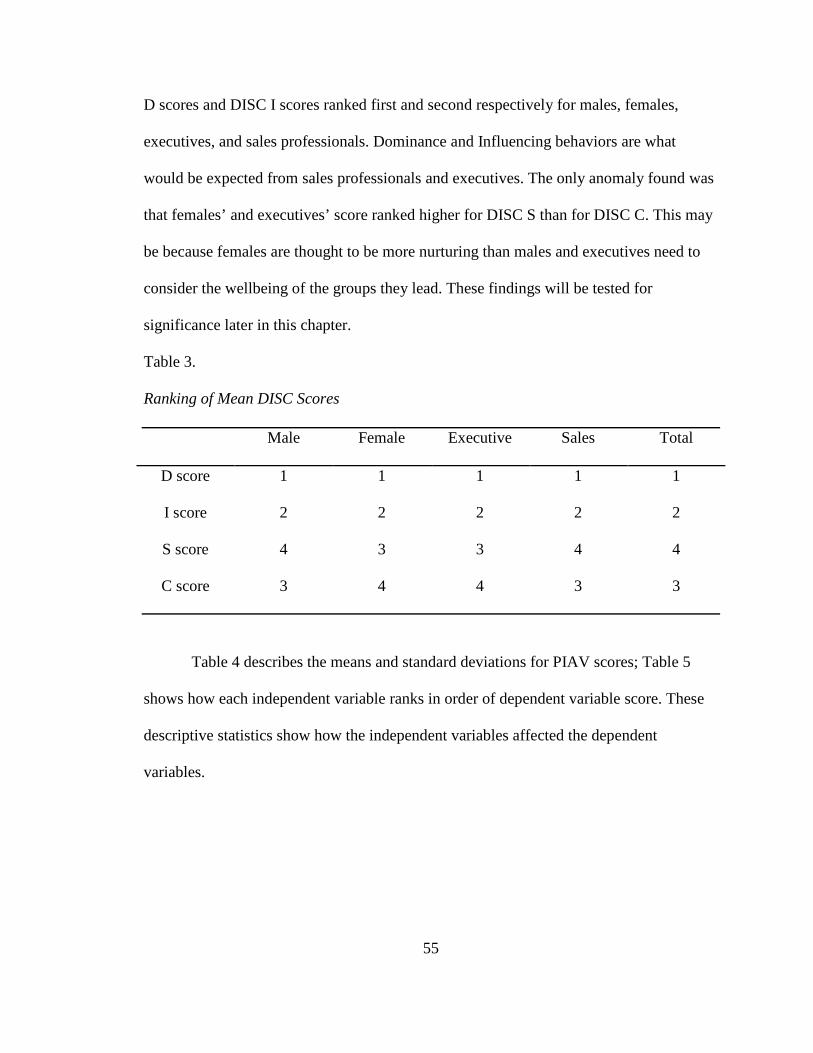
55
D scores and DISC I scores ranked first and second respectively for males, females,
executives, and sales professionals. Dominance and Influencing behaviors are what
would be expected from sales professionals and executives. The only anomaly found was
that females’ and executives’ score ranked higher for DISC S than for DISC C. This may
be because females are thought to be more nurturing than males and executives need to
consider the wellbeing of the groups they lead. These findings will be tested for
significance later in this chapter.
Table 3.
Ranking of Mean DISC Scores
Male Female Executive Sales Total
D score 1 1 1 1 1
I score 2 2 2 2 2
S score 4 3 3 4 4
C score 3 4 4 3 3
Table 4 describes the means and standard deviations for PIAV scores; Table 5
shows how each independent variable ranks in order of dependent variable score. These
descriptive statistics show how the independent variables affected the dependent
variables.

56
Table 4.
Means and Standard Deviations for PIAV
Gender Profession Mean Std. Deviation
Theoretical score Female Executive 46.08 8.681
Sales 45.57 8.162
Total 45.84 8.417
Male Executive 47.38 8.240
Sales 46.17 8.696
Total 46.77 8.488
Total Executive 47.04 8.363
Sales 46.03 8.565
Total 46.54 8.473
Utilitarian score Female Executive 49.27 9.674
Sales 49.46 9.414
Total 49.36 9.521
Male Executive 47.25 10.471
Sales 50.19 9.686
Total 48.75 10.175
Total Executive 47.78 10.290
Sales 50.02 9.613
Total 48.90 10.012
Aesthetic score Female Executive 29.75 10.143
Sales 29.51 10.417
Total 29.64 10.239
Male Executive 30.05 10.098
Sales 28.10 9.638
Total 29.06 9.903
Total Executive 29.97 10.094
Sales 28.43 9.826
Total 29.20 9.982
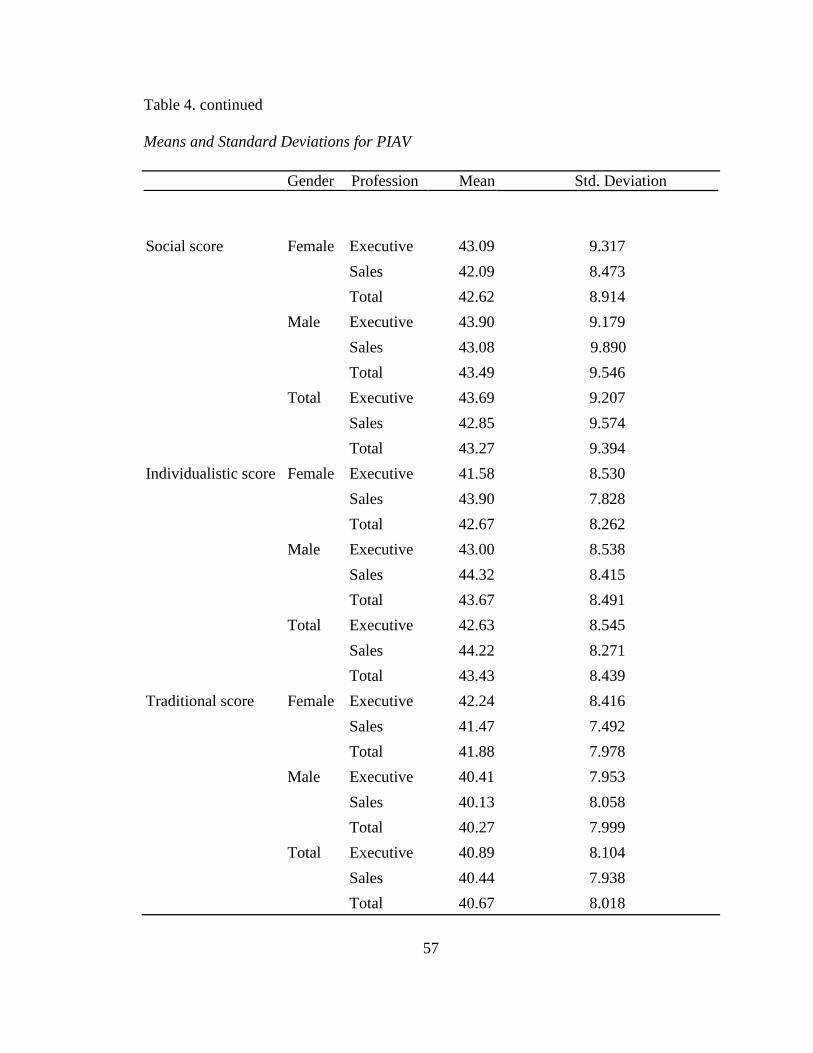
57
Table 4. continued
Means and Standard Deviations for PIAV
Gender Profession Mean Std. Deviation
Social score Female Executive 43.09 9.317
Sales 42.09 8.473
Total 42.62 8.914
Male Executive 43.90 9.179
Sales 43.08 9.890
Total 43.49 9.546
Total Executive 43.69 9.207
Sales 42.85 9.574
Total 43.27 9.394
Individualistic score Female Executive 41.58 8.530
Sales 43.90 7.828
Total 42.67 8.262
Male Executive 43.00 8.538
Sales 44.32 8.415
Total 43.67 8.491
Total Executive 42.63 8.545
Sales 44.22 8.271
Total 43.43 8.439
Traditional score Female Executive 42.24 8.416
Sales 41.47 7.492
Total 41.88 7.978
Male Executive 40.41 7.953
Sales 40.13 8.058
Total 40.27 7.999
Total Executive 40.89 8.104
Sales 40.44 7.938
Total 40.67 8.018
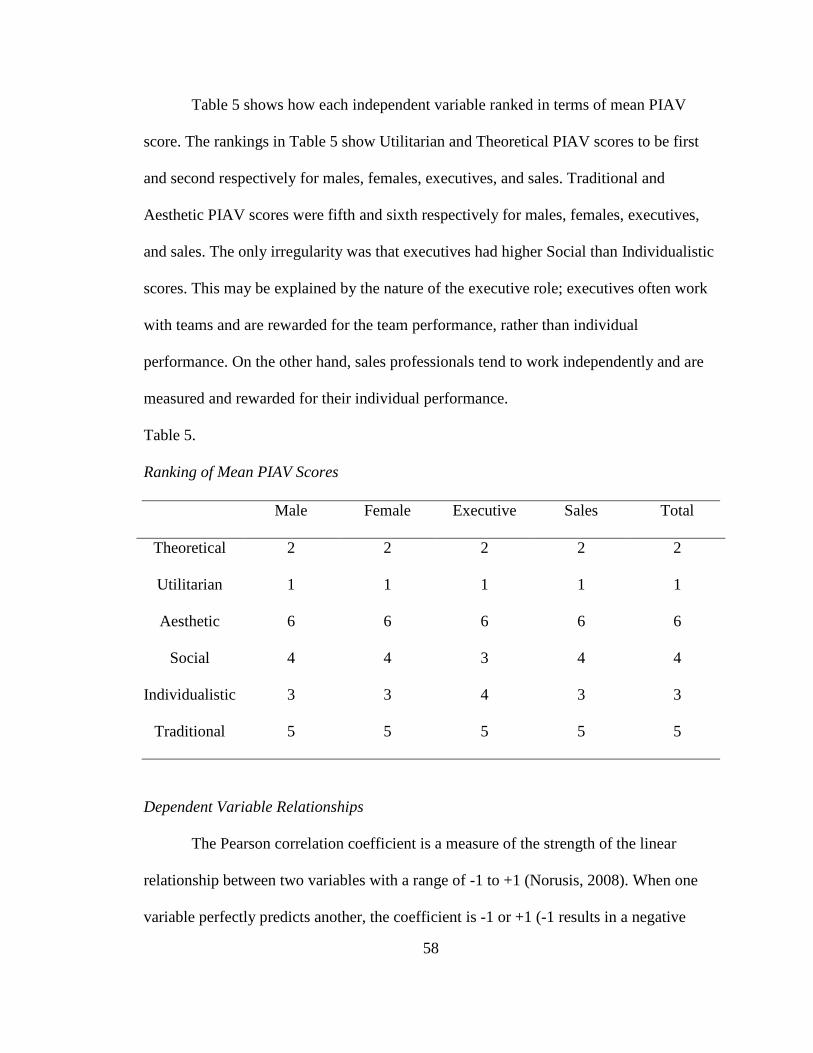
58
Table 5 shows how each independent variable ranked in terms of mean PIAV
score. The rankings in Table 5 show Utilitarian and Theoretical PIAV scores to be first
and second respectively for males, females, executives, and sales. Traditional and
Aesthetic PIAV scores were fifth and sixth respectively for males, females, executives,
and sales. The only irregularity was that executives had higher Social than Individualistic
scores. This may be explained by the nature of the executive role; executives often work
with teams and are rewarded for the team performance, rather than individual
performance. On the other hand, sales professionals tend to work independently and are
measured and rewarded for their individual performance.
Table 5.
Ranking of Mean PIAV Scores
Male Female Executive Sales Total
Theoretical 2 2 2 2 2
Utilitarian 1 1 1 1 1
Aesthetic 6 6 6 6 6
Social 4 4 3 4 4
Individualistic 3 3 4 3 3
Traditional 5 5 5 5 5
Dependent Variable Relationships
The Pearson correlation coefficient is a measure of the strength of the linear
relationship between two variables with a range of -1 to +1 (Norusis, 2008). When one
variable perfectly predicts another, the coefficient is -1 or +1 (-1 results in a negative

59
linear relationship; +1 results in a positive linear relationship; 0 results in no linear
relationship). When two variables are correlated it means that they move in the same
(positive correlation) or different (negative correlation) direction, but it does not indicate
why the relationship exists. Table 6 provides a descriptive summary of the relationship
between all the DISC and PIAV dependent variables using Pearson correlation
coefficients.
There are several examples of linear relationships among the variables in Table 6:
1. There is a significant negative linear relationship between the DISC scores (p
= .01). This may be because the assessment has few measures and low total
scores.
2. There is a negative linear relationship between PIAV Theoretical and PIAV
Individualistic, Social, Traditional, Utilitarian scores (p = .01) and a positive
linear relationship between Theoretical scores and DISC D scores (p = .05). It
is surprising that Theoretical scores correlate negatively with Utilitarian and
Individualistic scores. These PIAV scores had the highest mean scores for
sales professionals and executives. The knowledge that is attractive to those
with high PIAV Theoretical scores may diminish the need to seek return on
investment (Utilitarian passion) or power and control (Individualistic passion).
3. There is a negative linear relationship between PIAV Utilitarian and
Aesthetic, Social, Theoretical, and Traditional scores (p = .01) and a positive
linear relationship between Utilitarian scores and Individualistic scores (p =
.01). It is interesting to note that Utilitarian scores correlate positively with
Individualistic scores, while correlating negatively with Theoretical scores.
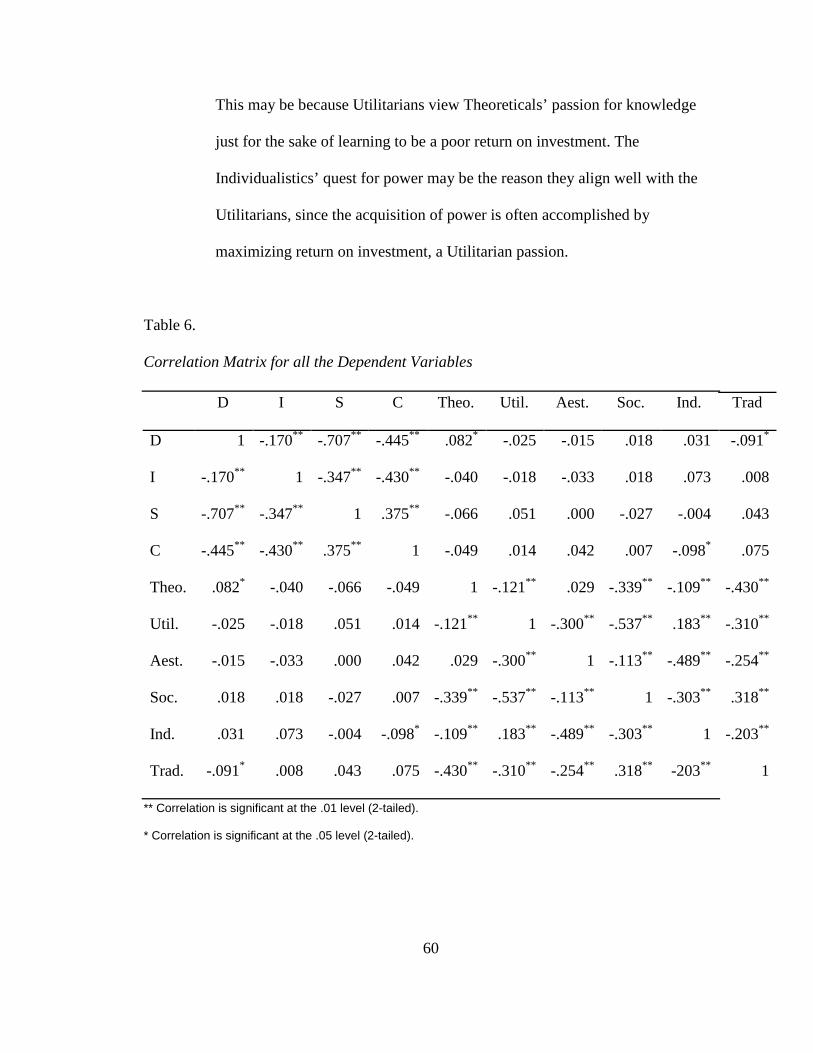
60
This may be because Utilitarians view Theoreticals’ passion for knowledge
just for the sake of learning to be a poor return on investment. The
Individualistics’ quest for power may be the reason they align well with the
Utilitarians, since the acquisition of power is often accomplished by
maximizing return on investment, a Utilitarian passion.
Table 6.
Correlation Matrix for all the Dependent Variables
D I S C Theo. Util. Aest. Soc. Ind. Trad
D 1 -.170** -.707** -.445** .082* -.025 -.015 .018 .031 -.091*
I -.170** 1 -.347** -.430** -.040 -.018 -.033 .018 .073 .008
S -.707** -.347** 1 .375** -.066 .051 .000 -.027 -.004 .043
C -.445** -.430** .375** 1 -.049 .014 .042 .007 -.098* .075
Theo. .082* -.040 -.066 -.049 1 -.121** .029 -.339** -.109** -.430**
Util. -.025 -.018 .051 .014 -.121** 1 -.300** -.537** .183** -.310**
Aest. -.015 -.033 .000 .042 .029 -.300** 1 -.113** -.489** -.254**
Soc. .018 .018 -.027 .007 -.339** -.537** -.113** 1 -.303** .318**
Ind. .031 .073 -.004 -.098* -.109** .183** -.489** -.303** 1 -.203**
Trad. -.091* .008 .043 .075 -.430** -.310** -.254** .318** -203** 1
** Correlation is significant at the .01 level (2-tailed).
* Correlation is significant at the .05 level (2-tailed).

61
4. There is a negative linear relationship between PIAV Aesthetic and
Individualistic, Social, Traditional, and Utilitarian scores (p = .01). These
groups may not share the Aesthetics passion for beauty and form. Also, beauty
and form are not ideals the typical sales professional or executive would value
highly.
5. There is a negative linear relationship between PIAV Social and Aesthetic,
Individualistic, Theoretical, and Utilitarian scores (p = .01) and a positive
linear relationship with Traditional scores (p = .01). The Social’s need to
promote love aligns well with the Traditional’s need to seek the highest value
in life and to be true to their belief system and may be the reason for this
positive correlation.
6. There is a negative linear relationship between DISC C (p = .05) and PIAV
Aesthetic, Social, Theoretical, and Traditional scores (p = .01) and a positive
linear relationship between DISC C and PIAV Utilitarian scores (p = .01).
DISC C behavior is private and analytical which complements the PIAV
Utilitarian passion for return on investment; analysis can help determine how
to maximize return.
7. There is a negative linear relationship between DISC D (p = .05) and PIAV
Aesthetic, Individualistic, Theoretical, and Utilitarian scores (p = .01) and a
positive linear relationship between DISC D and Social scores (p = .01). An
explanation for these relationships is that sales professionals have high DISC
D scores, but also need the relationships that are a passion for PIAV Social
attitudes.
62
Overall, the strongest negative correlation is between DISC D and DISC S scores
at -.707. One would expect that high DISC S individuals and high DISC D individuals
would have the greatest challenge communicating and reaching agreement: DISC D’s
display dominant, direct, and forceful behavior; DISC S’s display steady, gentle, and
accommodating behavior. The strongest positive correlation is between the PIAV
Traditional and PIAV Social. This is also not surprising – those with traditional attitudes
place high importance on their belief system; those with social attitudes place high
importance on contributing to others.
Data Analysis
The Pearson correlation coefficient was used to detect relationships between
DISC and PIAV scores to address the first research question and multivariate analysis of
variance was used to detect differences between the independent and dependent variables
to address the remaining four research questions. Multivariate analysis of variance was
selected because it considers the effects on multiple dependent variables at once (Norusis,
2008). In order to obtain robust results the procedure requires independent samples,
normality of the population distributions, and equality of the population variances
(Norusis, 2008). Following are the steps taken to assure this analysis met these
requirements and to provide more detail to help describe the dependent variables.
Independence
Table 7 displays the results of the four test statistics used by SPSS to run the
multivariate analysis of variance: Pillar’s Trace, Wilk’s Lambda, Hotelling’s Trace, and
Roy’s Largest Root. In the test of the interaction effect of gender and profession, the four
test statistics are the same – the F value (F = .561) is not significant at the 0.05 alpha
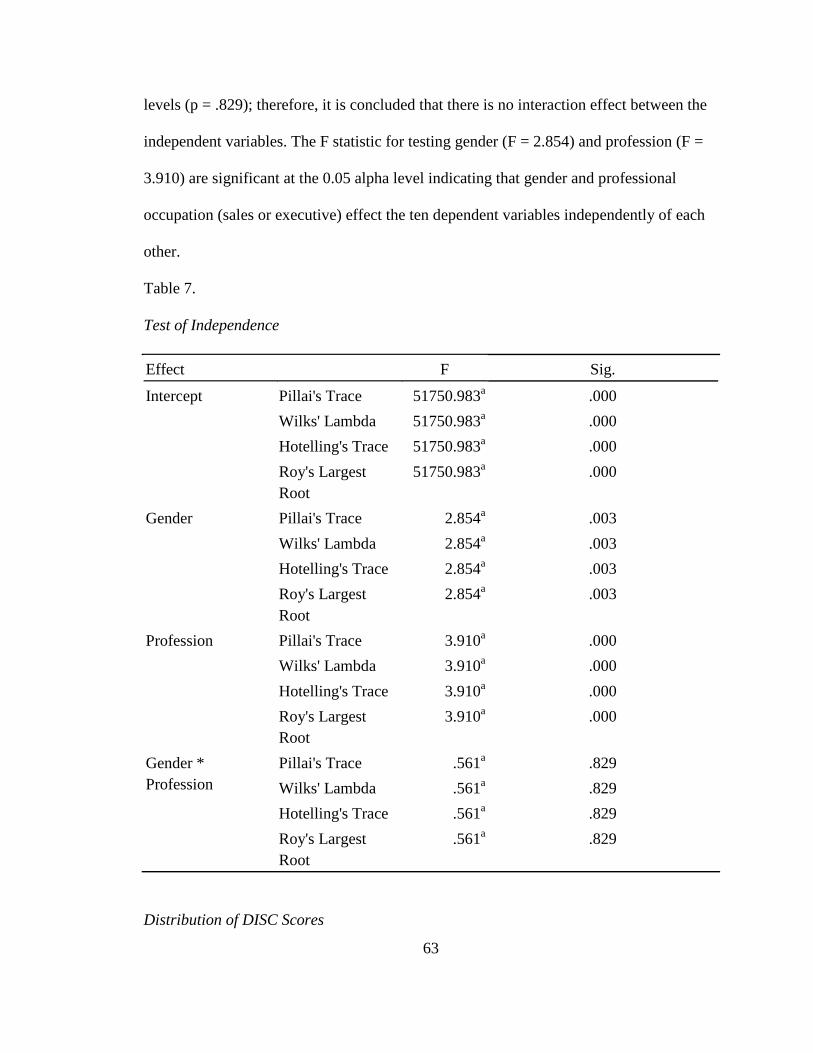
63
levels (p = .829); therefore, it is concluded that there is no interaction effect between the
independent variables. The F statistic for testing gender (F = 2.854) and profession (F =
3.910) are significant at the 0.05 alpha level indicating that gender and professional
occupation (sales or executive) effect the ten dependent variables independently of each
other.
Table 7.
Test of Independence
Effect F Sig.
Intercept Pillai's Trace 51750.983a .000
Wilks' Lambda 51750.983a .000
Hotelling's Trace 51750.983a .000
Roy's Largest Root
51750.983a .000
Gender Pillai's Trace 2.854a .003
Wilks' Lambda 2.854a .003
Hotelling's Trace 2.854a .003
Roy's Largest Root
2.854a .003
Profession Pillai's Trace 3.910a .000
Wilks' Lambda 3.910a .000
Hotelling's Trace 3.910a .000
Roy's Largest Root
3.910a .000
Gender * Profession
Pillai's Trace .561a .829
Wilks' Lambda .561a .829
Hotelling's Trace .561a .829
Roy's Largest Root
.561a .829
Distribution of DISC Scores
64
Multiple analysis of the variance requires that there be a normal distribution to
avoid having outliers bias the results. The following histograms provide the frequency of
distribution for DISC and PIAV scores, each bar representing a range of values. Normal
distributions are seen when data are concentrated in the middle and the tails are
approximately symmetric.
Figure 2. Histogram of DISC D Scores
2015105 0 -5
DISC D score
80
60
40
20
0
Mean =6.52Std. Dev. =3.667
N =600
Frequency

65
Figure 2 displays the distribution of DISC D scores represented in this study. The
distribution of scores in Figure 2 appears to be normal. There is a single peak at the score
of 7 and a tail that extends further towards larger values because 0 is the lowest score
obtainable. The mean DISC D score is 6.52 and does not appear to be influenced by
outliers.
Figure 3. Histogram of DISC I Scores
12963 0
DISC I score
100
80
60
40
20
0
Mean =5.46Std. Dev. =2.652
N =600
Frequency
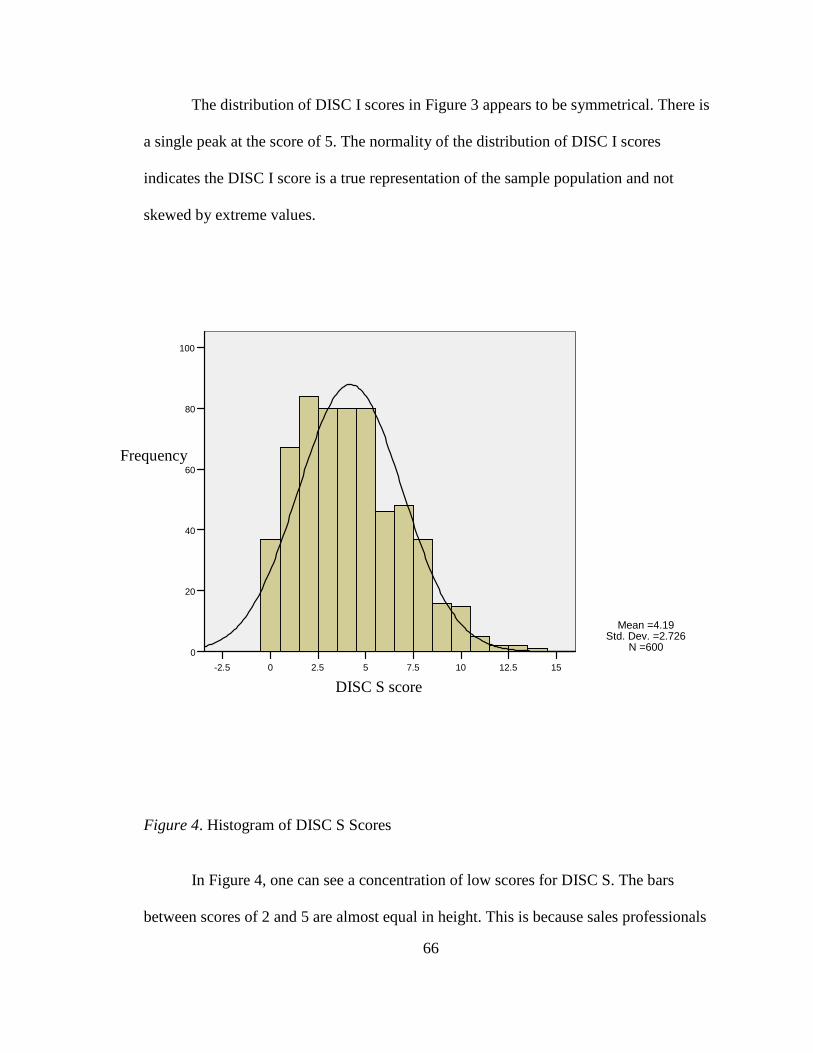
66
The distribution of DISC I scores in Figure 3 appears to be symmetrical. There is
a single peak at the score of 5. The normality of the distribution of DISC I scores
indicates the DISC I score is a true representation of the sample population and not
skewed by extreme values.
Figure 4. Histogram of DISC S Scores
In Figure 4, one can see a concentration of low scores for DISC S. The bars
between scores of 2 and 5 are almost equal in height. This is because sales professionals
1512.5107.552.5 0-2.5
DISC S score
100
80
60
40
20
0
Mean =4.19Std. Dev. =2.726
N =600
Frequency

67
and executives had a low mean score (4.19) for DISC S. The slight low mean score is not
caused by outliers.
Figure 5. Histogram of DISC C Scores
The DISC C scores in Figure 5 approximate a normal distribution curve. This
distribution does not indicate that DISC C scores are skewed by outliers. The values are
distributed symmetrically around the mean score of 4.23.
129 6 30
DISC C score
120
100
80
60
40
20
0
Mean =4.23Std. Dev. =2.256
N =600
Frequency
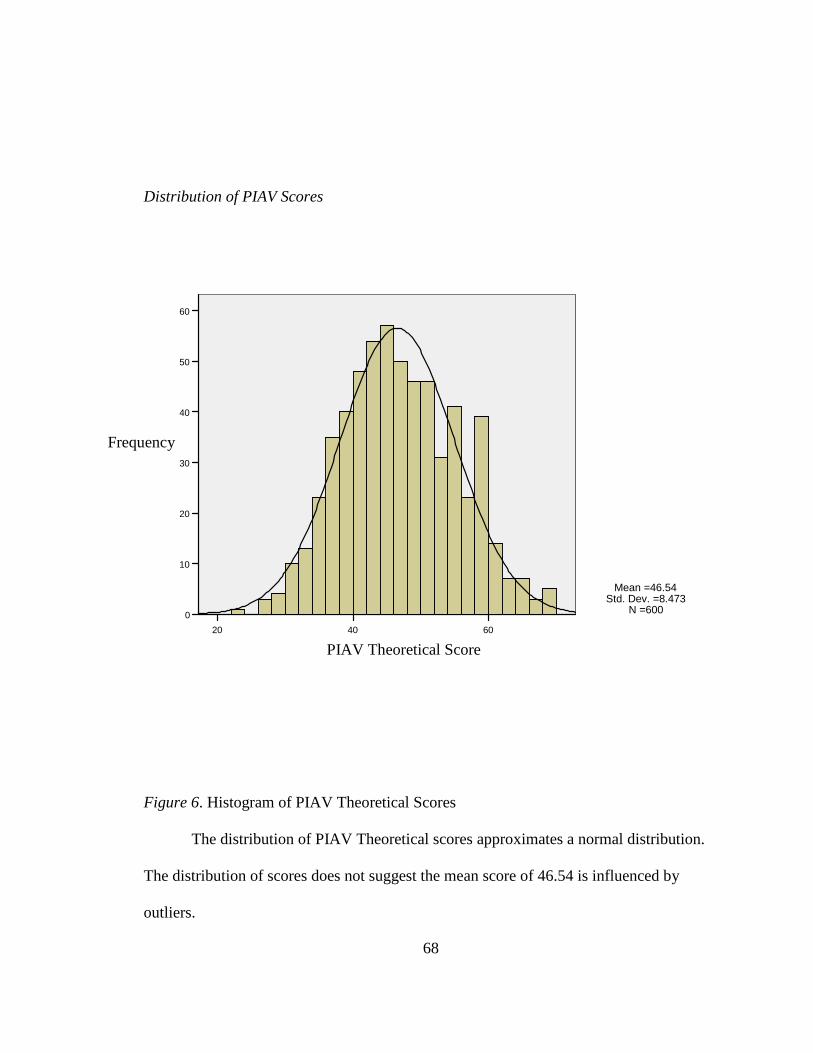
68
Distribution of PIAV Scores
Figure 6. Histogram of PIAV Theoretical Scores
The distribution of PIAV Theoretical scores approximates a normal distribution.
The distribution of scores does not suggest the mean score of 46.54 is influenced by
outliers.
604020
PIAV Theoretical Score
60
50
40
30
20
10
0
Mean =46.54Std. Dev. =8.473
N =600
Frequency

69
Figure 7. Histogram of PIAV Utilitarian Scores
The distribution of Utilitarian scores is approximately symmetric. The scores
cluster around the mean score of 48.9. The tail is slightly skewed toward lower scores,
but does not appear to influence the mean score.
8070 6050403020
PIAV Utilitarian Score
60
50
40
30
20
10
0
Mean =48.9Std. Dev. =10.012
N =600
Frequency
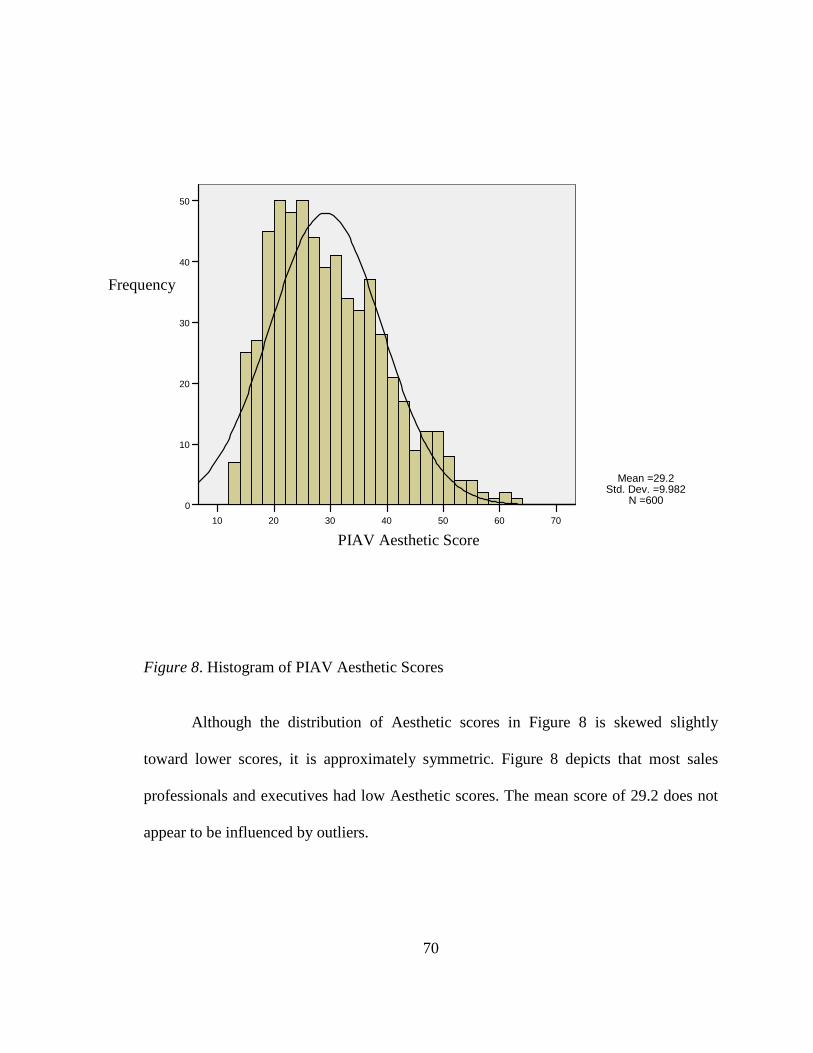
70
Figure 8. Histogram of PIAV Aesthetic Scores
Although the distribution of Aesthetic scores in Figure 8 is skewed slightly
toward lower scores, it is approximately symmetric. Figure 8 depicts that most sales
professionals and executives had low Aesthetic scores. The mean score of 29.2 does not
appear to be influenced by outliers.
7060 5040302010
PIAV Aesthetic Score
50
40
30
20
10
0
Mean =29.2Std. Dev. =9.982
N =600
Frequency
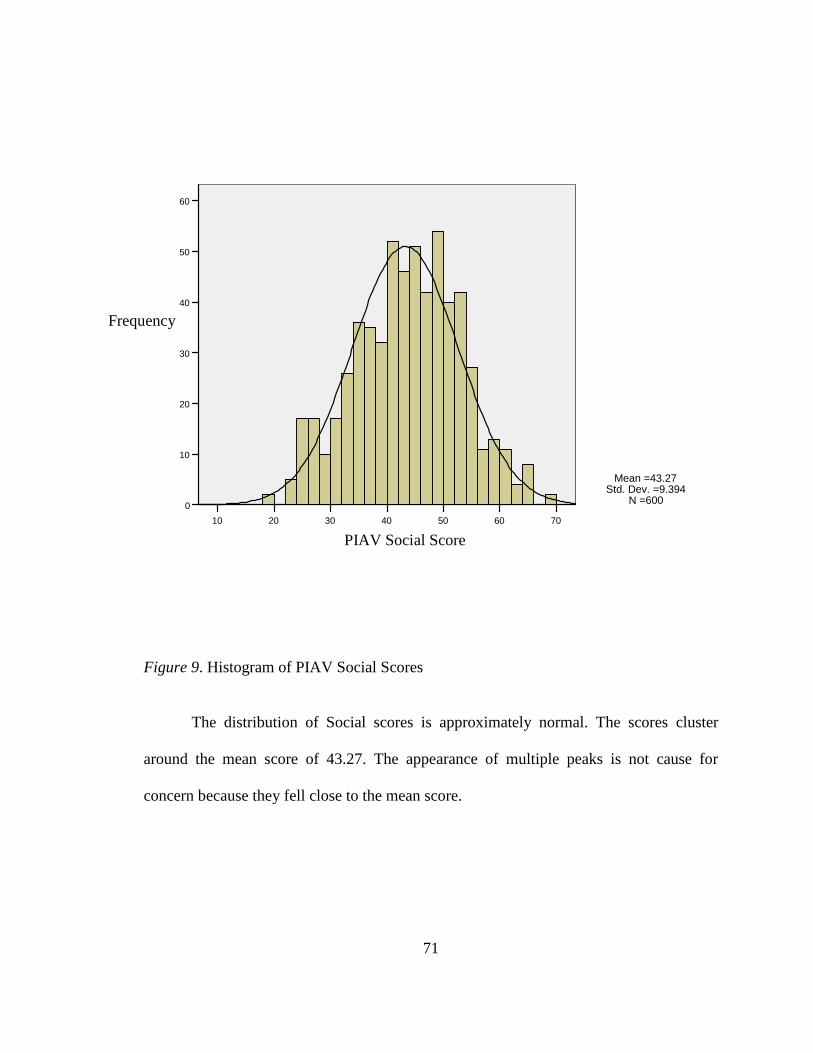
71
Figure 9. Histogram of PIAV Social Scores
The distribution of Social scores is approximately normal. The scores cluster
around the mean score of 43.27. The appearance of multiple peaks is not cause for
concern because they fell close to the mean score.
7060 5040302010
PIAV Social Score
60
50
40
30
20
10
0
Mean =43.27Std. Dev. =9.394
N =600
Frequency
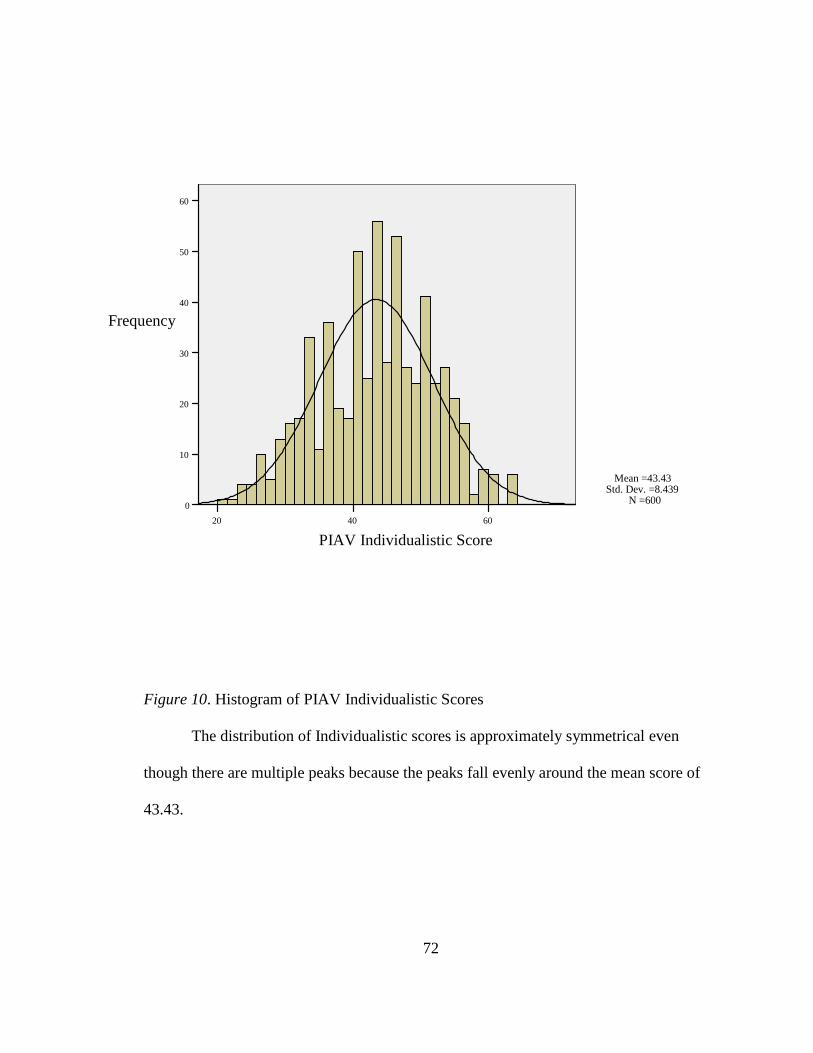
72
Figure 10. Histogram of PIAV Individualistic Scores
The distribution of Individualistic scores is approximately symmetrical even
though there are multiple peaks because the peaks fall evenly around the mean score of
43.43.
604020 PIAV Individualistic Score
60
50
40
30
20
10
0
Mean =43.43Std. Dev. =8.439
N =600
Frequency

73
Figure 11. Histogram of PIAV Traditional Scores
The distribution of Traditional scores is approximately normal; the scores cluster around
the mean score of 40.67.
Summary
The histograms of the distributions for DISC (Figures 1-4) and PIAV (Figures 5-
10) approximate a normal distribution; however, Figure 7 did demonstrate that Aesthetic
scores tend to skew somewhat to the left. The number of low Aesthetic scores does not
604020
PIAV Traditional Score
60
40
20
0
Mean =40.67Std. Dev. =8.018
N =600
Frequency

74
appear to contain outliers that would skew the accuracy of the results. Any violation of
normality appears to be minimal and should not compromise the results. In addition,
Mardia (1971) explained that mild violations of normality are not a cause for concern:
“MANOVA is also robust to modest violation of normality if the violation is created by
skewness rather than outliers” (p. 232). Normality is important to assure the results are
true for the population and not the result of a few extreme scores compromising the
results.
Equality of Variance
This study required comparing the means of ten groups, so it was necessary to
determine if the variances were equal. Table 8 displays the result of the Levene’s test to
compute the equality of variance (Norusis, 2008).
Table 8.
Levene’s Test of Equality of Error Variances
F Sig.
D score 2.459 .062
I score 4.606 .003
S score .791 .499
C score 2.903 .034
Theoretical Score .103 .958
75
Table 8. continued
Levene’s Test of Equality of Error Variances
F Sig.
Utilitarian Score .791 .499
Aesthetic Score .809 .489
Social Score .890 .446
Individualistic
Score
.373 .772
Traditional Score .260 .854
The Levene’s test of equality of error variance did show a significance difference
for I (p = .003) and C (p = .034). These differences should not pose a problem because
the number of cases in each group is similar (Norusis, 2008).
Addressing the Research Questions and Hypotheses
Question 1: Is there a Relationship between DISC and PIAV Scores?
Hypothesis 1 states that there is no relationship between DISC and PIAV scores.
The null hypothesis is rejected since relationships were found to exist between DISC and
PIAV scores at the alpha level of 0.05. Table 9 demonstrates there is a significant
positive relationship between DISC D score and PIAV Theoretical score (p = .05); there
is a significant negative relationship between DISC D score and PIAV Traditional score
(p = .05); and there is a significant negative relationship between DISC C score and
PIAV Individualistic score (p = .05).

76
Table 9.
Correlation between DISC and PIAV Scores
Theo. Util. Aest. Soc. Ind. Trad.
D .082* -.025 -.015 .018 .031 -.091*
I -.040 -.018 -.033 .018 .073 .008
S -.066 .051 .000 -.027 -.004 .043
C -.049 .014 .042 .007 -.098* .075
Note. Correlation is significant at the .05 level (2-tailed).
These correlations suggest that a sales professional or executive who has a high
DISC D score will be likely to have a high PIAV Theoretical score and a low PIAV
Traditional score. DISC D scores indicate a propensity towards direct, strong-willed, and
forceful behavior which may benefit from the information and knowledge valued by one
who obtains high PIAV Theoretical scores. In contrast, high DISC D scores portend low
PIAV Traditional scores. Sales professionals’ and executives’ high DISC D behavior
tends to be more aggressive and may not welcome the rules and guiding principles that
are attractive to those who have high PIAV Traditional scores.
The negative relationship between the DISC C scores and PIAV Individualistic
scores is no surprise, considering DISC C behavior is private and may be viewed
negatively by those sales professionals and executives who have high PIAV
Individualistic scores; high PIAV Individualistic scores indicate a need to control self and
others.
77
Question 2: Do Men and Women Sales Professionals and Executives Share Behavioral
Styles?
Hypothesis 2 states that there is no difference between the scores on the DISC
assessment for men and women. The null hypothesis is rejected since the F value in Table
10 for DISC D score (F = 8.019) is significant at the alpha level of 0.05 (p = .005). The F
value is not significant for DISC I score (p = .067), DISC S score (p = .196), and DISC C
score (p = .326) at the alpha level of 0.05.
Table 10.
Tests of Between-Subjects Effects for DISC and Gender
Dependent Variable Male Mean Scores
Female Mean Scores F Sig.
D score 6.76 5.81 8.019 .005
I score 5.36 5.76 3.367 .067
S score 4.11 4.19 1.675 .196
C score 4.29 4.07 .967 .326
The results from Table 10 are somewhat surprising; one would not expect gender
differences in behavioral styles to occur within the same profession. These results
indicate that within this sample of sales professionals and executives men tend to be more
direct and dominant than females.
Question 3: Do Men and Women have Different Personal Interests, Attitudes, and
Values?

78
Hypothesis 3 states there is no difference between the scores on the PIAV
assessment for men and women. Since the F value in Table 11 is significant for
Traditional score (p = .037) at the alpha level of 0.05 the null hypothesis is rejected. The
F statistics for testing PIAV Theoretical (F = 1.422), Utilitarian (F = .496), Aesthetic (F =
.556), Social (F = .308), and Individualistic scores (F = 1.336) were not significant at the
alpha level of 0.05.
Table 11.
Tests of Between-Subjects Effects for PIAV and Gender
Dependent Variable
Male Mean Score
Female Mean Score F Sig.
Theoretical Score 46.77 45.84 1.422 .233
Utilitarian Score 48.75 49.36 .464 .496
Aesthetic Score 29.06 29.64 .347 .556
Social Score 43.49 42.62 1.039 .308
Individualistic Score
43.67 42.67 1.336 .248
Traditional Score 40.27 41.88 4.379 .037
The results from Table 11 are also surprising; it was not expected that men and
women working in the same profession would differ in terms of their personal interests,
attitudes, and values. Table 11 indicates that women have a higher Traditional score than
men. This suggests that female sales and executive professionals value their principles
more than males in the same profession. Although the PIAV Traditional score was higher
for females than for males, it was relatively low compared to the other female PIAV
79
scores. The results indicate that traditional principles are more important to women than
to men.
Question 4: Do Sales Professionals and Executives have Different Behavioral Styles?
Hypothesis 4 states there is no difference between the scores of the DISC
assessment for sales professionals and executives. The null hypothesis is rejected since
the F value from Table 12 for DISC I score is significant (p = .000) at the alpha level of
0.05.
Table 12.
Tests of Between-Subjects Effects for DISC and Profession
Dependent Variable
Executive Mean Score
Sales Professional Mean Score F Sig.
D score 6.77 6.28 3.086 .079
I score 4.93 5.98 21.925 .000
S score 4.39 4.00 2.344 .126
C score 4.24 4.23 .006 .937
These finding from Table 12 are not surprising; sales professionals would be
expected to score higher on DISC I than executives due to their need to influence others
to use the products or services they sell.
Question 5: Do Sales Professionals and Executives have Different Personal Interests,
Attitudes, and Values?
Hypothesis 5 states there is no difference between the scores of the PIAV
assessment for sales professionals and executives. The null hypothesis is rejected since

80
the F score from Table 13 for PIAV Individualistic score (F = 5.203) is significant at the
alpha level of 0.05.
Table 13.
Tests of Between-Subjects Effects for PIAV and Profession
Dependent Variable
Executive Mean Score
Sales Professional Mean Score F Sig.
Theoretical Score 47.04 46.03 1.146 .285
Utilitarian Score 47.78 50.02 2.769 .097
Aesthetic Score 29.97 28.43 1.327 .250
Social Score 43.69 42.85 1.053 .305
Individualistic Score
42.63 44.22 5.203 .023
Traditional Score 40.89 40.44 .481 .488
The results from Table 13 are also not surprising; sales professionals would be
expected to have higher individualistic scores because they typically work alone and are
measured and rewarded on their individual results. Executives are responsible for the
performance of groups and would be expected to be less individualistic.
Summary
Chapter 4 described the data used in this study and provided the tests to assure the
statistical assumptions for multivariate analysis of variance were met. Each of the five
research questions with corresponding hypotheses was addressed. The null hypotheses
that there was no relationship between dependent variables and no difference between
independent variables were rejected in favor of the alternative hypotheses. Chapter 5 will
provide more interpretation of these findings and offer suggestions for future research.

81
CHAPTER 5: DISCUSSION, IMPLICATIONS, RECOMMENDATIONS
Chapter 5 discusses the results as they relate to the research questions and
hypotheses. This chapter also discusses how the findings may help to improve
communications between sales professionals and executives. The limitations of this study
are discussed as well as opportunities for future research.
Summary and Discussion of the Results
The primary objectives of this study were to determine whether there were
relationships and differences between personal values and behavioral style for gender and
profession. PIAV assessment scores were used to determine values; DISC assessment
scores were used to determine behavioral style. The sample population was comprised of
men and women sales professionals and executives. Knowledge of similarities and
differences between personal values and behavioral styles can be used to improve
communication and diversity within the organization, to reduce interpersonal conflict,
and to align employees with the appropriate type of work and incentive structure.
Humans are believed to form behaviors as a result of cognitively processing
perceived and real stimuli. Marston’s (1979) three-stage model considers four primary
emotions – dominance, inducement, submission, and compliance – that an individual uses
to interpret a stimulus before deciding how to react. Cognitive behavioral theory also uses
a three stage process to explain behavior. Seligman’s (1990) research into the differences
between optimists and pessimists demonstrates how patterns of behavior are formed
based on a person’s interpretation of events. For example, two sales people encounter
rejection from a prospect: one sales person interprets the rejection as a temporary
condition that is not based on his or her personal talents; the other sales person interprets

82
the rejection to mean he or she has chosen the wrong profession and visualizes failure to
be a permanent condition.
Organizations are comprised of individuals who habitually react to stimuli based
on beliefs that form as a result of their position within the organization. Shared beliefs
that result from work experiences create cultures within the organization that function
independently as well as interdependently with other of the organization’s work groups.
Schein (1996) identified three different management cultures that are common within
many organizations that evolve as a result of different responsibilities, training, and
measurements: executive, engineering, and operator. These different cultures are believed
to create problems with intra-organizational communication and learning. Those within
one culture often have agendas that differ from those of another culture.
Sales professionals and executives are examples of two groups with different
cultures: sales professionals are often responsible for individual sales results; executives
are responsible for the results of the groups they lead. As part of the operator culture,
sales professionals are primarily interested in operational efficiency; they want to secure
the sale. Problems can occur when the sales person’s behavior conflicts with the
objectives of those from the executive culture. An example of this is when the sales
person lowers the price to beat the competition; the sales person secures the sale at the
expense of the lowering the profit margin, a metric important to the executive.
Gender differences have also been found to contribute to miscommunication
(Tannen, 1995). Men are thought to be more dominant and women more nurturing. An
objective of this study was to determine whether differences in communication style
between men and women are transported into their professional roles.

83
This study examined the results of 600 DISC and PIAV assessment results – 300
sales professional and 300 executives – from the database of a business consultant who
specializes in interpreting and training on DISC and PIAV. DISC scores and PIAV scores
from the sample of men and women sales professionals and executives were compared
using SPSS. The correlation matrix of DISC and PIAV scores were examined to detect
relationships between DISC and PIAV. A multivariate analysis of variance was run to
determine if there were differences between men and women sales professionals and
executives on DISC scores and PIAV scores.
The DISC assessment is based on Marston’s (1979) three-stage model and
measures an individual’s behavioral preferences for Dominance (D) – how one responds
to problems or challenges; Influence (I) – how one influences others to his or her point of
view; Steadiness (S) – how one responds to the pace of the environment; and Compliant
(C) – how one responds to rules and procedures (Target Training International, 2009).
High DISC scores for each area can be used to describe an individual’s behavioral style:
1. D: direct, strong-willed, and forceful
2. I: sociable, talkative, and lively
3. S: gentle, accommodating, and soft hearted
4. C: private, analytical, and logical (Inscape Publishing, 2007)
DISC helps one to understand and anticipate behaviors, but does little to explain why
these behaviors occur.
The PIAV assessment is based on the work of Eduard Spranger (1928) that
identified six different attitudes that make up one’s personality. The PIAV assessment
measures a person’s interests, attitudes, and values to identify how they cluster and their
84
prevalence. Individual’s possess a mixture of these six attitudes, but do tend to gravitate
towards certain attitudes (Stewart, 1999). The six attitudes are:
1. Theoretical – a passion for truth and knowledge
2. Utilitarian – a passion for return on investment
3. Aesthetic – a passion for form, harmony, beauty, and balance
4. Social – a passion to eliminate hate and a love of people
5. Traditional – a passion for obtaining the highest value by adhering to a solid
set of principles
6. Individualistic – a passion to lead and control the destiny of self and others
(Bonnstetter, 1999).
The PIAV score describes an individual’s predominant attitudes and values and helps to
explain the motivation behind behavior, while the DISC score describes an individual’s
predominant behavioral style.
Hypotheses Discussion
Hypothesis 1 (Null): There is no relationship between DISC and PIAV Scores
The results of the Pearson correlation coefficient indicated there were
relationships between DISC and PIAV scores; therefore, the Null hypothesis was
rejected. There were some interesting relationships among DISC D and PIAV scores;
those who had high DISC D scores had low PIAV Traditional scores and high PIAV
Theoretical scores (p = .05). These findings are not too unusual considering high DISC D
scores indicate a direct, strong-willed and forceful behavioral style that is less likely to
value principles to help guide them. In contrast, those who score high for the Traditional
attitude and rely upon rules and principles to guide them are less likely to behave in a
85
direct, forceful, and direct manner (DISC D behavior). This study found sales
professionals and executives scored highest for DISC D and fifth for PIAV Traditional.
The finding that DISC D scores had a positive relationship with PIAV Theoretical
scores is also consistent with other findings in this study. The knowledge acquired and
valued by the PIAV Theoretical attitude can be useful to the DISC D to support their
strong-willed behavioral style. Sales professionals and executives need to have as much
knowledge as possible about the competitive environment before proceeding in the
forceful manner of their DISC D behavioral style.
Another relationship revealed between DISC and PIAV assessments was that
DISC C scores and PIAV Individualistic scores moved in opposite directions (p = .05).
This finding was no surprise considering those who score high on DISC C display
behaviors that are private, analytical, and logical, while those who score high on PIAV
Individualistic have a passion for power over self and others. In this study DISC C was
the lowest mean DISC score and PIAV Individualistic was the third highest PIAV score.
Future research is needed to determine whether the DISC and PIAV linear
relationships found in this study can be generalized to other professions, or if these
finding are specific to sales professionals and executives.
Hypothesis 2 (Null): There is no Difference between DISC Assessment Scores for Men
and Women.
The results of the multivariate analysis of variance indicated that there were
indeed differences on DISC scores between men and women. Men had higher mean
DISC D scores (p = .005); therefore, the null hypothesis was rejected. This finding
supports Tannen’s (1995) theory that “women – like people who have grown up in a

86
different culture – have often learned different styles of speaking than men, which can
make them seem less competent and self-assured than they are” (p. 139). The DISC D
behavioral style is direct, strong-willed, and forceful – behaviors less socially acceptable
for women than for men in the U. S.
There were no significant differences found between men and women on DISC I,
DISC S, and DISC C scores. Consider, high DISC I individuals are described as having
sociable, talkative, and lively behavior; DISC S individuals are describes as having
gentle, accommodating, and softhearted behavior; and DISC C individuals are
characterized as having private, analytical, and logical behavior – none of these behaviors
contrasts with male or female stereotypes.
Future research can look into whether female executives’ lower DISC D
behavioral style impacts their management style. For example, command and control
leadership – DISC D behavior - has been the most prevalent leadership model, but
research has found that empowering employees to participate in decisions can serve to
improve organizational efficiency and effectiveness (Marshall, Talbott, & Bukovinsky,
2006). Lower DISC D behavior may result in an advantage by making it easier for female
leaders seeking to empower their followers.
Hypothesis 3 (Null): There is no difference between PIAV assessment scores for men and
women.
Females were found to have higher Traditional PIAV scores than men (p = .037);
therefore, the null hypothesis was rejected. The higher interest in principles and
traditional values among women support Sikula and Costa’s (1994) finding that women
ranked certain ethical values higher than men ranked them. Another study found
87
differences in how women used rule abidance – a traditional characteristic – to
compensate for their lack of organizational power – a dominant characteristic - relative to
men (Portillo & DeHart-Davis, 2009). Differences between men and women have been
attributed to social conditioning (Tannen, 1995).
It is interesting to note that while females had higher PIAV Traditional scores, the
only PIAV mean score that was lower than the Traditional scores for females was the
Aesthetic score. This finding suggests that PIAV scores are influenced more by
profession than gender. Although PIAV Traditional scores were higher for females than
for males, they are still low relative to other female PIAV scores.
Future research can look into determining if female executives’ higher PIAV
Traditional scores results in better compliance to guidelines such as Sarbanes Oxley. In
addition, studies are needed to determine whether environmentally and socially
responsible organizations are more suitable for sales professionals and executives with
higher PIAV Traditional scores.
Hypothesis 4 (Null): There is no Difference between DISC Assessment Scores for Sales
Professionals and Executives
Sales professionals were found to have higher DISC I scores than executives (p =
000); therefore, the null hypothesis was rejected. One of the major differences between
sales professionals and executives is that sales professionals have a greater need to
persuade others to their point of view. While executives do need to influence employees
and stockholders that their strategies are suitable to meet specified goals, their primary
role is to develop strategies and to communicate and deliver financial results (Schein,
1996). Sales professionals, on the other hand, are measured and rewarded on how well

88
they influence clients to purchase the organization’s products and services. The findings
of this study are consistent with these different job requirements.
Future studies are needed to determine how to convince sales professionals with
high DISC I behavior that they need to work and interact with others within the
organization (Turnasella, 2002). High I behavioral types strive for individual recognition
and rewards, which can be a challenge to incorporate into a team atmosphere.
Hypothesis 5 (Null): There is no Difference between PIAV Assessment Scores for Sales
Professionals and Executives.
Sales professionals were found to have higher PIAV Individualistic scores than
executives (p = .023); therefore, the null hypothesis was rejected. This finding is
surprising because those scoring high for the Individualistic attitude are described by
their passion for power and their desire to lead and control the destiny of self and others.
Typically, executives are thought to be motivated by power; however, often executives
are more concerned with work groups and relationships, especially executives at lower
levels of the managerial hierarchy.
Sales professionals usually work independently and are measured by their
individual results. Sales professionals need to control the sales process to lead a client
towards accepting their proposal. This process requires the sales professional to use
influence to lead and control the client. The nature of the sales profession can explain the
higher mean PIAV Individualistic score.
An interesting finding is that PIAV Social ranked higher for executives than for
sales professionals. Table 5 shows that sales professionals’ mean score ranked higher for
PIAV Individualistic attitude than for Social, indicating that power and control is more
89
important than trust and the relationship. The Social attitude is needed to build trust and
to develop strong relationships (Potter, 1999). Trust and strong relationships between a
sales professional and client is important to the sales professional’s success. This finding
may help explain negative stereotypes often attributed to sales professionals.
Implications
Practical
Individuals who are direct and forceful (high DISC D) will tend to respond to
opportunities to learn and grow (high PIAV Theoretical), but will be less likely to
embrace rules and principles (high PIAV Traditional). Work environments, such as
accounting and pharmacy, where rule adherence is imperative may frustrate these
individuals. In this study, sales professionals and executives scored high for DISC D and
PIAV Theoretical and low for PIAV Traditional. It is important to recognize these
distinctions when these individuals face circumstances where adherence to rules are
required, such as call reporting for sales professionals and financial reports for
executives.
This study found that those who favor analysis and logic (high DISC C) are less
inclined to have a passion for power (high PIAV Individualistic). It is important to
understand this distinction in order to avoid rewarding those with superior analytical
skills with promotions to positions of power. Consider those who love to program
computers, but have no interest in managing themselves or others. A promotion to a
leadership position would be a mistake and frustrate them as well as the team they need
to lead.
90
Men need to recognize that women have a less intense DISC D behavioral style,
even when working in the same environment. Although this study found men and women
scored highest for DISC D, men had a significantly higher score than did women. Male
and female executive and sales professionals need to be aware that even though they
share the same DISC D behavioral style, the intensity of this dominant style is less for
women than for men. Turnasella (2002) identified that those who score high for DISC D
“prefer to take active roles in hostile environments… [are] unafraid of taking risks…
[and] love variety and crave adventure” (pp. 50-51). This study suggests males and
females need to be understanding of the feelings that others have about the risk and
excitement in the work environment.
Another finding that has practical implication is that women are more prone to
follow rules than are men. This information can be useful when determining how to
measure performance and to structure compensation. Objective criteria should be used to
provide the desired structure and to increase the sense of control, a value shared by men
and women.
Executives need to be cognizant of sales professionals’ higher DISC I when
communicating with them. Sales professional will be more sociable, talkative, and lively;
it may be more difficult for executives to match this energetic communication style. On
the other hand, sales professionals need to recognize that executives often communicate
differently and not mistake their more direct, strong-willed, and forceful style as a
personal affront.
Finally, executives are less individualistic than sales professionals. Executives
need to strive to balance how the sales professional is measured and incented for sales

91
performance between the sales professionals need for individual recognition the
organizations need for team work. Sales professionals need to be cognizant of how their
contributions are important to the organization’s mission and how their performance
contributes to the organization’s goals and objectives. Team measures are consistent with
executives’ high social score, but not sales professionals’ high individualistic score.
Theoretical
DISC and PIAV assessment scores can be used in job selection and promotion.
Table 3 shows sales professionals and executives ranked highest for DISC D and DISC I.
High scores on these DISC measures may indicate a candidate will be suitable for a sales
or executive position. Executives were found to rank higher for DISC S, indicating they
tend to be more steady and accommodating. When choosing a candidate from the sales
force for a leadership position, it may be wise to work with the individual to help him or
her to become more accommodating and steady.
Sales professionals and executives also ranked highest for PIAV Utilitarian and
Theoretical in Table 5. Candidates that value return on investment and knowledge may be
most suitable for a sales or executive position. When promoting a sales person, this study
indicates the sales professional may need to work on becoming more concerned with
others (PIAV Social) and less concerned with power (PIAV Individualistic).
Interestingly, this study found no difference between men and women in ranking
for PIAV, but did for DISC. Table 3 shows that women ranked third for DISC S, while
men ranked third for DISC C. In this study females were more likely to behave in a
steady, gentle, and accommodating manner than a logical and analytical manner. For
men, the results were just the opposite; men were more likely to behave in a logically and

92
analytically than steady and accommodating. These differences may be due to innate
differences between men and women or because of social conditioning.
DISC and PIAV may be used to redesign teams based on individual scores.
Experiments need to be conducted to determine how to structure teams to maximize
productivity. For instance, a team with too many leaders (high DISC D and PIAV
Utilitarian) and not enough followers may be less productive than a more diverse team.
DISC and PIAV may prove useful to improve the diversity of a team based on individual
value and behavior profiles; however, one may argue that diversity is decreased when
individuals are selected for positions because they match the desired DISC and PIAV
profile.
Recommendations
A major limitation of this study is the ability to generalize the results to
populations other than those included in this research – sales professionals and
executives. There is a need for future research into DISC and PIAV scores to help
understand how other professions and cultures differ in terms of behavioral style and
interests, attitudes, and values. For example, in a study of how successful financial
planners scored on PIAV assessments, Bonnstetter found that 80% had mean scores for
Utilitarian above the mean and 67% had Individualistic scores above the mean. The
findings in this study of sales professionals and executives were in agreement with
Bonnstetter’s finding that Utilitarian ranked as the top PIAV score; however, this study
found Theoretical to rank as the second highest PIAV score, not Individualistic as in
Bonnstetter’s research. Future research is needed to determine how different professions
compare for DISC and PIAV.

93
Research is recommended to discover ways to use DISC and PIAV in marketing
and consumer behavior to identify how values and behavioral style affect preference for
products. Consumer values have been found to be culturally and socially learned (Vinson,
Scott, & Lamont, 1977). Target marketing can be aligned with the targeted consumers’
predominant DISC and PIAV profile to improve the return on the marketing investment
and to increase consumer satisfaction.
Globalization of the economy has enhanced the need to understand cultural
differences and to identify ways to improve communication between different cultures,
creating an area of research for future research into DISC and PIAV results. Cultures
have been found to have attitudinal differences in terms of their view of behavioral
expectations. In a study of 50 countries, Hofstede (2001) examined how each culture
differed and found a difference in how much individuals are expected to look after
themselves. Hofstede called this measurement the individualism-collectivism scale.
Research into how different national cultures compare on DISC and PIAV may help with
diplomacy and international trade.
Conclusion
This study found that men from the sales and executive professions had higher
DISC D scores than women; females from the sales and executive professions had higher
PIAV Traditional scores than men; sales professionals had higher DISC I scores than
executives; and sales professionals had higher PIAV Individualistic scores than
executives. These findings contribute to the validity of Geier’s (1979) DISC assessment
as a tool to identify similarities and differences in behavioral style and Spranger’s (1928)
work that identified the six different attitudes measured by the PIAV assessment. It is

94
important to recognize that the differences found in this study were between men and
women working within the same professions – sales and executive. The fact that DISC
and PIAV could detect differences in these very similar groups increases the practical
value of these tools and magnifies the need to conduct further research into the use of
these tools.
95
REFERENCES
Allport, G. W., Vernon, P. E., & Lindzey, G. (1960). Study of values, manual and test booklet (3rd ed.). Boston: Houghton Mifflin.
Anonymous, (2008). The latest metrics on learning hours, training costs, & more. HR
Focus, 85(4), 6. Anton, R. J. (1990). Drawing the line: An exploratory test of ethical behavior in
negotiations. International Journal of Conflict Management, 1(1), 265-280. Baeyens, F., Geert, C., & Eelen, P. (1988). Once in contact, always in contact: Evaluative
conditioning is resistant to extinction. Advanced Behavioral Research and Therapy, 10(1), 179-199.
Bandura, A. (1977). Social learning theory. Englewood Cliffs, NJ: Prentice-Hall. Banerjee, R. P. (1999). Mind engineering for value-based order. International Journal of
Value-Based Management, 12(1), 69-86. Barbian, J. (2001). Getting to know you. Training, 38(6), 60-64. Barry, V. (1979). Moral issues in business. Belmont, CA: Wadsworth. Beck, A. T. (1961). A systematic investigation of depression. Comprehensive Psychiatry,
2(1), 163-170. Bonnstetter, B. J. (1999). If I knew then what I know now. New York: Forbes Custom
Publishing. Bonnstetter, B. J. (2006). Information that adds to the art of selection for the financial
industry. Success Insights Summer Conference. Retrieved January 17, 2009, from TTI Performance Systems, Ltd. Web Site: http://www.ttidisc.com/products.php?product=discassessment
Brady, N. & Hart, D. (2007). An exploration into the developmental psychology of
ethical theory with implications for business practice and pedagogy. Journal of Business Ethics, 76(1), 397-412.

96
Bridges, W. (1994). Job shift: How to prosper in a workplace without jobs. Reading, MA: Addison Wesley Publications.
Brotherton, C. (1996). Guidelines on recording the activities of an affiliate member of the
division. The Occupational Psychologist, 29(August), 50-56. Bruno, L. & Lay, E. (2008). Personal values and leadership effectiveness. Journal of
Business Research, 61(6), 678-683. Bushardt, S. C., Lambert, J., & Duhon, D. L. (2007). Selecting a better carrot:
Organizational learning, formal rewards and culture – a behavioral perspective. Journal of Organizational Culture, Communication and Conflict, 11(2), 67-79.
Buzzota, V. R. & Lefton, R. E. (1982). Is there a preferred style of sales management?
Journal of Personal Selling and Sales Management, 12(November), 1-7. Cazier, J. A., Shao, B. M., & Louis, R. D. (2007). Sharing information and building trust
through value congruence. Inf Syst Front, 9(1), 515-529. Chung, K. Y., Eichenseher, J. W., & Taniguchi, T. (2008). Ethical perceptions of
business students: Differences between east Asia and the USA and among “confusion” cultures. Journal of Business Ethics, 79(1/2), 121-132.
Covey, S. R. (2004). The 8th habit: From effectiveness to greatness. New York: Free
Press. Creswell, J. W. (2003). Research design: Qualitative, quantitative, and mixed methods
approaches. Thousand Oaks, CA: Sage Publications, Inc. Darling, J. R. & Walker, W. E. (2001). Effective conflict management: Use of the
behavioral style model. Leadership & Organization Development Journal, 22(5/6), 230-243.
Denhardt, R. B. & Denhardt, J. V. (2006). The dance of leadership: The art of leading in
business, government, and society. Armonk, NY: M.E. Sharpe. Donleavy, G. D. (2008). No man’s land: Exploring the space between Gilligan and
Kohlberg. Journal of Business Ethics, 80(1), 807-822. Eduard Spranger. (2009). In Encyclopedia Britannica. Retrieved January 26, 2009, from
Encyclopedia Britannica Online: http://www.britannica.com/EBchecked/topic/561201/Eduard-Spranger

97
Ellis, A., Young, J., & Lockwood, G. (1987). Cognitive therapy and rational-emotive therapy: A dialogue. Journal of Cognitive Psychotherapy: An International Quarterly, 1(4), 205-257.
England, G. W. & Lee R. (1974). The relationship between managerial values and
managerial success in the United States, Japan, and Australia. Journal of Applied Psychology, 59(4), 411-419.
Fisher, J. G., Maines, L. A., Peffer, S. A., & Sprinkle, G. B. (2005). An experimental
investigation of employer discretion in employee performance evaluation and compensation. The Accounting Review, 80(2), 563-584.
Fleishman, E. A. (1953). The description of supervisory behavior. Journal of Applied
Psychology, 38(1), 1-6. Forsyth, D. R. (1980). A taxonomy of ethical ideologies. Journal of Personality and
Social Psychology, 39(1), 175-184. Fraser, A. J. (2004). A return to basics at Kellogg. MIT Sloan Management Review,
45(4), 27-33. Furlow, L. (2000). Job profiling: Building a winning team using behavioral assessment.
Journal of Nursing Administration, 30(3), 107-111. Geier, J. G. (1976). Situation perception analysis [Review and interpretation of the book
Emotions of Normal People]. Minneapolis: Persona Press. Geier, J. G. (1992). Development and psychometric properties of the behavior indicator.
Minneapolis, MN: Geier Learning Systems. Gilligan, C. (1982). In a different voice: Psychological theory and women’s development.
Cambridge, MA: Harvard University Press. Gilligan, C. & Attanucci, J. (1988). Two moral orientations: Gender differences and
similarities. Merrill-Palmer Quarterly, 34(3), 223-237. Grossman, R. P. & Till, B. D. (1998). The persistence of classical conditioned brand
attitudes. Journal of Advertising, 27(1), 23-31. Groves, K., Vance, C., & Paik, Y. (2008). Linking linear/nonlinear thinking style balance
and managerial ethical decision-making. Journal of Business Ethics, 80(1), 305-325.
98
Haaga, D. A. F. & Davison, G. C. (1993). An appraisal of rational-emotive therapy. Journal of Consulting and Clinical Psychology, 61(2), 215-220.
Hartman, S. J., Lundberg, O., & White, M. (1989). Effect of background and
organizational position on executive planning. Journal of Social Psychology, 130(6), 801-811.
Helms, M. M., & Hutchins, B. A. (1992). Poor quality products: Is their production
unethical? Management Decision, 30(5), 35-46. Helweg, G. C. & Gaines, L. S. (1977). Subject characteristics and preferences for
different approaches to psychotherapy: A multivariate study. Journal of Consulting and Clinical Psychology, 45(5), 963-964.
Hensel, P. & Dubinsky, A. J. (1986). Ethical dilemmas in marketing: A rationale. Journal
of Business Ethics, 5(February), 63-67. Herzberg, F. (1968). One more time: How do you motivate employees? Harvard
Business Review, 46(1), 53-62. Hite, R. E. & Bellizzi, J. A. (1986). A preferred style of sales management. Industrial
Marketing Management, 15: 215-223. Hofstede, G. (2001). Culture’s consequences: Comparing values, behaviors, institutions,
and organizations across nations, 2nd ed.. Thousand Oaks, CA: Sage. Ingram, C. L. (2004). A case study of executive coaching as a leadership intervention in a
bureaucratic organization. Ph.D. dissertation, Regents University, United States. Retrieved January 2, 2009 from ProQuest Digital Dissertations database. (UMI No. 3141540).
Inscape Publishing, Inc. (2008). Everything DiSC application library. Retrieved January
19, 2009, from Inscape Publishing, Inc. Web Site: http://www.inscapepublishing.com/products.html
Izzo, G. (2000). Compulsory ethics education and the cognitive moral development of
salespeople: A quai-experimental assessment. Journal of Business Ethics, 28(3), 223-241.
Jaffee, S. & Hyde, J. S. (2000). Gender differences in moral orientation: A meta-analysis.
Psychological bulletin, 126(5), 703-726. Johnson, W. B., Nielsen, S. L., & Ridley, C. R. (2000). Religiously sensitive rational
emotive behavior therapy: Elegant solutions and ethical risks. Professional Psychology: Research and Practice, 31(1), 14-20.
99
Keirsey, D. & Bates, M. (1984). Please understand me. Del Mar, CA: Prometheus
Nemesis. Klassen, P. T. (2004). TTI’s personal interests, attitudes, values 2. Retrieved January 23,
2009, from TTI Performance Systems, Ltd. Web Site: http:ttidisc.com/validity.php?PHPSESSID=0250d5a78b9f3fe7fad534105bde46a3
Kohlberg, L. T. & Hersh, R. H. (1977). Moral development: A review of the theory.
Theory Into Practice, 16(2), 53-59. Kohlberg, L. T. (1981). The philosophy of moral development. San Francisco, CA:
Harper & Row. Kracher, B. & Marble, R. P. (2008). The significance of gender in predicting the
cognitive moral development of business practitioners using the sociomoral reflective objective measure. Journal of Business Ehics, 78(1), 503-526.
Kurland, N. (1996). Sales agents and clients: Ethics, incentives, and a modified theory of
planned behavior. Human Relations, 49(1), 51-74. Laird, J. D. (1974). Self-attribution of emotion: The effects of expressive behavior on the
quality of emotional experience. Journal of Personality and Social Psychology, 29(4), 475-486.
Malphurs, A. (1996). Values-driven leadership: Discovering and developing your core
values for ministry. Grand Rapids, MI: Baker Books. Mandler, G. (2007). A history of modern experimental psychology: From James and
Wundt to cognitive science. Cambridge, MA: The MIT Press. Manz, C. C. & Neck, C. P. (2004). Mastering self-leadership: Empowering yourself for
personal excellence, Upper Saddle River, NJ: Pearson Prentice-Hall. Manz, C. C. & Sims, H. P. Jr. (2001). New superleadership: Leading others to lead
themselves. San Francisco, CA: Berrett-Koehler. Mardia, K. V. (1971). The effect of nonnormality on some multivariate tests and
robustness to nonnormality in the linear model. Biometrika, 58(1), 105-121. Marshall, R., Talbott, J., & Bukovinsky, D. (2006). Employee empowerment works at
small companies, too. Strategic Finance, 88(3), 34-41. Marston, W. M. (1979). Emotions of normal people. Minneapolis, MN: Persona Press,
Inc. (Original work published 1928).
100
Maslow, A. H. (1943). A theory of human motivation. Psychological Review, 50(4), 370-
396. McAlister, D. T. & Darling, J. R. (2005). Upward influence in academic organizations: A
behavioral style perspective. Leadership & Organization Development Journal, 26(7/8), 558-574.
McGregor, D. (1960). The human side of enterprise. New York: McGraw-Hill. McKenna, M. K., Shelton, C. D., & Darling, J. R. (2002). The impact of behavioral style
assessment on organizational effectiveness: A call for action. Leadership & Organizational Development Journal, 23(5/6), 314-323.
Millward, L. (2005). Understanding occupational & organizational psychology.
London: SAGE Publications, Ltd. Milner, D. T., Mahaffey, T., Macauley, K. & Hynes, T. (1999). The effect of business
education on the ethics of students: An empirical assessment. Teaching Business Education, 3(3), 255-267.
Mischel, W. & Mischel, H. N. (1976). Cognitive social learning approach to morality and
self-regulation. In Lickona, T. (ed.), Moral Development and Behavior. New York: Rinehart & Winston.
Newman, M. A., Guy, M. E., & Mastracci, S. H. (2009). Beyond cognition: Affective
leadership and emotional labor. Public Administration Review, 69(1), 6-20. Norusis, M. J. (2008). SPSS 16.0 statistical procedures companion. Upper Saddle River,
NJ: Prentice Hall. O’Connor, D. & Yballe, L. (2007). Masow revisited: Constructing a road map of human
nature. Journal of Management Education, 31(6), 738-756. Palermo, J. & Evans, A. (2006). Relationships between personal values and reported
behavior on ethical scenarios for law students. Behavioral Sciences and the Law, 25: 121-136.
Pavlov, I. P. (1927). Conditional reflexes. New York: Dover Publications. Peters, D. H. (1968). Studies in personnel and industrial psychology (revised edition).
Industrial Management Review, 9(2), 118-120.
101
Petty, R. E., Cacioppo, J. T.,Sedikides, C., & Strathman, A. J. (1988). Affect and persuasion: A contemporary perspective. The American Behavioral Scientist, 31(3), 355-372.
Ponemon, L. A. & Gabhart, D. (1994). Ethical reasoning research in the accounting and
auditing professions. In Rest, J. (ed.), Moral development in the professions. Hillsdale, NJ: Erlbaum Associates.
Portillo, S., & DeHart-Davis, L., (2009). Gender and organizational rule abidance. Public
Administration Review, 69(2), 339-348. Posner, G. & Schmidt, W. (1984). Values and the American manager: An update.
California Management Review, 24(3), 206-216. Potter, L. H. (1999). With top performers, what’s inside counts. National Underwriter,
103(15), 8. Pratt, C. B. (1994). Applying classical ethical theories to ethical decision making in
public relations: Perrier's product recall. Management Communication, 88(1), 70-94.
Priluck, R. & Till, B. D. (2004). The role of contingency awareness, involvement, and
need for cognition in attitude formation. Academy of Marketing Science Journal, 32(3), 329-345.
Rahim, M. A., Buntzman, G. F., & White, D. (1999). An empirical study of the stages of
moral development and conflict management styles. The International Journal of Conflict Management, 10(2), 154-171.
Rawls, J. (1971). A Theory of Justice. Cambridge, MA: Harvard University Press. Rennie, D. L. (2007). Methodical hermeneutics and humanistic psychology. The
Humanistic Psychologist, 35(1), 1-14. Rest, J., Narvaez, D., Bebeau, J., & Thomas, S. (1999). Postconventional moral thinking:
A neo-Kohlbergian approach. Mahwah, NJ: Lawrence Erlbaum. Robbins, S. P. (2005). Managing and organizing people. Boston, MA: Pearson Custom
Publishing. Robinson, J. B., Shaver, P. R., & Wrightsman, L. S. (1991). Measures of personality and
social psychology attitudes. San Diego, CA: Academic Press. Rokeach, M. (1968). Beliefs, attitudes, and values. San Francisco, CA: JosseyBass.
102
Rokeach, M. (1973). The nature of values. New York: The Free Press. Rosener, J. B. (1990). Ways women lead. Harvard Business Review, November-
December: 119-125. Rouse, K. A. (2004). Beyond Maslow’s hierarchy of needs: What do people strive for?
Performance Improvement, 43(10), 27-32. Ryals, L. J. & Rogers, B. (2005). Sales compensation plans – One size does not fit all.
Journal of Targeting, Measurement and Analysis for Marketing, 13(4), 354-363. Saee, J. (2008). Best practice in global negotiation strategies for leaders and managers in
the 21st century. Journal of Business Economics and Management, 9(4), 309-318. Schein, E. H. (1996). Three cultures of management: The key to organizational learning.
MIT Sloan Management Review, 38(1), 9-20. Seligman, M. E. P. (1990). Learned optimism. New York: Knopf. Shimp, T. A. (1991). The role of subject awareness in classical conditioning: A case of
opposing ontologies and conflicting evidence. Advances in Consumer Research, 18(1), 158-163.
Shipley, C. J. & Kleiner, B. H. (2005). Compensation management of commissioned
sales employees. Management Research News, 28(2/3), 2-11. Shoemaker, M. E. (2003). Leadership behavior in sales managers: A level analysis.
Journal of Marketing Theory and Practice, 11(2), 17-29. Sikula, A. & Costa, A. D. (1994). Are women more ethical than men? Journal of
Business Ethics, 13(1): 859-871. Skinner, B. F. (1969). Contingency management in the classroom. Education, 90(2), 93-
101. Skinner, B. F. (1971). Contingencies of reinforcement. East Norwalk, CT: Appleton-
Century-Crofts. Spranger, E. (1928). Types of men. New York: G. E. Stechert Company. Stewart, D. J. (1998). Human factors research. Retrieved January 26, 2009, from Human
Factors Research Web Site: http://www.hfr.org.uk/figures/index.htm Stogdill, R. H. (1974). Handbook of Leadership. New York: Free Press.

103
Straw, J. (2002). The 4-dimensional manager. San Francisco, CA: Berrett-Koehler. Strutton, D., Pelton, L. E., & Lumpkin, J. R. (1993). The relationship between
psychological climate and salesperson-sales manager trust in sales organizations. Journal of Personal Selling and Sales Management, 13(4), 1-14.
Suiter, J. (2008). Are man and women in leadership roles in Luxembourg different? Tannen, D. (1995). The power of talk: Who gets heard and why. Harvard Business
Review, 73(5), 138-149. Target Training International (2008). How DISC is measured. Retrieved January 17,
2009, from TTI Performance Systems, Ltd. Web Site: http://www.ttidisc.com/products.php?product=discassessment.
Thompson, A. A., Strickland, A. J., & Gamble, J. E. (2007). Crafting and executing
strategy. New York: McGraw-Hill/Irwin. Tickle, E. L., Brownlee, J., & Nailon, D. (2005). Personal epistemological beliefs and
transformational leadership behaviours. The Journal of Management Development, 24(7/8), 706-719.
Tolman, E. C. (1932). Purposeful behavior in animals and men. New York: Appleton-
Century-Crofts. Turnasella, T. (2002). Pay and personality. Compensation and Benefits Review, 34(2),
49-59. Utley, D. R., Westbrook, J., & Turner, S. (1997). The relationship between Herzberg’s
two-factor theory and quality management. Engineering Management Journal, 9(3), 5-14.
Velasquez, M. G. (2006). Business ethics: Concepts and cases (6th ed.). Upper Saddle
River, NJ: Prentice Hall. Vinson, D. E., Scott, J. E., & Lamont, L. M. (1977). The role of personal values in
marketing and consumer behavior. Journal of Marketing, 41(4), 44-550. Vroom, V. H. (1976). Leadership. In Dunnette, M. D. (Ed.) Handbook of industrial and
organizational psychology (pp. 1527-1555). Chicago: Rand McNally. Wark, G. R. & Krebs, D. L. (1996). Gender and dilemma differences in real life moral
judgment. Developmental Psychology, 32(1), 220-230.
104
Wells, G. L. & Petty, R. E. (1980). The effects of overt head movements on persuasion: Compatibility and incompatibility of responses. Basic and Applied Social Psychology, 1(3), 219-230.
White, T. I. (1998). Sexual harassment: True and the ethic of care. Business & Society
Review, 100(101), 9-21. Wilson, D. H. (2007). A comparison of the Hermann brain dominance instrument and the
extended disc behavior profiling tool: An attempt to create a more discerning management perspective. Retrieved January 2, 2009 from ProQuest Digital Dissertations database. (UMI No. 3255609)
Wittig, A. F. (2002). Schaum’s outline of introduction of psychology. New York:
McGraw-Hill. Zikmund, W. G. (1984). Business research methods. New York: CBS College
Publishing.

105
Appendix
Raw Data
Gender Profession D_score I_score S_score C_score Theoretical Score
Utilitarian Score
Aestetic Score
Social Score
Individualistic Score
Traditional Score
Female Sales 4 8 5 2 41 51 46 37 42 35
Female Sales 3 6 5 7 48 51 27 46 43 37
Female Sales 2 5 7 6 39 70 24 34 47 38
Female Sales 10 7 1 4 45 37 34 61 39 36
Female Sales 9 8 1 2 41 50 16 47 52 46
Female Sales 6 8 2 1 57 48 34 34 49 30
Female Sales 9 9 0 3 32 45 34 50 45 46
Female Sales 12 6 0 4 46 28 53 60 27 38
Female Sales 2 13 2 2 58 48 37 40 33 36
Female Sales 7 5 4 5 54 42 42 42 37 35
Female Sales 5 12 0 5 35 54 39 26 45 53
Female Sales 10 7 1 3 46 40 28 42 52 44
Female Sales 6 8 5 4 41 51 18 50 53 39
Female Sales 3 5 6 6 49 53 24 47 42 37
Female Sales 2 6 8 4 68 49 13 38 39 45
Female Sales 6 5 5 6 33 64 23 49 38 45
Female Sales 4 9 2 4 49 46 15 51 46 45
Female Sales 8 2 3 4 54 28 60 41 31 38
Female Sales 6 8 1 5 47 35 24 56 34 56
Female Sales 1 2 5 8 30 45 51 53 42 31
Female Sales 4 4 8 5 45 52 42 44 34 35
Female Sales 6 2 9 3 40 52 37 43 45 35
Female Sales 2 4 5 8 45 31 44 48 28 56
Female Sales 6 9 3 3 52 51 21 28 56 44
Female Sales 1 9 5 4 35 51 25 41 48 52
Female Sales 4 5 10 3 58 53 27 39 40 35
Female Sales 10 6 0 4 53 48 20 30 56 45
Female Sales 4 5 8 6 29 55 39 30 61 38
Female Sales 7 6 5 5 38 44 25 48 46 51
Female Sales 7 8 5 3 47 58 36 32 36 43
Female Sales 8 8 2 5 43 44 18 42 45 60
Female Sales 12 7 1 2 51 51 32 34 49 35
Female Sales 1 7 6 5 41 54 15 46 63 33
Female Sales 2 6 8 3 55 40 17 50 48 42
Female Sales 5 4 5 7 31 63 20 42 45 51
Female Sales 2 6 7 7 46 69 30 33 46 28
Female Sales 8 6 3 3 43 58 26 38 43 44
Female Sales 16 2 0 3 44 55 12 40 53 48
Female Sales 2 3 8 3 53 60 27 27 52 33
Female Sales 0 2 10 8 51 55 22 32 54 38
Female Sales 2 3 6 9 39 54 31 52 41 35

106
Female Sales 15 5 0 1 42 47 37 52 38 36
Female Sales 2 9 2 7 49 56 21 41 34 51
Female Sales 6 9 1 4 50 53 24 49 38 38
Female Sales 4 6 7 4 48 51 27 46 43 37
Female Sales 7 11 1 1 58 54 21 27 52 40
Female Sales 4 8 5 2 56 40 28 29 47 52
Female Sales 7 7 3 5 54 45 36 48 32 37
Female Sales 3 6 5 7 50 39 32 48 31 52
Female Sales 3 8 4 5 58 48 37 40 33 36
Female Sales 6 2 5 3 41 50 43 40 35 43
Female Sales 6 3 7 3 37 53 23 46 50 43
Female Sales 2 5 7 6 47 57 22 42 36 48
Female Sales 3 8 8 2 33 64 23 49 38 45
Female Sales 10 7 1 4 39 42 30 50 46 45
Female Sales 3 7 5 2 54 35 32 47 48 36
Female Sales 12 3 1 2 43 36 53 42 37 41
Female Sales 4 7 5 6 46 69 30 33 46 28
Female Sales 5 9 2 4 39 47 26 34 54 52
Female Sales 3 5 7 7 34 39 36 52 42 49
Female Sales 3 10 4 2 40 27 33 59 41 52
Female Sales 9 8 1 2 37 65 24 35 55 36
Female Sales 9 7 2 1 57 52 26 31 46 40
Female Sales 3 2 8 8 54 57 46 33 38 24
Female Sales 9 6 2 4 54 49 16 34 55 44
Female Sales 1 9 5 2 41 51 18 50 53 39
Female Sales 5 7 4 5 40 48 42 43 43 36
Female Sales 4 8 8 0 39 45 20 50 46 52
Female Sales 0 12 5 1 48 60 22 33 46 43
Female Sales 6 7 4 4 50 50 30 40 45 37
Female Executive 4 3 6 3 44 41 16 50 57 44
Female Executive 9 8 2 3 64 31 23 55 43 36
Female Executive 8 3 6 4 36 52 21 48 48 47
Female Executive 4 2 9 5 57 62 32 35 40 26
Female Executive 5 9 4 2 52 52 24 41 35 48
Female Executive 11 5 1 2 52 29 41 51 34 45
Female Executive 0 8 6 4 46 57 42 34 27 46
Female Executive 0 3 11 6 44 51 27 27 48 55
Female Executive 2 8 7 5 47 49 20 48 41 47
Female Executive 10 4 3 2 55 41 35 36 44 41
Female Executive 7 1 4 7 31 31 36 69 26 59
Female Executive 1 6 8 6 64 61 29 31 40 27
Female Executive 4 11 2 4 32 52 35 46 40 47
Female Executive 3 5 7 5 47 50 44 43 29 39
Female Executive 9 4 6 3 56 40 21 50 53 32
Female Executive 5 4 6 5 23 47 26 58 43 55
Female Executive 12 7 1 1 54 51 44 32 37 34
Female Executive 0 10 5 5 39 62 20 45 32 54
Female Executive 3 2 8 6 48 50 32 45 33 44
Female Executive 7 6 4 1 56 63 20 25 55 33
Female Executive 1 6 8 3 34 51 19 54 51 43
Female Executive 9 3 7 3 46 50 15 45 52 44
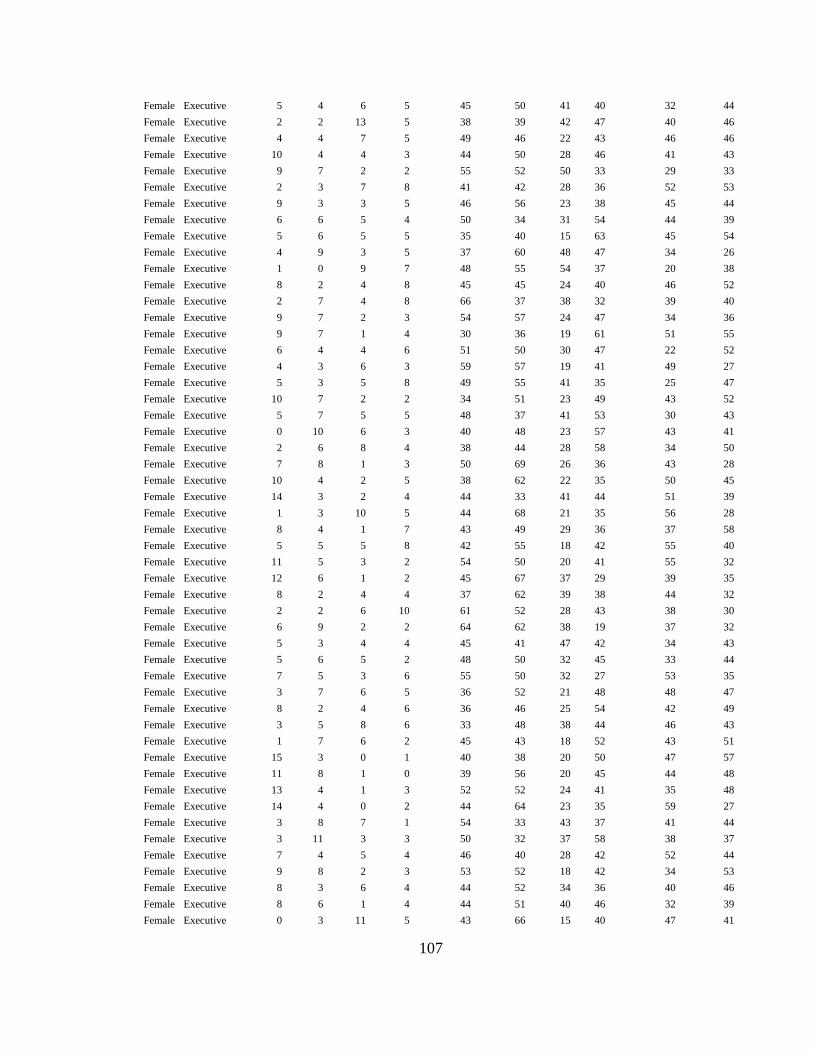
107
Female Executive 5 4 6 5 45 50 41 40 32 44
Female Executive 2 2 13 5 38 39 42 47 40 46
Female Executive 4 4 7 5 49 46 22 43 46 46
Female Executive 10 4 4 3 44 50 28 46 41 43
Female Executive 9 7 2 2 55 52 50 33 29 33
Female Executive 2 3 7 8 41 42 28 36 52 53
Female Executive 9 3 3 5 46 56 23 38 45 44
Female Executive 6 6 5 4 50 34 31 54 44 39
Female Executive 5 6 5 5 35 40 15 63 45 54
Female Executive 4 9 3 5 37 60 48 47 34 26
Female Executive 1 0 9 7 48 55 54 37 20 38
Female Executive 8 2 4 8 45 45 24 40 46 52
Female Executive 2 7 4 8 66 37 38 32 39 40
Female Executive 9 7 2 3 54 57 24 47 34 36
Female Executive 9 7 1 4 30 36 19 61 51 55
Female Executive 6 4 4 6 51 50 30 47 22 52
Female Executive 4 3 6 3 59 57 19 41 49 27
Female Executive 5 3 5 8 49 55 41 35 25 47
Female Executive 10 7 2 2 34 51 23 49 43 52
Female Executive 5 7 5 5 48 37 41 53 30 43
Female Executive 0 10 6 3 40 48 23 57 43 41
Female Executive 2 6 8 4 38 44 28 58 34 50
Female Executive 7 8 1 3 50 69 26 36 43 28
Female Executive 10 4 2 5 38 62 22 35 50 45
Female Executive 14 3 2 4 44 33 41 44 51 39
Female Executive 1 3 10 5 44 68 21 35 56 28
Female Executive 8 4 1 7 43 49 29 36 37 58
Female Executive 5 5 5 8 42 55 18 42 55 40
Female Executive 11 5 3 2 54 50 20 41 55 32
Female Executive 12 6 1 2 45 67 37 29 39 35
Female Executive 8 2 4 4 37 62 39 38 44 32
Female Executive 2 2 6 10 61 52 28 43 38 30
Female Executive 6 9 2 2 64 62 38 19 37 32
Female Executive 5 3 4 4 45 41 47 42 34 43
Female Executive 5 6 5 2 48 50 32 45 33 44
Female Executive 7 5 3 6 55 50 32 27 53 35
Female Executive 3 7 6 5 36 52 21 48 48 47
Female Executive 8 2 4 6 36 46 25 54 42 49
Female Executive 3 5 8 6 33 48 38 44 46 43
Female Executive 1 7 6 2 45 43 18 52 43 51
Female Executive 15 3 0 1 40 38 20 50 47 57
Female Executive 11 8 1 0 39 56 20 45 44 48
Female Executive 13 4 1 3 52 52 24 41 35 48
Female Executive 14 4 0 2 44 64 23 35 59 27
Female Executive 3 8 7 1 54 33 43 37 41 44
Female Executive 3 11 3 3 50 32 37 58 38 37
Female Executive 7 4 5 4 46 40 28 42 52 44
Female Executive 9 8 2 3 53 52 18 42 34 53
Female Executive 8 3 6 4 44 52 34 36 40 46
Female Executive 8 6 1 4 44 51 40 46 32 39
Female Executive 0 3 11 5 43 66 15 40 47 41

108
Female Executive 3 8 7 3 46 54 16 53 45 38
Female Executive 12 2 2 1 53 35 23 50 42 49
Female Executive 4 2 9 5 53 43 43 36 46 31
Female Executive 13 5 1 0 54 46 50 28 41 33
Female Executive 7 8 2 2 42 64 22 46 37 41
Female Executive 11 4 5 2 34 41 48 37 49 43
Male Sales 10 2 4 5 55 62 38 25 42 30
Male Sales 5 2 10 5 49 65 17 40 46 35
Male Sales 8 8 0 3 43 59 36 35 51 28
Male Sales 2 12 4 3 62 55 28 34 38 35
Male Sales 3 10 3 3 42 49 26 41 49 45
Male Sales 0 0 9 8 56 50 18 33 51 44
Male Sales 7 8 3 5 44 48 19 48 59 34
Male Sales 4 2 7 6 30 31 31 58 39 63
Male Sales 7 9 2 2 49 48 15 52 45 43
Male Sales 6 8 3 4 40 47 27 52 37 49
Male Sales 7 8 3 2 45 44 20 49 53 41
Male Sales 6 7 4 3 36 47 20 43 53 53
Male Sales 2 8 7 6 36 46 28 53 46 43
Male Sales 5 10 4 1 39 58 19 55 42 39
Male Sales 7 9 2 1 42 42 40 42 41 45
Male Sales 4 11 2 1 55 64 22 37 44 30
Male Sales 4 4 6 6 34 48 18 52 47 53
Male Sales 3 6 8 3 42 45 29 48 44 44
Male Sales 2 6 6 6 37 53 15 45 60 42
Male Sales 8 3 7 6 33 45 36 55 29 54
Male Sales 8 1 5 8 62 27 40 60 32 31
Male Sales 3 5 7 5 58 57 28 27 37 45
Male Sales 9 5 2 5 55 60 49 33 32 23
Male Sales 10 4 3 4 36 56 22 48 38 52
Male Sales 5 7 5 4 36 42 47 47 33 47
Male Sales 7 8 2 6 45 45 23 48 46 45
Male Sales 6 12 1 2 26 44 20 59 50 53
Male Sales 8 3 3 8 58 50 31 31 42 40
Male Sales 5 8 3 5 54 46 17 50 45 40
Male Sales 6 3 4 3 58 41 22 44 49 38
Male Sales 11 2 3 6 55 60 26 37 40 34
Male Sales 4 5 4 8 58 32 34 53 32 43
Male Sales 6 9 1 3 41 60 28 40 46 37
Male Sales 8 7 2 3 56 44 22 44 47 39
Male Sales 2 12 6 3 53 41 31 36 51 40
Male Sales 5 6 5 4 31 41 55 39 41 45
Male Sales 17 0 0 3 49 47 32 64 27 33
Male Sales 9 2 5 5 31 61 16 40 53 51
Male Sales 10 7 3 1 58 60 21 27 48 38
Male Sales 11 7 1 2 31 70 16 41 55 39
Male Sales 6 6 3 3 50 45 25 47 34 51
Male Sales 7 6 5 2 62 56 33 22 37 42
Male Sales 9 10 1 1 43 59 14 40 54 42
Male Sales 16 2 1 2 49 65 21 39 46 32
Male Sales 12 3 1 4 47 60 33 35 47 30
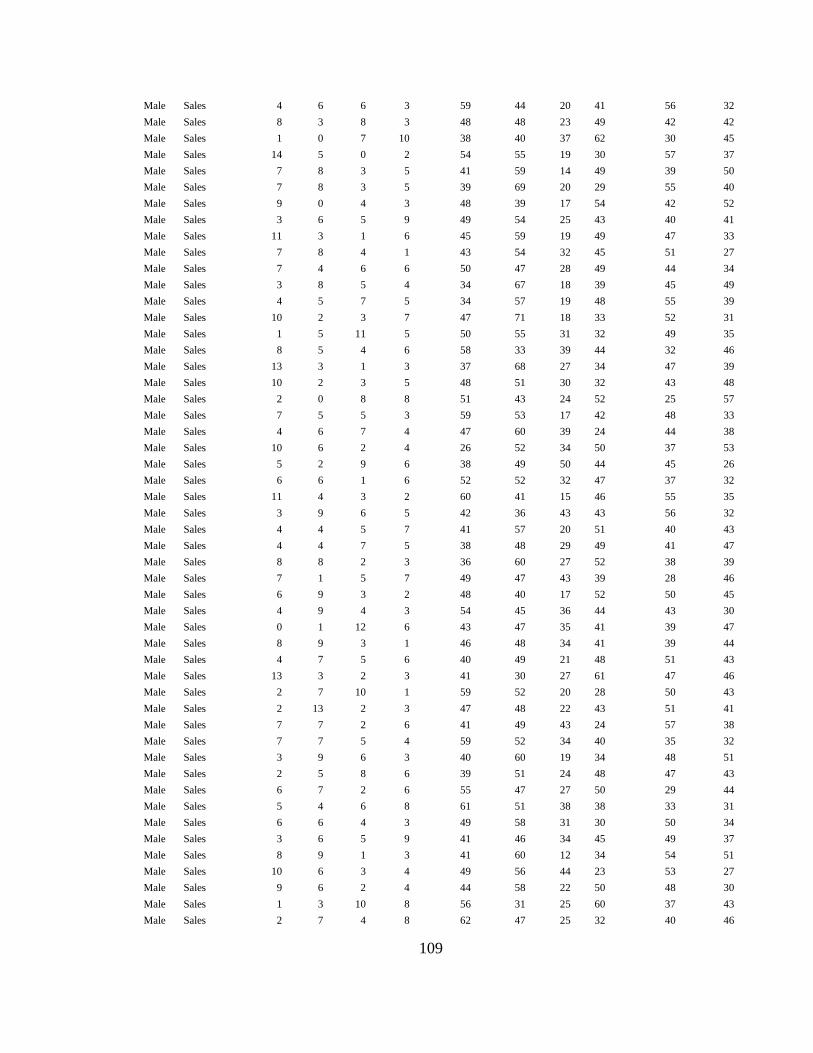
109
Male Sales 4 6 6 3 59 44 20 41 56 32
Male Sales 8 3 8 3 48 48 23 49 42 42
Male Sales 1 0 7 10 38 40 37 62 30 45
Male Sales 14 5 0 2 54 55 19 30 57 37
Male Sales 7 8 3 5 41 59 14 49 39 50
Male Sales 7 8 3 5 39 69 20 29 55 40
Male Sales 9 0 4 3 48 39 17 54 42 52
Male Sales 3 6 5 9 49 54 25 43 40 41
Male Sales 11 3 1 6 45 59 19 49 47 33
Male Sales 7 8 4 1 43 54 32 45 51 27
Male Sales 7 4 6 6 50 47 28 49 44 34
Male Sales 3 8 5 4 34 67 18 39 45 49
Male Sales 4 5 7 5 34 57 19 48 55 39
Male Sales 10 2 3 7 47 71 18 33 52 31
Male Sales 1 5 11 5 50 55 31 32 49 35
Male Sales 8 5 4 6 58 33 39 44 32 46
Male Sales 13 3 1 3 37 68 27 34 47 39
Male Sales 10 2 3 5 48 51 30 32 43 48
Male Sales 2 0 8 8 51 43 24 52 25 57
Male Sales 7 5 5 3 59 53 17 42 48 33
Male Sales 4 6 7 4 47 60 39 24 44 38
Male Sales 10 6 2 4 26 52 34 50 37 53
Male Sales 5 2 9 6 38 49 50 44 45 26
Male Sales 6 6 1 6 52 52 32 47 37 32
Male Sales 11 4 3 2 60 41 15 46 55 35
Male Sales 3 9 6 5 42 36 43 43 56 32
Male Sales 4 4 5 7 41 57 20 51 40 43
Male Sales 4 4 7 5 38 48 29 49 41 47
Male Sales 8 8 2 3 36 60 27 52 38 39
Male Sales 7 1 5 7 49 47 43 39 28 46
Male Sales 6 9 3 2 48 40 17 52 50 45
Male Sales 4 9 4 3 54 45 36 44 43 30
Male Sales 0 1 12 6 43 47 35 41 39 47
Male Sales 8 9 3 1 46 48 34 41 39 44
Male Sales 4 7 5 6 40 49 21 48 51 43
Male Sales 13 3 2 3 41 30 27 61 47 46
Male Sales 2 7 10 1 59 52 20 28 50 43
Male Sales 2 13 2 3 47 48 22 43 51 41
Male Sales 7 7 2 6 41 49 43 24 57 38
Male Sales 7 7 5 4 59 52 34 40 35 32
Male Sales 3 9 6 3 40 60 19 34 48 51
Male Sales 2 5 8 6 39 51 24 48 47 43
Male Sales 6 7 2 6 55 47 27 50 29 44
Male Sales 5 4 6 8 61 51 38 38 33 31
Male Sales 6 6 4 3 49 58 31 30 50 34
Male Sales 3 6 5 9 41 46 34 45 49 37
Male Sales 8 9 1 3 41 60 12 34 54 51
Male Sales 10 6 3 4 49 56 44 23 53 27
Male Sales 9 6 2 4 44 58 22 50 48 30
Male Sales 1 3 10 8 56 31 25 60 37 43
Male Sales 2 7 4 8 62 47 25 32 40 46
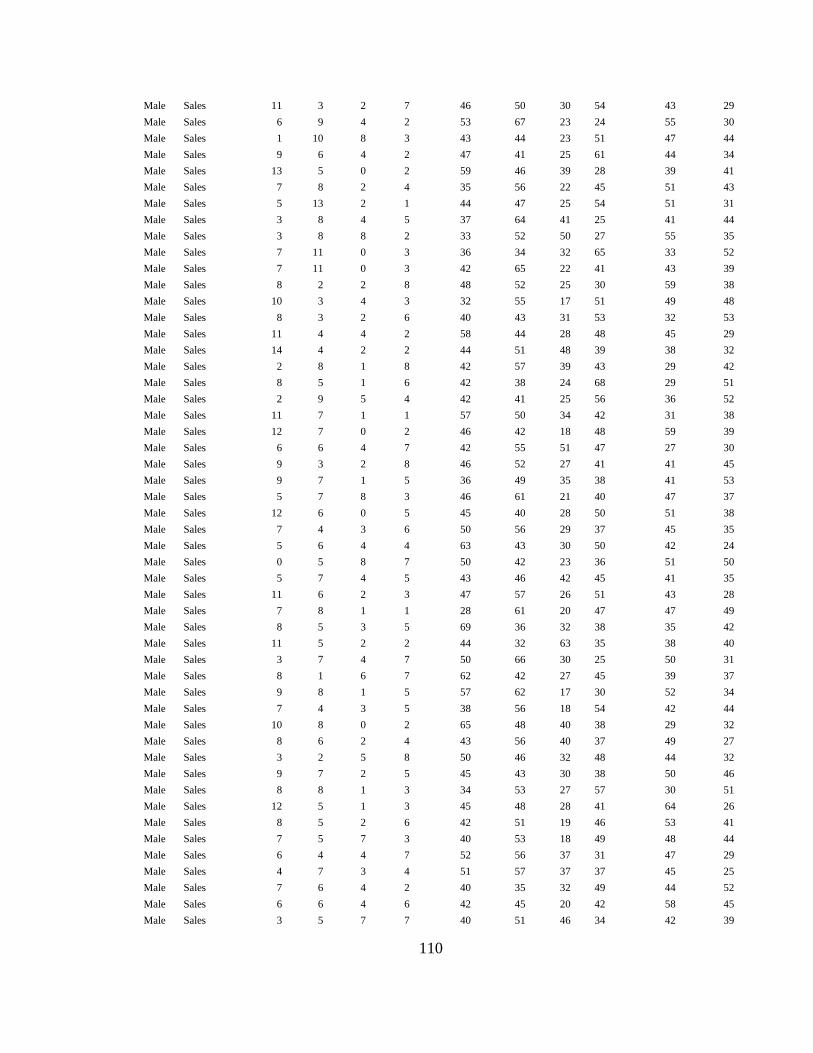
110
Male Sales 11 3 2 7 46 50 30 54 43 29
Male Sales 6 9 4 2 53 67 23 24 55 30
Male Sales 1 10 8 3 43 44 23 51 47 44
Male Sales 9 6 4 2 47 41 25 61 44 34
Male Sales 13 5 0 2 59 46 39 28 39 41
Male Sales 7 8 2 4 35 56 22 45 51 43
Male Sales 5 13 2 1 44 47 25 54 51 31
Male Sales 3 8 4 5 37 64 41 25 41 44
Male Sales 3 8 8 2 33 52 50 27 55 35
Male Sales 7 11 0 3 36 34 32 65 33 52
Male Sales 7 11 0 3 42 65 22 41 43 39
Male Sales 8 2 2 8 48 52 25 30 59 38
Male Sales 10 3 4 3 32 55 17 51 49 48
Male Sales 8 3 2 6 40 43 31 53 32 53
Male Sales 11 4 4 2 58 44 28 48 45 29
Male Sales 14 4 2 2 44 51 48 39 38 32
Male Sales 2 8 1 8 42 57 39 43 29 42
Male Sales 8 5 1 6 42 38 24 68 29 51
Male Sales 2 9 5 4 42 41 25 56 36 52
Male Sales 11 7 1 1 57 50 34 42 31 38
Male Sales 12 7 0 2 46 42 18 48 59 39
Male Sales 6 6 4 7 42 55 51 47 27 30
Male Sales 9 3 2 8 46 52 27 41 41 45
Male Sales 9 7 1 5 36 49 35 38 41 53
Male Sales 5 7 8 3 46 61 21 40 47 37
Male Sales 12 6 0 5 45 40 28 50 51 38
Male Sales 7 4 3 6 50 56 29 37 45 35
Male Sales 5 6 4 4 63 43 30 50 42 24
Male Sales 0 5 8 7 50 42 23 36 51 50
Male Sales 5 7 4 5 43 46 42 45 41 35
Male Sales 11 6 2 3 47 57 26 51 43 28
Male Sales 7 8 1 1 28 61 20 47 47 49
Male Sales 8 5 3 5 69 36 32 38 35 42
Male Sales 11 5 2 2 44 32 63 35 38 40
Male Sales 3 7 4 7 50 66 30 25 50 31
Male Sales 8 1 6 7 62 42 27 45 39 37
Male Sales 9 8 1 5 57 62 17 30 52 34
Male Sales 7 4 3 5 38 56 18 54 42 44
Male Sales 10 8 0 2 65 48 40 38 29 32
Male Sales 8 6 2 4 43 56 40 37 49 27
Male Sales 3 2 5 8 50 46 32 48 44 32
Male Sales 9 7 2 5 45 43 30 38 50 46
Male Sales 8 8 1 3 34 53 27 57 30 51
Male Sales 12 5 1 3 45 48 28 41 64 26
Male Sales 8 5 2 6 42 51 19 46 53 41
Male Sales 7 5 7 3 40 53 18 49 48 44
Male Sales 6 4 4 7 52 56 37 31 47 29
Male Sales 4 7 3 4 51 57 37 37 45 25
Male Sales 7 6 4 2 40 35 32 49 44 52
Male Sales 6 6 4 6 42 45 20 42 58 45
Male Sales 3 5 7 7 40 51 46 34 42 39
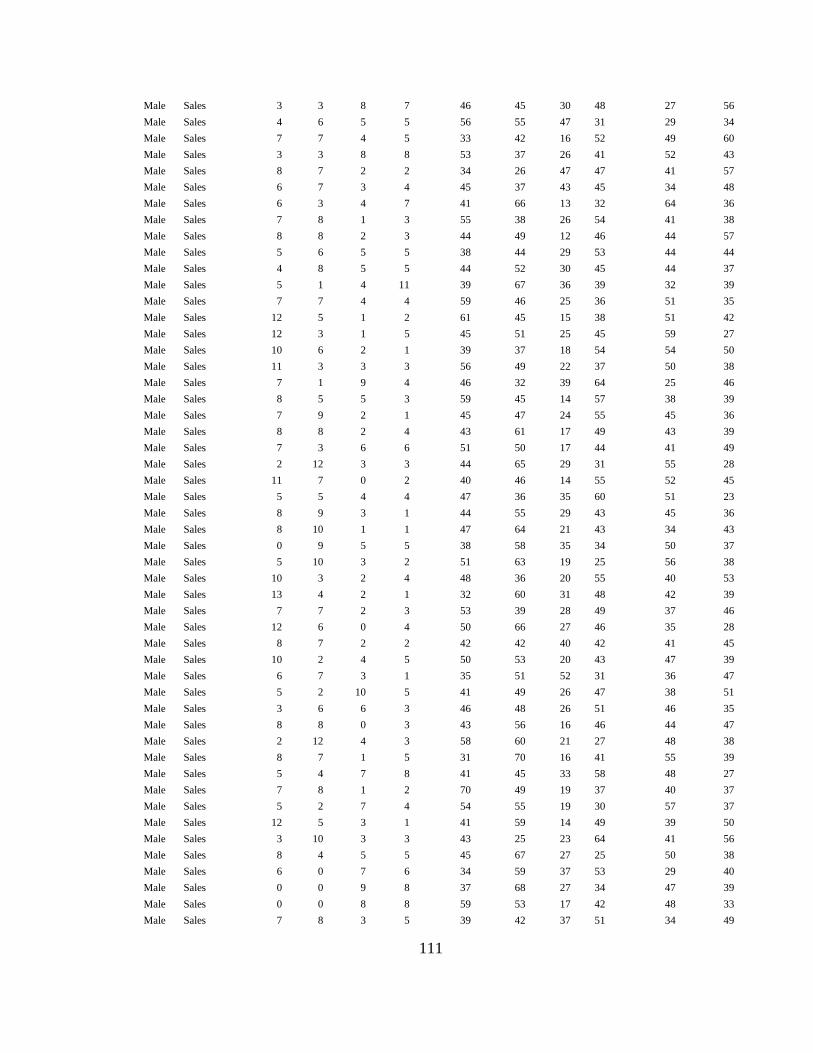
111
Male Sales 3 3 8 7 46 45 30 48 27 56
Male Sales 4 6 5 5 56 55 47 31 29 34
Male Sales 7 7 4 5 33 42 16 52 49 60
Male Sales 3 3 8 8 53 37 26 41 52 43
Male Sales 8 7 2 2 34 26 47 47 41 57
Male Sales 6 7 3 4 45 37 43 45 34 48
Male Sales 6 3 4 7 41 66 13 32 64 36
Male Sales 7 8 1 3 55 38 26 54 41 38
Male Sales 8 8 2 3 44 49 12 46 44 57
Male Sales 5 6 5 5 38 44 29 53 44 44
Male Sales 4 8 5 5 44 52 30 45 44 37
Male Sales 5 1 4 11 39 67 36 39 32 39
Male Sales 7 7 4 4 59 46 25 36 51 35
Male Sales 12 5 1 2 61 45 15 38 51 42
Male Sales 12 3 1 5 45 51 25 45 59 27
Male Sales 10 6 2 1 39 37 18 54 54 50
Male Sales 11 3 3 3 56 49 22 37 50 38
Male Sales 7 1 9 4 46 32 39 64 25 46
Male Sales 8 5 5 3 59 45 14 57 38 39
Male Sales 7 9 2 1 45 47 24 55 45 36
Male Sales 8 8 2 4 43 61 17 49 43 39
Male Sales 7 3 6 6 51 50 17 44 41 49
Male Sales 2 12 3 3 44 65 29 31 55 28
Male Sales 11 7 0 2 40 46 14 55 52 45
Male Sales 5 5 4 4 47 36 35 60 51 23
Male Sales 8 9 3 1 44 55 29 43 45 36
Male Sales 8 10 1 1 47 64 21 43 34 43
Male Sales 0 9 5 5 38 58 35 34 50 37
Male Sales 5 10 3 2 51 63 19 25 56 38
Male Sales 10 3 2 4 48 36 20 55 40 53
Male Sales 13 4 2 1 32 60 31 48 42 39
Male Sales 7 7 2 3 53 39 28 49 37 46
Male Sales 12 6 0 4 50 66 27 46 35 28
Male Sales 8 7 2 2 42 42 40 42 41 45
Male Sales 10 2 4 5 50 53 20 43 47 39
Male Sales 6 7 3 1 35 51 52 31 36 47
Male Sales 5 2 10 5 41 49 26 47 38 51
Male Sales 3 6 6 3 46 48 26 51 46 35
Male Sales 8 8 0 3 43 56 16 46 44 47
Male Sales 2 12 4 3 58 60 21 27 48 38
Male Sales 8 7 1 5 31 70 16 41 55 39
Male Sales 5 4 7 8 41 45 33 58 48 27
Male Sales 7 8 1 2 70 49 19 37 40 37
Male Sales 5 2 7 4 54 55 19 30 57 37
Male Sales 12 5 3 1 41 59 14 49 39 50
Male Sales 3 10 3 3 43 25 23 64 41 56
Male Sales 8 4 5 5 45 67 27 25 50 38
Male Sales 6 0 7 6 34 59 37 53 29 40
Male Sales 0 0 9 8 37 68 27 34 47 39
Male Sales 0 0 8 8 59 53 17 42 48 33
Male Sales 7 8 3 5 39 42 37 51 34 49

112
Male Sales 4 2 7 6 49 49 31 52 33 38
Male Sales 7 9 2 2 49 58 31 30 50 34
Male Sales 6 8 3 4 27 37 35 48 64 41
Male Sales 1 8 5 5 53 67 23 24 55 30
Male Sales 7 8 3 2 50 39 26 44 55 38
Male Sales 6 7 4 3 36 34 32 65 33 52
Male Sales 3 7 8 3 46 42 18 48 59 39
Male Sales 4 2 8 6 42 56 25 34 46 49
Male Sales 4 6 6 7 39 51 33 44 44 41
Male Sales 3 5 7 7 50 66 30 25 50 31
Male Sales 0 3 9 9 44 58 28 33 57 32
Male Sales 8 4 6 2 55 57 36 34 44 26
Male Sales 11 5 1 6 43 56 25 40 43 45
Male Sales 7 5 6 3 57 38 22 44 53 38
Male Sales 6 7 3 5 47 63 31 36 43 32
Male Sales 2 8 7 6 40 51 46 34 42 39
Male Sales 17 4 0 0 40 68 21 42 48 33
Male Sales 5 10 4 1 59 47 48 42 28 28
Male Sales 7 2 3 8 53 54 37 27 40 41
Male Sales 8 0 3 10 59 46 25 36 51 35
Male Sales 2 2 10 5 39 37 18 54 54 50
Male Sales 7 9 2 1 51 63 19 25 56 38
Male Sales 9 8 2 4 54 54 51 26 40 27
Male Sales 4 11 2 1 45 44 33 44 47 39
Male Sales 6 8 5 3 36 47 32 51 38 48
Male Sales 4 6 5 3 68 50 23 34 47 30
Male Sales 2 6 7 2 49 53 37 51 28 34
Male Sales 10 5 0 3 46 40 23 41 51 51
Male Sales 4 4 6 6 37 49 31 45 40 50
Male Sales 4 8 8 3 53 28 54 43 44 30
Male Sales 13 4 3 1 46 32 39 64 25 46
Male Sales 9 9 1 4 45 45 19 53 50 40
Male Executive 0 1 11 8 41 39 37 53 31 51
Male Executive 11 4 4 1 37 31 24 57 48 55
Male Executive 9 4 4 4 45 49 37 46 31 44
Male Executive 7 12 0 0 44 50 40 41 49 28
Male Executive 10 5 3 4 55 24 42 52 30 49
Male Executive 15 3 0 2 47 61 35 19 52 38
Male Executive 5 0 7 6 42 55 24 41 45 45
Male Executive 0 6 10 5 50 59 21 37 47 38
Male Executive 0 8 9 4 28 54 47 53 27 43
Male Executive 7 5 3 7 42 30 54 47 31 48
Male Executive 5 12 0 2 55 31 37 42 43 44
Male Executive 11 6 0 2 58 47 39 34 43 31
Male Executive 4 7 8 3 43 35 24 50 52 48
Male Executive 5 5 5 8 60 37 48 45 24 38
Male Executive 4 5 5 8 29 56 24 60 43 40
Male Executive 8 8 1 6 45 53 27 51 24 52
Male Executive 1 7 7 8 42 42 27 53 45 43
Male Executive 7 10 1 3 46 33 29 50 52 42
Male Executive 11 5 2 4 41 58 23 42 48 40
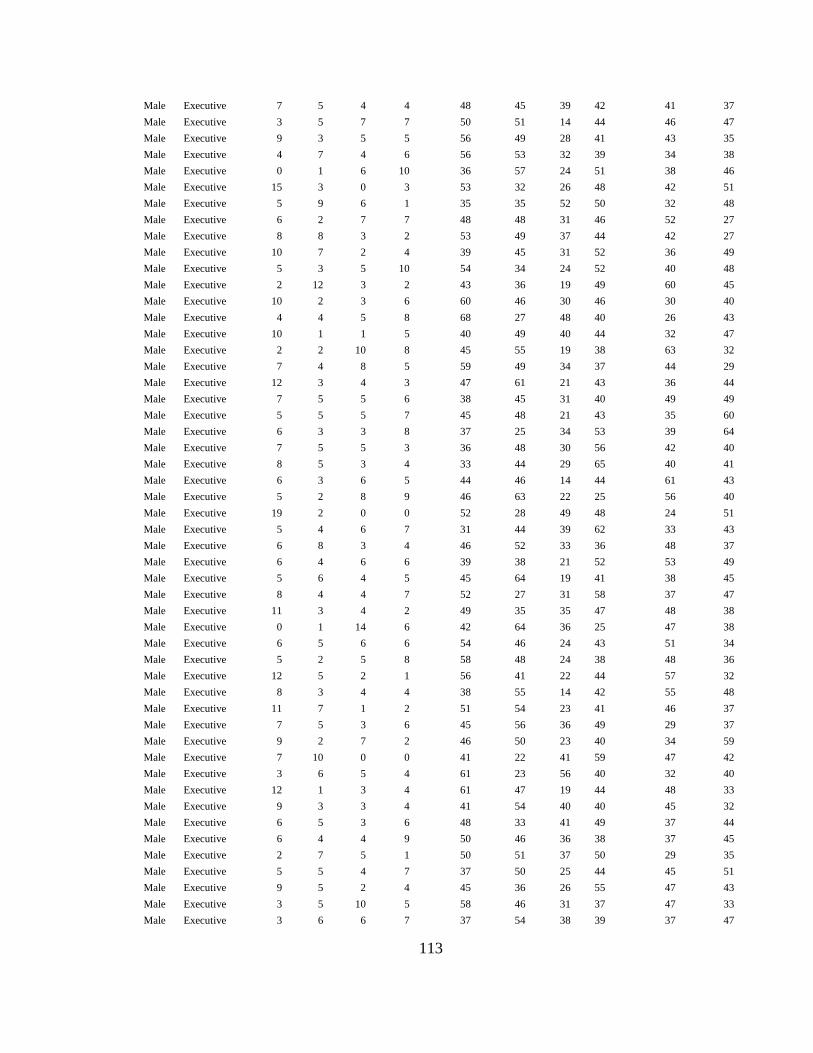
113
Male Executive 7 5 4 4 48 45 39 42 41 37
Male Executive 3 5 7 7 50 51 14 44 46 47
Male Executive 9 3 5 5 56 49 28 41 43 35
Male Executive 4 7 4 6 56 53 32 39 34 38
Male Executive 0 1 6 10 36 57 24 51 38 46
Male Executive 15 3 0 3 53 32 26 48 42 51
Male Executive 5 9 6 1 35 35 52 50 32 48
Male Executive 6 2 7 7 48 48 31 46 52 27
Male Executive 8 8 3 2 53 49 37 44 42 27
Male Executive 10 7 2 4 39 45 31 52 36 49
Male Executive 5 3 5 10 54 34 24 52 40 48
Male Executive 2 12 3 2 43 36 19 49 60 45
Male Executive 10 2 3 6 60 46 30 46 30 40
Male Executive 4 4 5 8 68 27 48 40 26 43
Male Executive 10 1 1 5 40 49 40 44 32 47
Male Executive 2 2 10 8 45 55 19 38 63 32
Male Executive 7 4 8 5 59 49 34 37 44 29
Male Executive 12 3 4 3 47 61 21 43 36 44
Male Executive 7 5 5 6 38 45 31 40 49 49
Male Executive 5 5 5 7 45 48 21 43 35 60
Male Executive 6 3 3 8 37 25 34 53 39 64
Male Executive 7 5 5 3 36 48 30 56 42 40
Male Executive 8 5 3 4 33 44 29 65 40 41
Male Executive 6 3 6 5 44 46 14 44 61 43
Male Executive 5 2 8 9 46 63 22 25 56 40
Male Executive 19 2 0 0 52 28 49 48 24 51
Male Executive 5 4 6 7 31 44 39 62 33 43
Male Executive 6 8 3 4 46 52 33 36 48 37
Male Executive 6 4 6 6 39 38 21 52 53 49
Male Executive 5 6 4 5 45 64 19 41 38 45
Male Executive 8 4 4 7 52 27 31 58 37 47
Male Executive 11 3 4 2 49 35 35 47 48 38
Male Executive 0 1 14 6 42 64 36 25 47 38
Male Executive 6 5 6 6 54 46 24 43 51 34
Male Executive 5 2 5 8 58 48 24 38 48 36
Male Executive 12 5 2 1 56 41 22 44 57 32
Male Executive 8 3 4 4 38 55 14 42 55 48
Male Executive 11 7 1 2 51 54 23 41 46 37
Male Executive 7 5 3 6 45 56 36 49 29 37
Male Executive 9 2 7 2 46 50 23 40 34 59
Male Executive 7 10 0 0 41 22 41 59 47 42
Male Executive 3 6 5 4 61 23 56 40 32 40
Male Executive 12 1 3 4 61 47 19 44 48 33
Male Executive 9 3 3 4 41 54 40 40 45 32
Male Executive 6 5 3 6 48 33 41 49 37 44
Male Executive 6 4 4 9 50 46 36 38 37 45
Male Executive 2 7 5 1 50 51 37 50 29 35
Male Executive 5 5 4 7 37 50 25 44 45 51
Male Executive 9 5 2 4 45 36 26 55 47 43
Male Executive 3 5 10 5 58 46 31 37 47 33
Male Executive 3 6 6 7 37 54 38 39 37 47
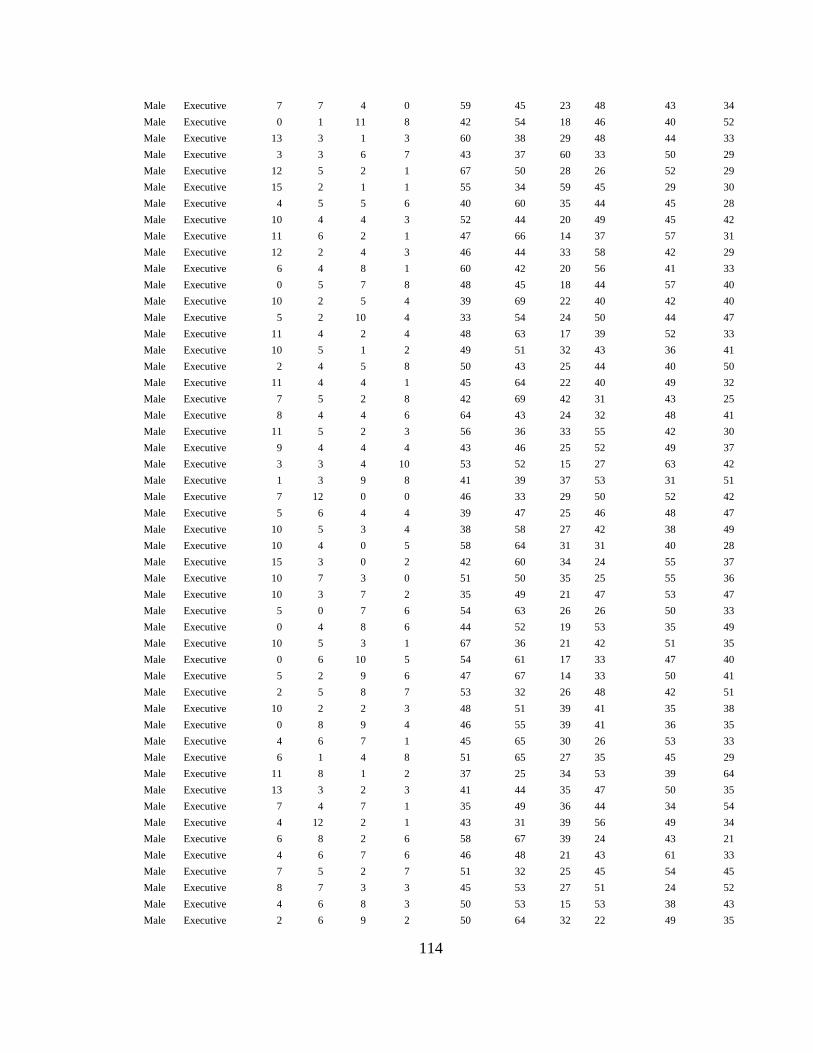
114
Male Executive 7 7 4 0 59 45 23 48 43 34
Male Executive 0 1 11 8 42 54 18 46 40 52
Male Executive 13 3 1 3 60 38 29 48 44 33
Male Executive 3 3 6 7 43 37 60 33 50 29
Male Executive 12 5 2 1 67 50 28 26 52 29
Male Executive 15 2 1 1 55 34 59 45 29 30
Male Executive 4 5 5 6 40 60 35 44 45 28
Male Executive 10 4 4 3 52 44 20 49 45 42
Male Executive 11 6 2 1 47 66 14 37 57 31
Male Executive 12 2 4 3 46 44 33 58 42 29
Male Executive 6 4 8 1 60 42 20 56 41 33
Male Executive 0 5 7 8 48 45 18 44 57 40
Male Executive 10 2 5 4 39 69 22 40 42 40
Male Executive 5 2 10 4 33 54 24 50 44 47
Male Executive 11 4 2 4 48 63 17 39 52 33
Male Executive 10 5 1 2 49 51 32 43 36 41
Male Executive 2 4 5 8 50 43 25 44 40 50
Male Executive 11 4 4 1 45 64 22 40 49 32
Male Executive 7 5 2 8 42 69 42 31 43 25
Male Executive 8 4 4 6 64 43 24 32 48 41
Male Executive 11 5 2 3 56 36 33 55 42 30
Male Executive 9 4 4 4 43 46 25 52 49 37
Male Executive 3 3 4 10 53 52 15 27 63 42
Male Executive 1 3 9 8 41 39 37 53 31 51
Male Executive 7 12 0 0 46 33 29 50 52 42
Male Executive 5 6 4 4 39 47 25 46 48 47
Male Executive 10 5 3 4 38 58 27 42 38 49
Male Executive 10 4 0 5 58 64 31 31 40 28
Male Executive 15 3 0 2 42 60 34 24 55 37
Male Executive 10 7 3 0 51 50 35 25 55 36
Male Executive 10 3 7 2 35 49 21 47 53 47
Male Executive 5 0 7 6 54 63 26 26 50 33
Male Executive 0 4 8 6 44 52 19 53 35 49
Male Executive 10 5 3 1 67 36 21 42 51 35
Male Executive 0 6 10 5 54 61 17 33 47 40
Male Executive 5 2 9 6 47 67 14 33 50 41
Male Executive 2 5 8 7 53 32 26 48 42 51
Male Executive 10 2 2 3 48 51 39 41 35 38
Male Executive 0 8 9 4 46 55 39 41 36 35
Male Executive 4 6 7 1 45 65 30 26 53 33
Male Executive 6 1 4 8 51 65 27 35 45 29
Male Executive 11 8 1 2 37 25 34 53 39 64
Male Executive 13 3 2 3 41 44 35 47 50 35
Male Executive 7 4 7 1 35 49 36 44 34 54
Male Executive 4 12 2 1 43 31 39 56 49 34
Male Executive 6 8 2 6 58 67 39 24 43 21
Male Executive 4 6 7 6 46 48 21 43 61 33
Male Executive 7 5 2 7 51 32 25 45 54 45
Male Executive 8 7 3 3 45 53 27 51 24 52
Male Executive 4 6 8 3 50 53 15 53 38 43
Male Executive 2 6 9 2 50 64 32 22 49 35
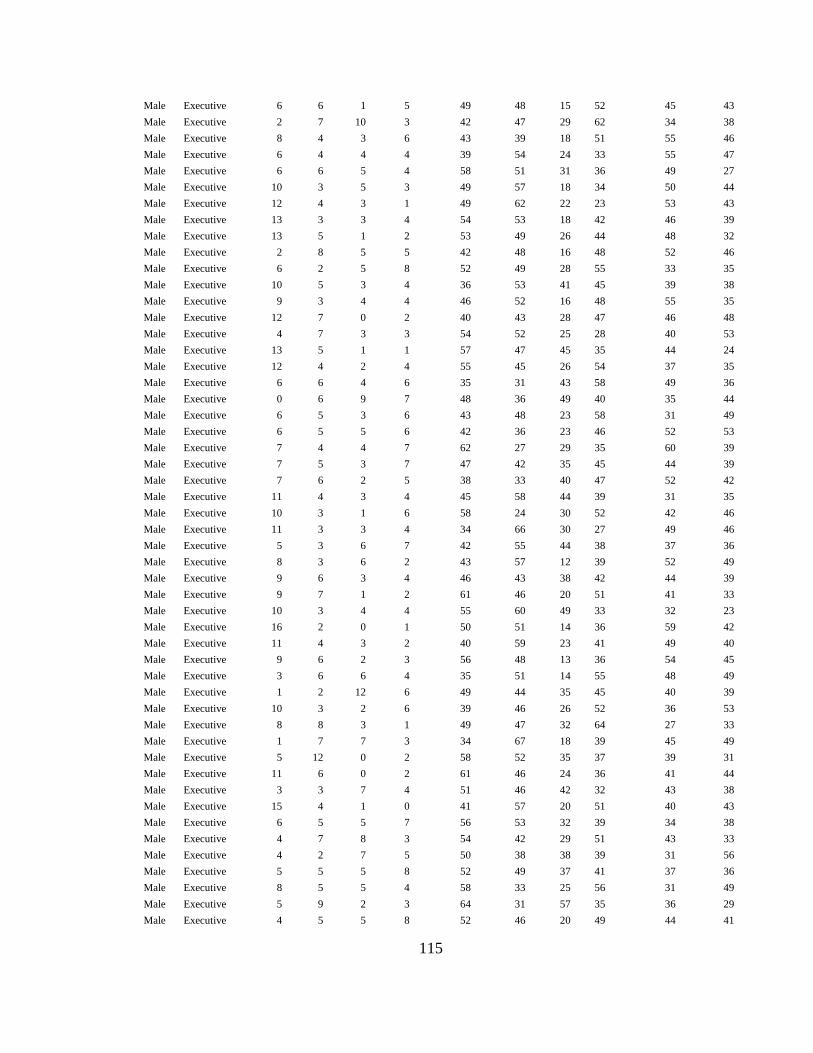
115
Male Executive 6 6 1 5 49 48 15 52 45 43
Male Executive 2 7 10 3 42 47 29 62 34 38
Male Executive 8 4 3 6 43 39 18 51 55 46
Male Executive 6 4 4 4 39 54 24 33 55 47
Male Executive 6 6 5 4 58 51 31 36 49 27
Male Executive 10 3 5 3 49 57 18 34 50 44
Male Executive 12 4 3 1 49 62 22 23 53 43
Male Executive 13 3 3 4 54 53 18 42 46 39
Male Executive 13 5 1 2 53 49 26 44 48 32
Male Executive 2 8 5 5 42 48 16 48 52 46
Male Executive 6 2 5 8 52 49 28 55 33 35
Male Executive 10 5 3 4 36 53 41 45 39 38
Male Executive 9 3 4 4 46 52 16 48 55 35
Male Executive 12 7 0 2 40 43 28 47 46 48
Male Executive 4 7 3 3 54 52 25 28 40 53
Male Executive 13 5 1 1 57 47 45 35 44 24
Male Executive 12 4 2 4 55 45 26 54 37 35
Male Executive 6 6 4 6 35 31 43 58 49 36
Male Executive 0 6 9 7 48 36 49 40 35 44
Male Executive 6 5 3 6 43 48 23 58 31 49
Male Executive 6 5 5 6 42 36 23 46 52 53
Male Executive 7 4 4 7 62 27 29 35 60 39
Male Executive 7 5 3 7 47 42 35 45 44 39
Male Executive 7 6 2 5 38 33 40 47 52 42
Male Executive 11 4 3 4 45 58 44 39 31 35
Male Executive 10 3 1 6 58 24 30 52 42 46
Male Executive 11 3 3 4 34 66 30 27 49 46
Male Executive 5 3 6 7 42 55 44 38 37 36
Male Executive 8 3 6 2 43 57 12 39 52 49
Male Executive 9 6 3 4 46 43 38 42 44 39
Male Executive 9 7 1 2 61 46 20 51 41 33
Male Executive 10 3 4 4 55 60 49 33 32 23
Male Executive 16 2 0 1 50 51 14 36 59 42
Male Executive 11 4 3 2 40 59 23 41 49 40
Male Executive 9 6 2 3 56 48 13 36 54 45
Male Executive 3 6 6 4 35 51 14 55 48 49
Male Executive 1 2 12 6 49 44 35 45 40 39
Male Executive 10 3 2 6 39 46 26 52 36 53
Male Executive 8 8 3 1 49 47 32 64 27 33
Male Executive 1 7 7 3 34 67 18 39 45 49
Male Executive 5 12 0 2 58 52 35 37 39 31
Male Executive 11 6 0 2 61 46 24 36 41 44
Male Executive 3 3 7 4 51 46 42 32 43 38
Male Executive 15 4 1 0 41 57 20 51 40 43
Male Executive 6 5 5 7 56 53 32 39 34 38
Male Executive 4 7 8 3 54 42 29 51 43 33
Male Executive 4 2 7 5 50 38 38 39 31 56
Male Executive 5 5 5 8 52 49 37 41 37 36
Male Executive 8 5 5 4 58 33 25 56 31 49
Male Executive 5 9 2 3 64 31 57 35 36 29
Male Executive 4 5 5 8 52 46 20 49 44 41
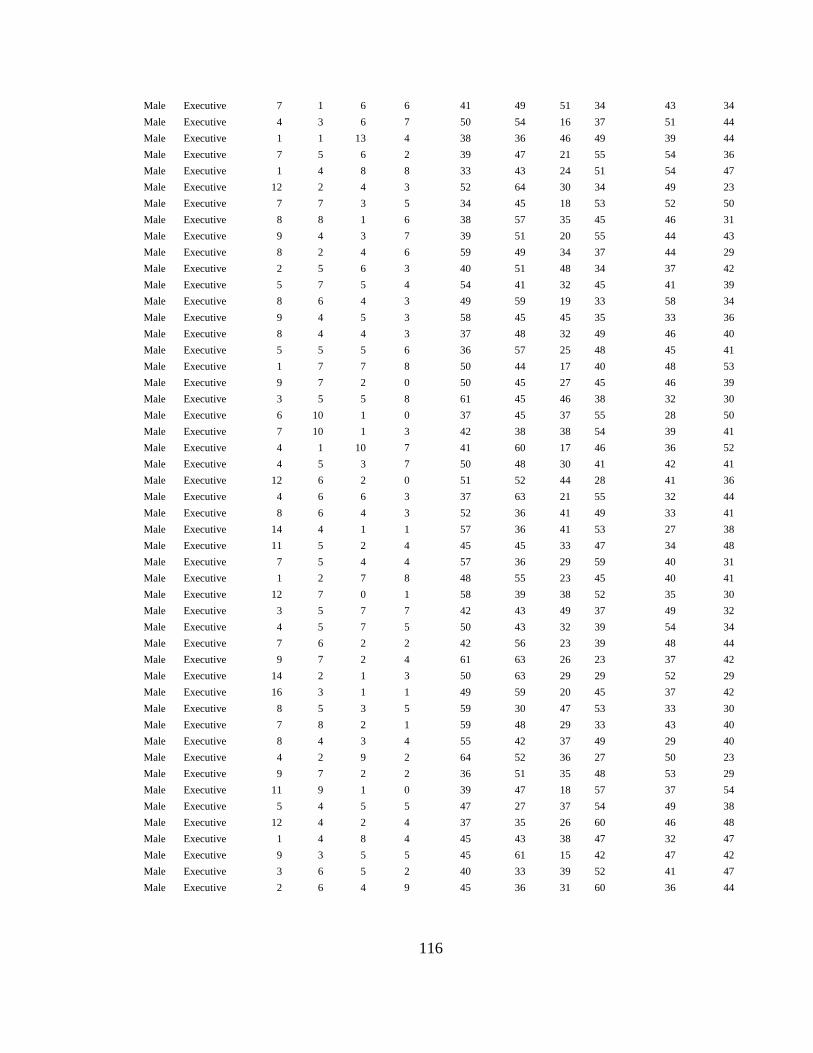
116
Male Executive 7 1 6 6 41 49 51 34 43 34
Male Executive 4 3 6 7 50 54 16 37 51 44
Male Executive 1 1 13 4 38 36 46 49 39 44
Male Executive 7 5 6 2 39 47 21 55 54 36
Male Executive 1 4 8 8 33 43 24 51 54 47
Male Executive 12 2 4 3 52 64 30 34 49 23
Male Executive 7 7 3 5 34 45 18 53 52 50
Male Executive 8 8 1 6 38 57 35 45 46 31
Male Executive 9 4 3 7 39 51 20 55 44 43
Male Executive 8 2 4 6 59 49 34 37 44 29
Male Executive 2 5 6 3 40 51 48 34 37 42
Male Executive 5 7 5 4 54 41 32 45 41 39
Male Executive 8 6 4 3 49 59 19 33 58 34
Male Executive 9 4 5 3 58 45 45 35 33 36
Male Executive 8 4 4 3 37 48 32 49 46 40
Male Executive 5 5 5 6 36 57 25 48 45 41
Male Executive 1 7 7 8 50 44 17 40 48 53
Male Executive 9 7 2 0 50 45 27 45 46 39
Male Executive 3 5 5 8 61 45 46 38 32 30
Male Executive 6 10 1 0 37 45 37 55 28 50
Male Executive 7 10 1 3 42 38 38 54 39 41
Male Executive 4 1 10 7 41 60 17 46 36 52
Male Executive 4 5 3 7 50 48 30 41 42 41
Male Executive 12 6 2 0 51 52 44 28 41 36
Male Executive 4 6 6 3 37 63 21 55 32 44
Male Executive 8 6 4 3 52 36 41 49 33 41
Male Executive 14 4 1 1 57 36 41 53 27 38
Male Executive 11 5 2 4 45 45 33 47 34 48
Male Executive 7 5 4 4 57 36 29 59 40 31
Male Executive 1 2 7 8 48 55 23 45 40 41
Male Executive 12 7 0 1 58 39 38 52 35 30
Male Executive 3 5 7 7 42 43 49 37 49 32
Male Executive 4 5 7 5 50 43 32 39 54 34
Male Executive 7 6 2 2 42 56 23 39 48 44
Male Executive 9 7 2 4 61 63 26 23 37 42
Male Executive 14 2 1 3 50 63 29 29 52 29
Male Executive 16 3 1 1 49 59 20 45 37 42
Male Executive 8 5 3 5 59 30 47 53 33 30
Male Executive 7 8 2 1 59 48 29 33 43 40
Male Executive 8 4 3 4 55 42 37 49 29 40
Male Executive 4 2 9 2 64 52 36 27 50 23
Male Executive 9 7 2 2 36 51 35 48 53 29
Male Executive 11 9 1 0 39 47 18 57 37 54
Male Executive 5 4 5 5 47 27 37 54 49 38
Male Executive 12 4 2 4 37 35 26 60 46 48
Male Executive 1 4 8 4 45 43 38 47 32 47
Male Executive 9 3 5 5 45 61 15 42 47 42
Male Executive 3 6 5 2 40 33 39 52 41 47
Male Executive 2 6 4 9 45 36 31 60 36 44

117


![Context-Aware Memory Dependence Profilingcorelab.yonsei.ac.kr/Pubs/mastersthesis_juhyun.pdf · 2018-07-24 · CAMP [This thesis] Byte Table 1.1 Comparison of memory profiling systems](https://img.dokumen.tips/doc/110x75/5f05a9fd7e708231d41415e5/context-aware-memory-dependence-2018-07-24-camp-this-thesis-byte-table-11-comparison.jpg)