Embed Size (px)
Citation preview

Comparison of Mineralization Styles in the OroBlanco Mining District, Santa Cruz County, Arizona
Item Type text; Thesis-Reproduction (electronic)
Authors Weiskopf, Thomas Andrew, 1959-
Publisher The University of Arizona.
Rights Copyright © is held by the author. Digital access to this materialis made possible by the University Libraries, University of Arizona.Further transmission, reproduction or presentation (such aspublic display or performance) of protected items is prohibitedexcept with permission of the author.
Download date 29/05/2018 07:53:32
Link to Item http://hdl.handle.net/10150/558227

On On O

A Comparison of Mineralization Styles in the Oro Blanco Mining District,
Santa Cruz County, Arizona
by 'Thomas Andrew Weiskopf
A Thesis Submitted to the Faculty of the DEPARTMENT OF GEOSCIENCES
In partial fulfillment of the Requirements for the degree of MASTER OF SCIENCE
In the Graduate College THE UNIVERSITY OF ARIZONA
19 9 4

2
STATEMENT BY AUTHOR
This thesis has been submitted in partial fulfillment of requirements for an advanced degree at the University of Arizona and is deposited in the University Library to be made available to borrowers under rules of the Library.
Brief quotations from this thesis are allowable without special permission, provided that accurate acknowledgement of source is made. Requests for permission for extended quotation from or reproduction of this manuscript in whole or in part may be granted by the head of the major department or the Dean of the Graduate College when in his or her judgement the proposed use of the material is in the interests of scholarship. In all other instances, however, permission must be obtained from the author.
This thesis has been approved on the date shown below:APPROVAL BY THESIS DIRECTOR
Professor of Geology
ACKNOWLEDGEMENTS
I would like to thank Stephen Van Nort and Alan Moran for suggesting this topic, and Dr. Spencer Titley for invaluable guidance during the research. I would also like to thank Drs. John Guilbert and Paul Damon whose reviews greatly improved the manuscript.
Generous financial support provided by Freeport McMoRan Gold Co. made this research possible.
Special thanks are extended to the residents of Arivaca and the Oro Blanco district who allowed access to the mines. Especially hospitable were Vernon Dale, Bill Ewing, and "Red" Heube, with whom conversation provided considerable insight and enjoyment.
I would like to extend gratitude for advice and friendship to Dr. Chris Eastoe, and fellow students Dan Sims, Matthew Knight, Bill Williams, Brooke Clements, and Tom McCandles. Matthew also provided assistance with the field work. Also, I would like to thank the geology staff at Phelps Dodge Morenci for their support, insight, and encouragement.
Finally I would like to thank Jean Mulvaney for her love, patience, and support during the research.

4Table of Contents
List of Illustrations...........................7
Abstract........................................ 12
1. INTRODUCTION.................................... 14Purpose and Method of Study................... 14Summary of Findings........................... 15Previous Work................................. 16Location...................................... 17History of Mining in the Oro Blanco District..19
2. GEOLOGY......................................... 22Jurassic Volcanic and Sediments...............22Jurassic? Cretaceous Sediments................26Tertiary Volcanic and Sediments...............27Intrusive Rocks............................... 27
Warsaw Quartz Monzonite...................27Ruby Diorite.............................. 28Sidewinder Quartz Monzonite...............28Rhyolite Dikes............................ 29Blue Ribbon Andesite...................... 30
Structural Geology............................ 31Attitudes................................. 31Metamorphic fabric........................ 31Faults..................................... 31Folds..................................... 34
3. MINERALIZATION.................................. 35Quartz-Sulfide Veins.......................... 35
Montana Mine............................. 36Silicified Zones.............................. 40
Old Glory Mine........................... 43Breccia Veins ................................ 46
Oro Blanco Mine.......................... 47Structural Orientation of MineralizationStyles........................................ 49Age of Mineralization......................... 54Production........ 54

5
4. GEOCHEMISTRY................................... 57Introduction................................. 57Previous Work................................ 58Comparison of Production Recordsand Sample Results............................58Element Abundance Distribution............... 64
Comparison of Mineralization Styles..... 68Gold..................................... 71Lead..................................... 73Zinc..................................... 76Silver...................................79Copper...................................79Molybdenum............. ................. 82Bismuth..................................85Antimony.................................88Manganese................................91Arsenic..................................94Thallium.................................96Tellurium................................96Mercury..................................100Tungsten.................................100
Elemental Ratio Distribution................. 103General Trends.......................... 103Silver versus Gold...................... 107Copper versus Gold...................... 108Lead versus Gold........................ 110Lead versus Copper...................... 113Lead versus Molybdenum.................. 118Antimony versus Arsenic................. 121Antimony versus Molybdenum.............. 124Antimony versus Bismuth................. 127Antimony versus Gold.................... 127Lead versus Silver...................... 132Lead versus Zinc........................ 135Antimony versus Zinc.................... 135Zinc versus Gold........................ 138Tellurium versus Thallium............... 141
Host Rock Geochemistry....................... 141Conclusions.................................. 148
5. FLUID INCLUSION STUDIES........................ 155Determination of origin....................... 155Measurements........... 156Overall results............................... 158Quartz-Sulfide Veins.......................... 162

Table of Contents— continuedMontana Mine.......................... 162Warsaw Mine........................... 167Idaho Mine............................ 172St. Christopher Mine.................. 176
Silicified Zones.......................... 177Old Glory Mine........................ 181Margarita Mine........................ 185
Breccia Veins............................. 189Oro Blanco Mine....................... 189
District-wide Variations.................. 1906. Discussion...................................... 195
Appendix 1......................................203Appendix 2...................................... 208References 210

7
List of Illustrations1. Location Map........ 182. Geologic Map of the Oro Blanco District..............233. Explanation for Figure 2............................. 244. Surface map of the Montana Mine...................... 375. Cross section of the Montana Mine.................... 386. Plan and cross section of the area occupied by
silicified zones..................................... 417. Plan view of the Old Glory Mine...................... 448. Plan view of the 125' level of the Oro Blanco
Mine..................................................489. Schmidt net plot of quartz-sulfide vein
orientations......................................... 5010. Schmidt net plot of silicified zone orientations.... 5111. Schmidt net plot of breccia vein orientations........5212. Production records summarized from the Arizona
Geological Survey data files......................... 5513. Comparison of silver values from production
records with mine averages from samples in thisstudy.................................................60
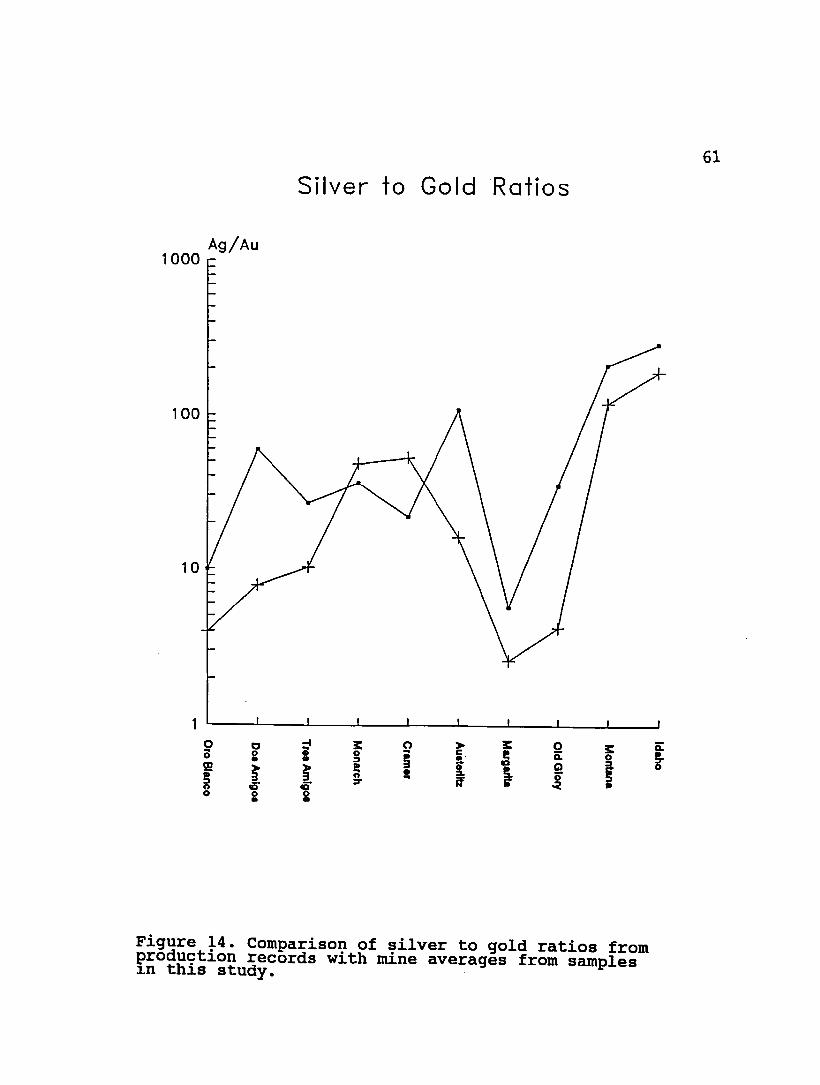
14. Comparison of silver to gold ratios from production records with mine averages from samples in thisstudy.................................................61
15. Comparison of sample averages with productiongrades from the Montana mine......................... 62
16. Comparison of sample averages with productiongrades from the Idaho mine........................... 63
17. Comparison of gold versus zinc values for relatively unoxidized and oxidized samples fromthe Montana and Idaho mines.......................... 65

8
18. Comparison of gold versus silver and copper values from relatively unoxidized and oxidized samplesfrom the Montana and Idaho mines.................... 66
19. Mine location map....................................6720. Comparison of the sample averages for each
mineralization style................................. 6921. Distribution of gold values.......................... 7222. Histogram of gold and lead values................... 7423. Distribution of lead values......................... 7524. Distribution of zinc values..........................7725. Histogram of zinc and silver values................. 7826. Distribution of silver values........................ 8027. Distribution of copper values........................ 8128. Histogram of copper and molybdenum values............8329. Distribution of molybdenum values.................... 8430. Distribution of bismuth values....................... 8631. Histogram of bismuth and antimony values.............8732. Distribution of antimony values...................... 8933. Plot of antimony versus silver + gold................9034. Distribution of manganese values..................... 9235. Histogram of manganese and arsenic values............9336. Distribution of arsenic values....................... 9537. Distribution of thallium values...................... 9738. Histogram of thallium and tellurium values...........9839. Distribution of tellurium values..................... 9940. Distribution of mercury values
List of Illustrations— Continued
101

9
41. Histogram of mercury and tungsten values............10242. Distribution of tungsten values..................... 10443. Silver / gold distribution..........................10844. Plot of silver versus gold..........................10945. Copper / gold distribution..........................Ill46. Plot of copper versus gold..........................11247. Lead / gold distribution............................ 11448. Plot of lead versus gold............................ 11549. Lead / copper distribution.......................... 11650. Plot of lead versus copper.......................... 11751. Lead / molybdenum distribution...................... 11952. Plot of lead versus molybdenum...................... 12053. Antimony / arsenic distribution..................... 12254. Plot of arsenic versus antimony..................... 12355. Antimony / molybdenum distribution.................. 12556. Plot of antimony versus molybdenum.................. 12657. Antimony / bismuth distribution..................... 12858. Plot of antimony versus bismuth..................... 12959. Antimony / gold distribution........................ 13060. Plot of antimony versus gold........................ 13161. Lead / silver distribution.............. 13362. Plot of lead versus silver.......................... 13463. Lead / zinc distribution............................ 13664. Plot of lead versus zinc............................ 137
List of Illustrations— Continued

10
65. Zinc / Antimony distribution........................13966. Plot of antimony versus zinc........................14067. Zinc / gold distribution............................14268. Plot of zinc versus gold............................ 14369. Tellurium / thallium distribution................... 14470. Plot of tellurium versus thallium................... 14571. Sample averages from unaltered Jurassic Volcanics
and Oro Blanco Conglomerate......................... 14672. Sample averages from the Ruby Diorite...............14773. Histogram of manganese values separated by host
lithology........................................... 14974. Histogram of gold values separated by host
lithology........................................... 15075. Histogram of copper values separated by host
lithology........................................... 15176. Plot of Tm ice versus Th measurements from the Oro
Blanco district..................................... 15977. Histogram of Th determinations on fluid
inclusions from the Montana mine.................... 16478. Histogram of Tm ice determinations on fluid
inclusions from the Montana mine.................... 16579. Plot of Tm ice versus Th from the Montana Mine...... 16680. Histogram of Th determinations on fluid
inclusions from the Warsaw mine..................... 16981. Histogram of Tm ice determinations on fluid
inclusions from the Warsaw mine................ 17082. Plot of Tm ice versus Th from the Warsaw Mine........17183. Histogram of Th determinations on fluid
inclusions from the Idaho mine...................17384. Histogram of Tm ice determinations on fluid
inclusions from the Idaho mine...................174
List of Illustrations— Continued

11List of Illustrations— Continued
85. Plot of Tm ice versus Th from the Idaho Mine....... 17586. Histogram of Th determinations on fluid
inclusions from the St. Christopher mine........... 17887. Histogram of Tm ice determinations on fluid
inclusions from the St. Christopher mine........... 17988. Plot of Tm ice versus Th from the St. Christopher
Mine........................................ 18089. Histogram of Th determinations on fluid
inclusions from the Old Glory mine................. 18290. Histogram of Tm ice determinations on fluid
inclusions from the Old Glory mine................. 18391. Plot of Tm ice versus Th from the Old Glory Mine....18492. Histogram of Th determinations on fluid
inclusions from the Margarita mine................. 18693. Histogram of Tm ice determinations on fluid
inclusions from the Margarita mine.................. 18794. Plot of Tm ice versus Th from the Margarita Mine....18895. Histogram of Th determinations on fluid
inclusions from the Oro Blanco mine................ 19196. Histogram of Tm ice determinations on fluid
inclusions from the Oro Blanco mine............ 19297. Plot of Tm ice versus Th from the Oro Blanco Mine...193

12Abstract
This study compares the three styles of mineralization found in the Oro Blanco District in terms of geochemical variations, fluid inclusion characteristics, and field relationships.
Steeply dipping quartz-sulfide veins form two parallel but distinct trends. Both systems were deposited along NW- trending faults and exhibit regular outward zoning from high lead, copper, and antimony cores to high zinc and to higher gold to base metals and gold to silver ratios distally. Fluid inclusion temperatures of homogenization range from about 325 to about 200 degrees, and the melting temperature of the ice ranges between -3 and -0.1 degrees. Shallowly dipping quartz lenses have a similar but more subtle zoning trend with generally decreased base to precious metals and silver to gold ratios towards the south. The metal ratios in the silicified zones are within the range of the ratios noted in the quartz-sulfide veins. Fluid inclusion temperatures of homogenization range from about 325 degrees to 260 degrees. Temperature of melting of the ice is around -1 degree. The third vein style examined includes high angle breccia veins. These veins are geochemically most similar to the distal quartz-sulfide veins and exhibit a subtle district scale zoning with

13decreased relative base metals and silver to gold towards the NE. Fluid inclusion homogenization temperatures have a clear mode between 200 and 210 degrees and ranged from 190 to 260 degrees. Melting temperatures of the ice is greater than -0.2 degrees.
Similarity in vein orientations, intrusive relationships, overlap in metal ratios, fluid inclusion characteristics and zoning patterns suggest that the quartz-sulfide veins and shallow quartz lenses are contemporaneous. The breccia veins are later, but similarities in elemental ratios suggest a single metal reservoir. All of the veins are probably Mid-Tertiary in age.

Chapter 1 Introduction
14
Purpose and Method of StudyThe Oro Blanco district has produced significant Pb, Zn,
and Ag and minor Au, and Cu. Three distinct styles of deposits have been exploited. The most important of these are steeply dipping quartz and sulfide veins. The Montana mine, which is responsible for 97% of the districts production, is of this type. A second mineralization style consists of steeply dipping breccia veins, which are confined to the south-central portion of the district. A third ore deposit type is typified by the Margarita and the Old Glory properties, where shallowly dipping quartz-pyrite lenses host gold and minor base metal mineralization.Mines of this third type are confined to the north and central portion of the district. The only cross cutting relationships noted were isolated quartz-sulfide veins that are cut by breccia veins (Knight 1970).
The main objective of this research was to characterize the mineralization styles and to determine how the various deposit types in the district are related. Techniques employed were those that would help define district scale zoning and aid in characterizing the ores in terms of

15chemical signatures, structural characteristics, and variation in temperature of formation. The methodology included collecting 460 rock samples, primarily of ore material, but also of host rocks and alteration zones.These samples were analyzed for Au, Ag, Cu, Pb, Zn, Mo, As, Hg, Mn, Te, Tl, Bi, W, and Sb by atomic absorption and fire assay for Au. The results were examined for distribution patterns of element abundances and ratios. Production records were incorporated into this study. Fluid inclusion heating and freezing data were collected on quartz samples associated with each mineralization style. The structural fabric of the deposits was determined by field study.
Summary of FindingsDue to similarities in metal zoning, metal ratios,
overlap in fluid inclusion characteristics, and field relationships, it is concluded that the quartz-sulfide veins and the silicified zones are contemporaneous. Based on a close association with the Sidewinder Quartz Monzonite dikes, these veins were probably deposited at about 24 Ma. The breccia veins post-date the other mineralization styles but overlap them in terms of many of the metal ratios examined, suggesting a similar source for the metals. The breccia veins occupy a late structural fabric which is also

16occupied by a rhyolite dike swarm dated at 24 to 26 Ma.
Four unique centers of mineralization with consistent metal-ratio zoning away from the core areas are outlined below. These include two centers of the quartz-sulfide veins, and separate centers at the silicified zones and the breccia veins. The zoning is best developed in the quartz- sulfide systems and is most subtle among the breccia veins.
Previous WorkWarren and Loofbourow (1932) were the first to publish a
detailed account of the ore mineralogy and paragenesis at the Montana mine. Fowler (1938, 1951) described the ores and the geologic setting at the Montana mine. The first regional geologic work was by Webb and Coryell (1954) who described Mesozoic volcanics and conglomerates and two Tertiary volcanic units. Nelson (1963) studied the geology of the Walker Canyon and Pena Blanca areas about 12 kilometers to the southeast. A dissertation by Knight (1970) remains the most detailed geologic investigation in the area. His geologic map covers the same area involved in the present investigation. Knight examined over one hundred thin sections and polished sections. No attempt was made to duplicate this work. Riggs (1985, 1987) described the geology and ore deposits in the Pajarito

17Mountains about 10 kilometers to the east. Riggs and Haxel (1990) described the Jurassic rocks in the district and classified them in terms of caldera related facies.
LocationThe Oro Blanco district, some 60 square kilometers in
area, is located in the southern portion of the Basin and Range physiographic province in Santa Cruz County, Arizona (Figure 1). The area is within the Ruby 15 minute U.S.G.S. Quadrangle map and the Bartlett Mountain and Ruby 7 1/2 minute quadrangle maps. The district is located about 10 kilometers southeast of the town of Arivaca, and stretches south to the international border. It is bordered on the east and west respectively by about 111 degrees 12 minutes and 111 degrees 17 minutes longitude. It is accessible via a well maintained dirt road that connects Arivaca and Nogales. Access within the district is provided by variably maintained dirt roads. The area is characterized by NW-trending ridges dissected by ephemeral streams. The elevation varies from about 1,079 meters near the Mexican border to 1,391 meters on Bartlett Mountain.
The Oro Blanco district described here includes both the Austerlitz and Oro Blanco districts as defined by Keith et al (1983).

Arizona Tucson
Three Points
Green Valley
Sl er r i t a M ts
P i m a C o .Cer r o Col or ado
S a n t a C r u z C oArnado
Las Gul jas
Ar ivaca
Area o f Study
At ascosa M tS
i—i i —i *—i i—i & = n M i le s
M W M #-# 1 K ilo m e te rs
NogalesF i g u r e 1. L o c a t i o n M a p

19History of Mining in the Oro Blanco District
Much of the following information is taken from the unpublished manuscript entitled The History of Mining in Arizona, (Tenney 1929). In 1872 peace was made with the Apache Indians and mines no longer had to be fortified. It was during this prospecting push in southeastern Arizona that the first recorded mining took place in the Oro Blanco district. It has been speculated (Tenney 1929) that owing to the proximity of the district to the great Planchas de Plata district, and also to the trail taken by the Coronado expedition, that Mexicans and Spaniards were aware of and may have exploited some of the rich near-surface ores of the Oro Blanco district. There are however no archeological or written records to support this.
The first property to be located was the Oro Blanco mine in 1873, followed by the Yellowjacket, Ostrich, Montana, Choctaw, and Blue Wing mines. Gold was the only metal recovered. After the completion of the Southern Pacific Railroad in 1876, material was shipped to Casa Grande and then staged to the various mining districts in southeastern Arizona. By 1884, at least five mills were processing ore in the district. By 1886 most of these early operations had closed owing to the exhaustion of the easily accessible oxidized ores. Another problem plaguing the district was

20the lack of water. Some of the mills built dams to insure a steady water supply, but most were forced to run intermittently.
Silver prices fell from a high of about $1.08 in 1890 to about $0.60 by 1893. Most silver mining closed down in Arizona at this time and people turned their attention to gold districts. During this period over a dozen mines operated in the Oro Blanco district, the largest being the Old Glory mine which treated thirtyfive to forty tons daily. Problems resulting from lack of water and the exhaustion of the better ores led to the abandonment of the district by 1905. Total production from 1873 through 1904 consisted of about 50,000 ounces of gold (based on the production value of $1,032,500 from Tenney).
The years between 1905 and 1925 included short lived attempts to mine the Austerlitz, Montana, and Idaho mines. The first large scale mining began in 1927 at the Montana mine. A 250-ton-per-day mill was employed and a fifteen mile pipeline from the Santa Cruz river ensured a steady water supply. In 1934, the mill capacity was increased and the Montana mine was Arizona's largest producer of lead and zinc from 1935 to 1939, and was third in silver production in 1938 (Wilson 1951). Between 1940 and 1960, there was limited activity at the Montana mine. Total production for

this period was less than 3,000 tons.Most of the 51 mines in the district saw some short
lived activity between 1925 and the present. During the field work for this study there was no mining activity.
Chapter 2 Geology
22
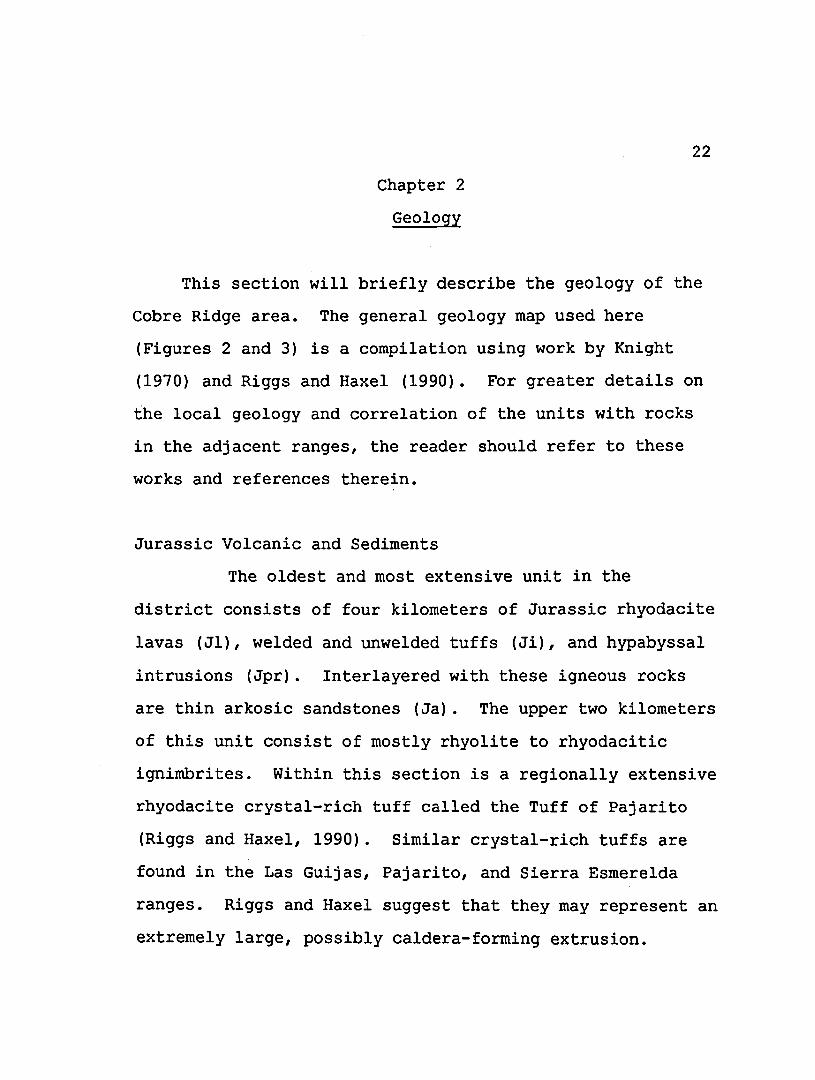
This section will briefly describe the geology of the Cobre Ridge area. The general geology map used here (Figures 2 and 3) is a compilation using work by Knight (1970) and Riggs and Haxel (1990). For greater details on the local geology and correlation of the units with rocks in the adjacent ranges, the reader should refer to these works and references therein.
Jurassic Volcanic and SedimentsThe oldest and most extensive unit in the
district consists of four kilometers of Jurassic rhyodacite lavas (Jl), welded and unwelded tuffs (Ji), and hypabyssal intrusions (Jpr). Interlayered with these igneous rocks are thin arkosic sandstones (Ja). The upper two kilometers of this unit consist of mostly rhyolite to rhyodacitic ignimbrites. Within this section is a regionally extensive rhyodacite crystal-rich tuff called the Tuff of Pajarito (Riggs and Haxel, 1990) . Similar crystal-rich tuffs are found in the Las Guijas, Pajarito, and Sierra Esmerelda ranges. Riggs and Haxel suggest that they may represent an extremely large, possibly caldera-forming extrusion.

\ \ \
\K J c N y
Figure 2. Geologic map of the Oro Blanco district. Modified from Riggs and Haxel (1990),
and Knight (1970). See figure 3 for explanation.

Explanation 24
\
QTg
Tvm
# 0
TKd
KJs
KJI
KJc
Jgd
Jpr
Jl
Ja
Ji
4 7
Gravel, conglomerate, eand, aandetone (Quaternary and late Tertiary)
Montana Peak Formation, Intermediate to alllclc volcanic and hypabyaaal rocka, conglomerate, aandetone (middle to late Tertiary)
Rhyolite dike# and plug# (middle Tertiary)
Quartz Monzonrte dikes and plugs (middle Tertiary)
Diorfte dikes and sills (Late Cretaceous, early Tertiary, and/or middle Tertiary)
Oro Blanco Formation, upper portion, conglomerate, sandstone, sNtstone, (late Jurassicand Cretaceous)
Oro Blanco Formation, limestone, (late Jurassic and Cretaceous)
Lower Oro Blanco Formation, conglomerate, (late Jurassic and Cretaceous)
Granite and granodrorite (middle or late Jurassic)
Rhyolite porphyry, chiefly hypabyeeal, (early or middle Jurassic)
Rhyolitic lava (early or middle Jurassic)
Arenitic sandstone (early or middle Jurassic)
Porphyritic rhyolitic Ignlmbrlte (early or midcie Jurassic)
Contact
Fault
Strike and dip of bedcfing
Strike an dip of primary compacted pumice foliation
Mine or prospect sampled In this study
International border
Figure 3. Explanation for figure 2.

25Stratigraphically below the ignimbrites is a two kilometer section of hypabyssal porphyritic rhyolite.
The entire sequence is tentatively interpreted as the outflow of a caldera caused by the eruption of the Tuff of Pajarito (Riggs and Haxel 1990). An alternative hypothesis for the origin of this sequence rests on the assumption that the ignimbrites are densely welded or rheomorphic Tuff of Pajarito. If this is the case, these authors suggest that the entire sequence represents caldera fill within a caldera extending from the Pajarito Mountains to Cobre Ridge, a distance of thirty kilometers.
Based on the stratigraphic similarities including interbedded cross-bedded sandstones, the Jurassic volcanics are correlated with the Lower Ali Molina Formation in the Baboquivaries. Dating of the Ali Molina Formation indicates an age of about 190 Ma. Preliminary interpretation of a U-Pb date from the tuff of Pajarito indicate an age of about 175 Ma (Riggs and Haxel, 1990).The authors admit a large uncertainty associated with this number and maintain that an age of up to about 200 Ma. is possible.
Conformably overlying the volcanics is up to 800 meters of fine grained arkose and arkosic sandstone. The only outcropping of this unit in the Oro Blanco district is in

the southwestern corner. These sediments may correlate with the Pitoikam Formation in the Baboquivari Mountains.
Jurassic? Cretaceous SedimentsThe Jurassic strata described above are overlain
unconformably by a unit that Knight (1970) calls the Oro Blanco Formation. Knight describes four members within this unit. The basal member called the Oro Blanco Conglomerate (KJc) consists of an conglomerate that contains angular fragments between one and 30 centimeters in diameter. In places it grades into a sedimentary breccia. This member ranges from about one to 800 meters.
This basal member grades into a maroon sandstone and siltstone member that is up to 1,700 meters thick (KJs). These clastic sediments in turn give way to a persistent black, silty, impure limestone member (KJ1). The limestone is only present in the eastern portion of the district and has a maximum thickness of 40 meters. The uppermost member consists of a conglomerate similar to the Oro Blanco Conglomerate (KJs). This unit reaches a maximum of about 350 meters in thickness.
The basal member closely resembles the Glance Conglomerate and may be its correlative. The upper members may correlate with the Cretaceous Bisbee Group. It is
26

27possible that some of the finer-grained units may correlate with the Late Cretaceous Fort Crittenden Formation (Riggs and Haxel, 1990).
Tertiary Volcanics and SedimentsThe eastern portion of the district is underlain by
Tertiary volcanic rocks. These rocks have been divided into two units. The Montana Peak Formation is the lower unit and consists of a maximum of about 400 meters of andesitic and dacitic lava flows, flow breccias, and tuffs, with interlayered clastic sediments. The Atascosa Formation is the upper unit and consists of about 300 meters of andesitic to silicic ash flow tuffs, rhyolite flows, and mudflows. Compositional zoning within the Atascosa formation has been interpreted to indicate tapping of successively deeper levels of a single magma chamber (Seaman and Foss, 1990).
Intrusive UnitsFive distinct intrusive rocks have been identified in
the Oro Blanco district.Warsaw Quartz Monzonite
The Warsaw Quartz Monzonite intrudes the Jurassic volcanics and sediments in the Oro Blanco district. Two

28varieties of this unit are exposed in the study area. The leuco-quartz monzonite variety consists of perthitic microcline, quartz, plagioclase, and rare muscovite. The mafic-rich quartz monzonite consists of plagioclase, orthoclase, quartz, hornblende, and biotite. Tosdal et al (1989), has tentatively assigned these rocks to the Late Jurassic Kitt Peak-Trigo Peak super unit. Based on crosscutting relationships, the Warsaw quartz monzonite is the oldest intrusive rock to outcrop in the Oro Blanco district.
Ruby DioriteThe next oldest intrusive unit is the Ruby diorite. It
is a dark grey porphyritic hornblende diorite. The mineralogy consists of a quartz- and alkali-feldspar-rich matrix, with plagioclase, hornblende, and rare quartz phenocrysts. It commonly occurs as a thick sill intruding the Oro Blanco Formation. It is in turn cut by all of the younger dikes, by mineralization, and by displacement along the major NW-trending faults. Based on these relationships, Knight (1970) assigned a probable age of Middle or Late Cretaceous.
Sidewinder Quartz MonzoniteCommonly occurring as dikes and plugs in the Oro Blanco
district is the Sidewinder Quartz Monzonite. This rock

29consists of fine-grained quartz and potassium feldspar, with phenocrysts of quartz, plagioclase, and biotite. The feldspars have been variously altered to sericite, the biotite to chlorite. These dikes generally trend NW, and dip 20 to 40 degrees to the north, with an average width of about 3 to 15 meters, and a range from a few centimeters to nearly 100 meters. These dikes are abundant throughout the district, especially in the north-central portion where they are closely associated with and cut the silicified zone style of mineralization.
Knight (1970) feels this unit is an intrusive equivalent of the Montana Peak Formation. The Sidewinder Quartz Monzonite cuts the lowest member of the Montana Peak Formation, and is in turn cut by all younger dikes. In addition, Knight notes that in the lower portion of the Montana Peak Formation there are volcanic rocks that strongly resemble the Sidewinder quartz monzonite. A single K-Ar date of 24.6 Ma. (Riggs 1985) does not preclude a cogenetic relationship.
Rhyolite DikesIn the southern and western portions of the district
numerous steeply dipping NW-trending rhyolite dikes and plugs outcrop. These form resistant ridges and ribs that are easily detected in outcrop and on air photos.

30These dikes range in thickness from a few centimeters to nearly 100 meters and average about 5 meters. They consist of about 85% quartz and alkali feldspar groundmass with phenocrysts of quartz, either sanidine or andesine, and minor biotite.
Similar dikes may be traced along this northwest trend for over fifty kilometers, from the Baboquivari Mountains to across the international border and into Mexico. K-Ar and U-Pb dates from these dikes in the Baboquivari Mountains yield dates of 24 to 26 Ma. (Haxel et al. 1980). These dikes cut all previously mentioned intrusive units, as well as volcanic rocks as young as the central Atascosa formation.
Blue Ribbon AndesiteThe youngest of the intrusives consists of two dikes of
the Blue Ribbon Andesite which outcrop near the Montana mine. This rock consists of a plagioclase groundmass with plagioclase and hornblende phenocrysts. The plagioclase is altered to carbonate and apatite, and the hornblende to chlorite. No crosscutting relationships with the other intrusive units were observed in the Oro Blanco district, although similar rocks in the Pajarito Mountains are seen to crosscut the rhyolite dikes.

Structural Geology Attitudes
31
Bedding indicators in the sediments and eutaxitic textures in the volcanics generally indicate that strata throughout the district strike NW and dip between about 40 and 80 SW.
Metamorphic FabricWithin one mile of the study area a weak, steeply
dipping W-SW cleavage is noted in the Oro Blanco Formation. This fabric represents the eastern extent of the Laramide aged metamorphism that effected the Baboquivari Mountains (Riggs and Haxel, 1990).
FaultsDetailed descriptions of the structural relationships
by Knight (1970), provide the framework for the following discussion. Four principal directions of faulting are found in the Oro Blanco district. Most of the faults show normal displacement with little strike slip movement.These faults generally show evidence of recurrent movement. The main faulting directions are N-NE, NE, NW, and E-W.
Knight (1970) has documented that the oldest movement is along the N-NE faults. These faults strike about N 0 to 30 E and dip greater than 70 degrees in either direction.

32Displacement of the Early to Middle Jurassic volcanics is greater than that along the Late Jurassic to Cretaceous Oro Blanco Formation. Thus movement along these structures began prior to, and continued into the time-frame of deposition of the Oro Blanco Formation. Movement along the N-NE faults deforms rocks no younger that the Ruby Diorite.
The NE faults are generally steeply dipping normal faults with their NW sides relatively downthrown. They are younger than the oldest movement on the N-NE faults. Two periods of movement on these faults are separated by movement along the NW faults. In one case a total of over 3 kilometers displacement is estimated. These structures significantly displace units no younger than the Ruby Diorite. There is however shearing along these structures that effects the Sidewinder Quartz Monzonite and mineralization.
The NW-trending faults are portions of regional structures that can be traced for tens of kilometers on either side of the district. These faults show normal displacement with the NE side relatively downthrown. In the Oro Blanco district, these structures form two parallel belts. The northern belt has an average strike of about N 50 E and dips 48 to 70 NE. At the southeastern end of this feature, the fault splits into a south-trending

33fault and an E-W structure, the latter being host to the mineralization at the Montana mine. Several quartz-sulfide type veins are situated along the NW-trending portion of this fault. Displacement along this feature was estimated at about two kilometers.
The southern belt averages closer to N 45 W in strike with moderate to steep NE dips. This belt is comprised of several smaller faults, many of which appear to host Mid- Tertiary rhyolite dikes. Knight estimated that the cumulative displacement along this feature was about 2,500 meters.
The earliest and most significant movement on the NW faults just predates the second movement on the NE faults. Smaller movements on the order of a few meters affect rocks as young as the lower Montana Peak Formation.
In the central portion of the district, silicification and precious metal mineralization, along with Sidewinder quartz monzonite, is hosted in E-W striking structures that dip 0 to 30 N. These faults are hosted within a thick volcanic section that does not contain distinctive marker beds, and therefore relative sense of movement is not apparent.
34Folds
In the Oro Blanco Formation are developed broad open folds. Some of these have been attributed to the forceful emplacement of the Ruby Diorite. However the cause of folding in other portions of the district is obscured. Similar folds are found in Late Jurassic-Cretaceous sediments in the Pajarito Mountains (Riggs 1985).
\.

Chapter 3 Mineralization
35
Previous workers have identified three main styles of mineralization in the Oro Blanco district. These include quartz-sulfide veins, silicified zones, and breccia veins. In the following section, the general characteristics of each will be described. In addition, one example of each style will be described in greater detail.
Quartz-Sulfide VeinsThe most productive mineralization style consists of
steeply dipping Pb-Zn-Ag-Cu-bearing quartz veins. The Montana mine is of this type and is responsible for 97% of the district's production. This style of veining is found throughout the district. These veins occupy steep faults and fractures, and consist of quartz often with pyrite altered to limonite, and locally with massive or disseminated sulfides, including pyrite, galena, sphalerite, tetrahedrite-tennantite, and chalcopyrite. In most cases these veins are located along or adjacent to steep northwest fault zones. For example, several mines and prospects, including the Montana, Idaho, Brick, Saint Christopher, Ostrich and Yellowjacket, as well as some

36unnamed prospects, are situated along the large NW- oriented normal fault in the northern portion of the district.
There is considerable variation in the size and mineralogy of the deposits assigned to this category. At the Montana mine, the vein forms a resistant iron-stained outcrop up to fifteen meters wide and one kilometer along strike. The mineralogy includes white quartz, which is locally pyritic, and massive pods or disseminated galena, with or without sphalerite, chalcopyrite, and tetrahedrite. In other cases, such as in the vicinity of the Oro Blanco mine, quartz-sulfide veins consist of fault gouge a few tens of centimeters wide, with pods of quartz that locally contain disseminated pyrite, chalcopyrite, or galena.
Montana MineThe most important quartz-sulfide system is the Montana
mine (Figures 4 and 5). Approximately 850,000 tons of ore was mined at an average grade of 3.3% lead, 2.8% zinc,0.21% copper, 4.8 ounces per ton silver, and 0.04 ounces per ton gold. The following description relies on work by Fowler (1938 and 1951) and by Warren and Loofhourow (1932).
The Montana mine is located along an E-W spur at the southern end of a large NW-striking fault. Production from

Bouch And B— dy
B
DSlI™1@
B
Andesite (Tertiary?)
Quartz Monzonite (middle Tertiary)
Diorite (Late Cretaceous, early Tertiary, and/or middle Tertiary)
Lower Oro Blanco Formation, conglomerate, (late Jurassic and Cretaceous)
Veins and Faults
A — B Location of Figure 5.
0 too 2001 ------ - IMeters
Figure 4. Surface geologic map of the Montana mine and vicinity. After Fowler, 1938.

38
TertUuy quartz monzonite
0 25 SO
Figure 5. Montana mine vertical section across veins looking West See Figure 4 for explanation. After Fowler 1938.

39the mine came from the Montana vein and a faulted segment of the same feature, called the Rough and Ready vein. The mineralization is hosted in a shear zone that separates the Oro Blanco Conglomerate and the Ruby Diorite. The shear-zone branches to form an anastomosing network with barren country rock between branches. The shears vary from over twelve meters wide to stringers a few centimeters wide. Shearing is confined largely to the contact and within the conglomerate.
Fowler (1938, 1951) described the mineralization at the Montana mine as consisting of an early barren milky quartz deposited within the shear zone. These bodies range from several centimeters to meters wide. Subsequent deformation shattered the quartz and the country rock and provided suitable depositional sites for the ore solutions. Post- ore faulting has had minimal effect on the ores.
Warren and Loofbourow (1932) described sulfide ores from the Idaho and Montana mines. The dominant minerals are galena and sphalerite, with common pyrite, chalcopyrite, and tetrahedrite. An early pyrite phase is generally fractured and healed with tetrahedrite or more rarely galena. Chalcopyrite occurs as inclusions in the sphalerite. Tetrahedrite occurs as inclusions in the sphalerite and to a lesser extent in the galena. A late

40pyrite phase is associated with kaolinitic material. The general sequence of the sulfides is pyrite, sphalerite, chalcopyrite, tetrahedrite, galena, and then pyrite. By assaying hand picked mineral separates of tetrahedrite, galena, and sphalerite it was concluded that most of the silver and gold is contained within the tetrahedrite.
Alteration associated with mineralization consists of silicification and sericitization, both confined to within a couple of meters of the veins.
Post mineralization intrusions include the Sidewinder Quartz Monzonite and two Blue Ribbon diorite dikes. The quartz monzonite intrudes along the Montana vein, and is everywhere unmineralized. The Blue Ribbon diorite forms two dikes that crosscut the vein.
Silicified ZonesThis mineralization style is confined to the north-
central portion of the district (Figure 6). Production records from these deposits indicate that about 5,500 tons were mined at an average grade of 0.48 ounces per ton gold and 8 ounces per ton silver. The northernmost of these deposits, the Austerlitz mine, had an average grade of 0.45% copper and 0.02% lead. Records indicate that base metals were not recovered during every year of production.

41
Elevation
4500' -
4000' —
m S#kW#d zone wkh dip.
P H Fault
o 100 M0 Meter#
\
Figure 6. Plan view (1), and cross-section (2) of the area with surface outcrops of silicified zones. After Knight, 1970. See Figure 3 for rest of explanation.

so the actual grade is somewhat higher than indicated. The Margarita and Old Glory mines produced some copper, and the Old glory mine some lead, although the average grades of less than 0.04% indicate that recovery of the base metals was probably not carried out with regularity.
These deposits consist of W-NW striking strongly silicified shear zones that dip 0 to 30 NE. They are hosted in the NW-striking, SW-dipping Jurassic volcanic units. They occur as veins and massive quartz lenses between three and fifteen meters thick. They are made up largely of barren milky quartz but locally contain a few weight percent disseminated pyrite. Minor amounts of chalcopyrite, galena, and tetrahedrite were noted in a few cases. The sulfide content in these veins is too sparse to determine a paragenetic sequence. Precious metal values are associated with these sulfide-bearing zones. Knight in an unpublished company report noted native gold in vein material from the Austerlitz mine. He also described spectrographic analysis of ore from this mine that suggested that at least some of the silver is contained in the tetrahedrite. Wilson (1934) attributed the gold values at the Oro Blanco mine to auriferous pyrite.
Both in the hanging wall and the footwall, the massive lenses tend to grade into stockwork zones containing quartz
42
43veinlets a few centimeters to half a meter in width. The stockwork veins generally parallel the main quartz body. Precious-metal-bearing pyritic quartz veins are associated with the stockwork zones as well as with the central lens.
Commonly associated with these veins are dikes of Sidewinder Quartz Monzonite. Nowhere is the quartz monzonite silicified or mineralized. At the Austerlitz mine a mineralized quartz lens is enclosed within unaltered Sidewinder Quartz Monzonite (Knight 1970). The quartz monzonite is clearly a later intrusion along the same structural fabric that guided the mineralization.
Other than silicification, the only alteration noted is replacement of the feldspars by sericite within the volcanic rocks. The intensity of the sericitization diminishes away from the veins and is generally not detectable at a distance of more than a couple of meters.
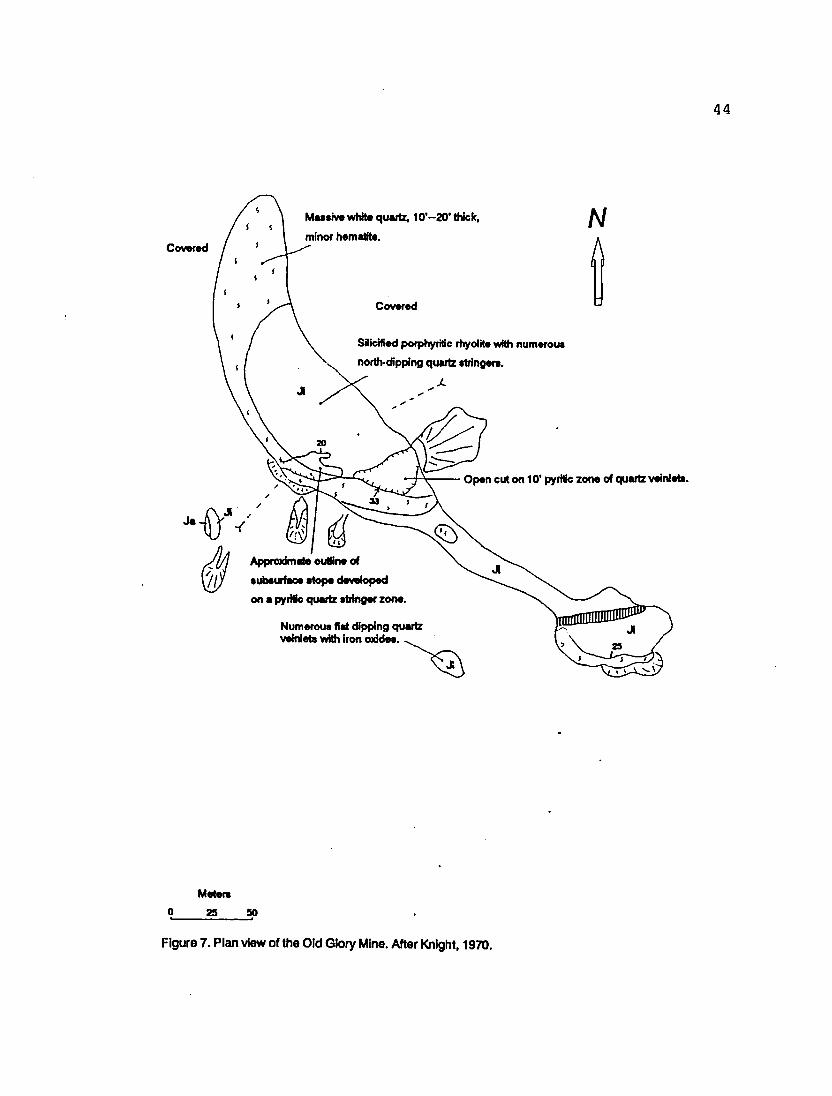
Old Glory MineThe Old Glory mine marks the southern limit of this
style of mineralization (Figure 7). Production records indicate that a minimum of about 711 tons of ore were mined at an average produced grade of about 1.2 ounces per ton silver and 0.3 ounces gold. Mineralization is contained within a zone of quartz veining and replacement that is at least twenty meters wide. This zone consists of a central
44
Massive white quartz, 10 -2 0 ' thick,
minor hematite.
SBic'rfied porphyrHic rhyolite with numerous
north-cfipping quartz stringers.
Open cut on 10' pyritk zone of quartz veinlets.
Approximate outline of
subsurface slope developed
on a pyritic quartz stringer zone.
Numerous flat cfipping quartz veinlets with iron oxides. .
? 28 ap
Figure 7. Plan view of the Old Glory Mine. After Knight, 1970.

45zone three to seven meters wide of massive, milky quartz. This central quartz forms a resistent cap along the hilltop over much of the 200 meter strike length. Both the footwall and the hanging wall, where the latter is not eroded away, consist of strongly silicified volcanics cut by numerous quartz veins and veinlets. The veining generally parallels the massive central quartz lens.Veining and replacement by quartz is found throughout the remaining 12 meters of hangingwall material. The silicification can be traced 40 meters into the footwall. Within the massive white pyrite-poor quartz are bands of pyritic precious-metal-bearing quartz that has been selectively mined. Near the hanging wall contact there is a precious-metal-rich pyritic zone approximately two meters wide that was selectively mined, producing a large pit on the north-facing slope. Also selectively mined was a grey quartz zone about one meter wide containing two percent pyrite near the footwall contact of the massive central vein.
To the north, up towards and including the Margarita property, numerous pits are located on similar silicified zones. Knight (1970) noted NW-striking faults with up to 60 meters of south-side down-thrown displacement between the Old Glory and Margarita mines. He has suggested that
46many of these silicified bodies may be faulted portions of an originally more-continuous lens.
Breccia VeinsThe breccia-vein style of mineralization is restricted
to an area of about four square kilometers in the southern portion of the district. Breccia veins have a recorded production of about 1,600 ounces of gold, 18,500 ounces of silver, and a small amount of base metals from 2,300 tons of material. The Oro Blanco mine is responsible for 40% of the production. Six other mines account for the remaining recorded production. Several other small mines and prospects of this type were worked in a small way, but production records were not located.
Within this zone, a series of NW-striking brecciated fault zones locally contain high-grade silver and gold mineralization. The breccias consist of clay gouge with angular fragments of wallrock, quartz cement, and variable iron and manganese oxides. The character varies from poorly cemented white to tan clay gouge with angular fragments to quartz cemented-breccias. In some places bands of gouge cut the quartz rich portions, and in other places the reverse is noted. Wallrock alteration consists of silicification and argillization. The veins vary from a few centimeters to over ten meters wide.

47All of the mining was carried out in the oxidized
portions of the veins. Native gold and silver have been identified by Knight, who suggested that silver also may be present as halides, or as native silver deposited along with the supergene manganese and iron oxides.
These veins cut intrusive units as young as the rhyolite dikes, as seen at the Monarch mine, and volcanic units as young as the Montana Peak Formation at the Cramer mine. Several small, quartz-sulfide veins, which are generally oriented about N 10 W, are also cut by mineralized breccia zones.
Oro Blanco MineThe Oro Blanco mine was the largest producer among the
breccia veins. Approximately 1,200 tons of material was mined along 800 meters of underground drifts and crosscuts (Figure 8). The average production grade of this material was 0.5 ounces per ton gold and 1.97 ounces per ton of silver. Most of the production came from the 125 foot level, where four parallel veins in a zone approximately 110 meters wide were exploited.
The most productive vein, the Main vein, was drifted along for over 300 meters. This vein is hosted in the Oro Blanco Conglomerate and consists of variable amounts of white to tan clay gouge a few centimeters to a meter wide

48
|T qm I Tertiary quartz monzorVrte
I^ T # ! Dip of fauHa and shear zones.
Figure 8. Plan view of the 125’ level of the Oro Blanco Mine. From Company reports with permission from owner. See Figure 3 for rest of explanation.
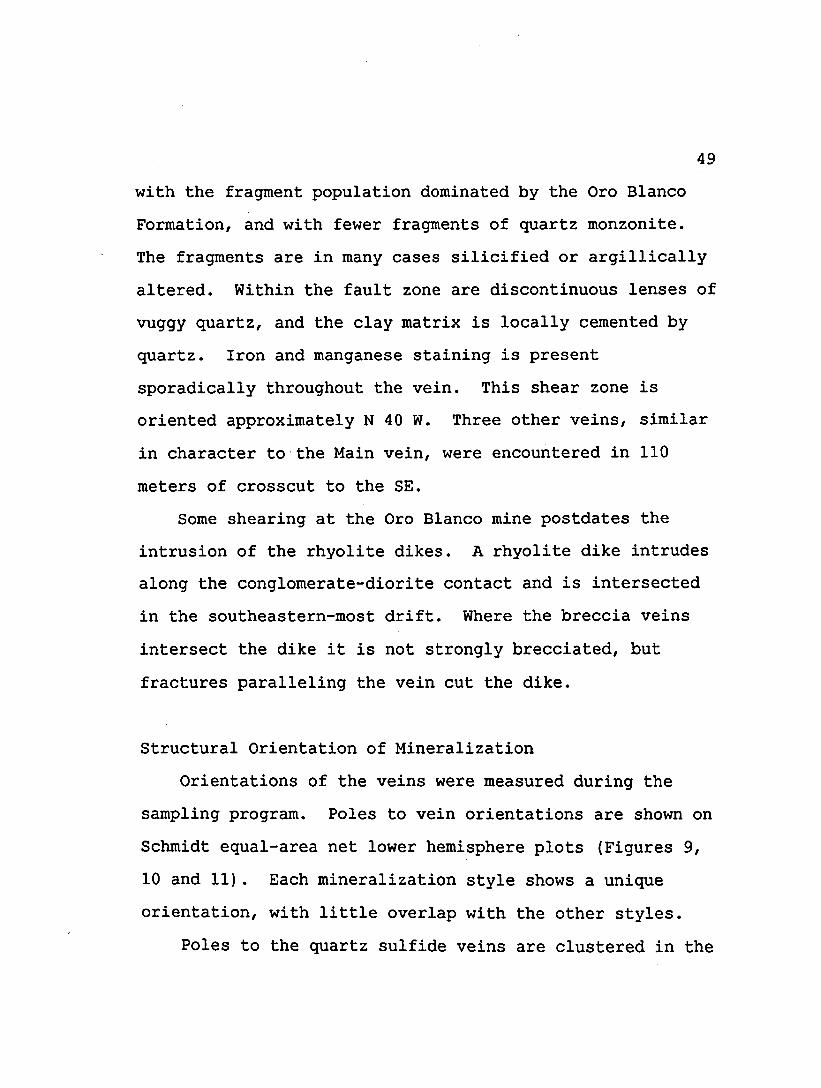
49with the fragment population dominated by the Oro Blanco Formation, and with fewer fragments of quartz monzonite.The fragments are in many cases silicified or argillically altered. Within the fault zone are discontinuous lenses of vuggy quartz, and the clay matrix is locally cemented by quartz. Iron and manganese staining is present sporadically throughout the vein. This shear zone is oriented approximately N 40 W. Three other veins, similar in character to the Main vein, were encountered in 110 meters of crosscut to the SB.
Some shearing at the Oro Blanco mine postdates the intrusion of the rhyolite dikes. A rhyolite dike intrudes along the conglomerate-diorite contact and is intersected in the southeastern-most drift. Where the breccia veins intersect the dike it is not strongly brecciated, but fractures paralleling the vein cut the dike.
Structural Orientation of MineralizationOrientations of the veins were measured during the
sampling program. Poles to vein orientations are shown on Schmidt equal-area net lower hemisphere plots (Figures 9, 10 and 11). Each mineralization style shows a unique orientation, with little overlap with the other styles.
Poles to the quartz sulfide veins are clustered in the

SCHMIDT EQUAL-AREA NET
LOWER HEMISPHERE
SPERCENT PLOT
NUMBER OF POINTS « 130
QUARTZ-SULFIDE VEINS
VEIN ORIENTATIONS
//////, IjFl//////,//////, i
SCHMIDT EQUAL-AREA NET
LOWER HEMISPHERE
* / / / / / /
v z z z z
PERCENT PLOT SIUOMED ZONES
NUMBER OF POINTS » 87 VEINORIENTAnONS
z z z z / z ,/ / / / / / ,/ / / / / / ,/ / / / / / .
3% lo 5% 5% to 10% gm#Wf*hmn10%
Figure 10. Percent plot of poles to silicified zones.

SCHMIDT EQUAL-AREA NET
LOWER HEMISPHERE
/ / / / / / ,//////,/ / / z z / ,/ / / / / /
3% to 5%II i
5% to 10% greater than 10%
Figure 11. Percent plot of poles to breccia veins.

53SE quadrant, indicating a generally steep to moderate NW dip and a NE strike. A second smaller population of veins has a NE strike and a steep dip. This second group consists primarily of the Yellowjacket, Ostrich and the El Oro Mines that are closely associated with major NW faults. While most of the significant quartz sulfide veins are in close proximity to the larger district-wide northwest faults, the actual mineralization at most of the mines is hosted in subsidiary structures that tend to be roughly perpendicular to the larger faults.
The silicified zones plot in a fairly tight cluster in the southern quadrant indicating a preferred E-W strike and a shallow dip to the north. The silicified zone plot indicates that while there is no significant overlap of vein orientation between the silicified zones and the quartz-sulfide, the data could be described as defining a single structural population, the silicified zones representing the shallow end of the continuum.
The breccia veins have a restricted range of vein orientation, and show little overlap with the other vein styles. They do, however, generally parallel the rhyolite dikes. The data from the breccia veins is clustered near the edges of the NE and SW quadrants, indicating a steeply dipping NW-striking vein system.

54Age of Mineralization
The quartz-sulfide veins are younger than the Ruby Diorite and older than the Sidewinder Quartz Monzonite.The upper age of the silicified zones is also constrained by the Sidewinder Quartz Monzonite. The fact that the quartz monzonite dikes occupy the same structural fabric as the quartz-sulfide veins and the silicified zones suggests that they may all be contemporaneous at about 24 Ma.
The youngest rocks cut by the breccia veins are the rhyolite dikes. The upper age of these veins is not constrained by cross cutting relationships. However, the breccia veins occupy structures parallel to the rhyolite dike-swarm possibly suggesting a similar age, about 24 to 26 Ma.
ProductionFigure 12 shows the tonnage distribution in the
district for those deposits for that there is both production data and enough information to place them into one of the recognized mineralization styles. This data is summarized from the Arizona Bureau of Mines data files. Only the Montana mine recorded production of greater than 10,000 tons of ore. Eight mines worked greater than 1,000 tons of ore. Of these, five are quartz-sulfide veins, two

Recorded P roduc t ion in the Oro B lanco D is tr ic t
Tons1,000,000
100,000
10,000
1,000
"* Silicified zones I Breccia veins
Q uartz—Sulfide veins
Figure 12. Production data summarized from the ArizonaBureau of Mines data files.

are silicified zones, and one is a breccia vein. An additional 45 mines have recorded production. Of these, fifteen produced between 100 and 1000 tons, twelve produced between 10 and 100, tons and 18 produced less than 10 tons.
56

Chapter 4 Geochemistry
57
IntroductionIn an attempt to directly detect chemical zoning in the
Oro Blanco district, 460 rock samples were collected. All samples were analyzed for Au, Cu, Pb, Zn, Mo, As, Hg, Mn,Te, Tl, Bi, W, and Sb. The analytical work was done at a commercial laboratory using atomic absorption and fire assay for gold. The samples consisted primarily of material that appeared to be "ore”. Wherever possible, vein material was sampled. In many cases, in-situ ore was not accessible and dump material was collected. Dump material was only sampled where the dumps were fairly small and the underground workings were not extensive so that the location of the sample could be determined with considerable reliability. An attempt was made to collect unoxidized material wherever possible. At many of the prospects, however, it was only possible to collect oxidized or partially oxidized ore. The degree of oxidation of each sample was noted in the field.
Also sampled were host rocks not associated with ore, as well as host rocks in the immediate vicinity of mineralization, barren quartz veins not associated with

58mining activity, and faults. Many of the samples described above had values near or below the detection limit of many of the elements. Those samples that had values near the detection limit or near Clark values in the ore elements were assumed to be not directly related to mineralizing events. Thus they were not used in determining the elemental zoning.
Previous WorkThe only previous worker to describe zoning in the Oro
Blanco district was Knight (1970). He compared production records and grouped the mines in order of the relative abundance of the commodities recovered. He noted a Pb-Zn- Ag high in the vicinity of the Montana mine with increasing Au and decreasing Zn outward. Knight also described a second center located around the Warsaw mine, that is characterized by Pb-Zn-Cu-Ag mineralization. Neither the breccia veins nor the silicified zones fit into this zoning pattern. The data collected in the present study generally supports these conclusions.
Comparison of Production Records and Sample ResultsIn order to help understand any bias that was
introduced during the sampling program, the geochemical

59data from this study were compared with the production grades. Where records exist, they typically show values for gold and silver. Complete records of copper, lead, and zinc values were also reported for the larger quartz- sulfide veins. In a few cases base metals were reported for other mines, although grades are so low as to indicate that these commodities were not recovered from the bulk of the tonnage mined.
Grades tended to be lower in the sampling program but trends are generally preserved. This is apparent in Figure 13, in which the silver values for those mines with production records are compared with the averages of sample values for each mine. Figure 14 compares the silver to gold ratios from production records with samples from this study. Samples from quartz-sulfide veins and silicified zones typically have higher relative gold contents than does the production record data, but trends between mines in the production records are generally reproduced in the sampling program. The trends among the breccia veins were not as well reproduced in the sampling program.
The two mines with the most complete set of production records for metals other than silver and gold are the Montana and Idaho mines. Figures 15 and 16 compare the sampling average and production records from the Montana

Silver Values
PPM10,000 =
1 ,0 0 0 Z=
100 3 =
This Study I Production Values
Figure 13. Comparison of silver values from productionrecords with mine averages from samples in this study.
Silver to Gold Ratios
1000 A g/A u
Figure 14. Comparison of silver to gold ratios fromproduction records with mine averages from samplesin this study. *
Ajoi
opio

Montana Mine
PPM100,000
10,000
1,000
Production ! This Study
Figure 15. Comparison of sample averages with production grades at the Montana mine.

63
Idaho Mine
PPM100,000
10,000
1,000
Production I This Study
Figure 16. Comparison of sample averages with production grades at the Idaho mine.
64and the Idaho mines respectively. Data from both mines show a good correlation for gold, silver, copper, and lead, and show lower zinc values from the samples in this study.
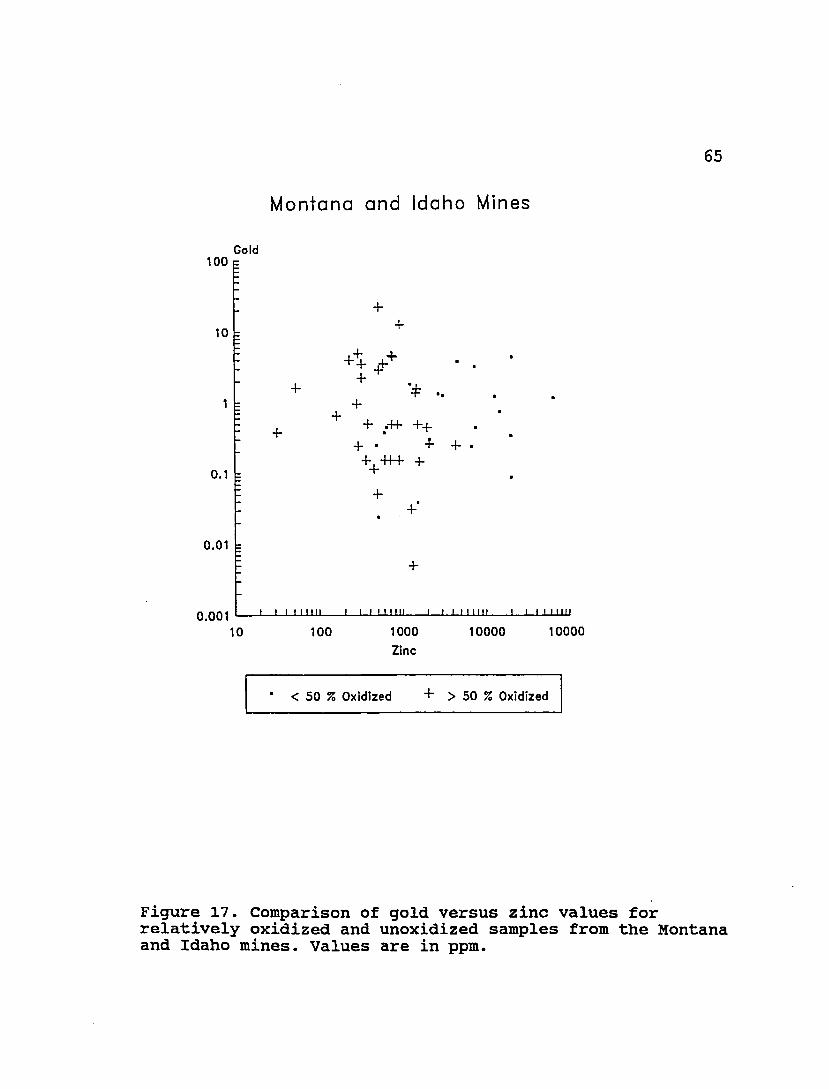
The lower zinc values from the sampling program probably reflect the high mobility of zinc in the oxidizing environment coupled with the fact that the samples in this study are from near surface and thus are more oxidized than the average material mined. This is demonstrated in Figure 17 where zinc abundance is plotted against gold abundance. Here samples are separated based on the percentage of the sulfide minerals that are oxidized. It is clear that higher gold to zinc ratios are associated with oxidized samples in contrast to Figure 18 in which gold values are plotted against silver and copper abundances. In these cases there are no regular changes in the metal ratios with increased oxidation.
Element Abundance DistributionsIn order to detect elemental zoning in the Oro Blanco
district, data from all of the samples collected at a given mine or prospect were averaged and the values were plotted. on a generalized geologic map of the district. For all subsequent calculations, one half of the value of the lower detection limit was used for samples below the detection
65
Montana and Idaho Mines
Gold
I I I I Mil0.0011000010000
Zinc
* < 50 % Oxidized + > 50 % Oxidized
Figure 17. Comparison of gold versus zinc values for relatively oxidized and unoxidized samples from the Montana and Idaho mines. Values are in ppm.

Montana and Idaho Mines 66
GoldA
0.001
Silver
Gold
+ + -K -H-
0.0011000
Copper10000 10000
• < 5 0 % Oxidized + > 50 % Oxidized
Figure 18. Comparison of gold versus silver (A), and copper (B) values from relatively oxidized and unoxidized samples from the Montana and Idaho mines. Values are in ppm.

O Q uartz-S u lfid e Veins
<£> Breccia Veins
□ Silicficd Zones
K lle m e le re
Figure 19. Location map of the mines in the Oro BlancoDistrict. Numbers are thelose used in Figures 44 through 70.

68limit. See Figure 19 to locate the various mines in the district. Also see appendix 1 for the number of samples collected and the elemental averages and ranges for each site.
In some cases zoning patterns are best seen with elemental ratios, and in other cases the distribution of the elemental abundances themselves best elucidate geochemical trends. The elemental plots will be considered first.
Comparison of Mineralization Styles Each mineralization style has a unique chemical
signature. The average values for each mineralization type are compared in Figure 20. In order accentuate the differences between the mineralization styles, the average values for each style were divided by the entire population sample average.
The quartz-sulfide veins showed the greatest abundance in all of the elements with the exceptions of gold, manganese, tellurium, and thallium. The manganese values were intermediate between the other two mineralization styles. The quartz-sulfide zones showed similar abundances to the silicified zones in bismuth, gold, tellurium, and thallium. Averages of the silicified zones were

69
Comparison of Elemental Abundances Between Vein Styles
Mine Type Average/Overall Average
Au Cu Mo Pb Zn Ag Mn As Sb Hg Te Tl W Bi
Element Averages
Quartz-Sulfide Veins Slllclfled Zones
— Breccia Veins
Figure 20. Comparison of vein style element averages.Values represent averages for each vein style divided bythe overall district sample average.

intermediate in copper, molybdenum, and lowest in zinc, silver, and manganese. The breccia veins were highest in gold, manganese, and thallium, intermediate in zinc and silver, and had the lowest abundances in copper, molybdenum, tellurium, and bismuth. Values from the breccia veins were similar to the silicified zones in term of lead, arsenic, and antimony.
Some elemental zoning trends are confined to particular mineralization styles. The quartz-sulfide veins appear to have two distinct centers characterized by high Pb, Zn, and Ag with increasing precious to base metal ratios away from these areas. Differences between the two centers include high antimony associated with the northern center around the Montana and Idaho mines, and high bismuth, tellurium, and molybdenum associated with quartz-sulfide veins in the southwestern portion of the district, around the Warsaw and Holden mines. In general, this zoning does not seem to transgress mineralization styles. However, a possible exception is found at the Grubstake breccia vein where high molybdenum values are found adjacent to high molybdenum quartz-sulfide veins including the N 10 W veins and the Louise mine.
The silicified zones have a generally similar zoning pattern with high relative base metals in the north and
70

71increasing relative precious metals to the south. The highest values of lead, zinc, arsenic, bismuth, molybdenum, and mercury are associated with the Austerlitz mine in the northernmost silicified zone; the highest gold values were noted at the Old Glory North and the Margarita mines near the southern limit of this mineralization style.
In terms of absolute elemental abundances the breccia veins in general show limited district scale zoning.
GoldFigure 21 shows the average values for mines and
prospects throughout the district. The highest average values are found among the breccia veins, which averaged 7.2 ppm. Within the breccia veins, no spatial zoning is apparent.
The quartz-sulfide veins contain generally lower gold values than the other vein styles. Several exceptions include minor producers along the major NW-trending structures, including the Ostrich, Saint Christopher, and the El Oro mines and the unnamed prospects near skunk springs, in general agreement with the available data from production grades.
Among the silicified zones, the highest average grades were found at the Old Glory North and the Margarita


73properties. The Old Glory mine had a relatively low average, in part due to differences in sampling between this mine and the other silicified zones. At the Old Glory mine, in addition to pyrite bearing auriferous quartz, samples of white quartz that contained few visible sulfides and had low gold values were collected. At the other mines, sampling was largely confined to sulfide-rich zones.
Figure 22 is a histogram depicting the overall gold distribution. The silicified zones and the breccia veins have similar distributions, both cresting between 1 and 10 ppm. The quartz-sulfide vein distribution shows the largest group of samples has between 0.1 and 1 ppm gold.
LeadThe highest lead values were located in and around the
major quartz-sulfide systems (Figures 22 and 23). Lower values are found at the El Oro Mine and a prospect between this and the Holden mine that I refer to here as the El Oro Extension. Another area of quartz-sulfide veins with low lead averages is in the NW corner of the district along the large NW-trending fault. The highest frequency of samples from this mineralization style is between 1,000 and 10,000 ppm. The other mineralization styles show a similar distributions to one another. Most samples from these
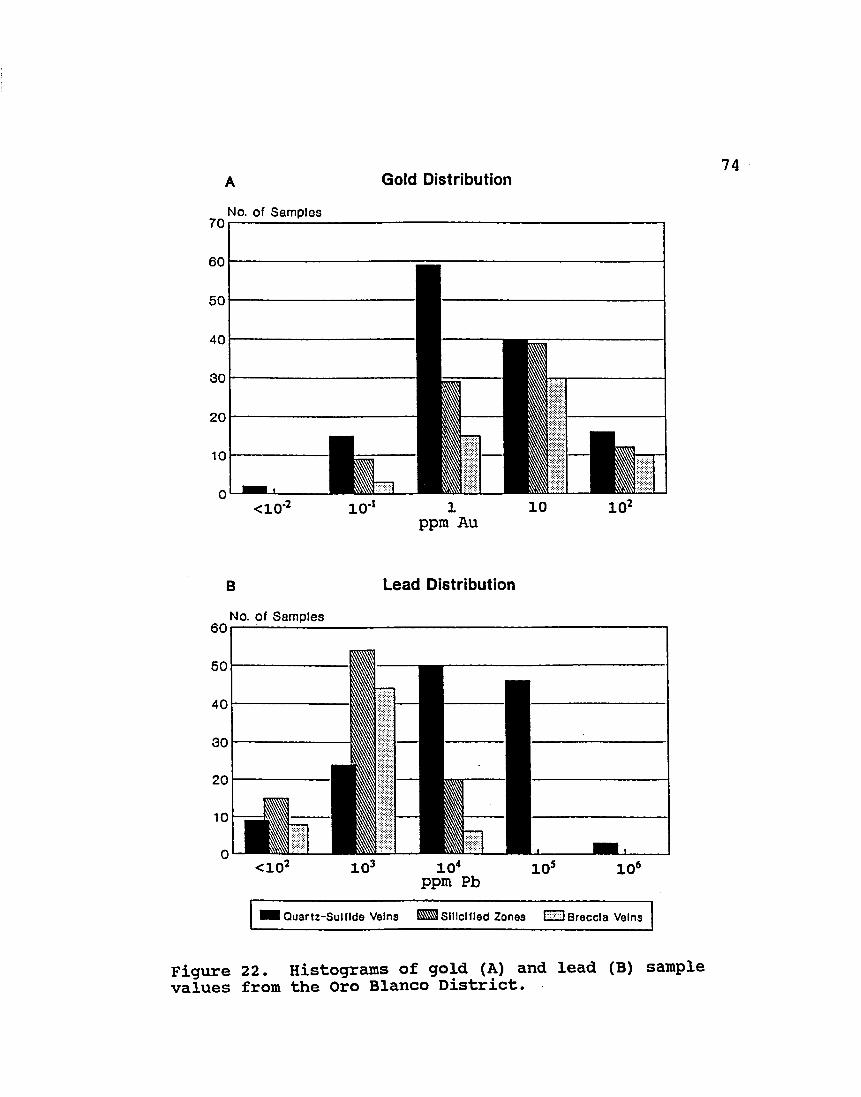
A Gold Distribution
No. of Samples
<10*2 10'1 1 10 102ppm Au
B Lead Distribution
No. of Sam ples601--;---------------------------
<102 103 104 io5 io6ppm Pb
Quartz-Sulllde Veins ^ 0 Slllcllled Zones [HUBreccia Veins
Figure 22. Histograms of gold (A) and lead (B) samplevalues from the Oro Blanco District.

75

76veins have between 100 and 1,000 ppm lead. The Austerlitz mine, averaged 1,273 ppm, over twice that of any other silicified zone. No special zoning is apparent among the breccia veins.
ZincThe highest average zinc values are peripheral to the
large quartz sulfide systems. Around the Montana and Idaho mines, high relative values were found at the Rubiana, Hilltop, and Blue Wing mines (Figure 24). In the southern portion of the district, near the Warsaw mine, high values were noted at the Louise and Black Diamond mines.
No strong zoning was detected within the breccia veins where most samples averaged between 100 and 1,000 ppm. The overall distribution of the breccia veins and quartz- sulfide veins were most similar. While both mineralization styles have the highest frequency of samples occurring between 100 and 1000 ppm, several samples from the quartz- sulfide veins are above this range (Figure 25).
The Austerlitz mine had the highest average zinc values among the silicified zones. This mine averaged 170 ppm zinc while the majority of samples from the silicified zones had between 10 and 100 ppm.

77

78A Zinc Distribution
No. of Samples
<10 102 103 1 04 105ppm Zn
B Silver Distribution
60
50
40
30
20
10
0
No. o f Sam ples
<1 10 102 103 104ppm Ag
I Quartz-Sulfide Veins H Ssillc ifled Zones E B Breccia Veins
Figure 25. Histograms of zinc (A) and silver (B) samplevalues from the Oro Blanco District.

79Silver
The quartz-sulfide veins show the highest values at the Warsaw and the Holden mines (Figure 26). Other high values are at and around the Montana and Idaho mines. The breccia veins have similarly high values along the south and western perimeter of this mineralization style at the Monarch, and Cramer mines, and at an unnamed prospect along California Gulch. No regular zoning is apparent among the silicified zones.
All of the mineralization styles have the highest frequency of samples in the 10 to 100 ppm range. Although the quartz-sulfide veins have a higher percentage of samples above this range than do the other styles (Figure 25) .
CopperThe highest average value is found at the Ostrich mine
in the NW corner of the district (Figure 27). Other high values are associated with quartz-sulfide veins including the Montana, Idaho, Holden, Warsaw and Louise mines. Lower values are found away from these centers. Neither the silicified zones nor the breccia veins show obvious trends in copper abundance.
The quartz-sulfide veins have a distinct distribution

80

81

82trend with the highest frequency of samples in the 1,000 to 10,000 ppm range. The breccia veins and the silicified zones show similar overall distribution trends with the highest frequency of samples in the 10 to 100 ppm range (Figure 28).
MolybdenumFigure 29 shows the distribution of molybdenum values.
The highest values are clustered in the SW portion of the district. These include the two quartz-sulfide veins including the Holden and Black Diamond mine. Several small quartz sulfide veins found within the area occupied by the breccia veins also have relatively high molybdenum averages. Values from these veins are grouped, and are here called the N 10 W veins, referring to their consistent orientation. A single breccia vein called the Grubstake mine also has an anomalously high molybdenum content.
The remaining quartz-sulfide veins generally show intermediate values, and the breccia veins show low values. The silicified zones have intermediate values, with the highest to the north at the Austerlitz mine and at a some unnamed pits at a silicified zone prospect(number 21 on Figure 19). The silicified zones and the quartz-sulfide veins have similar overall molybdenum distributions (Figure

A Copper Distribution83
B Molybdenum Distribution
No. o f Sam ples 801---------
<1 10 102 103 ppm Mo
Quartz-Sulfide Veins IMS Slllclfled Zones Lad Breccia Veins
Figure 28. Histograms of copper (A) and molybdenum (B)sample values from the Oro Blanco District.

84

8528). Both of these mineralization styles have the highest frequency of samples between 10 and 100 ppm. The breccia veins have generally lower values with the highest frequency of samples being between 1 and 10 ppm, and 30% of the samples had undetectable amounts of molybdenum (< 1 ppm) .
BismuthThe highest bismuth values are found in quartz-sulfide
systems in the SW portion of the district at the Warsaw, Louise, and Holden mines, and at the Ostrich mine in the NW corner of the district (Figure 30). The silicified zones had less bismuth than the above- mentioned mines, but generally had higher values than the remaining quartz- sulfide systems or the breccia veins. The Austerlitz mine had the highest bismuth values among the silicified zones. The breccia veins showed the lowest bismuth values. Half of the breccia vein samples had bismuth levels below the detection limit of 0.2 ppm.
The frequency distribution histogram (Figure 31) shows that the widest range of values was among the quartz- sulfide veins. The highest frequency of samples among the breccia veins have undetectable bismuth values while the other mineralization styles have a maximum frequency

86

A Bismuth Distribution 87
No. o f Sam ples
<10' 1 10 102 103ppm Bi
B Antimony Distribution
No. of Sam ples 7 0 1------------------------
<1 10 102 103 104 105ppm SbQuartz-Sulfide Veins t#3sillclfled Zones EEHBreccia Veins
Figure 31. Histograms of bismuth (A) and antimony (B)sample values from the Oro Blanco District.

88between 1 and 10 ppm.
AntimonyHigh grade antimony shows a restricted distribution.
Figures 31 and 32 show that the highest antimony grades are associated with the quartz-sulfide veins. The highest values in the district were at the Idaho and Montana mines. These mines averaged 1028 ppm and 143 ppm respectively . Seven other quartz-sulfide veins averaged between 4 and 31 ppm. All of the other mines averaged 2 ppm or less and the majority of the ore samples from the breccia veins and silicified zones had undetectable antimony values.
Warren and Loofbourow (1932) noted that precious metals were associated with tetrahedrite at the Idaho and Montana mines. A positive correlation is noted between antimony and gold plus silver (R2 = 58) from all of the samples taken at these mines. Figure 33 shows antimony versus silver plus gold for only those samples with less than 50 percent of the sulfides affected by oxidation at four quartz-sulfide veins. Using the more oxidized samples does not effect the overall pattern but it does clutter up the figure. Most of the samples from the Austerlitz and Warsaw mines plot below the Montana-Idaho trend. Only at the Idaho and Montana mines is there a strong correlation

89

Antimony vs. Silver + Gold For Selected Mines
Antimony10000
d a
10000100Silver + Gold
• Idaho + Montana* Warsaw a AusterlHz
Figure 33. Plot of antimony against silver plus goldfrom four mines in the Oro Blanco district.

between antimony and the precious metal values. At the other properties, the precious metals are apparently not solely associated with tetrahedrite.
ManganeseThe highest manganese values were found among the
breccia veins (Figure 34). Both the breccia veins and the quartz-sulfide veins had the highest frequency of samples between 100 and 1,000 ppm whereas the silicified zone had a maximum frequency between 10 and 100 ppm (Figure 35). The quartz-sulfide veins had a wide range of average manganese values. Two areas of manganese highs include, in the northern portion of the district, the Montana and Brick mines as well as an unnamed quartz-sulfide vein near the Austerlitz mine, and in the southern portion of the district, they are Louise mine, and the N 10 W prospects, and the Black Diamond mine. The silicified zones showed generally low manganese values with all of the mines averaging less than 300 ppm.
The district-wide zoning of the manganese distribution appears to be related to host lithology, with most of the high manganese values hosted in the sediments and the diorite. The veins hosted in the Jurassic volcanic units tend to have lower values. For a detailed discussion of
91

92

A Manganese Distribution 93
B Arsenic Distribution
No. of Samples 1 0 0 1----------
<10 102 103 ppm As
I Quartz-Sulfide Veins EBsuicided Zones EE3 Breccia Veins
Figure 35. Histograms of manganese (A) and arsenic(B) sample values from the Oro Blanco District.

94this refer to the section on host lithology chemistry.
Knight (1970) suggested that the precious metals in the breccia veins are associated with high manganese values. A comparison of correlation coefficient between silver and manganese for the different vein styles shows a positive correlation among the breccia veins (R2 = 0.42) and no correlation among the quartz-sulfide veins (R2 = 0.03) or the silicified zones (R2 = 0.00).
ArsenicMost of the samples from the overall population had
arsenic values between 1 and 10 ppm (Figures 35 and 36).The breccia veins had the most restricted range with all of the mines averaging between 3 and 11 ppm. The silicified zones had average arsenic values between 3 and 17 ppm. The highest averages were found at the Austerlitz mine and at an unnamed prospect in Japan Valley, the two northernmost silicified zones.
Among the quartz-sulfide veins the highest averages were found at the Idaho and Brick mines, averaging 56 and 21 ppm respectively. Other relatively high arsenic values were found in the southern half of the district at the Holden and El Oro mines, the El Oro Extension, and the Warsaw mine.

95

96
ThalliumFigures 37 and 38 indicate that the distribution of
thallium values is very similar for the quartz-sulfide veins and the silicified zones with the highest frequency of samples for both vein styles between 0.1 and 1 ppm.Less than 10% of the samples from these mines have thallium values greater than 1 ppm. The breccia veins on the other hand, show a distinct distribution with all but about 10% of the samples having greater than 1 ppm thallium. Within each mineralization style the values appear fairly uniform without obvious spatial zoning.
TelluriumFigures 38 and 39 show that the greatest frequency of
samples from all mineralization styles had undetectable amounts of tellurium ( <0.2 ppm.) Only 10% of the breccia samples had detectable tellurium, and none had values greater than 1 ppm. However nearly 40% of the quartz- sulfide veins and over 50% of the silicified zones had detectable tellurium with samples up to 16 ppm at the unnamed silicified zone prospect in Japan Valley. This property had the highest average value. Other relatively high values were noted at quartz-sulfide systems including the St. Christopher mine in the northern part of the

97
© Quartz—Sulfide Veins
$ Breccia Veins9 2to3^ > 3 ffl SilicfiedZones
Figure 37. Distribution of thallium values in the Oro Blanco District. Values are In ppm.
Ki lometers

A Thallium Distribution 98No. o f Sam ples 1001---------
80
60
40
20
0
■ :1111 I B
<10-1 ippm T1
10
B Tellurium Distribution
No. o f Sam ples 801---------
<10-1 1 10 102ppm Te
Quartz-Sulfide Veins EB sillc Ifled Zones K 3 Breccia Veins
Figure 38. Histograms of tellurium (A) and thallium(B) sample values from the Oro Blanco District.

99

100
district and at the Warsaw and Holden mines and at the El Oro Extension prospect in the southern portion of the district.
MercuryThe highest mercury values were found at quartz-sulfide
veins along the NW-trending fault in the northern portion of the district, at the St. Christopher, Montana, and Idaho mines, as well as an unnamed quartz-sulfide vein near the Austerlitz mine (Figures 40 and 41). Most of the samples from the quartz-sulfide and the breccia veins had between 0.1 and 1 ppm mercury. The breccia vein average values for the various properties ranged from 1.0 ppm to 0.1 ppm with no apparent spatial zoning.
The silicified zones had the lowest overall average, with the highest frequency of samples having between 0.01 and 0.1 ppm mercury. The silicified zones had a high average of 0.33 ppm at the Austerlitz mine, and lows of 0.06 to 0.07 ppm at three of the other properties.
TungstenTungsten values were generally low. Samples showed
that 58%, 69%, and 85% of the silicified zones, quartz- sulfide veins, and breccia veins respectively, had tungsten

101
© Quartz-Sulfide Veins
^ Breccia Veins Kl lomelere
Q >7 ffl SilicficdZones
Figure 40. Distribution of mercury values in the Oro Blanco District. Values are In ppm.

A Mercury Distribution 102No. of Sam ples
SO i---------------------------
C IO-1 1 10 102ppm Hg
B Tungsten Distribution
I Quartz-Sulfide Veins ■ Siiicified Zones IS ) Breccia Veins
Figure 41. Histograms of mercury (A) and tungsten(B) sample values from the Oro Blanco District.

103values at or below the detection limit of 1 ppm. The highest average was found at a breccia vein at the Twin mine (Figure 42). A single anomalous sample from this property had 44 ppm tungsten. The remaining breccia veins averaged between 2 and less than one ppm tungsten. Most of the quartz-sulfide veins averaged 2 ppm or less. However, a cluster of higher average tungsten values occurs around the Warsaw mine, which averaged 2.1 ppm. The El Oro and the El Oro extension, the N 10 W veins and the Louise mine, all averaged between 3.9 and 4.6 ppm. Also the Yellowjacket mine in the NW portion of the district averaged 2.5 ppm. Among the silicified zones, values ranged from a high of 4.3 at the Margarita mine to a low of 0.7 ppm at the prospect in Japan Valley. The overall distribution graph (Figure 41) shows that the highest frequency of samples is between 1 and 10 ppm, while in both of the other mineralization styles the highest frequency of samples have less than 1 ppm tungsten.
Element Ratio DistributionGeneral Trends
For descriptive purposes I have divided the quartz-sulfide veins into three classes based on their relativegeochemical characteristics and spatial distribution. The

104
Yellowjickct V kjs
<1 / J»d XVsJ x i (KJs
1 to3
3 to 5 © Quartz-Sulfide Veins
5 to 7 ^ Breccia Veins
> 7 EB Silicfied Zones
Ki lom eter#
Figure 42. Distribution of tungsten values In the Oro Blanco District Values are In ppm.

105classes include the main producers, the peripheral veins, and the distal veins. The first group includes the Montana and Idaho mines in the north and the Warsaw and Holden mines in the south. The Holden mine is not a large producer but is included due to similarities in relative chemical abundances. The peripheral veins around the northern center include the Hilltop, Rubiana. Blue Wing, and Brick mines, as well as unnamed prospect pits in the north near the Austerlitz mine and south of the Blue Wing mine. In the southern portion of the district the peripheral veins include the Louise, and Black Diamond mines, and the N 10 W veins. The distal veins cluster along NW-trending faults and are farther from the main producers than are the peripheral veins. In the north, these veins include the unnamed quartz-sulfide vein near the Ostrich mine, as well as the St. Christopher, Ostrich, and Yellowjacket mines. In the South, the distal veins include the El Oro and El Oro Extension veins.
Two areas of relatively high base- to precious-metal ratios are centered on the main producing veins. Within the quartz-sulfide veins, base- to precious-metal ratios as well as the ratios of arsenic to antimony and lead to molybdenum decrease to the NW away from these centers. The center near the Montana mine is high in antimony, and the

106center in the SW is higher in relative amounts of bismuth, molybdenum, and tellurium. Overall, the quartz-sulfide vein systems tend to have a relatively wide range of metal ratio values.
The breccia veins exhibit limited zoning. Relative to the other vein styles, they have low base- to precious- metal ratios, a low tellurium to thallium ratio, and a high gold to silver ratio. These veins are most similar geochemically to the distal quartz-sulfide veins. Samples from the Grubstake mine, located along the SW periphery of the area occupied by breccia veins, has the highest base- to precious-metal ratio, high antimony to arsenic ratios, and the highest molybdenum abundance. Breccia veins in the central portion of the area occupied by this mineralization style have generally higher lead to molybdenum values. The breccia veins at the NE limit of this mineralization style have the lowest silver to gold ratios.
The silicified zones show less overall variation than the quartz-sulfide veins, and typically exhibit higher gold to base metal ratios, and higher gold to silver ratios to the south away from the Austerlitz mine. The silicified zones tend to have metal ratio values intermediate between the peripheral and distal quartz-sulfide veins.

107Occasional differences occur between the two graphical
representations of the ratio data. The points on the X-Y graphs represent the ratio of the elemental averages at each site. The values plotted on the ratio distribution maps were calculated by averaging the ratios of each sample (Appendix 2). The two methods in some cases provide different numbers. There was no alternative for the X-Y plots, and the latter method was chosen for distribution maps because it minimizes the effects of erratic data points.
Silver versus GoldThe quartz-sulfide veins have the highest silver to
gold ratios (Figures 43 and 44). These veins have a bimodal distribution. The main producers and the proximal veins have silver to gold ratios above ten to one, whereas the distal veins in both the northern and southern portions of the district have lower relative silver abundances.
The silicified zones have a range of ratios higher than the distal quartz-sulfide veins and generally lower than the other quartz-sulfide veins. The highest silver to gold ratios among the silicified zones are at the two northernmost occurrences of this mineralization style.
Among the breccia veins, the ratios varied from

108

S U v e r Ve Go I d
1 0 0 “
I I I I 111| i i i 11 *11;
G o l d ( p p m )
o Quer Lz-Su I f Idg Ve ins ° S 11 Ic IT led Zones 0 Brecc le V e in s
Figure 44. Average silver and gold values forsamples collected at each mine. See Figure 43 formine locations.

relatively low to intermediate. The mines in the northeastern portion of the breccia vein zone have generally lower values.
Copper versus GoldThe highest copper to gold ratios are among the quartz-
sulfide veins in the vicinity of the Holden, Warsaw, and Black Diamond mines (Figures 45 and 46). A zone of slightly lower values is located around the Montana mine. While the main producers and most of the proximal veins have ratios greater than 1,000, most of the distal veins have ratios below 100.
The silicified zones have ratios intermediate between these two populations. All but one of the mines have values around 100. The Margarita mine had the lowest ratio among the silicified zones.
The breccia veins have ratios in the same range as the distal quartz-sulfide veins. All but the Grubstake and Oro Fino mines, the two mines on the southwestern limit of this mineralization style, have copper to gold ratios below 100.
Lead versus GoldThe lead to gold ratios of the mines fall into two
discreet populations separated by values of about 1,000
110

Ill

Co
pp
er
(pp
m)
C o p p e r Vs G o l d
10000 :
1 000 :
1 00 :
G o l d ( p p m )
o Quer t z -S u I f Ide V e in s o S l l Ic I f led Zones 9 G re c o lo V e in s
Figure 46. Average copper and gold values forsamples collected at each mine. See Figure 45 formine locations.

113(Figures 47 and 48). The higher ratio population consists entirely of the main producer and proximal quartz-sulfide veins. The silicified zones generally have intermediate values; the lowest ratios are found at the breccia veins and the distal quartz-sulfide veins. The highest average among the silicified zones is at the Austerlitz mine.Among the breccia veins, the highest ratios are found at the Twin, Grubstake, and the Oro Pino mines.
Lead versus CopperMost of the mines in the district have ratios of lead
to copper between one and ten. The quartz-sulfide veins have ratios similar to the other mineralization styles, but have generally greater abundances of both metals (Figures 49 and 50.) Slightly higher than average ratios are found at several of the peripheral quartz-sulfide veins including the Rubiana, Blue Wing, and Hilltop mines and the unnamed pit near the Austerlitz mine in the north, and the Black Diamond and N 10 W veins in the south. The distal quartz- sulfide veins have generally low ratios, with the exception of the St. Christopher mine, which had very low copper values.
The breccia veins have the most restricted range, all but one with values between 3 and 8. The silicified zones

114

Le
ad
C
pp
m)115
L e a d Vs Go I d
1 00000 "=
10000”
1 000 =
1 00 =
G o l d ( p p m )
° Q u a r t z - S u l f i d e V e in * o S t I tc I f led Zones 0 B r e c c i a V e in s
Figure 48. Average lead and gold values forsamples collected at each mine. See Figure 47 formine locations.
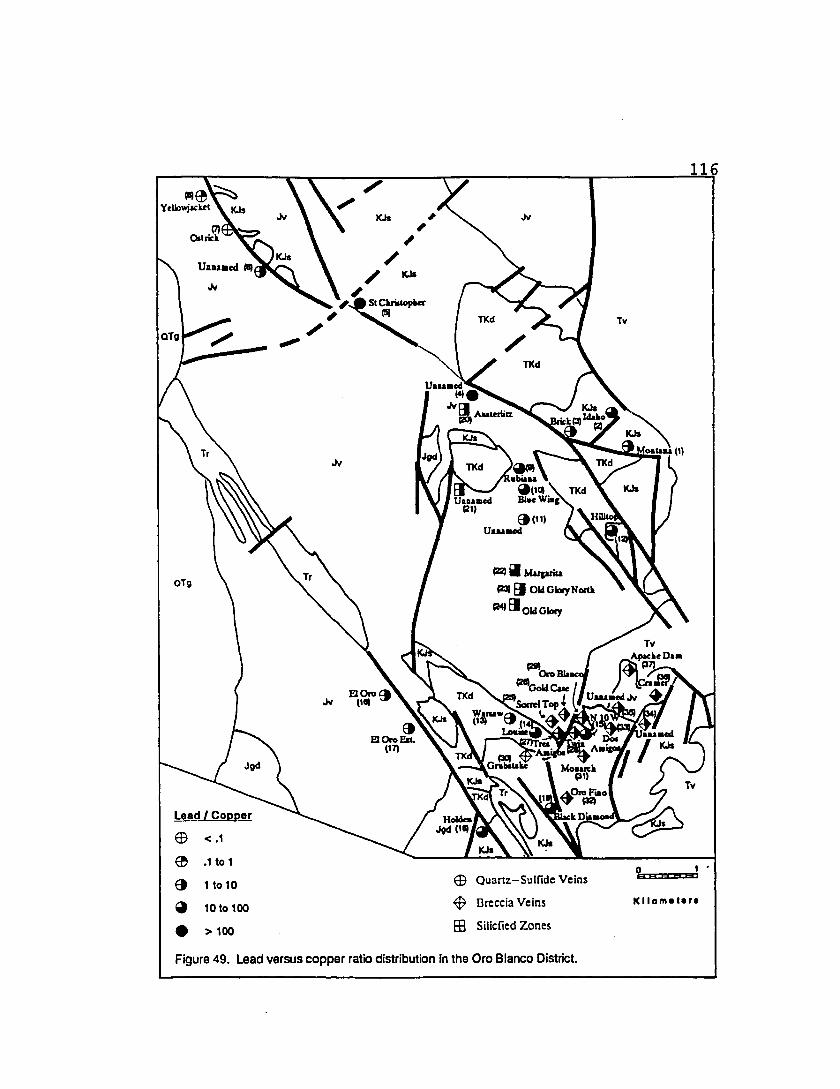
116
® Quartz—Sulfide Veins
Breccia Veins
H Silicfied Zones
Ki lometers
Figure 49. Lead versus copper ratio distribution in the Oro Blanco District.

Le
ad
(p
pm
)117
L e a d Vs C o p p e r
100000 =
10000 -
1 0001
I I I I 1111
10000|0 1000 C o p p e r ( p p m )
o Q u e r l z - S u l f l d e V e ins ° S 11 le I f led Zones 0 Brecc la Ve In e
Figure 50. Average lead and copper values forsamples collected at each mine. See Figure 49 formine locations.

also have a restricted range of ratios between 3 and 23, with the greatest abundance of each element found at the Austerlitz.
118
Lead versus MolybdenumFigure 51 shows a restricted zone of high values among
quartz-sulfide veins in the northeast portion of the district. Most of the quartz-sulfide veins have ratios above about 100. Figure 52 shows two distinct trends among the quartz-sulfide veins. The high lead trend includes most of the main producers including the Montana, Idaho and Warsaw mines, with the peripheral veins showing generally lower ratios and in a few cases lower abundances. The high molybdenum trend includes, in order of decreasing overall abundances, the Holden, El Oro Extension, and the El Oro in the south and the two most distal mines, the Ostrich and Yellowjacket, in the north. All but one of the silicified zones also plot along the high molybdenum trend.
The breccia veins show little overlap with the other mineralization styles. Within the breccia veins two distinct populations are evident in Figure 52. The Oro Blanco, Tres Amigos, Twin, and Sorrel Top mines, and an unnamed breccia vein, have lower overall lead and molybdenum abundance than the remaining breccia veins. All
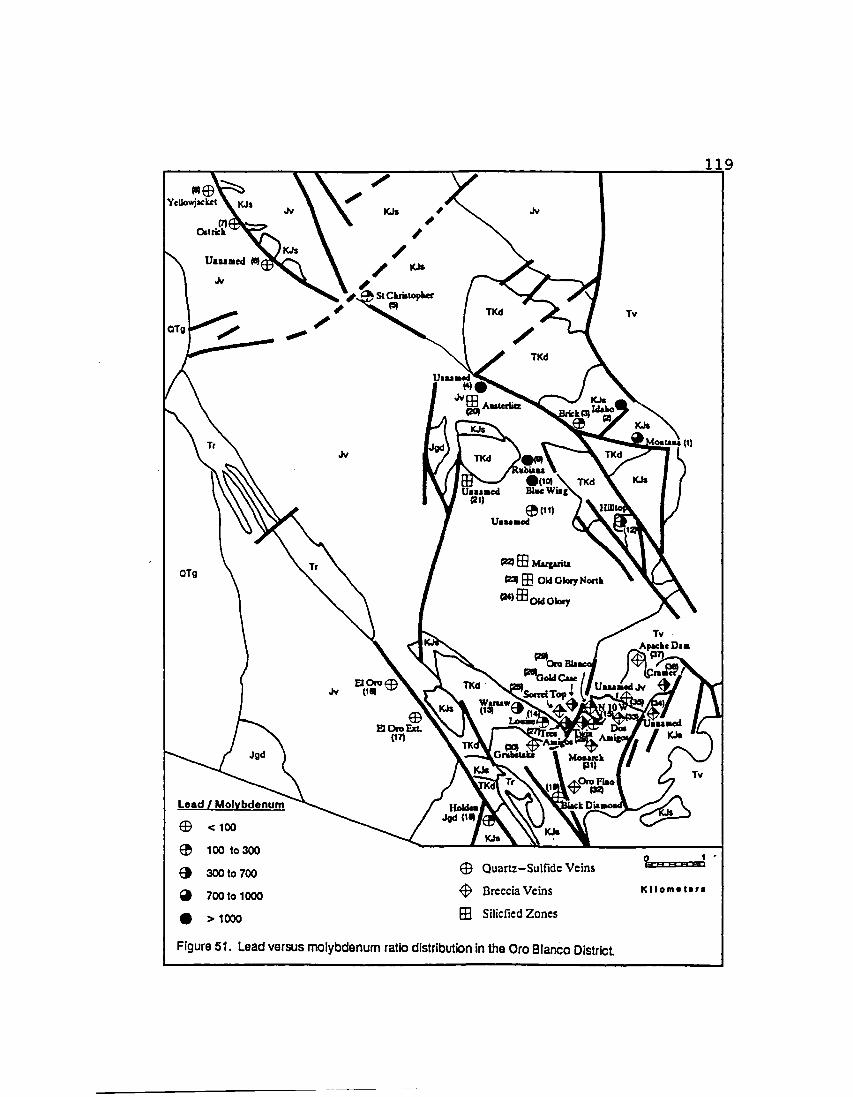
119«©
Ycllowjsckcl
Lead / Molybdenum
© < 100 © 100 to 300
0 300 to 700
0 700 to 1000
# >1000
© Quartz—Sulfide Veins
^ Breccia Veins
Q Silicfied Zones
Ki lometer#
Figure 51. Lead versus molybdenum ratio distribution in the Oro Blanco District

Le
ad
(p
pm
)120
L e a d Vs M o l y b d e n u m
100000 =
10000 =
1 000 =
1 00 =
M o l y b d e n u m ( p p m )
° Q u a r t z - S u l f i d e Ve ins ° S l l lc I f led Zonee 0 Brecc la Ve In e
Figure 52. Average lead and molybdenum values forsamples collected at each mine. See Figure 51 formine locations.

121
but the last of these veins are clustered near the center of the area hosting this mineralization style. The breccia veins with the lowest lead to molybdenum ratio include four of the mines near the periphery of the breccia vein zone, the Oro Fino, Grubstake, Apache Dam, and an unnamed breccia vein.
Antimony versus ArsenicThe quartz-sulfide veins generally have the highest
antimony to arsenic ratios. Ratios progressively decrease away from the main producers. Among the quartz-sulfide veins, the highest values are located at the Idaho and Montana mines, with lower overall abundances and slightly lower ratios at the peripheral veins including the Rubiana, Blue Wing, and the unnamed quartz-sulfide veins near the Austerlitz mine and south of the Blue Wing mine (Figures 53 and 54). Other relative highs among this mineralization style are found in the southern portion of the district at the Holden Mine and at the N 10 W veins. The lowest values, below about 0.3, are located at the El Oro, El Oro Extension, and the Louise properties in the south, and at the Brick mine and the three distal veins NW of the St. Christopher mine.
The breccia veins and silicified zones all have ratios

122

An
t Im
on
y (p
pm
)
A n t i m o n y Vs A r s o n Ic
1 00 ■=
O” Of? OMf? 0
10A r s e n Ic ( ppm)
° Ouer Lz-Su I f Ids V e in s ° S U Ic I f led Zones 0 Brecc lo Ve In e
Figure 54. Average arsenic and antimony values forsamples collected at each mine. See Figure 53 formine locations.

124below 1. The Austerlitz mine has the highest abundance of both elements among the silicified zones.
Antimony versus MolybdenumFigures 55 and 56 show two distinct trends among the
quartz-sulfide veins. The population with the higher ratios consists of mines in the northern portion of the district. The Idaho and Montana mines are on the high end of the curve with ratios and abundances decreasing away from this center. The peripheral veins have values intermediate between the main producers and the distal veins. Similarly, the lower trend consists primarily of mines in the south and progresses from the Holden mine on the high end to the El Oro mine on the low end.
The silicified zones have generally low antimony values, and all of these veins except the Old Glory mine plot along with the lower relative antimony trend with the southern quartz-sulfide veins. Most of the samples from the breccia veins have average antimony values at or below the detection limit of 1 ppm and they plot near the distal veins associated with the northern quartz-sulfide system. The highest ratios among the breccia veins were noted at the Tres Amigos, Twin, and Oro Blanco mines in the center of the area occupied by these veins.

126
A n t i m o n y Ve M o l y b d e n u m
1 0 0 0 *=
/ e 31 * ?f eoooo o o 20 - - ---*1 I * l l * | 1 1 I I I I |
M o l y b d e n u m ( p p m )
o Ouer t z -S u I f Ide Veins ° S 11 Ic I f led Zones 0 Brecc lo Ve In e
Figure 56. Average molybdenum and antimony values for sairples collected at each mine. See Figure 55 for mine locations. Trends A and B contain quartz-sulfide veins dominantly from the northern and southern portions of the district respectively.

127Antimony versus Bismuth
The quartz-sulfide veins are divided into two populations separated by values of about the 0.1 (Figures 57 and 58). The properties with lower ratios include the quartz-sulfide veins in the southern portion of the district/ except the Black Diamond mine and the N 10 W prospects. Along both trends/ the main producers occupy the higher ratio and abundance end/ the peripheral veins generally have intermediate values/ and the distal veins tend to have lower ratios.
The silicified zones all plot within the trend occupied by the southern quartz-sulfide veins. The breccia veins have the lowest abundances in both elements and have ratios similar to the northern quartz-sulfide trend.
Antimony versus GoldThe highest relative antimony is found among the
quartz-sulfide veins (Figures 59 and 60). The main producers, including the Idaho, Montana, and Holden mines have the highest ratios, and the peripheral veins have values intermediate between the main producers and the rest of the mines. The distal mines in the southern portion of the district as well as those NW of the St. Christopher prospect have very low antimony abundances and

128

An
tim
on
y
(pp
m)
129
A n t i m o n y Vs B i s m u t h
1 0 0 0 1
1 00 =o*
1 0 "E o11O4
osO’®
O'®
o13
•J24 020
D23 0M O21 O17 07
i i i m m] i i i iiiii; i iiiiill) i i i0.1 1 10 100
B I s mu t h ( p p m )
1 ='=OB
o’O22 o1*
° Quor t z - S u I f Ids V e i n s o S i I Ic I f l ed Zones 9 G reco le V e i n s
Figure 58. Average antimony and bismuth values forsamples collected at each mine. See Figure 57 formine locations.
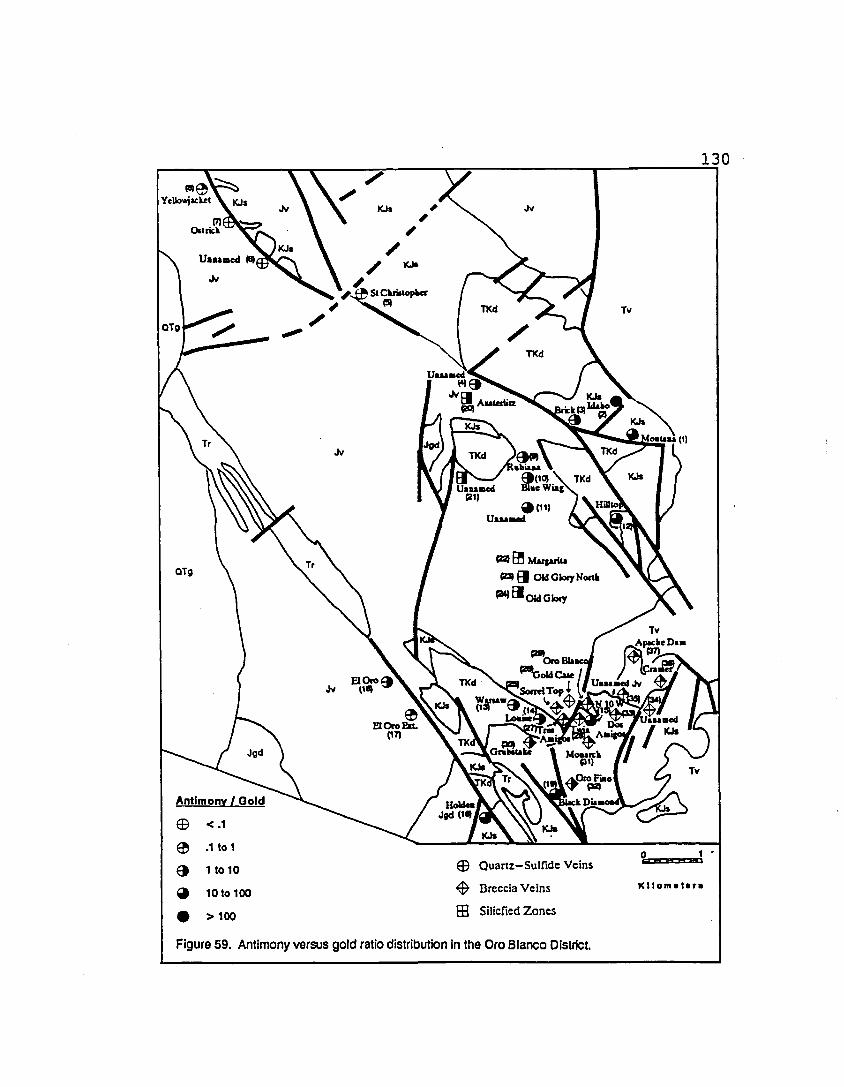
130
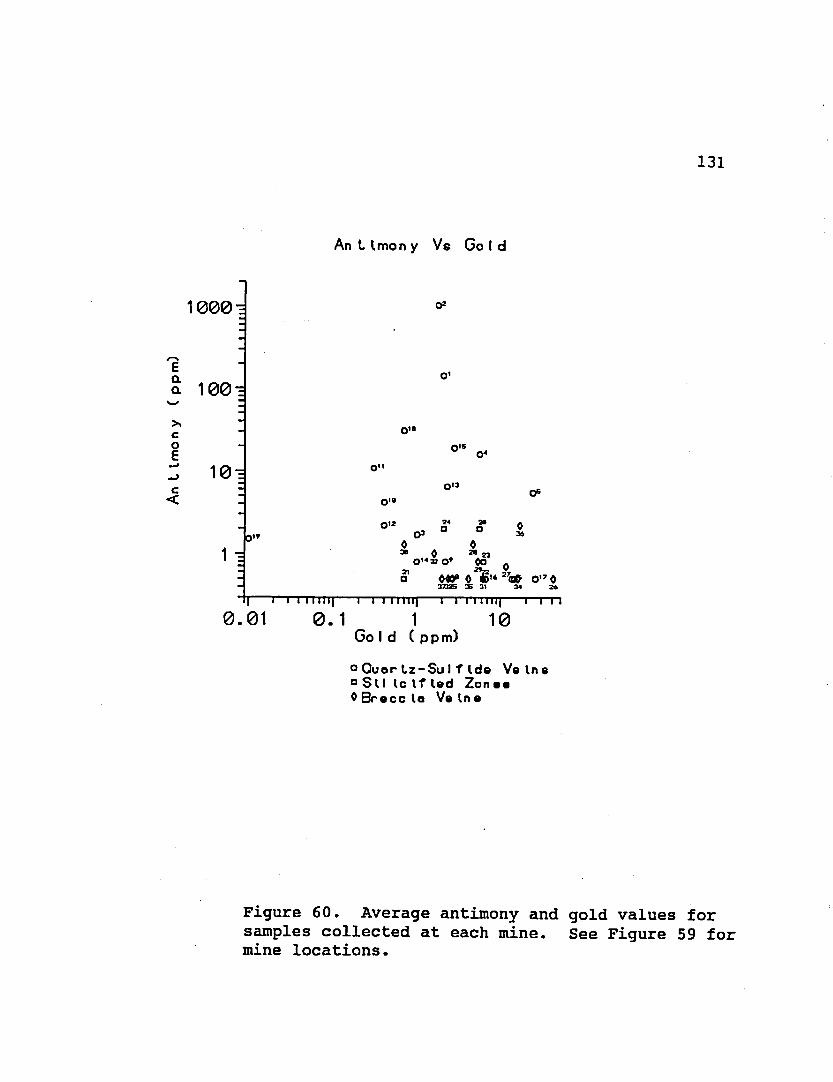
An
t tm
on y
(p
pm
)131
1000
100
10
1
A n t i m o n y Vs G o l d
T i i i 11 ii|i i i 1111 j
G o l d ( p p m )
o Q u o r t z - S u l f l d e V e i n s ° S i I lc I f led Zon ee 0 B re cc le Ve In e
Figure 60. Average antimony and gold values forsamples collected at each mine. See Figure 59 formine locations.

132ratios that overlap with the breccia veins. Antimony to gold ratios among the silicified zones generally lie between those of the peripheral and distal quartz-sulfide veins. Among the breccia veins, the highest ratios were noted at the peripheral deposits including the Grubstake, Oro Pino, and Cramer mines.
Lead versus SilverThe quartz-sulfide veins form two distinct populations
(Figures 61 and 62). One group, which has lead averages above about 3,000, includes the main producers with the exception of the Holden mine and all but two of the proximal veins. The lower lead population includes the distal veins and the Holden mine. The former group have fairly consistent lead values but have decreasing silver values away from the main producers. The latter population has decreased overall abundances away from the Holden mine but has fairly consistent ratios below about 100.
The silicified zones and the breccia veins have a narrower range of values. The silicified zones all have ratio averages between 20 and 70 and all but three of the breccia veins average between 3 and 26. The Austerlitz mine has the highest average abundances of both elements among the silicified zones.

133

134
L e e d Vs S 11v e r
100000
10000
1 000 :
1 00 =
S i l v e r ( p p m )
o Quor t z - S u I f Ids V e i n s a S l l Ic I f led Zones 4 B r e c c le Ve In s
Figure 62. Average lead and silver values forsamples collected at each mine. See Figure 61 formine locations.

135Lead versus Zinc
As above, the quartz-sulfide veins are separated into two populations with the higher lead population consisting primarily of the main producers and the proximal mines (Figures 63 and 64). These veins with the exception of the St. Christopher vein, and the unnamed vein near the Austerlitz mine, have lower ratios away from the Montana mine. In the southern portion of the district the high lead population has lower ratios away from the Warsaw mine toward the proximal veins at the Louise and Black Diamond mines. An exception to this is noted at the N 10 W veins, which have a higher average ratio than the Warsaw mine. Among the quartz-sulfide veins, the lower lead population consists of the Holden mine and most of the distal veins, as well as two northern proximal veins. The Holden mine has higher abundances of both metals than do the distal quartz-sulfide veins.
The silicified zones have a restricted range of ratios between 10 and 37. The Austerlitz mine has the highest abundances of both metals. The breccia veins all have ratios between 0.8 and 2.
Antimony versus ZincIn the northern portion of the district there is a
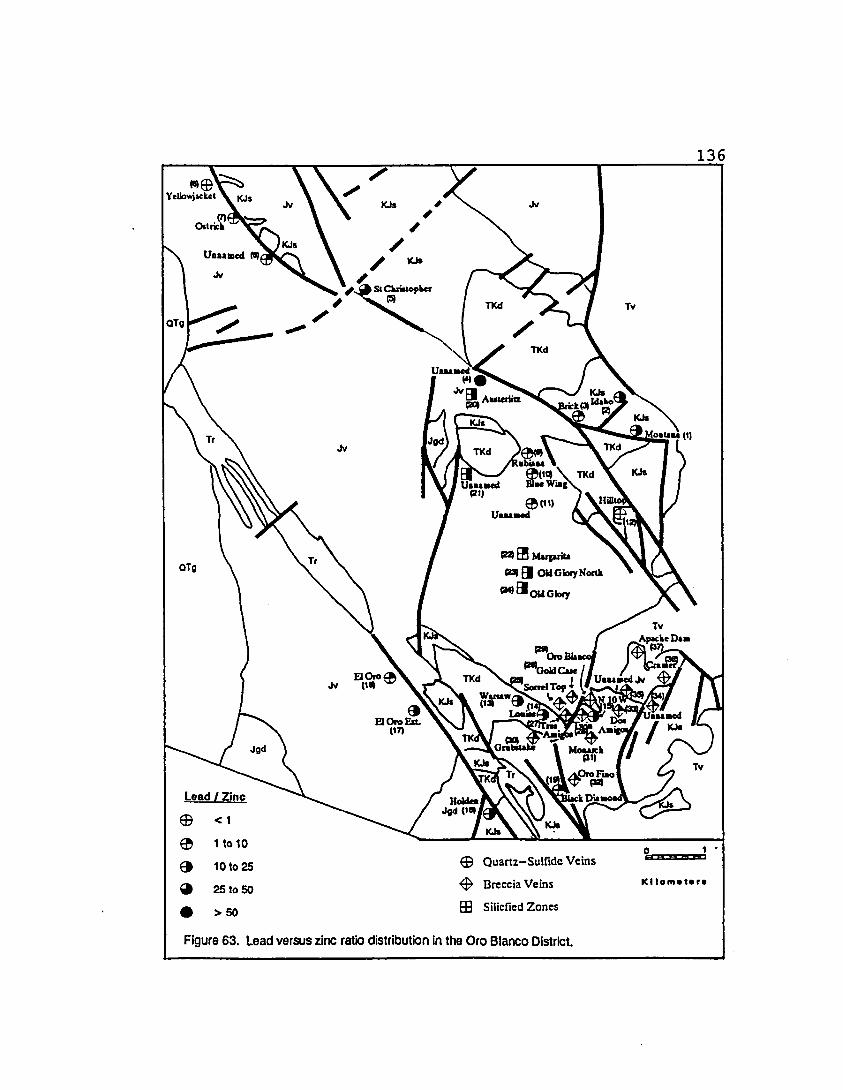
136

Le
ad
(p
pm
)137
L e a d Vs Z i n c
100000 “
1 0000 -=
1 I I I I 111I I II lll|I I I 1 I II)1000 1 0000
Z In c ( p p m )
o Q u e r t z - S u l f l d e Vo Inc o S U lc I f ted Zones 4 B r e c c i a V e i n s
Figure 64. Average lead and zinc values forsamples collected at each mine. See Figure 63 formine locations.

138decrease in antimony to zinc ratios as well as in abundances of antimony and zinc away from the main producers along the large NW-trending fault (Figures 65 and 66). Here, the Idaho and Montana mines have the highest relative antimony. Intermediate abundances and ratios are found at the unnamed veins south of the Blue Wing mine, near the Austerlitz mine, and at the St. Christopher mine. Low abundances and ratios were noted at the distal veins including the unnamed vein in Skunk Springs, and at the Ostrich and Yellowjacket mines. The lowest ratios in the district were found at the proximal quartz-sulfide veins at the Hilltop, Blue Wing and Rubiana mines in the north and at the Louise and Black Diamond mines in the south.
The silicified zones had low abundances of both metals and intermediate ratios. Among these veins the Austerlitz mine had the highest abundances of both metals. The breccia veins had low abundances and, where antimony levels were detectable, had ratios intermediate between the silicified zones and the proximal quartz-sulfide veins.
Zinc versus GoldThe highest relative zinc values were found at the
proximal quartz-sulfide veins including the Black Diamond and Louise mines in the south and the Hilltop, Blue Wing,

139

An
t Im
on y
(p
pm
)
A n t i m o n y Vs Z i n c
1 000 =
100 =
TTTTTTTfi I I M1110 100 1000 10000
Z i n c ( ppm)
o Q u a r t z - S u l f i d e V e in s ° S l l Ic I f led Zones 0 B r e c c la Ve In s
Figure 66. Average antimony and zinc values forsamples collected at each mine. See Figure 65 formine locations.

141and Rubiana mines in the north (Figures 67 and 68). High values were also noted at the Idaho mine. Intermediate values were noted among the breccia veins, most of the main producer quartz-sulfide veins, and the Austerlitz mine.The lowest ratios were among the remaining silicified zones and the distal quartz-sulfide veins.
Tellurium versus ThalliumFigures 69 and 70 show the tellurium to thallium ratios
throughout the district. The quartz-sulfide veins have two distinct trends. The southern veins have a higher relative tellurium trend. The Holden mine has the highest ratio.The highest values are among the northern quartz-sulfide veins are found at the St. Christopher and Montana mines and at the unnamed prospect near the Ostrich mine. Ratios among the silicified zones fall between these two trends.
The breccia veins have the lowest ratios and have no overlap with the other mineralization styles.
Host Rock ChemistriesFigures 71 and 72 show the results of analysis of host
rock lithologies. The ranges in each lithology overlap for all but three of the elements. The three exceptions include lower relative manganese and gold values in the Jurassic Volcanic units and higher copper in the diorite.

142

Z In
c
(pp
m)143
Z i n c Vs G o l d
10000 =
i m i im [
0.01G o l d ( ppm)
o Q u a r t z - S u l f i d e V e i n s ° S 11 lc I f led Zones 9 B re c c la Ve In e
Figure 68. Average zinc and gold values for samplescollected at each mine. See Figure 67 for minelocations.

144

145
The I I turn Vs To I I u r turn
Eaa
ED
OjC
36 37
I I I I |
To I I u r turn (p p m )
o Quer t z - S u I f Ide V e i n s ° S l l Ic I f led Zones 0 B re cc lo Ve In e
Figure 70. Average tellurium and thallium values for samples collected at each mine. See Figure 55 for mine locations. Trends A and B contain quartz-sulfide veins only from the northern and southern portions of the district respectively.

A Jurassic Volcanic GeochemistryN=3
146
P P M1,000
0.001
Mn Zn Cu Pb As Mo W Tl Sb Bi Hg Ag Te Au
Conglomerate Geochemistry
PPM10,0001,000
o.ooio.oooi
Mn Zn Cu Pb As Mo W Tl Sb Bi Hg Ag Te Au
I Range Average
Figure 71. Sample averages from unaltered Jurassic volcanics (A) and the Oro Blanco Conglomerate (B).

Diorite GeochemistryN-6
PPM10 ,000
1 ,0 0 0
0.001Mn Zn Cu Pb As Mo W Tl Sb Bi Hg Ag Te Au
I Range i r Average
Figure 72. Sample averages from the Ruby Diorite.

148While the lower manganese values in the volcanics appear to play an important role in the manganese distribution, the differences in the abundances of copper and gold in the host lithologies do not appear to exert a primary control. The low sample density brings the significance of minor differences in the range of values into question.
In Figure 73 it is apparent that the majority of mines with low relative manganese values are hosted in the Jurassic Volcanics. This difference cannot be attributed to mineralization style. Of the nineteen recognized quartz-sulfide veins sampled in this study, twelve are hosted solely within the volcanics. Of these mines, nine averaged below 500 ppm manganese, whereas six of the seven quartz-sulfide veins hosted in the other lithologies averaged above 1,000 ppm.
It is apparent from Figure 74 that there is no primary lithologic control on the gold averages among the mines.The role of host lithology on copper distribution is ambiguous as only three of the mines are hosted solely in the diorite (Figure 75).
ConclusionsIt appears that a single mineralizing episode resulted
in the deposition of both the quartz-sulfide veins and the

Mine Manganese Averages SeparatedBy Host Lithology
149
7
6
5
4
3
2
1
0
8No. of Mines
< 100 1 0 0 -5 0 0 5 0 0 -1 0 0 0 1 0 0 0 -5 0 0 0 >5000
PPM Manganese
KJS d H TKD
Figure 73. Histogram of manganese values separated by hostlithology.

150
Mine Gold Averages SeparatedBy Host Lithology
6
5
4
3
2
1
0
7No. of Mines
<1 1 -3 3 - 6 6 - 1 0 > 1 0
PPM Gold
Figure 74. Histogram of gold values separated by hostlithology.

Mine Copper Averages SeparatedBy Host Lithology
151
7
6
5
4
3
2
1
0
8No. of Mines
<50 50 -500 500-1500 1500-2500 >2500
PPM Copper
Figure 75. Histogram of copper values separated by hostlithology.

152silicified zones. The silicified zones have ratio values generally in the range of the proximal and distal quartz- sulfide veins. Similar zoning trends are also noted among these vein styles. The breccia veins are most similar to the distal quartz-sulfide veins but are known to represent a later event based on crosscutting relationships.
Based on metal ratio zoning, there appear to be four centers of mineralization including the main producers in both the north and the south, the silicified zones and the breccia veins. All of the centers have similar zoning trends.
Among the quartz-sulfide veins, metal zoning has resulted in three distinct populations based on metal ratios. This zoning was repeated at both centers of quartz-sulfide mineralization. Compared to the main producer veins the proximal veins have, relative to lead, increased zinc and decreased.copper. The proximal veins generally overlap in the ratios of silver to gold, lead to gold, copper to gold, and lead to molybdenum, and have lower relative antimony and higher zinc to gold ratios.The proximal veins are intermediate between the main and distal veins in terms of overall ratio values and abundances with most of the ratios tested. Compared to the main producers and the proximal veins, the distal quartz-
153sulfide veins have higher relative gold and lower relative lead, zinc, silver, copper, and antimony. The southern quartz-sulfide veins have higher bismuth, molybdenum, and tellurium and lower antimony than the main and proximal quartz-sulfide veins in the north but overlap in terms of the other ratios tested.
The silicified zones represent a distinct center. The silicified zones are intermediate between the proximal and distal quartz-sulfide veins with respect to silver to gold, copper to gold, antimony to arsenic, antimony to gold, and lead to gold ratios. Samples from these veins have average ratios that overlap with the distal veins in terms of lead to molybdenum, antimony to bismuth, and antimony to gold.
Within the silicified zones a zoning trend similar to the quartz-sulfide veins is noted. The northernmost vein, at the Austerlitz mine, exhibits the highest silver to gold and lead to gold ratios, and has the greatest overall abundances of lead, copper, molybdenum arsenic, and antimony.
The breccia veins exhibit ratios most similar to the distal quartz-sulfide veins. These vein styles have in common low antimony and generally low base metal abundances relative to gold. The breccia veins are intermediate in terms of silver to gold ratios between the distal and

154proximal quartz-sulfide veins, but are unique in terms of low tellurium to thallium. Samples from the Grubstake mine in the southwestern portion of the area occupied by this mineralization style had the highest zinc to gold, copper to gold, lead to gold, antimony to gold, lead to silver, and antimony to arsenic ratios as well as the highest molybdenum abundance. The veins at the northeastern limit of the area occupied by the breccia veins have the lowest relative silver to gold ratios.

Chapter 5 Fluid Inclusions
155
In order to characterize the deposits of the Oro Blanco district and to understand the relationships between the various styles of mineralization, temperatures of homogenization (Th), temperatures of melting of ice (Tm ice), or both, were determined on 296 fluid inclusions using an SGE gas-flow heating and freezing stage. Seven separate quartz bearing systems were examined with twelve doubly polished thin sections. Measurements were obtained on samples from four quartz-sulfide veins, one breccia vein, and two silicified zones.
Determination of OriginIn determining the origin of individual inclusions,
the criteria used were those outlined by Roedder (1984). A secondary origin was assumed where inclusions were located along a planar or linear feature that crosscut grain boundaries. A primary origin was only rarely determined with certainty. Most of the inclusions that were classified as primary were done so based on the lack of association with a linear or planar feature, in combination with the observation that no other inclusion is found

156within about five diameters of the inclusion in question. This lack of negative criteria is permissive of, but not proof of, a primary origin. Whenever possible, pseudosecondary inclusions were used. Here inclusions were typically seen to be associated with planes of inclusions parallel to and not crosscutting grain boundaries. This provides definitive proof of fluid trapping at the time of crystal growth.
MeasurementsWhenever possible both freezing and heating
measurements were taken on the same inclusion. On each chip, all freezing measurements were performed first. The inclusions all showed about 20% vapor phase, thus it was felt that stretching should not occur during freezing.
Freezing measurements were made by first supercooling the sample. In most cases freezing occurred at about -30 to -50 degrees, and was evidenced by a sudden change of the refractive index within the inclusion. The sample was then heated at a rate of about one degree per second until melting of the ice occurred. The sample was again supercooled, and then heated at the same rate to within about five degrees of the approximate melting temperature. Here the heating rate was slowed to about one degree per

157minute. Once the ice began to shrink the temperature was lowered about a tenth of a degree and the ice was allowed to grow back. Repeating this three or four times allowed the ice to grow back crystallographical continuously, and made the observation of final melting of the ice easier.The freezing point depression was then determined by heating the stage very slowly until the ice totally disappeared. At that instant the temperature was recorded and the stage cooled. If the crystal immediately grew back, final melting had not occurred, and the stage was heated to a temperature a tenth of a degree warmer than the previous run, and then cooled. This was repeated until the ice did not slowly grow back within a few degrees of disappearing.
For the observations described above, ten microns in length is about the minimum usable size. Many of the inclusions classified as primary were smaller than this.The observations necessary to determine homogenization temperatures could be made on the smaller inclusions, thus more of these data were collected.
Homogenization temperatures were determined by heating the stage at about a degree per minute until shrinkage of the vapor phase was noted. Typically, upon heating, the vapor phase would shrink until it was barely visible as a
158black dot and then rapidly bounce off the walls of the inclusion before disappearing. As soon as the disappearance occurred, the temperature would be noted and the stage was cooled. If upon cooling the black dot reappeared within a few degrees and continued to grow with further cooling, homogenization had not occurred. The temperature would then be raised to one-tenth of a degree above the last run and allowed to cool. This was repeated until the vapor remained metastably within the liquid through thirty or forty degrees of cooling, before suddenly appearing.
Overall ResultsAll inclusions consisted of a liquid and a vapor
phase, and homogenized to a single liquid phase upon heating. No double meniscuses or clathrates indicative of the presence of carbon dioxide were noted. The proportion of the vapor based on visual estimates was 15% to 30%. Usable inclusions were mostly in the range of five to fifteen microns in the largest dimension, and ranged from three to about thirty microns.
Th within primary inclusions varied from 190 to 370 degrees (figure 76). The Idaho mine contained inclusions that homogenized over this entire range. The other mines

District Wide Fluid Inclusion Data
Tm Ice
150 175 200 225 250 275 300 325 350 375 400
All Inclusions are primary.
Th
XSlChddophw 0 Wamaw ^ Margarita
+ Idaho D Old Glofy
A Montana X Oro Blanco
Figure 76. Tm ice versus Th determinations from all mines sampled in the Oro Blanco District.

160
showed narrower ranges. In general, samples from the Oro Blanco mine, the only example of a breccia vein, showed the lowest Th, about 210 degrees. The St. Christopher mine, a distal quartz-sulfide vein, showed slightly higher temperatures with a mode around 225 degrees. Several mines, including the Warsaw, Old Glory, and the Montana mine, have modes that cluster at about 275 degrees. The highest modal temperature of 330 degrees was noted at the Margarita Mine.
Some individual samples showed large ranges in Th.The largest range was from sample 166 from the Idaho mine, in which apparent primary inclusions homogenized over range of more than 150 degrees. There are four possible explanations of the large range in data from some of the mines: actual differences in the temperature of the trapped fluids; leakage after trapping; misidentification of bubble type so that an inclusion is actually secondary; operator error. The method of determining Th described above was strictly adhered to, and it is felt that the human error during data collection has been minimized. The range is therefore due to some combination of the first three factors. It is unlikely that leakage will create a tight mode in homogenization temperatures. Also, leakage in a temperature regime lower than the original trapping

161temperature will lower the observed Th. Therefore the high end of the Th range, and well defined modes, are probably due to trapping conditions. On the other hand, diffuse lower temperature ranges, that in many cases homogenization at temperatures similar to demonstrably secondary inclusions, are probably due to leakage or misidentification of origin.
Tm ice ranged from -3.5 to 0 degrees (Figure 76). The quartz-sulfide systems in general show the greatest freezing point depression, except at the Idaho mine. The silicified zones showed Tm ice from -2.2 to -0.7.Inclusions from the Oro Blanco vein showed Tm ice between - 0.6 and 0.
Estimates for pressure were not obtained, nor was evidence for boiling observed. Abundant open space filling textures and coxcomb quartz were noted in all of the mineralization styles. These are commonly associated with near surface deposits, which indicates that pressure corrections are probably small, and that Th approximate the true temperatures of trapping. It should be stressed however that Th represent minimum temperatures of trapping.

162Quartz-Sulfide Veins
The quartz-sulfide vein systems examined were the Montana, Idaho, Warsaw, and Saint Christopher mines. The Montana mine was chosen because it is the most important mine in the district and it was suspected that this may represent the center of the mineralizing system. The Idaho mine is the second largest producer, and is a possible extension of the Montana system. The Warsaw mine has had relatively extensive workings and is distinct mineralogically from other quartz-sulfide systems in that it contains much greater amounts of pyrite. The Saint Christopher mine was selected as an example of one of the many minor base-metal-rich veins that have been exploited in a small way throughout the district.
Montana MineTwo samples of ore grade material about 500 feet apart
were collected from the surface outcrops at the Montana Mine. Both samples consist of quartz with over two percent lead. Sample number 174 has 2.01 percent zinc, 0.8 percent copper, 154 ppm silver, and 4.38 ppm gold. Sample number 176 has 3.1 percent zinc, 0.2 percent copper, 34.1 ppm silver and 1.24 ppm gold. Both samples had two types of quartz, a fine-grained grey variety and a coarse, white variety with comb texture that was intergrown with galena.

163sphalerite, tetrahedrite, and chalcopyrite. The fine grained quartz yielded no usable fluid inclusions. Large primary inclusions were found in euhedral quartz crystals that were completely enclosed within galena. This material is particularly well suited to fluid inclusion study for two reasons. First of all, the galena absorbed much of the stress that deformed unprotected quartz. Relative to quartz outside of the galena, this material was clear and free of the numerous fracture-controlled planes of secondary inclusions that are abundant elsewhere.Secondly, the quartz was deposited at very nearly the same time as the galena. Similar undeformed quartz within the galena was located in thin sections from each of the quartz-sulfide veins and almost all of the primary inclusions were located in these areas.
Data were collected on 61 suspected primary inclusions (Figures 78, 79 and 80). The overall range in Th is from 225 to 350 degrees with a mode between 275 and 280 degrees and an average value of 289. Sample 176 inclusions that were thought to be of primary origin homogenized over this entire range. This sample also had a clear mode at 315 to 320 degrees. Data from this sample in which inclusions homogenized below about 250 degrees overlaps with data from the secondary inclusions and are probably not true primary

Montana Mine 164
No. of Inclusions
Secondary
111111 L1.1 I N I M 1 t I 1 M t
Sample 176. Primary
M I I I t I t t
tiiiiEl Sample 174 Primary
Figure 77. Th determinations on two fluid inclusion samples from the Montana mine.
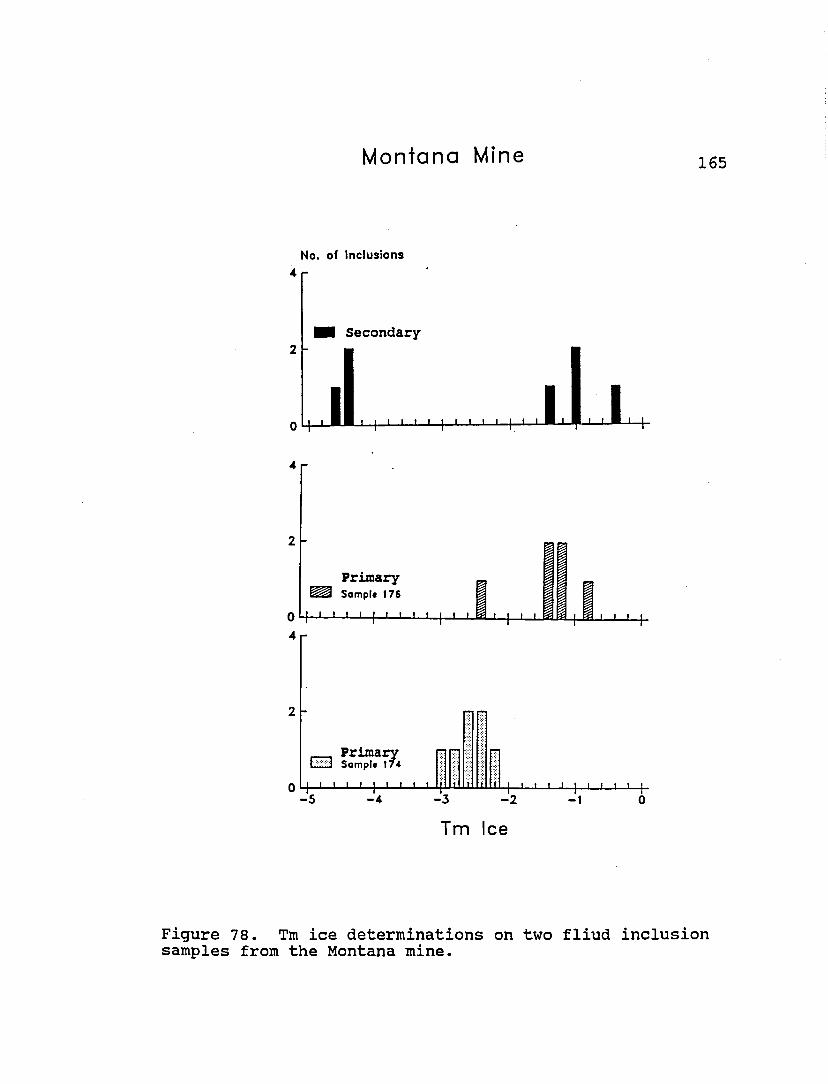
Montana Mine 165
No. of Inclusions 4 r
4
Prim arySemple 176
i i i t i t t i t i i »
4 r
P__, Prim arylS j Sample 174
i i i i i i i i i * 1 i t i t I I I—L.—5 —4 —3 —2 —1 6
Tm Ice
Figure 78. Tm ice determinations on two fliud inclusionsamples from the Montana mine.

166
Montana Mine
Tm Ice
150 175 200 225 250 275 300 325 350 375 400
Th
0 174 Primary & 176 Primary 4" 174 Secondary
Figure 79. Tm ice versus Th determinations on samples 174and 176 from the Montana mine.

167inclusions, or leakage may have occurred. Sample 174 shows a slightly more restricted range from 255 to 340 and a mode at 275 to 280.
Based on a close association with fractures, twelve inclusions were classified as secondary, and homogenized between 215 and 350 degrees. The secondary inclusions had a mode at 225 degrees and an average of 255 degrees.
Based on Tm ice, the two samples from the Montana mine appear to represent distinct fluids. Six melting temperature measurements on primary inclusions were taken from sample 176. They ranged from -0.8 to -2.4, with four inclusions melting between -1.2 and -1.4. Seven primary inclusions from sample 174 melted between -2.3 and -3.0, with four melting between -2.4 and -2.6. Seven secondary inclusions from sample 174 ranged between -0.5 and -4.7, with no clear mode, and a median temperature of -1.5 degrees.
Warsaw MineTwo samples were analyzed from the Warsaw mine. Both
samples were of unoxidized material collected approximately 500 feet apart along the NE-striking vein. Sample 137 has 1.02% lead, 1.22% zinc, 1.35% copper, 294 ppm silver, and 0.939 ppm gold. This sample consists of 60% pyrite in
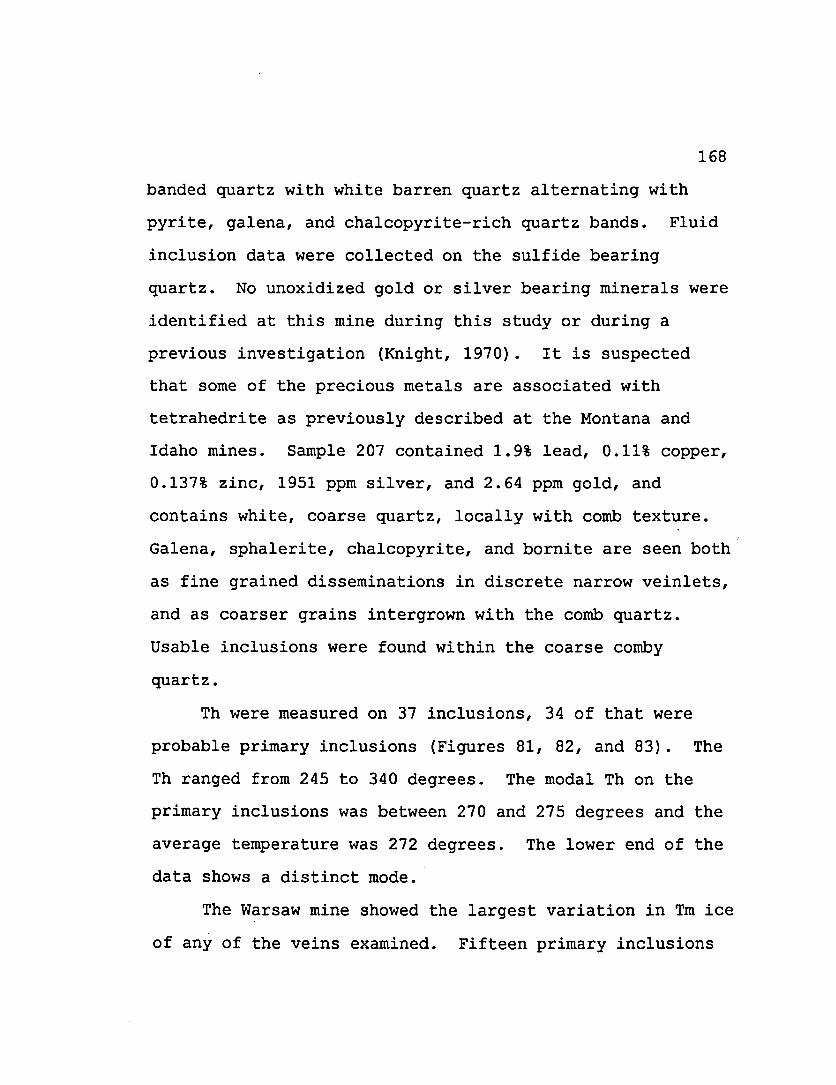
168banded quartz with white barren quartz alternating with pyrite, galena, and chalcopyrite-rich quartz bands. Fluid inclusion data were collected on the sulfide bearing quartz. No unoxidized gold or silver bearing minerals were identified at this mine during this study or during a previous investigation (Knight, 1970). It is suspected that some of the precious metals are associated with tetrahedrite as previously described at the Montana and Idaho mines. Sample 207 contained 1.9% lead, 0.11% copper, 0.137% zinc, 1951 ppm silver, and 2.64 ppm gold, and contains white, coarse quartz, locally with comb texture. Galena, sphalerite, chalcopyrite, and bornite are seen both as fine grained disseminations in discrete narrow veinlets, and as coarser grains intergrown with the comb quartz. Usable inclusions were found within the coarse comby quartz.
Th were measured on 37 inclusions, 34 of that were probable primary inclusions (Figures 81, 82, and 83). The Th ranged from 245 to 340 degrees. The modal Th on the primary inclusions was between 270 and 275 degrees and the average temperature was 272 degrees. The lower end of the data shows a distinct mode.
The Warsaw mine showed the largest variation in Tm ice of any of the veins examined. Fifteen primary inclusions

WARSAW MINE 169
No. of Inclusions
I I M I t
Sample 207
8 r
EEl Sample 137
I I I I I I I I I I I I I I I I I I I
150t- 200 250 300
ill | I I I I I I M I | I350 400
Th
Figure 80. Th determinations on two samples from theWarsaw mine.

170
Warsaw Mine
No. of Inclusions
Tm Ice
Figure 81. Tm ice determinations on two samples from theWarsaw mine.

171
Warsaw Mine
Tm Ice
150 175 200 225 250 275 300 325 350 375 400
Th
O 207 Primary 0 137 Primary
Figure 82. Tm Ice versus Th determinations on samples 137and 207 from the Warsaw mine.

172had a Tm ice between -0.7 and -3.5, with a mode at -1.6 to -1.8. All but one of these data points was taken from sample 037. No data on secondary inclusions was collected.
Idaho MineTwo samples from the Idaho mine were examined. Both
consisted of coarse quartz with disseminated pyrite, galena, sphalerite, tetrahedrite and chalcopyrite.Analysis of sample 166 shows 1.89% lead, 1.46% zinc, 0.78% copper, 155 ppm silver .731 ppm gold. This sample also contained anomalous antimony at 760 ppm. Sample 169 had 6.38% lead, 0.074% zinc, 0.23% copper, 389 ppm silver and 4.63 ppm gold.
Forty inclusions, 31 primary and 9 secondary, yielded Th data (Figure 83, 84, and 85). There are two distinct populations. The lower temperature population consists of several inclusions from sample 166 as well as the secondary inclusions, and has a modal temperature between 220 and 230. Overall sample 166 has a wide range in homogenization of suspected primary inclusions from 190 to 365 degrees.The higher temperature data are probably related to an initial trapping event, and the fluid inclusions homogenizing near the lower mode probably represent a later trapping event. Sample 169 had a much narrower range from

Idaho Mine
No. of Inclusions
Secondary
0 l[ M ■ M M I 1 | H 1 l i I I I | | | M I I I M I | I I I I M I I I | I M I I M I I | I
4 r
3
2
1
[ £ ] Sample 169Primary
q l| i i i i i i i i i | i i i i i i i i i | i i HlilMLIMlrfM m m i i i i 11 | i i t i m i i i j i
Figure 83. Th determinations on two samples from theIdaho mine.

Idaho Mine 174
No. of Inclusions
Secondary
22 Sample 169Primary
h _J Sample 166
Primary
. T m IceFigure 84. Tm ice determinations on two samples from theIdaho mine.

175
Idaho Mine
o
-i
-2
-3
-4
-5150 175 200 225 250 275 300 325 350 375 400
Th
Tm Ice+ g-M+a + 5
a n a a xD□
0
D 166 Primary 0 169 Primary
4- 166 Secondary X 169 Secondary
Figure 85. Tm ice versus Th determinations on samples 166and 169 from the Idaho mine.

176265 to 300 degrees, with an average of 277, and a mode at 285 to 290.
The Idaho mine exhibited the highest Tm ice of any of the quartz-sulfide systems. Fifteen possible primary inclusions showed a range from -0.1 to -1.4, with a clear mode at -0.4. All but one of these inclusions were from sample 166 and are suspected of being misidentified secondary inclusions or of having undergone leakage. A single Tm ice measurement from sample 169 had a melting temperature of -1.4 degrees. Six the secondary inclusions from sample 166 showed a Tm ice of -0.1 degrees, while one had a Tm ice -0.6 degrees.
Saint Christopher MineOne sample was selected for fluid inclusion work from
this property. Analysis of a hand sample of similar material contained 4.5% lead, 48.6 ppm gold, and 87.9 ppm silver. The sample consisted of broken, coarse, white quartz with hematite along the fractures. The sample contained about ten percent sulfides, including galena and pyrite intergrown with the quartz and also as veinlets cutting the quartz. No silver or gold minerals were identified during thin section analysis.
Nineteen primary and twenty secondary inclusions

177yielded Th data (Figures 84 and 85). Primary inclusions vary between 195 and 255 degrees, and show a mode between 215 and 230 degrees. Secondary inclusions have a similar range from 200 to 260 degrees, and have a mode of 245 to 250 degrees.
Tm ice measurements were made on twenty inclusions classified as primary. One of these inclusions had a Tm ice of -0.1 degrees. The remaining inclusions form a cluster ranging from -2.0 to -3.3, with a clear mode at - 2.8 to -3.0. It is assumed that the inclusion with the highest Tm ice was misclassified. Secondary inclusions overlapped this range with Tm ice value from -0.7 to -3.4 with a mode at -0.7.
Silicified ZonesTwo examples of the silicified zones, the Margarita
and the Old Glory mines, were examined. Fewer usable primary inclusions were found in the silicified zones than in the quartz-sulfide veins systems. This is primarily due to the absence of protected quartz crystals within ductile sulfides. Much of the quartz was highly sheared with numerous planes of secondary inclusions. Primary inclusions were found in zones of clear, relatively coarse quartz that had suffered only minor shearing.

Saint Christopher Mine 178
No. of Inclusions
Secondary
i i * i i i i i i> i i i t ii i i i i i i i i i i t i i i
Primary
150 175 200 225 250 275 500 325 350 375 400
Th
Figure 86. Th determinations from one sample from theSt. Christopher mine.
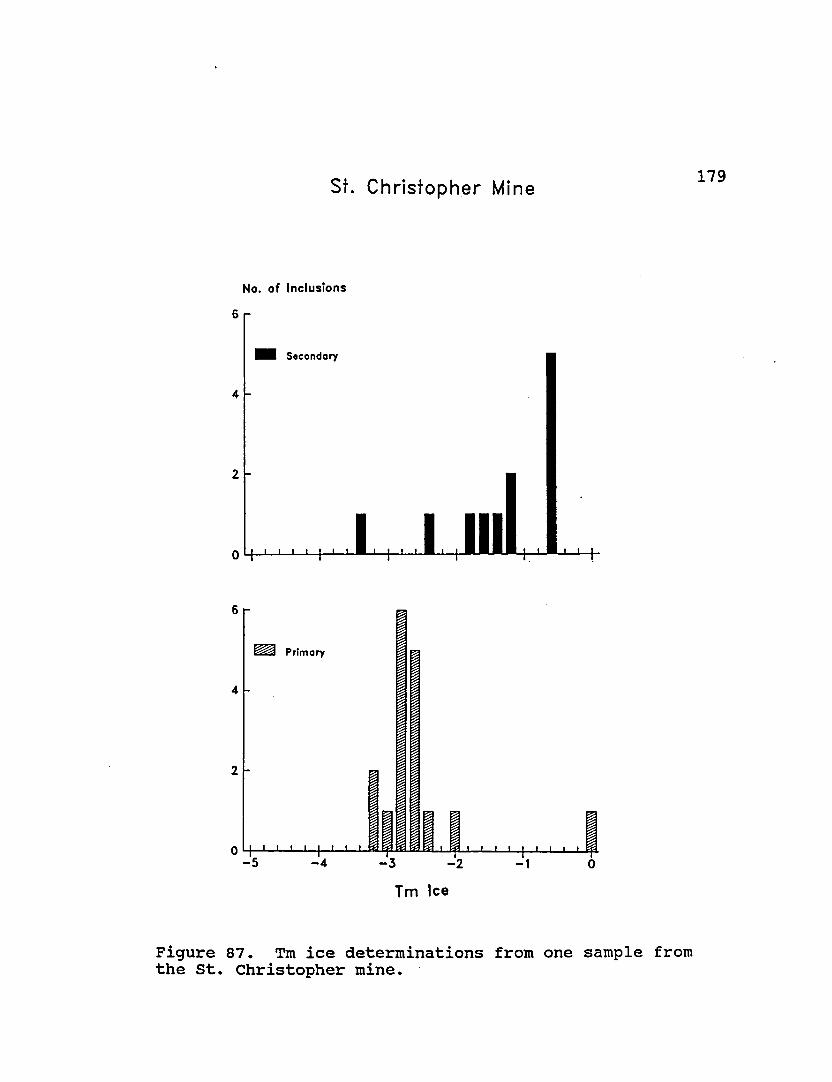
St. Christopher Mine 179
No. of Inclusions
6 n
Primary
Tm Ice
Figure 87. Tm ice determinations from one sample fromthe St. Christopher mine.

St. Christopher Mine
Tm Ice
150 175 200 225 250 275 300 325 350 375 400
Th
D Primary + Secondary
Figure 88. Tm ice versus Th determinations on fluidinclusions from the St. Christopher mine.

181
Two polished thin sections were examined from the Old Glory Mine (Figures 89, 90, and 91). Sample 119 was taken from a massive quartz lens that was not strongly mineralized. Analysis of this material shows 0.037 ppm gold, 7.8 ppm silver, and less than 0.1% of copper, lead, and zinc. Much of the mine area consists of this massive, largely barren quartz with a trace of pyrite and minor iron oxides along fractures. Sample 129 was taken from material that had been selectively mined consisting of a 60 centimeter layer of grey-green quartz with about 1% pyrite, within the barren white quartz. A grab sample of this material ran 1.49 ppm gold, 64.3 ppm silver, and less than 0.1% copper, lead, and zinc. No precious metal bearing phases were identified in the polished sections examined during this study. Previous workers (Wilson, 1934) attributed the gold values to auriferous pyrite.
Th of 24 primary inclusion ranged from 265 to 320 degrees, with a mode at 275 to 280 degrees. Fourteen inclusions from the unmineralized quartz, sample 119, showed a restricted range between 265 and 290 degrees, with a clear mode at 275 to 280, and an average of 272. Ten inclusions from the selectively mined quartz, sample 129, showed a range in Th from 270 to 325 degrees, with a mode
Old Glory Mine

4
2
04
2
08
6
4
2
01
8S
Old Glory Mine 182
lo. of Inclusions
Secondary
I 1 t 11 M I M M M I M t4-L- M M t ■ M f I 1 t t I t M M I t t t I I
Somple 129
Primary
(Hi Sample 119 Primary
ThTh determinations on two samples from the Old

Old Glory Mine183
No. of Inclusions
Secondary
-0EH3 Sample 119 Primary
Tm Ice
Figure 90. Tm ice determinations on two samples from theOld Glory mine.

184
Old Glory Mine
Tm Ice
150 175 200 225 250 275 300 325 350 375 400
Th
D Primary + Secondary
Figure 91. Tm ice versus Th determinations on sample 119from the Old Glory mine.

185at 270 to 275 and an average of 288. Th of three secondary inclusions varied from 160 to 300 degrees, with no clear mode and an average temperature of 253 degrees.
Five primary and two secondary inclusions from sample 119 yielded Tm ice data. The primary inclusions ranged from -0.8 to -2.2, with all but one of them melting between -0.8 and -1.0 degrees. The secondary inclusions had a Tm ice of -0.7 and -0.8.
Margarita MineOne sample yielded Th data on a single secondary and
32 primary fluid inclusions. This sample consisted of grey quartz containing about 3% pyrite that has been partially oxidized to hematite. This sample from a zone that had been selectively mined. Analysis of a grab sample of similar material had 13.9 ppm gold and 27.6 ppm silver, with less than 0.1% each of copper, lead, and zinc. While no precious-metal-bearing phases were recognized during examination of the thin sections, fine grained native gold and silver have been reported (U.S.G.S, 1990, MRDS).
Th of primary inclusion ranged from 270 to 360 degrees with a modal temperature of 330 to 335 and an average of 317 degrees (Figures 92, 93, and 94). The single secondary inclusion homogenized at 180 degrees.
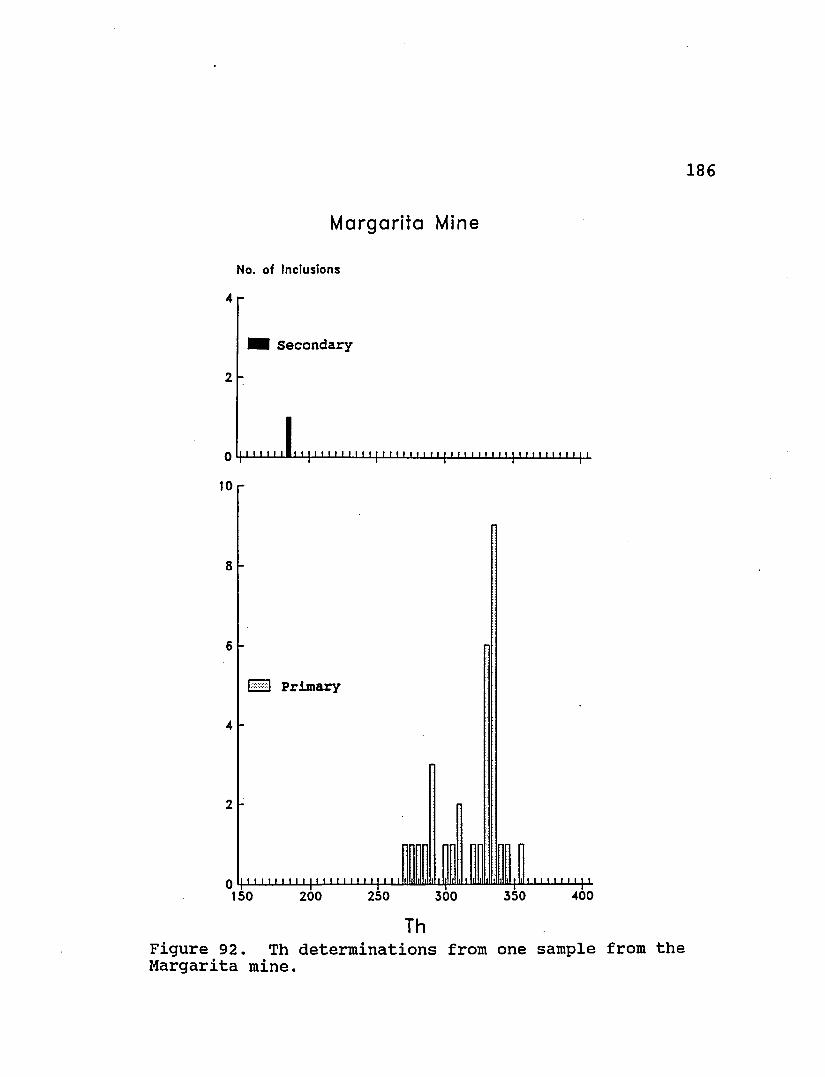
186
Margarita Mine
No. of Inclusions
Secondary
I I I I I I I M I I I I I I I I I I I I I I I I I I I I I I I I I I I I
ES3 Primary
ThFigure 92. Th determinations from one sample from theMargarita mine.

Margarita
No. of Inclusions
Secondary
■ElO Primary
Figure 93. Tm ice determinations from one sample fromthe Margarita mine.

Margarita Mine
Tm Ice
150 175 200 225 250 275 300 325 350 375 400
Th
D Primary + Secondary
Figure 94. Tm ice versus Th determinations on fluidinclusions from the Margarita mine.

Tm ice data were collected on six primary and one secondary inclusion. Of the primary inclusions, three had Tm ice of -0.8 or -0.9, and one -1.4. The secondary inclusion had a final melting temperature of -0.4.
Breccia VeinsThe Oro Blanco vein, the largest of the breccia vein
systems, was selected for fluid inclusion work.Oro Blanco Mine
Two polished thin sections were prepared but only one contained usable fluid inclusions. This sample was taken at the face of a drift on the 125-foot-level in the mine. The vein here consisted of clay gouge with 3 to 6 centimeter stringers of grey quartz throughout. In thin section the quartz is seen to consist of intergrown radiating crystals. Determinations were made on inclusions found in narrow bands consisting of small inclusions that parallel the crystal outlines. A hand sample from this zone contained 2.88 ppm gold, 4.1 ppm silver, and less than 0.1% each of copper, lead, and zinc.
Twelve primary inclusions had Th from 190 to 280 degrees, and had a mode at 205 to 210 degrees. All but two of the inclusions clustered between 190 and 225 degrees.No measurements were obtained on secondary inclusions
189

190(Figures 95, 96, and 97).
Twelve primary inclusions from the Oro Blanco mine exhibited the lowest modal Tm ice of any of the systems studied. All samples showed Tm ice between 0 and -0.4 degrees with a mode at -0.3. No melting data were collected from secondary inclusions.
District-Wide VariationsFigure 76 shows all of the fluid inclusion data points
for which both Th and Tm ice were recorded. Two distinct trends are noted among the quartz-sulfide veins. One trend, between the Montana mine sample 174 and the St. Christopher mine, shows Tm ice and with lower Th noted at the latter vein. One interpretation would be of the cooling of a constant-salinity fluid. The second trend involves the Montana, Idaho, and Warsaw mines, which trend away from Montana mine sample 174 towards lower temperatures and salinities. This trend may be interpreted as a simultaneous dilution and decrease in fluid temperature.
The silicified zones fall outside these trends. These samples define a trend with maximum Th similar to the highest quartz-sulfide temperatures, with a restricted range of Tm ice. This trend may be interpreted as the
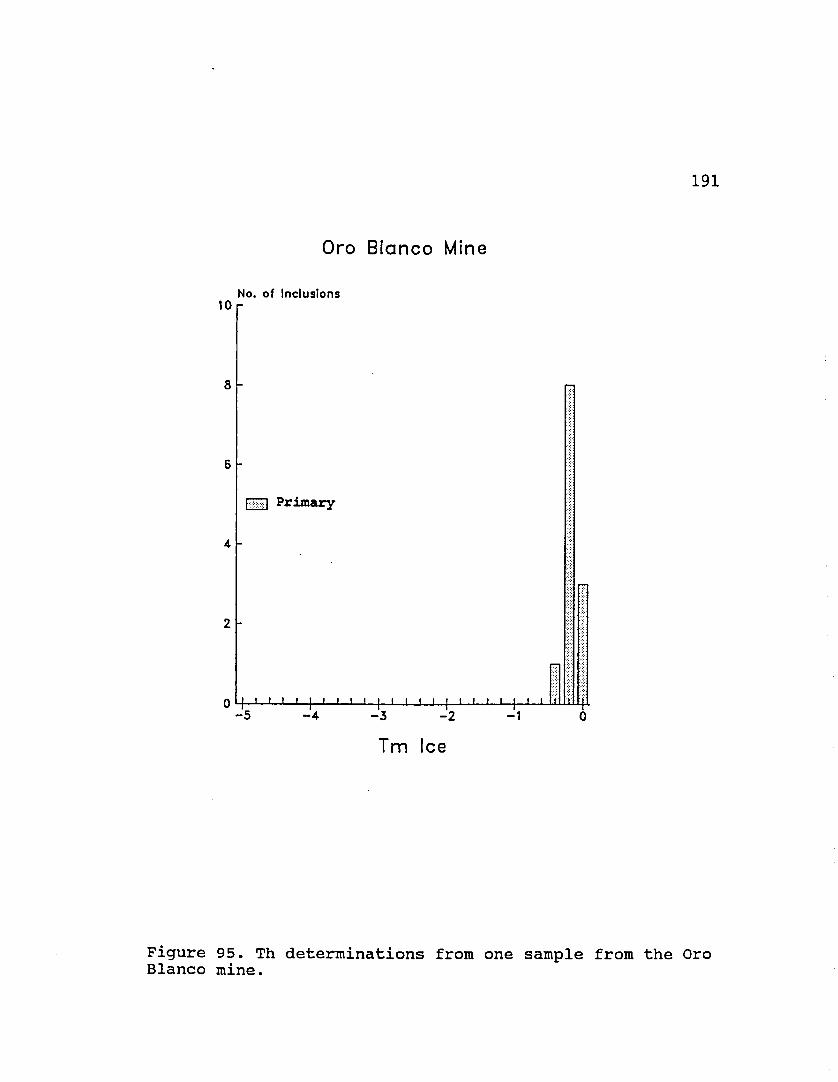
191
Oro Blanco Mine
No. of Inclusions
Primary
Tm Ice
Figure 95. Th determinations from one sample from the OroBlanco mine.

192
Oro Blanco Mine
No. of Inclusions
- Imrt Primary
i- i l i 11.1 i i i i i i i i i ; i i i i i i i i i
Figure 96. Tm ice determinations from one sample fromthe Oro Blanco mine.

Oro Blanco Mine
Tm Ice
150 175 200 225 275 300 375 400
ThAll Inclusions are primary.
Figure 97. Tm ice versus Th determinations on fluidinclusions from the Oro Blanco mine.

194cooling of a constant-salinity fluid. At the Old Glory mine, inclusions in the barren quartz homogenized at a slightly lower average temperature than the mineralized quartz. Unfortunately no salinity data were collected from the barren quartz material.
The fluid inclusion Th and Tm ice from the Oro Blanco breccia vein have a distinct distribution. This data defines the lowest average and modal Th and Tm ice among primary inclusions. This data is located at the low temperature end of the Montana, Idaho, and Warsaw mine trend, and overlaps only with the data from the Idaho mine that is suspected of having undergone leakage or of being secondary in origin.

Chapter 6 Discussion
195
The structural orientation of the ore bodies, fluid inclusion characteristics, geochemical signatures, along with cross cutting relationships were used to delineate and characterize four distinct centers of mineralization. At each mineralized center, a general trend from high base metal inward to higher precious metals outward is noted. This trend is strongest in the quartz-sulfide veins and most subtle within the breccia veins. While the general trends are found in each style, each center has a unique geochemical signature. In all mineralization styles, however, host rock chemistry plays a primary role in the zoning of manganese.
A restricted period of deposition is suggested by the relationships between the veins and the Mid-Tertiary dikes. Sidewinder Quartz Monzonite dikes intrude the qurtz-sulfide veins and the silicified zones and provide a minimum age. The close association between these dikes these veins and indicate general contemporaneity at about 24 Ma. The breccia veins are seen to cut the rhyolite dikes (24 to 26 Ma.) and are locally hosted in the Montana Peak Formation, indicating a younger age. The breccia veins and the

rhyolite dike swarm are both hosted in late NW-striking, steeply dipping structures suggesting possible contemporaneity.
General Contemporaneity is also suggested by the overlap in the ranges of metal ratios. The silicified zones fall within the ranges of the proximal and distal quartz-sulfide veins with respect to most of the ratios tested. The breccia veins have ranges in ratios similar to the distal quartz-sulfide veins and to a lesser extent the proximal veins.
Fluid inclusion data collected at the main producers including the Montana Idaho and Warsaw mines suggests that cooling and dilution occurred simultaneously. The fluid inclusion data permit that a mineralizing fluid similar to that which produced the Montana mine cooled without dilution to produce the fluid at the St. Christopher mine. Inclusion data from the silicified zones indicates that a solution cooled without dilution between the Margarita and Old Glory mine.
The fluid inclusion data indicates that ore generating fluids evolved by dilution with meteoric water to form the Montana and Idaho system in the north, and the Warsaw system in the south. A pulse of this fluid then intruded along the NW-trending fault and cooled without dilution to
196

197produce the fluid tested at the St. Christopher mine. The silicified zones may represent a similar pulse of fluid that evolved to precipitate largely barren and then ore bearing quartz.
The fluid inclusion data from the breccia veins indicate that mineralization was associated with dilute, low-temperature fluids typical of the epithermal environment.
Structurally there is little overlap in mineralization styles. The silicified zones do however have a similar general strike direction to the quartz-sulfide veins and may be seen as a shallow dipping end member.
This study demonstrates that trace element geochemistry and fluid inlusion studies can be used to delineate individual mineralizing episodes within a polymetallic vein district, and to discern elemental zoning within each episode. The information gained can be used to predict the chemistry of veins along structural trends.For example, in the southern portion of the Oro Blanco district veins encountered SW of the Holden mine along the NW-trending fault cam be expected to be base-metal rich, while veins occuring NW of the El Oro mine along the same trend can be expected to be precious-metal rich.
The character of each mineralization style as

determined by techniques in this study, are summarized below.Quartz-Sulfide Veins
The quartz-sulfide veins are located along large NW- trending faults and generally strike NE and have a steep to moderate NW dip. A second population of veins has a NE strike and a near vertical dip.
The geochemical signatures suggest two similar but separate mineralizing centers within the quartz-sulfide veins. The northern system is centered around the Montana and Idaho mines, with proximal mines including the Hilltop, the unnamed vein in Japan Valley, the Rubiana, Brick, and the unnamed vein near the Austerlitz mine. Distal veins associated with this system include four veins along the NW-trending fault including the St. Christopher, the unnamed vein near Skunk Springs, and the Ostrich and Yellowjacket mines. The southern system has a more diffuse center at the Warsaw and Holden mines. This center also has fewer proximal mines, which include the Louise, the N 10 W veins, and the Black Diamond mine. Distal mines in the south include the El Oro and the El Oro Extension.
The two quartz-sulfide centers have similar trends in elemental abundances and ratios. A general increase in zinc is noted at the proximal mines. Among the distal
198

199mines is noted a general decrease in the ratios of base metal to gold, antimony to arsenic, silver to gold, lead to molybdenum and antimony to bismuth. The two centers are distinct in terms of several of the elements tested. The northern center has higher antimony and lower bismuth, tellurium, and molybdenum. The ratios of antimony to bismuth and lead to molybdenum follow parallel but distinct trends, with mines along both systems having lower ratios as well as overall abundances away from the centers. The southern center also has higher average copper to gold ratios.
In terms of the fluid inclusion data, the mines fall into two unique trends. One trend includes the Montana, Idaho, and Warsaw mines. Here fluids form a linear population of points from Th of 270 to about 300 with Tm ice from about -2.5 to -3.5, to Th of about 190 to 250 with Tm ice of less than -0.5 degrees. The inclusions at the lower end of this trend probably were secondary or subjected to leakage. The two samples taken from the Montana mine, together with the sample from the Idaho mine fall along this line and probably represent a single cooling and diluting fluid. Fluid inclusion data from the Warsaw mine also falls along this trend. Because of the distance between these mines and the similar range in

2 0 0
values it is probable that the Warsaw inclusions represent the ascent of similar fluids rather than the lateral transportation of the same fluid.
The data from the St. Christopher mine falls outside this trend. Here the Th shows a range similar to that seen among the low temperature end of the other quartz-sulfide veins. The salinities, however, show a restricted range similar to the high end of the Montana and Warsaw systems. This has been interpreted as the cooling of a fluid without dilution.Silicified Zones
The silicified zones appear to represent a distinct center with metallogenic characteristics similar to the proximal and distal quartz-sulfide systems. A distinct center is evidenced by a unique structural style, by the fact that they do not fit into the elemental zonation along the northern NW-trending fault, and that the fluid inclusion data from the Margarita and Old Glory mines cluster along a distinct trend.
The silicified zones show a restricted structural orientation with a preferred E-W strike and a shallow dip to the north.
The silicified zones exhibit a more subtle zoning pattern than that found among the quartz-sulfide veins.

2 0 1
These zones have a lower overall range in element abundances than the main quartz-sulfide veins but fall within the range of the proximal and distal veins. The zoning consists of relatively higher base metal to gold ratios and higher gold to silver ratios away from the Austerlitz mine. The highest antimony to arsenic, lead to gold, and silver to gold ratios were found at the Austerlitz mine. Also at the Austerlitz mine were the highest average values of lead, zinc, arsenic, bismuth molybdenum, and mercury. The highest gold values were found at the southernmost Old Glory mine.
While data was collected at only two of the mines, fluid inclusion results are consistent with higher temperatures to the north with little variation noted in the Tm ice. The modal temperature of homogenization for the Margarita mine was the highest in the district, with a trend toward lower temperatures and similar salinities towards the Old Glory mine.
Breccia VeinsThe breccia veins represent a third style of
mineralization. They are characterized by a unique structural orientation, they are seen to cut a series of
small quartz-sulfide veins, and they have generally low

2 0 2
tellurium and poorly developed district-scale geochemical zoning.
The breccia veins strike NW and have a near vertical dip. The only crosscutting relationship noted between any of the veins styles are breccia veins which cut the N 10 W veins.
Relative to the other mineralization styles, the breccia veins have low silver to gold, base to precious metal, and low tellurium to thallium ratios. The zoning noted among the breccia veins includes high molybdenum at the Grubstake mine. The Oro Fino and Grubstake mines, the two veins on the southwestern margin of this mineralization style, have among the highest lead to gold, copper to gold, and Antimony to arsenic and the lowest lead to molybdenum. The four mines on the NE margin of the breccia vein zone have the lowest average silver to gold values.
Quartz from the Oro Blanco vein contained the lowest homogenization temperatures, and the most dilute solutions found in the district. While the fluid inclusion data fall roughly within the Montana-Warsaw-Idaho trend, cross cutting relationships indicate that the breccia veins are younger than the quartz sulfide vein style of mineralization.
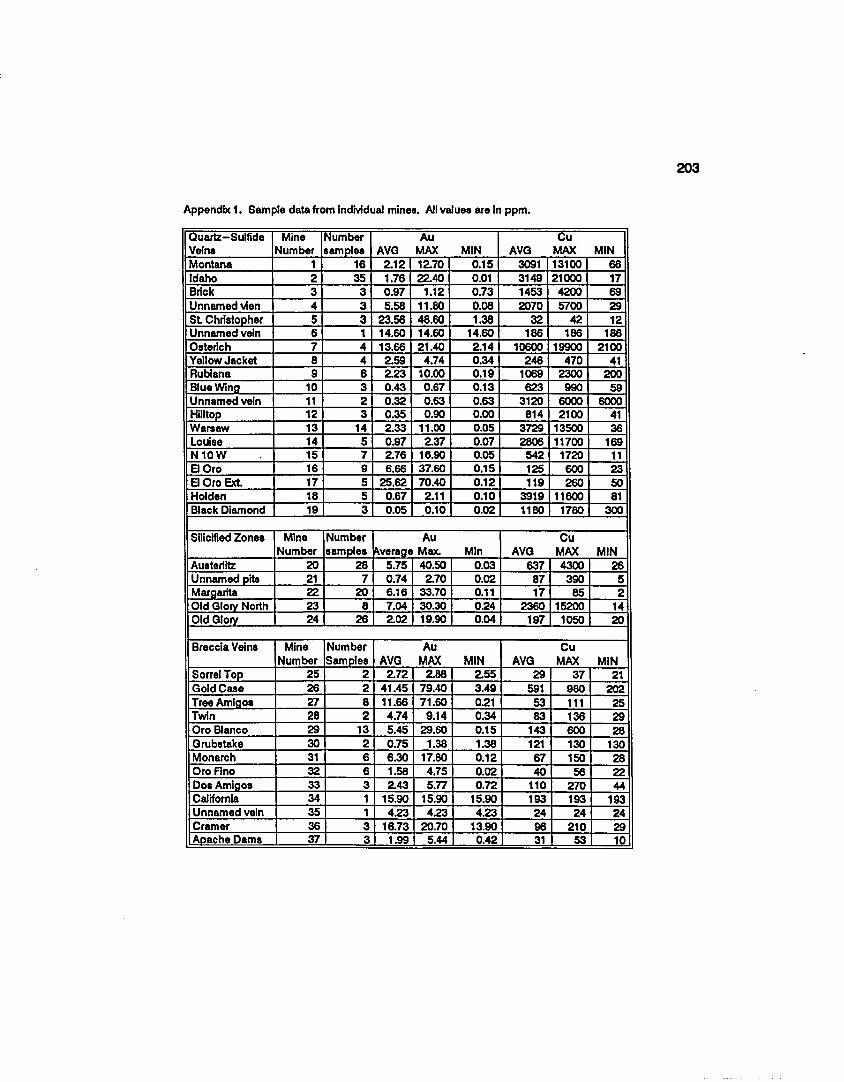
Appendix 1. Sample data from Individual mines. All values are In ppm,
Quartz-SulfideVeins
MineNumber
Numbersamples AVG
AuMAX MIN AVG
CuMAX MIN
Montana 1 16 2.12 12.70 0.15 3091 13100 66Idaho 2 35 1.76 22.40 0.01 3149 21000 17Brick 3 3 0.97 1.12 0.73 1453 4200 69Unnamed vien 4 3 5.58 11.80 0.08 2070 5700 29St Christopher 5 3 23.56 48.60 1.38 32 42 12Unnamed vein 6 1 14.60 14.60 14.60 186 186 186Osterich 7 4 13.66 21.40 2.14 10600 19900 2100Yellow Jacket 8 4 2.59 4.74 0.34 246 470 41Rubiana 9 6 223 10.00 0.19 1069 2300 200Blue Wing 10 3 0.43 0.67 0.13 623 990 59Unnamed vein 11 2 0.32 0.63 0.63 3120 6000 6000Hilltop 12 3 0.35 0.90 0.00 814 2100 41Warsaw 13 14 2.33 11.00 0.05 3729 13500 36Louise 14 5 0.97 2.37 0.07 2806 11700 169N 10 W 15 7 2.76 16.90 0.05 542 1720 11BOro 16 9 6.66 37.60 0.15 125 600 23BOroExt 17 5 25.62 70.40 0.12 119 260 50Holden 18 5 0.67 2.11 0.10 3919 11600 81Black Diamond 19 3 0.05 0.10 0.02 1180 1780 300
Siiicified Zones Mine Number Au CuNumber samples Average Max. Min AVG MAX MIN
Austeriitz 20 28 5.75 40.50 0.03 637 4300 26Unnamed pits 21 7 0.74 2.70 0.02 87 390 5Margarita 22 20 6.16 33.70 0.11 17 85 2Old Glory North 23 8 7.04 30.30 0.24 2360 15200 14Old Glory 24 26 2.02 19.90 0.04 197 1050 20
Breccia Veins Mine Number Au CuNumber Samples AVG MAX MIN AVG MAX MIN
Sorrel Top 25 2 2.72 2.88 2.55 29 37 21Gold Case 26 2 41.45 79.40 3.49 591 980 202Tree Amigos 27 8 11.66 71.60 021 53 111 25Twin 28 2 4.74 9.14 0.34 83 136 29Oro Blanco 29 13 5.45 29.60 0.15 143 600 28Grubstake 30 2 0.75 1.38 1.38 121 130 130Monarch 31 6 6.30 17.80 0.12 67 150 28Oro Fino 32 6 1.58 4.75 0.02 40 56 22Dos Amigos 33 3 2.43 5.77 0.72 110 270 44California 34 1 15.90 15.90 15.90 193 193 193Unnamed vein 35 1 4.23 4.23 4.23 24 24 24Cramer 36 3 16.73 20.70 13.90 96 210 29Apache Dams 37 3 1.99 5.44 0.42 31 53 10

204
Appendix 1. (Continued) Sample data from Individual mines. All values are In ppm.
Quartz-SulfideVeins
MineNumber AVG
MoMAX MIN AVG
PbMAX MIN AVG
ZnMAX MIN
Montana 1 10 25 2 3753 10700 270 1050 2000 400Idaho 2 54 250 2 20103 103000 33 4965 65000 290Brick 3 58 160 0.5 10685 69300 350 2395 12200 81Unnamed v$en 5 23 40 1 7500 10200 3100 5333 8950 250St Christopher 4 94 260 2 16174 45000 121 126.7 225 47Unnamed vein 6 120 385 14 18820 106000 1010 783.9 2000 60Osterich 7 138 190 94 15563 33700 1790 8280 20000 390Yellow Jacket 8 78 110 20 15233 39000 2200 29467 72000 3800Rubiana 9 82 105 44 18721 45400 4600 7222 20100 320Blue Wing 10 55 190 0.5 10039 23300 2100 6637 20800 790Unnamed vein 11 8 11 11 1103 1855 1855 267.5 295 295Hilltop 12 9 9 9 660 660 660 101 101 101Warsaw 13 37 53 18 106067 240000 3200 443.3 590 350Louise 14 238 530 2 3714 5680 1690 197.8 460 100N 10 W 15 49 170 0.5 16119 63200 47 2630 20600 32BOro 16 29 64 7 469 2200 82 99.67 330 21BOroExt 17 48 140 4 632 1110 108 58 105 26Holden 18 4 12 0.5 39 56 20 96.5 123 62Black Diamond 19 12 20 3 119 135 91 43 56 25
Silicified Zones Mine Mo Pb ZnNumber AVG MAX MIN AVG MAX MIN AVG MAX MIN
Austerlitz 20 84 290 3 1273 2800 114 170.4 580 15Unnamed pits 21 14 78 1 348 2000 41 32 124 4Margarita 22 22 66 0.5 266 1190 15 402 107 6Old Glory North 23 30 43 8 598 1200 75 26.75 79 7Old Glory 24 70 104 33 312 1000 31 15.57 44 5
Breccia Veins Mine Mo Pb ZnNumber AVG MAX MIN AVG MAX MIN AVG MAX MIN
Sorrel Top 25 2 2 1 226 290 161 143.5 186 101Gold Case 26 141 280 260 716 1320 1320 545 640 640Tree Amigos 27 4 7 1 2090 3300 880 1355 2000 710Twin 28 5 6 2 489 1300 118 373.8 910 192Oro Blanco 29 1 3 0.5 299 630 88 359.7 800 110Grubstake 30 2 6 0.5 271 600 71 268.8 460 126Monarch 31 5 5 5 890 890 890 450 450 450Oro Fino 32 2 2 2 105 105 105 109 109 109Dos Amigos 33 1 2 0.5 350 380 320 359.5 560 159California 34 7 10 2 156 350 41 165.5 210 53Unnamed pits 35 6 22 2 184 610 29 108 159 37Cramer 36 6 23 0.5 426 1230 30 3552 630 155Apache Dams 37 6 15 1 1443 2800 630 1560 1790 1260

205
Appendix 1. (continued) Sample data from individual mines. All values are In ppm.
Quartz-SulfideVein#
MineNumber AVG
AgMAX MIN AVG
MnMAX MIN AVG
A#MAX MIN
Montana 1 151 609 3 2030 21700 56 9 68 1Idaho 2 141 736 0 736 4000 44 57 510 2Brick 3 240 464 51 5413 11000 1140 21 58 2Unnamed vien 5 126 216 3 1853 4500 430 2 4 1St Christopher 4 31 88 1 207 480 65 12 18 3Unnamed vein 6 12 12 12 29 29 29 8 8 8Oaterich 7 81 146 54 80 106 64 5 8 1Yellow Jacket 8 2 5 0 736 2200 92 5 13 1Rublana 9 241 747 52 457 840 102 2 4 1Blue Wing 10 224 498 3 107 130 92 2 2 2Unnamed vein 11 89 155 155 1018 1410 625 2 3 3Hilltop 12 15 31 6 466 960 59 7 11 3Warsaw 13 317 1951 9 662 2900 27 16 88 1Louise 14 74 224 12 1193 4400 116 7 18 1N 10W 15 76 298 4 1501 5200 118 5 12 1BOro 16 13 35 1 204 550 63 17 32 4BOroExt 17 17 45 2 60 71 36 17 39 4Holden 18 252 584 38 74 137 47 10 21 2Black Diamond 19 14 22 8 2259 5050 136 3 6 1
SilicHied Zones Mine Ay Mn A#Number AVG MAX MIN AVG MAX MIN AVG MAX MIN
Austeriitz 20 66 190 2 289 1830 33 13 61 1Unnamed pits 21 21 42 2 38 65 23 17 76 5Margarita 22 9 44 0 127 650 15 3 7 1Old Glory North 23 70 290 6 58 110 19 6 11 2Old Glory 24 24 124 3 137 1170 13 8 31 1
Breccia Veins Mine Ag Mn A#Number AVG MAX MIN AVG MAX MIN AVG MAX MIN
Sorrel Top 25 46 57 35 489 870 107 4 4 4Gold Case 26 76 142 10 9715 17400 2030 6 8 3Tree Amigos 27 81 446 10 1330 3100 400 4 6 2Twin 28 108 207 6 676 1200 151 6 8 3Oro Blanco 29 20 79 4 647 2000 114 9 41 2Grubstake 30 9 11 11 119 134 134 3 4 4Monarch 31 260 729 1 6196 17600 1120 6 20 1Oro Fino 32 19 60 2 405 760 106 5 6 2Dos Amigos 33 212 639 17 5888 19100 1260 6 9 3California 34 298 298 298 750 750 750 11 11 11Unnamed pits 35 8 8 8 128 128 128 6 6 6Cramer 36 387 647 189 2767 5900 1080 6 11 3Apache Dams 37 36 93 4 878 2000 210 7 10 2

206Appendix 1. (Continued) Sample data from individual mines. AH values are in ppm.
Qumtiz—SulfideVein#
MineNumber
SbAVQ MAX MIN
HgAVG MAX MIN
TeAVG MAX MIN
Montana 1 143 1770 0.5 2.11 12.00 0.08 0 .6 7.2 0.1Idaho 2 1028 10900 0.5 1.67 10.60 0.14 0.1 0.4 0.1Brick 3 1.7 4 0.5 0.60 0 .8 8 0.43 0.1 0.1 0.1Unnamed vien 5 16.2 36 0.5 1.03 26 6 0.16 0 2 0.4 0.1St Christopher 4 5.5 14 0.5 8.26 24.20 0.27 2.3 6 .0 0.1Unnamed vein 6 0.5 0.5 0.5 0.13 0.13 0.13 0.4 0.4 0.4Osterlch 7 0.5 0.5 0.5 0.12 0.16 0.08 0.3 0 .6 0.1I1
8 0.5 0.5 0.5 0.07 0.09 0.04 0.1 0.1 0.1MUMana 9 0 .8 2 0.5 0.57 1.04 0.18 0.1 02 0.1Blue Wing 10 4.2 10 0.5 0.26 0.35 0.09 0.1 0.2 0.1Unnamed vein 11 10.8 21 21.0 0.12 0.17 0.17 0.1 0.1 0.1HMItop 12 Z2 4 0.5 0.27 0.57 0.09 0.1 0.2 0.1Warsaw 13 6.5 75 0.5 0.21 0.85 0.04 2.3 7.3 0.1Louise 14 0 .8 2 0.5 0.33 0.91 0.12 1.4 3.5 0.1N 10 W 15 19.0 115 0.5 0.14 0.33 0.03 0.6 2.1 0.1B Oro 16 0.5 0.5 0.5 0.23 1.62 0.01 0.8 2.1 0.1B Oro Ext 17 0.5 0.5 0.5 0.12 0.21 0.01 4.2 10.2 1.0Holden 18 30.8 141 20 0.19 0.37 0.09 4.6 9 .4 1.0Black Diamond 19 1.5 3 0.5 0.13 0.18 0.09 0.2 0.4 0.1SilicHied Zones Mine
NumberSb
avg max m inHg
AVG MAX MINTe
AVG MAY MIMAusterlitz 20 2 .2 15 0.5 0.33 1.17 0.06 0.9 72 0.1Unnamed pits 21 0.5 0.5 0.5 0.06 0.15 0.03 3.7 15.8 0 .6Margarita 2 2 0.5 0.5 0.5 0.06 0.14 0.02 02 0.9 0.1Old Glory N. 23 0.9 2 0.5 0.13 0.32 0.05 0 .6 12 0.1Old Glory 24 1.9 26 0.5 0.07 02? 0.02 0.9 5.9 0.1
Breccia Veins MineNumber
SbAVG MAX MIN
HgAVG MAX MIN
TeAVG MAX MINSorrel Top 25 0.5 0.5 0.5 0.12 0.14 0.10 0.1 0.1 0.111
26 0.5 0.5 0.5 0.11 0.11 0.10 0.1 0.1 0.1Tres Amigos 27 0.7 2 0.5 0.21 0.59 0.01 0.1 0.1 0.1Twin 28 1.3 2 0.5 0.11 0.13 0.09 02 0.3 0.1Oro Blanco 29 0 .8 3 0.5 0.26 0.60 0.03 0.1 0.3 0.1Grubstake 30 1.3 2 20 0.39 0.65 0.65 0.1 0.1 0.1Monarch 31 0.5 0.5 0.5 0.63 28 3 0.08 0.1 0.1 0.1Oro Fino 32 1.0 2 0.5 0.14 0.29 0.05 0.1 0.3 0.1Dos Amigos 33 0.5 0.5 0.5 1.04 3.67 0.13 0.1 0.1 0.1California 34 0.5 0.5 0.5 0.34 0.34 0.34 0.1 0.1 0.1Unnamed pits 35 0.5 0.5 0.5 0.13 0.13 0.13 0.1 0.1 0.1Cramer 36 2 .2 4 0.5 0.14 0.18 0.08 0.1 0.1 0.1Apache Dams 37 0.5 0.5 0.5 1.02 2.22 0.02 0.1 0.1 0.1

207Appendix 1. (Continued) Sample data from individual mines. All values are In ppm.
Quartz-SulfideVein#
MineNumber
f iAVQ MAX MIN
wAVQ MAX MIN
BlAVQ MAX MIN
Montana 1 02 0.6 0.1 1.0 5.0 0.5 8.8 113.0 0.1Idaho 2 0.5 1.0 0.1 0.6 2.0 0.5 3.6 20.9 0.1Brick 3 0.4 0.7 0.1 1.0 1.0 1.0 3.3 9.4 02i$i5|i 5 02 0.4 0.1 1.5 2.0 0.5 3.5 6.3 0.8St Christopher 4 0.3 0.8 0.1 2.0 3.0 1.0 6.5 13.7 02Unnamed vein 6 0.1 0.1 0.1 0.5 0.5 0.5 0.9 0.9 0.9Osterlch 7 0.5 1.0 0.1 0.5 0.5 0.5 124.6 242.0 10.4Yellow Jacket 8 1.4 1.8 0.8 2.5 4.0 1.0 3.3 5.6 02Rubiana 9 0.8 1.1 0.5 1.7 4.0 0.5 12.0 52.0 1.0Blue Winn 10 0.6 1.1 0.3 0.5 0.5 0.5 2.5 4.9 0.7Unnamed vein 11 0.4 0.5 0.5 1.3 2.0 2.0 0.8 1.2 1.2Hilltop 12 0.3 0.4 02 0.7 1.0 0.5 6.7 12.7 1.7Warsaw 13 0.4 2.8 0.1 2.1 10.0 0.5 277.5 795.0 0.8Louise 14 0.6 0.8 0.4 42 10.0 2.0 119.2 374.0 13.2N 10 W 15 1.0 2.0 0.1 3.9 15.0 1.0 1.8 4.8 0.3QOro 16 0.7 1.5 0.1 4.6 13.0 0.5 14.4 28.6 1.9BOroExt 17 0.5 0.9 0.1 42 8.0 2.0 76.3 160.0 4.1Holden 18 0.2 0.4 0.1 0.8 2.0 0.5 326.3 920.0 2.4Black Diamond 19 0.7 1.3 0.3 0.5 0.5 0.5 0.5 1.3 0.1
Silicified Zones MineNumber
TlAVQ MAX MIN
wAVQ MAX MIN
BlAVQ MAX MIN
Austerlitz 20 0.4 1.0 0.1 2.4 9.0 0.5 92.1 720.0 0.9Unnamed pits 21 0.4 0.9 0.1 0.7 1.0 0.5 32.6 111.0 3.0Marqarita 22 0.8 2.3 0.1 4.3 13.0 0.5 6.7 26.4 0.6Old Glory North 23 02 0.5 0.1 0.9 3.0 0.5 44.8 158.0 3.8Old Glory 24 0.4 1.3 0.1 1.3 10.0 0.5 33.7 254.0 0.6
Breccia Veins MineNumber
TlAVQ MAX MIN
wAVQ MAX MIN
BlAVG MAX MIN
Sorrel Top 25 1.8 2.0 1.6 0.8 1.0 0.5 0.3 0.3 02Gold Case 26 3.3 4.7 1.8 0.5 0.5 0.5 0.6 1.0 02Tree Aminos 27 2.6 4.0 2.0 0.9 2.0 0.5 0.3 0.8 0.1Twin 28 2.4 3.1 1.6 22.3 44.0 0.5 0.4 0.4 0.4Oro Blanco 29 2.4 4.1 0.9 0.7 1.0 0.5 1.7 15.1 0.1Grubstake 30 22 2.3 2.3 1.0 1.0 1.0 0.6 1.0 1.0Monarch 1 31 2.3 2.8 , 1.8 1.3 2.0 1.0 0.3 0.7 0.1Oro Fino 32 1.1 1.6 02 1.0 2.0 0.5 0.1 0.2 0.1Dos Aminos 33 1.1 1.5 0.5 0.9 1.0 0.5 0.9 2.8 02California 34 1.6 1.6 1.6 0.5 0.5 0.5 0.8 0.8 0.8Unnamed pits 35 1.9 1.9 1.9 2.0 2.0 2.0 1.7 1.7 1.7Cramer 36 1.4 1.8 12 0.7 1.0 0.5 0.2 0.3 0.1Apache Dams 37 1.4 1.7 1.0 0.6 1.0 0.5 0.1 0.1 0.1

Appendix 2. Averages of sample ratios from Individual mines.*
Quartz-SulfideVeins
MineNumber
Ag/Au Cu/Au Pb/Au Pb/Cu Pb/Mo Sb/As Sb/Mo
Montana 1 213.75 5665 20380 9.24 993 7.33 16.49Idaho 2 290.40 8694 44661 10.66 2178 8.59 268.08Brick 3 225.14 1977 5083 3.26 220 0.19 0.19Unnamed vein 4 32.12 528 25588 207.83 2194 5.17 0.34St Christopher 5 0.88 4 393 396.20 138 0.36 0.14Unnamed vein 6 0.79 13 45 3.55 73 0.06 0.06Ostrich 7 10.90 848 16 0.02 18 020 0.08Yellowjacket 8 2.84 456 53 025 43 0.30 0.57Rubiana 9 194.52 1726 17691 14.72 8093 0.69 022Blue Wing 10 431.26 1203 19567 24.76 1228 2.08 0.27Unnamed vein 11 1003.79 230960 14934 3.89 201 3.75 2.12Hilltop 12 966.11 8261 390851 29.08 671 0.53 0.07Warsaw 13 486.38 16178 15212 7.18 467 1.94 0.99Louise 14 199.32 2129 33824 18.86 233 0.18 0.01N 10 W 15 62.86 1980 25185 40.99 111 2.12 0.09B Oro 16 3225 171 347 4.38 28 0.05 0.03B Oro Ext 17 10.36 97 494 7.16 29 0.05 0.04Holden 18 828.71 26633 12807 10.59 183 4.43 026Black Diamond 19 513.96 52578 640317 10.86 94 1.36 0.01
Silicified Zones MineNumber
Ag/Au Cu/Au Pb/Au Pb/Cu Pb/Mo Sb/As Sb/Mo
Austerlitz 20 107.95 716 4365 6.01 37 0.62 0.06Unnamed vein 21 56.06 244 1103 622 4 0.07 0.01Margarita 22 5.70 21 305 23.46 26 026 0.18Old Glory North 23 15.38 270 295 525 25 025 0.03Old Glory 24 34.99 715 1219 3.04 55 029 0.31
Breccia Veins MineNumber
Ag/Au Cu/Au Pb/Au Pb/Cu Pb/Mo Sb/As Sb/Mo
Sorrel Top 25 16.65 11 85 7.75 153 0.13 0.38Gold Case 26 2.34 7 147 3.86 676 0.11 029Tree Amigos 27 26.96 51 116 523 334 0.16 0.94Twin 28 23.71 51 585 7.73 415 0.36 2.13Oro Banco 29 9.84 86 149 3.40 410 0.15 1.14Grubstake 30 32.01 615 974 6.38 30 0.56 0.50Monarch 31 36.06 50 111 5.19 270 0.18 0.68Oro Fino 32 28.65 467 1322 4.30 32 0.30 024Dos Amigos 33 59.48 59 189 4.32 116 0.10 0.14Unnamed vein 34 18.74 12 56 4.61 178 0.05 0.10Unnamed vein 35 1.99 6 25 4.38 53 0.08 025Cramer 36 26.08 7 96 15.85 243 0.43 0.47Apache Dams 37 24.11 27 136 5.77 33 0.11 0.11
* Differences occur between these values and those calculated directly from Appendix 1. This is due to differences in calculation methods. Values in Appendix 2 were calculated by taking the metal ratio of each sample and then averaging all samples taken at each mine. This method reduces the effect of erratic data points.

Appendix 2. (Continued) Averages of sample ratios from Individual mines.
Quartz-SulfideVeins
MineNumber
Sb/Bi Sb/Au Pb/Ag Pb/Zn Zn/Sb Zn/Au Te/n
Montana 1 660.24 40.65 258 6264 269 3021 5.44Idaho 2 252.90 2121.76 229 838 228 23479 0.36Brick 3 1.81 214 71 155 933 1266 0.46Unnamed vein 4 3.33 3.98 971 33567 275 1707 1.08St Christopher 5 1.29 025 435 922 55 15 22.71Unnamed vein 6 0.56 0.03 57 83 202 7 4.00Ostrich 7 0.02 0.08 2 50 86 5 1.53Yellowiacket 8 0.73 0.65 31 19 193 96 0.08Rubiana 9 0.42 1.20 101 7126 10348 8954 0.16Blue Wing 10 1.25 9.06 338 3750 1885 9722 026Unnamed vein 11 35.21 35.90 14 484 247 9465 0.35Hilltop 12 0.32 89.17 703 4574 10633 687333 0.47Warsaw 13 6.74 4.99 56 1220 4424 11405 18.15Louise 14 0.02 227 315 4511 14348 45711 2.52N 10 W 15 36.47 21.15 304 2436 247 2960 3.27B Oro 16 0.09 126 83 33 199 213 3.48BOroExt 17 0.04 0.90 45 50 116 54 3022Holden 18 11.76 24.55 37 545 58 987 41.15Black Diamond 19 13.46 58.17 928 15066 3966 332066 0.40
SMicMed Zones MineNumber
Sb/Bi Sb/Au Pb/Ag Pb/Zn Zn/Sb Zn/Au Te/nAusterlHz 20 0.16 5.71 63 261 197 1290 3.74Unnamed vein 21 0.04 6.34 24 31 31 129 8.75Margarita 22 0.19 0.67 63 155 80 47 0.36Old Glory North 23 0.09 0.54 16 154 34 18 3.43Old Glory 24 0.19 3.03 36 68 53 191 5.92
Breccia Veins MineNumber
Sb/Bi Sb/Au Pb/Ag Pb/Zn Zn/Sb Zn/Au Te/nSorrel Top 25 208 0.18 6 56 287 54 0.06Gold Case 26 1.50 0.07 55 353 2710 114 0.04Tree Amigos 27 4.42 0.46 6 69 509 183 0.04Twin 28 3.13 0.86 24 77 600 845 0.08Oro Blanco 29 4.68 0.57 26 62 604 216 0.06Grubstake 30 5.25 9.03 67 193 610 2995 0.05Monarch 31 3.11 0.78 7 83 710 766 0.05Oro Fino 32 9.17 8.91 75 68 142 1264 0.19Dos Amigos 33 1.40 0.42 4 79 748 193 0.11Unnamed vein 34 0.63 0.03 3 81 900 28 0.06Unnamed vein 35 0.29 0.12 13 18 218 26 0.05Cramer 36 16.67 0.16 4 240 651 97 0.07Apache Dams 37 5.00 0.60 7 24 331 157 0.08

2 1 0
ReferencesFowler, G.M., 1938, In Some Arizona Ore Deposits,University of Arizona, Arizona Bureau of Mines, Geological series no. 12, Bulletin 145.Fowler, G.M., 1951, In Arizona Zinc and Lead Deposits, University of Arizona, Arizona Bureau of Mines, Geologic series no. 19, Bulletin 158.Haxel, G.B., May, D.J., Wright, J.E., and Tosdal, R.M,1980, Reconnaissance Geologic Map of the Baboquivari Peak Quadrangle, Arizona: United States Geological Survey Miscellaneous Filed Studies Map MF-1251, scale 1:62,500.Keith, S.B., Gest, D.E., DeWitt, E., Toll, N.W., Everson, B.A., 1983, Metallic Mineral Districts and Production in Arizona, Arizona Bureau of Geology and Mineral Technology, Bulletin 194.Knight, L.H. Jr., 1970, Structure and Mineralization of the Oro Blanco Mining District, Santa Cruz County, Arizona, Unpublished Dissertation, University of Arizona, 172 p.Mineral Resources Data System (MRDS), 1990-91, U.S. Geological Survey, BORA (computer database). [Available from USGS, Branch of Resources Analysis, MS 920. 12201 Sunrise Valley Drive, Reston, VA 22092]Nelson, F.J., 1963, The Geology of the Pena Blanca and Walker Canyon Areas, Santa Cruz County, Arizona,Unpublished M.S. Thesis, University of Arizona.Riggs, N.R., 1985, Stratigraphy, Structure, and mineralization of the Pajarito Mountains, Santa Cruz County, Arizona, Unpublished M.S. Thesis, University of Arizona.
Riggs, N.R., 1987, Stratigraphy, Structure and Geochemistry of Mesozoic Rocks in the Pajarito Mountains, Santa Cruz County, Arizona, in Dickinson, W.R., and Klute, M.A., Mesozoic Rocks of Southern Arizona and Adjacent Areas, Arizona Geological Society Digest, Vol. 18, p. 165-175.

2 1 1
References (continued)
Riggs, N.R., and Haxel, G.B., 1990, The Early to Middle Jurassic Magmatic Arc in Southern Arizona: Plutons to Sand Dunes, in Arizona Geological Survey Special Paper 7: Geologic Excursions Through the Sonoran Desert Region, Arizona and Sonora, Gehrels, G.E., and Spencer J.E., eds., p. 90-103.Roedder, E., 1984, Reviews in Mineralogy Volume 12: Fluid Inclusions, 646 p.Seamen, S.J., and Foss, D., 1990, Tertiary Silicic Volcanicsuccessions of the Atascosa and Tumacoccori
Southern Arizona, in Abstracts with Programs, 86th Annual Meeting, Cordilleran Section, Geological Society of America.Tenney,Arizona, 1929, Unpublished report. History of Mining in Arizona Bureau of Mines.Tosdale, R.M., Haxel, G.B., and Wright, J.E., Jurassic Geology of the Sonoran Desert Region, Southern Arizona, Southeastern California, and Northernmost Sonora: Construction of a Continental-Margin Magmatic Arc, in Jenny, J.P., and Reynolds, S.J., eds., Geological Evolution of Arizona, Arizona Geological Society Digest, volume 17. p. 395-434.
Webb, B.P., and Coryell, K.C., 1954, Preliminary mapping in the Ruby Quadrangle, Arizona, USAEC, RME-2009.Wilson, E.D., Cunningham, J.B., and Butler, G.M., Arizona Lode Gold Mines and Gold Mining, University of Arizona, Arizona Bureau of Mines Bulletin 137.Warren, H.V., and Loofbourow, R.W., 1932, The Occurrence and Distribution of Precious Metals in the Montana and Idaho Mines, Ruby, Arizona, Economic Geology v. 27 p. 578- 585.

2 36283 MAIN: TH158U/A 11/23/95 5015

?-----


![Indigenous Enhanced Mineralization Pyrene, Benzo[a]pyrene ...Indigenous soil microorganism mineralization experiments. All of the mineralization experiments were performed by using](https://img.dokumen.tips/doc/110x75/5e7c41b0b7c4ef64181e5e16/indigenous-enhanced-mineralization-pyrene-benzoapyrene-indigenous-soil-microorganism.jpg)