Embed Size (px)
Citation preview
Groundwater Resources Program
A Comparison of Consumptive-Use Estimates Derived from the Simplified Surface Energy Balance Approach and Indirect Reporting Methods
U.S. Department of the InteriorU.S. Geological Survey
Scientific Investigations Report 2012–5005


A Comparison of Consumptive-Use Estimates Derived from the Simplified Surface Energy Balance Approach and Indirect Reporting Methods
By Molly A. Maupin, Gabriel B. Senay, Joan F. Kenny, and Mark E. Savoca
Groundwater Resources Program
Scientific Investigations Report 2012–5005
U.S. Department of the InteriorU.S. Geological Survey

U.S. Department of the InteriorKEN SALAZAR, Secretary
U.S. Geological SurveyMarcia K. McNutt, Director
U.S. Geological Survey, Reston, Virginia: 2012
For more information on the USGS—the Federal source for science about the Earth, its natural and living resources, natural hazards, and the environment, visit http://www.usgs.gov or call 1–888–ASK–USGS.
For an overview of USGS information products, including maps, imagery, and publications, visit http://www.usgs.gov/pubprod
To order this and other USGS information products, visit http://store.usgs.gov
Any use of trade, product, or firm names is for descriptive purposes only and does not imply endorsement by the U.S. Government.
Although this report is in the public domain, permission must be secured from the individual copyright owners to reproduce any copyrighted materials contained within this report.
Suggested citation:Maupin, M.A, Senay, G.B., Kenny, J.F., and Savoca, M.E., 2012, A comparison of consumptive-use estimates derived from the simplified surface energy balance approach and indirect reporting methods: U.S. Geological Survey Scientific Investigations Report 2012-5005, 8 p.

iii
Contents
Abstract ...........................................................................................................................................................1Introduction.....................................................................................................................................................1Methods...........................................................................................................................................................3Results .............................................................................................................................................................5Summary..........................................................................................................................................................7References Cited............................................................................................................................................8
Figures Figure 1. Map showing conterminous United States depicted as arid western states and
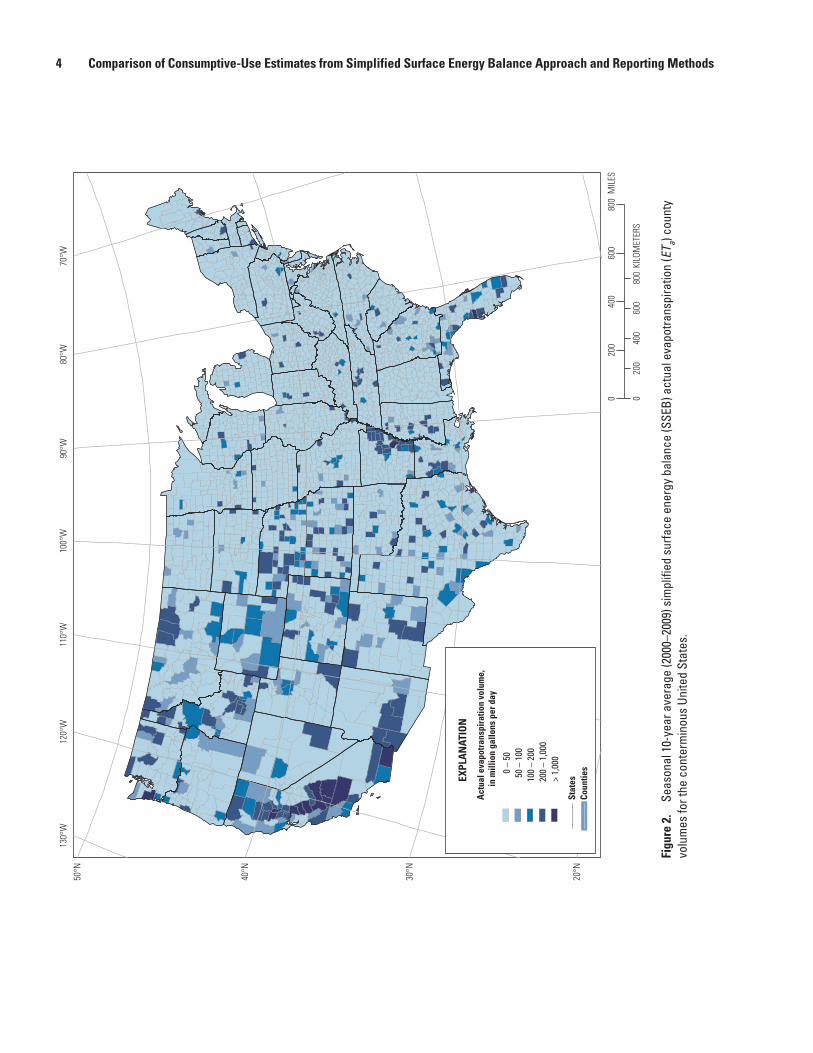
humid eastern states ……………………………………………………………… 2 Figure 2. Map showing seasonal 10-year average (2000–2009) simplified surface energy
balance (SSEB) actual evapotranspiration (ETa) county volumes for the conterminous United States ……………………………………………………… 4
Figure 3. Graph showing relation between Simplified Surface Energy Balance (SSEB) actual evapotranspiration (ETa) and National Water Use Information Program (NWUIP) consumptive use (CU) county data, 1995, in western states …………… 6
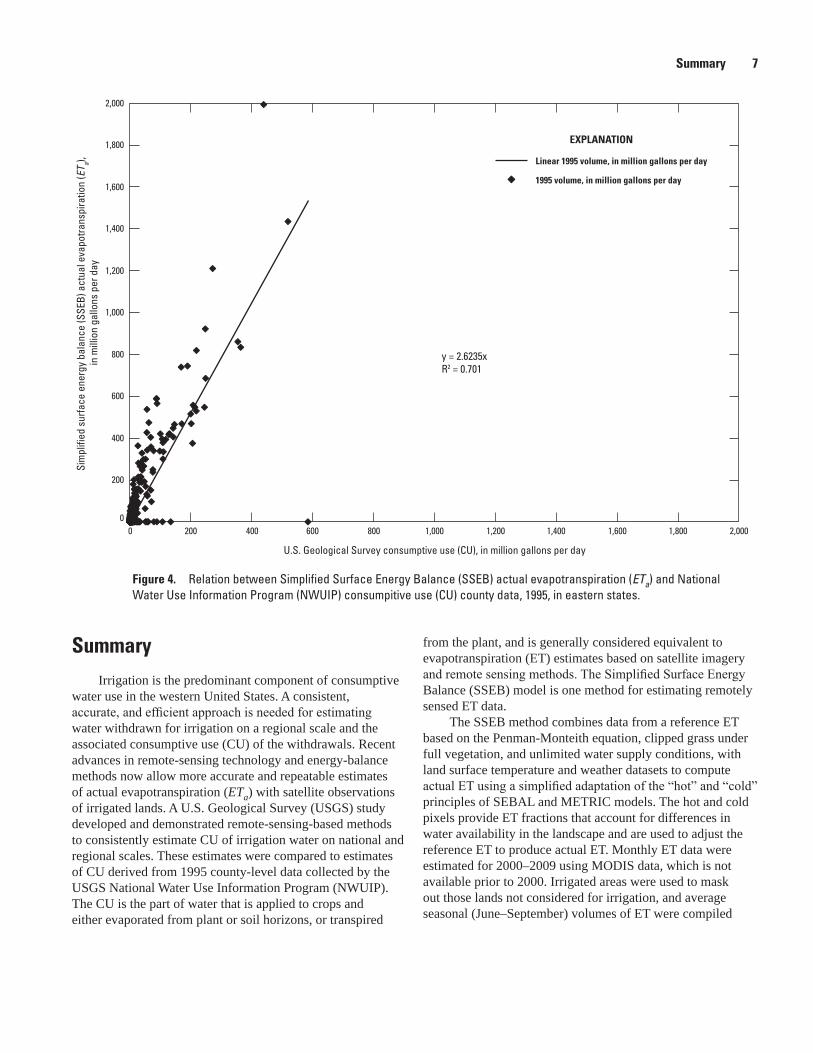
Figure 4. Graph showing relation between Simplified Surface Energy Balance (SSEB) actual evapotranspiration (ETa) and National Water Use Information Program (NWUIP) consumpitive use (CU) county data, 1995, in eastern states …………… 7

iv
Conversion Factors and Abbreviations and Acronyms
Conversion Factors
Inch/Pound to SI
Multiply By To obtain
Area
acre 0.004047 square kilometer (km2)million gallons per acre (Mgal/acre) 935,395 cubic meters per square kilometer (m3/km2)
SI to Inch/Pound
Multiply By To obtain
Length
centimeter (cm) 0.3937 inch (in.)kilometer (km) 0.6214 mile (mi)meter (m) 1.094 yard (yd)
Abbreviations and Acronyms
CU consumptive useET evapotranspirationETa actual evapotranspirationETf evapotranspiration fractionsETo reference evapotranspiration LST land surface temperature MODIS Moderate Resolution Imaging Spectroradiometer NWUIP National Water Use Information Program PRISM Parameter-elevation Regressions on Independent Slopes ModelSSEB Simplified Surface Energy Balance SSEB Simplified Surface Energy Balance USGS U.S. Geological Survey

AbstractRecent advances in remote-sensing technology and
Simplified Surface Energy Balance (SSEB) methods can provide accurate and repeatable estimates of evapotranspiration (ET) when used with satellite observations of irrigated lands. Estimates of ET are generally considered equivalent to consumptive use (CU) because they represent the part of applied irrigation water that is evaporated, transpired, or otherwise not available for immediate reuse. The U.S. Geological Survey compared ET estimates from SSEB methods to CU data collected for 1995 using indirect methods as part of the National Water Use Information Program (NWUIP). Ten-year (2000–2009) average ET estimates from SSEB methods were derived using Moderate Resolution Imaging Spectroradiometer (MODIS) 1-kilometer satellite land surface temperature and gridded weather datasets from the Global Data Assimilation System (GDAS). County-level CU estimates for 1995 were assembled and referenced to 1-kilometer grid cells to synchronize with the SSEB ET estimates. Both datasets were seasonally and spatially weighted to represent the irrigation season (June–September) and those lands that were identified in the county as irrigated. A strong relation (R2 greater than 0.7) was determined between NWUIP CU and SSEB ET data. Regionally, the relation is stronger in arid western states than in humid eastern states, and positive and negative biases are both present at state-level comparisons. SSEB ET estimates can play a major role in monitoring and updating county-based CU estimates by providing a quick and cost-effective method to detect major year-to-year changes at county levels, as well as providing a means to disaggregate county-based ET estimates to sub-county levels. More research is needed to identify the causes for differences in state-based relations.
IntroductionIrrigation is the predominant component of consumptive
water use in the western United States (fig. 1). A consistent, accurate, and efficient approach is needed for estimating on a regional scale the water withdrawn for irrigation and the associated consumptive use (CU) of the withdrawals. Recent advances in remote-sensing technology and energy-balance methods enable more accurate and repeatable estimates of actual evapotranspiration (ETa) with satellite observations of irrigated lands. A U.S. Geological Survey (USGS) study developed and demonstrated remote-sensing-based methods to consistently estimate CU of irrigation water on national and regional scales. This report describes initial results from that study.
The USGS National Water Use Information Program (NWUIP) has estimated water use for irrigation in the United States at 5-year intervals since 1950. Data that have been collected for each state include irrigation withdrawals from groundwater and surface-water sources, acres irrigated, and CU. The USGS NWUIP defines CU for irrigation as that part of applied water that is evaporated, transpired, incorporated into products or crops, or otherwise not available for immediate reuse. It does not include groundwater recharge or water stored in the vadose zone. Estimates of irrigation CU for each state were produced by the NWUIP through 1995, but were discontinued nationally in the 2000 and 2005 compilations. The CU estimates derived from the Simplified Surface Energy Balance (SSEB) model can be compared to previous estimates of CU for 1995 from the NWUIP to estimate the unreported CU for states in 2000 and 2005.
A Comparison of Consumptive-Use Estimates Derived from the Simplified Surface Energy Balance Approach and Indirect Reporting Methods
By Molly A. Maupin, Gabriel B. Senay, Joan F. Kenny, and Mark E. Savoca

2 Comparison of Consumptive-Use Estimates from Simplified Surface Energy Balance Approach and Reporting Methods
Figu
re 1
. Co
nter
min
ous
Unite
d St
ates
dep
icte
d as
arid
wes
tern
sta
tes
and
hum
id e
aste
rn s
tate
s.
tac1
2-07
08_f
ig01
Wes
t
East
Texa
s
Uta
h
Mon
tana
Calif
orni
a
Ari
zona
Idah
o
Nev
ada
Ore
gon
Iow
a
Colo
rado
Kans
as
Wyo
min
g
New
Mex
ico
Illin
ois
Ohi
o
Flor
ida
Mis
sour
i
Min
neso
ta
Neb
rask
a
Geo
rgia
Okl
ahom
a
Ala
bam
a
Was
hing
ton
Ark
ansa
s
Sout
h D
akot
aW
isco
nsin
Nor
th D
akot
a
Virg
inia
Mai
ne
New
Yor
kRh
ode
Isla
nd
Indi
ana
Loui
sian
a
Mic
higa
n
Mis
siss
ippi
Kent
ucky
Tenn
esse
eN
orth
Car
olin
a
Penn
sylv
ania
Sout
h Ca
rolin
a
Wes
tVi
rgin
ia
Mic
higa
nVe
rmon
t
Mar
ylan
d
New
Jer
sey
New
Ham
pshi
re
Mas
sach
uset
ts
Conn
ectic
ut
Del
awar
e
70°W
80°W
90°W
100°
W11
0°W
120°
W13
0°W
50°N
40°N
30°N
20°N
020
040
060
080
0KI
LOM
ETER
S
020
040
060
080
0M
ILES

Methods 3
MethodsThe main modeling principle of the SSEB approach
documented by Senay and others (2007, 2011) is the combined use of reference ET (ETo) and land surface temperature (LST) data to compute ETa, a simplified adaptation of the “hot” and “cold” principles of the SEBAL (Bastiaanssen and others, 1998) and METRIC (Allen and others, 2007) models. The surface energy balance is first solved for a reference-clipped grass condition, assuming full vegetation cover and unlimited water supply, using the standardized Penman-Monteith Equation (Allen and others, 1998). Then, ET fractions (ETf) are calculated from the LST data. ETf account for differences in water availability in the landscape and are used to adjust the ETo based on the land surface and air temperatures of each pixel in the geospatial dataset (eq. 1). Global daily ETo (Senay and others, 2008) is produced at the USGS Earth Resources Observation and Science (EROS) Center from six-hourly weather datasets (radiation, air temperature and pressure, humidity and wind speed) obtained from the Global Data Assimilation System (GDAS) (Kanamitsu, 1989). Additionally, high-resolution (4 km) monthly air temperature data from the Parameter-elevation Regressions on Independent Slopes Model (PRISM, Daly and others, 1993,) were used in combination with the LST to calculate ETf according to equation 1.
ETfdT dTdT dT
dT
h x
h c
h
=−−
whereis difference between Land Surfacce Temperature
Ts and Air Temperature Ta at the hot pi( ) ( ) xxelis difference between Ts and Ta at a given pixel
,dT xx ,,
andis difference between Ts and Ta at the cold pixeldTc
(1)
The main driver for the ETf is the difference between LST and air temperature (Ta) in relation to the same temperature differences at the reference locations (hot and cold). For a given location, a small temperature difference between LST and Ta (eq. 1) indicates high ET (that is, low sensible heat flux) and a high temperature difference indicates low ET (that is, high sensible heat flux).
ETf is calculated for each pixel x by applying equation 1 to each of the 8-day LST grid cells in the Moderate Resolution Imaging Spectroradiometer (MODIS; National Aeronautics and Space Administration, 2011) dataset that was used for this study. MODIS data are at 1 km resolution and provide multi-band infrared spectral data useful for atmospheric, land, and ocean imaging from a single satellite instrument. MODIS has a 10-year period of record of data available; however, this method also can be applied to LSTs obtained from Landsat
or other thermal-infrared datasets from different sensors or resolutions. Landsat data were considered for this work, but they did not provide the frequent temporal coverage necessary to produce monthly ET images for the continental United States due to infrequent (16-day) temporal sampling and images with too much cloud cover. Future studies will jointly employ Landsat and MODIS data to combine the high spatial resolution of Landsat data with the high temporal frequency of MODIS data.
The basic principle that relates instantaneous satellite measurements to daily and weekly ET estimation is the fact that ETf are stable throughout the day (Allen and others, 2005, 2007). By extension, ETf generated from the standard 8-day MODIS LST datasets represent the average ETf for the period. Because the resulting ETf are average representations of the period, the day-to-day variability of ET within an 8-day period is captured by the daily fluctuations of ETo, which are largely driven by the net radiation and aerodynamic forces experienced at a GDAS modeling unit (pixel or grid cell).The basic approach of calculating ETa involves two steps: ETa is a product of the ETf and ETo (eqs. 1 and 2).
ET ET ET
ETET
a f o
a
f
= *
,where
is actual evapotranspirationis fracttion of evapotranspiration andis reference evapotrans
,ETo ppiration for a given location.
(2)
Monthly ET grids were created from the summation of 8-day ETa values for the conterminous United States from January 2000 through December 2009. To compute monthly ET for only those areas with cropland irrigation, an irrigation mask was obtained from EROS (Pervez and Brown, 2010), and county average ET depths (in centimeters) were calculated using only the masked irrigated areas. The NWUIP supplied national CU datasets as annual county data for 1995. No MODIS data are available for dates earlier than 2000. A 10-year average SSEB ETa (2000–2009) dataset was created for each month as an alternative comparative dataset using an approach that disregarded any major climatic differences between 1995 and the 2000–2009 mean, and assumed that seasonal county-average irrigation requirement depths remained about the same. This is true when the objective is to explain the spatial variability (county-to-county) of water use, with the knowledge that any major weather change between any 2 years will tend to affect all the counties in a given state comparably. However, potential irrigated area changes are accounted for by using reported irrigated areas from NWUIP in the same period, rather than the 10-year SSEB ETa method. Thus, total seasonal (June–September) ET depths were converted to volumetric units using county-based irrigated area values provided by the NWUIP dataset for 1995 (fig. 2).
4 Comparison of Consumptive-Use Estimates from Simplified Surface Energy Balance Approach and Reporting Methods
tac1
2-07
08_f
ig02
70°W
80°W
90°W
100°
W11
0°W
120°
W13
0°W
50°N
40°N
30°N
20°N
020
040
060
080
0KI
LOM
ETER
S
020
040
060
080
0M
ILES
EXPL
AN
ATIO
N
Stat
esCo
untie
s
Act
ual e
vapo
tran
spir
atio
n vo
lum
e,
in m
illio
n ga
llons
per
day
0
– 5
0 5
0 –
100
100
– 20
020
0 –
1,00
0>
1,00
0
Figu
re 2
. Se
ason
al 1
0-ye
ar a
vera
ge (2
000–
2009
) sim
plifi
ed s
urfa
ce e
nerg
y ba
lanc
e (S
SEB)
act
ual e
vapo
trans
pira
tion
(ET a)
cou
nty
volu
mes
for t
he c
onte
rmin
ous
Unite
d St
ates
.

Results 5
The use of contemporary irrigation area allows the comparison of NWUIP CU and SSEB ET in volumetric units as millions of gallons per acre. Because the irrigated area is provided by NWUIP, the most important contribution of SSEB ET is capturing the spatial variability of CU in the form of ET among counties within states or between states. Furthermore, when yearly ET (instead of mean ET) is used, both the spatial and temporal variability of ET can be quantified.
The energy-balance based approach gives a “total” ET that is a summation of ET from all water sources, including rainfall, soil moisture or groundwater in the vadose zone, or irrigation. Although this is useful in estimating total water use by crops, it does not differentiate the various source contributions. This is not a major problem in regions of the west and southwest that are largely dependent on irrigation to grow crops, and rainfall and groundwater resources are minimal compared to the crop needs met by irrigation. However, in humid regions of the east and southeast, irrigation still may be necessary, although on a smaller scale; it is difficult to determine the exact source of the water as either irrigation or natural sources such as rainfall or groundwater.
One possible way to distinguish sources would be with the use of a parallel soil-moisture-balance ET model, such as the VegET (U.S. Geological Survey, 2010) that calculates ET based on daily rainfall and location-specific water-use phenology coefficients. This model allows for the identification and separation of the amount of ET met by natural sources such as rainfall. The difference between energy balance “total” ET and soil-moisture-balance ET would provide an estimate of the amount supplied through irrigation. Although the application of this approach was not part of this study, it warrants further investigation and potential application to areas in the humid regions in the eastern and southeastern United States.
NWUIP data for 1995 county average daily withdrawals and CU estimates were assembled and associated to a 1 km county grid. Water-use data is reported as average daily withdrawals in million gallons per day. The withdrawals were adjusted to represent only the growing-season months (4 months) rather than the average annual value. Similarly, the corresponding volumetric seasonal ET values were compared to the reported volumetric CU datasets.
NWUIP reports irrigation withdrawals at the point of diversion and the irrigated acres in the county where the crops occur. In many cases, CU is estimated using non-analytical methods and reported in the county where the withdrawals occur. In many western states, water is diverted from surface-water resources and conveyed long distances to the point of use, sometimes across multiple county lines, which creates inconsistencies in the data where there are seemingly conflicting amounts of withdrawals or CU compared to irrigated acres. A county with large withdrawals and CU but few irrigated acres illustrates exportation of irrigation water
to a neighboring county; conversely, a county with small withdrawals and CU and many irrigated acres indicates a situation where water is imported from a neighboring county.
NWUIP county data spatially referenced to 1 km grids were related to the SSEB ETa estimates. Basic statistics were summarized to identify the relations between the two data sources at national and state-level scales.
ResultsA strong relation is evident between county-based
volumetric SSEB ETa and NWUIP CU datasets (R2 greater than 0.7 in most states, as much as 0.9 in some states). The study demonstrated that SSEB ETa could explain the spatial variability of county CU datasets. Therefore, SSEB ETa has shown promise as a means to estimate ETa at county and state levels for reporting purposes. Although the R2 is strong in most states, the slope of the relation varies from state to state. This indicates the need to establish a state-based equation between SSEB ETa and CU. One reason for this is the potential difference in reporting methods for NWUIP CU data among states.
Overall, the relation between SSEB ETa and NWUIP CU for 1995 is stronger in arid western states than in humid eastern states, and both positive and negative biases exist, depending on the region (figs. 3 and 4). SSEB ETa tends to be overestimated in the east (probably due to rainfall contributions and abundant soil moisture that naturally supplement crop water needs) and underestimated in the west (possibly due to coarse MODIS grid resolutions averaging over dry non-irrigated areas). Year-to-year spatial variability (relative changes between counties) is small in both the NWUIP CU (1990–95) and SSEB ETa data (2000–2009). This is a crucial point to consider while monitoring CU over the years with and without remote sensing. Relative CU or ET changes are small from year to year, which implies that marked changes in seasonal ET can be quantified reliably. Because atmospheric demand is a large-scale process, the effect of major weather changes between any 2 years tends to be widespread and sometimes statewide. Because of this, the volumetric water-use variability among counties comes from differences in irrigated areas. However, when using yearly ETa values (instead of mean ETa), both the spatial and temporal variability of water use can be accounted for. Due to a mismatch of the temporal datasets in this study, remote sensing ET was used to explain the spatial variability of CU among counties.
The importance of estimating the irrigated areas accurately is crucial because the volume magnitude of CU is affected more by the area than by the depth (ET). This can be inferred from the non-uniform distribution of irrigated

6 Comparison of Consumptive-Use Estimates from Simplified Surface Energy Balance Approach and Reporting Methods
areas in different counties in a given state. Although some counties have a few hundred acres of irrigated land, others have thousands of acres under irrigation. In terms of ET depth, counties with either large or small irrigated areas in a similar hydro-climatic region tend to have comparable depth (under optimum irrigation); however, the volumetric quantity will be a multiple of the area under irrigation, accounting for a large volume of ET for a county with a large irrigated area. Therefore, remote sensing ET can play two major roles in monitoring and updating county-based CU:
• Remote sensing ET can be applied quickly in a cost effective and timely manner to detect major year-to-year changes (absolute or relative) in the CU of any county by monitoring ET of potential irrigable areas (irrigated plus potential areas that can come in and out of irrigation).
• Remote sensing ET can be used to disaggregate county based volumetric estimates to sub-county levels. The current NWUIP CU data is at the county-level
and lacks the spatial resolution to identify important patterns in crop and irrigation practices that may dictate ET. Thus, remote sensing ET can be used to estimate subcounty CU values based on the spatial variability of ET magnitudes in irrigable lands at scales as low as 100 m with Landsat, and 1 km with MODIS.
More research is needed to identify the reasons for differences in state-based relations. Possible causes include: (1) SSEB ETa model assumptions and data accuracy, and (2) NWUIP CU accounting methods for total CU with respect to rainfall contributions, different approaches by different states, and anomalies in counties with seemingly conflicting data for withdrawals and irrigated acres.
The study outlined in this report shows the value of using combined data sources, such as trusted irrigated area values and remote sensing ET estimates, in conjunction with irrigated area masks to understand the spatial variability of CU among counties and between states. Remote sensing ET has the potential to timely and efficiently update CU.
Figure 3. Relation between Simplified Surface Energy Balance (SSEB) actual evapotranspiration (ETa) and National Water Use Information Program (NWUIP) consumptive use (CU) county data, 1995, in western states.
tac12-0708_fig 03
0
U.S. Geological Survey consumptive use (CU), in million gallons per day
2,500
Sim
plifi
ed s
urfa
ce e
nerg
y ba
lanc
e (S
SEB)
act
ual e
vapo
trans
pira
tion
(ET a),
in m
illio
n ga
llons
per
day
Linear 1995 volume, in million gallons per day
1995 volume, in million gallons per day
EXPLANATION
500 1,000 1,500 2,000
2,500
2,000
1,500
1,000
500
0
y = 1.1567xR2 = 0.8102
Summary 7
SummaryIrrigation is the predominant component of consumptive
water use in the western United States. A consistent, accurate, and efficient approach is needed for estimating water withdrawn for irrigation on a regional scale and the associated consumptive use (CU) of the withdrawals. Recent advances in remote-sensing technology and energy-balance methods now allow more accurate and repeatable estimates of actual evapotranspiration (ETa) with satellite observations of irrigated lands. A U.S. Geological Survey (USGS) study developed and demonstrated remote-sensing-based methods to consistently estimate CU of irrigation water on national and regional scales. These estimates were compared to estimates of CU derived from 1995 county-level data collected by the USGS National Water Use Information Program (NWUIP). The CU is the part of water that is applied to crops and either evaporated from plant or soil horizons, or transpired
from the plant, and is generally considered equivalent to evapotranspiration (ET) estimates based on satellite imagery and remote sensing methods. The Simplified Surface Energy Balance (SSEB) model is one method for estimating remotely sensed ET data.
The SSEB method combines data from a reference ET based on the Penman-Monteith equation, clipped grass under full vegetation, and unlimited water supply conditions, with land surface temperature and weather datasets to compute actual ET using a simplified adaptation of the “hot” and “cold” principles of SEBAL and METRIC models. The hot and cold pixels provide ET fractions that account for differences in water availability in the landscape and are used to adjust the reference ET to produce actual ET. Monthly ET data were estimated for 2000–2009 using MODIS data, which is not available prior to 2000. Irrigated areas were used to mask out those lands not considered for irrigation, and average seasonal (June–September) volumes of ET were compiled
tac12-0708_fig04
Linear 1995 volume, in million gallons per day
1995 volume, in million gallons per day
EXPLANATION
400 600 1,000200 800 1,200 1,400 1,8001,600
2,000
1,600
1,400
1,800
1,200
800
600
1,000
400
200
0
y = 2.6235xR2 = 0.701
Sim
plifi
ed s
urfa
ce e
nerg
y ba
lanc
e (S
SEB)
act
ual e
vapo
trans
pira
tion
(ET a),
in m
illio
n ga
llons
per
day
0
U.S. Geological Survey consumptive use (CU), in million gallons per day
2,000
Figure 4. Relation between Simplified Surface Energy Balance (SSEB) actual evapotranspiration (ETa) and National Water Use Information Program (NWUIP) consumpitive use (CU) county data, 1995, in eastern states.

8 Comparison of Consumptive-Use Estimates from Simplified Surface Energy Balance Approach and Reporting Methods
and compared to NWUIP 1995 county-level CU data that also were weighted seasonally and aerially. The use of an average (2000–2009) SSEB ET estimate disregards any major climatic differences between 1995 NWUIP CU and the 2000–2009 average, and assumes that seasonal county-average irrigation requirement depths remained about the same. This is true when the objective is to explain the spatial variability (county-to-county) of water use, with the knowledge that any major weather change between any 2 years will tend to affect all the counties in a given state, comparably. However, potential irrigated area changes are accounted for by using reported irrigated areas from NWUIP in the same period. The use of contemporary irrigation areas allows the comparison of both NWUIP CU and SSEB ET estimates in volumetric units. Because irrigated areas are provided by NWUIP, the most important contribution SSEB ET estimates provide is capturing the spatial variability of CU in the form of ET among counties within states or between states. Furthermore, when yearly ET (instead of average ET) is used, the spatial and temporal variability of ET can be quantified.
SSEB ET estimates do not distinguish the source of water that is evaporated or transpired. In humid eastern regions soil moisture and shallow groundwater levels may contribute some fraction of ET estimates, whereas in the arid western regions almost all ET is presumed to be from supplemental irrigation used to maintain plant health and growth. For these reasons, using SSEB methods to decipher what part of ET is from irrigation is limited in eastern regions. There is a strong relation (R2 greater than 0.7) between NWUIP CU and SSET ET estimates, especially in arid western regions. This study demonstrated that SSEB ET estimates can explain the spatial variability of CU data, and shows promise for use in reporting consistent and national estimates of CU where data are missing. The use of yearly ET estimates derived from SSEB methods can explain the temporal variability more accurately than previous NWUIP CU methods.
References Cited
Allen, R.G., Pereira, L.S., Raes, Dirk, and Smith, Martin, 1998, Crop evapotranspiration—Guidelines for computing crop water requirements—FAO irrigation and drainage paper 56: Food and Agricultural Organization of the United Nations, Rome, Italy, accessed December 12, 2011, at http://www.fao.org/docrep/X0490E/X0490E00.htm.
Allen, R.G., Tasumi, M., Morse, A.T., and Trezza, R., 2005, A Landsat-based energy balance and evapotranspiration model in western US water rights regulation and planning: American Society of Civil Engineers Journal of Irrigation and Drainage Engineering, v. 19, p. 251–268.
Allen, R.G., Tasumi, M., and Trezza, R., 2007, Satellite-based energy balance for mapping evapotranspiration with internalized calibration (METRIC)—Applications: American Society of Civil Engineers Journal of Irrigation and Drainage Engineering, v. 133, no. 4, p. 395–406.
Bastiaanssen, W.G.M., Menenti, M., Feddes, R.A., and Holtslag, A.A.M., 1998, A remote sensing surface energy balance algorithm for land (SEBAL)—1. Formulation: Journal of Hydrology, v. 212–213, p. 198–212.
Daly, C., Neilson, R.P., and Phillips, D.L., 1993, A statistical-topographic model for mapping climatological precipitation over mountainous terrain: Journal of Applied Meteorology, v. 33, no. 2, p. 140–158, accessed July 15, 2011, at http://www.prism.oregonstate.edu/.
Kanamitsu, M., 1989, Description of the NMC Global Data Assimilation and Forecast System: American Meteorological Society Weather and Forecasting, v. 4, no. 3, p. 335–342.
National Aeronautics and Space Administration, 2011, MODIS: National Aeronautic and Space Administration, accessed December 14, 2011, at http://modis.gsfc.nasa.gov/about/design.php.
Pervez, M.S., and Brown J.F., 2010, Mapping irrigated lands at 250-m scale by merging MODIS data and national agricultural statistics: Remote Sensing, v. 2, p. 2,388–2,412.
Senay, G.B., Budde, M., and Verdin, J.P., 2011, Enhancing the simplified surface energy balance approach for estimating landscape ET—Validation with the METRIC model: Agricultural Water Management, v. 98, no. 4, p. 606–618.
Senay, G.B., Budde, M., Verdin, J.P., and Melesse, A.M., 2007, A coupled remote sensing and simplified surface energy balance approach to estimate actual evapotranspiration from irrigated fields: Sensors, v. 7, no. 6, p. 979–1,000.
Senay, G.B., Verdin, J.P., Lietzow, P., and Melesse, A.M., 2008, Global daily reference evapotranspiration modeling and validation: Journal of American Water Resources Association, v. 44, no. 4, p. 969–979.
U.S. Geological Survey, 2010, Early warning and environmental monitoring program: U.S. Geological Survey database. (Also available at http://earlywarning.usgs.gov/usewem/swi.php.)

Publishing support provided by the U.S. Geological Survey Publishing Network, Tacoma Publishing Service Center
For more information concerning the research in this report, contact the Director, Idaho Water Science Center U.S. Geological Survey 230 Collins Road Boise, Idaho 83702 http://id.water.usgs.gov

Maupin and others—
Consumptive-U
se Estimates from
Simplified Surface Energy B
alance Approach and Indirect Reporting M
ethods—Scientific Investigations Report 2012–5005