Embed Size (px)
Citation preview
CONSUMPTIVE USE AND CONSUMPTIVE IRRIGATION REQUIREMENTS IN WYOMING
Larry Pochop, Travis Teegarden, Greg Kerr, Ronald Delaney and Victor Hasfurther
ABSTRACT
Monthly and seasonal estimates of consumptive use and consumptive irrigation requirements for crops and turf in Wyoming are given at each of 67 locations. Mean, maximum and minimum estimates are given for consumptive use and consumptive irrigation requirements as well as for grass reference evapotranspiration.
"WRC Publication #92-06
Contents of this publication have been reviewed only for editorial and grammatical correctness, not for technical accuracy. The material presented herein resulted from research sponsored by the Wyoming Water Resources Center, however views presented reflect neither a consensus of opinion nor the views and policies of the Wyoming Water Resources Center, or the University of Wyoming. Explicit findings and implicit interpretations of this document are the sole responsibility of the author(s).
To obtain a copy of this report, please call or write:
Wyoming Water Resources Center P.O. Box 3067, University Station Laramie, Wyoming 82071-3067 (307) 766-2143
ACKNOWLEDGEMENTS
c
h
The methodologies used in calculating the estimates given in this document are explained in a separate publication by Teegarden (1992). The methods are explained in detail by Teegarden, except that the information he gives concerning growing seasons and crop coefficients are examples only. Therefore, this document contains more detailed information on the growing seasons and crop coefficients, used for calculation of the consumptive use and consumptive irrigation requirement estimates, than on the other methodologies used.
The calculations contained herein are based upon climatic, evapotranspiration, and crop data collected in Wyoming and the surrounding region over a long period of time. Without this field data, this document could not have been prepared. Some of those who have been instrumental in collecting the data used herein include all the cooperators of the National Weather Service Cooperative Station Network with respect to the climatic data; Robert Burman, John Borrelli, John Barnes, Patrick O’Neill, Tom Crump, Joan Schumaker, Del Baird, Angela Vassar, and Mike Ebsen with respect to the evapotranspiration data; and all personnel contributing to the Wyoming Agicultural Statistics publications with respect to cropping information. Special appreciation is extended to Robert Burman and John Borrel-li for sharing the efforts in conducting and directing most of the consumptive use studies performed in Wyoming. Many long and productive days and weeks have been spentwith these co-workers, both in the field collecting consumptive use and related climatic data and in the office analyzing the field data. We are grateful to the agencies which provided funding to support consumptive use studies. Appreciation is extended to Barry Lawrence, Kenneth Carnes, and Catherine Voigtsberger at the WWRC for providing the climatic data from WRDS in a readily usable format, to Richard Marston for a review of the methodolgy used in preparing the esitmates in this document, and to K. James Fornstrom for providing sample data of crop water use for verification of final estimates.
The preparation of this document was supported, in part, by a State Grant-in-Aid from the Wyoming Water Resources Center.
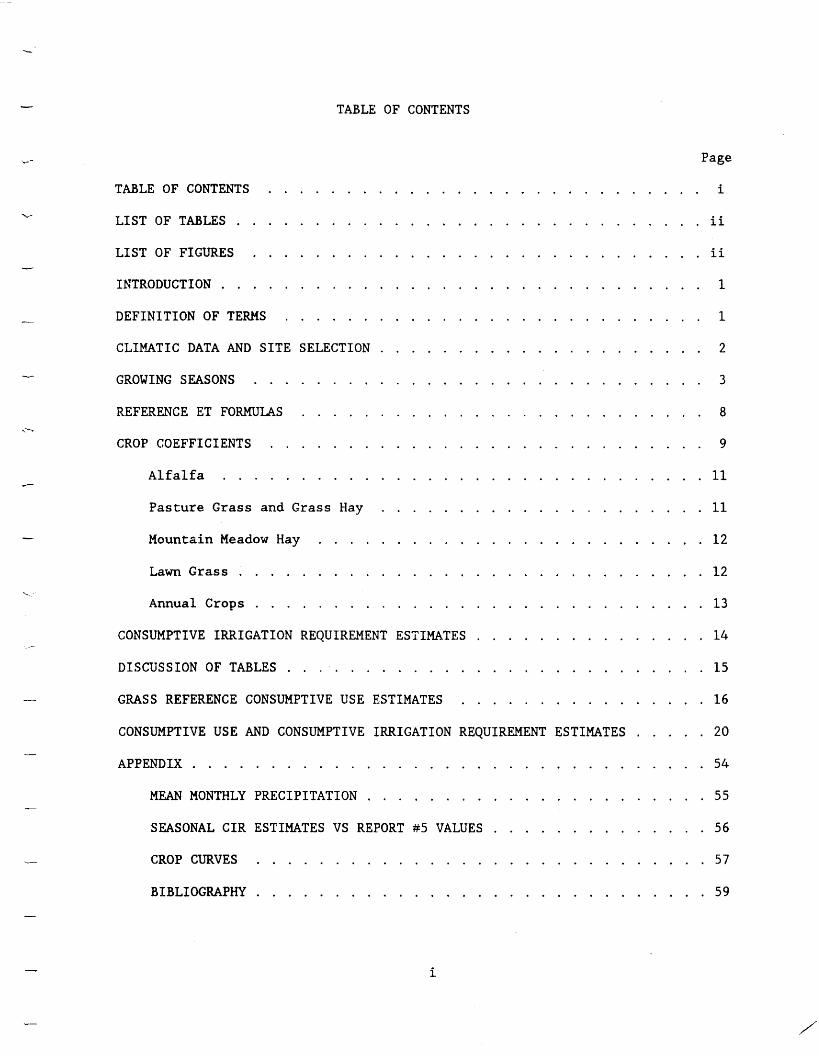
TABLE OF CONTENTS
’- -
--:
. .-
Page
TABLE OF CONTENTS . . . . . . . . . . . . . . . . . . . . . . . . . . . . i
LIST OF TABLES . . . . . . . . . . . . . . . . . . . . . . . . . . . . . . ii
LIST OF FIGURES . . . . . . . . . . . . . . . . . . . . . . . . . . . . . ii
IETRODUCTION . . . . . . . . . . . . . . . . . . . . . . . . . . . . . . . 1
DEFINITIONOFTERMS . . . . . . . . . . . . . . . . . . . . . . . . . . . 1
CLIMATIC DATA AND SITE SELECTION . . . . . . . . . . . . . . . . . . . . . 2
GROWING SEASONS . . . . . . . . . . . . . . . . . . . . . . . . . . . . . 3
REFERENCE ET FORMULAS . . . . . . . . . . . . . . . . . . . . . . . . . . 8
CROPCOEFFICIENTS . . . . . . . . . . . . . . . . . . . . . . . . . . . . 9
Alfalfa . . . . . . . . . . . . . . . . . . . . . . . . . . . . . . . 11
Pasture Grass and Grass Hay . . . . . . . . . . . . . . . . . . . . . 11
Mountain Meadow Hay . . . . . . . . . . . . . . . . . . . . . . . . . 12
LawnGrass.. . . . . . . . . . . . . . . . . . . . . . . . . . . . . 12
Annual Crops . . . . . . . . . . . . . . . . . . . . . . . . . . . . . 13
CONSUMPTIVE IRRIGATION REQUIREMENT ESTIMATES . . . . . . . . . . . . . . . 14
DISCUSSION OF TABLES . . . . . . . . . . . . . . . . . . . . . . . . . . . 15
GRASS REFERENCE CONSUMPTIVE USE ESTIMATES . . . . . . . . . . . . . . . . 16
CONSUMPTIVE USE AND CONSUMPTIVE IRRIGATION REQUIREMENT ESTIMATES . . . . . 20
APPENDIX.. . . . . . . . . . . . . . . . . . . . . . . . . . . . . . . . 54
MEAN MONTHLY PRECIPITATION . . . . . . . . . . . . . . . . . . . . . . 55
SEASONAL CIR ESTIMATES VS REPORT #5 VALUES . . . . . . . . . . . . . . 5 6
CROPCURVES . . . . . . . . . . . . . . . . . . . . . . . . . . . . . 57
BIBLIOGRAPHY.. . . . . . . . . . . . . . . . . . . . . . . . . . . . 59
i
LIST OF TABLES
c
Table Page
1. Adjustment Coefficients for Wind Speeds . . . . . . . . . . . . . . 5 2. Average Growing Seasons for Forages and Lawn Grass . . . . . . . . . 6
3 . Average Planting and Harvest Dates . . . . . . . . . . . . . . . . . 7 4 . Calibration Coefficients for the FA0 Blaney-Criddle Equation . . . . 9 5. Locations and Season Lengths for Crop Coefficient Development . , . . 10
6. Grass Reference Crop Coefficients for Forages and Lawns . . . . . . . 13 7. Grass Reference Crop Coefficients for Annual Crops . . . . . . . . . 14 8. Reference Consumptive Use Estimates . . . . . . . . . . . . . . . . . 16
9. Consumptive Use and Consumptive Irrigation Requirement Estimates . . 20
Al. Mean Monthly Precipitation (Inches) . . . . . . . . . . . . . . . . . 55 A 2 . Comparison of Seasonal CIR Values with Report #5 Values . . . . . . . 56
LIST OF FIGURES
Figure Page
1. Map of Seven Regions and 67 Selected Sites . . . . . . . . . . . . . 4
2. Map of April-October Reference Consumptive Use Isolines . . . . . . . 18 3 . Map of Forage Season Reference Consumptive Use Isolines . . . . . . . 19
Al. Crop Curves for Forages and Lawn Grass . . . . . . . . . . . . . . . 57
A 2 . Crop Curves for Annual Crops . . . . . . . . . . . . . . . . . . . . 58
ii
CONSUMPTIVE USE AND CONSUMPTIVE IRRIGATION REQUIREMENTS IN WYOMING
Larry Pochop, Travis Teegarden, Greg Kerr, Ronald Delaney, and Victor Hasfurther
by
INTRODUCTION
The primary objective of this document is to provide up-to-date estimates of means and probabilities of crop consumptive use and consumptive irrigation requirements in Wyoming. The last publication on statewide estimates of consumptive use of irrigation water in Wyoming was in 1970 (Trelease et al., 1970). Extensive research, both in Wyoming and the surrounding region, has provided much additional information on crop water use since 1970.
Details of the methodologies used in calculating the estimates are not given herein but are explained in a separate publication by Teegarden (1992). Discussion in this document is limited to that necessary for the proper understanding and interpertation of the information presented.
DEFINITION OF TERMS
Evapotranspiration (ET) is the combination of evaporation from the s o i l and plant surfaces and transpiration from plants. The term consumptive use is used interchangeably with ET, however, consumptive use also includes the water used by plants for the production of physical plant matter. Since the water used for production of plant matter is relatively small, ET and consumptive use are essentially the same. (Note: The consumptive use of a specified well-watered crop is referred to herein as the crop consumptive use requirement, CU.)
Reference Crop Evapotranspiration (ET,) is the evapotranspiration from a given well-watered crop selected for comparative purposes under given weather conditions and with adequate fetch. The crop type can vary but is usually clipped grass or alfalfa. In theory, any plant or reference such as pan evaporation or any equation estimate may be used. The reference crop ET used throughout this document is grass reference ET and is defined as the rate of evapotranspiration from an extensive surface of 3 to 6 inches tall green grass of uniform height, actively growing in an open area, completely shading the ground, and not short of water (Doorenbas and Pruitt, 1977). The grass type is not defined, but a cool season grass such as alta fescue is assumed.
Crop Coefficient (K,) is the ratio between crop ET and reference crop ET when the crop is grown in large fields under optimum well-watered growing conditions. Crop ET refers to the rate of ET from a specified well-watered crop from time of planting to harvest of annual crops or from the development of perennial crops in tne spring until harvest or until fall, including the effects of cutting on forage crops like alfalfa and grass. The magnitude of crop coefficients are dependent upon the reference crop, with grass reference used in this document. Crop coefficients are also referred to as consumptive use coefficients.
Crop coefficients used in this document are "mean" crop coefficients accounting for typical irrigation practices, including regular wetting of the s o i l surface. When soil water is not optimum for the crop, or when soil water begins to limit ET, the mean crop coefficients must be reduced in estimating crop
1
ET which will be less than maximum crop ET. The levels of soil water depletion at which reduction of water use begins to occur for various crops, soils, climatic conditions, and other factors affecting water use are not well defined.
_--
”-
1-
1
I
+-
Crop Consumptive Use Requirement (CU or ETCrop) is the water use of any specified well-watered crop under optimum growing conditions. CU is determined by multiplying ET, by the appropriate K, values. Crop consumptive use is usually considered the maximum water use of a crop for the given conditions. However, a crop with access to a high water table will generally use water at a rate greater than if the water table were not present. In this document the consumptive use estimates for mountain meadows assume the presence of a high water table. Estimates for all other crops assume well-watered conditions but no water table. A5 mentioned above, when soil water is limited, crop water use is less than that defined as crop consumptive use.
Effective Precipitation, The commonly recognized definition, which is most suitable f o r irrigation scheduling purposes, is that effective precipitation is that part of the total rainfall during the growing season which is available to meet the consumptive water requirements of a crop (Dastane, 1974). However, for water right transfers, another definition must be applied. In the case of water transfers and water right issues, effective rainfall is the totai amount of rair,fall that falls on an area which supplements the consumptive irrigation requirements of a crop and produces additional water as runoff and/or deep percolation. The latter definition will be used throughout this document. Thus, for the purposes of on-farm irrigation management, individual irrigation adjustments will need to be made to account for runoff and deep percolation that occur from high intensity rainfalls. Various methods are available for estimating effective precipitation for irrigation management (e.g., Jensen et al., 1990), however, their accuracy and reliability are questionable.
Consumptive Irrigation Requirement ( C I R ) is the consumptive use requirement of a crop minus precipitation. Note that in this document a l l precipitation is considered effective. Therefore CIR - CU - Precipitation. However, CIR estimates for those crops having growing seasons beginning or ending on dates other than the first of a month were calculated using precipitation for the entire month even though consumptive use estimates were only for partialmonths. That is, precipitation was considered on a monthly basis. Also, any excess precipitation during a given month was not carried over to the next month.
CLIMATIC DATA AND SITE SELECTIONS
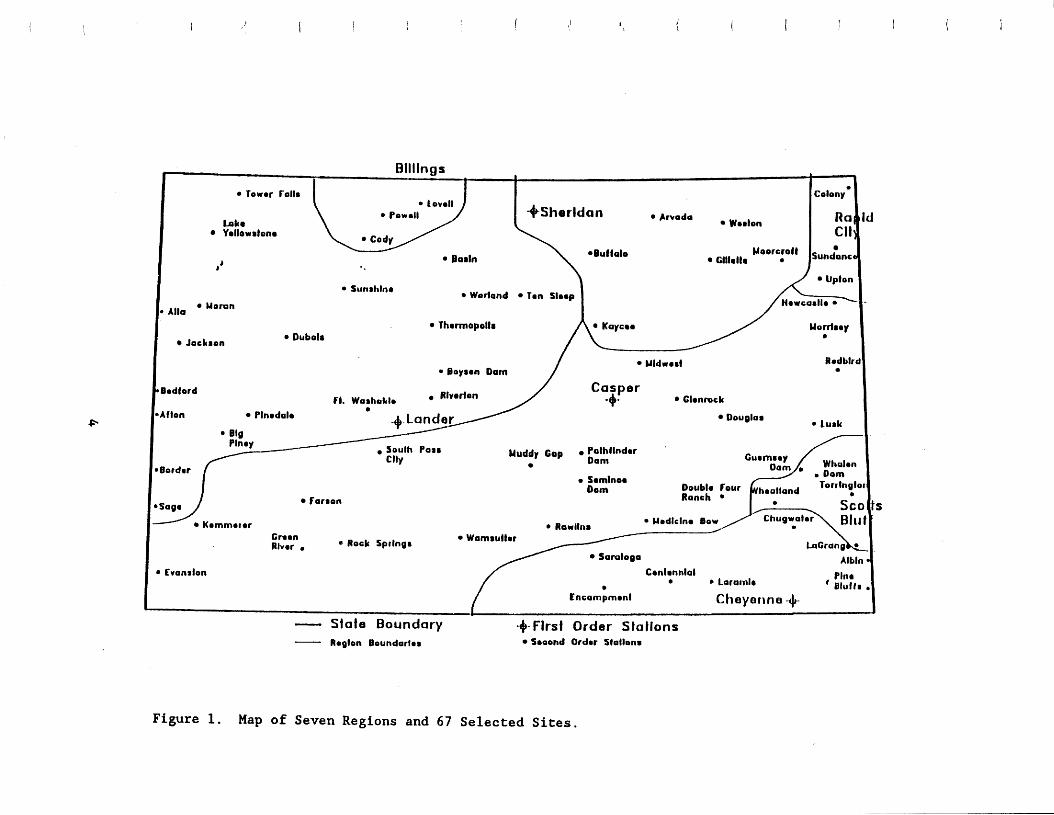
A major factor in selecting sites for ET estimates is the availability of climatic data. Local temperature and precipitation data are available at over 100 National Weather Service cooperative stations (second order stations) in Wyoming. Additional climatic data--such as sky cover, percent sunshine, humidity, and wind speed--are generally available at the four first order National Weather Service stations of Cheyenne, Lander, Casper, and Sheridan. The three first order stations of Billings, Rapid City, and Scottsbluff are located near Wyoming and have climatic conditions representative of adjacent areas in Wyoming.
Analyses suggested that air temperature and wind velocity variations need to be accounted for by using local temperature data and by adjusting wind speeds
2
--
from one location to another within a region prior to reference ET calculations. The use of constant region-wide values of dew point temperature and solar radiation from the first order stations provides adequate estimates of those parameters for an entire region.
By using wind data from first order stations and from research sites having short term records of wind along with isolines and areas of equal wind power from Martner (1986), Wyomingwas divided into seven regions of similar wind conditions (Fig. 1). Within each region, wind adjustment coefficients were developed by comparing wind speeds at each of the second order stations where data existed to speeds at the first order stations (Table 1). Thus, monthly wind speeds for ET estimates at the second order stations were taken as the monthly wind speeds at the first order station within the region multiplied by the wind adjustment coefficient for the second order station. In most cases the wind adjustment coefficients were developed using isolines of equal wind power from Elliott (198Q) to scale wind speeds up or down as compared to the speed at the first order stations. For locations where no wind speed data were available (e.g., Powell, Cody, and Lovell) , the first order station wind speed data were used directly at the second order station. For most locations, the 40 year period of 1951 through 1990 was used in calculating CU and CIR estimates.
GROWING SEASONS
For seasonal consumptive use estimates, the length of time that water is used by various crops must be known. The growing season within Wyoming for some crops is fairly similar Erom one location to another, since these crops are limited to areas of similar elevation and climatic conditions. The growing season for other crops, e. g. forages, vary greatly throughout the State since the crops are grown at locations having considerable differences in elevation and climate
Growing seasons for forages and lawn grass were defined as the period between the average date that the diiily mean temperature reaches 40°F in the spring and the average date of the first 24°F or lower minimum temperature occurrence the fall (Table 2). This definition may best fit the growing season for alfalfa while the growing seasons for pasture grass, mountain meadows, and lawn grass may be slightly greater than that defined by the above criteria. However, any differences will cause only small differences in total water use because of the low rates of water use in early spring and late fall. The occurrences of the 40°F temperature in the spring were compiled from the Wvominq Climate Atlas (Martner, 1986), and the source of the average 24°F frost/freeze occurrences in the fall was the Probabilities of Freeze in Wvominq (Becker et al., 1977). The criteria for the start of the growing season is the same as that used in Wyoming Water Report No. 5 (Trelease et al., 1970). Since 1970, over 20 years of additional temperature data have become available and were used in this analysis. Therefore, starting dates in the spring may be different than those published by Trelease et al. (1970).
Since the purpose of this document is to provide estimates of CU aad CIR over the water use period, estimates for the fall assume that water application continues after the last cutting--for example, for the development of pasture grass for winter feed. Individual farming practices need to be considered during the fall after the last cutting because in some locations and/or years water is not available late in the season or irrigation is simply discontinued, therefore, water use will be lower than for irrigated conditions. Adjustments may also need to be made in the spring if irrigation is not applied at the beginning of the growing season.
3
I I 1 1 i I
81111ngs
I lowor Follr I I I
Lake Yollowrtonr
J4
Allo
Jackson
odiord
Ervada Woolon
+Sheridan
0 Ouf ialo Uoorcrofl Barln G191rl!r 0
\
- -u. ......, I 1 0 Worland Ton Sloop
Colony
iundanco
Uplon
Thrrmopollm Dubolr
Kaycrr Uordroy
Uldwort ~ B o y r r n Dam
Fl. Warhoklo Rrvrdon / Casper -$- Glonrock
Rodblrc 0
I ton Plnedalr
Uuddy Plnry South Parr
rrder
farson
Kommoror Gmon Wamrullor ~l~~~ . 0 Rock Sprlngi
Oouglor ' lurk
7
Tonlngl
Dam
Dam 0
C,.
G~~ Pathtlndor
0 Somlnoo
d
i s tamtogo
lvanrlon Contrnnlal Plnr 0 0 B I U t l l 0
Laramlr
tncampmonl Cheyenne 4- A - Stote Boundary -$- Flrst Order Stations
- Raglon Boundorlo8 Soaond Order Slotlonm
Figure 1. Map of Seven Regions and 67 Selected S i t e s .
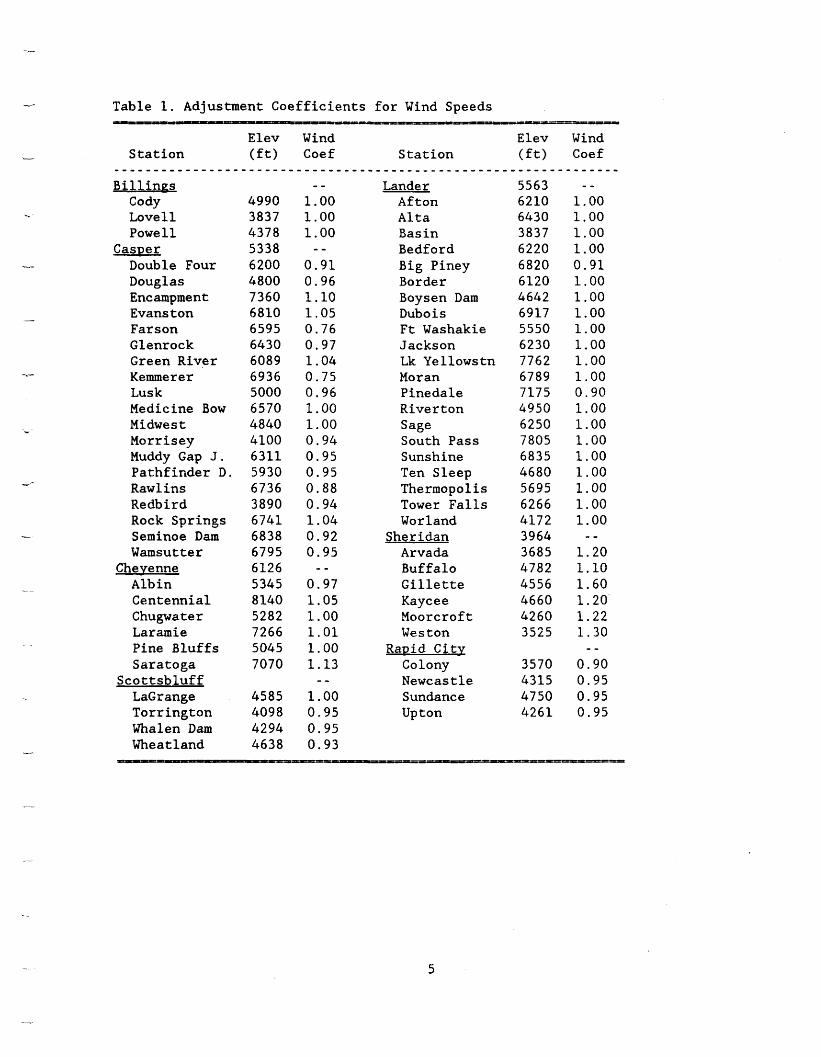
4 Table 1. Adjustment Coefficients for Wind Speeds
i
Elev Wind Elev Wind Station (ft) Coef Station (ft) Coef
€3 i 11 inns Cody Love11 Powell
Double Four Douglas Encampment Evans ton Farson G1 enr ock Green River Kemmerer Lusk Medicine Bow Midwest Morr isey Muddy Gap J. Pathfinder D. Rawlins Redbird Rock Springs Seminoe Dam Wamsutter
Chevenne Albin Centennial Chugwa t e r Laramie Pine Bluffs Saratoga
Scottsbluff LaGrange Torrington Whalen Dam Wheat 1 and
Casper
4990 3837 4378 5338 6200 4800 7360 6810 6595 6430 6089 6936 5000 6570 4840 4100 6311 5930 6736 3890 6741 6838 6795 6126 5345 8 140 5282 7266 5045 7070
4585 4098 4294 4638
- - 1 . 0 0 1 . 0 0 1.00
0 . 9 1 0 .96 1 . 1 0 1 . 0 5 0 .76 0 .97 1 . 0 4 0 . 7 5 0 .96 1 .00 1 . 0 0 0 . 9 4 0 . 9 5 0 .95 0 .88 0 . 9 4 1 . 0 4 0 . 9 2 0 .95
0 .97 1 . 0 5 1.00 1.01 1.00 1 . 1 3
1 .00 0 . 9 5 0 . 9 5 0 .93
- -
- -
- -
Lander Afton Alta Basin Bedford Big Piney Border Boysen Dam Dubois Ft Washakie Jackson Lk Yellowstn Moran Pinedale River ton Sage South Pass Sunshine Ten Sleep Thermopolis Tower Falls Worland
Sheridan Arvada Buffalo Gillette Kaycee Moorcrof t Weston
Rapid Citv Colony Newcastle Sundance Upton
5563 6210 6430 3837 6220 6820 6120 4642 6917 5550 6230 7762 6789 7175 4950 6250 7805 6835 4680 5695 6266 4172 3964 3685
4556 4660 4260 3525
3570 4315 4750 4261
4782
- - 1.00 1.00 1 . 0 0 1.00 0 . 9 1 1 . 0 0 1 . 0 0 1.00 1.00 1.00 1.00 1.00 0 . 9 0 1.00 1.00 1.00 1.00 1.00 1.00 1.00 1.00
1 . 2 0 1.10 1 . 6 0 1 . 2 0 1 . 2 2 1 . 3 0
0 .90 0 .95 0 .95 0 . 9 5
I -
- -
5
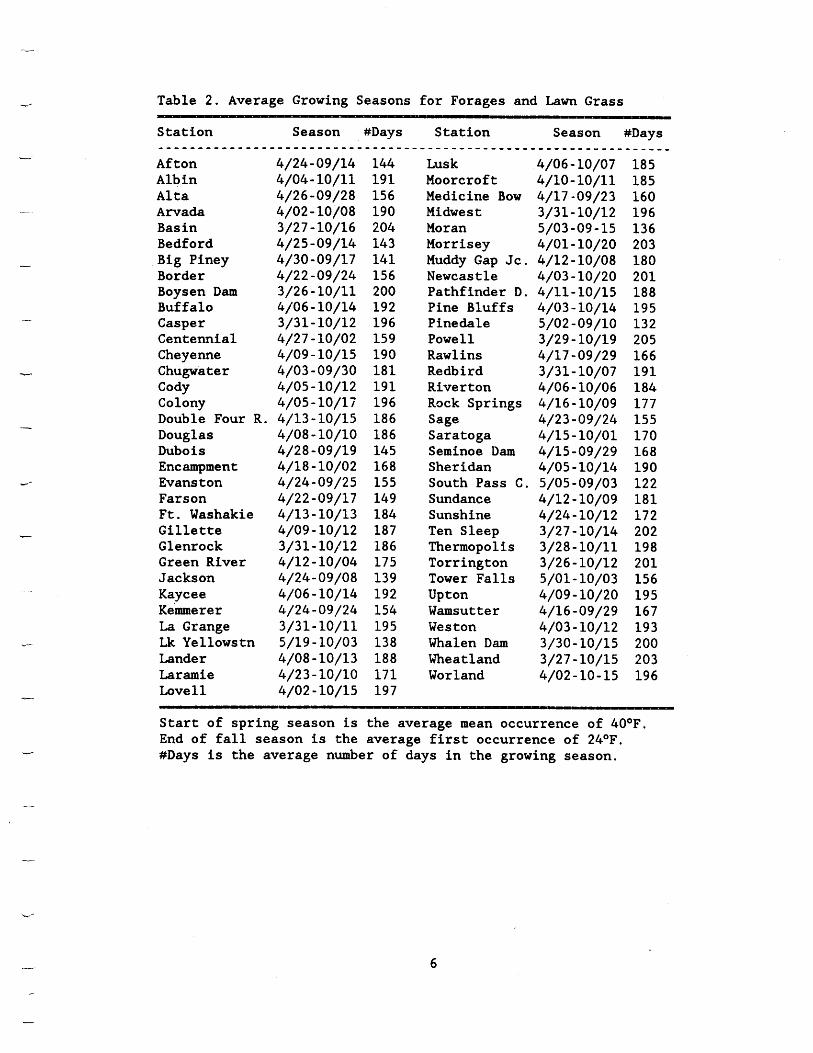
Table 2. Average Growing Seasons for Forages and Lawn Grass
Af ton 4/24-09/14 Albin 4/04-10/11 A k a 4/26-09/28 Arvada 4/02-10/08 Bas in 3/27-10/16 Bedford 4/25-09/14 Big Piney 4/30-09/17 Border 4/22-09/24 Boysen Dam 3/26-10/11 Buffalo 4/06-10/14 Casper 3/31-10/12 Centennial 4/27-10/02 Cheyenne 4/09-10/15 Chugwater 4/03-09/30 Cody 4/05-10/12 Colony 4/05-10/17 Double Four R. 4/13-10/15 Douglas Dubois Encampment Evans ton Farson Ft. Washakie Gillette Glenrock Green River Jackson Kaycee Kemmerer La Grange Lk Yellowstn Lander Laramie Love11
4/08-10/10 4/28-09/19 4/18-10/02 4/24-09/25 4/22-09/17 4/13-10/13 4/09-10/12 3/31-10/12 4/12-10/04 4/24-09/08 4/06-10/14 4/24-09/24 3/31-10/11 5/19-10/03 4/08-10/13 4/23-10/10 4/02-10/15
144 191 156 190 204 143 141 156 200 192 196 159 190 181 191 196 186 186 145 168 155 149 184 187 186 175 139 192 154 195 138 188 171 197
Lusk Moorcrof t Medicine Bow Midwest Moran Morris ey Muddy Gap Jc. Newcas t le Pathfinder D. Pine Bluffs Pinedale Powell Rawlins Redbird River ton Rock Springs Sage Saratoga Seminoe Dam She r k dan South Pass C. Sundance Sunshine Ten Sleep Thermopolis Torrington Tower Falls Upton Wamsutter Weston Whalen D a m Wheat land Wor land
4/06-10/07 4/10-10/11 4/17-09/23 3/31-10/12 5/03-09-15 4/01-10/20 4/12-10/08 4/03-10/20 4/11-10/15 4/03-10/14 5/02-09/10 3/29-10/19 4/17-09/29 3/31-10/07 4/06-10/06 4/16-10/09 4/23-09/24 4/15-10/01 4/15-09/29 4/05-10/14 5/05-09/03 4/12-10/09 4/24-10/12 3/27-10/14 3/28-10/11 3/26-10/12 5/01-10/03 4/09-10/20 4/16-09/29 4/03-10/12 3/30-10/15 3/27-10/15 4/02-10-15
185 185 160 196 136 203 180 201 188 195 132 205 166 191 184 177 155 170 168 190 122 181 172 202 198 201 156 195 167 193 200 203 196
Start of spring season is the average mean occurrence of 40°F. End of fall season is the average first occurrence of 24OF. #Days is the average number of days in the growing season.
6
5-
W
r)
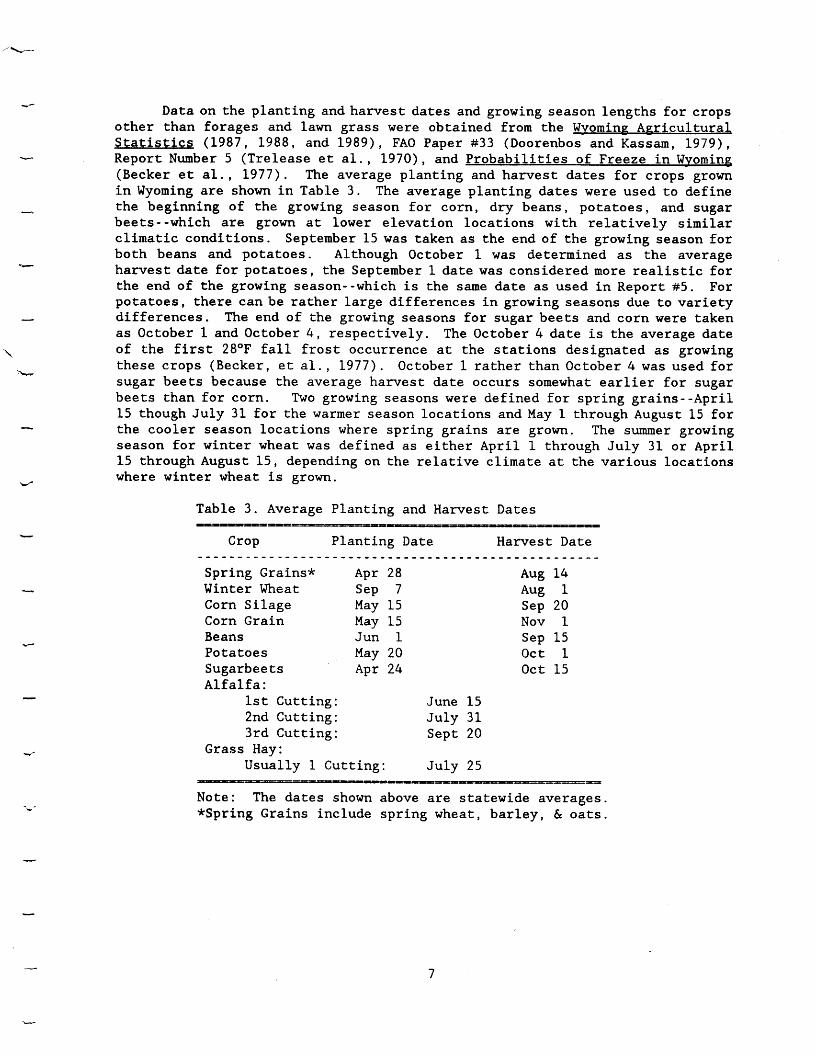
Data on the planting and harvest dates and growing season lengths for crops other than forages and lawn grass were obtained from the Wvoming Agricultural Statistics (1987, 1988, and 1989), FA0 Paper #33 (Doorenbos and Kassam, 1979) , Report Number 5 (Trelease et al., 1970), and Probabilities of Freeze in Wvominq (Becker et al., 1977). The average planting and harvest dates for crops grown in Wyoming are shown in Table 3 . The average planting dates were used to define the beginning of the growing season for corn, dry beans, potatoes, and sugar beets--which are grown at lower elevation locations with relatively similar climatic conditions. September 15 was taken as the end of the growing season for both beans and potatoes. Although October 1 was determined as the average harvest date for potatoes, the September 1 date was considered more realistic for the end of the growing season--which is the same date as used in Report #5. For potatoes, there can be rather large differences in growing seasons due to variety differences. The end of the growing seasons for sugar beets and corn were taken as October 1 and October 4 , respectively. The October 4 date is the average date of the first 28OF fall frost occurrence at the stations designated as growing these crops (Becker, et al., 1977) . October 1 rather than October 4 was used for sugar beets because the average harvest date occurs somewhat earlier for sugar beets than for corn. Two growing seasons were defined for spring grains--April 15 though July 31 for the warmer season locations and May 1 through August 15 for the cooler season locations where spring grains are grown. The summer growing season for winter wheat was defined as either April 1 through July 3 1 or April 15 through August 15, depending on the relative climate at the various locations where winter wheat is grown.
Table 3 . Average Planting and Harvest Dates -- -- Crop Planting Date Harvest Date
Spring Grains* Apr 28 Winter Wheat Sep 7 Corn Silage May 15 Corn Grain May 15 Beans Jun 1 Potatoes May 20 Sugarbeets Apr 24 Alfalfa :
1st Cutting: 2nd Cutting: 3rd Cutting:
Usually 1 Cutting: Grass Hay:
Aug 14 Aug 1 Sep 20 Nov 1 Sep 15 Oct 1 Oct 15
June 15 July 31 Sept 20
July 25
Note: The dates shown above are statewide averages. *Spring Grains include spring wheat, barley, & oats.
7
1
-
. .-
REFERENCE ET FORMULAS
Recent research updating methods and information for providing estimates of ET has emphasized the reference crop approach. Crop ET is estimated as
CU = K,ET,
For monthly estimates of CU, monthly ET, is estimated using one of several available equations and then ET, is multiplied by monthly crop coefficients, K,. CU is for a well-watered crop under optimum growing conditions.
In the past, temperature methods have been widely used in the Western United States to estimate long-term mean ET. The availability of temperature data at many locations throughout the West, and the simplicity of the equations, encouraged the use of temperature methods. The Blaney-Criddle method of estimating ET was introduced during the late 1940's (Blaney and Criddle, 1950) and has seen widespread use for estimating long-term mean ET. The SCS (1967) modified the Blaney-Criddle formula, adding a climate coefficient to the original crop growth stage coefficient. However, the SCS version is still a single parameter temperature method. The temperature dependent Blaney-Criddle requires local calibration to provide accurate long-term mean ET estimates. However, even when locally calibrated, it generally cannot adequately account for spatial variability since it is a single parameter equation. Also, it will not account sufficiently far year-to-year variability in ET (Allen and Brockway, 1983).
With the development and common usage and availability of personal computers, the simplicity of use advantage of ET estimating equations is no longer a significant criteria. Even the availability of climatic data other than temperature is rapidly becoming less of an issue. Automated weather stations capable of recording all weather parameters have been available for several years. The development of the National Weather Service's Automated Surface Observing System will soon provide ready access to complete climatic data at numerous sites throughout the country.
The FAO-24 version of the Blaney-Criddle method represents a major modification of the Blaney-Criddle formula because climatic information in addition to air temperature data is included (Doorenbos and Pruitt, 1977). Doorenbos and Pruitt modified the original single parameter Blaney-Criddle method, which uses the temperature and day length related factor f (f=tp/100), by including general levels of humidity, sunshine, and wind in an adjustment factor, c.
ET, = c(tp/100)
The adjustment factor is actually a regression adjustment. On-site measurements of climatic data other than temperature are not required in the adjustment factor. Only general levels, or regional values, of radiation, humidity, and wind data are required.
Penman (1948) published the first of what have become known as the "combination methods". These methods are a combination of a theoretical energy balance, a mass-transfer approach, and an empirical wind function. Since the time of it's original development, the Penman equation has seen many modificatians. Various forms of the Penman equation have been developed for varying climatic regimes and local conditions. Monteith introduced a significant variation of the Penman method in 1965, including the use of a plant resistance parameter and a more general use of an aerodynamic resistance parameter (Manteith, 1965). The most recent and significant modification was completed by
8
'4
L
\-
3 -
Allen et al. (1989), and this version is referred to herein as the Penman- Monteith formula.
From comparisons of estimates to measured data in Wyoming, the Penman- Monteith formula for use with either grass or alfalfa reference ET estimates was the best combination method while the FA0 Blaney-Criddle was the best single parameter equation for supplying grass reference ET estimates (Teegarden, 1992). Jensen et al. (1990) conclude similar results, with the Penman-Monteith equation ranking first among 20 methods tested while the FA0 Blaney-Criddle ranked first among the single parameter equations.
The FA0 Blaney-Criddle method is suggested for locations where available on-site climatic data consist only of air temperature (Doorenbos and Pruitt, 1977). Since the Penman-Monteith produces accurate estimates of reference ET when local data are available, the FA0 Blaney-Criddle can be calibrated against the Penman-Monteith at each first order station and applied at other stations in a region with on-site temperature data and estimates of other climatic data from the first order stations to produce reliable estimates of monthly ET,.
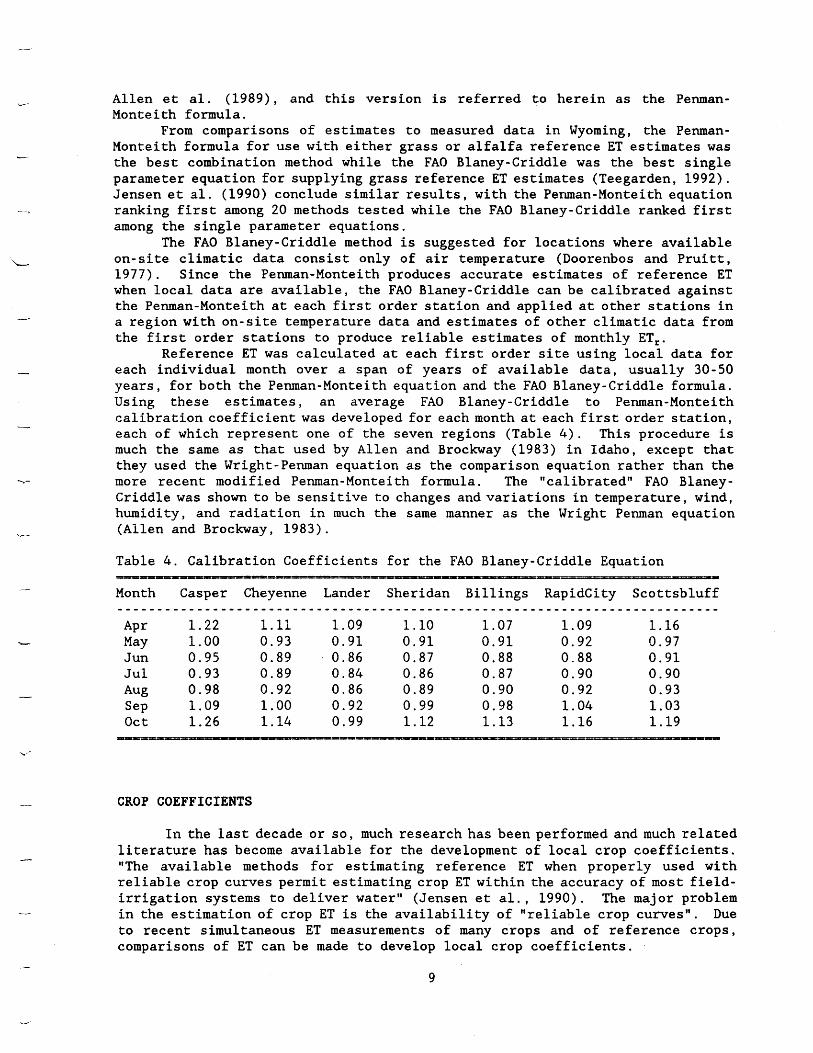
Reference ET was calculated at each first order site using local data for each individual month over a span of years of available data, usually 30-50 years, for both the Penman-Monteith equation and the FA0 Blaney-Criddle formula. Using these estimates, an average FA0 Blaney-Criddle to Penman-Monteith calibration coefficient was developed for eachmonth at each first order station, each of which represent one of the seven regions (Table 4 ) . This procedure is much the same as that used by Allen and Brockway (1983) in Idaho, except that they used the Wright-Penman equation as the comparison equation rather than the more recent modified Penman-Monteith formula. The "calibrated" FA0 Blaney- Griddle was shown to be sensitive to changes and variations in temperature, wind, humidity, and radiation in much the same manner as the Wright Penman equation (Ailen and Brockway, 1983).
Table 4 . Calibration Coefficients for the FA0 Blaney-Criddle Equation
T
Month Casper Cheyenne Lander Sheridan Billings Rapidcity Scottsbluff - - - - - - - - - - - * * - - - ~ - - - " ~ - " - - - ~ * - * * * * - - - - - - - - - - - - - - - - ~ - - - - - - - - - ~ - - ~ * * - - - * - - * - - -
APr 1.22 1.11 1.09 1.10 1.07 1.09 1.16 May 1.00 0 . 9 3 0.91 0.91 0.91 0.92 0.97
0.88 0.88 0.91 Jun 0.95 0.89 0.86 0.87 Jul 0.93 0.89 0.84 0.86 0.87 0.90 0.90 Aug 0.98 0 . 9 2 0.86 0.89 0.90 0.92 0.93 SeP 1.09 1.00 0.92 0.99 0.98 1.04 1.03 oc t 1.26 1.14 0.99 1.12 1.13 1.16 1.19
CROP COEFFICIENTS
In the last decade or so, much research has been performed and much related literature has become available for the development of local crop coefficients. "The available methods for estimating reference ET when properly used with reliable crop curves permit estimating crop ET within the accuracy of most field- irrigation systems to deliver water" (Jensen et al., 1990). The major problem in the estimation of crop ET is the availability of "reliable crop curves". Due to recent simultaneous ET measurements of many crops and of reference crops, comparisons of ET can be made to develop local crop coefficients. .
9
.-
I
I
-I
.__-
Crop coefficients were developedusingvarious methodologies and references (Tables 6 and 7). The two main references were FA0 Paper #33 (Doorenbos and Kassam, 1979) and ASCE Manual #70 (Jensen et al., 1990). FA0 Paper #33 uses a grass reference while ASCE Manual #70 uses alfalfa as a reference. Since only grass reference is used herein, and since a standard conversion of 0.78 is suggested for alfalfa reference to grass reference, ASCE Manual #70 values were used as a check for the crop coefficients developed from FA0 Paper #33. Any discrepancies were noted and adjustments were made when deemed appropriate. Crop coefficients for mountain meadow hay and lawn grass were developed using ET measurements collected in Wyoming. Alfalfa crop coefficients were developed using ASCE Manual #70 since FA0 Paper #33 gives less information on alfalfa.
FA0 Paper #33 provides a range of crop coefficients for various crop developmental stages as well as €or the total growing period. Teegarden (1992) shows that Wyoming conditions best represent the low humidity and strong wind conditions associated with the higher side of the range of values. Monthly crop coefficients used herein were developed using the methodology given in FA0 Paper # 3 3 . Adjustments to the monthly values were made when necessary to give crop coefficients within the range given in FA0 Paper #33 for the total growing period--e.g., for wheat the K, range is listed as 0.8 to 0.9 for the total growing period. All crop curves are shown in the Appendix.
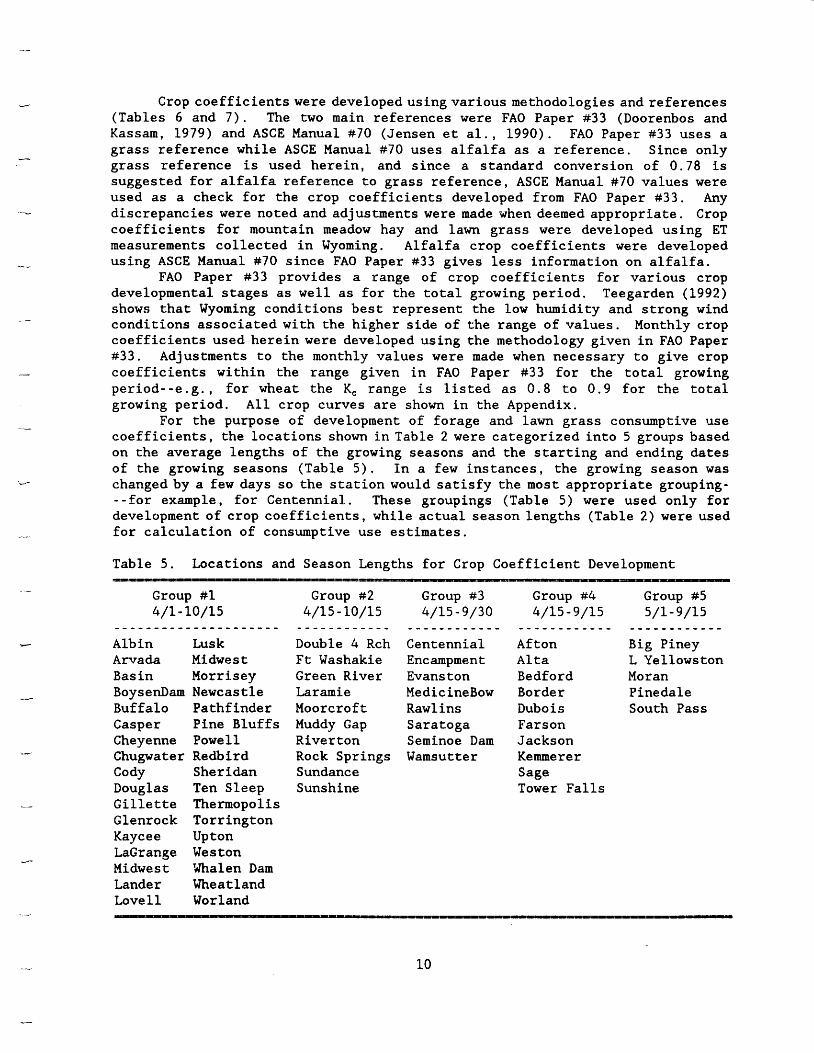
For the purpose of development of forage and lawn grass consumptive use coefficients, the locations shown in Table 2 were categorized into 5 groups based on the average lengths of the growing seasons and the starting and ending dates of the growing seasons (Table 5). In a few instances, the growing season was changed by a few days so the station would satisfy the most appropriate grouping- --for example, for Centennial. These groupings (Table 5) were used only for development of crop coefficients, while actual season lengths (Table 2) were used for calculation of consumptive use estimates.
Table 5 . Locations and Season Lengths for Crop Coefficient Development
Group #1 4/1- 10/15
Alb in Lusk Arvada Midwest Bas in Morrisey BoysenDam Newcastle Buffalo Pathfinder Casper Pine Bluffs Cheyenne Powell Chugwa t er Redbird Cody Sher i dan Douglas Ten Sleep Gillette Thermopolis Glenrock Torrington Kaycee Upton LaGrange Weston Midwest Whalen Dam Lander Wheat land Love11 Worland
Group #2 4/15-10/15
Double 4 Rch Ft Washakie Green River Laramie Moorcroft Muddy Gap River ton Rock Springs Sundance Sunshine
Group #3 4/15 - 9/30
Centennial Encampment Evans ton MedicineBow Rawlins Sara toga Seminoe Dam Wamsutter
Group #4 Group #5 4/15 - 9/15 5/1-9/15
Af ton Big Piney Alta L Yellowston Bedford Moran Border Pine dale Dub0 is South Pass Farson Jackson Kemmerer Sage Tower Falls
10
b--
Alfalfa. Alfalfa requires special considerations when developing it's crop coefficients. A methodology for developing alfalfa crop coefficients is given by Jensenet al. (1990). The difference between alfalfa reference ET and alfalfa crop ET is that early in the season when the crop is shorter than the defined reference height, alfalfa reference equations assume the crop is at reference height and estimate ET accordingly. In actuality, the alfalfa crop is shorter than reference and will use something less than alfalfa reference ET. The same is true after harvest of the alfalfa crop. The ASCE method uses alfalfa as the reference crop and assumes an increase in water use in the early season after the initial stage until the coefficient is 1.00 as compared to the alfalfa reference. It stays 1.00 until the first cutting and then drops abruptly, slowly rising until the next cutting but not quite reaching 1.00 again. This trend continues, for any number of cuttings, until the end of the water use season. Thus the mean crop coefficients for alfalfa are adjusted downward from 1.00. The values for alfalfa crop coefficients for alfalfa reference as given by Jensen et al. (1990) assume two mid-season harvests and one late-seasonharvest when the crop becomes dormant in cool weather. In Wyoming, the average is two harvests, with some locations having a third harvest. The curve shape does not change significantly with only two cuttings since the peak of the third section occurs in coincidence with the first average occurrence of 24°F frost in the fall. A smooth curve was fitted through the points of the alfalfa reference alfalfa crop curve, such that the areas above and below the lines were similar. The values of the smooth curve were divided by 0.78 to obtain grass reference alfalfa crop coefficient values as presented by Jensen et a1 (1990). Average monthly grass reference alfalfa crop coefficients adjusted for 2 cuttings and ending 7 to 10 days after the average 24°F frost in the fall were then determined for each of the five location groupings (Table 6 ) . Coefficients are given for the highest locations, Group #5, although alfalfa may not be grown at those locations. However, the intent is for use in lower nearby areas where alfalfa may be grown.
Pasture Grass andGrass Hay. Crop coefficients for pasture grass and grass hay (Table 6 ) were developed based on coefficients used for alfalfa. Jensen et al. (1990) assume a fairly constant crop coefficient during the season of 0.87 €or pasture grass when using an alfalfa reference. For dry, windy conditions, such as Wyoming, FA0 gives a pasture grass crop coefficient of about 0 . 9 5 of mean alfalfa crop Coefficients when using a grass reference, which is the recommendation used herein.
Grass hay, in this document, is assumed to be irrigated under a sprinkler system or a similar non-flooding system and is harvested one time in mid-July to mid-August. Pasture grass is assumed to have the same irrigation management as grass hay except that it is grazed during the season keeping the grass clipped somewhat. The extent of grazing will affect the water use. Since the coefficients are the same for grass hay and pasture grass, it is assumed that the water use given for pasture grass is similar to a grass hay crop having the same average crop height that is cut once during the season. If heavier grazing takes place, the water use by the pasture grass will be lower due to a shorter and less dense crop canopy. On the other hand, if the pasture is not grazed, the average water use w i l l be somewhat higher than for grass hay. If pasture grass or hay is flood irrigated with a high water table, then the water use rates likely will be considerably higher than those given in this document.
11
w
b
'il
Mountain Meadow Hay. High elevation mountain meadow hays in Wyoming are primarily flood irrigated and have high water tables. High water tables are a constant source of irrigation to the root zone and provide higher water use than in areas with low water tables. Mountain meadow crop coefficients (Table 6 ) were developed for grass reference ET directly using lysimeter data from the Green River Basin, Wyoming (Pochop and Burman, 1987) and estimates of clipped grass ET using a locally calibrated FA0 Blaney-Criddle at locations in the Green River Basin where mountain meadow ET data are available.
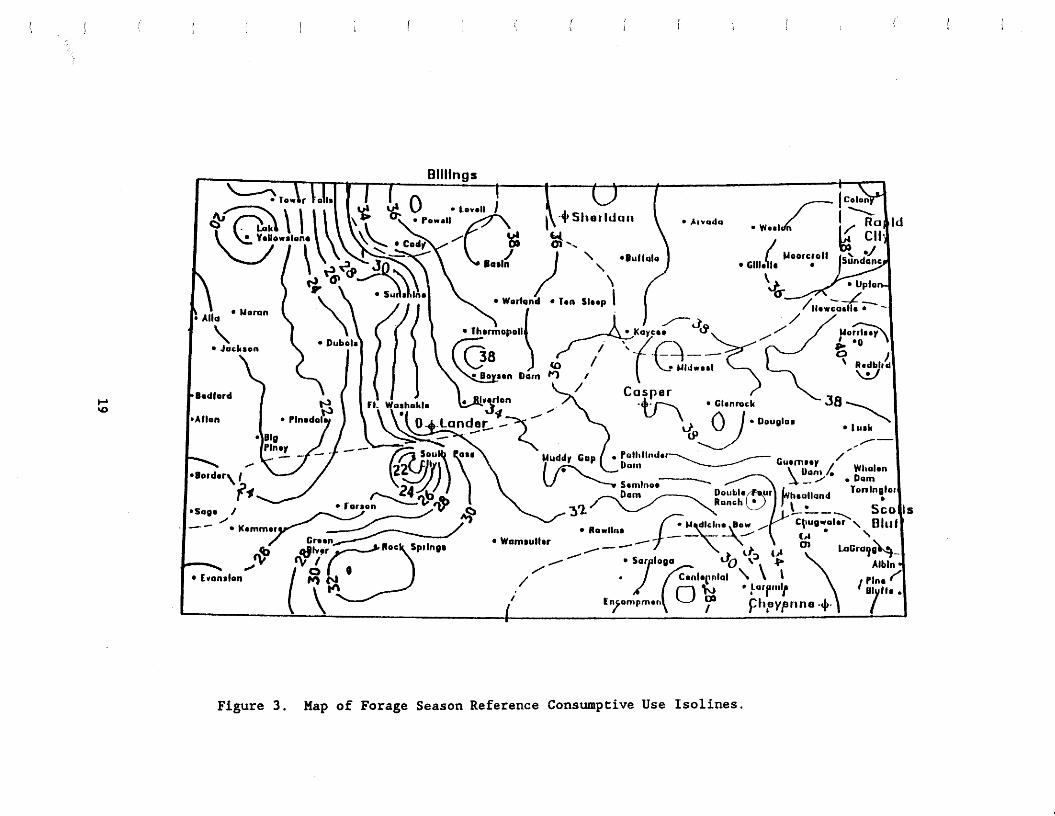
Although all crops are to some extent grown at elevations somewhat different than those for which CU and C I R estimates are given in this document, mountain meadows are sometimes grown at considerable differences in elevation. As elevations increase above those at the locations listed, the growing season decreases and climatic conditions change. Temperatures, for example, normally decrease. Analyses of the average summer-time temperature lapse rate in Wyoming indicated that it is about 6OF and 3OF decrease per 1000 ft of elevation increase for maximum and minimum temperatures, respectively. Using these lapse rates, and assuming similar growing seasons, wind, radiation, and humidity at both the listed locations and at higher elevations, the average decrease in CU for mountain meadows was estimated as about 15% per 1000 ft elevation increase. However, regression analyses performed on CU estimates listed in Table 9 indicate that the CU versus elevation relationship varies greatly depending on location and initial elevation. (The map given as Figure 3 showing isolines of reference ET adjusted for forage growing season lengths provides further guidelines for the spatial variability of CU.) Precipitation differences between locations in mountainous regions differ greatly depending on local conditions. Thus, C I R estimates at locations not listed depend on difficult to define precipitation patterns.
Lawn Grass. Well-watered lawn grass can be defined as a clipped grass never short of water, which matches the definition of a grass reference. Thus the water use of lawn grass and a grass reference should closely match under similar climatic conditions. However, differences in water use do occur due to dissimilarities in the temperatures, wind speeds, and shading effects between residential areas in which lawn grasses are located and the open rural areas for which the grass reference is defined. These differences become less in larger open areas such as parks and golf courses. In addition, lawn grasses do have growth and development stages in early spring and late fall. Thus, consumptive use of lawn grass may be either less than or greater than that of a reference clipped grass crop. Monthly values of measured ET for lawn grass at Laramie and Wheatland, Wyoming (Pochop and Borrelli, 1979) and estimated clipped grass reference ET using the calibrated FA0 Blaney-Criddle grass reference ET equation were used to determine lawn grass consumptive use coefficients for Wyoming (Table 6 )
The consumptive use coefficients for lawn grass peak in June and taper off at the end of the season in August, September, and October. Unlike field crops, where maximum production (yield) is the ultimate goal, it is not a consideration in lawn grass. Rather, the goal is for the grass to be aesthetically pleasing. Barnes et al. (1979) explain that based on the Laramie and Wheatland, Wyoming lawn grass ET data, "an aesthetically pleasing lawn can be achieved with an average application rate equal to or less than the seasonal ET rate. Proper water application, timing, and other lawn care factors must be considered".
12
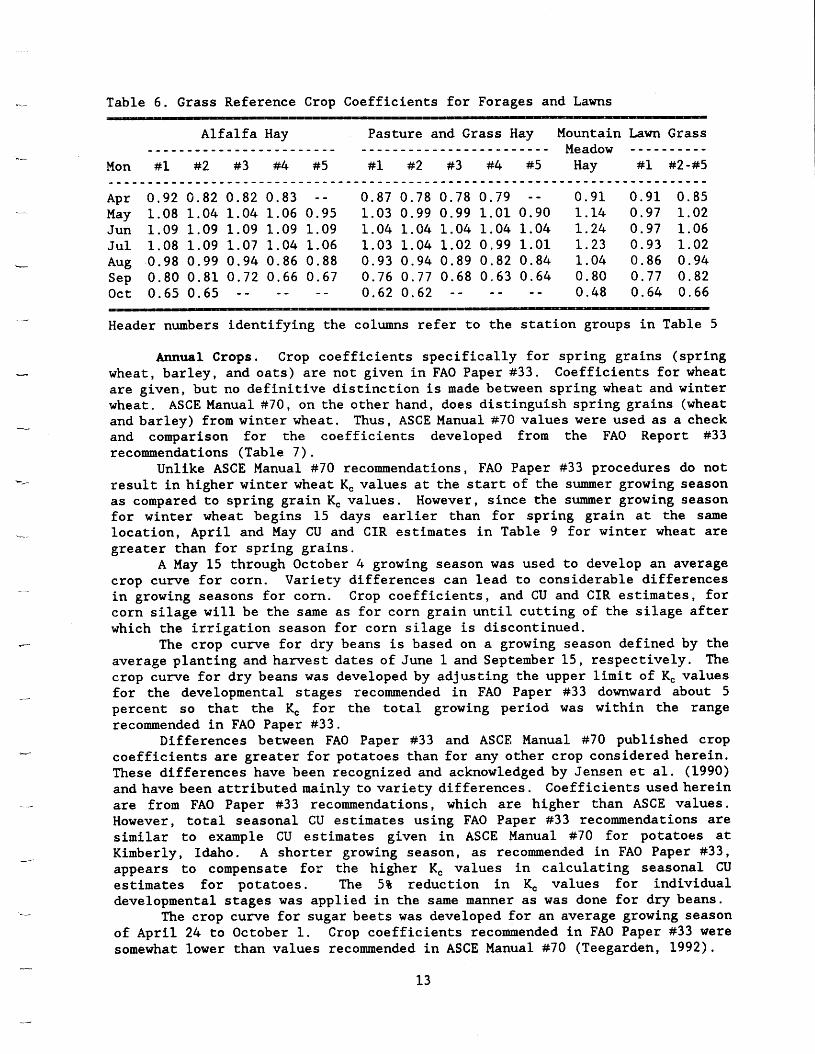
-- Table 6. Grass Reference Crop Coefficients for Forages and Lawns
'c-
Alfalfa Hay Pasture and Grass Hay Mountain Lawn Grass . . . . . . . . . . . . . . . . . . . . . . . . _ _ - - - - - - - - _ _ _ _ - - _ " _ - - - - - Meadow - - - - - - - - - -
Mon #1 #2 #3 #4 #5 #l #2 #3 #4 # S Hay #1 #2-#5 - _ _ _ - _ _ - - _ _ _ - _ _ L - _ - - - - - - - - - - - - - - - - - - - - - - - - - - - - - - - - - - - - - - - - - - " - - - - - " - - - - - - - - -
Apr 0.92 0.82 0.82 0.83 - - 0.87 0.78 0.78 0.79 - - 0.91 0.91 0.85 May 1.08 1.04 1.04 1.06 0.95 1.03 0.99 0.99 1.01 0.90 1.14 0.97 1.02 Jun 1.09 1.09 1.09 1.09 1.09 1.04 1.04 1.04 1.04 1.04 1.24 0.97 1.06 Ju1 1.08 1.09 1.07 1.04 1.06 1.03 1.04 1.02 0.99 1.01 1.23 0.93 1.02 Aug 0.98 0.99 0.94 0.86 0.88 0.93 0.94 0.89 0.82 0.84 1.04 0.86 0.94 Sep 0.80 0.81 0.72 0.66 0.67 0.76 0.77 0.68 0.63 0.64 0.80 0.77 0.82
0.48 0.64 0.66 - - - - 0.62 0.62 - - - - - - Oct 0.65 0.65 - - Header numbers identifying the columns refer to the station groups in Table 5
Annual Crops. Crop coefficients specifically for spring grains (spring wheat, barley, and oats) are not given in FA0 Paper #33. Coefficients for wheat are given, but no definitive distinction is made between spring wheat and winter wheat. ASCE Manual #70, on the other hand, does distinguish spring grains (wheat and barley) from winter wheat, Thus, ASCE Manual #70 values were used as a check and comparison for the coefficients developed from the FA0 Report #33 recommendations (Table 7).
Unlike ASCE Manual #70 recommendations, FA0 Paper #33 procedures do not result in higher winter wheat K, values at the start of the summer growing season as compared to spring grain K, values. However, since the summer growing season for winter wheat begins 15 days earlier than for spring grain at the same location, April and May CU and CIR estimates in Table 9 for winter wheat are greater than for spring grains.
A May 15 through October 4 growing season was used to develop an average crop curve for corn. Variety differences can lead to considerable differences in growing seasons for corn. Crop coefficients, and CU and CIR estimates, for corn silage will be the same as for corn grain until cutting of the silage after which the irrigation season for corn silage is discontinued.
The crop curve for dry beans is based on a growing season defined by the average planting and harvest dates of June 1 and September 15, respectively. The crop curve for dry beans was developed by adjusting the upper limit of K, values for the developmental stages recommended in FA0 Paper #33 downward about 5 percent so that the K, for the total growing period was within the range recommended in FA0 Paper #33.
Differences between FA0 Paper #33 and ASCE Manual #70 published crop coefficients are greater for potatoes than for any other crop considered herein. These differences have been recognized and acknowledged by Jensen et al. (1990) and have been attributed mainly to variety differences. Coefficients usedherein are from FA0 Paper #33 recommendations, which are higher than ASCE values. However, total seasonal CU estimates using FA0 Paper #33 recommendations are similar to example CU estimates given in ASCE Manual #70 for potatoes at Kimberly, Idaho. A shorter growing season, as recommended in FA0 Paper #33, appears to compensate for: the higher K, values in calculating seasonal CU estimates for potatoes. The 5% reduction in K, values for individual developmental stages was applied in the same manner as was done for dry beans.
The crop curve for sugar beets was developed for an average growing season of April 24 to October 1. Crop coefficients recommended in FA0 Paper #33 were somewhat lower than values recommended in ASCE Manual #70 (Teegarden, 1992).
13
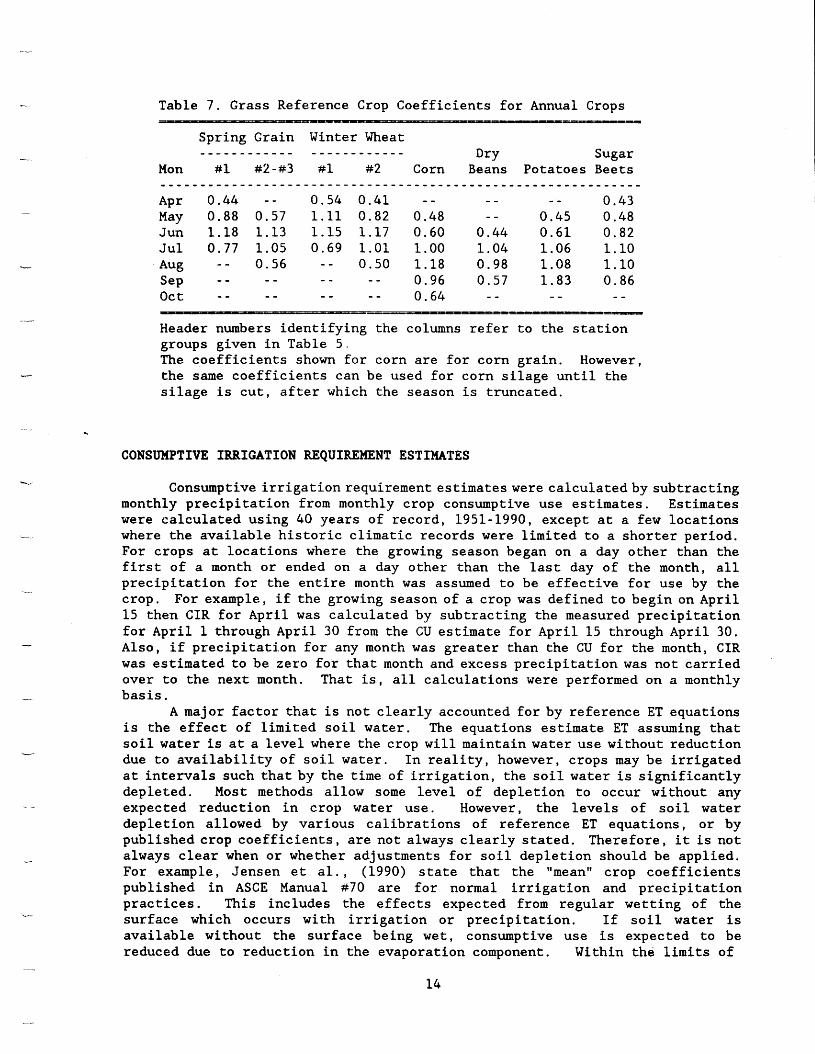
Table 7. Grass Reference Crop Coefficients for Annual Crops
Header numbers identifying the columns refer to the station groups given in Table 5. The coefficients shown for corn are for corn grain. However, the same coefficients can be used for corn silage until the silage is cut, after which the season is truncated.
CONSUMPTIVE IRRIGATION REQUIREMENT ESTIMATES
-.-
c -
-
.-
Consumptive irrigation requirement estimates were calculatedby subtracting monthly precipitation from monthly crop consumptive use estimates. Estimates were calculated using 40 years of record, 1951-1990, except at a few locations where the available historic climatic records were limited to a shorter period. For crops at locations where the growing season began on a day other than the first of a month or ended on a day other than the last day of the month, all precipitation for the entire month was assumed to be effective for use by the crop. For example, if the growing season of a crop was defined to begin on April 15 then CIR for April was calculated by subtracting the measured precipitation for April 1 through April 30 from the CU estimate for April 15 through April 30. Also, if precipitation for any month was greater than the CU for the month, CIR was estimated to be zero for that month and excess precipitation was not carried over to the next month. That is, all calculations were performed on a monthly basis.
A major factor that is not clearly accounted for by reference ET equations is the effect of limited soil water. The equations estimate ET assuming that soil water is at a level where the crop will maintain water use without reduction due to availability of soil water. In reality, however, crops may be irrigated at intervals such that by the time of irrigation, the soil water is significantly depleted. Most methods allow some level of depletion to occur without any expected reduction in crop water use. However, the levels of soil water depletion allowed by various calibrations of reference ET equations, or by published crop coefficients, are not always clearly stated. Therefore, it is not always clear when or whether adjustments for soil depletion should be applied. For example, Jensen et al., (1990) state that the "mean" crop coefficients published in ASCE Manual #70 are for normal irrigation and precipitation practices. This includes the effects expected from regular wetting of the surface which occurs with irrigation or precipitation. If soil water is available without the surface being wet, consumptive use is expected to be reduced due to reduction in the evaporation component. Within the limits of
14
-- present knowledge, if local soil water levels are measured or estimated, methods are available for adjusting CU and CIR estimates to supply more accurate "on- farm" crop water use estimates.
DISCUSSION OF TABLES
R
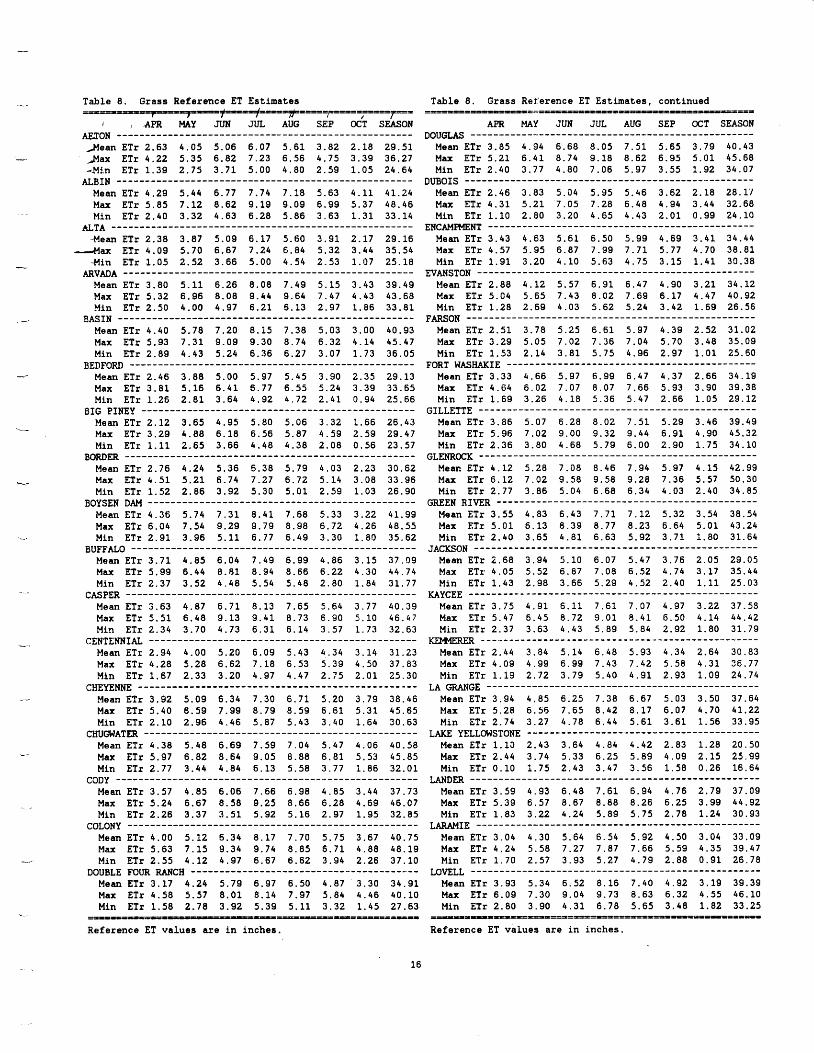
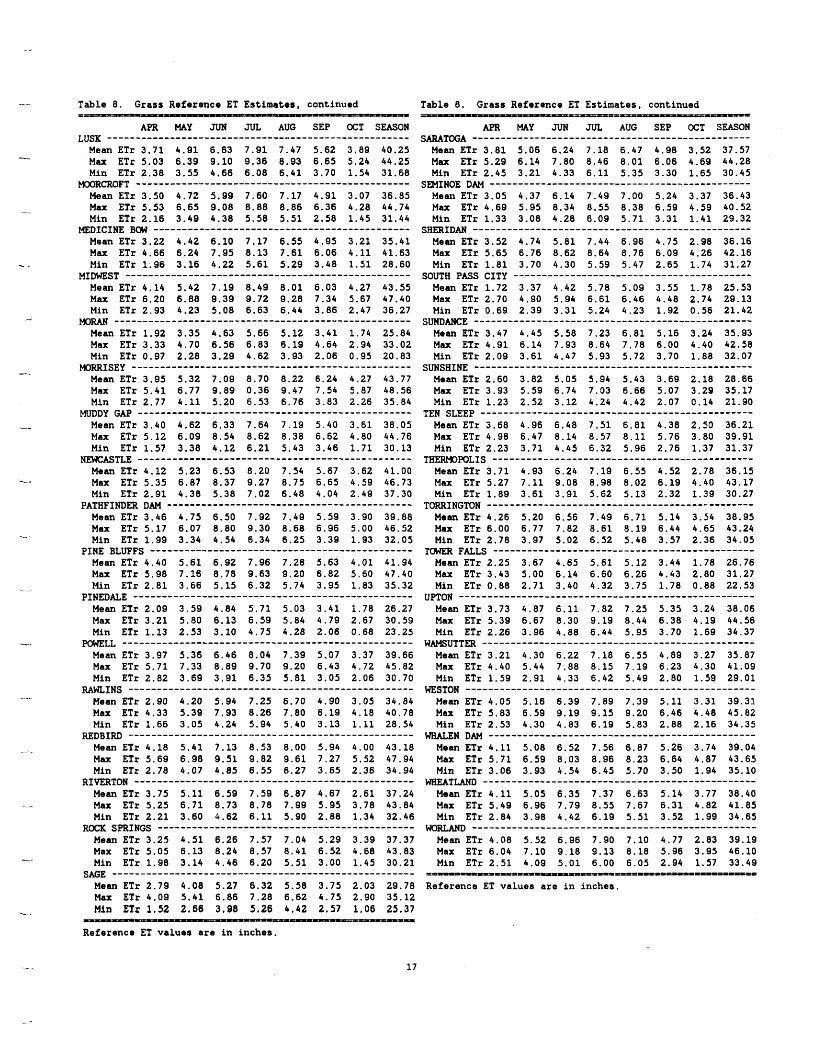
Monthly and seasonal grass reference ET estimates and consumptive use and consumptive irrigation requirement estimates are given at each of 67 locations (Tables 8 and 9). Mean, maximum, and minimum estimates are given for both ETr and CU and CIR. Seasonal values of mean ET,, CU, and CIR are equal to the summation of the monthly mean values shown in the tables. However, seasonal values of maximum and minimum ET,, CU, and CIR are for the years of record with the highest and lowest respective estimates. The maximum and minimum monthly values shown in the tables do not all occur during the year with the maximum or minimum seasonal occurrences. Thus, the seasonal values of maximum and minimum ET,, CU, and CIR are not the summation of the monthly maximum and minimum values shown in the tables.
Effort has been made to provide CU and CIR estimates for all crops grown at each location. However, occasionally a crop may have been overlooked at a specific location. In these cases, estimates of mean CU and CIR may be obtained by using the ETr values of Table 8, the K, values of Tables 6 and/or 7, and the average precipitation values given in Table A1 of the Appendix. These estimates would use long-term averages and, thus, are not as accurate as those presented in Table 9, which were determined based on year-by-year calculations for the period of record (usually 1951-1990).
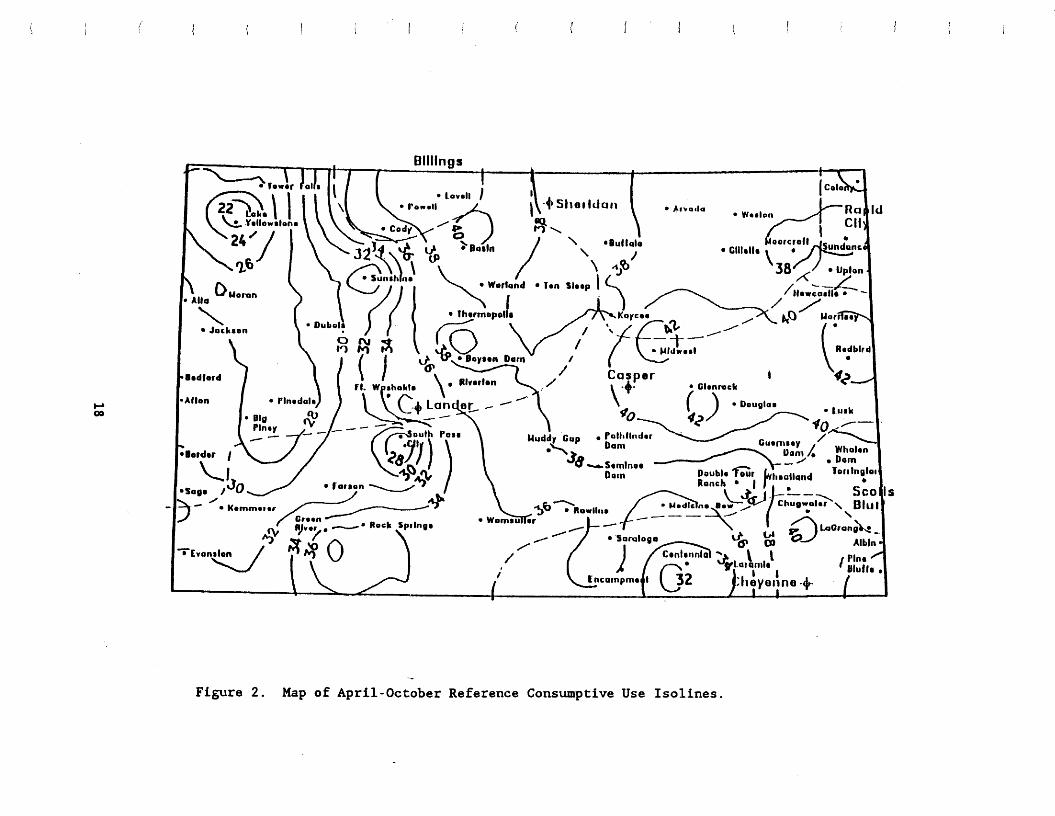
Maps of Wyoming are given showing isolines of estimated April through October ET, (Fig. 2) and estimated ET, (Fig. 3) based on the length of the forage growing season as given for each station in Table 2. Figure 2 may be used to roughly extrapolate seasonal ET, from locations where estimates are given in Table 8 to points without tabulated estimates. Figure 3 provides the same type of information, but adjustments for the length of the forage growing season have been made. This gives a more realistic estimate of local conditions than would be provided by Figure 2. To a lesser degree of accuracy, especially because of precipitation variations in the case of CIR, the same general trends between isolines can be assumed for CU and CIR.
15
d
L-
Table 8. Grass Reference ET Estimates Table 8. Grass Reference ET Estimates, continued -*=-7-====.=- r z : = - = p P - - o = = = - = ~ ~ = ~ = -7-= =--== Jj AUG SEP OC'T SEASON APR MAY JUN JUL AUG SEP OCT SEASON
>can ETr 2.63 4.05 5.06 6.07 5.61 3.82 2.18 29.51 Mean ETr 3.85 4.94 6.68 8.05 7.51 5.65 3.79 40.43 Jax ETr 4.22 5.35 6.82 7.23 6.56 4.75 3.39 36.27 Max ETr 5.21 6.41 8.74 9.18 8.62 6.95 5.01 45.68 -Min ETr 1.39 2.75 3.71 5.00 4.80 2.59 1.05 24.64 Min ETr 2.40 3.77 4.80 7.06 5.97 3.55 1.92 34.07
Mean ETr 4.29 5.44 6.77 7.74 7.18 5.63 4.11 41.24 Mean ETr 2.46 3.83 5.04 5.95 5.46 3.62 2.18 28.11 Max ETr 5.85 7.12 8.62 9.19 9.09 6.99 5.37 48.46 Max ETr 4.31 5.21 7.05 7.28 6.48 4.94 3.44 32.68 Min ETr 2.40 3.32 4.63 6.28 5.86 3.63 1.31 33.14 Min ETr 1.10 2.80 3.20 4.65 4.43 2.01 0.99 24.10
-Mean ETr 2.38 3.87 5.09 6.17 5.60 3.91 2.17 29.16 Mean ETr 3.43 4.63 5.61 6.50 5.99 4.69 3.41 34.44 - U a x ETr 4.09 5.70 6.67 7.24 6.84 5.32 3.44 35.54 Max ETr 4.57 5.95 6.87 7.99 7.71 5.77 4.70 38.81
Min ETr 1.05 2.52 3.66 5.00 4.54 2.53 1.07 25.18 Min ETr 1.91 3.20 4.10 5.63 4.75 3.15 1.41 30.38
Mean ETr 3.80 5.11 6.26 8.08 7.49 5.15 3.43 39.49 Mean ETr 2.88 4.12 5.57 6.91 6.47 4.90 3.21 34.12 Max ETr 5.32 6.96 0.08 9.44 9.64 7.47 4.43 43.60 Max ETr 5.04 5.65 7.43 8.02 7.69 6.17 4.47 40.92 Min ETr 2.50 4.00 4.97 6.21 5.13 2.97 1.86 33.81 Min ETr 1.28 2.69 4.03 5.62 5.24 3.42 1.69 26.56
Mean ETr 4.40 5.78 7.20 8.i5 7.38 5.03 3.00 40.93 Mean ETr 2.51 3.78 5.25 6.61 5.97 4.39 2.52 31.02 Max ETr 5.93 7.31 9.09 9.30 8.74 6.32 4.14 45.47 Max ETr 3.29 5 . 0 5 7.02 7.36 7.04 5.70 3.48 35.09 Min ETr 2.89 4.43 5.24 6.36 6.27 3.07 1.73 36.05 Min ETr 1.53 2.14 3.81 5.75 4.96 2.97 1.01 25.60
Mean ETr 2.46 3.88 5.00 5.97 5.45 3.90 2.35 29.13 Mean ETr 3.33 4.66 5.97 6.99 6.47 4.37 2.66 34.19 Max ETr 3.81 5.16 6.41 6.77 6.55 5.24 3.39 33.65 Max ETr 4.64 6.02 7.07 8.07 7.66 5.93 3.90 39.38 Min ETr 1.26 2.81 3.64 4.92 4.72 2.41 3.94 25.66 Min ETr 1.69 3.26 4.18 5.36 5.47 2.66 1.05 29.12
Mean ETr 2.12 3.65 4.95 5.80 5.06 3.32 1.66 26.43 Mean ETr 3.86 5.07 6.28 8.02 7.51 5.29 3.46 39.49 Max ETr 3.29 4.88 6.18 6.56 5.87 4.59 2.59 29.47 Max ETr 5.96 7.02 9.00 9.32 9.44 6.91 4.90 45.32 Min ETr 1.11 2.65 3.66 4.48 4.38 2.08 0.56 23.57 Min ETr 2.36 3.80 4.68 5.79 6.00 2.90 1.75 34.10
Mean ETr 2.76 4.24 5.36 5.38 5.79 4.03 2.23 30.62 Mean ETr 4.12 5.28 7.08 8.46 7.94 5.97 4.15 42.99 Max ETr 4.51 5.21 6.74 7.27 6.72 5.14 3.08 33.96 Max ETr 6.12 7.02 9.58 9.58 9.28 7.36 5.57 50.30 Min ETr 1.52 2.86 3.92 5.30 5.01 2.59 1.03 26.90 Min ETr 2.77 3.86 5 . 0 4 6.68 6.34 4.03 2.40 34.85
Mean ETr 4.36 5.74 7.31 8.41 7.68 5.33 3.22 41.99 Mean ETr 3.55 4.83 6.43 7.71 7.12 5.32 3.54 38.54 Max ETr 6.04 7.54 9.29 9.79 8.98 6.72 4.26 48.55 Max ETr 5.01 6.13 8.39 8.77 8.23 6.64 5.01 43.24 Min ETr 2.91 3.96 5.11 6.77 6.49 3.30 1.80 35.62 Min ETr 2.40 3.65 4.81 6.63 5.92 3.71 1.80 31.64
Mean ETr 3.71 4.85 6.04 7.49 6.99 4.86 3.15 37.09 Mean ETr 2.68 3.94 5.10 6.07 5.47 3.76 2.05 29.05 Max ETr 5.99 6.44 8.81 8.94 8.66 6.22 4.30 44.74 Max ETr 4.05 5.52 6.87 7.08 6.52 4.74 3.17 35.44 Min ETr 2.37 3.52 4.48 5.54 5.48 2.80 1.84 31.77 Min ETr 1.43 2.98 3.66 5.29 4.52 2.40 1.11 25.03
Mean ETr 3.63 4.87 6.71 8.13 7.65 5.64 3.77 40.39 Mean ETr 3.75 4.91 6.11 7.61 7.07 4.97 3.22 37.58 Max ETr 5.51 6.48 9.13 9.41 8.73 6.90 5.10 46.47 Max ETr 5.47 6.45 8.72 9.01 8.41 6.50 4.14 44.42 Min ETr 2.34 3.70 4.73 6.31 6.14 3.57 1.73 32.63 Min ETr 2.37 3.63 4.43 5.89 5.84 2.92 1.80 31.79
CENTENNIAL ------_---------------------------------------- __----------------------------------------------- Mean ETr 2.94 4.00 5.20 6.09 5.43 4.34 3.14 31.23 Mean ETr 2.44 3.84 5.14 6.48 5.93 4.34 2.64 30.83 Max ETr 4.28 5.28 6.62 7.18 6.53 5.39 4.50 37.83 Max ETr 4.09 4.99 6.99 7.43 7.42 5.58 4.31 36.77 Min ETr 1.67 2.33 3.20 4.97 4.47 2.75 2.01 25.30 Min ETr 1.19 2.72 3.79 5.40 4.91 2.93 1.09 24.74
Mean ETr 3.92 5.09 6.34 7.30 6.71 5.20 3.79 38.46 Mean ETr 3.94 4.85 6.25 7.38 6.67 5.03 3.50 37.64 Max ETr 5.40 6.59 7.99 8.79 8.59 6.61 5.31 45.65 Max ETr 5.28 6.S6 7.65 8.42 8.17 6.07 4.70 41.22 Min ETr 2.10 2.96 4.46 5.87 5.43 3.40 1.64 30.63 Min ETr 2.74 3.27 4.78 6.44 5.61 3.61 1.56 33.95
Mean ETr 4.38 5.48 6.69 7.59 7.04 5.47 4.06 40.58 Mean ETr 1.13 2.43 3.64 4.84 4.42 2.83 1.28 20.50 Max ETr 5.97 6.82 8.64 9.05 8.88 6.81 5.53 45.85 Max ETr 2.44 3.74 5.33 6.25 5.89 4.09 2.15 25.99 Min ETt 2.77 3.44 4.84 6.13 5.50 3.77 1.86 32.01 Min ETr 0.10 1.75 2.43 3.47 3.56 1.58 0.26 16.64
Mean ETr 3.57 4.85 6.06 7.66 6.98 4.85 3.44 37.73 Mean ETr 3.59 4.93 6.48 7.61 6.94 4.76 2.79 37.09 .- Max ETr 5.24 6.67 8.58 9.25 8.66 6.28 4.69 46.07 Max ETr 5.39 6.57 8.67 8.88 8.26 6.25 3.99 44.92
Min ETr 2.26 3.37 3.51 5.92 5.16 2.97 1.95 32.85 Min ETr 1.83 3.22 4.24 5.89 5.75 2.78 1.24 30.93
Mean ETr 4.00 5.12 6.34 8.17 7.70 5.75 3.67 40.75 Mean ETr 3.04 4.30 5.64 6.54 5.92 4.50 3.04 33.09 Max ETr 5.63 7.15 9.34 9.74 8.85 6.71 4.88 48.19 Max ETr 4.24 5.58 7.27 7.87 7.66 5.59 4.35 39.47
-- Min ETr 2.55 4.12 4.97 6.67 6.62 3.94 2.26 37.10 Min ETr 1.70 2.57 3.93 5.27 4.79 2.88 0.91 26.78 DOUBLE FOm RANCH --------------------_________________I__ LOVELL ----------------------.-----------------------------
Mean ETr 3.17 4.24 5.79 6.97 6.50 4.87 3.30 34.91 Mean ETr 3.93 5.34 6.52 8.16 7.40 4.92 3.19 39.39 Max ETr 4.58 5.57 8.01 8.14 7.97 5.84 4.46 40.10 Max ETr 6.09 7.30 9.04 9.73 8.63 6.32 4.55 46.10 Min ETr 1.58 2.78 3.92 5.39 5.11 3.32 1.45 27.63 Min ETr 2.80 3.90 4.31 6.78 5.65 3.48 1.82 33.25
m O N .................................................... DOUGLAS ..................................................
&BIN .................................................... DUBOIS --------------------_____I______________-----------
fiTA ..................................................... ENCAMPMENT ------------------__---------------------------
S v m A ................................................... EVANSTON -------------------------------------------------
BASIN --------------------________I___________------------ F m O N ---------------------------------------------------
BEDFORD -___---------------------------------------------- FORT WASMIE --------------------------------------------
BIG PINEY _----------------------------------------------- GILLETTE -------------------------------------------------
BORDER ................................................... GLENROCK --------------------______I_____________---------
BOYSEN D M ----------------------------------------------- W E N RIVER . . . . . . . . . . . . . . . . . . . . . . . . . . . . . . . . . . . . . . . . . . . . . .
BUFFALO .................................................. J A W O N --------------------______________I_____----------
cmpm --------------------------------------------------- UYCEE ----------------------------.-----------------------
CHEYENNE ------------------------------------------------- LA GRANGE -I----------------------------------------------
C.JUWAT' --------------------l_______________l___-------- LAKE YELLOWSTONE
CODY ----------------------------------------------------- LANDER ---------------------------------------------------
COLONY --------------------------------------------------- L M I E --------------------__________I_________----------
=s8=--- LILl=~===t-~====-======= PPPDlllflllllLI=EePP================--==a-=-~=~===%=~=
Reference ET values are i n inches. Reference ET values are i n inches.
---
16
- Table 8. Grass Reference ET Estimates, continued ==--
APR MAY JUN JUL AUG SEP OCT SEASON
Mean ETr 3.71 4.91 6.63 7.91 7.47 5.62 3.89 40.25 Max ETr 5.03 6.39 9.10 9.36 8.93 6.65 5.24 44.25 Min ETr 2.38 3.55 4.66 6.08 6.41 3.70 i.54 31.68
Mean ETr 3.50 4.72 5.99 7.60 7.17 4.91 3.07 36.85 Max ETr 5.53 6.6s 9.08 8.88 8.86 6.36 4.28 44.74 Min ETr 2.16 3.49 4.38 5.58 5.51 2.58 1.45 31.44
Mean ETr 3.22 4.42 6.10 7.17 6.55 4.95 3.21 35.41 Max ETr 4.66 6.24 7.95 8.13 7.61 6.06 4.11 41.63 Min ETr 1.96 3.16 4.22 5.61 5.29 3.48 1.51 28.60
Mean ETr 4.14 5.42 7.19 8.49 8.01 6.03 4.27 43.55 Max ETr 6.20 6.88 9.39 9.72 9.28 7.34 5.67 47.40 Min ETr 2.93 4.23 5.08 6.63 6.44 3.86 2.47 36.27 m w .................................................... Mean ETr 1.92 3.35 4.63 5.66 5.12 3.41 1.74 25.84 Max ETr 3.33 4.70 6.56 6.83 6.19 4.64 2.94 33.02 Min ETr 0.97 2.28 3.29 4.62 3.93 2.06 0.95 20.83
Mean ETr 3.95 5.32 7.09 8.70 8.22 6.24 4.27 43.77 Max ETr 5.41 6.77 9.89 0.36 9.47 7.54 5.87 48.56 Min ETr 2.77 4.11 5.20 6.53 6.76 3.83 2.26 35.84
- Mean ETr 3.40 4.62 6.33 7.64 7.19 5.40 3.61 38.05 Max ETr 5.12 6.09 8.54 8.62 8.38 6.62 4.80 44.76 Min ETr 1.57 3.38 4.12 6.21 5.43 3.46 1.71 30.13
Mean ETr 4.12 5.23 6.53 8.20 7.54 5.67 3.62 41.00 -c- Max ETr 5.35 6.87 8.37 9.27 8.75 6.65 4.59 46.73
Min ETr 2.91 4.38 5.38 7.02 6.48 4.04 2.49 37.30
Mean ETr 3.46 4.75 6.50 7.92 7.49 5.59 3.90 39.88 Max ETr 5.17 6.07 8.80 9.30 8.68 6.96 5.00 46.52 Min ETr 1.99 3.34 4.54 6.34 6.25 3.39 1.93 32.05
Mean ETr 4.40 5.61 6.92 7.96 7.28 5.63 4.01 41.94 Max ETr 5.98 7.16 8.78 9.63 9.20 6.82 5.60 47.40
- . Min ETr 2.81 3.66 5.15 6.32 5.74 3.95 1.83 35.32
LUSK --------------------__c_________________-------------
W R a O F T ................................................
MEDICINE BOW .............................................
MIDWEST ..................................................
/
MOmISEY .................................................
MUDDY GAp ................................................
NEWCASTLE ----------------I-------------------------------
PATHFINDER DAM -------_-----------------------------------
PINE BLUFFS ..............................................
PINEDUE .................................................
Table 8. Grass Reference ET Estimates, continued -==-Pa== ==-ID
APR MAY JUN JUL AUG SEP OCT SEASON
Mean ETr 3.81 5.06 6.24 7.18 6.47 4.98 3.52 37.57 Max ETr 5.29 6.14 7.80 8.46 8.01 6.06 4.69 44.28 Min ETr 2.45 3.21 4.33 6.11 5.35 3.30 1.65 30.45
Mean ETr 3.05 4.37 6.14 7.49 7.00 5.24 3.37 36.43 Max ETr 4.69 5.95 8.34 8.55 8.38 6.59 4.59 40.52 Min ETr 1.33 3.08 4.28 6.09 5.71 3.31 1.41 29.32
Mean ETr 3.52 4.74 5.81 7.44 6.96 4.75 2.98 36.16 Max ETr 5.65 6.76 8.62 8.64 8.76 6.09 4.26 42.16 Min ETr 1.81 3.70 4.30 5.59 5.47 2.65 1.74 31.27
Mean ETr 1.72 3.37 4.42 5.78 5.09 3.55 1.78 25.53 Max ETr 2.70 4.90 5.94 6.61 6.46 4.48 2.74 29.13 Min ETr 0.69 2.39 3.31 5.24 4.23 1.92 0.56 21.42
Mean ETr 3.47 4.45 5.58 7.23 6.81 5.16 3.24 35.93 Max ETr 4.91 6.14 7.93 8.64 7.78 6.00 4.40 42.58 Min ETr 2.09 3.61 4.47 5.93 5.72 3.70 1.88 32.07
Mean ETr 2.60 3.82 5.05 5.94 5.43 3.69 2.18 28.66 Max ETr 3.93 5.59 6.74 7.03 6.66 5.07 3.29 35.17 Min ETr 1.23 2.52 3.12 4.24 4.42 2.07 0.14 21.90
Mean ETr 3.68 4.96 6.48 7.51 6.81 4.38 2.50 36.21 Max ETr 4.98 6.47 8.14 8.57 8.11 5.76 3.80 39.91 Min ETr 2.23 3.71 4.45 6.32 5.96 2.76 1.37 31.37
Mean ETr 3.71 4.93 6.24 7.19 6.55 4.52 2.78 36.15 Max ETr 5.27 7.11 9.08 8.98 8.02 6.19 4.40 43.17 Min ETr 1.89 3.61 3.91 5.62 5.13 2.32 1.39 30.27
Mean ETr 4.26 5.20 6.56 7.49 6.71 5.14 3.54 38.95 Max ETr 6.00 6.77 7.82 8.61 8.19 6.44 4.65 43.24 Hin ETr 2.78 3.97 5.02 6.52 5.48 3.57 2.36 34.05
Mean ETr 2.25 3.67 4.65 5.61 5.12 3.44 1.78 26.76 Max ETr 3.43 5 . 0 0 6.14 6.60 6.26 4.43 2.80 31.27 Min ETr 0.88 2.71 3.40 4.32 3.75 1.78 0.88 22.53
SARATOGA .................................................
SmINOE DAM ..............................................
SHERIDAN .................................................
SOUTH PASS CITY ..........................................
SUNDANCE .................................................
SUNSHINE .................................................
TEN SLEEP ................................................
T-mLIS ..............................................
TORRINGTON -----_-----------I--__________________c_-------
TOWER FAILS ..............................................
UPTON .................................................... Mean ETr 2.09 3.59 4.84 5.71 5.03 3.41 1.78 26.27 Max ETr 3.21 5.80 6.13 6.59 5.84 4.79 2.67 30.59 Min ETr 1.13 2.53 3.10 4.75 4.28 2.06 0.68 23.25
m L L ................................................... Mean ETr 3.97 5.36 6.46 8.04 7.39 5.07 3.37 39.66 Max ETr 5.71 7.33 8.89 9.70 9.20 6.43 4.72 45.82 Min ETr 2.82 3.69 3.91 6.35 5.81 3.05 2.06 30.70
Mean ETr 2.90 4.20 5.94 7.25 6.70 4.90 3.05 34.84 Max ETr 4.33 5.39 7.93 8.26 7.80 6.19 4.18 40.78 Min ETr 1.66 3.05 4.24 5.94 5.40 3.13 1.11 28.54
-_ Mean ETr 4.18 5.41 7.13 8.53 8.00 5.94 4.00 43.18 Max ETr 5.69 6.98 9.51 9.82 9.61 7.27 5.52 47.94 Min ETr 2.78 4.07 4.85 6.55 6.27 3.65 2.36 34.94
Mean ETr 3.75 5.11 6.59 7.59 6.87 4.67 2.61 37.24 _ _ Max ETr 5.25 6.71 8.73 8.78 7.99 5.95 3.78 43.84
Min ETr 2.21 3.60 4.62 6.11 5.90 2.88 1.34 32.46
Mean ETr 3.25 4.51 6.26 7.57 7.04 5.29 3.39 37.37 Max ETr 5.05 6.13 8.24 8.57 8.41 6.52 4.68 43.83 Min ETr 1.98 3.14 4.46 6.20 5.51 3.00 1.45 30.21
Mean ETr 2.79 4.08 5.27 6.32 5.58 3.75 2.03 29.78 Max ETr 4.09 5.41 6.86 7.28 6.62 4.75 2.90 35.12
\-- Min ETr 1.52 2.66 3.98 5.26 4.42 2.57 1.06 25.37
-.
RAmINS .................................................. _I
REDBIRD --------------------------------------------------
RIVERTON .................................................
ROCK SPRINGS ---------I-----------------------------------
- 7
SAGE .....................................................
I___ . -P -*Dl;t
Reference ET values are in inches.
Mean ETr 3.73 4.87 6.11 7.82 7.25 5.35 3.24 38.06 Max ETr 5.39 6.67 8.30 9.19 8.44 6.38 4.19 44.56 Min ETr 2.26 3.96 4.88 6.44 S.95 3.70 1.69 34.37
Mean ETr 3.21 4.30 6.22 7.18 6.55 4.89 3.27 35.87 Max ETr 4.40 5.44 7.88 8.15 7.19 6.23 4.30 41.09 Min ETr 1.59 2.91 4.33 6.42 5.49 2.80 1.59 29.01
Mean ETr 4.05 5.16 6.39 7.89 7.39 5.11 3.31 39.31 Max ETr 5.83 6.59 9.19 9.15 9.20 6.46 4.48 45.82 Min ETr 2.53 4.30 4.83 6.19 5.83 2.88 2.16 34.35
Mean ETr 4.11 5.08 6.52 7.56 6.87 5.26 3.74 39.04 Max ETr 5.71 6.59 8.03 8.96 8.23 6.64 4.87 43.65 Min ETr 3.06 3.93 4.54 6.45 5.70 3.50 1.94 35.10
Mean ETr 4.11 5 . 0 5 6.35 7.37 6.63 5.14 3.77 38.40 Max ETr 5.49 6.96 7.79 8.55 7.67 6.31 4.82 41.85 Min ETr 2.84 3.98 4.42 6.19 5.51 3.52 1.99 34.65
Mean ETr 4.08 5.52 6.96 7.90 7.10 4.77 2.83 39.19 Max ETr 6.04 7.10 9.18 9.13 8.18 5.96 3.95 46.10 Min ETr 2.51 4.09 5.01 6.00 6.05 2.94 1.57 33.49
WMUTTER ---I--------------------------------------------
WESTON --------------------__I_________________-----------
W E N DAM -I---------------------------------------------
WEATLAND ................................................
W O m D ..................................................
17
I i I I i I J
J
.- Figure 2. Map of April-October Reference Consumptive Use Isolines.
I !, I L ! I i,
f
i I I i’ I
Figure 3 . Map of Forage Season Reference Consumptive U s e Isolines.
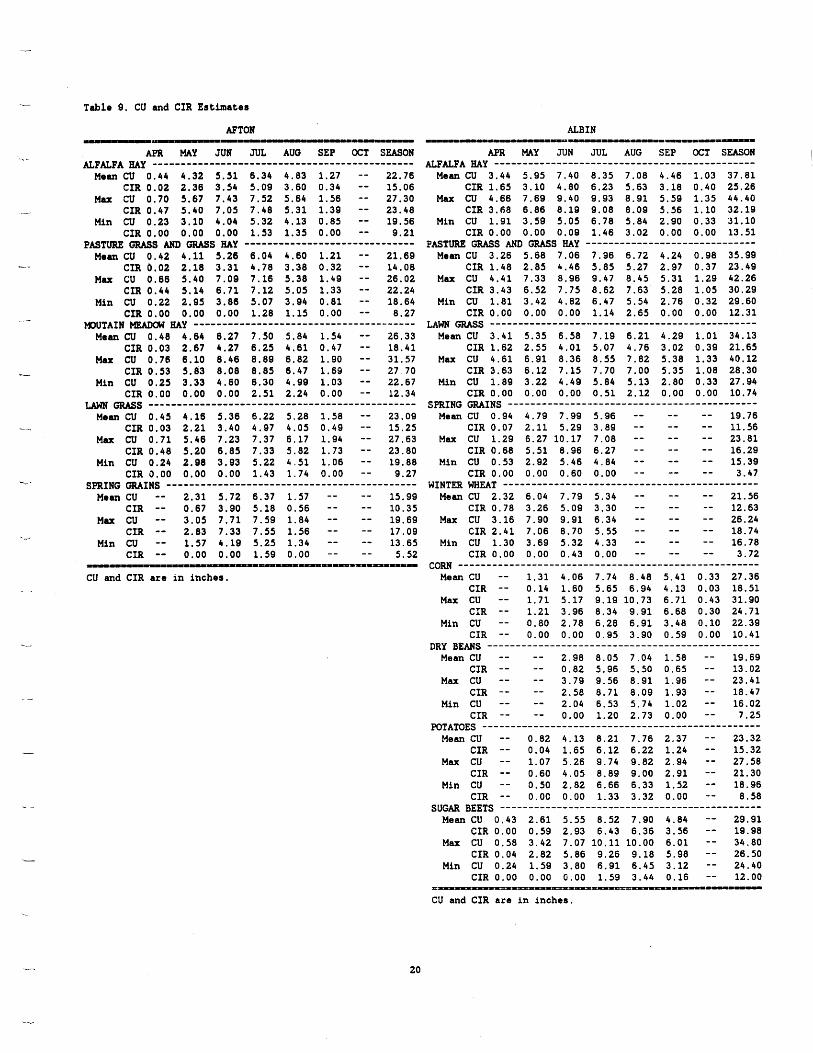
Table 9. CU and CIR Estimates
AFTON ALBIN
-4
_I__-__________ ~
APR MAY JUN JUL AUG SEP OCT SEASON
Mean CU 0.44 4.32 5.51 6.34 4.83 1.27 -- 22.76 CIR 0.02 2.36 3.54 5.09 3.60 0.34 -- 15.06
M a x CU 0.70 5.67 7.43 7.52 5.64 1.56 -- 27.30 CIR 0.47 5.40 7.05 7.48 5.31 1.39 -- 23.48
Min CU 0.23 3.10 4.04 5.32 4.13 0.85 -- 19.56 CIR 0.00 0.00 0.00 1.53 1.35 0.00 -- 9.21
Mean CU 0.42 4.11 5.26 6.04 4.60 1.21 -- 21.69 CIR 0.02 2.18 3.31 4.78 3.38 0.32 -- 14.08
Max CU 0.66 5.40 7.09 7.16 5.38 1.49 -- 26.02 CIR 0.44 5.14 6.71 7.12 5.05 1.33 -- 22.24
Min CU 0.22 2.95 3.86 5.07 3.94 0.81 -- 18.64 CIR 0.00 0.00 0.00 1.28 1.15 0.00 -- 8.27
Mean CU 0.48 4.64 6.27 7.50 5.84 1.54 -- 26.33 CIR 0.03 2.67 4.27 6.25 4.61 0.47 -- 18.41
Max CU 0.76 6.10 8.46 8.89 6.82 1.90 -- 31.57 CIR 0.53 5.83 8.08 8.85 6.47 1.69 -- 27 70
Min CU 0.25 3.33 4.60 6.30 4.99 1.03 -- 22.67 CIR 0.00 0.00 0.00 2.51 2.24 0.00 -- 12.34 urn U S __--__---____-------_______I____________-------
Mean CU 0.45 4.16 5.36 6.22 5.28 1.58 -- 23.09 c- CIR 0.03 2.21 3.40 4.97 4.05 0.49 -- 15.25
Max CU 0.71 5.46 7.23 7.37 6.17 1.94 -- 27.63 CIR 0.48 5.20 6.85 7.33 5.82 1.73 -- 23.80
Min CU 0.24 2.98 3.93 5.22 4.51 1.06 -- 19.88 CIR 0.00 0.00 0.00 1.43 1.74 0.00 -- 9.27
Mean CU -- 2.31 5.72 6.37 1.57 -- -- 15.99 CIR -- 0.67 3.90 5.18 0.56 -- -- 10.35
Max CU -- 3 . 0 5 7.71 7.59 1.84 -- -- 19.69 CIR -- 2.83 7.33 7.55 1.56 -- -- 17.09
Min CU -- 1.57 4.19 5.25 1.34 -- -- 13.65 CIR -- 0.00 0.00 1.59 0.00 -- -- 5.52
ALFALFA my ..............................................
PASTURE U S AND GRASS my ..............................
m(JTAIN MEADOW my _-------_----_--_----------------------
SPRING GRAINS --__--_-I----------------------------------- 'i-
CU and CIR are in inches.
APR MAY JUN JUL AUG SEP OCT SEASON
Mean CU 3.44 5.95 7.40 8.35 7.08 4.46 1.03 37.81 CIR 1.65 3.10 4.80 6.23 5.63 3.18 0.40 25.26
CIR 3.65 6.86 8.19 9.08 8.09 5.56 1.10 32.19 Min CU 1.91 3.59 5.05 6.78 5.84 2.90 0.33 31.10
CIR 0.00 0.00 0.09 1.46 3.02 0.00 0.00 13.51
Mean CU 3.26 5.68 7.06 7.96 6.72 4.24 0.98 35.99 CIR 1.48 2.85 4.46 5.85 5.27 2.97 0.37 23.49
Max CU 4.41 7.33 8.96 9.47 8.45 5.31 1.29 42.26 CIR 3.43 6.52 7.75 8.62 7.63 5.28 1.05 30.29
Min CU 1.81 3.42 4.82 6.47 5.54 2.76 0.32 29.60 CIR 0.00 0.00 0.00 1.14 2.65 0.00 0.00 12.31
GRASS ............................................... Mean CU 3.41 5 . 3 5 6.58 7.19 6.21 4.29 1.01 34.13
CIR 1.62 2.55 4.01 5.07 4.76 3.02 0.39 21.65 Max CU 4.61 6.91 8.36 8.55 7.82 5.38 1.33 40.12
CIR 3.63 6.12 7.15 7.70 7.00 5.35 1.08 28.30 Min CU 1.89 3.22 4.49 5.84 5.13 2.80 0.33 27.94
CIR 0.00 0.00 0.00 0.51 2.12 0.00 0.00 10.74
Mean CU 0.94 4.79 7.99 5.96 -- -- -- 19.76 CIR 0.07 2.11 5.29 3.89 -- -- -- 11.56
Max CU 1.29 6.27 10.17 7.08 -- -- -- 23.81 CIR 0.68 5.51 8.96 6.27 -- -- -- 16.29
Min CU 0.53 2.92 5.46 4.84 -- -- -- 15.39 CIR 0.00 0.00 0.60 0.00 -- -- -- 3.47
Mean CU 2.32 6.04 7.79 5.34 -- -- -- 21.56 CIR 0.78 3.26 5.09 3.30 -- -- -- 12.63
Max CU 3.16 7.90 9.91 6.34 -- -- -- 26.24 CIR 2.41 7.06 8.70 5.55 -- -- -- 18.74
Min CU 1.30 3.69 5.32 4.33 -- -- -- 16.78 CIR 0.00 0.00 0.43 0.00 -- -- -- 3.72
CORN --------------------_______________o____-------------
Mean CU -- 1.31 4.06 7.74 8.48 5.41 0.33 27.36 CIR -- 0.14 1.60 5.65 6.94 4.13 0.03 18.51
Max CU -- 1.71 5.17 9.19 10.73 6.71 0.43 31.90 CIR -- 1.21 3.96 8.34 9.91 6.68 0.30 24.71
Min CU -- 0 . 8 0 2.78 6.28 6.91 3.48 0.10 22.39 CIR -- 0.00 0.00 0.95 3.90 0.59 0.00 10.41
Mean CU -- -- 2.98 8.05 7.04 1.58 -- 19.69 CIR -- -- 0.82 5.96 5.50 0.65 -- 13.02
Max CU -- -- 3.79 9.56 8.91 1.96 -- 23.41 CIR -- -- 2.58 8.71 8.09 1.93 - - 18.47
Min CU -- -- 2.04 6.53 5.74 1.02 -- 16.02 CIR -- -- 0.00 1.20 2.73 0.00 -- 7.25
Mean CU -- 0.82 4.13 8.21 7.76 2.37 -- 23.32 CIR -- 0.04 1.65 6.12 6.22 1.24 -- 15.32
Max CU -- 1.07 5.26 9.74 9.82 2.94 -- 27.58 CIR -- 0.60 4.05 8.89 9.00 2.91 -- 21.30
Min CU -- 0 . 5 0 2.82 6.66 6.33 1.52 -- 18.96 CIR -- 0.00 0.00 1.33 3.32 0.00 -- 8.58
Mean CU 0.43 2.61 5.55 8.52 7.90 4.84 -- 29.91 CIR 0.00 0.59 2.93 6.43 6.36 3.56 -- 19.98
Max CU 0.58 3.42 7.07 10.11 10.00 6.01 -- 34.80 CIR 0.04 2.82 5.86 9.26 9.18 5.98 -- 26.50
Min CU 0.24 1.59 3.80 6.91 6.45 3.12 -- 24.40 CIR 0.00 0.00 0.00 1.59 3.44 0.16 -- 12.00
ALFALFA my ..............................................
MU cu 4.66 7.69 9.40 9.93 8.91 5.59 1.35 44.40
PASTURE GRASS AND my ..............................
SPRING GRAINS ............................................
WINTER WHEAT ---------------------------------------------
DRY BEANS ................................................
POTATOES .................................................
SUGAR BEETS -----I----------------------------------------
* 1 - - ~ 1 t i ~ - ~ - ~ ~ ~ ~ ~ n ~ % % % n - ~ ~ -
CU and CIR are in inches.
20

Table 9. CU and CIR Estimates. continued c..
ALTA =------- . . . . . . . . . . . . . . . . . . . . . . . . . . .
APR MAY JUN JUL AUG SEP OCT SEASON
Mean CU 0.26 4.13 5.61 6.38 4.84 2.45 -- 23.70 CIR 0.00 1.59 3.40 5.05 3.36 1.07 -- 14.44
Max CU 0.45 6.04 7.27 7.53 5.88 3.39 -- 28.00 CIR 0.00 5.40 7.16 7.43 5.37 3.04 -- 23.06
Min CU 0.12 2.67 3.99 5.20 3.90 1.62 -- 21.05 CIR 0.00 0.00 0.00 1.84 0.00 0.00 - - 7.82
Mean CU 0.25 3.93 5.35 6.07 4.62 2.34 -- 22.59 - CIR 0.00 1.43 3.15 4.74 3.14 0.99 -- 13.44 Max CU 0.43 5.76 6.94 7.17 5.61 3.24 -- 26.69
CIR 0.00 5.12 6.83 7.07 5.11 2.30 -- 21.78 Min CU 0.11 2.55 3.81 4.95 3.72 1.54 -- 20.06
CIR 0.00 0.GO 0.00 1.58 0.00 0.00 -- 6.93
Mean CU 0.29 4.44 6.38 7.54 5.85 2.97 -- 27.51 CIR 0.00 1.84 4.14 6.21 4.35 1.43 -- 17.96
Max CU 0.49 6.50 8.27 8.91 7.11 4.11 -- 32.48 - CIR 0.00 5.84 8.16 8.81 6.57 3.69 -- 27.52
Min CU 0.13 2.87 4.54 6.15 4.72 1.96 -- 24.54 CIR 0.00 0.00 0.00 2.84 0.11 0.00 -- 10.81
urn GRASS ---_----------------_____^______________-------
Mean CU 0.27 3.97 5.46 6.25 5.29 3.05 -- 24.32 1 CIR 0.00 1.47 3.25 4.92 3.80 1.49 -- 14.91
Max CU 0.46 5.81 7.07 7.38 6.43 4.21 -- 28.62 CIR 0.00 5.18 6.96 7.28 5.90 3.78 -- 23.68
Min CU 0.12 2.57 3.88 5.10 4.27 2.01 -- 21.68 CIR 0.00 0.00 0.00 1.74 0.00 0.00 -- 7.90
Mean CU -- 2.21 5.76 6.48 1.57 -- -- 16.01 CIR -- 0.37 3.56 5.20 0.45 -- -- 9.52
M a x CU -- 3.25 7.54 7.60 1.92 -- -- 19.49 CIR -- 2.71 7.43 7.50 1.63 -- -- 16.46
Min CU -- 1.44 4.14 5.25 1.27 -- -- 14,06 CIR -- 0.00 0.00 1.89 0.00 -- -- 5..16
ALFALFA my --___-I---------------------------------------
--
PASTURE GRASS AND GRASS HAY ------------------------------
MOUTAIN mow HAY --------------------______________I____
/
SPRING W I N S -------------------------------------------- L/.
-DI. , I - - - ~ l ~ ~ = ~ ~ ~ = = ~ = a = = ~ = = = = = = = ~ = ~ =
--
CU and CIR are i n inches.
ARVADA ====~---~=--.-----==~====---1=-=rr====-~=-~-
APR MAY JUN JUL AUG SEP OCT SEASON
Mean CU 3.25 5.55 6.93 8.74 7.42 4.09 0.72 36.93 CIR 1.92 3.67 4.24 7.67 6.63 3.18 0.18 27.66
Max CU 4.57 7.52 8.81 10.20 9.45 5.98 0.93 40.77 CIR 3.80 6.68 8.27 10.02 9.16 5.09 0.92 35.39
Min CU 2.42 4.56 5.68 6.71 6.01 2.38 0.39 32.95 CIR 0.47 1.11 1.09 3.44 2.92 0.92 0.00 19.43
Mean CU 3 . 0 8 5.29 6.61 8.33 7.04 3.89 0.69 35.14 CIR 1.74 3.41 3.92 7.26 6.26 2.98 0.16 25.89
Max CU 4.32 7.17 8.40 9.72 8.97 5.68 0.89 38.81 CIR 3.57 6.33 7.86 9.55 8.68 4.83 0.87 33.43
Min CU 2.29 4.35 5.42 6.40 5.70 2.26 0.37 31.36 CIR 0.32 0.84 0.81 3.13 2.61 0.80 0.00 17.83
Mean CU 3.22 4.98 6.17 7.52 6.51 3.94 0.71 33.26 CIR 1.88 3.10 3.48 6.46 5.72 3.03 0.17 23.99
Max CU 4.52 6.75 7.84 8.78 8.29 5.75 0.92 36.74 CIR 3.76 5.91 7.30 8.61 8.00 4.89 0.90 31.36
Min CU 2.39 4.09 5.05 5.78 5.27 2.29 0.38 29.64
ALFALFA HAY _--__---------I-------------------------------
PASTURE GRASS AND GRASS HAY ------I-----------------------
urn GRASS -----------------------------------------------
CIR 0.44 0.50 0.41 2.51 2.18 0.83 0.00 16.11 SPRING GRAINS . . . . . . . . . . . . . . . . . . . . . . . . . . . . . . . . . . . . . . . . . . . .
Mean CU 0.84 4.49 7.39 6.22 -- -- -- 18.94 CIR 0.17 2.60 4.84 5 . 0 8 -- -- -- 12.70
Max CU 1.17 6.12 9.53 7.27 -- -- -- 21.24 CIR. 1.13 5.28 8.99 7.11 -- -- -- 18.85
Min CU 0.55 3.52 5.86 4.78 -- -- -- 16.97 CIR 0.00 0.01 1.60 1.51 -- -- -- 6.61
Mean CU 2 . 0 5 5.67 7.20 5.57 -- -- -- 20. SO CIR 0.95 3.78 4.65 4.44 -- -- -- 13.83
Max CU 2.87 7.73 9.29 6.51 -- -- -- 22.89 CIR 2.79 6.89 8.75 6.36 -- -- -- 19.77
Min CU 1.35 4.44 5.72 4.28 -- -- -- 18.03 CIR 0.00 1.28 1.43 1.01 -- -- -- 8.55
CORN . . . . . . . . . . . . . . . . . . . . . . . . . . . . . . . . . . . . . . . . . . . . . . . . . . . . . Mean CU -- 1.23 3.76 8.08 8.83 4.95 0.27 27.27
CIR -- 0.22 1.48 6.94 8.02 4.06 0.03 20.91 1.67 4.85 9.44 11.38 7.17 0.35 30.91 Max CU --
CIR -- 1.17 4.31 9.27 11.09 6.14 0.35 27.24 Min CU -- 0.96 2.98 6.21 7.23 2.85 0.15 23.43
CIR -- 0.00 0.00 2.94 4.15 1.39 0.00 13.60
WINTER WHEAT _____-----__--__---_-------------------------
5=-I--ll=='lt=--X=========--===-~=====~~==~~-- -- CU and CIR are i n inches.
21
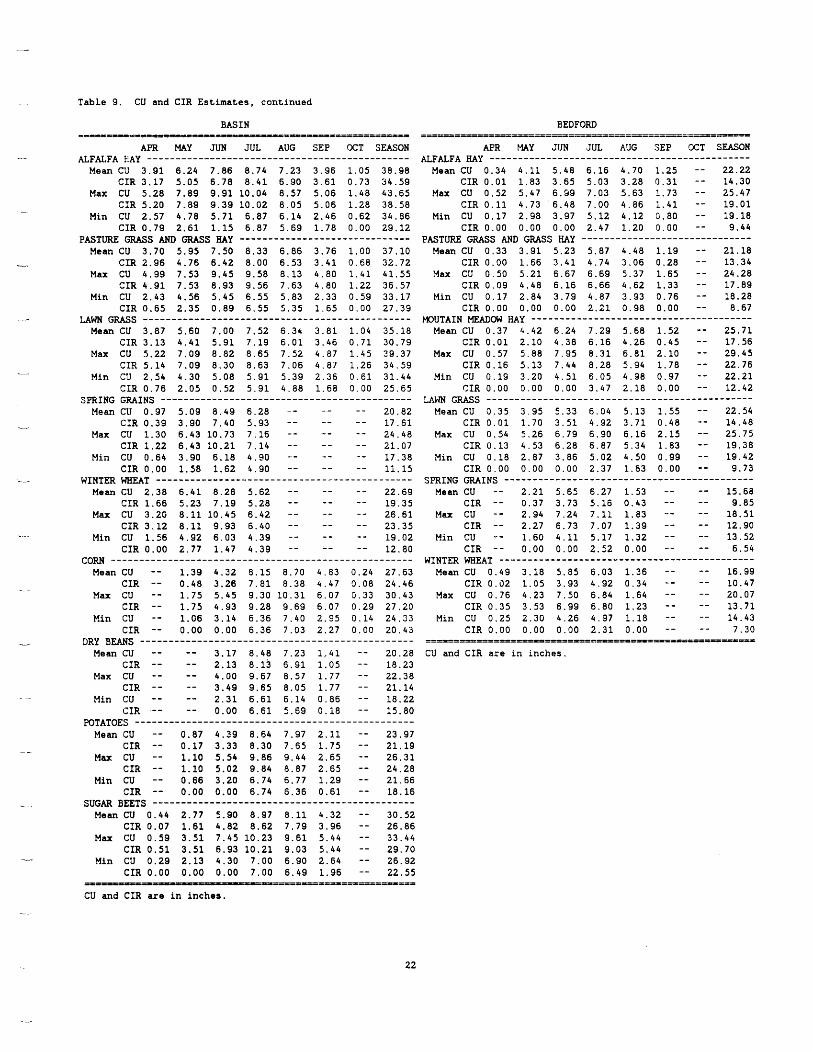
Table 9. CU and CIR Estimates, continued
.--
Y
-.
BASIN BEDFORD __-- ------=E====I--=P-I- I --------===== ===i-=I====I======3.=========3=================~=~~
APR MAY JUN JUL AUG SEP GCT SEASON APR t4AY J U N JUL AUG SEP K T SEASON ALFALFA fi.iy ________------------__________I_________------ ALFALFA m y --------------------_____________II_____------
Mean CU 3.91 6.24 7.86 8.74 7.23 3.96 1.05 38.98 Mean CU 0.34 4.li 5.48 6.16 4.70 1.25 -- 22.22 CIR 3.17 5.05 6.78 8.41 6.90 3.61 0.73 34.59 CIR 0.01 1.83 3.65 5.03 3.28 0.31 -- 14.30
Max CU 5.28 7.89 9.91 10.04 8.57 5.06 1.48 43.65 Max CU 0.52 5.47 6.99 7.03 5.63 1.73 -- 25.47 CIR 5.20 7.89 9.39 10.02 8.05 5.06 1.28 38.58 CIR 0.11 4.73 6.48 7.00 4.86 1.41 -- 19.01
Min CU 2.57 4.78 5.71 6.87 6.14 2.46 0.62 34.86 Min CU 0.17 2.98 3.97 5.12 4.12 0.80 -- 19.18 CIR 0.79 2.61 1.15 6.87 5.69 1.78 0.00 29.12 CIR 0.00 0.00 0.00 2.47 1.20 0.00 -- 9.44
Mean CU 3.70 5.95 7.50 8.33 6.86 3.76 1.00 37.10 Hean CU 0.33 3.91 5.23 5.87 4.48 1.19 -- 21.18 CIR 2.96 4.76 6.42 8.00 6.53 3.41 0.68 32.72 CIR 0.00 1.66 3.41 4.74 3.06 0.28 -- 13.34
Max CU 4.99 7.53 9.45 9.58 8.13 4.80 1.41 41.55 Max CU 0.50 5.21 6.67 6.69 5.37 1.65 -- 24.28 CIR 4.91 7.53 8.93 9.56 7.63 4.80 1.22 36.57 CIR 0.09 4.48 6.16 6.66 4.62 1.33 -- 17.89
Min CU 2.43 4.56 5.45 6.55 5.83 2.33 0.59 33.17 Min CU 0.17 2.84 3.79 4.07 3.93 0.76 -- 18.28 CIR 0.65 2.35 0.89 6.55 5.35 1.65 0.00 27.39 CIR 0.00 0.00 0.00 2.21 0.98 0.00 -- 8.67
Mean CU 3.87 5.60 7.00 7.52 6.34 3.81 1.04 35.18 Mean CU 0.37 4.42 6.24 7.29 5.68 1.52 -- 25.71 CIR 3.13 4.41 5.91 7.19 6.01 3.46 0.71 30.79 CIR 0.01 2.10 4.38 6.16 4.26 0.45 -- 17-56
Max CU 5.22 7.09 8.82 8.65 7.52 4.87 1.45 39.37 Max CU 0.57 5.88 7.95 8.31 6.81 2.10 -- 29.45 CXR 5.14 7.09 8.30 8.63 7.06 4.87 1.26 34.59 CIR 0.16 5.13 7.44 8.28 5.94 1.78 -- 22.76
Min CU 2.54 4.30 5.08 5.91 5.39 2.36 0.61 31.44 Min CU 0.19 3.20 4.51 6.05 4.98 0.97 -- 22.21 CIR 0.76 2.05 0.52 5.91 4.88 1.68 0.00 25.65 CIR 0.00 0.00 0.00 3.47 2.18 0.00 *- 12.42
Mean CU 0.97 5.09 8.49 6.28 -- -- -- 20.82 Mean CU 0.35 3.95 5.33 6.04 5.13 1.55 -- 22.54 CIR 0.39 3.90 7.40 5.93 -- -- - - 17.61 CIR 0.01 1.70 3.51 4.92 3.71 0.48 -- 14.48
Max CU 1.30 6.43 10.73 7.16 -- -- -- 24.48 Max CU 0.54 5.26 6.79 6.90 6.16 2.15 -- 25.75 CIR 1.22 6.43 10.21 7.14 -- - - -- 21.07 CIR 0.13 4.53 6.28 6.87 5.34 1.83 -- 19.38
Min CU 0.64 3.90 6.18 4.90 -- -- -- 17.38 Min CU 0.18 2.87 3.86 5.02 4.50 0.99 -- 19.42 CIR 0.00 1.58 1.62 4.90 -- -- -- 11.15 CIR 0.00 0.00 0.00 2.37 1.63 0.00 -- 9.73
Mean CU 2.38 6.41 8.28 5.62 -- -- - - 22.69 Mean CU -- 2.21 5.65 6.27 1.53 -- -- 15.68 CIR 1.66 5.23 7.19 5.28 -- - - -- 19.35 CIR -- 0.37 3.73 5.16 0.43 -- -- 9.85
Max CU 3.20 8.11 10.45 6.42 -- -- -- 26.61 Max CU -- 2.94 7.24 7.11 1.83 -- -- 18.51 CIR 3.12 8.11 9.93 6.40 -- -- -- 23.35 CIR -- 2.27 6.73 7.07 1.39 -- -- 12.90
Min CU 1.56 4.92 6.03 4.39 -- -- -- 19.02 Min CU -- 1.60 4.11 5.17 1.32 -- -- 13.52 CIR 0.00 2.77 1.47 4.39 - - -- -- 12.80 CIR - - 0.00 0.00 2.52 0.00 -- -- 6.54
Mean CU -- 1.39 4.32 8.15 8.70 4.83 0.24 27.63 Mean CU 0.49 3.18 5.85 6.03 1.36 -- -- 16.99 CIR -- 0.48 3.26 7.81 8.38 4.47 9.08 24.46 CIR 0.02 1.05 3.93 4.92 0.34 -- -- 10.47
20.07 Max CU -- 1.75 5.45 9.30 10.31 6.07 0.33 30.43 Max CU 0.76 4.23 7.50 6.84 1.64 -- -- CIR -- 1.75 4.93 9.28 9.69 6.07 0.29 27.20 CIR 0.35 3.53 6.99 6.80 1.23 -- -- 13.71
Min CU -- 1.06 3.14 6.36 7.40 2.95 0.14 24.33 Min CU 0.25 2.30 4.26 4.97 1.18 -- -- 14.43 CIR -- 0.00 0.00 6.36 7.03 2.27 0.00 20.43 CIR 0.00 0.00 0.00 2.31 0.00 -- -- 7.30
PASTURE GRASS AND GRASS m y .............................. PASTURE GRASS AND GRASS HAY _---_--------_----------------
LAWN GRASS ______----------------------------------------- MUTAIN MJ77OW HAY .......................................
SPRING W I N S -I------------------------------------------ LAW GRASS ____________________---------------------------
WINTER -T ---------------.------------------------------ SPRING GRAINS --------------------------------------------
CORN . . . . . . . . . . . . . . . . . . . . . . . . . . . . . . . . . . . . . . . . . . . . . . . . . . . . . WINTER WHEAT . . . . . . . . . . . . . . . . . . . . . . . . . . . . . . . . . . . . . . . . . . . . .
DRY BEANS ------------------------------------------------ . . . . . . . . . . . . . . . . . . . . . . . . . . . . . . . . . . . . . . . . . . . . . . . . . . . . . . Mean CU -- -- 3.17 8.40 7.23 1.41 -- 20.28 CU and CIR are i n inches.
CIR -- -- 2.13 8.13 6.91 1.05 -- 18.23 Max CU -- -- 4.00 9.67 8.57 1.77 -- 22.38
CIR -- -- 3.49 9.65 8.05 1.77 21.14 Min CU -- -- 2.31 6.61 6.14 0.06 - - 18.22
0.00 6.61 5.59 0.18 -- 15.80
Mean CU -- 0.87 4.39 8.64 7.97 2.3.1 -- 23.97 CIR -- 0.17 3.33 8.30 7.65 1.75 -- 21.19
Max CU -- 1.10 5.54 9.86 9.44 2.65 -- 26.31 CIR -- 1-10 5.02 9.84 0.87 2.55 -- 24.28
Min CU -- 0 . 6 6 3.20 6.74 6.77 1.29 -- 21,66 CIR -- 0.00 0.00 6.74 6.36 0.61 -- 18.16
Mean CU 0.44 2.77 5.90 8.97 8.11 4.32 -- 30.52 CIR 0.07 1.61 4.82 8.62 7.79 3.96 -- 26.86
Max CU 0.59 3.51 7.45 10.23 9.61 5.44 -- 33.44 CIR 0.51 3.51 6.93 10.21 9.03 5.44 -- 29.70
Min CU 0.29 2.13 4.30 7.00 6.90 2.64 -- 26.92 CIR 0.00 0.00 0.00 7.00 6.49 1.96 -- 22.55
CIR -- -- POTATOES --------------------______________I_____---------
SUGAR BEETS ----------------------------------------------
====-=a ...........................
CU and CIR are i n inches.
22
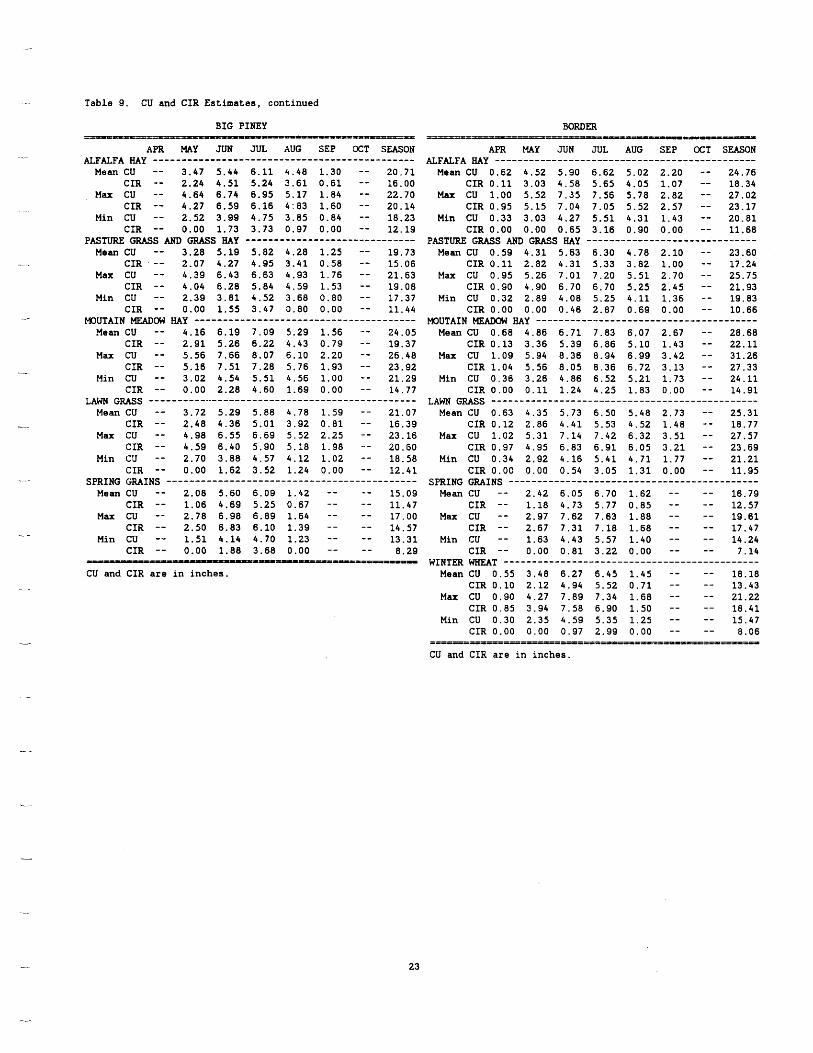
Table 9. CU and CIR Estimates, continued
- .-
-.-
BIG PINEY -- -=L- 1pI ,--=PI=PIL=DPCLPIE==
APR MAY JUN JUL AUG SEP OCT SEASON
Mean CU -- 3.47 5.44 6.11 4.48 1.30 -- 20.71 CIR -- 2.24 4.51 5.24 3.61 0.61 -- 16.00
Max CU -- 4.64 6.74 6.95 5.17 1.84 -- 22.70 CIR -- 4.27 6.59 6.16 4:83 1.60 -- 20.14
Min CU -- 2.52 3.99 4.75 3.85 0.84 -- 18.23 CIR -- 0.00 1.73 3.73 0.97 0.00 -- 12.19
Mean CU -- 3.28 5.19 5.82 4.28 1.25 -- 19.73 CIR -- 2.07 4.27 4.95 3.41 0 .58 -- 15.06
Max CU -- 4.39 6.43 6.63 4.93 1.76 -- 21.63 CIR -- 4.04 6.20 5.84 4.59 1.53 -- 19.08
Min CU -- 2.39 3.81 4.52 3.68 0.80 -- 17.37 CIR -- 0.00 1.55 3.47 0.80 0.00 -- 11.44
Mean CU -- 4.16 6.19 7.09 5.29 1.56 -- 24.05 CIR -- 2.91 5.26 6.22 4.43 0.79 -- 19.37
Max CU -- 5.56 7.66 8.07 6.10 2.20 -- 26.48 CIR -- 5.16 7.51 7.28 5.76 1.93 -- 23.92
Min CU -- 3.02 4.54 5.51 4.56 1.00 -- 21.29 CIR -- 0.00 2.28 4.60 1.69 0.00 -- 14.77
Mean CU -- 3.72 5.29 5.88 4.7% 1.59 -- 21.07 CIR -- 2.48 4.36 5.01 3.92 0.81 -- 16.39
Max CU -- 4.98 6.55 6.69 5.52 2.25 -- 23.16 CIR -- 4.59 6.40 5.90 5 .18 1.98 -.- 20.60
Min CU -- 2.70 3.88 4.57 4.12 1.02 -- 18.58 CIR -- 0.00 1.62 3.52 1.24 0.00 -- 12.41
Mean CU -- 2.08 5.60 6.09 1.42 -- -- 15.09 CIR -- 1.06 4.69 5.2s 0.67 -- -* 11.47
Max CU -- 2.78 6.98 6.89 1.64 -- -- 17.00 CIR -- 2.50 6.83 6.10 1.39 -- -- 14.57
Min CU -- 1.51 4.14 4.70 1.23 -- -- 13.31 CIR -- 0.00 1.88 3.68 0.00 -- -- 8.29
ALFALFA my _____-----------------------------------------
PASTURE GRASS AND GRASS my ..............................
mUTAIN W O W m y -------------------------------------*-
LAWN G M S ______----I--------------------------------~---
SPRING GRAINS ___-----------------________________I___----
== --= -_ -a=as=a-====pI-
CU and CIR are i n inches.
BORDER ==t=ePP--Prr-==--==- -- - ---=-- = - ---- --
APF2 MAY JUN JUL AUG SEP OCT SEASON
Mean CU 0.62 4.52 5.90 6.62 5.02 2.20 -- 24.76 CIR 0.11 3.03 4.58 5.65 4.05 1.07 -- 18.34
Max CU 1.00 5 . 5 2 7.35 7.56 5.78 2.82 -- 27.02 CIR 0.95 5.15 7.04 7.05 5.52 2.57 -- 23.17
Min CU 0.33 3.03 4.27 5.51 4.31 1.43 -- 20.81 CIR 0.00 0.00 0.65 3.16 0.90 0.00 -- 11.68
Mean CU 0.59 4.31 5.63 6.30 4.78 2.10 -- 23.60 CIR 0.11 2.82 4.31 5.33 3.82 1.00 -- 17.24
Max CU 0.95 5.26 7.01 7.20 5.51 2.70 -- 25.75 CIR 0.90 4.90 6.70 6.70 5.25 2.45 -- 21.93
Min CU 0.32 2.89 4.08 5.25 4.11 1.36 -- 19.83 CIR 0.00 0.00 0.46 2.87 0.69 0.00 -- 10.66
Mean CU 0.68 4.86 6.71 7.83 6.07 2.67 -- 28.68 CIR 0.13 3.36 5.39 6.86 5.10 1.43 -- 22.11
Max CU 1.09 5.94 8.36 8.94 6.99 3.42 -- 31.26 CIR 1.04 5.56 8.05 8.36 6.72 3.13 -- 27,33
Min CU 0.36 3.26 4.86 6.52 5.21 1.73 -- 24.11 CIR 0.00 0.11 1.24 4.25 1.83 0.00 -- 14.91
Mean CU 0.63 4.35 5.73 6.50 5.48 2.73 -- 25.31 CIR 0.12 2.86 4.41 5.53 4.52 1.48 - - 1%. 77
Max CU 1.02 5.31 7.14 7.42 6.32 3.51 -- 27.57 CIR 0.97 4.95 6.83 6.91 6.05 3.21 -- 23.69
Min CU 0.34 2.92 4.16 5.41 4.71 1.77 -- 21.21 CIR 0.OC 0.00 0.54 3.05 1.31 0.00 -- 11.95
Mean CU -- 2.42 6.05 6.70 1.62 -- -- 16.79 CIR -- 1.18 4.73 5.77 0 . 8 5 -- -- 12.57
Max CU -- 2.97 7.62 7.63 1.88 -- -- 19.61 CIR -- 2.67 7.31 7.10 1.68 -- -- 17.47
Min CU -- 1.63 4.43 5.57 1.40 -- -- 14.24 CIR -- 0.00 0.81 3.22 0.00 -- -- 7.14
Mean CU 0 . 5 5 3.48 6.27 6.45 1.45 - - -- 18.18 CIR 0.10 2.12 4.94 5.52 0.71 -- -- 13.43
Max CU 0.90 4.27 7.89 7.34 1.68 -- -- 21.22 CIR 0.85 3.94 7.58 6.90 1.50 -- -- 18.41
Min CU 0.30 2.35 4.59 5.35 1.25 -- -- 15.47 CIR 0.00 0.00 0.97 2.99 0.00 -- -- 8.C6
my ..............................................
PASTURE GRASS AND GRASS my ..............................
MOUTAIN m y ---------_-----------------------------
LAW G U S ...............................................
SPRING GRAINS -_---------_-__-----------------------------
WINTER WHEAT ---------------------------------------------
--- - - - - - - - -c========-==p=o=======~~===~==a=-=-==-~
CU and CIR are in inches.
23
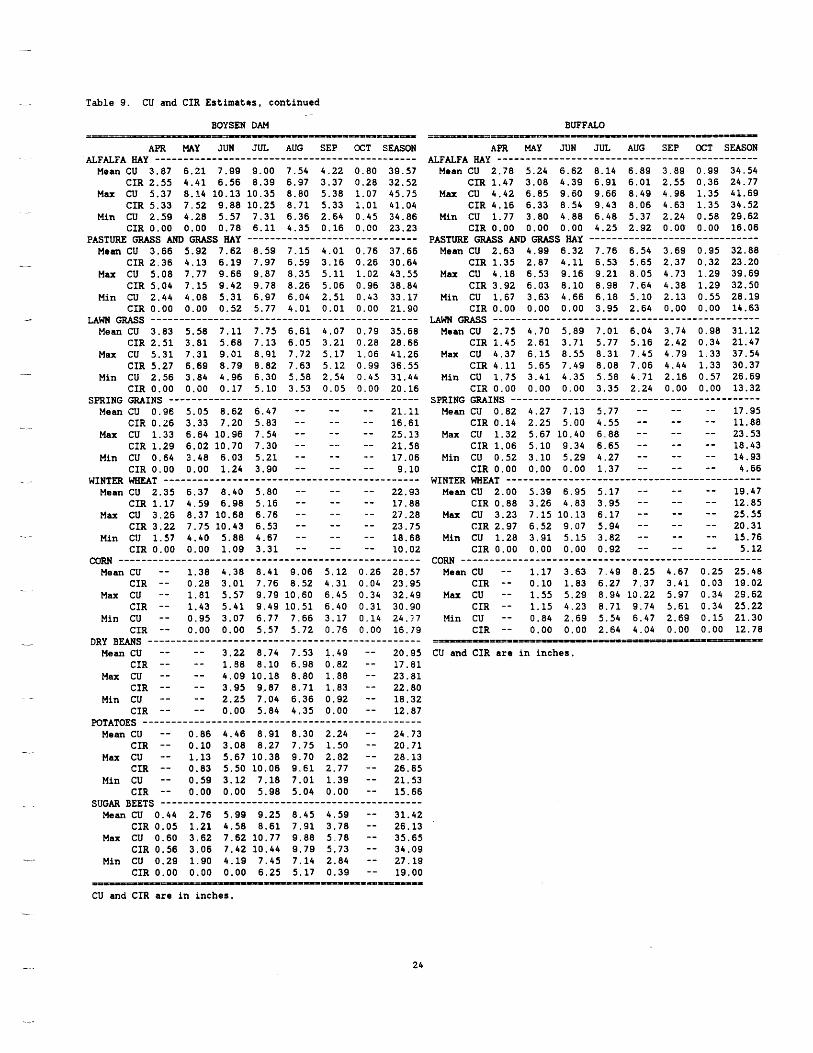
. _ Table 9. CU and CIR Estimates, continued
BOYSEN DAM BUFFALO
APR MAY JUN JUL AUG SEP OCT SEASON
Mean CU 3.87 6.21 7.99 9.00 7.54 4.22 0.80 39.57 CIR 2.55 4.41 6.56 8.39 6.97 3.37 0.28 32.52
Max CU 5.37 8.14 10.13 10.35 8 .80 5.38 1.07 45.75 CIR 5.33 7.52 9.88 10.25 8.71 5.33 1.01 41.04
Min CU 2.59 4.28 5.57 7.31 6.36 2.64 0.45 34.86 CIR 0.00 0.00 0.78 6.11 4.35 0.16 0.00 23.23
Mean CU 3.66 5.92 7.62 8.59 7.15 4.01 0.76 37.66 CIR 2.36 4.13 6.19 7.97 6.59 3.16 0.26 30.64
Max CU 5.08 7.77 9.66 9.87 8.35 5.11 1.02 43.55 CIR 5.04 7.15 9.42 9.78 8.26 5.06 0.96 38.84
Min CU 2.44 4.08 5.31 6.97 6.04 2.51 0.43 33.17 CIR 0.00 0.00 0.52 5.77 4.01 0.01 0.00 21.90
/ GRASS --------------------______C_____L_______-------
Mean CU 3.83 5.58 7.11 7.75 6.61 4.07 0.79 35.68 CIR 2.51 3.81 5.68 7.13 6.05 3.21 0.28 28.66
Max CU 5.31 7.31 9.01 8.91 7.72 5.17 1.06 41.26 CIR 5.27 6.69 8.79 8.82 7.63 5.12 0.99 36.55
Min CU 2.56 3.84 4.96 6.30 5.58 2.54 0.45 31.44 CIR 0.00 0.00 0.17 5.10 3.53 0.05 0.00 20.16
Mean CU 0 . 9 6 5.05 8.62 6.47 -- -- -- 21.11 CIR 0.26 3.33 7.20 5.83 -- -- -- 16.61
Max CU 1.33 6.64 10.96 7.54 -- -- -- 25.13 CIR 1.29 6.02 10.70 7.30 -- -- -- 21.58
Min CU 0.64 3.48 6.03 5.21 -- -- -- 17.06 CIR 0.00 0.00 1.24 3.90 -- -- -- 9. lo
Mean CU 2.35 6.37 8.40 5.80 -- -- -- 22.93 CIR 1.17 4.59 6.98 5.16 -- -- -- 17,88
Max CU 3.26 8.37 10.68 6.76 -- -- -- 27.28 CIR 3.22 7.75 10.43 6.53 -- -- -- 23.75
Min CU 1.57 4.40 5.88 4.67 -- -- -- 18.68 CIR 0.00 0.00 1.09 3.31 -- -- -- 10.02 cow ____________-_------_______________^____-------------
Mean CU -- 1.38 4.38 8.41 9.06 5.12 0.26 28.57 CIR -- 0.28 3.01 7.76 8.52 4.31 0.06 23.95
Max CU -- 1.81 5.57 9.79 10.60 6.45 0.34 32.49 CIR -- 1.43 5.41 9.49 10.51 6.40 0.31 30.90
Min CU -- 0.95 3.07 6.77 7.66 3.17 0.14 24.57 CIR -- 0.00 0.00 5.57 5.72 0.76 0.00 16.79
Mean CU -- -- 3.22 8.74 7.53 1.49 -- 20.95 CIR -- -- 1.88 8.10 6.98 0.82 -- 17.81
Max CU -- -- 4.09 10.18 8 - 8 0 1.88 -- 23.81 CIR -- -- 3.95 9.87 8.71 1.83 -- 22.80
Min CU -- -- 2.25 7.04 6.36 0.92 -- 18.32 CIR -- -- 0.00 5.84 4.35 0.00 -- 12.87
ALFALFA M y ..............................................
PASTURE GRASS AND GRASS m y ..............................
-
SPRING GRAINS _-_-----------------------------------------
c _-
WINTER m T --------------------------------------------- _ -
DRY B U S ___-_-_----------------------------------------- --
. -
POTATOES -------------------------------------------------
APR MAY JUN JUL AUG SEP CCT SEASON
Mean CU 2.78 5.24 6.62 8.14 6.89 3.89 0.99 34.54 CIR 1.47 3.08 4.39 6.91 6.01 2.55 0.36 24.77
Max CU 4.42 6.85 9.60 9.66 8.49 4.98 1.35 41.69 CIR 4.16 6.33 8.54 9.43 8.06 4.63 1.35 34.52
Min CU 1.77 3.80 4.88 6.48 5.37 2.24 0.58 29.62 CIR 0.00 0.00 0.00 4.25 2.92 0.00 0.00 16.06
Mean CU 2.63 4.99 6.32 7.76 6.54 3.69 0.95 32.88 CIR 1.35 2.87 4.11 6.53 5.65 2.37 0.32 23.20
Max C'J 4.18 6.53 9.16 9.21 8 . 0 5 4.73 1.29 39.69 CIR 3.92 6.03 8.10 8.98 7.64 4.38 1.29 32.50
Min CU 1.67 3.63 4.66 6.18 5.10 2.13 0.55 28.13 CIR 0.00 0.00 0.00 3.95 2.64 0.00 0.00 14.63
Mean CU 2.75 4.70 5.89 7.01 6.04 3.74 0.98 31.12 CIR i.45 2.61 3.71 5.77 5.16 2.42 0.34 21.47
Max CU 4.37 6.15 8.55 8.31 7.45 4.79 1.33 37.54 CIR 4.11 5.65 7.49 8.08 7.06 4.44 1.33 30.37
Min CU 1.75 3.41 4.35 5.58 4.71 2.16 0.57 26.69 CIR 0.00 0.00 0.00 3.35 2.24 0.00 0.00 13.32
Mean CU 0.82 4.27 7.13 5.77 -- -- -- 17.95 CIR 0.14 2.25 5.00 4.55 -- -- -- 11.88
Max CU 1.32 5.67 10.40 6.88 -- -- -- 23.53 CIR 1.06 5.10 9.34 6.65 -- -- *- 18.43
Min CU 0.52 3.10 5.29 4.27 -- -- -- 14.93 CIR 0.00 0.00 0.00 1.37 -- -- -- 4.66
Mean CU 2.00 5.39 6.95 5.17 -- -- -- 19.47 CIR 0.88 3.26 4.83 3.95 -- -- -- 12.85
Max CU 3.23 7.15 10.13 6.17 -- -- -- 25.55 CIR 2.97 6.52 9.07 5.94 -- -- -- 20.31
Min CU 1.28 3.91 5.15 3.82 -- -- -- 15.76 CIR 0.00 0.00 0.00 0.92 -- -- -- 5.12 cow .....................................................
Mean CU -- 1.17 3.63 7.49 8.25 4.67 0.25 25.48 CIR -- 0.10 1.83 6.27 7.37 3.41 0.03 19.02
CIR -- 1.15 4.23 8.71 9.74 5.61 0.34 25.22 Min CU -- 0.84 2.69 5.54 6.47 2.69 0.15 21.30
CIR -- 0.00 0.00 2.64 4.04 0.00 0.00 12.78
U'aFA M y ..............................................
PASTURE GRASS AND GRASS my ..............................
LAWN GRASS ------------------I----------------------------
SPRING GRAINS --------------------------------------------
WINTER WHEAT ---------------------------------------------
Max CU -- 1.55 5.29 8.94 13.22 5.97 0.34 29.62
= = ~ l ~ P P I I l % P p P - - - = ~ = = = ~ ~ - ~ - ~ - = ~
CU and CIR are in inches.
--
Mean CU -- 0.86 4.46 8.91 8.30 2.24 -- 24.73 CIR -- 0.10 3.08 8.27 7.75 1.50 -- 20.71
Max CU -- 1.13 5.67 10.38 9.70 2.82 -- 28.13 CIR -- 0.83 5.50 10.06 9.61 2.77 -- 26.65
Min CU -- 0 . 5 9 3.12 7.18 7.01 1.39 -- 21.53 CIR -- 0.00 0.00 5.98 5.04 0.00 -- 15.66
Mean CU 0.44 2.76 5.99 9.25 8.45 4.59 -- 31.42 CXR 0.05 1.21 4.58 8.61 7.91 3.78 -- 26.13
Max CU 0.60 3.62 7.62 10.77 9.88 5.78 -- 35.65 CIR 0.56 3.06 7.42 10.44 9.79 5.73 -- 34.09
Min CU 0.29 1.90 4.19 7.45 7.14 2.84 -- 27.19 CXR 0.00 0.00 0.00 6.25 5.17 0.39 -- 19.00
SUGAR BEETS ----------------------------------------------
- P m n P i i i i t l P I I t U I I I
CU and CIR are in inches.
24
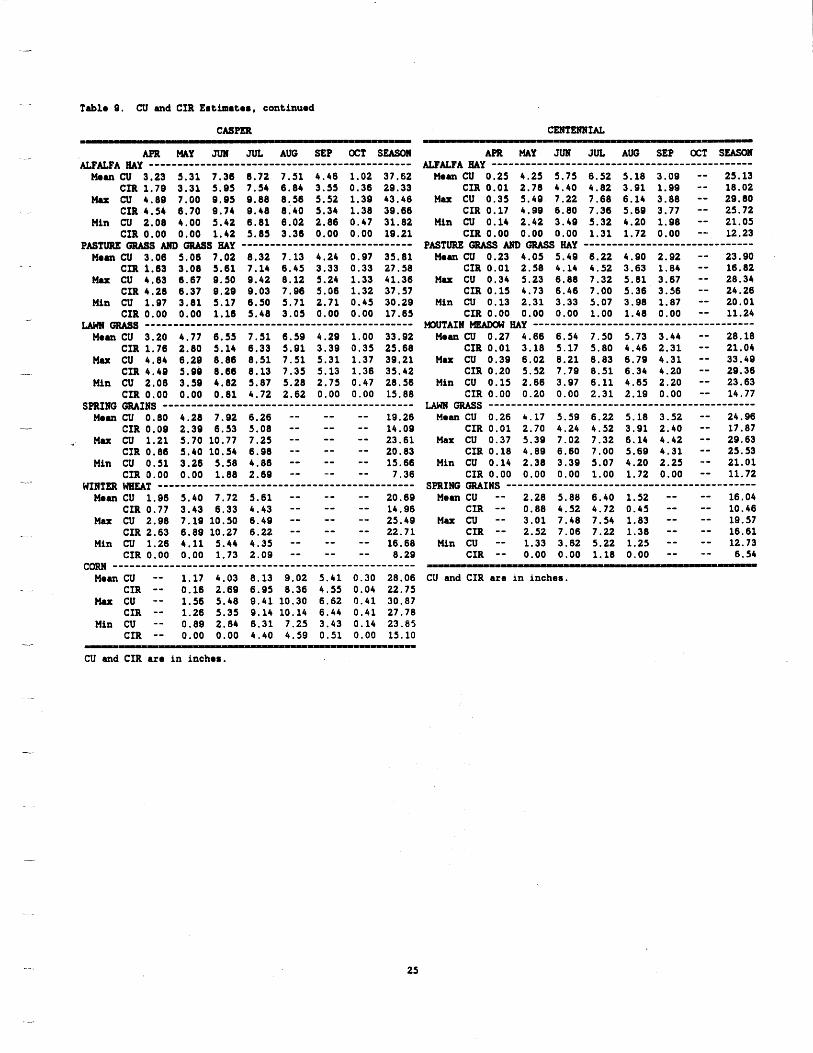
- - Tablo 9. CU and CIR Estimato8, continuod
CASPLR CENTENNIAL
1.
APR MAY Jun JUL AUG SEP OCT SEASO#
Moan CU 3.23 5 .31 7.36 8.72 7 .51 4.46 1.02 37.62 CIR 1.70 3 .31 5.95 7.54 6.84 3.55 0.36 29.33
M u CU 4.89 7.00 9.95 9.88 8:56 5.52 1.39 43.46 CIR 4.54 6.70 9.74 9.48 8.40 5.34 1.38 39.66
Min CU 2.08 4.00 5.42 6 . 8 1 6.02 2.86 0.47 31.82 CIR 0.00 0.00 1.42 5.85 3.36 0.00 0 .00 19.21
p U m u s GRASS my .............................. Moan CU 3.06 5.06 7 .02 8.32 7 .13 4.24 0.97 35.81
CIR 1.63 3.08 5 .61 7.14 6.45 3.33 0 .33 27.58 M u CU 4.63 6 . 6 7 9.50 9.42 8.12 5.24 1.33 41.36
CIR 4.28 6.37 9.29 9.03 7.96 5.06 1.32 37.57 Min CU 1.97 3 .81 5.17 6.50 5 .71 2 . 7 1 0.45 30.29
CIR 0.00 0.00 1.16 5.48 3.05 0.00 0.00 17.65 GRASS ...............................................
Moan CU 3.20 4.77 6.55 7 . 5 1 6.59 4.29 1.00 33.92 CIR 1.76 2.80 5.14 6.33 5 . 9 1 3.39 0 . 3 5 25.68
Mu CU 4.84 6.29 8.86 8 . 5 1 7 . 5 1 5 . 3 1 1.37 39.21 CIR 4.49 5.90 8.66 8.13 7.35 5.13 1.36 35.42
Min CU 2.06 3.59 4.82 5.87 5.28 2.75 0.47 28.56 CIR 0.00 0.00 0 .81 4.72 2 .62 0 .00 0.00 15.88
Mean CU 0.80 4.28 7.92 6.26 -- -- -- 19.26 CIR 0.09 2.39 6.53 5.08 -- -- -- 14.09
, M u CU 1 . 2 1 5.70 10.77 7.25 -- -- -- 23.61 CIR 0.86 5.40 10.54 6 .98 -- -- -- 20.83
Min CU 0 . 5 1 3.26 5.58 4.86 -- -- -- 15.66 CIR 0 .00 0.00 1.88 2.69 -- -- -- 7.36
Mean CU 1.96 5.40 7.72 5 . 6 1 -- -- -- 20.69 CIR 0.77 3.43 6.33 4.43 -- -- -- 14.96
M a x CU 2.98 7.19 10.50 6 .49 -- -- -- 25.49 CIR 2.63 6.89 10.27 6.22 -- -- -- 22.71
Min CU 1.26 4 . 1 1 5.44 4.35 -- -- -- 16.68 CIR 0.00 0.00 1.73 2 . 0 9 -- -- -- 8.29 c- ----------------I___---------------------------------
Mean CU -- 1.17 4 .03 8 .13 9.02 5 . 4 1 0 .30 28.06 CIR -- 0.16 2.69 6.95 8.36 4 .55 0.04 22.75
Max cu -- 1.56 5.48 9 . 4 1 10.30 6.62 0 . 4 1 30.87 CIR -- 1.26 5.35 9.14 10.14 6.44 0 . 4 1 27.78
Min CU -- 0.89 2.84 6 . 3 1 7.25 3 .43 0.14 23.85 CIR -- 0.00 0.00 4.40 4.59 0 . 5 1 0.00 15.10
A L p U A my
SPRING W I N S _________--_____-_-___c_________________----
WINTER WBUT .............................................
____ - - _ _ - __ - _ __ _ _ - __ - - - - - - - ___ ___ _ - __ _______- - -
APR MAY JUN JUL AUG SEP OCT SEASON
Mean CU 0.25 4.25 5.75 6 .52 5.18 3.09 -- 25.13 CIR 0 . 0 1 2.78 4.40 4.82 3 .91 1.99 -- 18.02
M u CU 0.35 5.49 7.22 7.68 6.14 3.88 -- 29.80 CIR 0.17 4.99 6.80 7.36 5.69 3.77 -- 25.72
Min CU 0.14 2 .42 3 .49 5.32 4.20 1.98 -- 21.05 CIR 0.00 0.00 0.00 1 . 3 1 1.72 0.00 -- 12.23
Moan CU 0.23 4.05 5.49 6.22 4.90 2.92 -- 23.90 CIR 0 . 0 1 2 .58 4.14 4 .52 3.63 1.84 -- 16.82
M u CU 0.34 5.23 6 . 8 8 7.32 5 . 8 1 3.67 -- 28.34 CIR 0.15 4.73 6.46 7.00 5 .36 3.56 -- 24.26
Min CU 0.13 2 . 3 1 3.33 5.07 3.98 1.87 -- 20.01 CIR 0.00 0.00 0.00 1.00 1.48 0 .00 -- 11.24
Moan CU 0.27 4.66 6.54 7.50 5.73 3.44 -- 28.18 CIR 0 . 0 1 3.18 5.17 5.80 4.46 2 . 3 1 -- 21.04
Max CU 0.39 6 . 0 2 8 .21 8.83 6.79 4 .31 -- 33.49 CIR 0.20 5.52 7.79 8 . 5 1 6.34 4.20 -- 29.36
Min CU 0.15 2.66 3.97 6 .11 4.65 2.20 -- 23.63 CIR 0.00 0.20 0.00 2.31 2.19 0.00 -- 14.77
urn GRASS ............................................... Mean CU 0.26 4.17 5.59 6.22 5.18 3.52 -- 24.96
CIR 0 . 0 1 2.70 4.24 4.52 3 . 9 1 2.40 -- 17.87 Max CU 0.37 5.39 7.02 7.32 6.14 4.42 -- 29.63
CIR 0.18 4.89 6 .60 7.00 5.69 4 . 3 1 -- 25.53 Min CU 0.14 2.38 3.39 5.07 4.20 2.25 -- 21.01
CIR 0.00 0.00 0.00 1.00 1.72 0.00 -- 11.72
Maan CU -- 2.28 5.88 6.40 1.52 -- -- 16.04 CIR -- 0.88 4.52 4.72 0.45 -- -- 10.46
Max CU -- 3.01 7.48 7.54 1.83 -- -- 19.57 CIR -- 2.52 7 .06 7.22 1.38 -- -- 16.61
Min CU -- 1.33 3 .62 5.22 1.25 -- -- 12.73 CIR -- 0.00 0.00 1.18 0.00 -- -- 6.54
aF&J'A ___-__-__-________--____________________------
PUT= W S AND GRASS my _____________-______----------
W W A I N MEADOW fuy --I---___-_______-__-------------------
SPRING WINS ------__-_--_---I___~-----------------------
CU and CIR ara in inches.
CU and CIR are in inchos.
25
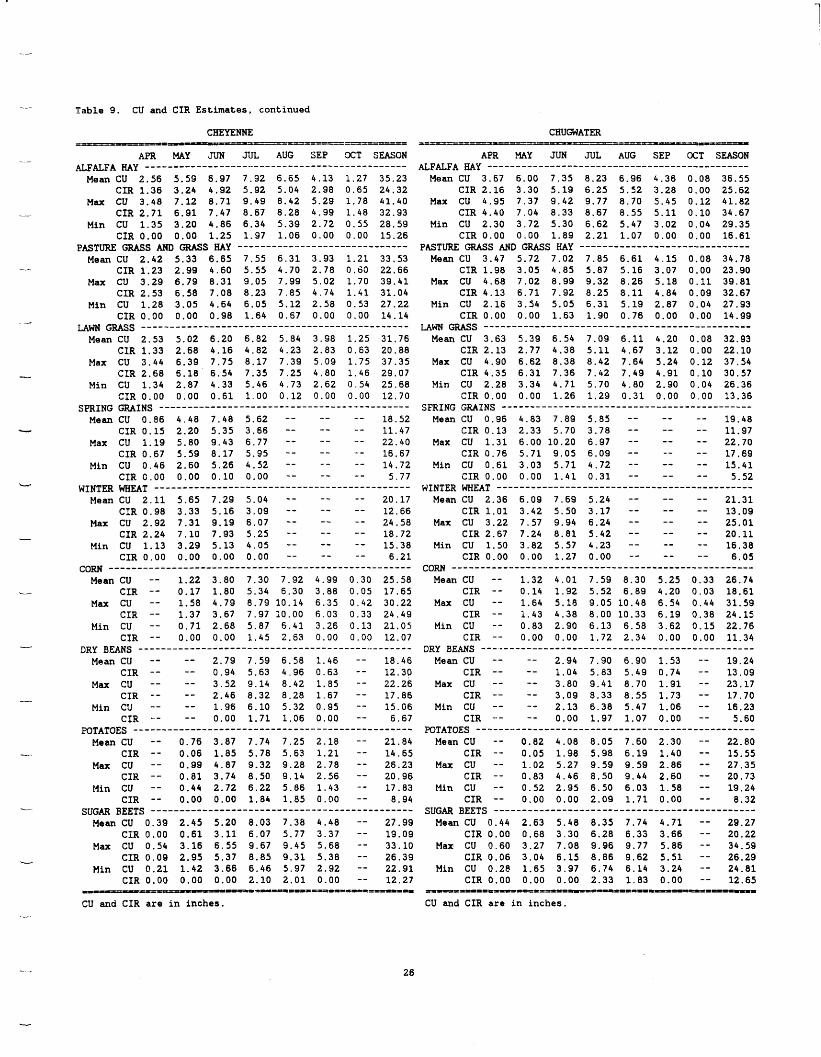
1
Table 9. CU and CIR Estimates, continued
'v
-_ .
CHEYENNE CHUGWATER =---<=-=-- ---.-a====l=E====lT== ===-I- '--=----E1=I==a==P==-
APR MAY JUN JUL AUG SEP X T SEASON APR MAY JUN JUL AUG SEP OCT SEASON
Mean CU 2.56 5.59 6.97 7.92 6.65 4.13 1.27 35.23 Mean CU 3.67 6.00 7.35 8.23 6.96 4.36 0.08 36.55 CIR 1.36 3.24 4.92 5.92 5.04 2.98 0.65 24.32 CIR 2.16 3.30 5.19 6.25 5.52 3.28 0.00 25.62
Max CU 3.48 7.12 8.71 9.49 8.42 5.29 1.78 41.40 Max CU 4.95 7.37 9.42 9.77 8.70 5.45 0.12 41.82 CIR 2.71 6.91 7.47 8.67 8.28 4.99 1.48 32.93 CIR 4.40 7.04 8.33 8.67 8.55 5.11 0.10 34.67
Min CU 1.35 3.20 4.86 6.34 5.39 2.72 0.55 28.59 Min CU 2.30 3.72 5.30 6.62 5.47 3.02 0.04 29.35 CIR 0.00 0.00 1.25 1.97 1.06 0.00 0.00 15.26 CIR 0.00 0.00 1.89 2.21 1.07 0.00 0.00 16.61
Mean CU 2.42 5.33 6.65 7.55 6.31 3.93 1.21 33.53 Mean CU 3.47 5.72 7.02 7.85 6.61 4.15 0.08 34.78 CIR 1.23 2.99 4.60 5.55 4.70 2.78 0.60 22.66 CIR 1.98 3.05 4.85 5.87 5.16 3.07 0.00 23.90
Max CU 3.29 6.79 8.31 9.05 7.99 5.02 1.70 39.41 Max CU 4.68 7.02 8.99 9.32 8.26 5.18 0.11 39.81 CIR 2.53 6.58 7.08 8.23 7.85 4.74 1.41 31.04 CIR 4.13 6.71 7.92 8.25 8.11 4.84 0.09 32.67
Min CU 1.28 3.05 4.64 6.05 5.12 2.58 0.53 27.22 Min CU 2.16 3.54 5.05 6.31 5.19 2.87 0.04 27.93 CIR 0.00 0.00 0.98 1.64 0.67 0.00 0.00 14.14 CIR 0.00 0.00 1.63 1.90 0.76 0.00 0.00 14.99
LAWN GRASS ________--------------------------------------- GRASS --------_-------------------------------------- Mean CU 2.53 5.02 6.20 6.82 5.84 3.98 1.25 31.76 Mean CU 3.63 5.39 6.54 7.09 6.11 4.20 0.08 32.93
CIR 1.33 2.68 4.16 4.82 4.23 2.83 0.63 20.88 CIR 2.13 2.77 4.38 5.11 4.67 3.12 0.00 22.10 Max CU 3.44 6.39 7.75 8.17 7.39 5.09 1.75 37.35 Max CU 4.90 6.62 8.38 8.42 7.64 5.24 0.12 37.54
CIR 2.68 6.18 6.54 7.35 7.25 4.80 1.46 29.07 CIR 4.35 6.31 7.36 7.42 7.49 4.91 0.10 30.57 Min CU 1.34 2.87 4.33 5.46 4.73 2.62 0.54 25.68 Min CU 2.28 3.34 4.71 5.70 4.80 2.90 0.04 26.36
CIR 0.00 0.00 0.61 1.00 0.12 0.00 0.00 12.70 CIR 0.00 0.00 1.26 1.29 0.31 0.00 0.00 13.36
Mean CU 0.86 4.48 7.48 5.62 -- -- -- 18.52 Mean CU 0.96 4.83 7.89 5.85 -- -- -- 19.48 CIR 0.15 2.20 5.35 3.66 -- -- -- 11.47 CIR 0.13 2.33 5.70 3.78 -- -- -- 11.97
Max CU 1.19 5 .80 9.43 6.77 -- -- -- 22.40 Max CU 1.31 6 . 0 0 10.20 6.97 -- -- -- 22.70 17.69 CIR 0.67 5.59 8.17 5.95 -- -- --
Min CU 0.46 2.60 5.26 4.52 -- -- -- 14.72 Min CU 0.61 3.03 5.71 4.72 -- -- -- 15.41 CIR C.00 0.00 0.10 0.00 -- -- -- 5.77 CIR 0.00 0.00 1.41 0.31 -- -- -- 5.52
Mean CU 2.11 5.65 7.29 5.04 -- -- -- 20.17 Mean CU 2.36 6.09 7.69 5.24 -- -- -- 21.31 CIR 0.98 3.33 5.16 3.09 -- -- -- 12.66 CIR 1.01 3.42 5.50 3.17 -- -- -- 13.09
Max CU 2.92 7.31 9.19 6.07 -- -- -- 24.58 Max CU 3.22 7.57 9.94 6.24 -- -- -- 25.01 CIR 2.24 7.10 7.93 5.25 -- -- -- 18.72 CIR 2.67 7.24 8.81 5.42 -- -- -- 20.11
Min CU 1.13 3.29 5.13 4.05 -- -- -- 15.38 Min CU 1.50 3.82 5.57 4.23 -- -- -- 16.38 CIR 0.00 0.00 0.00 0.00 -- -- -- 6.21 CIR 0.00 0.00 1.27 0.00 -- -- -- 6.05
corn ______________----I---------------------------------- CORN ----------I------------------------------------------ Mean CU -- 1.22 3.80 7.30 7.92 4.99 0.30 25.58 Mean CU -- 1.32 4.01 7.59 8.30 5.25 0.33 26.74
CIR -- 0.17 1.80 5.34 6.30 3.88 0.05 17.65 CIR - - 0.14 1.92 5.52 6.89 4.20 0.03 18.61 Max CU -- 1.58 4.79 8.79 10.14 6.35 0.42 30.22 Max CU -- 1.64 5.18 9.05 10.48 6.54 0.44 31.59
CIR -- 1.37 3.67 7.97 10.00 6.03 0.33 24.49 CIR -- 1.43 4.38 8.00 10.33 6.19 0.38 24.15 Min CU -- 0.71 2.68 5.87 6.41 3.26 0.13 21.05 Min CU -- 0.83 2.90 6.13 6.50 3.62 0.15 22.76
CIR -- 0.00 0.00 1.45 2.63 0.00 0.00 12.07 CIR -- 0.00 0 .00 1.72 2.34 0.00 0.00 11.34
Mean CU -- -- 2.79 7.59 6.58 1.46 -- 18.46 Mean CU -- -- 2.94 7.90 6.90 1.53 -- 19.24 CIR -- -- 0.94 5.63 4.96 0.63 -- 12.30 CIR -- -- 1.04 5.83 5.49 0.74 -- 13.09
Max CU -- -- 3.52 9.14 8.42 1.85 -- 22.26 Max CU -- -- 3.80 9.41 8.70 1.91 -- 23.17 CIR -- -- 2.46 8.32 8.28 1.67 -- 17.86 CIR -- -- 3.09 8.33 8.55 1.73 -- 17,70
Min CU -- -- 1.96 6.10 5.32 0.95 -- 15.06 Min CU -- -- 2.13 6.38 5.47 1.06 -- 16.23 CIR -- -- 0 .00 1.71 1.06 0.00 -- 6.67 0.00 1.97 1.07 0.00 -- 5.60
Mean CU -- 0.76 3.87 7.74 7.25 2.18 -- 21.84 Mean CU -- 0.82 4.08 8.05 7.60 2.30 -- 22.80 CIR -- 0.06 1.85 5.78 5.63 1.21 -- 14.65 CIR -- 0.05 1.98 5.98 6.19 1.40 -- 15.55
Max CU -- 0.99 4.87 9.32 9.28 2.78 -- 26.23 Max CU -- 1.02 5.27 9.59 9.59 2.86 -- 27.35 CIR -- 0.81 3.74 8.50 9.14 2.56 -- 20.96 CIR -- 0.83 4.46 8.50 9.44 2.60 -- 20.73
Min CU -- 0.44 2.72 6.22 5.86 1.43 -- 17.83 Min CU -- 0.52 2.95 6.50 6.03 1.58 -- 19.24 CIR -- 0.00 0.00 1.84 1.85 0.00 -- 8.94 CIR -- 0.00 0.00 2.09 1.71 0.00 -- 8.32
Mean CU 0.39 2.45 5.20 8.03 7.38 4.48 -- 27.99 Mean CU 0.44 2.63 5.48 8.35 7.74 4.71 -- 29.27 CIR 0.00 0.61 3.11 6.07 5.77 3.37 -- 19.09 CIR 0.00 0.68 3.30 6.28 6.33 3.66 -- 20.22
Max CU 0.54 3.16 6.55 9.67 9.45 5.68 -- 33.10 Max CU 0.60 3.27 7.08 9.96 9.77 5.86 -- 34.59 CIR 0.09 2.95 5.37 8.85 9.31 5.38 -- 26.39 CIR 0.06 3.04 6.15 8.86 9.62 5.51 -- 26.29
Min CU 0.21 1.42 3.66 6.46 5.97 2.92 -- 22.91 Min CU 0.28 1.65 3.97 6.74 6.14 3.24 -- 24.81 CIR 0.00 0.00 0.00 2.10 2.01 0.00 -- 12.27 CIR 0.00 0.00 0.00 2.33 1.83 0.00 -- 12.65
ALFALFA HAY __________-____I--._--------------------------- ALFALFA my ----------------------------------------------
PASTURE GRASS AND a s my --_-----I -.--- ---- ----- - ------- PASTURE GRASS AND GRASS my ..............................
SPRING W I N S ________------------------------------------ SFRING GRAINS ............................................
16.67 CIR 0.76 5.71 9.05 6.09 -- -- --
WINTER m T . . . . . . . . . . . . . . . . . . . . . . . . . . . . . . . . . . . . . . . . . . . . . WINTER HEAT -----.----------------------------------------
DRY BEANS _________---_----------------------------~------- DRY BEANS . . . . . . . . . . . . . . . . . . . . . . . . . . . . . . . . . . . . . . . . . . . . . . . .
CIR --- -- WTATOES ________------------___________I________--------- POTATOES -------------------------------------------------
SUGAR BEETS __-_------------------------------------------ SUGAR BEETS --------------------________________I___------
CU and CIR are in inches. CU and CIR are in inches.
26
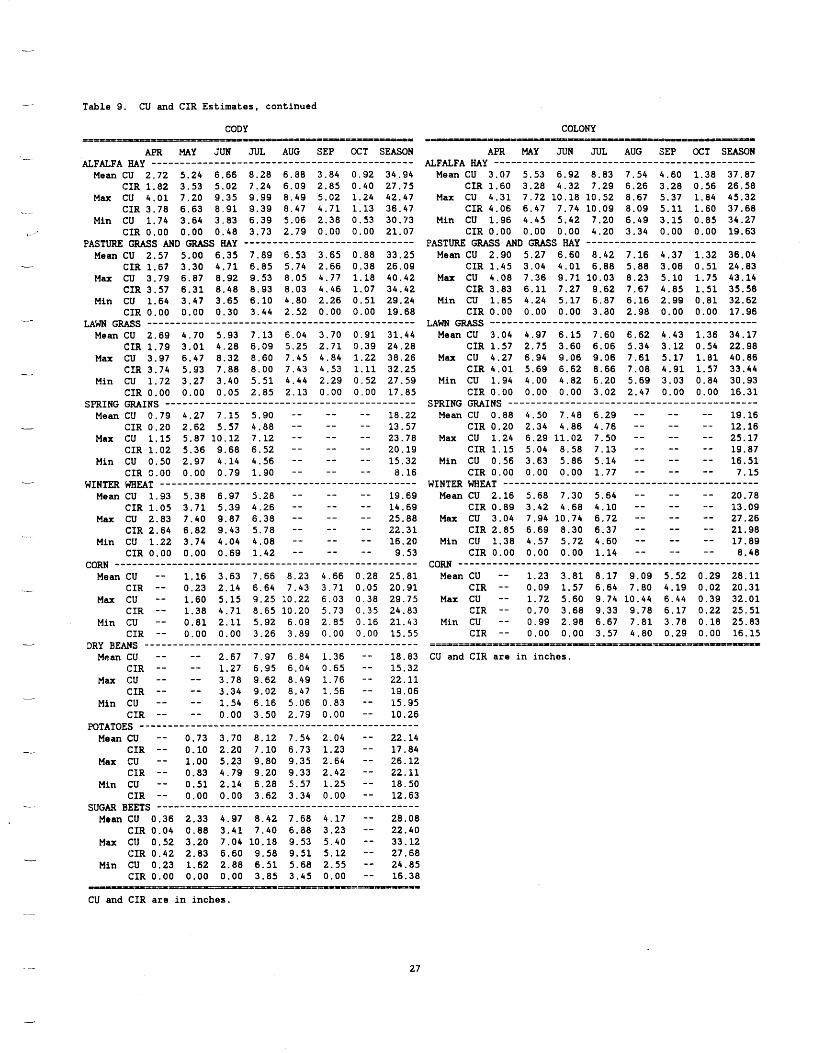
Table 9. CU and CIR Estimates, continued L
--
CODY COLONY ===--- ~--a=----~=--===IX--= =- - = = = = = = ~ ~ a ~ - - ~ - - - - ~ - - -
APR MAY JUN JUL AUG SEP OCT SEASON APR MAY JUN JUL AUG SEP OCT SEASON
Mean CU 2.72 5.24 6.66 8.28 6.88 3.84 0.92 34.94 Mean CU 3.07 5 . 5 3 6.92 8.83 7.54 4.60 1.38 37.87 CIR 1.82 3.53 5.02 7.24 6.09 2.85 0.40 27.75 CIR 1.60 3.28 4.32 7.29 6.26 3.28 0.56 26.58
Max CU 4.01 7.20 9.35 9.99 8.49 5.02 1.24 42.47 Max CU 4.31 7.72 10.18 10.52 8.67 5.37 1.84 45.32 L _ CIR 3.78 6.63 8 91 9.39 8.47 4.71 1.13 36.47 CIR 4.06 6.47 7.74 10.09 8.09 5.11 1.60 37.68
Min CU 1.74 3.64 3.83 6.39 5.06 2.38 0.53 30.73 Min CU 1.96 4.45 5.42 7.20 6.49 3.15 0.85 34.27 I CIR 0.00 0.00 0.48 3.73 2.79 0.00 0.00 21.07 CIR 0.00 0.00 0.00 4.20 3.34 0.00 0.00 19.63
Mean CU 2.57 5 . 0 0 6.35 7.89 6.53 3.65 0.88 33.25 Mean CU 2.90 5.27 6.60 8.42 7.16 4.37 1.32 36.04 c CIR 1.67 3.30 4.71 6.85 5.74 2.66 0.38 26.09 CIR 1.45 3.04 4.01 6.88 5.88 3.06 0.51 24.83
Max CU 3.79 6.87 8.92 9.53 8.05 4.77 1.18 40.42 Max CU 4.08 7.36 9.71 10.03 8.23 5.10 1.75 43.14 CIR 3.57 6.31 8.48 8.93 8.03 4.46 1.07 34.42 CIR 3.83 6.11 7.27 9.62 7.67 4.85 1.51 35.58
Min CU 1.64 3.47 3.65 6.10 4.80 2.26 0.51 29.24 Min C'J 1.85 4.24 5.17 6.87 6.16 2.99 0.81 32.62 CIR 0.00 0.00 0.30 3.44 2.52 0.00 0.00 19.68 CIR 0.00 0.00 0.00 3.80 2.98 0.00 0.00 17.96
Mean CU 2.69 4.70 5.93 7.13 6.04 3.70 0.91 31.44 Mean CU 3.04 4.97 6.15 7.60 6.62 4.43 1.36 34.17 CIR 1.79 3.01 4.28 6.09 5.25 2.71 0.39 24.28 CIR 1.57 2.75 3.60 6.06 5.34 3.12 0.54 22.98
Max CU 3.97 6.47 8.32 8.60 7.45 4.84 1.22 38.26 Max CU 4.27 6.94 9.06 9.06 7.61 5.17 1.81 40.86 CXR 3.74 5.93 7.88 8.00 7.43 4.53 1.11 32.25 CIR 4.01 5.69 6.62 8.66 7.08 4.91 1.57 33.44
Min CU 1.72 3 . 2 7 3.40 5.51 4.44 2.29 0.52 27.59 Min CU 1.94 4.00 4.82 6.20 5.69 3.03 0.84 30.93 CIR 0.00 0.00 0.05 2.85 2.13 0.00 0.00 17.85 CIR 0.00 0.00 0.00 3.02 2.47 0.00 0.00 16.31
Mean C!J 0.79 4.27 7.15 5.90 -- -- -- 18.22 Mean CU 0.88 4.50 7.48 6.29 -- -- -- 19.16 - CIR 0.20 2.62 5.57 4.88 -- -- -- 13.57 CIR 0.20 2.34 4.86 4.76 -- -- 12.16
Max CU 1.15 5.87 10.12 7.12 -- -- -- 23.70 Max CU 1.24 6.29 11.02 7.50 -- -- -- 25.17 CIR 1.02 5.36 9.68 6.52 -- -- -- 20.19 CIR 1.15 5.04 8.58 7.13 -- -- -- 19.87
Min CU 0.50 2.97 4.14 4.56 -- -- -- 15.32 Min CU 0.56 3.63 5.86 5.14 -- -- -- 16.51 CIR 3.00 0.00 0.79 1.90 -- -- -- 8.16 CIR 0.00 0.00 0.00 1.77 -- -- -- 7.15
Mean CU 1.93 5.38 6.97 5.28 -- -- -- 19.69 Mean CU 2.16 5.68 7.30 5.64 -- -- -- 20.78 CIR 1.05 3.71 5.39 4.26 -- -- -- 14.69 CIR 0.89 3.42 4.68 4.10 -- -- -- 13.09
M a x CU 2.83 7.40 9.87 6.38 -- - - -- 25.88 Max CU 3.04 7.94 10.74 6.72 -- -- -- 27.26 CIR 2.64 6.82 9.43 5.78 -- -- -- 22.31 CIR 2.85 6.69 8.30 6.37 -- -- -- 21.98
Min CU 1.22 3.74 4.04 4.08 -- -- -- 16.20 Min CU 1.38 4.57 5.72 4.60 -- -- -- 17.89 CIR 0.00 0.00 0.69 1.42 -- -- -- 9.53 CIR 0.00 0.00 0.00 1.14 -- -- -- 8.48 cow ____________----------------~.------------------------ CORN -----^------I----------------------------------------
Mean CU -- 1.16 3.63 7.66 8.23 4.66 0.28 25.81 Mean CU -- 1.23 3.81 8.17 9.09 5.52 0.29 28.11 CIR -- 0.23 2.14 6.64 7.43 3.71 0.05 20.91 CIR -- 0.09 1.57 6.64 7.80 4.19 0.02 20.31
Max CU -- 1.60 5.15 9.25 10.22 6.03 0.38 29.75 Max CU -- 1.72 5.60 9.74 10.44 6.44 0.39 32.01 CIR -- 1.38 4.71 8.65 10.20 5.73 0.35 24.83 CIR -- 0.70 3.68 9.33 9.78 6.17 0.22 25.51
Min CU -- 0.81 2.11 5.92 6.09 2.85 0.16 21.43 Min CU -- 0.99 2.98 6.67 7.81 3.78 0.18 25.83 CIR -- 0.00 0.00 3.26 3.89 0.00 0.00 15.55 CIR -- 0.00 0.00 3.57 4.80 0.29 0.00 16.15
ALFALFA m y ______________-_------------------------------ ALFALFA my .............................................. -
PASTURE GRASS AND B S m y -------I---------------------- PASTURE GRASS AND GRASS HAY ..............................
urn GRASS ______-______---------------------------------- LAWN GRASS ............................................... --
SPRING GRAINS _____---------------_I__________________---- SPRING GRAINS ____--------___-__--------------------------
.-- WINTER mEAT ___-----------------__________I_________----- WINTER WHEAT -_-------------------------------------------
1 DRY BEANS . . . . . . . . . . . . . . . . . . . . . . . . . . . . . . . . . . . . . . . . . . . . . . . . ...................................
Mean CU -- -- 2.67 7.97 6.84 1.36 -- 18.83 CU and CIH are i n inches. CIR -- -- 1.27 6.95 6.04 0.65 -- 15.32
Max CU -- -- 3.78 9.62 8.49 1.76 -- 22.11 CIR -- -- 3.34 9.02 8.47 1.56 -- 19.06
15.35 Min CU -- -- 1.54 6.16 5.06 0.83 -- CIR -- -- 0.00 3.50 2.79 0.00 -- 10.26
Mean CU -- 0.73 3.70 8.12 7 . 5 4 2.04 -- 22.14 CIR -- 0.10 2.20 7.10 6.73 1.23 -- 17.84
Max CU -- 1.00 5.23 9.80 9.35 2.64 -- 26.12 CIR -- 0.83 4.79 9.20 9.33 2.42 -- 22.11
Min CU -- 0 . 5 1 2.14 6.28 5.57 1.25 -- 18.50 CIR -- 0.00 0.00 3.62 3.34 0.00 -- 12.63
* SUGAR BEETS _--------------------------------------------- Mean CU 0.36 2.33 4.97 8.42 7.68 4.17 -- 28.08
CPR 0.04 0.88 3.41 7.40 6.88 3.23 -- 22.40 Max CU 0.52 3.20 7.04 10.18 9.53 5.40 -- 33.12
CIR 0.42 2.83 6.60 9.58 9.51 5.12 -- 27.68 24.85 Min CU 0.23 1.82 2.88 6.51 5.68 2.55 --
CIR 0.00 0.00 0.00 3.85 3.45 0.00 -- 16.38
- POTATOES ___________-__-----------------------------------
- ==---ma--- --'P-=ltPI===x-===
CU and CIR are i n inches.
27
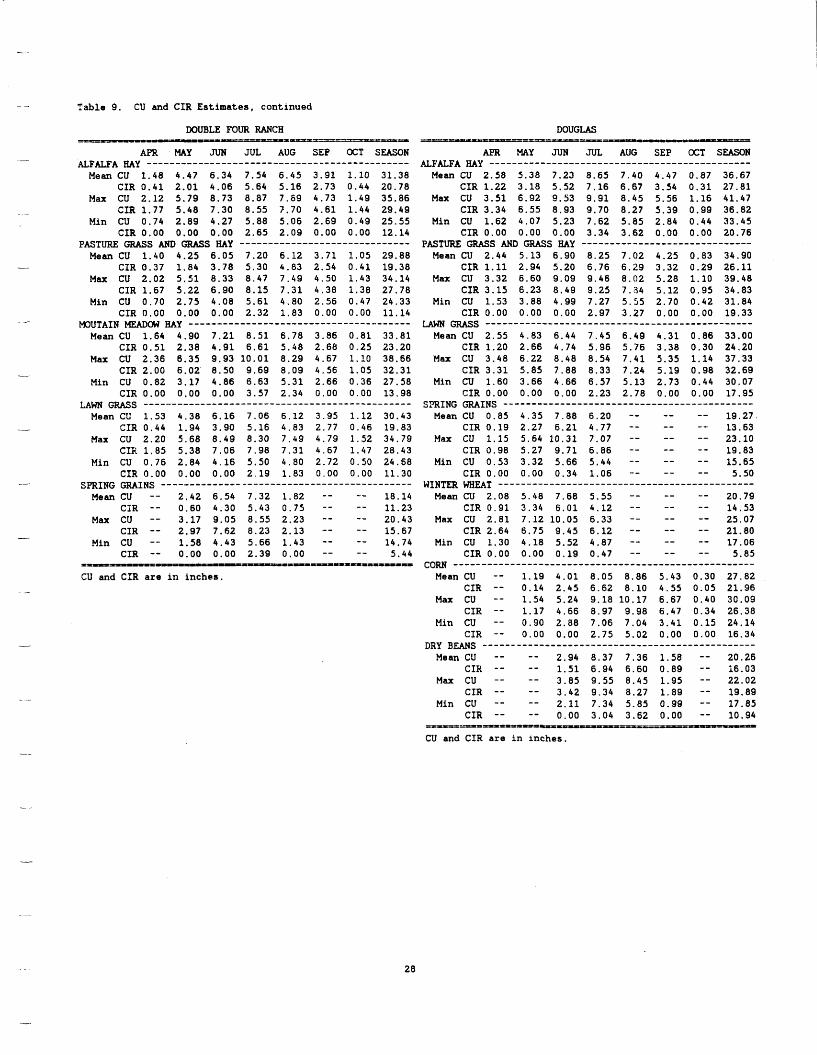
T a b l e 9. CU and CIR Estimates, continued
DOUBLE FOUR RANCH I ----- --nn*r=n-TT---
APR MAY JUN JUL AUG SEP OCT SEASON
Mean CU 1.48 4.47 6.34 7.54 6.45 3.91 1.10 31.38 CIR 0.41 2.01 4.06 5.64 5.16 2.73 0.44 20.78
Max CU 2.12 5.79 8.73 8.87 7.69 4.73 1.49 35.86 CIR 1.77 5.48 7.30 8.55 3.70 4.61 1.44 29.49
Min CU 0.74 2.89 4.27 5.88 5.06 2.69 0.49 25.55 CIR 0.00 0.00 0.00 2.65 2.09 0.00 0.00 12.14
Mean CU 1.40 4.25 6.05 7.20 6.12 3.71 1.05 29.88 CIR 0.37 1.84 3.78 5.30 4.83 2.54 0.41 19.38
Max CU 2.02 5.51 8.33 8.47 7.49 4.50 1.43 34.14 CIR 1.67 5.22 6.90 8.15 7.31 4.38 1.38 27.78
Min CU 0.70 2.75 4.08 5.61 4.80 2.56 0.47 24.33 CIR 0.00 0.00 0.00 2.32 i.83 0.00 0.00 11.14
Mean CU 1.64 4.90 7.21 8.51 6.78 3.86 0.81 33.81 CIR 0.51 2.38 4.91 6.61 5.48 2.68 0.25 23.20
Max CU 2.36 6.35 9.93 10.01 8.29 4.67 1.10 38.66 CIR 2.00 6.02 8.50 9.69 8.09 4.56 1.05 32.31
Min CU 0.82 3.17 4.86 6.63 5.31 2.66 0.36 27.58 CIR 0.00 0.00 0.00 3.57 2.34 0.00 0.00 13.98
Mean CU 1.53 4.38 6.16 7.06 5.12 3.95 1.12 30.43 CIR 0.44 1.94 3.90 5.16 4.83 2.77 0.46 19.83
Max CU 2.20 5.68 8.49 8.30 7.49 4.79 1.52 34.79 CIF. 1.85 5.38 7.06 7.98 7.31 4.67 1.47 28.43
Min CU 0.76 2.84 4.16 5.50 4.80 2.72 0.50 24.68 CIR 0.00 0.00 0.00 2.19 1.83 0.00 0.00 11.30
Mean CU -- 2.42 6.54 7.32 1.82 -- -- 18.14 CXR -- 0.60 4.30 5.43 0.75 -- -- 11.23
Max CU -- 3.17 9.05 8.55 2.23 -- -- 20.43 CIR -- 2.97 7.62 8.23 2.13 -- -- 15.67
Min CU -- 1.58 4.43 5.66 1.43 -- -- 14.74 CIR -- 0.00 0.00 2.39 0.00 -- -- 5.44
ALFALFA my ..............................................
PASTURE GRASS GRASS my ..............................
MOUTAIN my ---------------------------------------
LAW W S _---.---__--------------------------------------
SPRING GRAINS --------------------------------------------
=-IIpIIII pI--pY======-%===nw
CU and CIR are in inches.
DOUGLAS = - - I I = - - I I c = = - - = - - = P P
APR MAY JUN JUL AUG SEP OCT SEASON
Mean CU 2.58 5.38 7.23 8.65 7.40 4.47 0.87 36.67 CIR 1.22 3.18 5.52 7.16 6.67 3.54 0.31 27.81
Max CU 3.51 6.92 9.53 9.91 8.45 5.56 1.16 41.47 CIR 3.34 6.55 8.93 9.70 8.27 5.39 0.99 36.82
Min CU 1.62 4.07 5.23 7.62 5.85 2.84 0.44 33.45 CIR 0.00 0.00 0.00 3.34 3.62 0.00 0.00 20.76
Mean CU 2.44 5.13 6.90 8.25 7.02 4.25 0.83 34.90 CIR 1.11 2.94 5.20 6.76 6.29 3.32 0.29 26.11
M a x CU 3.32 6.60 9.09 9.46 8.02 5.28 1.10 39.48 CIR 3.15 6.23 8.49 9.25 7.34 5.12 0.95 34.83
Min CU 1.53 3.88 4.99 7.27 5.55 2.70 0.42 31.84 CIR 0.00 0.00 0.00 2.97 3.27 0.00 0.00 19.33
GRASS --------------------_________________^__-------
Mean CU 2.55 4.83 6.44 7.45 6.49 4.31 0.86 33.00 CIR 1.20 2.66 4.74 5.96 5.76 3.38 0.30 24.20
Max CU 3.48 6.22 8.48 8.54 7.41 5.35 1.14 37.33 CIR 3.31 5.85 7.88 8.33 7.24 5.19 0.98 32.69
Min CU 1.60 3.66 4.66 6.57 5.13 2.73 0.44 30.07 CIR 0.00 0.00 0.00 2.23 2.78 0.00 0.00 17.95
Mean CU 0.85 4.35 7.88 6.20 -- -- -- 19.27 CIR 0.19 2.27 6.21 4.77 -- -- -- 13.63
Max CU 1.15 5.64 10.31 7.07 -- -- -- 23.10 CIR 0.98 5.27 9.71 6.86 -- -- -- 19.83
Min CU 0.53 3.32 5.66 5.44 -- -- -- 15.65 CIR 0.00 0.00 0.34 1.06 -- -- -- 5.50
Mean CU 2.08 5.48 7.68 5.55 -- -- -- 20.79 CIR 0.91 3.34 6.01 4.12 -- -- -- 14.53
Max CU 2.81 7.12 10.05 6.33 -- -- -- 25.07 CIR 2.64 6.75 9.45 6.12 -- -- -- 21.80
Min CU 1.30 4.18 5.52 4.87 -- -- -- 17.06 CIR 0.00 0.00 0.19 0.47 -- -- -- 5.85
CORN ..................................................... Mean CU -- 1.19 4.01 8.05 8.86 5.43 0.30 27.82
CIR -- 0.14 2.45 6.62 8.10 4.55 0.05 21.96 Max CU -- 1.54 5.24 9.18 10.17 6.67 0.40 30.09
CIR -- 1.17 4.66 8.97 9.98 6.47 0.34 26.38 Min CU -- 0.90 2.88 7.06 7.04 3.41 0.15 24.14
CIR -- 0.00 0.00 2.75 5.02 0.00 0.00 16.34
Mean CU -- -- 2.94 8.37 7.36 1.58 -- 20.26 CIW - - -- 1.51 6.94 6.60 0.89 -- i6.03
Max CU -- -- 3.85 9.55 8.45 1.95 -- 22.02 CIR -- -- 3.42 9.34 8.27 1.89 -- 19.89
Min CU -- -- 2.11 7.34 5.85 0.99 -- 17.85 CIR -- -- 0.00 3.04 3.62 0.00 -- 10.94
fiFALFA my ..............................................
PASTURE GRASS AND GRASS my ------------------------------
SnING GRAINS --------------------------------------------
WINTER WHEAT ---------------------------------------------
DRY BEANS ------------------------------------------------
==-rI=Pra1IParPIDP~=---%-======-----~
CU and CIR are in inches.
28
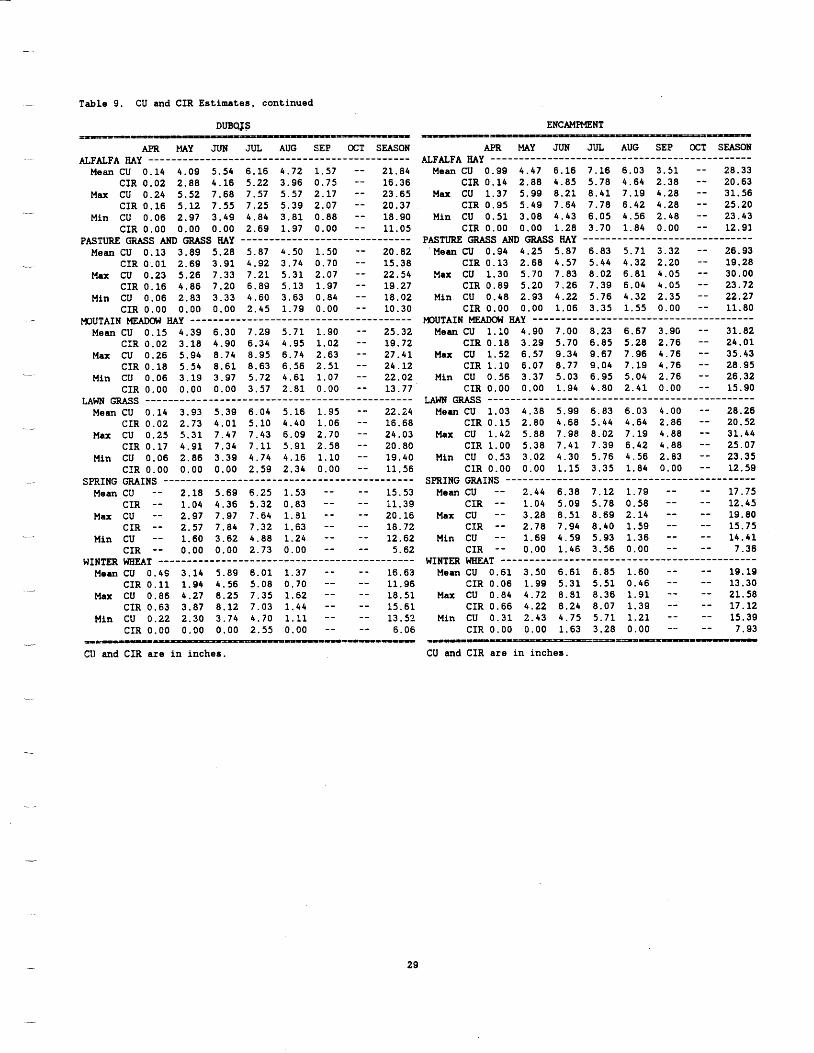
Table 9. CU and CIR Estimates, continued
DUElqTS ENCAMPMENT - -- - --=:o=--- P =-a PPU=---=-
APR MAY JUN JUL AUG SEP OCT SEASON APR MAY JUN JUL AUG SEP OCT SEASON _ _ ALFALFA my .............................................. ALFALFA HAY ---------------------------------.-------------
Mean CU 0.14 4.09 5.54 6.16 4.72 1.57 -- 21.84 Mean CU 0.99 4.47 6.16 7.16 6.03 3.51 -- 28.33 CIR 0.02 2.88 4.16 5.22 3.96 0.75 -- 16.36 CIR 0.14 2.88 4.85 5-78 4.64 2.38 -- 20.63
Max CU 0.24 5.52 7.68 7.57 5.57 2.17 -- 23.65 M- cu 1.37 5.99 8 . 2 1 8.41 7.19 4.28 -- 31.56 CIR 0.16 5.12 7.55 7.25 5.39 2.07 -- 20.37 CIR 0.95 5.49 7.64 7.78 6.42 4.28 -- 25.20
23.43 CIR 0.00 0.00 0.00 2.69 1.97 0.00 -- 11.05 CIR 0.00 0.00 1.28 3.70 1.84 0.00 -- 12.91
Mean cu 0.13 3.89 5.28 5.87 4.50 1.50 -- 20.82 Mean cu 0.94 4.25 5.87 6.83 5.71 3.32 -- 26.93
Max CU 0.23 5.26 7.33 7.21 5.31 2.07 -- 22.54 Max cu 1.30 5.70 7.83 8.02 6.81 4.05 -- 30.00 CIR 0.16 4.86 7.20 6.89 5.13 1.97 -- 19.27 CIR 0.89 5.20 7.26 7.39 6.04 4.05 -- 23.72
Min cu 0.06 2.83 3.33 4.60 3.63 0.84 -- 18.02 Min cu 0.48 2.93 4.22 5.76 4.32 2.35 -- 22.27 CIR 0.00 0.00 0.00 2.45 1.79 0.00 -- 10.30 CIR 0.00 0.00 1.06 3.35 1.55 0.00 -- 11.80 - NUTAIN MEADOW m y __---------I--------------------------- MOUTAIN my .......................................
Mean CU 0.15 4.39 6.30 7.29 5.71 1.90 -- 25.32 Mean CU 1.10 4.90 7.00 8.23 6.67 3.90 -- 31.82
Max cu 0.26 5.94 8.74 8.95 6.74 2.63 -- 27.41 Max CU 1.52 6.57 9.34 9.67 7.96 4.76 -- 35.43 CIR 0.18 5.54 8 - 6 1 8.63 6.56 2.51 -- 24.12 CIR 1.10 6.07 8.77 9.04 7.19 4.76 -- 28.95
Min CU 0.06 3.19 3.97 5.72 4.61 1.07 -- 22.02 Min CU 0.56 3.37 5.03 6.95 5.04 2.76 -- 26,32 CIR 0.00 0.00 0.00 3.57 2.81 0.00 -- 13.77 CIR 0.00 0.00 1.94 4.80 2.41 0.00 -- 15.90
urn a s ______--____----------------------------------- urn GRASS __-___--____----------------------------------- Mean CU 0.14 3.93 5.39 6.04 5.16 1.95 -- 22.24 Mean CU 1.03 4.38 5.99 6.83 6.03 4.00 -- 28.26
CIR 0.02 2.73 4.01 5.10 4.40 1.06 -- is. 68 CIR 0.15 2.80 4.68 5.44 4.64 2.86 -- 20.52 Max CU 0.25 5.31 7.47 7.43 6.09 2.70 -- 24.03 Max cu 1.42 5 . 8 8 7.98 8.02 7.19 4.88 -- 31.44
CIR 0.17 4.91 7.34 7.11 5.91 2.58 -- 20. 80 CIR 1.00 5.38 7.41 7.39 6.42 4.88 -- 25.07 Min CU 0.06 2.86 3.39 4.74 4.16 1.10 -- 19.40 Min cu 0.53 3.02 4.30 5.76 4.56 2.83 -- 23.35
CIR 0.00 0.00 0.00 2.59 2.34 0.00 -- 11.56 CLR 0.00 0.00 1.15 3.35 1.84 0.00 -- 12.59
Mean CU -- 2.18 5.69 6.25 1.53 -- -- 15.53 Mean CU -- 2.44 6.38 7.12 1.79 -- -- 17.15 CIR -- 1.04 4.36 5.32 0.83 -- -- 11.39 ClR -- 1.04 5.09 5.78 0.58 -- -- 12.45
Max cu -- 2.97 7.97 7.64 1.31 -- -- 20.16 Max CU -- 3.28 8.51 8.69 2.14 -- -- 19.80 CIR -- 2.57 7.84 7.32 1.63 -- -- 18.72 CXR -- 2.78 7.94 8.40 1.59 -- -- 15.75
Min CU -- 1.60 3.62 4.88 1.24 -- -- 12.62 Min CU -- 1.69 4.59 5.93 1.36 -- -- 14.41 CIR -- 0.00 0.00 2.73 0.00 -- -- 5.62 CIR -- 0.00 1.46 3.56 0.00 -- -- 7.36
._ Min cu 0.06 2.97 3.49 4.84 3.81 0 . 8 8 -- 18.90 Min cu 0.51 3.08 4.43 6.05 4.56 2.48 .--
PASTURE GRASS AND GRASS my ------------------------------ PASTURE GRASS AND GRASS HAY .............................. -_ CIR 0.01 2.69 3.91 4.92 3.74 0.70 -- 15.38 CIR 0.13 2.68 4.57 5.44 4.32 2.20 -- 19.28
CIR 0.02 3.18 4.90 6.34 4.95 1.02 -- 19-72 CIR 0.18 3.29 5.70 6.85 5.28 2.76 -- 24.01
-
-
SPRING GRAINS -------------------------------------------- SPRING GRAINS ............................................ _-
WINTER WHEAT ............................................. WINTER WHEAT ------__------------------------------------- Mean CU 0.49 3.14 5.89 6.01 1.37 -- -- 16.63 Mean CU 0.61 3.50 6.61 6.85 1.60 -- -- 19.19
Max cu 0.86 4.27 8.25 7.35 1.62 -- -- 18.51 Max cu 0.84 4.72 8.81 a.36 1.91 -- -- 23.. 58
CXR 0.00 0.00 0.00 2.55 0.00 -- -- 6.06 CIR 0.00 0.00 1.63 3.28 0.00 -- -- 7.93
CIR 0.11 1.94 4.56 5 .08 0 . 7 0 -- -- 11.96 CIR 0.06 1.99 5.31 5.51 0.46 -- -- 13.30
CIR 0.63 3.87 8.12 7.03 1.44 -- -- 15.61 CIR 0.66 4.22 8.24 8.07 1.39 -- -- 17.12 Min CU 0.22 2.30 3.74 4.70 1.11 -- -- 13.52. Min CU 0.31 2.43 4.75 5.71 1.21 -- -- 15.39
- CU and CXR are in inches. CU and CIR are in inches.
29
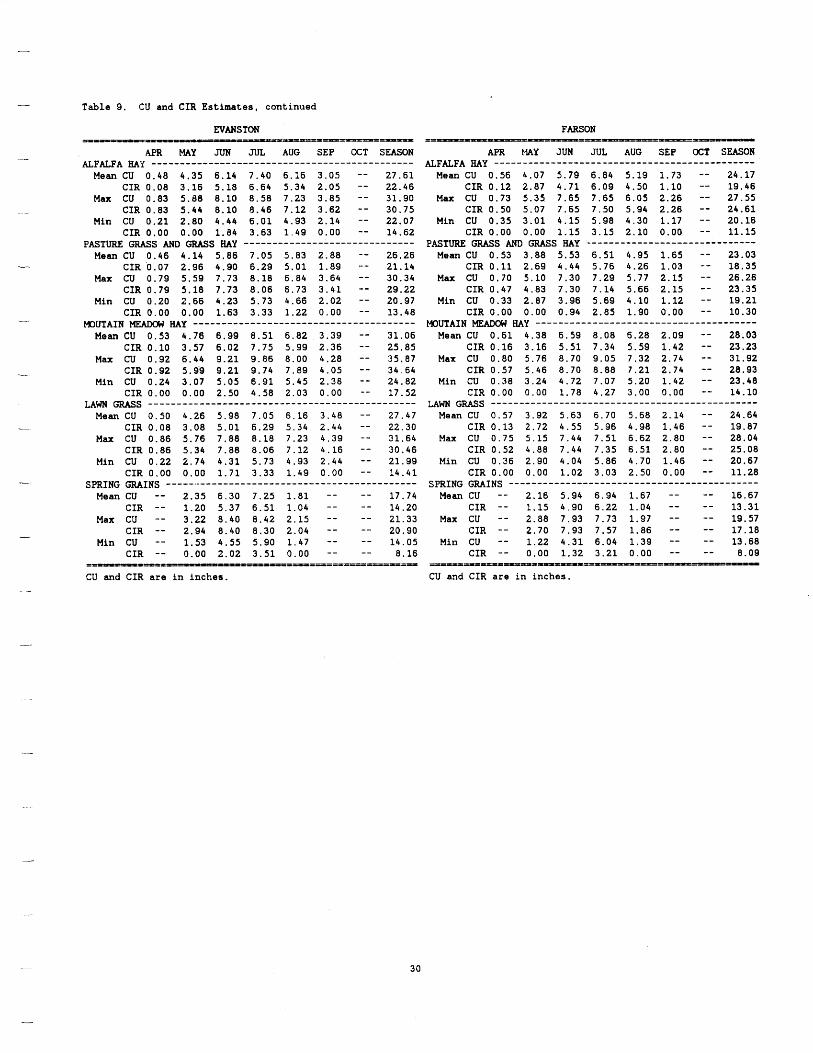
Table 9, CU and CIR Estimates, continued
EVANSTON FARSON
APR MAY JUN JUL AUG SEP OCT SEASON
Mean CU 0.48 4.35 6.14 7.40 6.16 3.05 -- 27.61 CIR 0.08 3.16 5.18 6.64 5.34 2.05 -- 22.46
Max CU 0.83 5.d8 8.10 8.58 7.23 3.85 -- 31.90 CIR 0.83 5.44 8.10 8.46 7.12 3.62 -- 30.75
Min CU 0.21 2.80 4.44 6.01 4.93 2.14 -- 22.07 CIR 0.00 0.00 1.64 3.63 1.49 0.00 -- 14.62
Mean CU 0.46 4.14 5.86 7.05 5.83 2.88 -- 26.26 CIR 0.07 2.96 4.90 6.29 5.01 1.89 -- 21.14
Max CU 0.79 5.59 7.73 8.18 6.84 3.64 -- 30.34 CIR 0.79 5.18 7.73 8.06 6.73 3.41 -- 29.22
Min CU 0.20 2.66 4.23 5.73 4.66 2.02 -- 20.97 CIR 0.00 0.00 1.63 3.33 1.22 0.00 -- 13.48
Mean CU 0 . 5 3 4.76 6.99 8.51 6.82 3.39 -- 31.06 CIR 0.10 3.57 6.02 7.75 5.99 2.36 -- 25.85
Max CU 0.92 6.44 9.21 9.86 8.00 4.28 -- 35.87 CIR 0.92 5.99 9.21 9.74 7.89 4.05 -- 34.64
Min CU 0.24 3.07 5.05 6.91 5.45 2.36 -- 24.82 CIR 0.00 0.00 2.50 4.58 2.03 0.00 -- 17.52
Mean CU 0 . 5 0 4.26 5.98 7.05 6.16 3.48 -- 27.47 CIR 0.08 3.08 5.01 6.29 5.34 2.44 -- 22.30
Max CU 0.86 5.76 7.88 8.18 7.23 4.39 -- 31.64 CIR 0.86 5.34 7.88 8.06 7.12 4.16 -- 30.46
Min CU 0.22 2.74 4.31 5.73 4.93 2.44 -- 21.99 CIR 0.00 0.00 1.71 3.33 1.49 0.00 -- 14.41
Mean CU -- 2.35 6.30 7.25 1.81 -- -- 17.74 CIR -- 1.20 5.37 6.51 1.04 -- -- 14.20
Max CU -- 3.22 8.40 8.42 2.15 -- -- 21.33 CIR -- 2.94 8.40 8.30 2.04 -- -- 20.90
Min CU -- 1.53 4.55 5.90 1.47 -- -- 14.05 CIR -- 0.00 2.02 3.51 0.00 -- -- 8.16
ALFALFA my ------------------I---------------------------
PASTURE GRASS AND GRASS my ------------------------------
MOUTAIN MEMOW my ---------------------------------------
LAWN W S ______-----------------------------------------
SPRING W I N S -----.---------------________II__________----
= r e - = i P = p ~=-I-==*===~===~==~==~
CU and CIR are i n inches.
AF'R MAY JUN 2UL AUG SEP OCT SEASON
Mean CU 0.56 4.07 5.79 6.84 5.19 1.73 -- 24.17 CIR 0.12 2.87 4.71 6.09 4.50 1.10 -- 19.46
Max CU 0.73 5 . 3 5 7.65 7.65 6.05 2.26 -- 27.55 CIR 0.50 5.07 7.65 7.50 5.94 2.26 -- 24.61
Min CU 0.35 3.01 4.15 5.98 4.30 1.17 -- 20.16 CIR 0.00 0.00 1.15 3.15 2.10 0.00 -- 11.15
Mean CU 0 . 5 3 3.88 5.53 6.51 4.95 1.65 -- 23.03 CIR 0.11 2.69 4.44 5.76 4.26 1.03 -- 18.35
Max CU 0.70 5.10 7.30 7.29 5.77 2.15 -- 26.26 CIR 0.47 4.83 7.30 7.14 5.66 2.15 -- 23.35
Min CU 0.33 2.87 3.96 5.69 4.10 1.12 -- 19.21 CIR 0.00 0.00 0.94 2.85 1.90 0.00 -- 10.30
Mean CU 0.61 4.38 6.59 8.08 6.28 2.09 -- 28.03 CIR 0.16 3.16 5.51 7.34 5.59 1.42 -- 23.23
Max CU 0.80 5.76 8.70 9.05 7.32 2.74 -- 31.92 CIR 0.57 5.46 8.70 8.88 7.21 2.74 -- 28.93
Min CU 0.38 3.24 4.72 7.07 5.20 1.42 -- 23.40 CIR 0.00 0.00 1.78 4.27 3.00 0.00 -- 14.10
Mean CU 0.57 3.92 5.63 6.70 5.58 2.14 -- 24.64 CIR 0.13 2.72 4.55 5.96 4.98 1.46 -- 19.87
Max CU 0.75 5.15 7.44 7.51 6.62 2.80 -- 28.04 CIR 0.52 4.88 7.44 7.35 6.51 2.80 -- 25.08
Min CU 0.36 2.90 4.04 5.86 4.70 1.46 -- 20.67 CIR 0.00 0.00 1.02 3.03 2.50 0.00 -- 11.28
Mean CU -- 2.16 5.94 6.94 1.67 -- -- 16.67 CIR -- 1.15 4.90 6.22 1.04 -- -- 13.31
Max CU -- 2.88 7.93 7.73 1.97 -- -- 19.57 CIR -- 2.70 7.93 7.57 1.86 -- -- 17.18
Min CU -- 1.22 4.31 6.04 1.39 -- -- 13.68 CIR -- 0.00 1.32 3.21 0.00 -- -- 8.09
ALFALFA my ..............................................
PASTURE GRASS AND GRASS M y ..............................
MOUTAIN fIAy _-__-_-----_--------____I______________
LAWN GRASS ______-----------------------------------------
SPRING GRAINS ___-----------------------------------------
CU and CIR are i n inches.
30
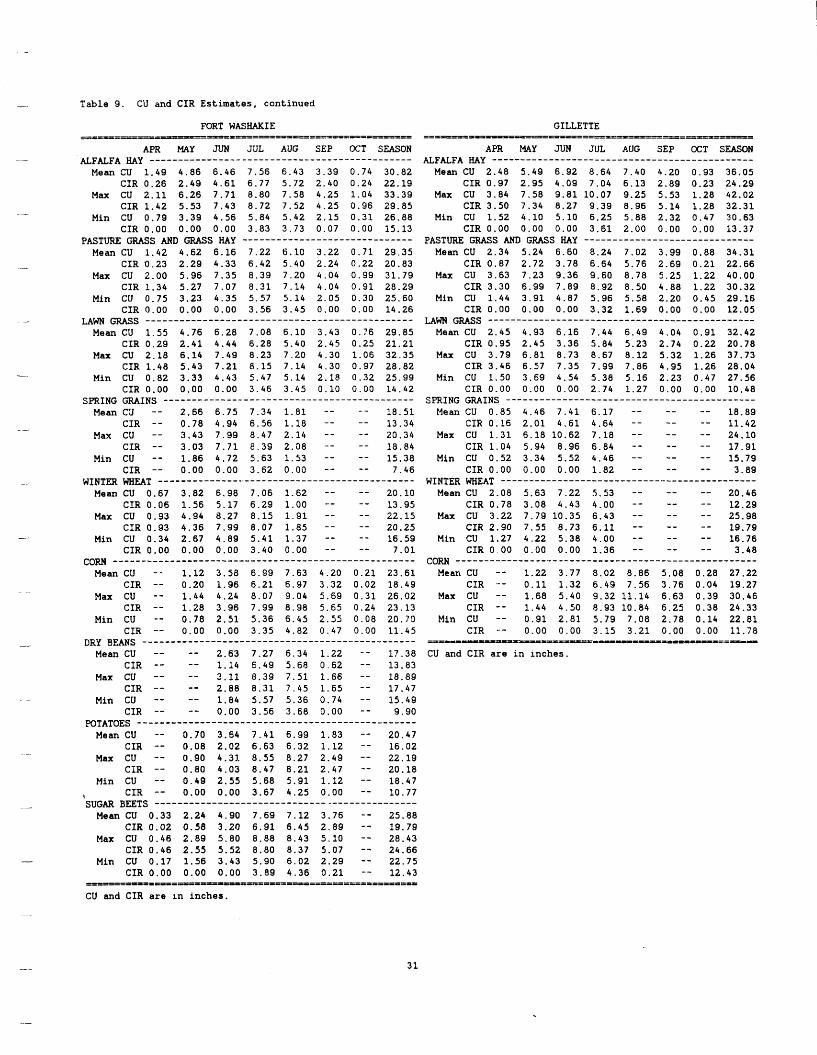
Table 9. CU and CIR Estimates, continued
.-
A
FORT WASHAKIE GILLETTE --=-=--- --. - -- -=-=ert===-x-r==sz==,,=rl~m=~= ==I=ie--P=U=--~-~~========~=~--=--e=t=----
Am MAY JUN JUL AUG SEP OCT SEASON APR MAY JUN JUL AUG SEP OCT SEASON
Mean CU 1.49 4.86 6.46 7.56 6.43 3.39 0.74 30.82 Mean CU 2.48 5.49 6.92 8.64 7.40 4.20 0.93 36.05 CIR 0.26 2.49 4.61 6.77 5.72 2.40 0.24 22.19 CIR 0.97 2.95 4.09 7.04 6.13 2.89 0.23 24.29
Max CU 2.11 6.26 7.71 8.80 7.58 4.25 1.04 33.39 Max CU 3.84 7.58 9.81 10.07 9.25 5.53 1.28 42.02 CIR 1.42 5.53 7.43 8.72 7.52 4.25 0.96 29.85 CIR 3.50 7.34 8.27 9.39 8.96 5.14 1.28 32.31
Min CU 0.79 3.39 4.56 5.84 5.42 2.15 0.31 26.88 Min CU 1.52 4.10 5.10 6.25 5.88 2.32 0.47 30.63 CIR 0.00 0.00 0.00 3.83 3.73 0.07 0.00 15.13 CIR 0.00 0.00 9.00 3.61 2.00 0.00 0.00 13.37
Mean CU 1.42 4.62 6.16 7.22 6.10 3.22 0.71 29.35 Mean CU 2.34 5.24 6.60 8.24 7.02 3.99 0.88 34.31 CIR 0.23 2.29 4.33 6.42 5.40 2.24 0.22 20.83 CIR 0.87 2.72 3.78 6.64 5.76 2.69 0.21 22.66
Max CU 2.00 5.96 7.35 8.39 7.20 4.04 0.99 31.79 Max CU 3.63 7.23 9.36 9.60 8.78 5.25 1.22 40.00 CIR 1.34 5.27 7.07 8.31 7.14 4.04 0.91 28.29 CIR 3.30 6.99 7.89 8.92 8.50 4.88 1.22 30.32
Min CU 0.75 3.23 4.35 5.57 5.14 2.05 0.30 25.60 Min CU 1.44 3.91 4.87 5.96 5.58 2.20 0.45 29.16 CIR 0.00 0.00 0.00 3.56 3.45 0.00 0.00 14.26 CIR 0.00 0.00 0.00 3.32 1.69 0.00 0.00 12.05
LAWN a s . . . . . . . . . . . . . . . . . . . . . . . . . . . . . . . . . . . . . . . . . . . . . . . GRASS ............................................... Mean CU 1.55 4.76 6.28 7.00 6.10 3.43 0.78 29.85 Mean CU 2.45 4.93 6.16 7.44 6.49 4.04 0.91 32.42
CIR 0.29 2.41 4.44 6.28 5.40 2.45 0.25 21.21 CIR 0.95 2.45 3.36 5.84 5.23 2.74 0.22 20.78 Max CU 2.18 6.14 7.49 8.23 7.20 4.30 1.06 32.35 Max CU 3.79 6.81 8.73 8.67 8.12 5.32 1.26 37.73
CIR 1.48 5.43 7.21 8.15 7.14 4.30 0.97 28.82 CIR 3.46 6.57 7.35 7.99 7.86 4.95 1.26 28.04 Min CU 0.82 3.33 4.43 5.47 5.14 2.18 0.32 25.99 Min CU 1.50 3.09 4.54 5.36 5.16 2.23 0.47 27.56
CIR 0.00 0.00 0.00 3.46 3.45 0.10 0.00 14.42 CIR 0.00 0.00 0.00 2.74 1.27 0.00 0.00 10.48
Mean C3 -- 2.66 6.75 7.34 1.81 -- - - 18.51 Mean CU 0 . 8 5 4.46 7.41 6.17 -- -- -- 18.89 11,42 CIR -- 0.78 4.94 6.56 1.18 -- -- 13.34 CIR 0.16 2.01 4.61 4.64 -- --
Max CU -- 3.43 7.99 8.47 2.14 -- -- 20.34 Max CU 1.31 6.18 10.62 7.18 -- -- -- 24.10 CIR -- 3.03 7.71 E.39 2.08 -- -- 18.84 CIR 1.04 5.94 8.96 6.84 -- -- -- 17.91
Min CU -- 1.86 4.72 5.63 1.53 -- -- 15.38 Min CU 0.52 3.34 5.52 4.46 -- -- -- 15.79 CIR -- 0.00 0.00 3.62 0.00 -- -- 7.46 CIR 0.00 0.00 0.00 1.82 -- -- -- 3.89
Mean CU 0.67 3.82 6.98 7.06 1.62 -- -- 20.10 Mean CU 2.08 5.63 7.22 5.53 -- -- -- 20.46 CIR 0.06 1.56 5.17 6.29 1.00 -- -- 13.95 CIR 0.78 3.08 4.43 4.00 -- -- -- 12.29
22.15 Max CU 3.22 7.79 10.35 6.43 -- -- -- 25.98 Max CU 0.93 4.94 8.27 8.15 1.91 -- CIR 0.93 4.36 7.99 8 . 0 7 1.35 -- -- 20.25 CIR 2.90 7.55 8.73 6.11 -- -- -- 19.79
Min CU 0.34 2.67 4.89 5.41 1.37 -- -- 16.59 Min CU 1.27 4.22 5.30 4.00 -- -- -- 16.76 CIR 0.00 0.00 0.00 3.40 0.00 -- -- 7.01 CIR 0.00 0.00 0.00 1.36 -- -- -- 3.40
CORN ___-________----------------------------------------- cow . . . . . . . . . . . . . . . . . . . . . . . . . . . . . . . . . . . . . . . . . . . . . . . . . . . . . Mean CU -- 1.12 3.58 6.99 7.63 4.20 0.21 23.61. Mean CU -- 1.22 3.77 8.02 8.86 5.08 0.28 27.22
CIR -- 0.20 1.96 6.21 6.97 3.32 0.02 18.49 CIR -- 0.11 1.32 6.49 7.56 3.76 0.04 19.27 Max CU -- 1.44 4.24 8.07 9.04 5.69 0.31 26.02 Max CU -- 1.68 5.40 9.32 11.14 6.63 0.39 30.46
CIR -- 1.28 3.96 7.99 8.98 5.65 0.24 23.13 CIR -- 1.44 4.50 8.93 10.84 6.25 0.38 24.33 Min CU -- 0 . 7 0 2.51 5.36 6.45 2.55 0.08 20.79 Min CU -- 0.91 2.81 5.79 7.08 2.78 0.14 22.81
CIR -- 0.00 0.00 3.35 4.82 0.47 0.00 11.45 CIR -- 0.00 0.00 3.15 3.21 0.00 0.00 11.78
ALFALFA IfAy _______--------------------------------------- ALFALFA HAY ------------------______I_______________------
PASTW GRASS AND GRASS my ------------------------------ PASTURE GRASS AND GRASS HAY ---------------____-----------
SPRING GRAINS ___----------------------.------------------- SmING GRAINS
--
WINTER WHEAT __------------------------------------------- WINTER WHEAT --------------------________I___________-----
--
DRY BUNS -------------------------------------.----------- ===~-C~~~DIPIPI---====--~--==--=--===-==
Mean CU -- -- 2.63 7.27 6.34 1.22 -- 1?.38 CU and CIR are in inches. CIR -- -- 1.14 6.49 5.68 0.62 -- 13.83
Max CU -- -- 3.11 8.39 7.51 1.66 -- 18.89 CIR -- -- 2.00 8.31 7.45 1.65 -- 17.47
Min CU -- -- 1.64 5.57 5.36 0.74 -- 15.49 CIR -- -- 0.00 3.56 3 . E 8 0.00 -- 9.90
Mean CU -- 0.70 3.54 7.41 6.99 1.83 -- 20.47 CIR -- 0.08 2.02 6.63 6.32 1.12 -- 16.02
Max CU -- 0.90 4.31 8.55 8.27 2.49 -- 22.19 CiR -- 0.80 4.03 8.47 8.21 2.47 -- 20.18
Min CU -- 0.49 2.55 5.68 5.91 1.12 -- 18.47
WTATOES --_----------------------------------------------
3 CIR -- 0.00 0.00 3.67 4.25 0.00 -- 10.77 SUGAR BEETS ---------------------------------------------- - Mean CU 0.33 2.24 4.90 7.69 7.12 3.76 -- 25.88
CIR 0.02 0.38 3.29 6.91 6.45 2.89 -- 19.79 Max CU 0.46 2.89 5.80 8.88 8.43 5.10 -- 28.43
CIR 0.46 2.55 5.52 8 . 8 0 8.37 5.07 -- 24.66 - Min CU 0.17 1.56 3.43 5.90 6.02 2.29 -- 22.75
CIR 0.00 0.00 0.00 3.89 4.36 0.21 -- 12.43 ,,--tpIPI=P===r=IPD=-=-==~==a=====*=~=======~~=a====
CU and CIR are in inches.
31
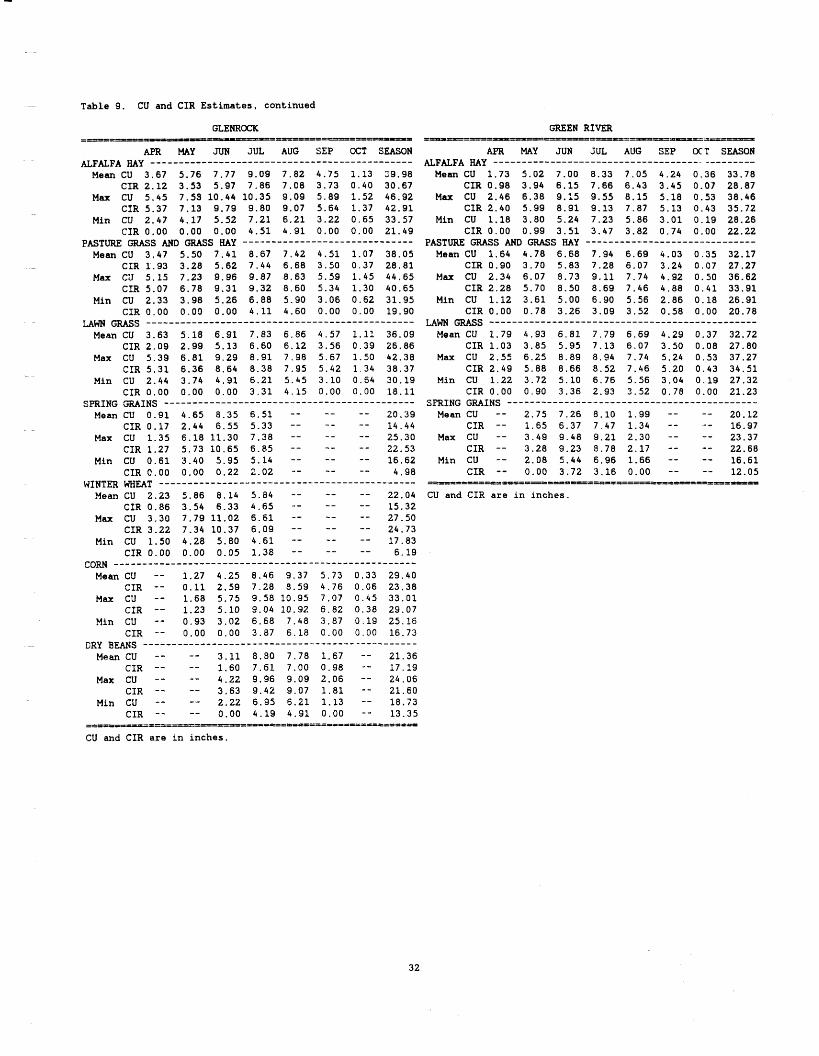
Table 9. CU and CIR Estimates, continued
GLENROCK _----- -------- 1 1 1 5 5 3 1 C = - - i e - - - - e = = r Z = = - -
APR MAY JUN JUL AUG SEP CCT SEASON
Mean CU 3.67 5.76 7.77 9.09 7.82 4.75 1.13 39.98 CIR 2.12 3.53 5.97 7.86 7.08 3.73 0.40 30.67
Max CU 5.45 7.53 10.44 10.35 9.09 5.89 1.52 46.92 CIR 5.37 7.13 9.79 9.80 9.07 5.64 1.37 42.91
Min CU 2.47 4.17 5.52 7.21 6.21 3.22 0.65 33.57 CIR 0.00 0.00 0.00 4.51 4.91 0.00 0.00 21.49
Mean CU 3.47 5 . 5 0 7.41 8.67 7.42 4.51 1.07 38.05 CIR 1.93 3.28 5.62 7.44 6.68 3.50 0.37 28.81
Max Cil 5.15 7.23 9.96 9.87 8.63 5.59 1.45 44.65 CIR 5.07 6.78 9.31 9.32 8.60 5.34 1.30 40.65
Min CU 2.33 3.98 5.26 6.88 5.90 3.06 0.62 31.95 CIR 0.00 0.09 0.00 4.11 4.60 0.00 0.00 19.90
a s __--_____------I-------------------------------
Mean CU 3.63 5 . 1 8 6.91 7.83 6.86 4.57 1.11 36.09 CIR 2.09 2.99 5.13 6.60 6.12 3.56 C.39 26.86
Max CU 5.39 6.81 9.29 8.91 7.38 5.67 1.50 42.38 CIR 5.31 6.36 8.64 8.38 7.95 5.42 1.34 38.37
Min CU 2.44 3.74 4.91 6.21 5.45 3.10 0.64 30.19 CIR 0.00 0.00 0.00 3.31 4.15 0.00 0.00 18.11
Mean CU 0.91 4.65 8.35 6.51 -- -- -- 20.39 CIR 0.17 2.44 6.55 5.33 -- -- -- 14.44
Max CU 1.35 6.18 11.30 7.38 -- -- -- 25.30 CIR 1.27 5.73 10.65 6.85 -- -- -- 22.53
Min CU 0.61 3.40 5.95 5.14 -- -- -- 16.62 CIR 0.00 0.00 0.22 2.02 -- -- -- 4.98
Mean CU 2.23 5.86 8.14 5.84 -- -- -- 22.04 CXR 0.86 3.54 6.33 4.65 -- -- -- 15.32
M a x CU 3-30 7.79 11.02 6.61 -- -- -- 27.50 CIR 3.22 7.34 10.37 6.09 -- -- -- 24.73
Min CU 1.50 4.28 5.80 4.61 -- -- -- 17.83 CIR 0.00 0.00 0.05 1.38 -- -- -- 6.19 cow ______-I-____----------------------------------------
Mean CU -- 1.27 4.25 8.46 9.37 5.73 0.33 29.40 CIR -- 0.11 2.59 7.28 8.59 4.76 0.06 23.38
Max CU -- 1.68 5.75 9.58 10.95 7.07 0.45 33.01 CIR -- 1.23 5.10 9.04 10.92 6.82 0.38 29.07
Min CU -- 0.93 3.02 6.68 7.48 3.87 0.19 25.16 CIR -- 0.00 0.00 3.87 6.18 0.00 0.00 16.73
Mean CU -- -- 3.11 8 . 8 0 7.78 1.67 - - 21.36 CIR -- -- l.60 7.61 7.00 0.98 -- 17.19
Max CU -- - - 4.22 9.96 9.09 2.06 -- 24.06 CIR -- -- 3.63 9.42 9.07 1.81 -- 21.60
Min CU -- -- 2.22 6.95 6.21 1.13 -- 18.73 CIR -- -- 0.00 4.19 4.91 0.00 -- 13.35
ALFALFA HAY _-______--------------------------------------
PASTURE GRASS AND GRASS M y -_ -_- - --------------- ---- -----
SPRING =INS _____-----_---------__________l______l__----
WINTER WHUT -____---------------_________I__________-----
DRY BEANS ___-______---____--_-------- - - -~-------- - -~~-----
----==-==rt==---~~--Df==tE--=~~*====================
CU and CIR are in inches.
GREEN RIVER I --- P-;cI==~-po I==-Ix-ac=-- a d
APR MAY JUN JUL AUG SEP OCT SEASON
Mean CU 1.73 5 . 0 2 7.00 8.33 7.05 4.24 0.36 33.78 CIR 0.98 3.94 6.15 7.66 6.43 3.45 0.07 28.87
Max CU 2.46 6.38 9.15 9.55 8.15 5.18 0.53 38.46 CIR 2.40 5.99 8.91 9.13 7.87 5.13 0.43 35.72
Min CU 1.18 3.80 5.24 7.23 5.86 3.01 0.19 28.26 CIR 0.00 0.99 3.51 3.47 3.82 0.74 0.00 22.22
Mean CU 1.64 4.78 6.68 7.94 6.69 4.03 0.35 32.17 CIR 0.90 3.70 5.83 7.28 6.07 3.24 0.07 27.27
Max CU 2.34 6.07 8.73 9.11 7.74 4.92 0.50 36.62 CIR 2.28 5.70 8.50 8.69 7.46 4.88 0.41 33.91
Min CU 1.12 3.61 5.00 6.90 5.56 2.86 0.18 26.91 CIR 0.00 0.78 3.26 3.09 3.52 0.58 0.00 20.78
a s -____------------I-----------------------------
Mean CU 1.79 4.93 6.81 7.79 6.69 4.29 0.37 32.72 CIR 1.03 3.85 5.95 7.13 6.07 3.50 0.08 27.80
Max CU 2.55 6.25 8.89 8.94 7.74 5.24 0.53 37.27 CIR 2.49 5.88 8.66 8.52 7.46 5.20 0.43 34.51
Min CU 1.22 3.72 5.10 6.76 5.56 3.04 0.19 27.32 CIR 0.00 0.90 3.36 2.93 3.52 0.78 0.00 21.23
Mean CU -- 2.75 7.26 8.10 1.99 -- -- 20.12 CIR -- 1.65 6.37 7.47 1.34 -- -- 16.97
3.49 9.48 9.21 2.30 -- -- 23.37 Max CU - - CIR -- 3.28 9.23 8.78 2.17 -- -- 22.68
2.08 5.44 6.96 1.66 -- -- 16.61 Min CU -- CIR -- 0.00 3.72 3.16 0.00 -- -- 12.05
ALFALFA M y _---------------------------------------------
PASTURE GRASS AND GRASS my --------------------I_________
SFRING GRAINS --_----_____--_-----------------------------
................................................
CU and CIR are i n inches.
32
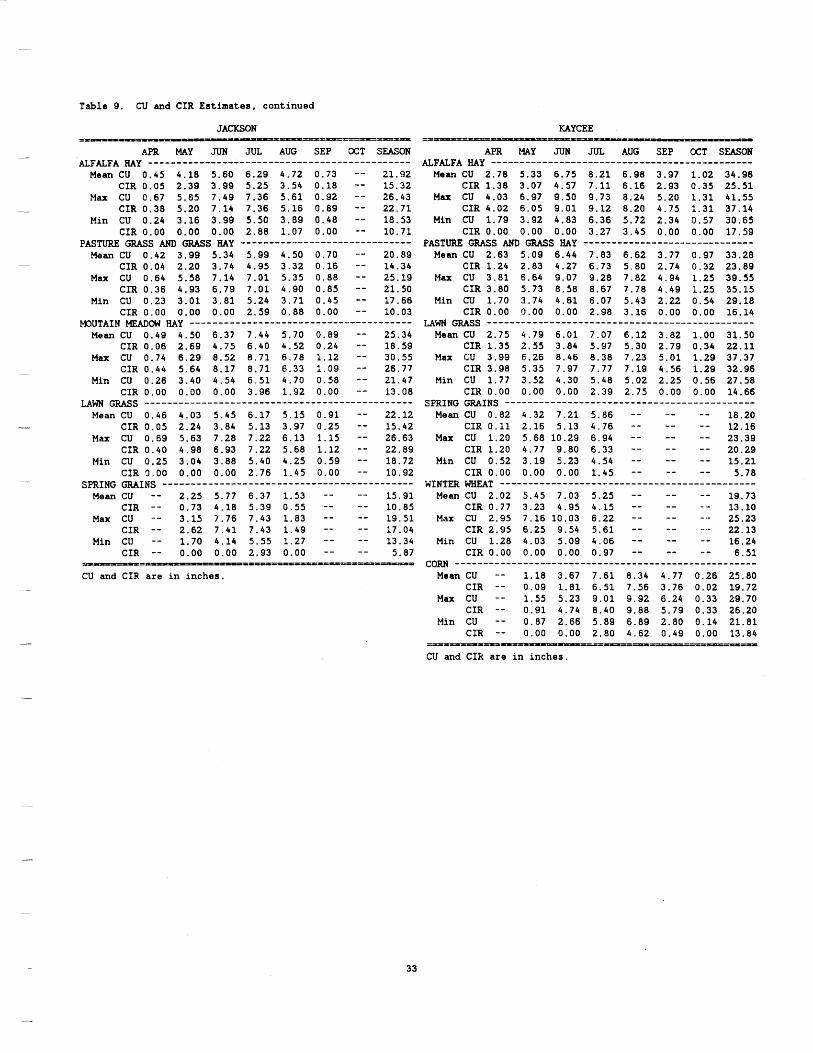
Table 9. CU and CIR Estimates, continued
JACKSON - ~ - - - - = = - ~ - = = - = = = = ~ ~ = ~ - ~ ~ -
APR MAY JUN JUL AUG SEP OCT SEASON ALFALFA my _----------------I----------------------------
Mean CU 0.45 4.18 5.60 6.29 4.72 0.73 -- 21.92 CIR 0.05 2.39 3.99 5.25 3.54 0.18 -- 15.32
Max CU 0.67 5.85 7.49 7.36 5.61 0.92 -- 26.43 CIR 0.38 5.20 7.14 7.36 5.16 0.89 -- 22.71
Min CU 0.24 3.16 3.99 5.50 3.89 0.48 -- 18.53 CIR 0.00 0.00 0.00 2.88 1.07 0.00 -- 10.71
Mean CU 0.42 3.99 5.34 5.99 4.50 0.70 --- 20.89 CIR 0.04 2.20 3.74 4.95 3.32 0.16 -- 14.34
Max CU 0.64 5.58 7.14 7.01 5.35 0.89 -- 25.19 CIR 0.36 4.93 6.79 7.01 4.90 0.85 -- 21.50
Min CU 0.23 3.03. 3.81 5.24 3.71 0.45 -- 17.66 CIR 0.00 0.00 0.00 2.59 0.88 0.00 -- 10.03
Mean CU 0.48 4.50 6.37 7.44 5.70 0.89 -- 25.34 CIR 0.06 2.69 4.75 6.40 4.52 0.24 -- 18.59
Max CU 0.74 6.29 8.52 8.71 6.78 1.12 -- 30.55 CIR 0.44 5.64 8.17 8.71 6.33 1.99 -- 26.77
Min CU 0.26 3.40 4.54 6.51 4.70 0.58 -- 21.47 CIR 0.00 0.00 0.00 3.96 1.92 0.00 -- 13.08
LAWN (I';RAss ----------------------------------------------- Mean CU 0.46 4.03 5.45 6.17 5.15 0.91 -- 22.12
CIR 0.05 2.24 3.84 5.13 3.97 0.25 -- 15.42 Max CU 0.69 5.63 7.28 7.22 6.13 1.15 -- 26.63
CIR 0.40 4.98 6.93 7.22 5.68 1.12 -- 22.89 Min CU 0.25 3.04 3.88 5.40 4.25 0.59 -- 18.72
CIR 3 . 0 0 0.00 0.00 2.76 1.45 0.00 -- 10.92
Mean CU -- 2.25 5.77 6.37 1.53 -- -- 15.91 CIR -- 0.73 4.18 5.39 0.55 -- -- 10.85
Max CU -- 3.15 7.76 7.43 1.83 -- -- 19.51 CIR -- 2.62 7.41 7.43 1.49 -- -- 17.04
Min CU -- 1.70 4.14 5.55 1.27 -- -- 13.34 CIR -- 0.00 0.00 2.93 0.00 -- -- 5.87
PASTURE GRASS AND GRASS m y I-----------------------------
MOUTAIN m o w HAY -__------------------------------------
SPRING GRAINS --------------------------------------------
CU and CIR are i n inches.
KAYCEE ==---- ==-==---I=----=-
APR MAY JUN JUL AUG SEP OCT SEASON
Mean CU 2.78 5.33 6.75 8.21 6.98 3.97 1.02 34.96 CIR 1.38 3.07 4.57 7.11 6.16 2.93 0.35 25.51
M a x CU 4.03 6.97 9.50 9.73 8.24 5.20 1.31 41.55 CIR 4.02 6.05 9.01 9.12 8.20 4.75 1.31 37.14
Min CU 1.79 3.92 4.83 6.36 5.72 2.34 0.57 30.65 CIR 0.00 0.00 0.00 3.27 3.45 0.00 0.00 17.59
Mean CU 2.63 5.09 6.44 7.83 6.62 3.77 0.97 33.28 CIR 1.24 2.83 4.27 6.73 5.80 2.74 0.32 23.89
Max CU 3.81 6.64 9.07 9.28 7.82 4.94 1.25 39.55 CIR 3.80 5.73 8.58 8.67 7.78 4.49 1.25 35.15
Min CU 1.70 3.74 4.61 6.07 5.43 2.22 0.54 29.18 CIR 0.00 0.00 0.00 2.98 3.16 0.00 0.00 16.14
GRASS ----------------------------------------------- Mean CU 2.75 4.79 6.01 7.07 6.12 3.82 1.00 31.50
CIR 1.35 2.55 3.84 5.97 5.30 2.79 0.34 22.11 Max CU 3.99 6.26 8.46 8.38 7.23 5.01 1.29 37.37
CIR 3.98 5.35 7.97 7.77 7.19 4.56 1.29 32.96 Min CU 1.77 3.52 4.30 5.48 5.02 2.25 0.56 27.58
CIR 0.00 0.00 0.00 2.39 2.75 0.00 0.00 14.66
Mean CU 0.82 4.32 7.21 5.86 -- -- -- 18.20 CIR 0.11 2.16 5.13 4.76 -- -- -.- 12.16
Max CU 1.20 5.68 10.29 6.94 -- -- -- 23.39 CIR 1.20 4.77 9.80 6.33 -- -- -- 20.29
Min CU 0.52 3.19 5.23 4.54 -- -- -- 15.21 CIR 0.00 0.00 0.00 1.45 -- -- -- 5.78
Mean CU 2.02 5.45 7.03 5.25 -- -- -- 19.73 CIR 0.77 3.23 4.95 4.15 -- -- - - 13.10
Max CU 2.95 7.16 10.03 6.22 -- -- -.- 25.23 CIR 2.95 6.25 9.54 5.61 -- -- -.- 22.13
Min CU 1.28 4.03 5.09 4.06 -- -- -- 16.24 CIR 0.00 0.00 0.00 0.97 -- -- -- 6.51 cow -----------------------------------------------------
Mean CU -- 1.18 3.67 7.61 8.34 4.77 0.26 25.80 CIR -- 0.09 1.81 6.51 7.56 3.76 0.02 19.72
Max CU -- 1.55 5.23 9.01 9.92 6.24 0.33 29.70 CIR -- 0.91 4.74 8.40 9.88 5.79 0.33 26.20
Min CU -- 0.87 2.66 5.89 6.89 2.80 0.14 21.81 CIR -- 0.00 0.00 2.80 4.62 0.49 0.00 13.84
ALFALFA HAY ------I---------------------------------------
PASTURE GRASS AND GRASS my ..............................
SPRING GRAINS --------------------------------------------
WINTER WEAT ---------------------------------------------
CU and CIR are i n inches.
33
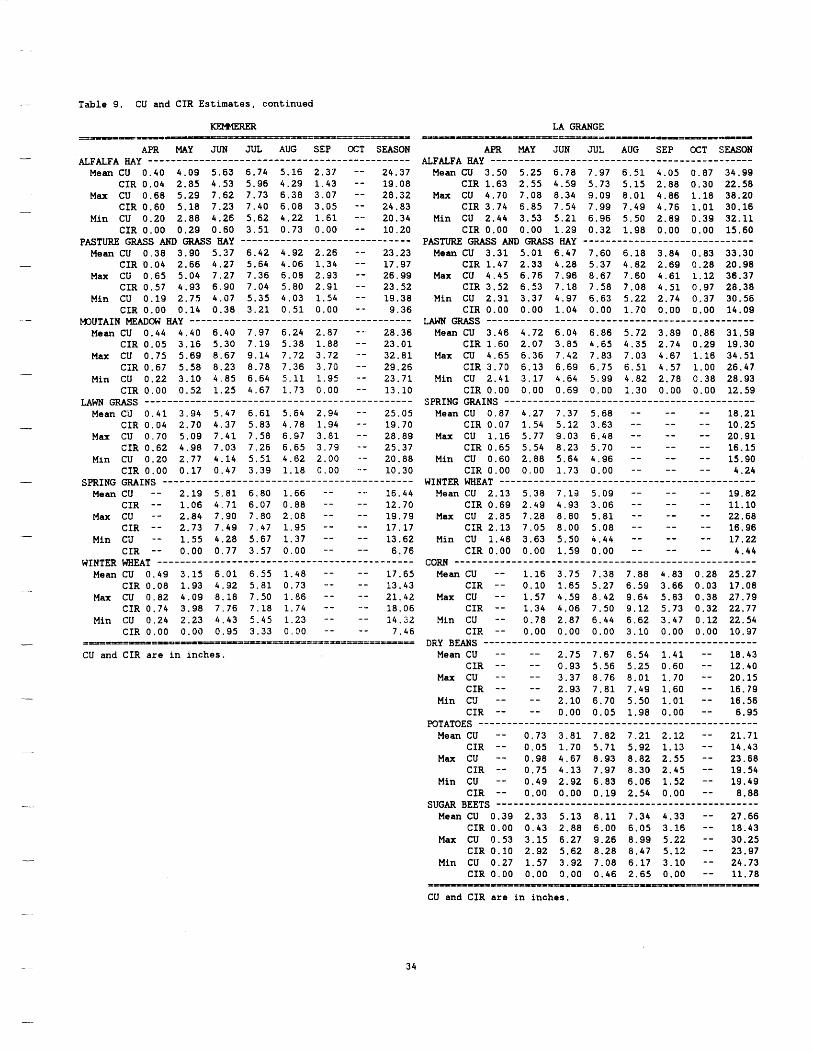
- Table 9. CU and CIR Estimates, continued
KEplMERER ---=-=---a==------ --=s----=---=
APR MAY JUN JUL AUG SEP OCT SEASON
Mean CU 0.40 4.09 5.63 6.74 5.16 2.37 -- 24.37 CIR 0.04 2.85 4.53 5.96 4.29 1.43 -- 19.08
Max CU 0.68 5.29 7.62 7.73 6.38 3.07 -- 28.32 - CIR 0.60 5.18 7.23 7.40 6.08 3.05 -- 24.83
Mfn CU 0.20 2.88 4.26 5.62 4.22 1.61 -- 20.34 CIR 0.00 0.29 0.60 3.51 0.73 0.00 -- 10.20
Mean CU 0.38 3.90 5.37 6.42 4.92 2.26 -- 23.23 - CIR 0.04 2.66 4.27 5.64 4.06 1.34 -- 17.97
Max CU 0.65 5.04 7.27 7.36 6.08 2.93 -- 26.99 CIR 0.57 4.93 6.90 7.04 5.80 2.91 -- 23.52
Fin CU 0.19 2.75 4.07 5.35 4.03 1.54 -- 19.38 CIR 0.00 0.14 0.38 3.21 0.51 0.00 -- 9.36
Mean CU 0.44 4.40 6.40 7.97 6.24 2.87 --. 28.36 CIR 0.05 3.16 5.30 7.19 5.38 1.88 -- 23.01
Max CU 0.75 5.69 8.67 9.14 7.72 3.72 .-- 32.81 CSR 0.67 5.58 8.23 8.78 7.36 3.70 -- 29.25
Min CU 0.22 3.10 4.85 6.64 5.11 1.95 -- 23.71 CIR 0.00 0.52 1.25 4.67 1.73 0.00 -- 13.10
Mean CU 0.41 3.94 5.47 6.61 5.64 2.94 -- 25.05 - CIR 0.04 2.70 4.37 5.83 4.78 1.94 -- 19.70
Max CU 0.70 5.09 7.41 7.58 6.57 3.81 -- 28.89 CIR 0.62 4.98 7.03 7.26 6.65 3.79 - - 25.37
Min CU 0.20 2.77 4.14 5.51 4.62 2.00 - - 20.88 CIR 0.00 0.17 0.47 3.39 1.18 C.00 -- 10.30
Mean CU -- 2.19 5.81 6.80 1.66 -- -- 16.44 CIR -- 1.06 4.71 6.07 0.88 -- -- 1.2.70
Max CU -- 2.84 7.90 7.80 2.08 -- -- 19.79 CXR - - 2.73 7.49 7.47 1.95 -- -- 17.17
Min CU -- 1.55 4.28 5.67 1.37 -- -- 13.62 CIR -- 0.00 0.77 3.57 0.00 - - -- 6.76
Mean CU 0.49 3.15 6.01 6.55 1.48 -- -- 17.65 CIR 0.08 1.93 4.92 5.81 0.73 -- -- 13.43
Max CU 0.82 4.09 8.18 7.50 1.86 -- -- 21.42 CIR 0.74 3.98 7.76 7.18 1.74 -- -- 18.06
Min CU 0.24 2.23 4.43 5.45 1.23 -- -- 14.22 CIR 0.00 O.QO 0.95 3.33 O.@O -- -- 7.46
ALFALFA my --__------------------------------------------ -
P S T W GRASS AND GRASS m y ------------------I-----------
- MOUTAIN m?m m y -----------------..---------------------
LAWN GRASS ---__------------------------------------------
- SPRING GRAINS ___-----------------------------------------
WTNTn WHEAT -_____--------------___I________________"----
- =1=-==-Yr--I----~=~~=-====*-====================
CU and CIR are in inches.
LA GRANGE =-~ I Ip .c IL I~===~~~=======~-~~=-~~-
AER MAY JUN JUL AUG SEP OCT SEASON
Mean CU 3.50 5.25 6.78 7.97 6.51 4.05 0.87 34.99 CIR 1.63 2.55 4.59 5.73 5.15 2.88 0.30 22.58
Max CU 4.70 7.08 8.34 9.09 8.01 4.86 1.18 38.20 CIR 3.74 6.85 7.54 7.99 7.49 4.76 1.01 30.16
Min CU 2.44 3.53 5.21 6.96 5.50 2.89 0.39 32.11 CIR 0.00 0.00 1.29 0.32 1.98 0.00 0.00 15.60
Mean CU 3.31 5.01 6.47 7.60 6.18 3.84 0.83 33.30 CIR 1.47 2.33 4.28 5.37 4.82 2.69 0.28 20.98
Max CU 4.45 6.76 7.96 8.67 7.60 4.61 1.12 36.37 CIR 3.52 6.53 7.18 7.58 7.08 4.51 0.97 28.38
Min CU 2.31 3.37 4.97 6.63 5.22 2.74 0.37 30.56 CIR 0.00 0.00 1.04 0.00 1.70 0.00 0.00 14.09
Mean CU 3.46 4.72 6.04 6.86 5.72 3.89 0.86 31.59 CIR 1.60 2.07 3.85 4.65 4.35 2.74 0.29 19.30
Max CU 4.65 6.36 7.42 7.83 7.03 4.67 1.16 34.51 CIR 3.70 6.13 6.69 6.75 6.51 4.57 1.00 26.47
Min CU 2.41 3.17 4.64 5.99 4.82 2.78 0.38 28.93 CIR 0.00 0.00 0.69 0.00 1.30 0.00 0.00 12.59
Mean CU 0.87 4.27 7.37 5.68 -- -- -- 18.21 CIR 0.07 1.54 5.12 3.63 -- -- -- 10.25
Max CU 1.16 5.77 9.03 6.48 -- -- -- 20.91 CIR 0.65 5.54 8.23 5.70 -- -- -- 16.15
Min CU 0.60 2.88 5.64 4.96 -- -- -- 15.90 CIR 0.00 0.00 1.73 0.00 -- -- -- 4.24
Mean CU 2.13 5.38 7.13 5.09 -- -- -- 19.82 CIR 0.69 2.49 4.93 3.06 -- -- -- 11. lo
Max CU 2.85 7.28 8.80 5.81 - - -- -- 22.68 CIR 2.13 7.05 8.00 5.08 -- -- -- 16.96
Min CU 1.48 3.63 5.50 4.44 -- -- -- 17.22 CIR 0.00 0.00 1.59 0.00 -- -- -- 4.44
CORN ..................................................... Mean CU -- 1.16 3.75 7.38 7.88 4.83 0.28 25.27
CIR -- 0.10 1.65 5.27 6.59 3.66 0.03 17.08 Max CU -- 1.57 4.59 8.42 9.64 5.83 0.38 27.79
CIR -- 1.34 4.06 7.50 9.12 5.73 0.32 22.77 Hin CU -- 0.78 2.87 6.44 6.62 3.47 0.12 22.54
CIR -- 0.00 0.00 0.00 3.10 0.00 0.00 10.97
Mean CU -- -- 2.75 7.67 6.54 1.41 -- 18.43 CIR -- -- 0.93 5.56 5.25 0.60 -- 12.40
Max CU -- -- 3.37 8.76 8.01 1.70 -- 20.15 CIR -- -- 2.93 7.81 7.49 1.60 -- 16.79
Min C'J -- -- 2.10 6.70 5.50 1.01 -- 16.56 CIR -- -- 0.00 0.05 1.98 0.00 -- 6.95
Mean CU -- 0.73 3.81 7.82 7.21 2.12 -- 21.71 CIR -- 0.05 1.70 5.71 5.92 1.13 -- 14.43
Max CU -- 0.98 4.67 8.93 8.82 2.55 -- 23.68 CIR -- 0.75 4.13 7.97 8.30 2.45 -- 19.54
Min CU -- 0.49 2.92 6.83 6.06 1.52 -- 19.49 CIR -- 0.00 0.00 0.19 2.54 0.00 -- 8.88
Mean CU 0.39 2.33 5.13 8.11 7.34 4.33 -- 27.66 CIR 0.00 0.43 2.88 6.00 6.05 3.16 -- 10.43
Max CU 0.53 3.15 6.27 9.26 8.99 5.22 -- 30.25 CIR 0.10 2.92 5.62 8.28 8.47 5.12 -- 23.97
Min CU 0.27 1.57 2.92 7.08 6.17 3.10 -- 24,73 CIR 0.00 0.00 9.00 0.46 2.65 0.00 -- 11.78
ALFALFA m y ------------------_---------------------------
PASTURE GRASS AND GRASS M y ..............................
LAWN GRASS -----------------------------------------------
SPRING W I N S --------------------------------------------
WINTER WHEAT ------------I--------------------------------
DRY BEANS ------------------------------------------------
POTATOES -------------------------------------------------
SUGM BEETS ..............................................
CU and CIR are in inches.
34
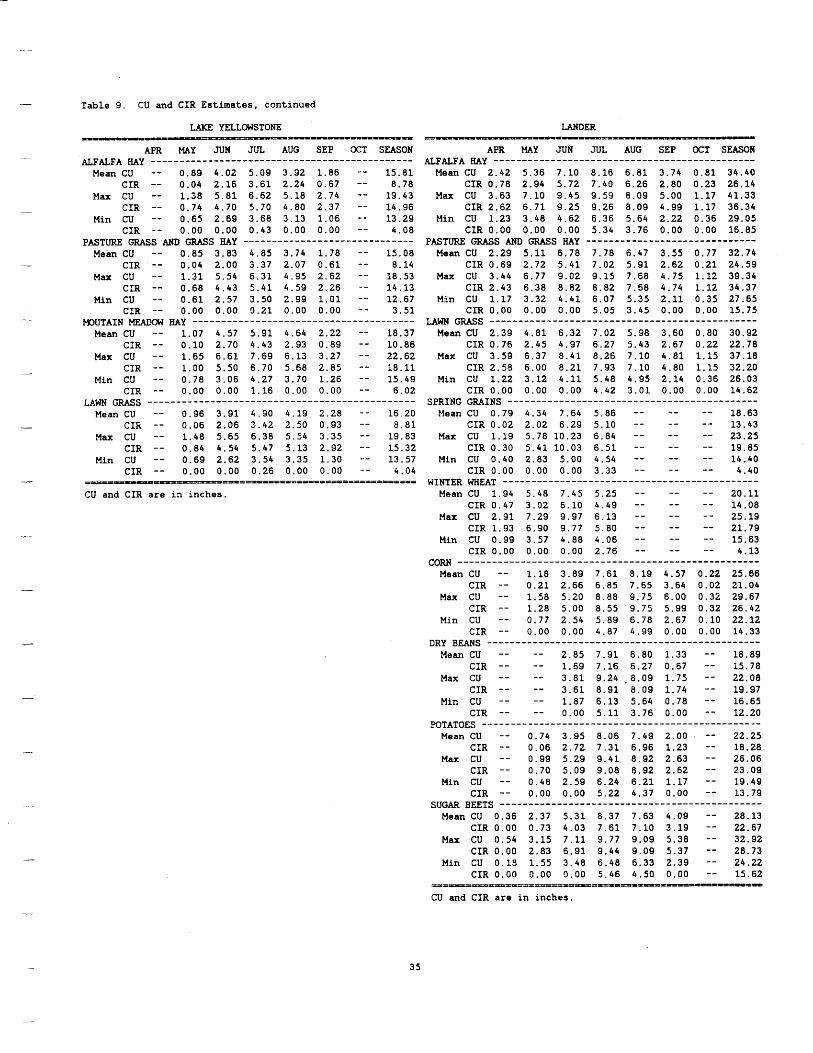
- Table 9. CU and CIR Estimates, continued
LAKE YELLOWSTONE ---A --- ==-=---==-==-
APR MAY JUN JUL AUG SEP OCT SEASON
Mean CU -- 0.89 4.02 5.09 3.92 1.86 -- 15.81 CIR -- 0.04 2.16 3.61 2.24 0.67 -- 8.78
Max CU -- 1.38 5.81 6.62 5.18 2.74 -- 13.43 __ CIR -- 0.74 4.70 5.70 4.80 2.37 -- 14.96
Min CU -- 0.65 2.69 3.68 3.13 1.06 -*. 13.29 CIR -- 0.00 0.00 0.43 0.00 0.00 -- 4.08
Mean CU -- 0.85 3.83 4.85 3.74 1.78 -- 15.08 - CIR -- 0.04 2.00 3.37 2.07 0.61 -- 8.14
Max CU -- 1.31 5.54 6.31 4.95 2.62 -- 18.53 CIR -- 0.68 4.43 5.41 4.59 2.26 - - 14.13
Min CU -- 0.61 2.57 3.50 2.99 1.01 -- 12.67 CIR -- 0.00 0.00 0.21 0.00 0.00 -- 3.51
Mean CU -- 1.07 4.57 5.91 4.64 2.22 -- 18.37 CIR -- 0.10 2.70 4.43 2.93 0.89 -- 10.86
Max CU -- 1.65 6.61 7.69 6.13 3.27 -.- 22.62 CIR -- 1.00 5.50 6.70 5.68 2.85 -- i8.11
Min CU -- 0.78 3.06 4.27 3.70 1.26 -- 15.49 CIR -- 0.00 0.00 1.16 0.00 0.00 -- 6.02
Mean CU -- 0.96 3.91 4.90 4.19 2.28 -- 16.20 I CIR -- 0.06 2.06 3.42 2.50 0.93 -- 8.81
Max CU -- 1.48 5.65 6.38 5.54 3.35 -- 19.83 CIR -- 0.84 4.54 5.47 5.13 2.92 -- 15.32
Min CU -- 0.69 2.62 3.54 3.35 1.30 --- 13.57 CIR -- 0.00 0.00 0.26 0.00 0.00 -- 4.04
ALFALFA my __________-------__--------------------------- I
PASTURE a s s AND a s my -_---_------------------------
- MOUTAIN MEADOW my ___-------__________-------------------
-
LAWN GRASS ____________________---------------------------
- ===--=-- .................................
CU and CIR are iil inches.
LANDER rr- --.-==-=----
APR MAY JUN JUL AUG SEP OCT SEASON
Mean CU 2.42 5.36 7.10 8.16 6.81 3.74 0.81 34.40 CIR 0.78 2.94 5.72 7.40 6.26 2.80 0.23 26.14
Max cu 3.63 7.10 9.45 9.59 8.09 5 . 0 0 1.17 41.33 CIR 2.62 6.71 9.25 9.26 8.09 4.99 1.17 36.34
Min CU 1.23 3.48 4.62 6.36 5.64 2.22 0.36 29.05 CIR 0.00 0.00 0.00 5.34 3.76 0.00 0.00 16.85
Mean CU 2.29 5.11 6.78 7.78 6.47 3.55 0.77 32.74 CIR 0.69 2.72 5.41 7.02 5.91 2.62 0.21 24.59
Max CU 3.44 6.77 9.02 9.15 7.68 4.75 1.12 39.34 CIR 2.43 6.38 8.82 8.82 7.68 4.74 1.12 34.37
Min CU 1.17 3.32 4.41 6.07 5.35 2.11 0.35 27.65 CIR 0.00 0.00 0.00 5.05 3.45 0.00 0.00 15.75
Mean CU 2.39 4.81 6.32 7.02 5.98 3.60 0.80 30.92 CIR 0.76 2.45 4.97 6.27 5.43 2.67 0.22 22.78
Max CU 3.53 6.37 8.41 8.26 7.10 4.81 1.15 37.18 CIR 2.58 6.00 8.21 7.93 7.10 4.80 1.15 32.20
Min CU 1.22 3.12 4.11 5.48 4.95 2.14 0.36 26.03 CIR 0.00 0.00 0.00 4.42 3.01 0.00 0.00 14.62
Mean CU 0.79 4.34 7.64 5.86 -- -- -- 18.63 CIR 0.02 2.02 6.29 5.10 -- -- -.- 13.43
Max CU 1.19 5.78 10.23 6.84 -- -- -- 23.25 CIR 0.30 5.41 10.03 6.51 -- -- -- 19.85
Min CU 0.40 2.83 5.00 4.54 -- -- -- 14.40 CIR 0.00 0.00 0.00 3.33 -- -- -- 4.40
Mean CU 1.94 5.48 7.45 5.25 -- -- -- 20.11 CIR 0.47 3.02 6.10 4.49 -- -- -- 14.08
Max CU 2.91 7.29 9.97 6.13 -- -- -- 25.19 CIR 1.93 6.90 9.77 5.80 -- -- -- 21.79
Min CU 0.99 3.57 4.88 4.06 -- -- -- 15.63 CIR 0.00 0.00 0.00 2.76 -- -- -- 4.13 cow .....................................................
Mean CU -- 1.18 3.89 7.61 8.19 4.57 0.22 25.66 CIR -- 0.21 2.66 6.85 7.65 3.64 0.02 21.04
Max CU -- 1.58 5.20 8.88 9.75 6.00 0.32 29.67 CIR -- 1.28 5.00 8.55 9.75 5.99 0.32 26.42
Min CU -- 0.77 2.54 5.89 6.78 2.67 0.10 22.12 CIR -- 0.00 0.00 4.87 4.99 0.00 0.00 14.33
Mean CU -- -- 2.85 7.91 6.80 1.33 -- 18.89 CIR -- -- 1.69 7.16 6.27 0.67 -- 15. 78
Max CU -- -- 3.81 9.24 -8.09 1.75 -- 22.08 CIR -- -- 3.61 8.91 8.09 1.74 -- 19.97
Min CU -- -- 1.87 6.13 5.64 0.78 -- 16.65 CIR -- -- 0.00 5.11 3.76 0.00 -- 12.20
Mean CU -- 0.74 3.95 8.06 7.49 2.00 -- 22.25 CIR -- 0.06 2.72 7.31 6.96 1.23 -- 18.28
Max CU -- 0.99 5.29 9.41 8.92 2.63 -- 26.06 CIR -- 0.70 5.09 9.08 8.92 2.62 -- 23.09
Min CU -- 0.48 2.59 6.24 6.21 1.17 -- 19.49 CIR -- 0.00 0.00 5.22 4.37 0.00 -- 13.79
Mean CU 0.36 2.37 5.31 8.37 7.63 4.09 -- 28.13 CIR 0.00 0.73 4.03 7.61 7.10 3.19 -- 22.67
Max CU 0.54 3.15 7.11 9.77 9.09 5.38 -- 32.92 C I R 0.00 2.83 6.91 9.44 9.09 5.37 -- 28.73
Min CU 0.19 1.55 3.48 6.48 6.33 2.39 -- 24.22 CIR 0.00 0.00 9.00 5.46 4.50 0.00 -- 15.62
ALFALFA my ..............................................
PASTURE GRASS AM) a s my ---------------- ---- ----------
GRASS -----------------------------------------------
SPRING GRAINS --------------------______________I_____----
WINTER WEAT _______-_-__---_-___---------------------~---
DRY BEANS ----I-------------------------------------------
mTATOES __---_--------------_I__________________---------
SUGAR BEETS --.------------------_________I__________------
I P I - = P I I * = = - = I = = ~ = ~ = = ~ = = = ~ = a % ~ = ~ = = ~ -=- CU and CIR are in inches.
35
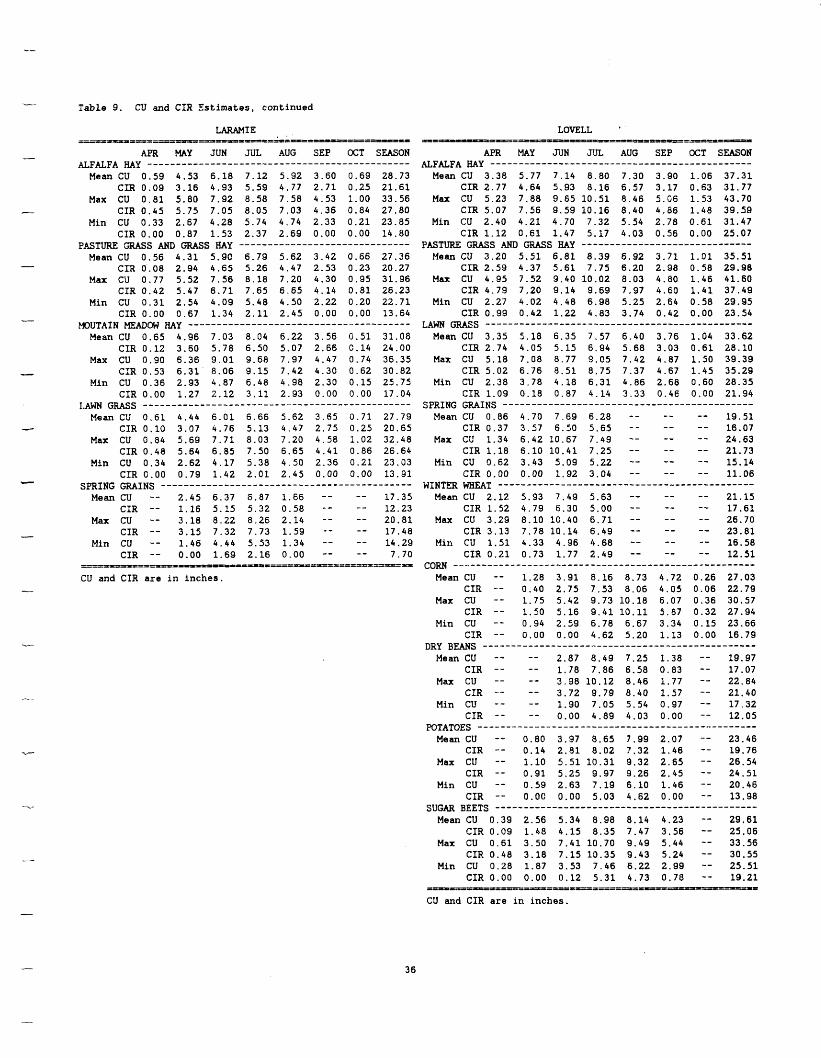
Table 9. CU and CIR Sstirnates, continued --
LARAMIE E--t9n======----=~--II=IEIP=P=rIIIDIZE===~=~=~=
APR MAY JUN JUL AUG SEP OCT SEASON
Mean CU 0.59 4.53 6.18 7.12 5.92 3.60 0.69 28.73 CIR 0.09 3.16 4.93 5.59 4.77 2 .71 0.25 21 .61
Max CU 0 .81 5.80 7.92 8.58 7.58 4.53 1.00 33.56 - CIR 0.45 5.75 7.05 8.05 7.03 4.36 0.84 27.80
Min CU 0.33 2.67 4.28 5.74 4 .74 2.33 0 . 2 1 23.85 CIR 0 .00 0.87 1.53 2.37 2.69 0.00 0.00 14.80
Mean CU 0.56 4 .31 5.90 6.79 5.62 3.42 0.66 27.36 CIR 0.08 2.94 4.65 5.26 4.47 2.53 0.23 20.27
Max CU 0.77 5.52 7 .56 8.18 7.20 4.30 0.95 31.96 CIR 0.42 5.47 6 . 7 1 7.65 6.65 4.14 0 . 8 1 26.23
Min CU 0 . 3 1 2.54 4.09 5.48 4.50 2.22 0.20 22 .71 CIR 0.00 0.67 1.34 2 . 1 1 2.45 0.00 0.00 13.64
Mean CU 0.65 4.96 7.03 8.04 6.22 3.56 0 . 5 1 31.08 CIR 0.12 3.60 5.78 6.50 5.07 2.66 '2.14 24.00
Max CU 0.90 6.36 9 . 0 1 9.68 7.97 4.47 0.74 36.35 - CIR 0.53 6 .31 8.06 9.15 7.42 4.30 0.62 30.82 Min CU 0.36 2.93 4.87 6.48 4.98 2.30 0.15 25.75
CIR 0.00 1.27 2.12 3 . 1 1 2.93 0.00 0.00 17.04
Mean CU 0 . 6 1 4.44 6 . 0 1 6.66 5.62 3.65 0 . 7 1 27.79 4 CIR 0.10 3.07 4.76 5.13 4.47 2.75 0.25 20.65
Max CU 0.84 5.69 7 . 7 1 8.03 7 .20 4.58 1.02 32.48 CIR 0.48 5.64 6.85 7.50 6.65 4 . 4 1 0.86 26.64
Min CU 0.34 2.62 4.17 5.38 4 .50 2.36 0 . 2 1 23.03 CIR 0 .00 0.79 1.42 2 . 0 1 2.45 0.00 0.00 13.91
Mean CU -- 2.45 6 .37 6.87 1.66 -- -- 17.35 CXR -- 1 .16 5 .15 5.32 0.58 -- -- 12.23
Max CU -- 3.18 8.22 8.26 2.14 -- -- 20 .81 CIR -- 3.15. 7 .32 7.73 1.59 -- -- 17.48
Min CU -- 1.46 4.44 5.53 1.34 -- -- 14.29 CIR -- 0.00 1 .69 2.16 0.00 -- -- 7.70
ALFALFA m y -_____--___---_-I___--------------------------
-
PASTURE a s s AND GRASS HAY ________ll_____---_l______II__
-
MOUTAIN W O W my __-___----__-______-_______I___________
-
1,AW GRASS --__________I___--__---------------------------
SPRING GRAINS -__--____--_---_--__------------------------ -
-
Etl-P-P=*=ltPIIP*==========*===========~==~=~
CU and CIR are i n inches.
LOVELL '
APR MAY JUN JUL AUG SEP OCT SEASON
Mean CU 3.38 5.77 7.14 8.80 7.30 3.90 1.06 37.31 CIR 2.77 4.64 5.93 8.16 6.57 3.17 0.63 31.77
Max CU 5.23 7.88 9.85 10.51 8.46 5.G6 1.53 43.70 CXR 5.07 7.56 9.59 10.16 8.40 4.86 1.48 39.59
Min CU 2.40 4 . 2 1 4.70 7.32 5.54 2.78 0 . 6 1 31.47 CIR 1.12 0 .61 1.47 5.17 4.03 0.56 0.09 25.07
Mean CU 3 . 2 0 5 .51 6 . 8 1 8.39 6.92 3.71 1 . 0 1 35.51 CIR 2.59 4.37 5 .61 7.75 6.20 2.98 0.58 29.98
Max CU 4.95 7.52 9.40 10.02 8.03 4.80 1.46 41.60 CIR 4.79 7.20 9.14 9.69 7.97 4.60 1 .41 37.49
Min CU 2.27 4.02 4.48 6.98 5.25 2.64 0.58 29.95 CIR 0.99 0.42 1.22 4.83 3.74 0.42 0.00 23.54
Mean CU 3.35 5.18 6.35 7,57 6.40 3.76 1.04 33.62 CIR 2.74 4.05 5.15 6.94 5.68 3.03 0 .61 28.10
Max CU 5.18 7.08 8 .77 9.05 7 .42 4.87 1.50 39.39 CIR 5.02 6.76 8 . 5 1 8.75 7.37 4.67 1.45 35.29
Min CU 2.38 3 .78 4.18 6 . 3 1 4.86 2.68 0.60 28.35 CIR 1.09 0.18 0.87 4.14 3 . 3 3 0.4E 0.00 21.94
Mean CU 0.86 4.70 7 .69 6.28 - - -- -- 19 .51 CXR 0.37 3.57 6.50 5.65 - - -- -- 16.07
Max CL' 1.34 6.42 10.57 7.49 -- -- -- 24.63 CIR 1.18 6.10 10.41 7.25 -- -- -- 21.73
Min CU 0.62 3.43 5.09 5.22 -- -- -- 15.14 CIR o.ao 0.00 1.92 3.04 -- -- -- 11.06
Mean CU 2.12 5.93 7.49 5.63 -- -- -- 21.15 CIR 1.52 4.79 6.30 5.00 -- -- -- 17.61
Max CU 3.29 8.10 10.40 6 . 7 1 -- -- -- 26.70 CIR 3.13 7.78 10.14 6.49 -- -- -- 23 .81
Min CU 1 .51 4.33 4.96 4.68 -- -- -- 16.58 CIR 0 . 2 1 0.73 1.77 2.49 -- -- -- 12 .51 cow -----------------------------------------------------
Mean CU -- 1.28 3 . 9 1 8.16 8.73 4.72 0.26 27.03 CIR - - 0.40 2.75 7.53 8 .06 4.05 0.06 22.79
Max CU -- 1.75 5.42 9.73 10.18 6.07 0.36 30.57 CIR -- 1.50 5.16 9 . 4 1 1 0 . 1 1 5.87 0.32 27.94
Min CU -- 0.94 2.59 6.78 6.67 3.34 0.15 23.66 CIR -- 0.00 0.00 4.62 5.20 1.13 0.00 16.79
Mean CU -- -- 2.87 8.49 7.25 1.38 -- 19.97 CIR -- -- 1.78 7.86 6.58 0.83 -- 17.07
Max CU -- -- 3.98 10.12 8.46 1.77 -- 22.84 CIR -- -- 3.72 9.79 8.40 1.57 -- 21,40
Min CU - - -- 1.90 7.05 5.54 0.97 -- 17.32 CIR - - -- 0.00 4.89 4.03 0.00 -- 12.05
Mean CU -- 0.80 3.37 8.65 7.99 2.07 -- 23.46 CIR -- 0.14 2 .51 8.02 7.32 1.46 -- 19,76
Max CU -- 1.10 5 .51 10.31 9.32 2.65 -- 26.54 CIR -- 0 . 9 1 5.25 9.97 9.26 2.45 -- 24.51
Min CU -- 0.59 2.63 7.19 6.10 1.46 -- 20,46 CIR -- 0.W 0.00 5.03 4.62 0 .00 -- 13.98
Mean CU 0 .39 2.56 5.34 8.98 8.14 4.23 -- 29.61 CXR 0.09 1.48 4.15 8 .35 7.47 3.56 -- 25.06
Max CU 0 . 6 1 3.50 7 . 4 1 10.70 9.49 5.44 -- 33.56 CIR 0.48 3.18 7.15 10.35 9.43 5.24 -- 30.55
Min CU 0.28 1.87 3.53 7.46 6.22 2.99 -- 25.51 CIR 0.00 0.00 0.12 5 .31 4.73 0.78 -- 19 .21
ALFALFA m y
PASTURE GRASS AND GRASS HAY ------------------------------
LAWN GRASS I----------------------------------------------
SmING GRAINS -----------------__________I____________----
WINTER WHEAT -----------_------I--------------------------
DRY BEANS --------------_---------------------------------
POTATOES -_-_--11__--_-__---1-----------------------------
SuGM BEETS -----------------I--__^_____________II__------
= - ~ ~ ~ - - 3 C ~ I = = = P I = = = = i = e ~ = ~ = ~ ~ - - = = =
CU and CIR are in inches.
36
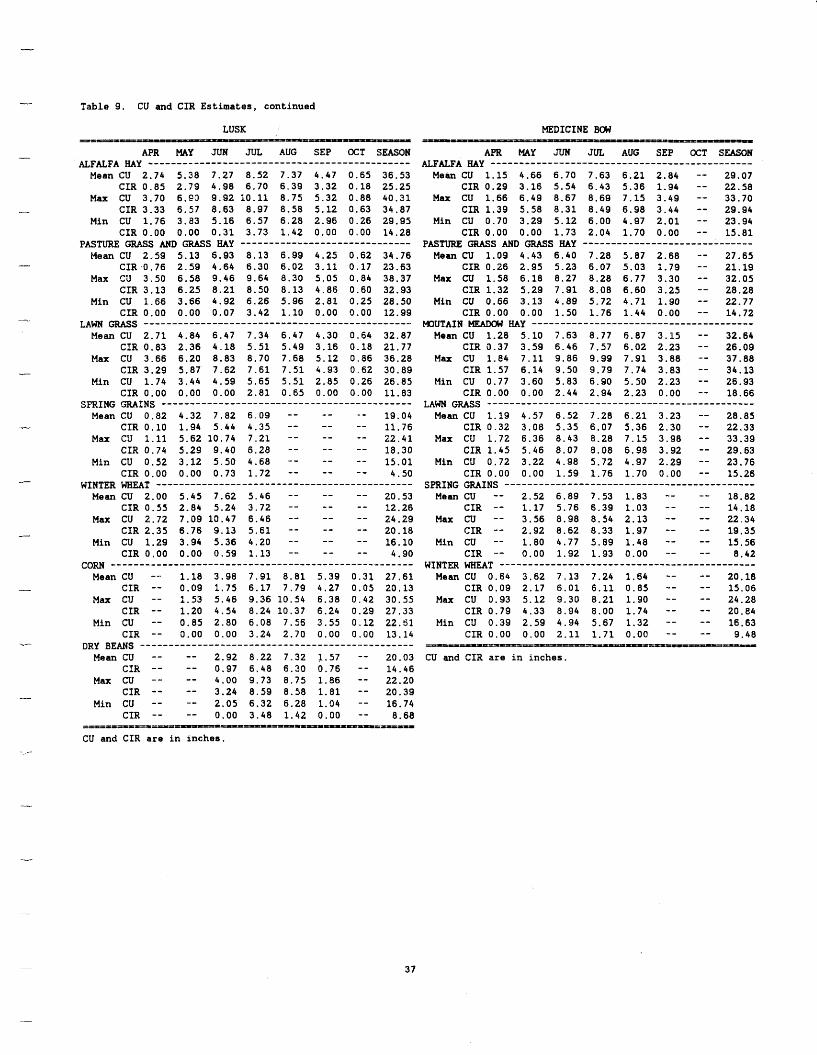
Table 9. CU and CIR Estimates, continued -
I
LUSK , ----i--- =-r-
APR MAY JUN JUL AUG SEP OCT SEASON
Mean CU 2.74 5.28 7.27 8.52 7.37 4.47 0.65 36.53 CIR 0.85 2.79 4.98 6.70 6.39 3.32 0.18 25.25
Max CU 3.70 6.93 9.92 10.11 8.75 5.32 0.88 40.31 CIR 3.33 6.57 8.63 8.97 8.58 5.12 0.63 34.87
Min CU 1.76 3.83 5.16 6.57 6.28 2.96 0.26 29.95 CIR 0.00 0.00 0.31 3.73 1.42 0.00 0.00 14.28
Mean CU 2.59 5.13 6.93 8.13 6.99 4.25 0.62 34.76 CIR 0.76 2.59 4.64 6.30 6.02 3.11 0.17 23.63
Max CU 3.50 6.58 9.46 9.64 8.30 5.05 0.84 38.37 CIR 3.13 6.25 8.21 8.50 8.13 4.86 0.60 32.93
Min CU 1.66 3.66 4.92 6.26 5.96 2.81 0.25 28.50 CIR 0.00 0.00 0.07 3.42 1.10 0.00 0.00 12.99
Mean CU 2.71 4.84 6.47 7.34 6.47 4.30 0.64 32.87 CIR 0.83 2.36 4.18 5.51 5.49 3.16 0.18 21.77
Max CU 3.66 6.20 8.83 8.70 7.68 5.12 0.86 36.28 CIR 3.29 5.87 7.62 7.61 7.51 4.93 0.62 30.89
Min CU 1.74 3.44 4.59 5.65 5.51 2.85 0.26 26.85 CIR 0.00 0.00 0.00 2.81 0.65 0.00 0.00 11.83
Mean CU 0.82 4.32 7.82 6.09 -- -- -- 19.04 CIR 0.10 1.94 5.44 4.35 -- -- -- 11.76
Max CU 1.11 5.62 10.74 7.21 -- -- -- 22.41 CIR 0.74 5.29 9.40 6.28 -- -- -- 18.30
Mln CU 0.52 3.12 5.50 4.68 -- -- -- 15.01 CIR 0.00 0.00 0.73 1.72 -- -- -- 4.50
Mean CU 2.00 5.45 7.62 5.46 -- -- -- 20.53 CIR 0.55 2.84 5.24 3.72 -- -- -- 12.26
Max CU 2.72 7.09 10.47 6.46 -- -- -- 24,29 CIR 2.35 6.76 9.13 5.61 -- -- -- 20.18
Min CU 1.29 3.94 5.36 4.20 -- -- -- 16.10 CIR 0.00 0.00 0.59 1.13 -- -- -- 4.90
CORN ----------------------------------------------------- Mean CU -- 1.18 3.98 7.91 8.81 5.39 0.31 27.61
CIR -- 0.09 1.75 6.17 7.79 4.27 0.05 20.13 M a x CU -- 1.53 5.46 9.36 10.54 6.38 0.42 30.55
CIR -- 1.20 4.54 8.24 10.37 6.24 0.29 27.33 Min CU -- 0.85 2.80 6.08 7.55 3.55 0.12 22.51
CIR -- 0.00 0.00 3.24 2.70 0.00 0.00 13.14
Mean CU -- -- 2.92 8.22 7.32 1.57 -- 20.03 CIR -- -- 0.97 6.48 6.30 0.76 - - 14.46
Max CU -- -- 4.00 9.73 8.75 1.86 -- 22.20 CIR -- -- 3.24 8.59 8.58 1.81 -- 20.39
Min CU -- -- 2.05 6.32 6.28 1.04 -- 16.74 CIR -- -- 0.00 3.48 1.42 0.00 -- 8.68
ALFALFA m y ..............................................
PASTURE GRASS AND GRASS my ..............................
LAWN GRASS -----------------------------------------------. -
SPRING W I N S ___-----------------------------------------
WINTER WHEAT ---------------------------------------------
- DRY BEANS -_------------_-----__________________I_--------
-
= = = = = = = - t = = = = P = ~ = - = ~ a = ~ ~ a ~ ~ ~ n n ~ - = = = -
CU and CIR are in snchas. - -
MEDICINE BOW - =-=-- APR MAY JUN JUL AUG SEP OCT SEASON
Mean CU 1.15 4.66 6.70 7.63 6.21 2.84 -- 29.07 CIR 0.29 3.16 5.54 6.43 5.36 1.94 -- 22.58
Max CU 1.66 6.49 8.67 8.69 7.15 3.49 -- 33.70 CIR 1.39 5.58 8.31 8.49 6.98 3.44 -- 29.94
Min CU 0.70 3.29 5.12 6.00 4.97 2.01 -- 23.94 CIR 0.00 0.00 1.73 2.04 1.70 0.00 -- 15.81
Mean CU 1.09 4.43 6.40 7.28 5.87 2.68 -- 27.65 CIR 0.26 2.95 5.23 6.07 5.03 1.79 -- 21.19
Max CU 1.58 6.18 8.27 8.28 6.77 3.30 -- 32.05 CIR 1.32 5.29 7.91 8.08 6.60 3.25 -- 28.28
Min CU 0.66 3.13 4.89 5.72 4.71 1.90 -- 22.77 CIR 0.00 0.00 1.50 1.76 1.44 0.00 -- 14.72
Mean CU 1.28 5.10 7.63 8.77 6.87 3.15 -- 32.64 CIR 0.37 3.59 6.46 7.57 6.02 2.23 -- 26.09
Max CU 1.84 7.11 9.86 9.99 7.91 3.88 -- 37.88 CIR 1.57 6.14 9.50 9.79 7.74 3.83 -- 34.13
Min CU 0.77 3.60 5.83 6.90 5.50 2.23 -- 26.93 CIR 0.00 0.00 2.44 2.94 2.23 0.00 -- 18.66
Mean CU 1.19 4.57 6.52 7.28 6.21 3.23 -- 28.85 CIR 0.32 3.08 5.35 6.07 5.36 2.30 -- 22.33
Max CU 1.72 6.36 8.43 8.28 7.15 3.98 -- 33.39 CIR 1.45 5.46 8.07 8.08 6.98 3.92 -- 29.63
Min CU 0.72 3.22 4.98 5.72 4.97 2.29 -- 23.76 CIR 0.00 0.00 1.59 1.76 1.70 0.00 -- 15.26
Mean CU -- 2.52 6.89 7.53 1.83 -- -- 18.82 CIR -- 1.17 5.76 6.39 1-03 - - -- 14,18
Max CU -- 3.56 8.98 8.54 2.13 -- -- 22.34 CIR -- 2.92 8.62 8.33 1.97 -- -- 19.35
Min CU -- 1.80 4.77 5.89 1.48 -- -- 15.56 CIR -- 0.00 1.92 1.93 0.00 -- -- 8.42
Mean CU 0.64 3.62 7.13 7.24 1.64 -- -- 20.18 CIR 0.09 2.17 6.01 6.11 0.85 -- -- 15.06
Max CU 0.93 5.12 9.30 8.21 1.90 -- -- 24.28
Min CU 0.39 2.59 4.94 5.67 1.32 -- -- 16.63 CIR 0.00 0.00 2.11 1.71 0.00 -- -- 9.48
ALFALFA my ..............................................
PfiTW a s AM) GRASS my ..............................
MOUTAIN my .......................................
LAWN GRASS ...............................................
SPRING W I N S ----------c---------------------------------
WINTER WHEAT .............................................
CIR 0.79 4.33 8.94 8.00 1.74 -- -- 20. e4
== ___p t3==--OL-==--r-=---
CU and CIR are in inches.
37
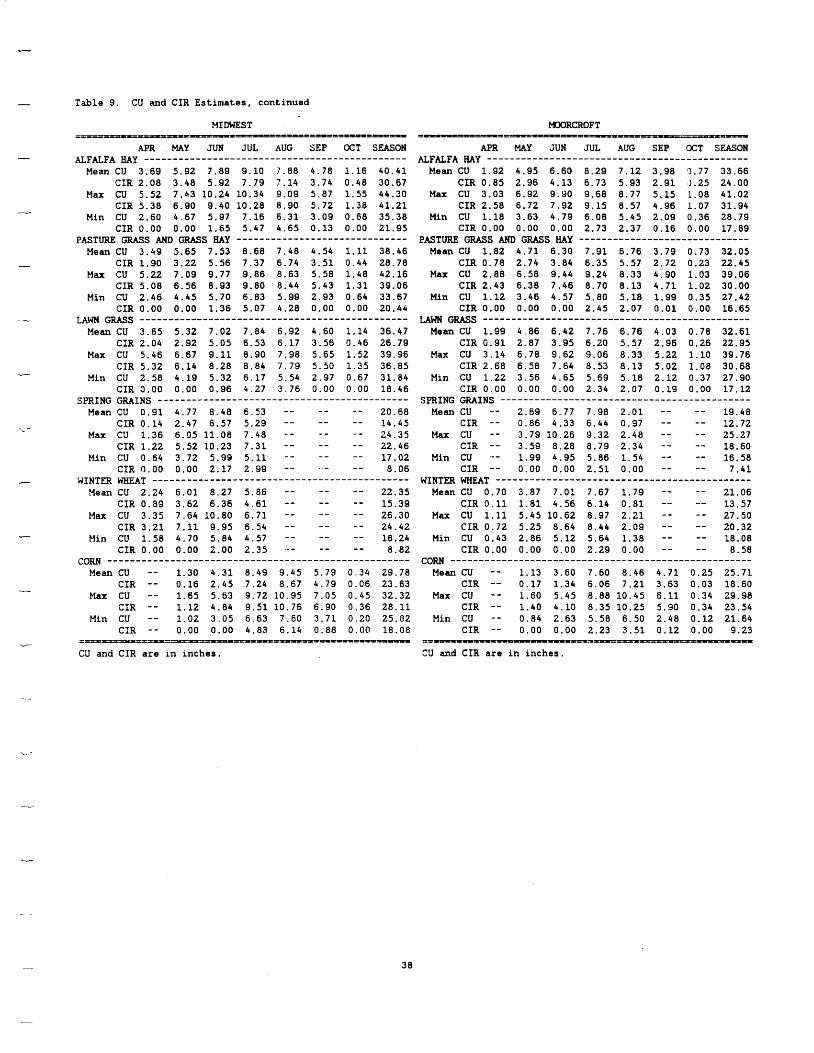
Table 9. CU and CIR Estimates, continued
-.
c
MIDWEST =-=----ICI1-LliP==-=-*--li~=e--=-.ItrP~~==-
APR MAY JUN JUL AUG SEP OCT SEASON
Mean CU 3.69 5.92 7.89 9.10 7.88 4.78 1.16 40.41 CIR 2.08 3.48 5.92 7.79 7.14 3.74 0.48 30.67
Max CU 5.52 7.L3 10.24 10.34 9.09 5.87 1.55 44.30 CIR 5.38 6.90 9.40 10.28 8.90 5.72 1.38 41.21
Min CU 2.60 4.67 5.97 7.16 6.31 3.09 0.68 35.38 CIR 0.00 0.00 1.65 5.47 4.65 0.13 0.00 21.95
Mean CU 3.49 5.65 7.53 8.68 7.48 4.54 1.11 38.46 CIR 1.90 3.22 5.56 7.37 6.74 3.51 0.44 28.78
Max CU 5.22 7.09 9.77 9.86 8.63 5.58 1.48 42.16 CIR 5.08 6.56 8.93 9.80 8.44 5.43 1.31 39.06
Min CU 2.46 4.45 5.70 6.83 5.99 2.93 0.64 33.67 CIR 0.00 0.00 1.36 5.07 4.28 0.00 0.00 20.44
Mean CU 3.65 5.32 7.02 7.84 6.92 4.60 1.14 36.47 CXR 2.04 2.92 5.05 6.53 6.17 3.56 0.46 26.79
Max CU 5.46 6.67 9.11 8.90 7.98 5.65 1.52 39.96 CIR 5.32 6.14 8.28 8.84 7.79 5.50 1.35 36.85
Min CU 2.58 4.19 5.32 6.17 5.54 2.97 0.67 31.84 CIR 0.00 0.00 0.96 4.27 3.76 0.00 0.00 18.46
Mean CU 0.91 4.77 8.48 6.53 -- -- -- 20.68 CIR 0.14 2.47 6.57 5.29 -- -- -- 14.45
Max CU 1.36 6.05 11.08 7.48 -- -- -- 24.35 CIR 1.22 5.52 10.23 7.31 -- -- -- 22.46
Min CU 0.64 3.72 5.99 5.11 -- -- -- 17.02 CIR 0.00 0.00 2.17 2.99 -- -- 8.06
Mean CU 2.24 6.01 8.27 5.86 -- -- -- 22.35 CIR 0.89 3.62 6.36 4.61 -- -- -- 15.39
Max CU 3.35 7.64 10.80 6.71 -- -- -- 26.30 CIR 3.21 7.11 9.95 6.54 -- -- -- 24.42
Min CU 1.58 4.70 5.84 4.57 -- -- -- 18.24 CIR 0.00 0.00 2.00 2.35 -- -- -- 8.82
corn ______________--------------------------------------- Mean CU -- 1 . 3 0 4.31 8.49 9.45 5.79 0.34 29.78
CIR -- 0.16 2.45 7.24 8.67 4.79 0.06 23.63 Max CU -- 1.65 5.63 9.72 10.95 7.05 0.45 32.32
CIR -- 1.12 4.84 9.51 10.76 6.90 0.36 28.11 Min CU -- 1.02 3.05 6.63 7.60 3.71 0.20 25.82
CIR -- 0.00 0.00 4.83 6.14 0.88 0.00 18.08
ALFALFA HAY _________________-_-________I___________------
PASTURE GRASS AND W S my ------------------------------
LAWN GRASS ...............................................
SPRING GRAINS . . . . . . . . . . . . . . . . . . . . . . . . . . . . . . . . . . . . . . . . . . . .
WINTER WHEAT . . . . . . . . . . . . . . . . . . . . . . . . . . . . . . . . . . . . . . . . . . . . .
==--===-=--- -DIII==3P=I==I---=PI==- -v-
CU and CIR are in inches.
MOORCROFT - ~ - = = - ~ ~ = - - = = = - = = = = - - - - -I
APR MAY JUN JUL AUG SEP OCT SEASON
Mean CU 1.92 4.95 6.60 8.29 7.12 3.98 '3.77 33.66 CIR 0.85 2.96 4.13 6.73 5.93 2.91 1.25 24.00
Max CU 3.03 6.92 9.90 9.68 8.77 5.15 1.08 41.02 CIR 2.58 6.72 7.92 9.15 8.57 4.96 1.07 31.94
Min CU 1.18 3.63 4.79 6.08 5.45 2.09 0.36 28.79 CIR 0.00 0.00 0.00 2.73 2.37 0.16 0.00 17.89
Mean CU 1.82 4.71 6.30 7.91 6.76 3.79 0.73 32.05 CIR 0.78 2.74 3.84 6.35 5.57 2.72 0.23 22.45
Max CU 2.88 6.58 9.44 9.24 8.33 4.90 1.03 39.06 CIR 2.43 6.38 7.46 8.70 8.13 4.71 1.02 30.00
Min CU 1.12 3.46 4.57 5.80 5.18 1.99 0.35 27.42 CIR 0.00 0.00 0.00 2.45 2.07 0.01 0.00 16.65
GRASS --------------^--------------------------------
Mean CU 1.99 4.86 6.42 7.76 6.76 4.03 0.78 32.61 CIR G.91 2.87 3.95 6.20 5.57 2.96 0.26 22.95
Max CU 3.14 6.78 9.62 9.06 8.33 5.22 1.10 39.76 CIR 2.68 6.58 7.64 8.53 8.13 5.02 1.08 30.68
Min CU 1.22 3.56 4.65 5.69 5.18 2.12 0.37 27.90 CIR 0.00 0.00 0.00 2.34 2.07 0.19 0.00 17.12
Mean CU -- 2.69 6.77 7.98 2.01 -- -- 19.48 CIR -- 0.86 4.33 6.44 0.97 -- -- 12.72
Max CU -- 3.79 10.26 9.32 2.48 -- -- 25.27 CIR -- 3.59 8.28 8.79 2.34 -- -- 18.60
Min CU -- 1.99 4.95 5.86 1.54 -- -- 16.58 CIR -- 0.00 0.00 2.51 0.00 -- -- 7.41
Mean CU 0.70 3.87 7.01 7.67 1.79 -- -- 21.06 CIR 0.11 1.81 4.56 6.14 0.81 -- -- 13,57
Max CU 1.11 5.45 10.62 8.97 2.21 -- -- 27. 50 CIR 0.72 5.25 8.64 8.44 2.09 -- -- 20.32
Min CU 0.43 2.86 5.12 5.64 1.38 -- -- 18.08 CIR 0.00 0.00 0.00 2.29 0.00 -- -- 8.58
CORN ..................................................... Mean CU -- 1.13 3.60 7.60 8.46 4.71 0.25 25.71
CIR -- 0.17 1.34 6.06 7.21 3.63 0.03 18.60 Max CU -- 1.60 5.45 8.88 10.45 6.11 0.34 29.98
CIR -- 1.40 4.10 8.35 10.25 5.90 0.34 23.54 Min CU -- 0.84 2.63 5.58 6.50 2.48 0.12 21.64
CIR -- 0.00 0.00 2.23 3.51 0.12 0.00 9.23
ALFALFA my ..............................................
PASTURE GRASS AND GRASS HAY ..............................
SPRING GRAINS ___---_________-----___I________________----
WINTER WHEAT ---------------------------------------------
= = M = I = - = = = - - P = = = = = % ~ ~ = ~ ~ ~ ~ = ~ - =
CU and CIR are in inches.
38
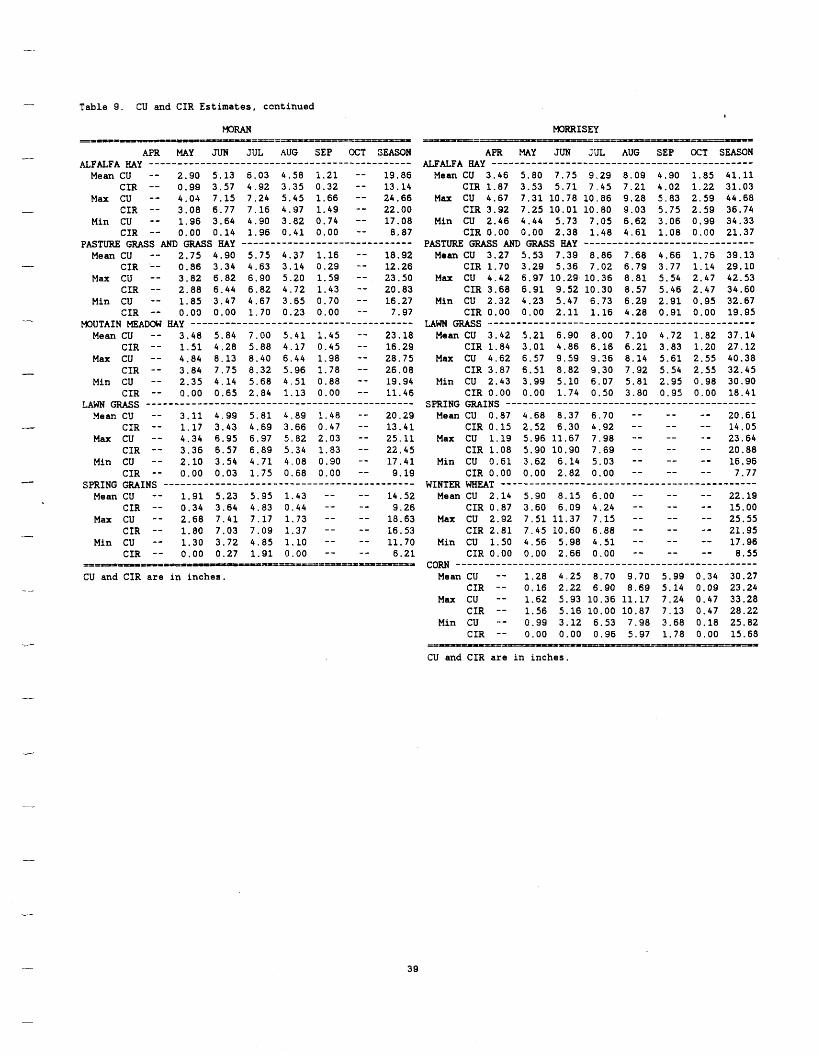
Table 9. CU and CIR Estimates, continued I
Mow ===w=L- - -Of.CE=E===-5.---==--
APR MAY JUN JUL AUG SEP OCT SEASON
Mean CU -- 2.90 5.13 6.03 4.58 i.21 -- 19.96 CIR -- 0.99 3.57 4.92 3.35 0.32 -- 13.14
Max CU -- 4.04 7.15 7.24 5.45 1.66 -- 24.66 _- CIR -- 3.08 6.77 7.16 4.97 1.49 -- 22.00
Min CU -- 1.96 3.64 4.90 3.82 0.74 -- 17.08 CIR -- 0.00 0.14 1.96 0.41 0.00 -- 8.87
Mean CU -- 2.75 4.90 5.75 4.37 1.16 -- 18.92 CIR -- 0.86 3.34 4.63 3.14 0.29 -- 12.26
Max CiJ -- 3.82 6.82 6.90 5.20 1.59 -- 23.50 CIR -- 2.88 6.44 6.82 4.72 1.43 -- 20.83
Min CU -- 1.85 3.47 4.67 3.65 0.70 -- 16.27 CIR -- 0.00 0.00 1.70 0.23 0.00 -- 7.97
Mean CU -- 3.48 5.84 7.00 5.41 1.45 -- 23.18 CIR -- 1.51 4.28 5.88 4.17 0.45 -- 16.29
Max CU -- 4.84 8.13 8.40 6.44 1.98 -- 28.75 I CIR -- 3.84 7.75 0.32 5.96 1.78 -- 26.08
Min CU -- 2.35 4.14 5.68 4.51 0.88 -- 19.94 CIR -- 0.00 0.65 2.84 1.13 0.00 -- 11.46
Mean CU -- 3.11 4.99 5.81 4.89 1.48 -- 20.29 - CIR -- 1.17 3.43 4.69 3.66 0.47 -- 13.41 Max CU -- 4.34 6.95 6.97 5.82 2.03 -- 25.11
CIR -- 3.36 6.57 6.89 5.34 1.83 -- 22.45 Min CU -- 2.10 3.54 4.71 4.08 0.90 -- 17.41
CIR -- 0.00 0.03 1.75 0.68 0.00 -- 9.19
Mean CU -- 1.91 5.23 5.95 1.43 -- -- 14.52 CIR -- 0.34 3.64 4.83 0.44 -- -- 9.26
Max CU -- 2.68 7.41 7.17 1.73 -- -- 18.63 CIR -- 1.80 7.03 7.09 1.37 -- -- 16.53
Min CU -- 1.30 3.72 4.85 1.10 -- -- 11.70 CIR -- 0.00 0.27 1.91 0.00 -- -- 6.21
&FaFA m y __-------------------------------------------- I
PASTURE GRASS AND GRASS m y -----------_------------------ -
MOUTAIN WDOW m y _---------_____---_-___l_____________l_ -
LAWN GRASS _-----__----------____I__^______________-------
-c SPRING GRAINS --------------------------------------------
--
I = = = - = = = = - ~ - = ~ - ~ = ~ = = = = = = ~ ~ = ~ = ~ ~ ~ - ~ =
CU and CIR are i n inches.
MORRISEY
APR MAY JUN JUL AUG SEP CCT SEASON
Mean CU 3.46 5.80 7.75 9.29 8.09 4.90 i.85 41.11 CIR 1.87 3.53 5.71 7.45 7.21 4.02 1.22 31.03
CIR 3.92 7.25 10.01 10.80 9.03 5.75 2.59 36.74 Min CU 2.46 4.44 5.73 7.05 6.62 3.06 0.99 34.33
CIR 0.00 0.00 2.38 1.48 4.61 1.08 0.00 21.37
Mean CU 3.27 5.53 7.39 8.86 7.68 4.66 1.76 39.13 CIR 1.70 3.29 5.36 7.02 6.79 3.77 1.14 29.10
Max CU 4.42 6.97 10.29 10.36 8.81 5.54 2.47 42.53 CIR 3.68 6.91 9.52 10.30 8.57 5.46 2.47 34.60
Min CU 2.32 4.23 5.47 6.73 6.29 2.91 0.95 32.67 CIR 0.00 0.00 2.11 1.16 4.28 0.91 0.00 19.95
Mean CU 3.42 5.21 6.90 8.00 7.10 4.72 1.82 37.14 CIR 1.84 3.01 4.86 6.16 6.21 3.83 1.20 27.12
Max CU 4.62 6.57 9.59 9.36 8.14 5.61 2.55 40.38 CIR 3.87 6.51 8.82 9.30 7.92 5.54 2.55 32.45
Min CU 2.43 3.99 5.10 6.07 5.81 2.95 0.98 30.90 CIR 0.00 0.00 1.74 0.50 3.80 0.95 0.00 18.41
Mean CU 0.87 4.68 8.37 6.70 -- -- -- 20.61 CIR 0.15 2.52 6.30 4.92 - - -- -- 14.05
Max CU 1.19 5.96 11.67 7.98 -- -- -- 23.64 CIR 1.08 5.90 10.90 7.69 -- -- -- 20.88
Min CU 0.61 3.62 6.14 5.03 -- -- -- 16.96 CIR 9.00 0.00 2.82 0.00 -- -- -- 7.77
Mean CU 2.14 5.90 8.15 6.00 -- -- -- 22.19 CIR 0.87 3.60 6.09 4.24 -- -- -- 15.00
Max CU 2.92 7.51 11.37 7.15 -- -- -- 25.55 CIR 2.81 7.45 10.60 6.88 -- -- -- 21.95
Min CU 1.50 4.56 5.98 4.51 -- -- -- 17.96 CIR 0.00 0.00 2.66 0.00 -- -- -- 8.55
CORN --_---------_-------__^_________________---~---------
CIR -- 0.16 2.22 6.90 8.69 5.14 0.09 23.24 Max CU -- 1.62 5.93 10.36 11.17 7.24 0.47 33.28
CIR -- 1.56 5.16 10.00 10.87 7.13 0.47 28.22 Min CU -- 0.99 3.12 6.53 7.98 3.68 0.18 25.82
CIR -- 0.00 0.00 0.96 5.97 1.78 0.00 15.68
ALFALFA HAY ..............................................
M- cu 4.67 7.31 10.78 10.86 9.28 5.83 2.59 44.68
PASTURE GRASS AND U S my ..............................
-----------------------------------------------
SPRING GRAINS ---------------I----------------------------
WINTER WHEAT ---------------------------------------------
Mean CU -- 1.28 4 . 2 5 8.70 9.70 5.99 0.34 30.27
-- -==-=-==--=-- --= CU and CIR are i n inches.
39
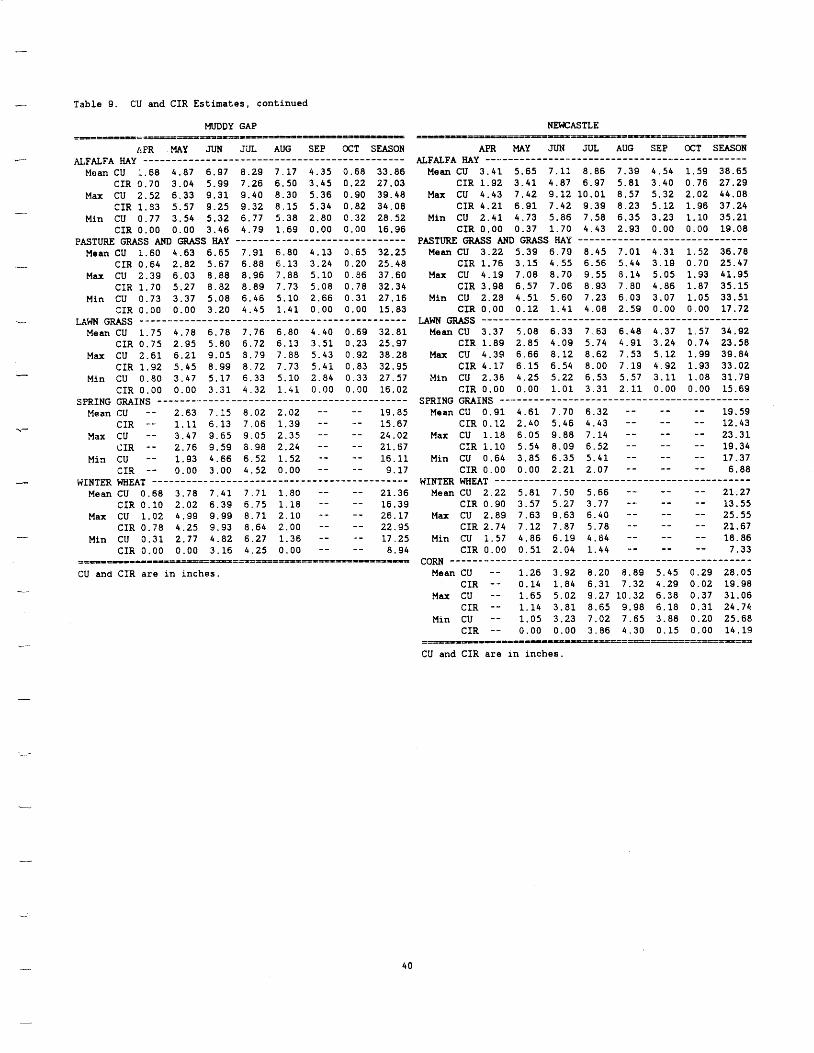
I
---
._-
Table 9. CU and CIR Estimates, continued
MUDDY GAP
APR MAY JUN JiiL AUG SEP OCT SEASON K F M F A my ______-___------------------------------------
Mean CU L.68 4.87 6.97 8.29 7.17 4.35 0.68 33.86 CIR 0.70 3.04 5.99 7.26 6.50 3.45 0.22 27.03
Max cu 2.52 6.33 9.31 9.40 8.30 5.36 0.90 39.48 CIR 1.33 5.57 9.25 9.32 8.15 5.34 0.82 34.08
Min CU 0.77 3.54 5.32 6.77 5.38 2.80 0.32 28.52 CIR 0.00 0.00 3.46 4.79 1.69 0.00 0.00 16.96
Mean CU 1.60 4.63 6.65 7.91 5 . 8 0 4.13 0.65 32.25 CIR 0.64 2.82 5.67 6.88 6.13 3.24 0.20 25.48
Max CU 2.33 6.03 8.88 8.96 7.88 5.10 0.36 37.60 CIR 1.70 5.27 8.82 0.89 7.73 5.00 0.78 32.34
Min CU 0.73 3.37 5.08 6.46 5.10 2.66 0.31 27.16 CIR 0.00 0.00 3.20 4.45 1.41 0.00 0.00 15.83
Mean CU 1.75 4.78 6.78 7.76 6.80 4.40 0.69 32.81 CIR 0.75 2.95 5.80 6.72 6.13 3.51 0.23 25.97
Max CU 2.61 6.21 9.05 8.79 7.88 5.43 0.92 38.28 CIR 1.92 5.45 8.99 8.72 7.73 5.41 0.83 32.95
Min CU 0.80 3.47 5.17 6.33 5.10 2.04 0.33 27.57 CIR 0.00 0.00 3.31 4.32 1.41 0.00 0.00 16.02
Mean CU -- 2.63 7.15 8.02 2.02 -- -- 19.85 CIR -.- 1.11 6.13 7.06 1.39 -- - - 15.67
Max CU -- 3.47 9.65 9.05 2.35 -- -- 24 * 02 CIR -- 2.76 9.59 a.98 2.24 -- -- 21.67
Min CU -- 1.93 h.66 6.52 1.52 -- -- 16.11 CIR -- 0.00 3.00 4.52 0.00 -- -- 9.17
Mean CU 0.68 3.78 7.41 7.71 1.80 -- -- 21.36 CIR 0.10 2.02 6.39 6.75 1.18 -- -- 16.39
Max CU 1.02 4.99 9.99 8.71 2.10 -- -- 26.17 CXR 0.78 4.25 9.93 8.64 2.00 -- -- 22.95
Mfn CU 0.31 2.77 4.82 6.27 1.36 -- -- 17.25 CIR 0.00 0.00 3.16 4.25 0.00 -- -- 8.94
PASTURE GRASS GRASS my ------------------------------
LAWN GRASS _____---__----------__________I_________-------
SPRING GMINS __---_______-_------_____I______________----
WINTER WHEAT I__---__________-----------------------------
5TPPP--EP-=l=lt--==---=-=====a====~~===============-~
CU and CXR are in inches.
NEWCASTLE = ~ ~ - = = - = = - - - - ~ ~ = = ~ = ~ = ~ ~ = ~ ~ ~ = - ~ = - - = = %
APR MAY JUN JUL AUG SEP OCT SEASON
Mean CU 3.41 5.65 7.11 8.86 7.39 4.54 1.59 38.65 CIR 1.92 3.41 4.87 6.97 5.81 3.40 0.76 27.29
Max CU 4.43 7.42 9.12 10.01 8.57 5.32 2.02 44.08 CIR 4.21 6.91 7.42 9.39 8.23 5.12 1.96 37.24
Min CU 2.41 4.73 5.86 7.58 6.35 3.23 1.10 35.21 CIR 0.00 0.37 1.70 4.43 2.93 0.00 0.00 19.08
Mean CU 3.22 5.39 6.79 8.45 7.01 4.31 1.52 36.78 CIR 1.76 3.15 4.55 6.56 5.44 3.19 0.70 25.47
Max CU 4.19 7.08 8.70 9.55 8.14 5.05 1.93 41.95 CIR 3.98 6.57 7.06 8.93 7.80 4.86 1.87 35.15
Min CU 2.29 4.51 5.60 7.23 6.03 3.07 1.05 33.51 CIR 0.00 0.12 1.41 4.08 2.59 0.00 0.00 17.72
GRASS _____--------I---------------------------------
Mean CU 3.37 S.08 6.33 7.63 6.48 4.37 1.57 34.92 CIR 1.89 2.85 4.09 5.74 4.91 3.24 0.74 23.58
Max CU 4.39 6.66 8.12 8.62 7.53 5.12 1.99 39.84
Min CU 2 . 3 8 4.25 5.22 6.53 5.57 3.11 1.08 31.79 CIR 0.00 0.00 1.01 3.31 2.11 0.00 0.00 15.69
Mean CU 0.91 4.61 7.70 6.32 -- -- -- 19.59 CIR 0.12 2.40 5.46 4.43 -- -- -* 12.43
Max CU 1.18 6.05 9.88 7.14 -- -- -- 23.31 CIR i.10 5.54 8.09 6.52 -- -- -- 19.34
Min CU 0.64 3 . 8 5 6.35 5.41 -- -- -- 17.37 CIR 0.00 0.00 2.21 2.07 -- -- -- 6.88
Mean CU 2.22 5.81 7.50 5.66 -- -- -- 21.27 CIR 0.90 3.57 5.27 3.77 --. -- -- 1 3 . 5 5
Max CU 2.89 7.63 9.63 6.40 --- -- -- 25.55 CIR 2.74 7.12 7.87 5.78 -- -- -- 21.67
Min CU 1.57 4.86 6.19 4.84 -- -- -- 18.86 CIR 0.00 0.51 2.04 1.44 -- -- -- 7.33 corn ______I_____.-------_f_________.________---------------
Mean CU -- 1.26 3.92 8.20 8.89 5.45 0.29 28.05 CIR - - 0.14 1.84 6.31 7.32 4.29 0.02 19.98
Max CU -- 1.65 5.02 9.27 10.32 6.38 0.37 31.06 CIR -- 1.14 3.81 8.65 9.98 6.18 0.31 24.74
Min CU -- 1.05 3.23 7.02 7.65 3.88 0.20 25.68 CIR -- 0.00 0.00 3.86 4.30 0.15 0.00 14.19
ALJ'fiFA ---.-------------------------------------------
PASTURE GRASS AND GRASS my" --------------------______I___
CIR 4.17 6.15 6.54 a.oo 7.19 4.92 1.93 33.02
SPRING GRAINS _-_------------_____-----------------------..
WINTER WHEAT .............................................
-- ............................................... CU and CIR are i n inches.
40
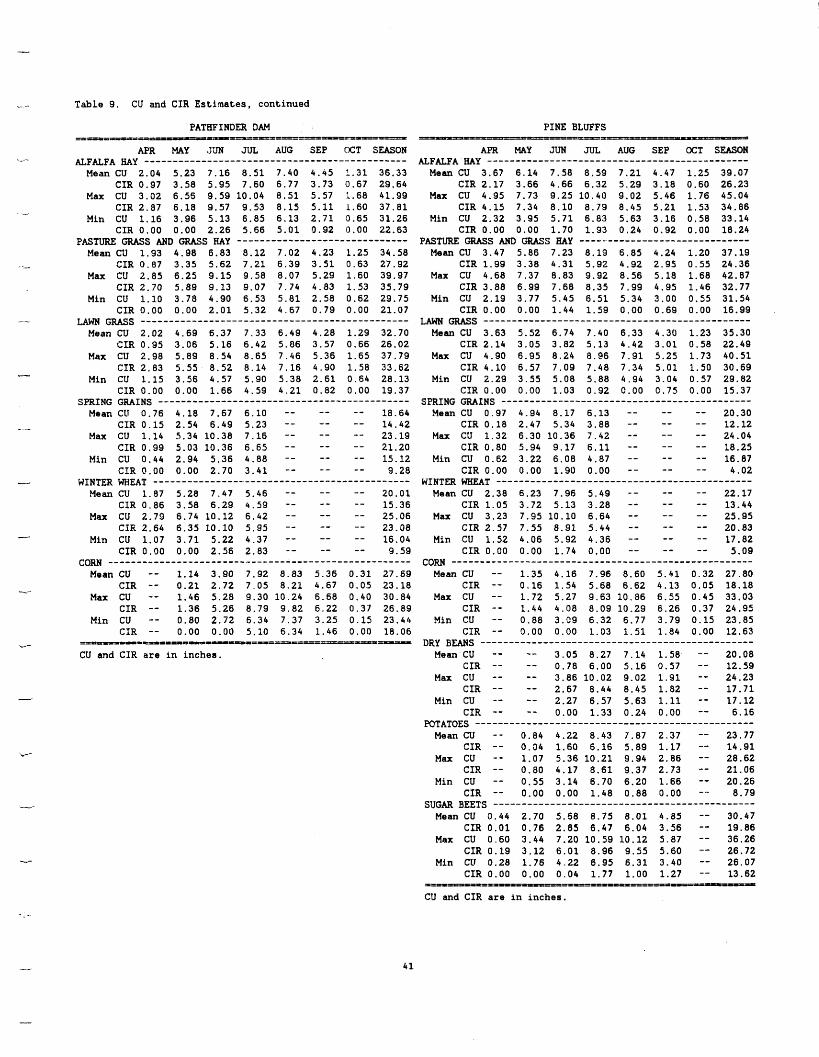
-- Table 9. CU and CIR Estimates, continued
,-
Mean CU 2.04 5.23 7.16 8.51 7.40 4.45 1.31 36.33 CIR 0.97 3.58 5.95 7.60 6.77 3.73 0.67 29.64
Max CU 3.02 6.55 9.59 10.04 8.51 5.57 1.68 41.99 CIR 2.87 6.18 9.57 9.53 8.15 5.11 L.60 37.81
Min CU 1.16 3.96 5.13 6.85 6.13 2.71 3.65 31.26 CIR 0.00 0.00 2.26 5.66 5.01 0.92 0.00 22.63
Mean CU 1.93 4.98 6.83 8.12 7.02 4.23 1.25 34.58 CIR 0.87 3.35 5.62 7.21 6.39 3.51 0.63 27.92
Max CU 2.85 6.25 9.15 9.58 8.07 5.29 1.60 39.97
Min CU 1.10 3.78 4.90 6.53 5.81 2.58 0.62 29.75 CIR 0.00 0.00 2.01 5.32 4.67 0.79 0.00 21.07
Mean CU 2.02 4.69 6.37 7.33 6.49 4.28 1.29 32.70 CIR 0.95 3.06 5.16 6.42 5.06 3.57 0.66 26.02
Max CU 2.98 5 . 8 9 8.54 8.65 7.46 5.36 1.65 37.79
Min CU 1.15 3.56 4.57 5.90 5.38 2.61 0.64 28.13 CIR 0.00 0.00 1.66 4.59 4.21 0.82 0.00 19.37
Mean CU 0.76 4.18 7.67 6.10 -- -- -- 18.64 CIR 0.15 2.54 6.49 5.23 -- -- -- 14.42
Max CU 1.14 5.34 10.38 7.16 -- -- -- 23.19 CIR 0.99 5.03 10.36 6.65 -- -- -- 21.20
Min CU 0.44 2.94 5.36 4.88 -- -- -- 15.12 CIR 0.00 0.00 2.70 3.41 -- - - -- 9.28
Yean CU 1.87 5.28 7.47 5.46 -- -- -- 20.01 CIR 0.86 3.58 6.29 4.59 -- -- -- 15.36
Max CU 2.79 6.74 10.12 6.42 -- -- -- 25.06 CIK 2.64 6.35 10.10 5.95 -- -- -- 23.08
Min CU 1.07 3.71 5.22 4.37 -- -- -- 16.04 CIR 0.00 0.00 2.56 2.83 -- -- -- 9.59
cow _---------------------------------------------------- Mean CU -- 1.14 3.90 7.92 8.83 5.36 0.31 27.69
CIR -- 0.21 2.72 7.05 8.21 4.67 0.05 23.18 Max CU -- 1.46 5.28 9.30 10.24 6.68 0.40 30.84
CIR -- 1.36 5.26 8.79 9.82 6.22 0.37 26.89 Min CU -- 0 . 8 0 2.72 6.34 7.37 3.25 0.15 23.414
CIR -- 0.00 0.00 5.10 6.34 1.46 0.00 18.06
PASTURE GRASS AND W S HAY ..............................
CIR 2.70 5.89 9.13 9.07 7.74 4.83 1.53 35.79
GRASS --_--------------------------------------------
CIR 2.83 5.55 8.52 8.14 7.16 4.90 1.58 33.62
SPRING GRAINS __----------------I-------------------------
WINTER WHEAT ----------------_---__________I_________-----
--
- - - - . - = r r = = = = ~ = P I = ~ - ~ = = = = = = = ~ ~ = = = = ~ = ~ ~ ~ -
CU and CIR are i n inches.
--r
- -
Mean CU 3.67 6.14 7.58 8.59 7.21 4.47 1.25 39.07 CIR 2.17 3.66 4.66 6.32 5.29 3.18 0.60 26.23
Max CU 4.95 7.73 9.25 10.40 9.02 5.46 1.76 45.04 CIR 4.15 7.34 8.10 8.79 8.45 5.21 1.53 34.86
Min CU 2.32 3.95 5.71 6.83 5.63 3.16 0.58 33.14 CIR 0.00 0.00 1.70 1.93 0.24 0.92 0.00 18.24
Mean CU 3.47 5.86 7.23 8.19 6.85 4.24 1.20 37.19 CIR 1.99 3.38 4.31 5.92 4.92 2.95 0.55 24.36
Max CU 4.68 7.37 8.83 9.92 8.56 5.18 1.68 42.87 CIR 3.88 6.99 7.68 8.35 7.99 4.95 1.46 32.77
Min CU 2.19 3.77 5.45 6.51 5.34 3.00 0.55 31.54 CIR 0.00 0.00 1.44 1.59 0.00 0.69 0.00 16.99
GRASS --------------------__________________^_-------
Mean CU 3.63 5.52 6.74 7.40 6.33 4.30 1.23 35.30 CIR 2.14 3.05 3.82 5.13 4.42 3.01 0 . 5 8 22.49
Max CU 4.90 6.95 8.24 8.96 7.91 5.25 1.73 40.51 CIR 4.10 6.57 7.09 7.48 7.34 5.01 1.50 30.69
Min CU 2.29 3.55 5.08 5.88 4.94 3.04 0.57 29.82 CIR 0.00 0.00 1.03 0.92 0.00 0.75 0.00 15.37
Mean CU 0.97 4.94 8.17 6.13 -- -- -- 20.30 CIR 0.18 2.47 5.34 3.88 -- -- -- 12.12
Max CU 1.32 6.30 10.36 7.42 -- -- -- 24.04 CIR 0.80 5.94 9.17 6.11 -- -- -- 18.25
Min CU 0.62 3.22 6 . 0 8 4.87 -- -- -- 16.87 CIR 0.00 0.00 1.90 0.00 -- -- -- 4.02
Mean CU 2.38 6.23 7.96 5.49 - - -- -- 22.17 CIR 1.05 3.72 5.13 3.28 -- -- -- 13.44
Max CU 3.23 7.95 10.10 6.64 -- -- -- 25.95 CTR 2.57 7.55 8.91 5.44 -- -- -- 20.83
Min CU 1.52 4.06 5.92 4.36 -- -- -- 17.82 CIR 0.00 0.00 1.74 0.00 -- -- -- 5.09
CORN ----------------------------------------------------- Mean CU -- 1.35 4.16 7.96 8.60 5.41 0.32 27.80
CIR -- 0.16 1.54 5.68 6.62 4.13 0.05 18.18 Max CU -- 1.72 5.27 9.63 10.86 6.55 0.45 33.03
CIR -- 1.44 4.08 8.09 10.29 6.26 0.37 24.95 Min CU -- 0 . 8 8 3.C9 6.32 6.77 3.79 0.15 23.85
CIR -- 0.00 0.00 1.03 1.51 1.84 0.00 12.63
Mean CU -- -- 3.05 8.27 7.14 1.58 -- 20.08 CIR -- -- 0.78 6.00 5.16 0.57 -- 12.59
Max CU -- -- 3.86 10.02 9.02 1.91 -- 24.23 CIR -- -- 2.67 8.44 8.45 1.82 -- 17.71
Min CU -- -- 2.27 6.57 5.63 1.11 -- 17.12 CIR -- -- 0.00 1.33 0.24 0.00 -- 6.16
Mean CU -- 0.84 4.22 8.43 7.87 2.37 -- 23.77 CIR -- 0.04 1.60 6.16 5.89 1.17 -- 14,91
Max CU -- 1.07 5.36 10.21 9.94 2.86 -- 28.62 CIX -- 0.80 4.17 8.61 9.37 2.73 -- 21.06
Min CU -- 0.55 3.14 6.70 6.20 1.66 -- 20.26 CIR -- 0.00 0.00 1.48 0.88 0.00 -- 8.79
Mean CU 0.44 2.70 5.68 8.75 8.01 4.85 -- 30.47 CIR 0.01 0.76 2.85 6.47 6.04 3.56 -- 19.86
Max CU 0.60 3.44 7.20 10.59 10.12 5.87 -- 36,26 CIR 0.19 3.12 6.01 8.96 9.55 5.60 -- 26.72
Min CU 0.28 1.76 4.22 6.95 6.31 3.40 -- 26.07 CIR 0.00 0.00 0.04 1.77 1.00 1.27 -- 13.62
PJTW GRASS GRASS my -----.---- ---- ---- ----- --------
SPRING GRAINS --------------------------------------------
WINTER WHEAT .............................................
DRY BEANS ------------------------------------------------
POTATOES .................................................
SUGm BEETS ..............................................
CU and CIR are i n inches.
41
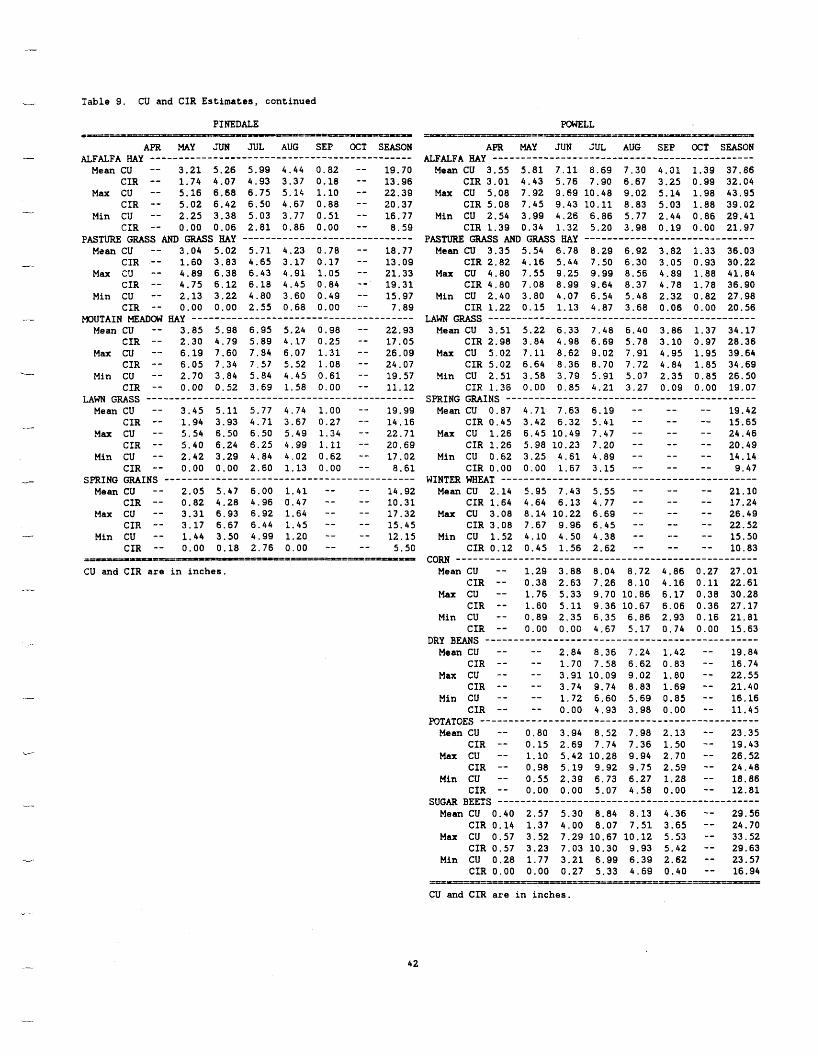
- Table 9. CU and CIR Estimates, continued
PINEDALE ===-a=- ---=I----=
APR MAY u3.W JUL AUG SEP OCT SEASON I ALFALFA HAY ..............................................
Mean CU -- 3.21 5.26 5.99 4.44 0.82 -- 19.70 CIR -- 1.74 4.07 4.93 3.37 0.18 -- 13.96
Max cu -- 5.16 6.68 6.75 5.14 1.10 -- 22.39 CIR -- 5.02 6.42 6.50 4.67 0.88 -- 20.37
Min CU -- 2.25 3.38 5.03 3.77 0.51 -- 16.77 CIR -- 0.00 0.06 2.81 0.86 0.00 -- 8.59
Msan CU -- 3.04 5.02 5.71 4.23 0.78 -- 18.77 CIR -- 1.80 3.83 4.65 3.17 0.17 -- 13.09
Max CU -- 4.89 6.38 6.43 4.91 1.05 -- 21.33 CIR -- 4.75 6.12 6.18 4.45 0.84 -- 19.31
Min CU -- 2.13 3.22 4.80 3.60 0.49 -- 15.97 CIR -- 0.00 0.00 2.55 0.68 0.00 7.89
Mean CU -- 3.85 5.98 6.95 5.24 0.98 -- 22.93 CIR -- 2.30 4.79 5.89 0.17 0.25 -- 17.05
Max CU -- 6.19 7.60 7.84 6.07 1.31 -- 26.09 CIR -- 6.05 7.34 7.57 5.52 1.08 -- 24.07
Min CU -- 2.70 3.84 5.84 4.45 0.61 -- 19.57 CIR -- 0.00 0.52 3.69 1.58 0.00 -- 11.12
Mean CU -- 3.45 5.11 5.77 4.74 1.00 -- 19.99 CIR -- 1.94 3.93 4.71 3.67 0.27 --- 14.16
Max CU -- 5.54 6.50 6.50 5.49 1.34 -- 22.71 CIR -- 5.40 6.24 6.25 4.99 1.11 -- 20.69
Min CU -- 2.42 3.29 4.84 4.02 0.62 -- 17.02
--
PASTURE GRASS AND GRASS my ..............................
MOUTAIN MEADOW my --------------------------------------- -
L
LAWN GRASS ___-__----------------------------.-------------
,-
CIR -- 0.00 0.00 2.60 1.13 0.00 -- a.61 SPRING GRAINS _____---._----------------------.------------- -
Mean CU -- 2.05 5.47 6.00 1.41 -- -- 14.92 CIR -- 0.82 4.28 4.96 0.47 -- -- 10.31
Max CU -- 3.31 6.93 6.92 1.64 -- -- 17.32 CIR -- 3.17 6.67 6.44 1.45 -- -- 15.45
Min CU -- 1.44 3.50 4.99 1.20 -- -- 12.15 CIR -- 0.00 0.18 2.76 0.00 -- -- 5.5c
=--mDIcIDIP=- ---a===---=--=-
CU and CIR are in inches.
P-
--
POWELL
APR MAY JUN JUL AUG SEP OCT SEASON
Mean CU 3.55 5.81 7.11 8.69 7.30 4.01 1.39 37.86 CIR 3.01 4.43 5.76 7.90 6.67 3.25 0.99 32.04
Max CU 5.08 7.92 9.69 10.48 9.02 5.14 1.98 43.95 CIR 5.08 7.45 9.43 10.11 8.83 5.03 1.88 39.02
Min CU 2.54 3.99 4.26 6.86 5.77 2.44 0.86 29.41 CIR 1.39 0.34 1.32 5.20 3.98 0.19 0.00 21.97
Mean CU 3.35 5.54 6.78 8.29 6.92 3.82 1.33 36.03 CIR 2.82 4.16 5.44 7.50 6.30 3-05 0.93 30.22
Max CU 4.80 7.55 9.25 9.99 8.56 4.89 1.88 41.84 CIR 4.80 7.08 8.99 9.64 8.37 4.78 1.78 36.90
Min CU 2.40 3.80 4.07 6.54 5.48 2.32 0.82 27.98 CIR 1.22 0.15 1.13 4.87 3.68 0.06 0.00 20.56
a s -____----_----------____________I_______-------
Mean CU 3.51 5.22 6.33 7.48 6.40 3.86 1.37 34.17 CIR 2.98 3.84 4.98 6.69 5.78 3.10 0.97 28.36
Max CU 5.02 7.11 8.62 9.02 7.91 4.95 1.95 39.64 CIR 5.02 6.64 8.36 8.70 7.72 4.84 1.85 34.69
Min CU 2.51 3.58 3.79 5.91 5.07 2.35 0.85 26.50 CIR 1.36 0.00 0.85 4.21 3.27 0.09 0.00 19.07
Mean CU 0.87 4.71 7.63 6.19 -- -- -- 19.42 CIR 0.45 3.42 6.32 5.41 -- -- -- 15.65
Max CU 1.26 6.45 10.49 7.47 -- -- -- 24.46 CIR 1.26 5.98 10.23 7.20 -- -- -- 20.49
Min CU 0.62 3.25 4.61 4.89 -- -- -- 14.14 CIR 0.00 0.00 1.67 3.15 -- -- -- 9.47
Mean CU 2.14 5.95 7.43 5.55 -- -- -- 21.10 CIR 1.64 4.64 6.13 4.77 -- -- -- 17.24
Max CU 3.08 8.14 10.22 6.69 -- -- -- 26.49 CIR 3.08 7.67 9.96 6.45 -- -- -- 22.52
Min CU 1.52 4.10 4.50 4.38 -- -- -- 15. 50 CIR 0.12 0.45 1.56 2.62 -- -- -- 10.83
CORN --------------------_______________^____-------------
Mean CU -- 1.29 3.88 8.04 8.72 4.86 0.27 27.01 CIR -- 0.38 2.63 7.26 8.10 4.16 0.11 22.61
Max CU -- 1.76 5.33 9.70 10.86 6.17 0.38 30.28 CIR -- 1.60 5.11 9.36 10.67 6.06 0.36 27.17
Min CU -- 0.89 2.35 6.35 6.86 2.93 0.16 21.81 CIR -- 0.00 0.00 4.67 5.17 0.74 0.00 15.63
Mean CU -- -- 2.84 8.36 7.24 1.42 -- 19.84 CIR -- -- 1.70 7.58 6.62 0.83 -- 16.74
Max CU -- -- 3.91 10.09 9.02 1.80 -- 22.55 CIR -- -- 3.74 9.74 8.83 1.69 -- 21.40
Min CU -- -- 1.72 6.60 5.69 0.85 -- 16.16 CIR -- -- 0.00 4.93 3.98 0.00 -- 11.45
Mean CU -- 0 . 8 0 3.94 8.52 7.98 2.13 -- 23.35 CIR -- 0.15 2.69 7.74 7.36 1.50 -- 19.43
Max CU -- 1.10 5.42 10.28 9.94 2.70 -- 26.52 CIR -- 0.98 5.19 9.92 9.75 2.59 -- 24.48
Min CU -- 0 . 5 5 2.39 6.73 6.27 1.28 -- 18.86 CIR -- 0.00 0.00 5.07 4.58 0.00 -- 12.81
Mean CU 0.40 2.57 5.30 8.84 8.13 4.36 -- 29.56 CIR 0.14 1.37 4.00 8.07 7.51 3.65 -- 24.70
Max CU 0.57 3.52 7.29 10.67 10.12 5.53 -- 33.52 CIR 0.57 3.23 7.03 10.30 9.93 5.42 -- 29.63
Min CU 0.28 1.77 3.21 6.99 6.39 2.62 -- 23.57 CIR 0.00 0.00 0.27 5.33 4.69 0.40 -- 16.94
ALFALFA my ----------------------------------------------
PASTURE GRASS AND W S my ------------- ---------._-- -----
SPRING GRAINS --I-----------------------------------------
WINTER WHEAT ____----------------_____I_________^____-----
DRY BEANS -__-----------------I___________________--------.
POTATOES --_----------------------------------------------
SUGAR BEETS ..............................................
CU and CIR are in inches.
42
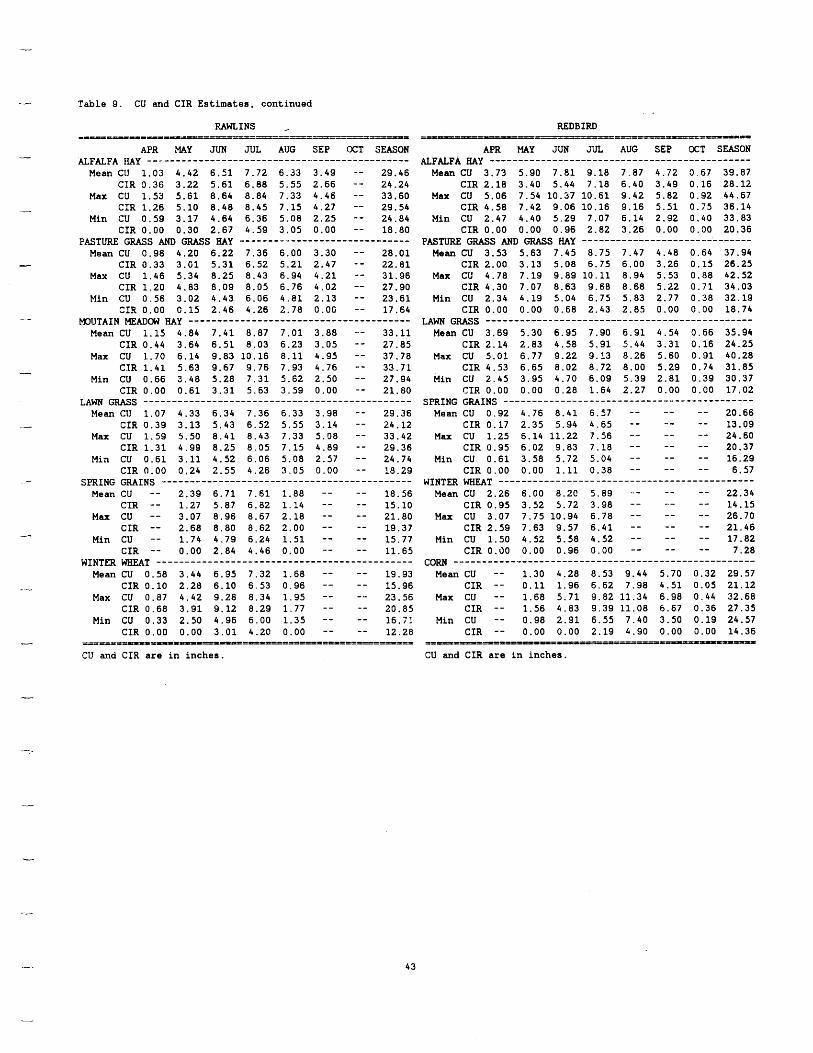
.-.- Table 9. CU and CIR Estimates, continued
RAWLINS - -------------=~~------------------~- ___-_------_---- ----------- - --- P
APR MAY JUN JUL AUG SEP OCT SEASON
Mean CU 1.03 4.42 6.51 7.72 6.33 3.49 -- 29.46 CXR 0.36 3.22 5.61 6.88 5.55 2.66 -- 24.24
Max CU 1.53 5.61 8.64 8.84 7.33 4.46 -- 33.60 I CIR 1.26 5.10 8.48 8.45 7.15 4.27 -- 29.54
Min CU 0.59 3.17 4.64 6.36 5.08 2.25 -- 24.84 CIR 0.00 0.30 2.67 4.59 3.05 0.00 -- 18.80
Mean CU 0.98 4.20 6.22 7.36 6.00 3.30 -- 28.01 - CIR 0.33 3.01 5.31 6.52 5.21 2.47 -- 22.81
Max CU 1.46 5.34 8.25 8.43 6.94 4.21 -- 31.96 CIR 1.20 4.83 8.09 8.05 6.76 4.02 -- 27.90
Min CU 0.56 3.02 4.43 6.06 4.81 2.13 -- 23.61 EIR 0.00 0.15 2.46 4.26 2.78 0.00 -- 17.64
Mean CU 1.15 4.84 7.41 8.87 7.01 3.88 -- 33.11 CIR 0.44 3.64 6.51 8.03 6.23 3.05 -- 27.85
Max CU 1.10 6.14 9.83 10.16 8.11 4.95 -- 37.78 C'IR 1.41 5.63 9.67 9.76 7.93 4.76 -- 33.71
Min CU 0.66 3.48 5.28 7.31 5.62 2.50 -- 27.94 CIR 0.00 0.61 3.31 5.63 3.59 0.00 -- 21.80
Mean CU 1.07 4.33 6.34 7.36 6.33 3.98 -- 29.36 _- CIR 0.39 3.13 5.43 6.52 5.55 3.14 -- 24.12
Max CU 1.59 5.50 8.41 8.43 7.33 5.08 -- 33.42 CIR 1.31 4.99 8.25 8.05 7.15 4.89 -- 29.36
Min CU 0.61 3.11 4.52 6.06 5.08 2.57 -- 24.74 CIR 0.00 0.24 2.55 4.26 3.05 0.00 -- 18.29 - SPRING GRAINS _____I-__-_--------_------------------------
Mean CU -- 2.39 6.71 7.61 1.88 -- -- 18.56 CIR -- 1.27 5.87 6.82 1.14 -- -- 15.10
Max CU -- 3.07 8.96 8.67 2.18 -- -- 21.80 CIR -- 2.68 8.80 8.62 2.00 -- -- 19.37
Min CU -- 1.74 4.79 6.24 1.51 -- -- 15.77 CIR -- 0.00 2.84 4.46 0.00 -- -- 11.65
Mean CU 0.58 3.44 6.95 7.32 1.68 -- -- 19.93 CIR 0.10 2.28 6.10 6.53 0.96 -- -- 15.96
Max CU 0.87 4.42 9.28 8.34 1.95 -- -- 23.56 20.85 CIR 0.68 3.91 9.12 8.29 1.77 --
Min CU 0.33 2 . 5 0 4.96 6.00 1.35 -- -- 16.71 CIR 0.00 0.00 3.01 4.20 0.00 -- -- 12.28
ALFALFA HAY ________________--_-________I___________------ -
PASTURE GRASS AND U S my ------------------------------
- - MOUTAIN MlEADOW my _--------------------------------------
- LAWN GRASS ______-----------------------------------------
WINTER WHEAT _-____---------------------------------------
--
- I -~~DI~ l l r l l l lP= -==-==* -~==a~=%=~====-========
REDBIRD - - ------ -------- -=f.D-=i ---------- ------ APR MAY JUN JUL AUG SEP OCT SEASON
Mean CU 3.73 5.90 7.81 9.18 7.87 4.72 0.67 39.87 CIR 2.18 3.40 5.44 7.18 6.40 3.49 0.16 28.12
Max CU 5.06 7.54 10.37 10.61 9.42 5.82 0.92 44.67 CIR 4.58 7.42 9.06 10.16 9.16 5.51 0.75 36.14
Min CU 2.47 4.40 5.29 7.07 6.14 2.92 0.40 33.83 CIR 0.00 0.00 0.96 2.82 3.26 0.00 0.00 20.36
Mean CU 3.53 5.63 7.45 8.75 7.47 4.40 0.64 37.94 CIR 2.00 3.13 5.08 6.75 6.00 3.26 0.15 26.25
Max CL' 4.78 7.19 9.89 10.11 8.94 5.53 0.88 42.52 CIR 4.30 7.07 8.63 9.68 8.68 5.22 0.71 34.03
Min CU 2.34 4.19 5.04 6.75 5.83 2.77 0.38 32.19 CIR 0.00 0.00 0.68 2.43 2.85 0.00 0.00 18.74
Mean CU 3.69 5.30 6.95 7.90 6.91 4.54 0.66 35.94 CIR 2.14 2.83 4.58 5.91 5.44 3.31 0.16 24.25
Max CU 5.01 6.77 9.22 9.13 8.26 5.60 0.91 40.28 CIR 4.53 6.65 8.02 8.72 8.00 5.29 0.74 31.85
Min CU 2.45 3.95 4.70 6.09 5.39 2.81 0.39 30.37 CIR 0.00 0.00 0.28 1.64 2.27 0.00 0.00 17.02
Mean CU 0.92 4.76 8.41 6.57 -- -- -- 20.66 CIR 0.17 2.35 5.94 4.65 -- -- -- 13.09
Max CU 1.25 6.14 11.22 7.56 -- -- -- 24.60 CIR 0.95 6.02 9.83 7.18 -- -- -- 20,37
Min CU 0.61 3.58 5.72 5.04 -- -- -- 16.29 CIR 0.00 0.00 1.11 0.38 -- -- -- 6.57
Mean CU 2.26 6.00 8.2C 5.89 -1- -- -- 22.34 CIR 0.95 3.52 5.72 3.98 -- -.- -- 14.15
Max CU 3.07 7.75 10.94 6.78 -- -- -- 26.70 CIR 2.59 7.63 9.57 6.41 -- -- -- 21.46
Min CU 1.50 4.52 5.58 4.52 -- -- -- 17.82 CIR 0.00 0.00 0.96 0.00 -- -- -- 7.28
CORN __------------------I___________________-------------
Mean CU -- 1.30 4.28 8.53 9.44 5.70 0.32 29.57 CIR -- 0.11 1.96 6.62 7.98 4.51 0.05 21.12
Max CU -- 1.68 5.71 9.82 11.34 6.98 0.44 32.68 CIR -- 1.56 4.83 9.39 11.08 6.67 0.36 27.35
Min CU -- 0.98 2.91 6.55 7.40 3.50 0.19 24.57 CIR -- 0.00 0.00 2.19 4.90 0.00 0.00 14.36
ALFALFA my _______---------------------------------------
PASTURE GRASS AND GRASS HAY --------------------_I________
GRASS ---------------------------------------~--------
SPRING GRAINS ............................................
WINTER WHEAT __--------------__---------------------------
-- - - - = P E I I I - ~ O P ~ ~ ~ = ~ ~ = = P = =
CU and CIR are in inches. CU and CIR are in inches.
43
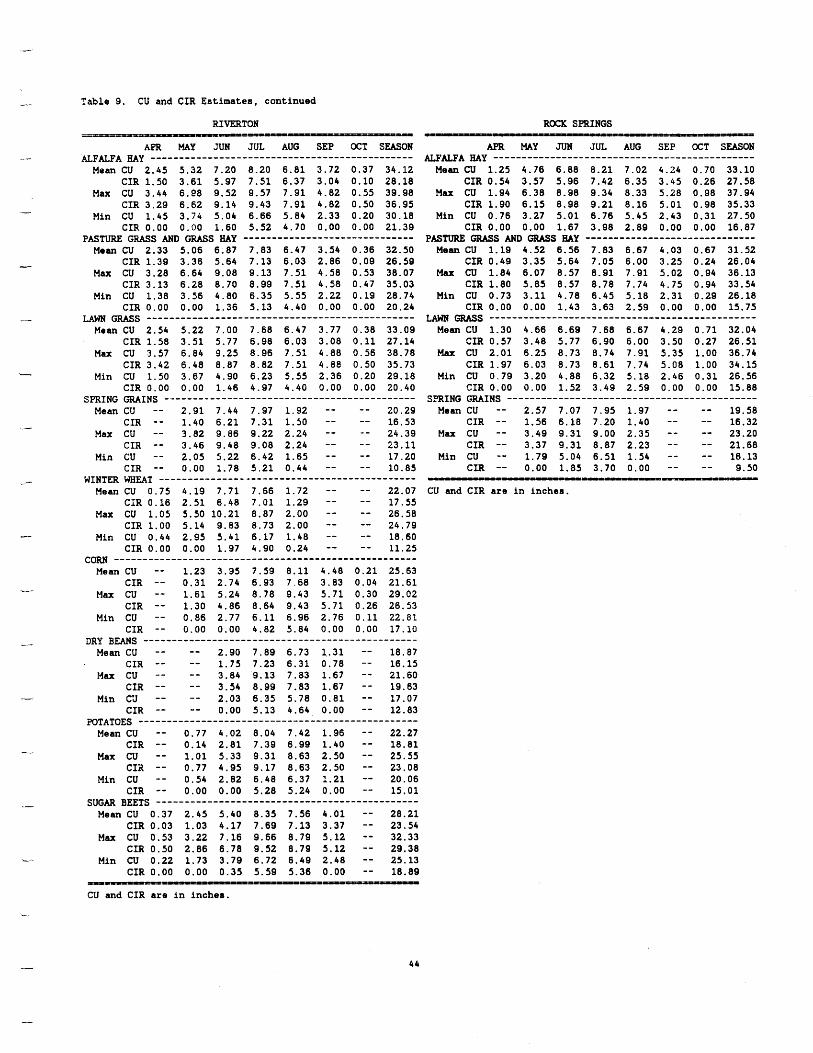
Table 9. CU and CIR Estimates, continued
RIVERTON ROCK SPRINGS
c
APR MAY JUN JUL AUG SEP OCT SEASON
Mean CU 2.45 5.32 7.20 8.20 6.81 3.72 0.37 34.12 CIR 1.50 3.61 5.97 7.51 6.37 3.04 0.10 28.18
Max CU 3.44 6.98 9.52 9.57 7.91 4.82 0.55 39.98 CIR 3.29 6.62 9.14 9.43 7.91 4.82 0.50 36.95
Min CU 1.45 3.74 5.04 6.66 5.84 2.33 0.20 30.18 CIR 0.00 0.00 1.60 5.52 4.70 0.00 0.00 21.39
Mean CU 2.33 5.06 6.87 7.83 6.47 3.54 0.36 32.50 CIR 1.39 3.36 5.64 7.13 6.03 2.86 0.09 26.59
Max CU 3.28 6.64 9.08 9.13 7.51 4.58 0.53 38.07 CIR 3.13 6.28 8.70 8.99 7.51 4.58 0.47 35.03
Min CU 1.38 3.56 4.80 6.35 5.55 2.22 0.19 28.74 CIR 0.00 0.00 1.36 5.13 4.40 0.00 0.00 20.24
U S ............................................... Mean CU 2.54 5.22 7.00 7.68 6.47 3.77 0.38 33.09
Max CU 3.57 6.84 9.25 8.96 7.51 4.88 0.56 38.78
Min CU 1.50 3.67 4.90 6.23 5.55 2.36 0.20 29.18 CIR 0.00 0.00 1.46 4.97 4.40 0.00 0.00 20.40
Mean CU -- 2.91 7.44 7.97 1.92 -- -- 20.29 CIR -- 1.40 6.21 7.31 1.50 -- -- 16.53
Max CU -- 3.82 9.86 9.22 2.24 -- -- 24,39 CIR -- 3.46 9.48 9.08 2.24 -- -- 23.11
Min CU -- 2.05 5.22 6.42 1.65 -- -- 17.20 CIR -- 0.00 1.78 5.21 0.44 -- -- 10.85
Mean CU 0.75 4.19 7.71 7.66 1.72 -- -- 22.07 CIR 0.16 2.51 6.48 7.01 1.29 -- -- 17.55
ax cu 1.05 5.50 10.21 8.87 2.00 -- -- 26.58 CIR 1.00 5.14 9.83 8.73 2.00 -- -- 24.79
Min CU 0.44 2.95 5.41 6.17 1.48 -- -- 18.60 CIR 0.00 0.00 1.97 4.90 0.24 -- -- 11.25
CORN ..................................................... CIR -- 0.31 2.74 6.93 7.68 3.83 0.04 21.61
CIR -- 1.30 4.86 8.64 9.43 5.71 0.26 26.53 Min CU -- 0.86 2.77 6.11 6.96 2.76 0.11 22.81
CIR -- 0.00 0.00 4.82 5.84 0.00 0.00 17.10
Mean CU -- -- 2.90 7.89 6.73 1.31 -- 18.87 CIR -- -- 1.75 7.23 6.31. 0.78 -- 16.15
Max CU -- -- 3.84 9.13 7.83 1.67 -- 21.60 CIR -- -- 3.54 8.99 7.83 1.67 -- 19.63
Min c3 -- -- 2.03 6.35 5.78 0.81 -- 17.07 CIR -- -- 0.00 5.13 4.64 0.00 -- 12.83
Mean CU -- 0.77 4.02 8.04 7.42 1.96 -- 22.27
Max CU -- 1.01 5.33 9.31 8.63 2.50 -- 25.55 CIR -- 0.77 4.95 9.17 8.63 2.50 -- 23.08
Min CU -- 0.54 2.82 6.48 6.37 1.21 -- 20.06 CIR -- 0.00 0.00 5.28 5.24 0.00 -- 15.01
Mean CU 0.37 2.45 5.40 8.35 7.56 4.01 -- 28.21 CIR 0.03 1.03 4.17 7.69 7.13 3.37 -- 23.54
Max CU 0.53 3.22 7.16 9.66 8.79 5.12 -- 32.33 CIR 0.50 2.86 6.78 9.52 8.79 5.12 -- 29.38
Min CU 0.22 1.73 3.79 6.72 6.49 2.48 -- 25.13 CIR 0.00 0.00 0.35 5.59 5.36 0.00 -- 18.89
ALFALFA HAY ..............................................
PASTURE GRASS U S m y ..............................
CIR 1.58 3.51 5.77 6.98 6.33 3.08 0.11 27.14
CIR 3.42 6.48 8.87 8.82 7.51 4.88 0.50 35.73
SPRING GRAINS -.-------------------------------------------
WINTER WHEAT _-_------------------------------------------
Mean CU -- 1.23 3.35 7.59 8.11 4.48 0.21 25.63
Max CU -- 1.61 5.24 8.78 9.43 5.71 0.30 29.02
DRY B U S ---------------I--------------------------------
mTATOES .................................................
CIR -- 0.16 2.81 7.39 6.99 1.40 -- 18.81
SUGAR BEETS ..............................................
P U -IIV
CU and CIR are in inches.
APR MAY JUN JUL AUG SEP OCT SEASON
Mean CU 1.25 4.76 6.88 8.21 7.02 4.24 0.70 33.10 CIR 0.54 3.57 5.96 7.42 6.35 3.45 0.26 27.58
Max CU 1.94 6.38 8.98 9.34 8.33 5.28 0.98 37.94
Min CU 0.76 3.27 5.01 6.76 5.45 2.43 0.31 27.50 CIR 0.00 0.00 1.67 3.98 2.89 0.00 0.00 16.87
Mean CU 1.19 4.52 6.56 7.83 6.67 4.03 0.67 31.52 CIR 0.49 3.35 5.64 7.05 6.00 3.25 0.24 26.04
Max CU 1.84 6.07 8.57 8.91 7.91 5.02 0.94 36.13 CIR 1.80 5.85 8.57 8.78 7.74 4.75 0.94 33.54
Min CU 0.73 3.11 4.78 6.45 5.18 2.31 0.29 26.18 CIR 0.00 0.00 1.43 3.63 2.59 0.00 0.00 15.75
GRASS ............................................... Mean CU 1.30 4.66 6.69 7.68 6.67 4.29 0.71 32.04
CIR 0.57 3.48 5.77 6.90 6.00 3.50 0.27 26.51 Max CU 2.01 6.25 8.73 8.74 7.91 5.35 1.00 36.74
CIR 1.97 6.03 8.73 8.61 7.74 5.08 1.00 34.15 Min CU 0-79 3.20 4.88 6.32 5.18 2.46 0.31 26.56
CIR 0.00 0.00 1.52 3.49 2.59 0.00 0.00 15.88
Mean CU -- 2.57 7.07 7.95 1.97 -- -- 19.58 CIR -- 1.56 6.18 7.20 1.40 -- -- 16.32
Max CU -- 3.49 9.31 9.00 2.35 -- -- 23.20 CIR -- 3.37 9.31 8.87 2.23 -- -- 21.68
1.79 5.04 6.51 1.54 -- -- 16.13 Min CU -- CIR -- 0.00 1.85 3.70 0.00 -- -- 9.50
UJ'fiFA my ..............................................
CIR 1.90 6.15 8.98 9.21 8.16 5.01 0.98 35.33
PASTURE GRASS AND U S my ..............................
SDJING GRAINS --------------------------------------------
= =31p PII-=
CU and CIR are in inches.
44
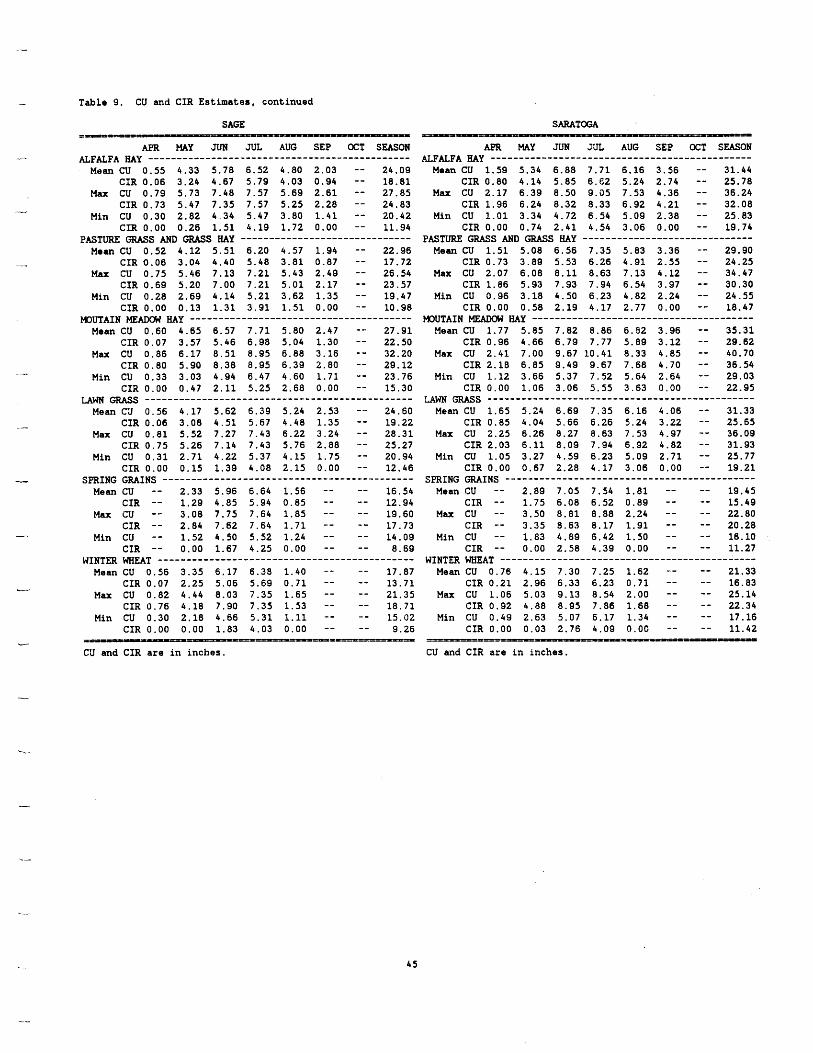
I Table 9. CU and CIR Estimates, continued
^C
SAGE =v---
APR MAY JUN JUL AUG SEP OCT SEASON
Mean CU 0 . 5 5 4.33 5.78 6.52 4.80 2.03 -- 24.09 CIR 0.06 3.24 4.67 5.79 4.03 0.94 -- 18.81
Max CU 0.79 5.73 7.48 7.57 5.69 2.61 -- 27.85 CIR 0.73 5.47 7.35 7.57 5.25 2.28 -- 24.83
Min CW 0.30 2.82 4.34 5.47 3.80 1 . 4 1 -- 20.42 CIR 0.00 0.26 1.51 4.19 1.72 0.00 -- 11.94
Mean CU 0.52 4.12 5 . 5 1 6.20 4.57 1.94 -- 22.96 CIR 0.06 3.04 4.40 5.48 3.81 0.87 -- 17.72
Max CU 0.75 5.46 7.13 7 .21 5.43 2.49 -- 26.54 CIR 0.69 5.20 7.00 7.21 5 .01 2.17 -- 23.57
Min CU 0.28 2.69 4 . 1 4 5.21 3.62 1.35 -- 19.47 CIR 0.00 0.13 1 .31 3 . 9 1 1.51 0.00 -- 10.98
Mean CU 0.60 4.65 6.57 7.71 5.80 2.47 -- 27.91 CIR 0.07 3.57 5.46 6.98 5.04 1.30 -- 22.50
Max CU 0.86 6.17 8 . 5 1 8.95 6.88 3.16 -- 32.20 C I R 0.80 5.90 8.38 8.95 6.39 2.80 -- 29.12
Min CU 0.33 3.03 4.94 6.47 4.60 1.71 -- 23.76 CIR 0.00 0.47 2 . 1 1 5.25 2.68 0.00 -- 15.30
LAWN GRASS ____----------------__I_________________-------
Mean CJ 0 . 5 6 4.17 5.62 6.39 5.24 2.53 -- 24.60 CIR 0.06 3.08 4 . 5 1 5.67 4.48 1.35 -- 19.22
Max CU 0 . 8 1 5.52 7.27 7.43 6.22 3.24 -- 28.31 CIR 0.75 5.26 7.14 7.43 5.76 2.88 -- 25.27
Min CU 0 . 3 1 2 .71 4.22 5.37 4.15 1.75 -- 20,94 CIR 0.00 0.15 1.39 4.08 2.15 0.00 -- 12.46
Mean CU -- 2.33 5.96 6.64 1.56 -- -- 16.54 CIR -- 1.29 4.85 5.94 0.85 -- -- 12.94
Max CU -- 3.08 7.75 7.64 1.85 -- -- 19.60 CIR -- 2.84 7.62 7.64 1.71 -- -- 17.73
Min CU -- 1.52 4.50 5.52 1.24 -- -- 14.09 CIR -- 0.00 1.67 4.25 0.00 -- -- 8.69
Mean CU 0 . 5 6 3.35 6.17 6.38 1.40 -- -- 17.87 CIR 0.07 2.25 5.06 5.69 0.71 -- -- 13.71
Max CU 0.82 4 .44 8.03 7.35 1.65 -- -- 21.35 CIR 0.76 4.18 7.90 7.35 1.53 -- -- 18.71
Min CU 0.30 2.18 4.66 5.31 1.11 -- -- 15.C2 CIR 0.00 0.00 1.83 4.03 0.00 -- -- 9.26
ALFALFA m y ..............................................
PASTURE GRASS AND U S my ..............................
MOUTAIN MEADOW m y -I-------------------------------------
SPRING GRAINS ............................................
WINTER WHEAT ----------------.----_______I____________-----
. . P I S - = - ~ = = ~ = ~ = ~ = ~ ~ ~ - - - - ~ =
CLI and CIR are in inches.
SARATOGA ------ APR MAY JUN J'JL AUG SEP OCT SWSON
ALFALFA my .............................................. Mean CU 1.59 5.34 6.88 7 .71 6.16 3.56 -- 31.44
CIR 0.80 4.14 5.85 6.62 5.24 2.74 -- 25.78 Max CU 2.17 6.39 8.50 9.05 7.53 4.36 -- 36.24
CIR 1.96 6.24 8.32 8.33 6.92 4 .21 -- 32.08 Min CU 1.01 3.34 4.72 6.54 5.09 2.38 -- 25.83
CIR 0.00 0.74 2.41 4.54 3.06 0.00 -- 19.74
Mean CU 1.51 5.08 6.56 7.35 5.83 3.36 -- 29.90 CIR 0.73 3.89 5.53 6.26 4.91 2.55 -- 24.25
Max CU 2.07 6.08 8.11 8.63 7.13 4.12 -- 34.47 CIR 1.86 5.93 7.93 7.94 6.54 3.97 -- 30.30
Min CU 0.96 3.18 4.50 6.23 4.82 2.24 -- 24.55 CIR 0.00 0.58 2.19 4.17 2.77 0.00 -- 18.47
Mean CU 1.77 5.85 7.82 8.86 6.E2 3.96 -- 35.31 CIR 0.96 4.66 6.79 7.77 5.89 3.12 -- 29.62
Max CU 2.41 7.00 9.67 10.41 8.33 4.85 -- 40.70 CIR 2.18 6.85 9.49 9.67 7.68 4.70 -- 36.54
Min CW 1.12 3.66 5.37 7.52 5.64 2.64 -- 29.03 CIR 0.00 1.06 3.06 5.55 3.63 0.00 -- 22.95
Mean CU 1.65 5.24 6.69 7.35 6.16 4.06 -- 31.33 CIR 0.85 4.04 5.66 6.26 5.24 3.22 -- 25.65
Max CU 2.25 6.26 8.27 8.63 7.53 4.97 -- 36.09 CIR 2.03 6.11 8.09 7.94 6.92 4.82 -- 31.93
Min CU 1.05 3.27 4.59 6.23 5.09 2 .71 -- 25.77 CIR 0.00 0.67 2.28 4 . 1 7 3.06 0.00 -- 19.21
Mean CU -- 2.89 7.05 7.54 1.81 -- -- 19.45 CIR -- 1.75 6.08 6.52 0.89 -- -- 15.49
Max CU -- 3.50 8.81 8.88 2.24 -- -- 22.80 CIR -- 3.35 8.63 8.17 1.91 -- -- 20.28
Min CU -- 1.83 4.89 6.42 1.50 -- -- 16.10 CIR -- 0.00 2.58 4.39 0.00 -- -- 11.27
Mean CU 0.76 4.15 7.30 7.25 1.62 -- -- 21.33 CIR 0.21 2.96 6.33 6.23 0.71 -- -- 16.83
Max CU 1.06 5.03 9.13 8.54 2.00 -- -- 25.14 CIR 0.92 4.88 0.95 7.86 1.68 -- -- 22.34
Min CU 0.49 2.63 5.07 6.17 1.34 -- -- 17.16 CIR 0.00 0.03 2.76 4.09 0.01: -- -- 11.42
PASTURE U S AND GRASS m y ..............................
MOuTAIN MADOW my .......................................
LAWN GRASS ...............................................
SPRING W I N S ............................................
WINTER WHEAT .............................................
- - ---=-- -===a=---- IIP
CU and CIR are in inches.
4 s
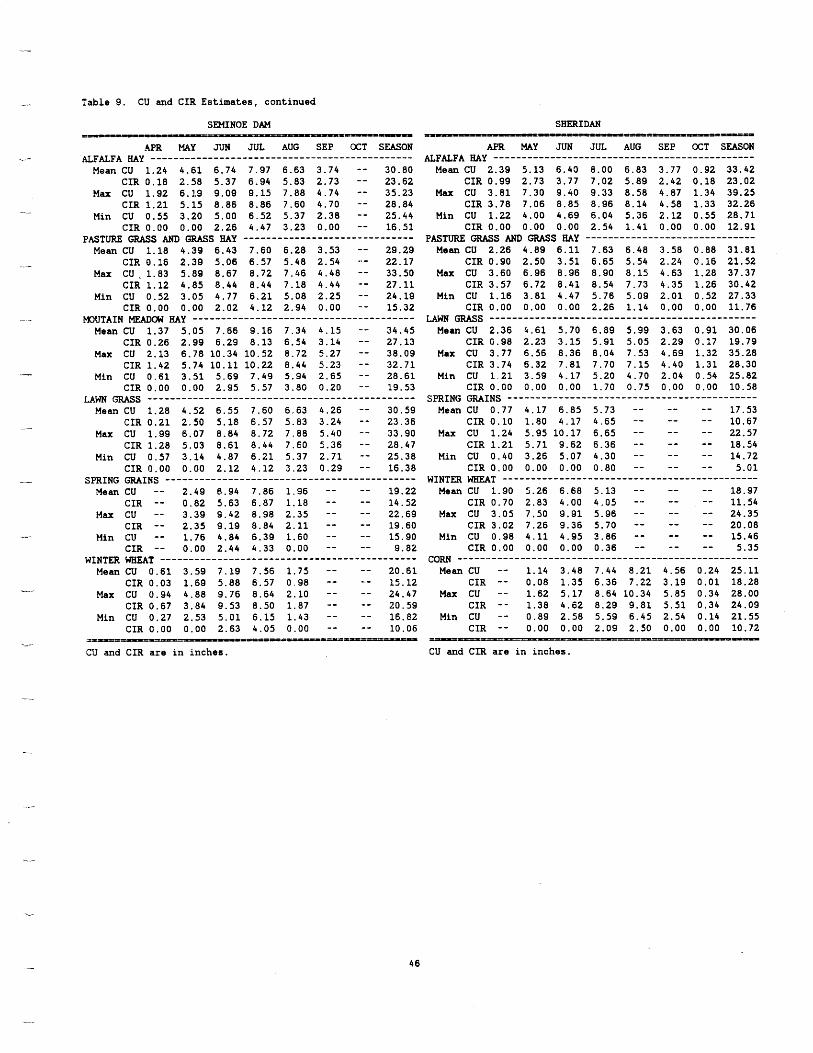
c Table 9. CU and C I R Estimates, continued
--
I-
-
SEMINOE DAM --- --.
APR MAY JUN JUL AUG SEP OCT SEASON
Mean CU 1.24 4.61 6.74 7.97 6.63 3.74 -- 30.80 C I R 0.18 2.58 5.37 6.94 5.83 2.73 -- 23.62
Max CU 1.92 6.1.9 9.09 9.15 7.88 4 . 7 4 -- 35.23 CIR 1 .21 5.15 8.86 8.86 7.60 4.70 -- 28.84
Min CU 0.55 3.20 5.00 6.52 5.37 2.38 -- 25.44 C I R 0 .00 0.00 2.26 4 . 4 7 3.23 0.00 -- 16.51
Mean CU 1.18 4.39 6.43 7.60 6.28 3.53 -- 29.29 CIR 0.16 2.39 5.06 6.57 5.48 2.54 -.- 22.17
Max CU,1.83 5.89 8.67 8.72 7.46 4.48 -- 33. 50 C I R 1.12 4.85 8.44 8.44 7.18 4 . 4 4 -- 27.11
Min CU 0.52 3 . 0 5 4.77 6.21 5.08 2.25 -- 24.19 C I R 0.00 0.00 2.02 4.12 2.94 0.00 -- 15.32
Mean CU 1.37 5.05 7.66 9.16 7.34 4.15 -- 34.45 CIR 0.26 2.99 6.29 8.13 6.54 3.14 -- 27.13
Max CU 2.13 6.78 10.34 10.52 8.72 5.27 -- 38.09 C I R 1.42 5.74 10.11 10.22 8.44 5.23 -- 32.71
Min CU 0 .61 3.51 5.69 7.49 5.94 2.65 -- 28.61 C I R 0 .00 0.00 2.95 5.57 3.80 0.20 -- 19.53
Mean CU 1.28 4.52 6.55 7.60 6.63 4.26 -- 30.59 C I R 0.21 2.50 5.18 6.57 5.83 3.24 -- 23.36
Max CU 1.99 6.07 8.84 8.72 7.88 5.40 -- 33.90 CIR 1.28 5.03 8.61 8.44 7.60 5.36 -- 28.47
Min CU 0.57 3.14 4.87 6.21 5.37 2.71 -- 25.38 C I R 0.00 0.00 2.12 4.12 3.23 0.29 -- 16.38
Mean CU -- 2.49 6.94 7.86 1.96 -- -- 19.22 C I R -- 0.82 5.63 6.87 1.18 -- -- 14.52
Max CU -- 3.39 9.42 8.98 2.35 -- -- 22.69 C I R -- 2.35 9.19 8.84 2.11 -- -- 19.60
Min CU -- 1.76 4.84 6.39 1.60 -- -- 15. 90 C I R -- 0.00 2.44 4.33 0 .00 -- -- 9.82
Mean CU 0.61 3.59 7.19 7.56 1.75 -- -- 20.61 C I R 0.03 1.69 5.88 6.57 0.98 -- - - 15.12
Max CU 0.94 4.88 9.76 8.64 2.10 -- -- 24.47 CIR 0.67 3.84 9.53 8.50 1.87 -- -- 20.59
Min CU 0.27 2.53 5.01 6.15 1.43 -- -- 16. e2 C I R 0 . 0 0 0 .00 2.63 4.05 0 .00 -- -- 10.06
ALFALFA my ..............................................
PJTW W S AND GRASS fuy ------------------------------
MOUTAIN MEADOW m y __------------------________I__________ _ -
I
urn GRASS ______________----__-------- - - - - - - - - .~-------- - -
-
SPRING GRAINS -__--_---_---------------------------------- -
WINTER WHEAT -___-----------------------------------------
= = - - - = P E = = = r l ~ P ~ I = t P n - ~ ~ ~ ~ -./-
CU and C I R are in inches.
SHERIDAN
APR MAY J U N JUL AUG SEP OCT SEASON
Mean CU 2.39 5.13 6.40 8.00 6.83 3.77 0.92 33.42 C I R 0.99 2.73 3.77 7.02 5.89 2.42 0.18 23.02
Max CU 3.81 7.30 9.40 9.33 8.58 4.87 1.34 39.25 C I R 3.78 7.06 8.85 8.96 8.14 4.58 1.33 32.26
Min CU 1.22 4.00 4.69 6.04 5.36 2.12 0.55 28.71 CIR 0.00 0.00 0.00 2.54 1 . 4 1 0.00 0 .00 12.91
Mean CU 2.26 4.89 6.11 7.63 S.48 3.58 0.88 31.81 CIR 0.90 2.50 3.51 6.65 5.54 2.24 0.16 21.52
Max CU 3.60 6.96 8.96 8.90 8.15 4.63 1.28 37.37 CIR 3.57 6.72 8.41 8.54 7.73 4.35 1.26 30.42
Min CU 1.16 3.81 4.47 5.76 5.09 2.01 0.52 27.33 CIR 0.00 0 .00 0.00 2.26 1 . 1 4 0 .00 0 .00 11.76
GRASS ............................................... Mean CU 2.36 4.61 5.70 6.89 5.99 3.63 0 .91 30.06
CIR 0.98 2.23 3.15 5.91 5.05 2.29 0.17 19.79 Max CU 3.77 6.56 8.36 8.114 7.53 4.69 1.32 35.28
CIR 3.74 6.32 7.81 7.70 7.15 4.40 1.31 28.30 Min CU 1 . 2 1 3.59 4 . 1 7 5.20 4.70 2.04 0.54 25.82
C I R 0 .00 0 .00 0.00 1.70 0.75 0 .00 0.00 10.58
Mean CU 0.77 4 . 1 7 6.85 5.73 -- -- -- 17.53 CIR 0.10 1.80 4 . 1 7 4.65 -- -- -- 10.67
Max CU 1.24 5.95 10.17 6.65 -- -- -- 22.57 C I R 1.21 5.71 9.62 6.36 -- -- -- 18.54
Min CU 0.40 3.26 5.07 4.30 -- -- -- 14.72 C I R 0 .00 0 .00 0.00 0.80 -- -- -- 5.01
Mean CU 1 . 9 0 5.26 6.68 5.13 -- -- -- 18.97 C I R 0.70 2.83 4.00 4.05 -- -- -- 11.54
Max CU 3.05 7.50 9.91 5.96 -- -- -- 24.35 CIR 3.02 7.26 9.36 5.70 -- -- -- 20.08
Min CU 0.98 4 . 1 1 4.95 3.86 -- -- -- 15. 46 C I R 0.00 0.00 0.00 0.36 -- -- -- 5.35
CORN _---------------------------------------------------- Mean CU -- 1 . 1 4 3.48 7 . 4 4 8 .21 4.56 0.24 25.11
C I R -- 0.08 1.35 6.36 7.22 3.19 0 . 0 1 18.28 Max CU -- 1.62 5.17 8.64 10.34 5.85 0.34 28.00
C I R -- 1.38 4.62 8.29 9.81 5.51 0.34 24.09 Min CU -- 0.89 2.58 5.59 6.45 2.54 0 .14 21.55
C I R -- 0.00 0.00 2.09 2.50 0.00 0.00 10.72
ALFALFA my ..............................................
PASTURE GRASS GRASS my ..............................
SPRING GRAINS ----------------I---------------------------
WINTER WHEAT ---------------------------------------------
_ _ _ _ _ _ _ _ _ _ _ _
CU and CIR are in inches.
-_
46
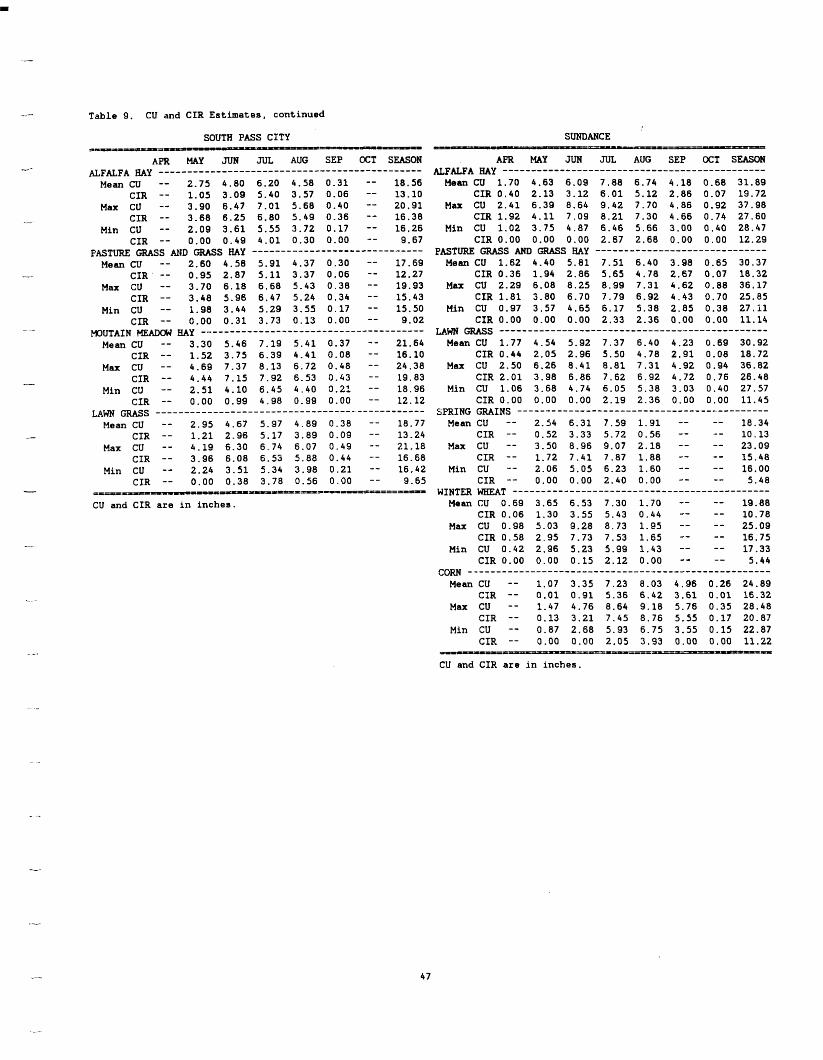
-_-
-_-- Table 9. CU and CIR Estimates, continued
SOUTH PASS CITY --- --- APR MAY JUN JUL AUG SEP OCT SEASON
Mean CU -- 2.75 4.80 6.20 4.58 0.31 -- 18.56 CIR -- 1.05 3.09 5.40 3.57 0.06 -- 13.10
Max CU -- 3.90 6.47 7.01 5.68 0.40 -- 20.91 .- CIR -- 3.68 6.25 6.80 5.49 0.36 -- 16.38
Min CU -- 2.09 3.61 5.55 3.72 0.17 -- 16.26 CIR -- 0.00 0.49 4.01 0.30 0.00 -- 9.67
Mean CU -- 2.60 4.58 5.91 4.37 0.30 -- 17.69 -- CIR -- 0.95 2.87 5.11 3.37 0.06 -- 12.27
Max CU -- 3.70 6.18 6.68 5.43 0.38 -- 19.93 CIR -- 3.48 5.96 6.47 5.24 0.34 -- 15.43
Min CU -- 1.98 3.44 5.29 3.55 0.17 -- 15.50 CIR -- 0.00 0.31 3.73 0.13 0.00 -- 9.02
Mean CU -- 3.30 5.46 7.19 5.41 0.37 -- 21.64 CIR -- 1.52 3.75 6.39 4.41 0.08 -- 16.10
Max CU -- 4.69 7.37 8.13 6.72 0.48 -- 24.38 CIR -- 4.44 7.15 7.92 6.53 0.43 -- 19.83
Min CU -- 2.51 4.10 6.45 4.40 0.21 -- 18.96 CIR -- 0.00 0.99 4.98 0.99 0.00 -- 12.12
Mean CU -- 2.95 4.67 5.97 4.89 0.38 - - 18.77 CIR -- 1.21 2.96 5.17 3.89 0.09 -- 13.24
Max CU -- 4.19 6.30 6.74 6.07 0.49 -- 21.18 CIR -- 3.96 6.08 6.55 5.88 0.44 -- 16.68
Min CU -- 2.24 3.51 5.34 3.98 0.21 -- 16.42 CIR -- 0.00 0.38 3.78 0.56 0.00 -- 9.65
ALFALFA my .............................................. 4
PASTURE: a s s MID GRASS HAY -------------------------.-----
MOUTAIN W O S J M y _I___---------------------------------- _ -
LAWN GRASS _____---------------____^___L___________-------
=-~=-=-I---~===:=======---~~=~-
CU and CIR are in inches.
SUNDANCE
APR MAY JUN JUL AUG SEP OCT SEASON ALFALFA my ..............................................
Mean CU 1.70 4.63 6.09 7.88 6.74 4.18 0.68 31.89 CIR 0.40 2.13 3.12 6.01 5.12 2.86 0.07 19.72
Max CU 2.41 6.39 8.64 9.42 7.70 4.86 0.92 37.98 CIR 1.92 4.11 7.09 8.21 7.30 4.66 0.74 27.60
Min CU 1.02 3.75 4.87 6.46 5.66 3.00 0.40 28.47 CIR 0.00 0.00 0.00 2.67 2.68 0.00 0.00 12.29
Mean CU 1.62 4.40 5.81 7.51 6.40 3.98 0.65 30.37 CIR 0.36 1.94 2.86 5.65 4.78 2.67 0.07 18.32
Max CU 2.29 6.08 8.25 8.99 7.31 4.62 0.88 36.17 CIR 1.81 3.80 6.70 7.79 6.92 4.43 0.70 25.85
Min CU 0.97 3.57 4.65 6.17 5.38 2.85 0.38 27.il CIR 0.00 0.00 0.00 2.33 2.36 0.00 0.00 11.14
GRASS --------------------____________l_______-------
Mean CU 1.77 4.54 5.92 7.37 6.40 4.23 0.69 30.92 CIR 0.44 2.05 2.96 5.50 4.78 2.91 0.08 18.72
Max CU 2.50 6.26 8.41 8.81 7.31 4.92 0.94 36.82 CIR 2.01 3.98 6.86 7.62 6.92 4.72 0.76 26.48
Min CU 1.06 3.68 4.74 6.05 5.38 3.03 0.40 27.57 CIR 0.00 0.00 0.00 2.19 2.36 0.00 0.00 11.45
Mean CU -- 2.54 6.31 7.59 1.91 -- -- 18.34 CIR -- 0.52 3.33 5.72 0.56 -- .-- 10.13
Max CU -- 3.50 8.96 9.07 2.18 -- -- 23.09 CIR -- 1.72 7.41 7.87 1.88 -- -- 15.48
2.06 5.05 6.23 1.60 -- -- 16.00 Min CU -- CIR -- 0.00 0.00 2.40 0.00 -- -- 5.48
Mean CU 0.69 3.65 6.53 7.30 1.70 -- -- 19.88 CIR 0.06 1.30 3.55 5.43 0.44 -- -- 10.78
Max CU 0.98 5.03 3.28 8.73 1.95 -- -- 25.09 CIR 0.58 2.95 7.73 7.53 1.65 -- -- 16.75
Mia CU 0.42 2.96 5.23 5.99 1.43 -- -- 17.33 CIR 0.00 0.00 0.15 2.12 0.00 -- -- 5.44 cow .....................................................
Mean CU -- 1.07 3.35 7.23 8.03 4.96 0.26 24.89 CZR -- 0.01 0.91 5.36 6.42 3.61 0.01 16.32
Max CU -- 1.47 4.76 8.64 9.18 5.76 0.35 28.48 CIR -- 0.13 3.21 7.45 8.76 5.55 0.17 20.87
Min CU -- 0.87 2.68 5.93 6.75 3.55 0.15 22.87 CIR -- 0.00 0.00 2.05 3.93 0.00 0.00 11.22
PASTURE U S GRASS my ..............................
SPRING GRAINS -----------------------------------.---------
WINTER WHEAT ---------------------------------------------
-- ==-I==- =P==u=--D---
CU and CIR are in inches.
47
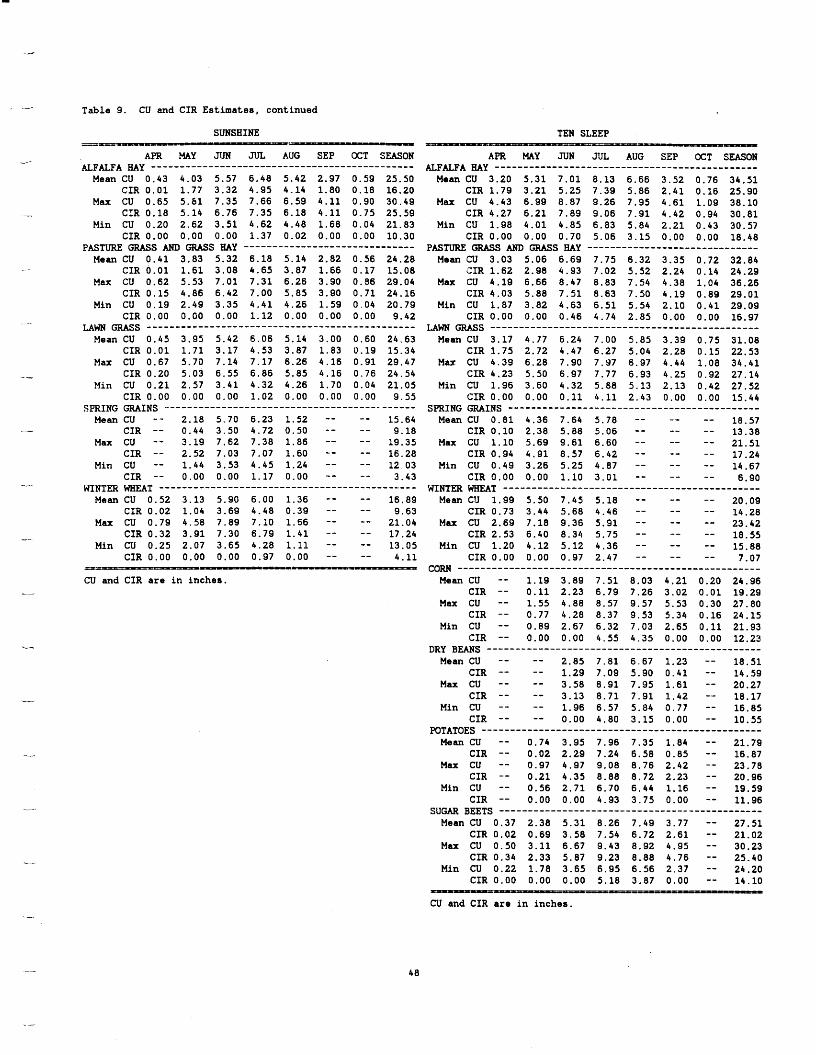
Table 9. CU and CIR Estimates, continued I I.
SUNSHINE TEN SLEEP
---
--
APR MAY JUN JUL AUG SEP OCT SEASON
Mean CU 0.43 4.03 5.57 6.48 5.42 2.97 0.59 25.50 CIR 0.01 1.77 3.32 4.95 4.14 1.80 0.18 16.20
Max CU 0.65 5.61 7.35 7.66 6.59 4.11 0.90 30.49 CIR 0.18 5.14 6.76 7.35 6.18 4.11 0.75 25.59
Min CU 0.20 2.62 3.51 4.62 4.48 1.68 0.04 21.83 CIR 0.00 0.00 0.00 1.37 0.02 0.00 0.00 10.30
Mean CU 0.41 3.83 5.32 6.18 5.14 2.82 0.56 24.28 CIR 0.01 1.61 3.08 4.65 3.87 1.66 0.17 15.08
Max CU 0.62 5.53 7.01 7.31 6.26 3.90 0.86 29.04 CIR 0.15 4.86 6.42 7.00 5.85 3.90 0.71 24.16
Min CU 0.19 2.49 3.35 4.41 4.26 1.59 0.04 20.79 CIR 0.00 0.00 0.00 1.12 0.00 0.00 0.00 9.42
GRASS ___-----------------________________I___-------
Mean CU 0.45 3.95 5.42 6.06 5.14 3.00 0.60 24.63 CIR 0.01 1.71 3.17 4.53 3.87 1.83 0.19 15.34
Max CU 0.67 5.70 7.14 7.17 6.26 4.16 0.91 29.47 CIR 0.20 5.03 6.55 6.86 5.85 4.16 0.76 24.54
Min CU 0.21 2.57 3.41 4.32 4.26 1.70 0.04 21.05 CIR 0.00 0.00 0.00 1.02 0.00 0.00 0.00 9.55
Mean CU -- 2.18 5.70 6.23 1.52 -- -- 15.64 - CIR -- 0.44 3.50 4.72 0.50 -- -- 9.18
Max CU -- 3.19 7.62 7.38 1.86 -- -- 19.35 CIR -- 2.52 7.03 7.07 1.60 -- -- 16.28
Min Cu -- 1.44 3.53 4.45 1.24 -- -- 12 03 CIR -- 0.00 0.00 1.17 0.00 -- -- 3.43
Mean CU 0.52 3.13 5.90 6.00 1.36 -- -- 16.89 CIR 0.02 1.04 3.69 4.48 0.39 -- -- 9.63
Max CU 0.79 4.58 7.89 7.10 1.66 -- -- 21.04 CIR 0.32 3.91 7.30 6.79 1.41 -- -- 17.24
Min CU 0.25 2.07 3.65 4.28 1.11 -- -- 13.05 CIR 0.00 0.00 0.00 0.97 0.00 -- -- 4.11
ALFALFA HAY _____-I---------------------------------------
PASTURE GRASS GRASS HAY -----------------I------------
SPRING GRAINS .--------------------___________I________----
WINTER =T ------------------------------------------.--- -- -
=I== - CU and CIR are in inches.
w
--
APR MAY JUN JUL AUG SEP OCT SEASON
Mean CU 3.20 5.31 7.01 8.13 6.66 3.52 0.76 34.51 CIR 1.79 3.21 5.25 7.39 5.86 2.41 0.16 25.90
Max CU 4.43 6.99 8.87 9.26 7.95 4.61 1.09 38.10 CIR 4.27 6.21 7.89 9.06 7.91 4.42 0.94 30.81
Min CU 1.98 4.01 4.85 6.83 5.84 2.21 0.43 30.57 CIR 0.00 0.00 0.70 5.06 3.15 0.00 0.00 18.48
Mean CU 3.03 5.06 6.69 7.75 6.32 3.35 0.72 32.84 CIR 1.62 2.98 4.93 7.02 5.52 2.24 0.14 24.29
Max CU 4.19 6.66 8.47 8.83 7.54 4.38 1.04 36.26 CIR 4.03 5.88 7.51 8.63 7.50 4.19 0.89 29.01
Min CU 1.87 3.82 4.63 6.51 5.54 2.10 0.41 29.09 CIR 0.00 0.00 0.46 4.74 2.85 0.00 0.00 16.97
Ct'RhSs ............................................... Mean CU 3.17 4.77 6.24 7.00 5.85 3.39 0.75 31.08
CIR 1.75 2.72 4.47 6.27 5.04 2.28 0.15 22.53 Max CU 4.39 6.28 7.90 7.97 6.97 4.44 1.08 34.41
CIR 4.23 5.50 6.97 7.77 6.93 4.25 0.92 27.14 Min CU 1.96 3.60 4.32 5.88 5.13 2.13 0.42 27.52
CIR 0.00 0.00 0.11 4.11 2.43 0.00 0.00 15.44
18.57 Mean CU 0.81 4.36 7.64 5.78 -- --- -- CIR 0.10 2.38 5.88 5.06 -- -- -- 13.38
Max CU 1.10 5.69 9.61 6.60 -- -- -- 21.51 CIR 0.94 4.91 8.57 6.42 -- -- -- 17.24
Min CU 0.49 3.26 5.25 4.87 -- -- -- 14.67 CIR 0.00 0.00 1.10 3.01 -- -- -- 6.90
Mean CU 1.99 5 . 5 0 7.45 5.18 -- -- -- 20.09 14.28 CIR 0.73 3.44 5.68 4.46 -- -- .-- 23.42 Max CU 2.69 7.18 9.36 5.91 -- -- -- 18.55 CIR 2.53 6.40 8.34 5.75 -- -- -- 15.88 Min CU 1.20 4.12 5.12 4.36 -- -- -- 7.07 CIR 0.00 0.00 0.97 2.47 -- -- -- cow .....................................................
Mean CU -- 1.19 3.89 7.51 8.03 4.21 0.20 24.96 CIR -- 0.11 2.23 6.79 7.26 3.02 0.01 19.29
Max CU -- 1.55 4.88 8.57 9.57 5.53 0.30 27.80 CIR -- 0.77 4.28 8.37 9.53 5.34 0.16 24.15
Min CU -- 0 . 8 9 2.67 6.32 7.03 2.65 0.11 21.93 CIR -- 0.00 0.00 4.55 4.35 0.00 0.00 12.23
Mean CU -- -- 2.85 7.81 6.67 1.23 -- 18.51 14.59 CIR -- -- 1.29 7.09 5.90 0.41 -- 20.27 3.58 8.91 7.95 1.61 -- Max CU -- --
CIR -- -- 3.13 8.71 7.91 1.42 -- 18.17 16.85 Min CU -- -- 1.96 6.57 5.84 0.77 --
CIR -- -- 0.00 4.80 3.15 0.00 -- 10.55
Mean CU -- 0.74 3.95 7.96 7.35 1.84 -- 21.79 CIR -- 0.02 2.29 7.24 6.58 0.85 -- 16.87
Max CU -- 0.97 4.97 9.08 8.76 2.42 -- 23.78 CIR -- 0.21 4.35 8.88 8.72 2.23 -- 20.96
Min CU -- 0.56 2.71 6.70 6.44 1.16 -- 19.59 CIR -- 0.00 0.00 4.93 3.75 0.00 -- 11.96
Mean CU 0.37 2.38 5.31 8.26 7.49 3.77 -- 27.51 CIR 0.02 0.69 3,58 7.54 6.72 2.61 -- 21.02
Max CU 0.50 3.11 6.67 9.43 8.92 4.95 -- 30.23 CIR 0.34 2.33 5.87 9.23 8.88 4.76 -- 25.40
Min CU 0.22 1.78 3.65 6.95 6.56 2.37 -- 24.20 CIR 0.00 0.00 0.00 5.18 3.87 0.00 -- 14.10
UF&FA my ..............................................
PASTURE GRASS GRASS my ..............................
SPRING GRAINS ............................................
WINTER WHEAT .............................................
DRY BEANS ................................................
POTATOES .................................................
S U M BEETS ..............................................
CU and CIR are in inches.
48
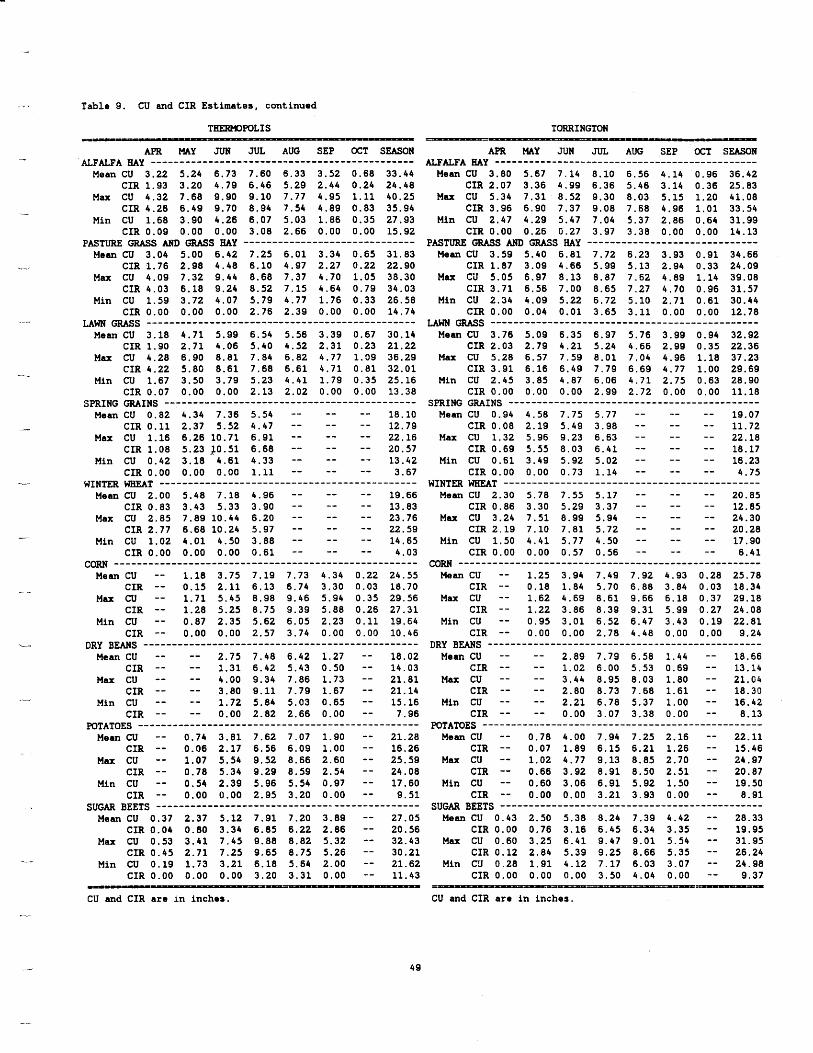
Table 9. CU and CIR Estimates, continued
THERMOPOLIS ~~
APR MAY JUN JUL AUG SEP OCT SEASON
Mean CU 3.22 5.24 6.73 7.60 6.33 3.52 0.68 33.44 CIR 1.93 3.20 4.79 6.46 5.29 2.44 0.24 24.48
Max CU 4.32 7.68 9.90 9.10 7.77 4.95 1.11 40.25 CIR 4.26 6.49 9.70 8.94 7.54 4.89 0.83 35.94
Min CU 1.68 3.90 4.26 6.07 5.03 1.86 0.35 27.93 CIR 0.09 0.00 0.00 3.08 2.66 0.00 0.00 15.92
Mean CU 3.04 5.00 6.42 7.25 6.01 3.34 0.65 31.83 CIR 1.76 2.98 4.48 6.10 4.97 2.27 0.22 22.90
Max CU 4.09 7.32 9.44 8.68 7.37 4.70 1.05 38.30 CIR 4.03 6.18 9.24 8.52 7.15 4.64 0.79 34.03
Min CU 1.59 3.72 4.07 5.79 4.77 1.76 0.33 26.58 CIR 0.00 0.00 0.00 2.76 2.39 0.00 0.00 14.74 a s ...............................................
Mean CU 3.18 4.71 5.99 6.54 5.56 3.39 0.67 30.14 CIR 1.90 2.71 4.06 5.40 4.52 2.31 0.23 21.22
Max CU 4.28 6.90 8.81 7.84 6.82 4.77 1.09 36.29 CIR 4.22 5.80 8.61 7.68 6.61 4.71 0.81 32.01
Min CU 1.67 3.50 3.79 5.23 4.41 1.79 0.35 25.16 CIR 0.07 0.00 0.00 2.13 2.02 0.00 0.00 13.38
Mean CU 0.82 4.34 7.36 5.54 -- -- -- 18.10 CIR 0.11 2.37 5.52 4.47 -- -- -- 12.79
Max CU 1.16 6.26 10.71 6.91 -- -- -- 22.16 CIR 1.08 5.23 J0.51 6.68 -- -- -- 20.57
Min CU 0.42 3.18 4.61 4.33 -- -- -- 13.42 CIR 0.00 0.00 0.00 1.11 -- -- -- 3.67
Mean CU 2.00 5.48 7.18 4.96 -- -- -- 19.66 CIR 0.83 3.43 5.33 3.90 -- -- -- 13.83
Max CU 2.85 7.89 10.44 6.20 -- -- -- 23.76 CIR 2.77 6.68 10.24 5.97 -- -- -- 22.59
Min CU 1.02 4.01 4.50 3.88 -- -- -- 14.65 CIR 0.00 0.00 0.00 0.61 -- -- -- 4.03
CORN ..................................................... Mean CU -- 1.18 3.75 7.19 7.73 4.34 0.22 24.55
CIR -- 0.15 2.11 6.13 6.74 3.30 0.03 18.70 Max CU -- 1.71 5.45 8.98 9.46 5.94 0.35 29.56
CIR -- 1.28 5.25 8.75 9.39 5.88 0.26 27.31 Min CU -- 0.87 2.35 5.62 6.05 2.23 0.11 19.64
CIR -- 0.00 0.00 2.57 3.74 0.00 0.00 10.46
Mean CU -- -- 2.75 7.48 6.42 1.27 -- 18.02 CIR -- -- 1.31 6.42 5.43 0.50 -- 14.03
Max CU -- -- 4.00 9.34 7.86 1.73 -- 21.81 CIR -- -- 3.80 9.11 7.79 1.67 -- 21.14
Min CU -- -- 1.72 5.84 5.03 0.65 -- 15.16 CIR -- -- 0.00 2.82 2.66 0.00 -- 7.96
Mean CU -- 0.74 3.81 7.62 7.07 1.90 -- 21.28 CIR -- 0.06 2.17 6.56 6.09 1.00 -- 16.26
Max CU -- 1.07 5.54 9.52 8.66 2.60 -- 25.59 CIR -- 0.78 5.34 9.29 8.59 2.54 -- 24.08
Min CU -- 0 . 5 4 2.39 5.96 5.54 0.97 -- 17.60 CIR -- 0.00 0.00 2.95 3.20 0 . 0 0 -- 9.51
Mean CU 0.37 2.37 5.12 7.91 7.20 3.89 -- 27.05 CIR 0.04 0.80 3.34 6.85 6.22 2.86 -- 20.56
Max CU 0.53 3.41 7.45 9.88 8.82 5.32 -- 32.43 CIR 0.45 2.71 7.25 9.65 8.75 5.26 -- 30.21
Min CU 0.19 1.73 3.21 6.18 5.64 2.00 -- 21.62 CIR 0.00 0.00 0.00 3.20 3.31 0.00 -- 11.43
AtFf iFA my ..............................................
P M T W GRASS UJD GRASS my ..............................
SPRING m I N S --------------------_________I__________----
WINTER WHEAT --------------------_________________I__-----
DRY BEANS ................................................ u
.-
POTATOES .................................................
SUGAR BEETS .............................................. - -
.-
TORRINGTON
APR MAY JUN JUL AUG SEP OCT SEASON
Mean CU 3.80 5.67 7.14 8.10 6.56 4.14 0.96 36.42 CIR 2.07 3.36 4.99 6.36 5.46 3.14 0.36 25.83
Max CU 5.34 7.31 8.52 9.30 8.03 5.15 1.20 41.08 CIR 3.96 6.90 7.37 9.08 7.68 4.96 1.01 33.54
Min CU 2.47 4.29 5.47 7.04 5.37 2.86 0.64 31.99 CIR 0.00 0.26 0.27 3.97 3.38 0.00 0.00 14.13
Mean CU 3.59 5.40 6.81 7.72 6.23 3.93 0.91 34.66 CIR 1.87 3.09 4.66 5.99 5.13 2.94 0.33 24.09
Max cil 5.05 6.97 8.13 8.87 7.62 4.89 1.14 39.08 CIR 3.71 6.56 7.00 8.65 7.27 4.70 0.96 31.57
Min CU 2.34 4.09 5.22 6.72 5.10 2.71 0.61 30.44 CIR 0.00 0.04 0.01 3.65 3.11 0.00 0.00 12.78
GRASS ............................................... Mean CU 3.76 5.09 6.35 6.97 5.76 3.99 0.94 32.92
CIR 2.03 2.79 4.21 5.24 4.66 2.99 0.35 22.36 Max CU 5.28 6.57 7.59 8.01 7.04 4.96 1.18 37.23
CIR 3.91 6.16 6.49 7.79 6.69 4.77 1.00 29.69 Min CU 2.45 3.85 4.87 6.Q6 4.71 2.75 0.63 28.90
CIR 0.00 0.00 0.00 2.99 2.72 0.00 0.00 11.18
Mean CU 0.94 4.58 7.75 5.77 -- -- -- 19.07 CIR 0.08 2.19 5.49 3.98 -- -- -- 11.72
CIR 0.69 5.55 8.03 6.41 -- -- -- 18.17 Min CU 0.61 3.49 5.92 5.02 -- -- -- 16.23
CIR 0.00 0.00 0.73 1.14 -- -- -- 4.75
Mean CU 2.30 5.78 7.55 5.17 -- -- -- 20.85 CIR 0.86 3.30 5.29 3.37 -- -- -- 12.85
Max CU 3.24 7.51 8.99 5.94 -- -- -- 24.30 CIR 2.19 7.10 7.81 5.72 -- -- -- 20.28
Min CU 1.50 4.41 5.77 4.50 -- -- -- 17.90 CIR 0.00 0.00 0.57 0.56 -- -- -- 6.41 corn .....................................................
Mean CU -- 1.25 3.94 7.49 7.92 4.93 0.28 25.78 CIR -- 0.18 1.84 5.70 6.88 3.84 0.03 18.34
M a x CU -- 1.62 4.69 8.61 9.66 6.18 0.37 29.18 CIR -- 1.22 3.86 8.39 9.31 5.99 0.27 24.08
Min CU -- 0.95 3.01 6.52 6.47 3.43 0.19 22.81 CIR -- 0.00 0.00 2.78 4.48 0.00 0.00 9.24
Mean CU -- -- 2.89 7.79 6.58 1.44 -- 18.66 CIR -- -- 1.02 6.00 5.53 0.69 -- 13.14
Max CU -- -- 3.44 8.95 8.03 1.80 -- 21.04 CIR -- -- 2.80 8.73 7.68 1.61 -- 18.30
Min CU -- -- 2.21 6.78 5.37 1.00 -- 16.42 CIR -- -- 0.00 3.07 3.38 0.00 -- 8.13
Mean CU -- 0.78 4.00 7.94 7.25 2.16 -- 22.11 CIR -- 0.07 1.89 6.15 6.21 1.26 -- 15.46
Max CU -- 1.02 4.77 9.13 8.85 2.70 -- 24.97 CIR -- 0.66 3.92 8.91 8.50 2.51 -- 20.87
Min CU -- 0.60 3.06 6.91 5.92 1.50 -- 19.50 CIR -- 0.00 0.00 3.21 3.93 0.00 -- 8.91
Mean CU 0.43 2.50 5.38 8.24 7.39 4.42 -- 28.33 CIR 0.00 0.76 3.16 6.45 6.34 3.35 -- 19.95
Max CU 0.60 3.25 6.41 9.47 9.01 5.54 -- 31.95 CIR 0.12 2.84 5.39 9.25 8.66 5.35 -- 26.24
Min CZI 0.28 1.91 4.12 7.17 6.03 3.07 -- 24.98 CIR 0.00 0.00 0.00 3.50 4.04 0.00 -- 9.37
ALFALFA my ..............................................
PASTURE GRASS U S m y ..............................
SPRING GRAINS ............................................
Max CU 1.32 5.96 9.23 6.63 -- -- -- 22.18
WINTER WHEAT .............................................
DRY BEANS ................................................
PQTATOES ---------..---_---___-----------------------------
S u m BEE'S ..............................................
CU and CIR are in inches. - -_
CU and CIR are in inches.
49
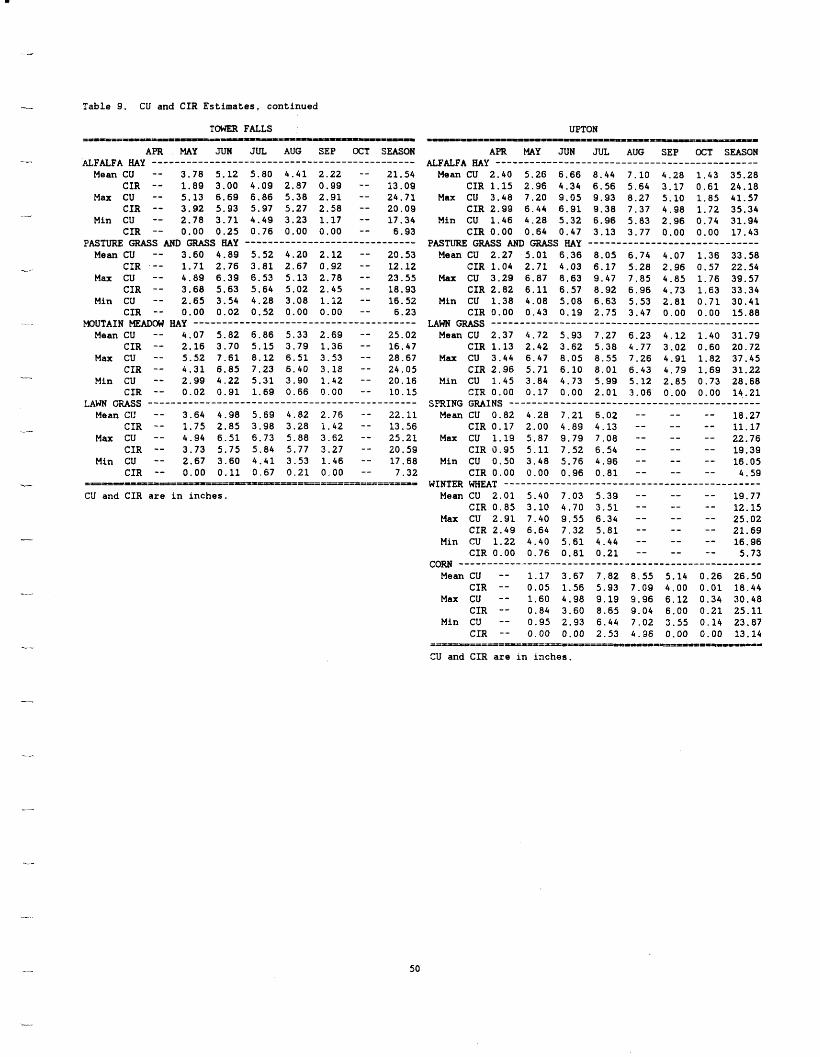
.-
- Table 9, CU and CIR Estimates, continued
TOWER FALLS I=~IcIII-pI=III--=-- R
APR MAY JUN JUL AUG SEP OCT SEASON
Mean CU -- 3.78 5.12 5.80 4.41 2.22 -- 21.54 CIR -- 1.89 3.00 4.09 2.87 0.99 -- 13.09
Max CU -- 5.13 6.69 6.86 5.38 2.91 -- 24.71 CIR -- 3.92 5.93 5.97 5.27 2.58 -- 20.09
Min CU -- 2.78 3.71 4.49 3.23 1.17 -- 17.34 CIR -- 0.00 0.25 0.76 0.00 0.00 -- 6.93
Mean cu -- 3.60 4.89 5.52 4.20 2.12 -- 20.53
Max CU -- 4.89 6.39 6.53 5.13 2.78 -- 23.55 CIR -- 3.68 5.63 5.64 5.02 2.45 -- 18.93
Min Cii -- 2.65 3.54 4.28 3.08 l.i2 -- 16.52 CIR -- 0.00 0.02 0.52 0.00 0.00 -- 6.23
Mean CU -- 4.07 5.82 6.86 5.33 2.69 -- 25.02 CIR -- 2.16 3.70 5.15 3.79 1.36 -- 16.47
Max CU -- 5.52 7.61 8.12 6.51 3.53 -- 28.67 CIR -- 4.31 6.85 7.23 6.40 3.1e -- 24.05
Min CU -- 2.99 4.22 5.31 3.90 1.42 - - 20.16 CIR -- 0.02 0.91 1.69 0.66 0.00 -- 10.15
Mean CU -- 3.64 4.98 5.69 4.82 2.76 -- 22.11 - CIR -- 1.75 2.85 3.98 3.28 1.42 -- 13.56
Max CU -- 4.94 6.51 6.73 5.88 3.62 -- 25.21 CIW -- 3.73 5.75 5.84 5.77 3.27 - - 20.59
Min CU -- 2.67 3.60 4.41 3.53 1.46 -- 17.68 CIR -- 0.00 0.11 0.67 0.21 0.00 -- 7.32
- ALFALFA my ..............................................
-
PASTURE GRASS AND GRASS my ..............................
x CIR -- 1.71 2.76 3.81 2.67 0.92 -- 12.12
. _ MOUTAIN m7w my -----------_---------------------------
LAWN GRASS ______-----_-----------------------------------
D==-==-=i=PI=s==-~~~-====================*=-= w
CU and CIR are i n inches.
UPTON ~ -
APR MAY JUN JUL AUG SEP OCT SEASON
Mean CU 2.40 5.26 6.66 8.44 7.10 4.28 1.43 35.28 CIR 1.15 2.96 4.34 6.56 5.64 3.17 0.61 24.18
Max CU 3.48 7.20 9.05 9.93 8.27 5.10 1.85 41.57 CIR 2.99 6.44 6.91 9.38 7.37 4.98 1.72 35.34
Min CU 1.46 4.28 5.32 6.96 5.83 2.96 0.74 31.94 CIR 0.00 0.64 0.47 3.13 3.77 0.00 0.00 17.43
Mean CU 2.27 5 . 0 1 6.36 8.05 6.74 4.07 1.36 33.58 CIR 1.04 2.71 4.03 6.17 5.28 2.96 0.57 22.54
Max CU 3.29 6.87 8.63 9.47 7.85 4.85 1.76 39.57 CIR 2.82 6.11 6.57 8.92 6.96 4.73 1.63 33.34
Mfn CU 1.38 4.08 5.08 6.63 5.53 2.81 0.71 30.41 CIR 0.00 0.43 0.19 2.75 3.47 0.00 0.00 15.88
GRASS ............................................... Mean CU 2.37 4.72 5.93 7.27 6.23 4.12 1.40 31.79
CIR 1.13 2.42 3.62 5.38 4.77 3.02 0.60 20.72 Max CU 3.44 6.47 8.05 8.55 7.26 4.91 1.82 37.45
Min CU 1.45 3.84 4.73 5.99 5.12 2.85 0.73 28.68 CIR 0.00 0.17 0.00 2.01 3.06 0.00 0.00 14.21
Mean CU 0.82 4.28 7.21 6.02 --- -- -- 18.27 CIR 0.17 2.00 4.89 4.13 -- -- -- 11.17
Max CU 1.19 5.87 9.79 7.08 -- -- -- 22.76 CIR 0.95 5.11 7.52 6.54 -- -- -- 19.39
Min CU 0.50 3.48 5.76 4.96 -- -- -- 16.05 CIR 0.00 0.00 0.96 0.81 -- -- -- 4.59
Mean CU 2.01 5.40 7.03 5.39 -- -- -- 19.77 CIR 0.85 3.10 4.70 3.51 -- -- -- 12.15
Max CU 2.91 7.40 9.55 6.34 -- -- -- 25.02 CIR 2.49 6.64 7.32 5.81 -- -- -- 21.69
Min CU 1.22 4.40 5.61 4.44 -- -- -- 16.96 CIR 0.00 0.76 0.81 0.21 -- -- -- 5.73
CORN -_------------------_______________^____-------------
Mean CU -- 1.17 3.67 7.82 8.55 5.14 0.26 26.50 CIR -- 0.05 1.56 5.93 7.09 4.00 0.01 18.44
Max CU -- 1.60 4.98 9.19 9.96 6.12 0.34 30.48 CIR -- 0.84 3.60 8.65 9.04 6.00 0.21 25.11
Min CU -- 0.95 2.93 6.44 7.02 3.55 0.14 23.87 CIR -- 0.00 0.00 2.53 4.36 0.00 0.00 13.14
ALFALFA my ..............................................
PAST' GRASS AND GRASS my ------------------------------
CIR 2.96 5.71 6.10 8.01 6.43 4.79 1.69 31.22
SmING GRAINS ............................................
WINTER WHEAT .............................................
c-
CU and CIR are i n inches.
50
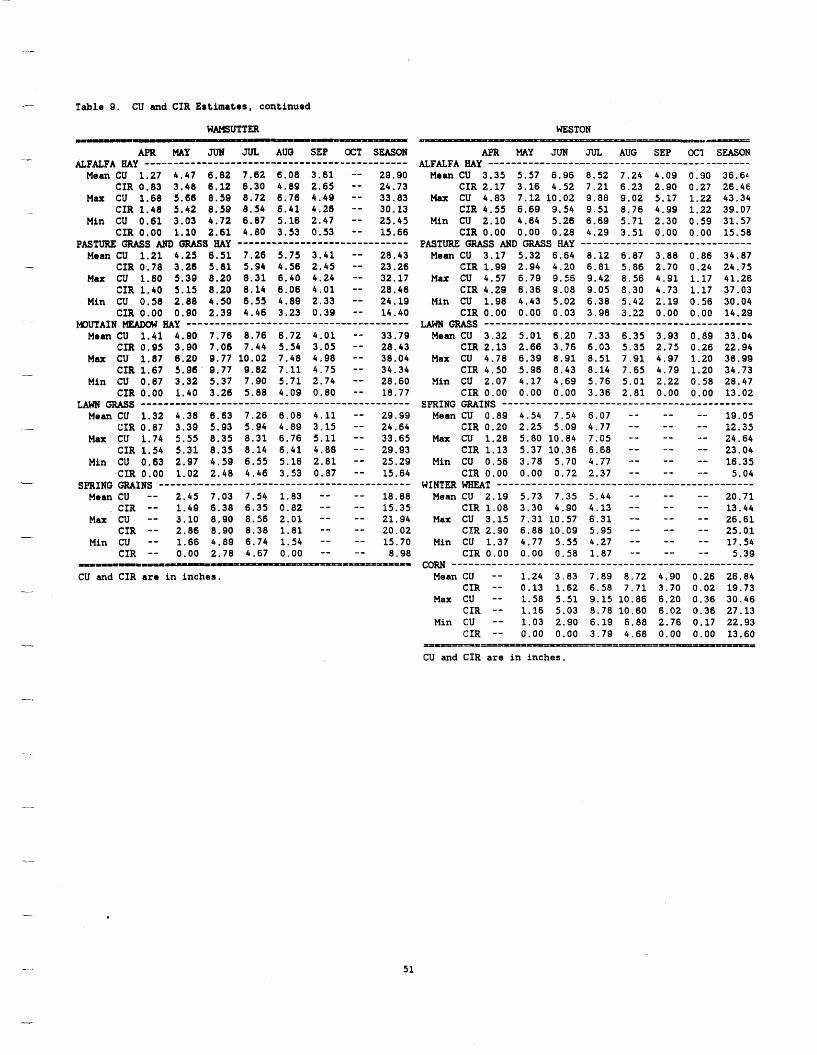
_- Table 9. CU and CIR Estimates, continued
WAMSUTTER
APR MAY JUN JUL AUG SEP OCT SEASON
Mean CU 1.27 4.47 6.82 7.62 6.08 3.61 -- 29.90 CIR 0.83 3.48 6.12 6.30 4.89 2.65 -- 24.73
Max CU 1.68 5.66 8.59 8.72 6.76 4.49 -- 33.83 - CIR 1.48 5.42 8.59 8.54 6.41 4.26 -- 30.13
Min CU 0.61 3 . 0 3 4.72 6.87 5.16 2.47 -- 25.45 CIR 0.00 1.10 2.61 4.80 3.53 0.53 -- 15.66
Mean CU 1.21 4.25 6.51 7.26 5.75 3.41 -- 28.43 - CIR 0.78 3.20 5.81 5.94 4.56 2.45 -- 23.26
Max CU 1.60 5.39 8.20 8.31 6.40 4.24 -- 32.17 CIR 1.40 5.15 8.20 8.14 6.06 4.01 -- 28.46
Min CU 0.58 2.88 4.50 6.55 4.89 2.33 -- 24.19 CIR 0.00 0.90 2.39 4.46 3.23 0.39 -- 14.40
Mean CU 1.41 4.90 7.76 8.76 6.72 4.01 -- 33.79 CIR 0.95 3.90 7.06 7.44 5.54 3.05 -- 28.43
Max CU 1.87 6.20 9.77 10.02 7.48 4.98 -- 38.04
Min CU 0.67 3.32 5.37 7.90 5.71 2.74 -- 28.60 CIR 0.00 1.40 3.26 5.88 4.09 0.80 -- 18.77
Mean CU 1.32 4.38 6.63 7.26 6.08 4.11 -- 29.89 - CIR 0.87 3.39 5.93 5.94 4.89 3.15 -- 24.64
Max CU 1.74 5.55 8.35 8.31 6.76 5.11 -- 33.65 CIR 1.54 5.31 8.35 8.14 6.41 4.88 -- 29.93
Min CU 0.63 2.97 4.59 6.55 5.16 2.81 -- 25.29 CIR 0.00 1.02 2.48 4.46 3.53 0.87 -- 15.64
Mean CU -- 2.45 7.03 7.54 1.83 -- -- 18.88 . CXR -- 1.49 6.38 6.35 0.82 -- -- 15.35
Max CU -- 3.10 8.90 8.56 2.01 -- -- 21.94 CIR -- 2.86 8.90 8.38 1.81 -- -- 20.02
Min CU -- 1.66 4.89 6.74 1.54 -- -- 15.70 CIR -- 0.00 2.78 4.67 0.00 -- -- 8.98
ALFALFA HAY .............................................. --
P M T W GRASS AND W S HAY ..............................
WUTAIN my _-------------------_____I_____________
I CIR 1.67 5.96 9.77 9.82 7.11 4.75 -- 34.34
LAWN GRASS ---_----__-l-----------------------------------
c- SPRING W I N S --I--_----__--------------------------------
-
I==-=--- =PIIII=--ll==m
CU and CIR are in inches.
WESTON --- - =- APR MAY JUN JUL AUG SEP OC'I SEASON
Mean CU 3.35 5.57 6.96 8.52 7.24 4.09 0.90 36.64 CIR 2.17 3.16 4.52 7.21 6.23 2.90 0.27 26.40
Max CU 4.83 7.12 10.02 9.88 9.02 5.17 1.22 43.34 CIR 4.55 6.69 9.54 9.51 8.76 4.99 1.22 39.07
Min CU 2.10 4.64 5.26 6.69 5.71 2.30 0.59 31.57 CIR 0.00 0.00 0.28 4.29 3.51 0.00 0.00 15.58
Mean CU 3.17 5.32 6.64 8.12 6.87 3.88 0.86 34.87 CIR 1.99 2.94 4.20 6.81 5.86 2.70 0.24 24.75
Max CU 4.57 6.79 9.56 9.42 8.56 4.91 1.17 41.26 CIR 4.29 6.36 9.08 9.05 8.30 4.73 1.17 37.03
Min CU 1.98 4.43 5.02 6.38 5.42 2.19 0.56 30.04 CIR 0.00 0.00 0.03 3.98 3.22 0.00 0.00 14.29 a s ----------_--------I---------------------------
Mean CU 3.32 5 . 0 1 6.20 7.33 6.35 3.93 0.89 33.04 CIR 2.13 2.66 3.76 6.03 5.35 2.75 0.26 22.94
Max CU 4.78 6.39 8.91 8.51 7.91 4.97 1.20 38.99 CIR 4.50 5.96 8.43 8.14 7.65 4.79 1.20 34.73
Hin CU 2.07 4.17 4.69 5.76 5.01 2.22 0.58 28.47 CIR 0.00 0.00 0.00 3.36 2.81 0.00 0.00 13.02
Mean CU 0.89 4.54 7.54 6.07 -- -- -- 19.05 CIR 0.20 2.25 5.09 4.77 -- -- -- 12.35
Max C'J 1.28 5.80 10.84 7.05 -- -- -- 24.64 CIR 1.13 5.37 10.36 6.68 -- -- -- 23.04
Min CU 0.56 3.78 5.70 4.77 -- -- -- 16.35 CIR 0.00 0.00 0.72 2.37 -- -- -- 5.04
Mean CU 2.19 5.73 7.35 5.44 -- -- -- 20.71 CIR 1.08 3.30 4.90 4.13 -- -- -- 13.44
Max CU 3.15 7.31 10.57 6.31 -- -- -- 26.61 CLR 2.90 6.88 10.09 5.95 -- -- -- 25.01
Min CU 1.37 4.77 5.55 4.27 -- -- -- 17.54 CIR 0.00 0.00 0 . 5 8 1.87 -- -- -- 5.39
CORN -----.-------------I-__________I_________-------------
CIR -- 0.13 1.62 6.58 7.71 3.70 0 . 9 2 19.73 Max CU -- 1.58 5.51 9.15 10.86 6.20 0.36 30.46
CIR -- 1.16 5.03 8.78 10.60 6.02 0.36 27.13 Min CU -- 1.03 2.90 6.19 6.88 2.76 0.17 22.93
CIR -- 0.00 0.00 3.79 4.68 0.00 0.00 13.60
ALFALFA my ----------------------------------------------
PASTURE W S AND GRASS HAY ..............................
SPRING GRAINS ............................................
WINTER =T .............................................
Mean CU -- 1.24 3.83 7.89 8.72 4.90 0.26 26.84
-z=-- -- CU and CIR are in inches.
51
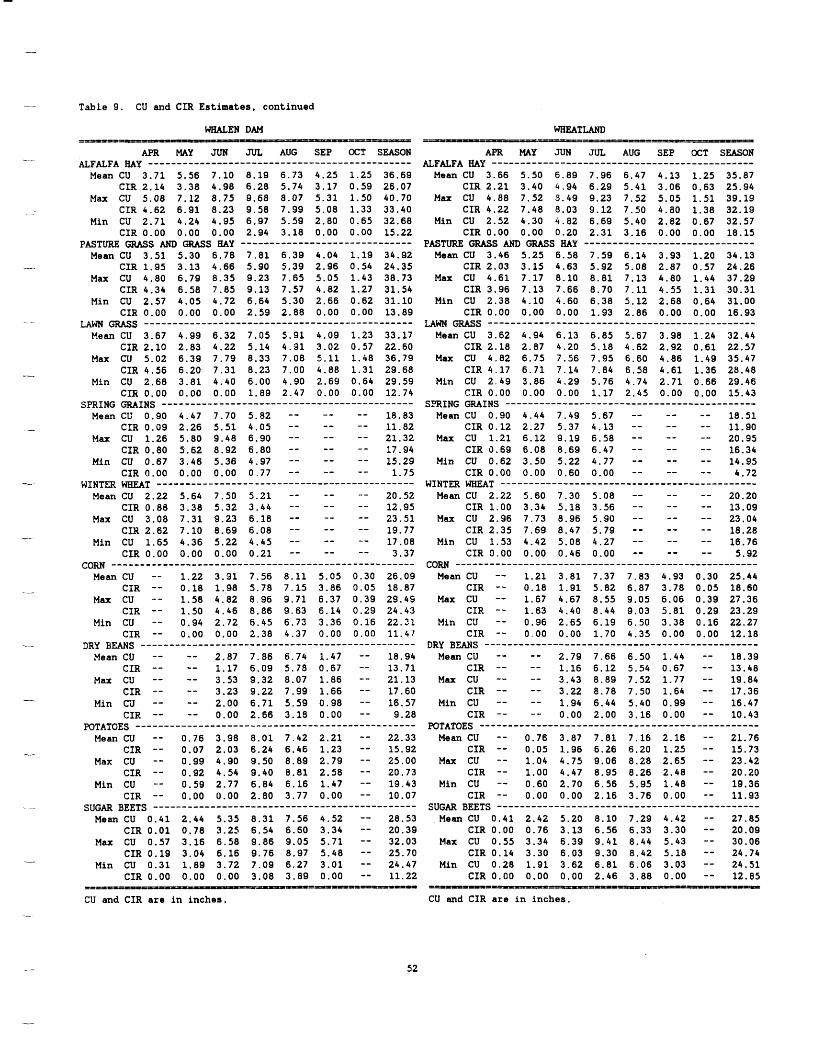
- Table 9. CU and CIR Estimates, cantinued
WRALEN DAM WHEATLAND
c
APR MAY JUN JUL AUG SEP OCT SEASON AFR MAY JUN JUL AUG SEP OCT SEASON
Mean CU 3.71 5.56 7.10 8.19 6.73 4.25 1.25 36.69 Mean CU 3.66 5 . 5 0 6.89 7.96 6.47 4.13 1.25 35.87 CIR 2.14 3.38 4.98 6.28 5.74 3.17 0.59 26.07 CIR 2.21 3.40 4.94 6.29 5.41 3.06 0.63 25.94
Max CU 5.08 7.12 8.75 9.68 8.07 5.31 1.50 40.70 Max CU 4.88 7.52 9.49 9.23 7.52 5.05 1.51 39.19
Min Cii 2.71 4.24 4.95 6.97 5.59 2.80 0.65 32.68 Min CU 2.52 4.30 4.82 6.69 5.40 2.82 0.67 32.57 CIR 0.00 0.00 0.00 2.94 3.18 0.00 0.00 15.22 CIR 0.00 0.00 0.20 2.31 3.16 0.00 0.00 18.15
Mean CU 3.51 5.30 6.78 7.81 6.39 4.04 1.19 34.92 Mean CU 3.46 5.25 6.58 7.59 6.14 3.93 1.20 34.13 - CIR 1.95 3.13 4.66 5.90 5.39 2.96 0.54 24.35 CIR 2.03 3.15 4.63 5.92 5.08 2.87 0.57 24.26
Max CU 4.80 6.79 8.35 9.23 7.65 5.05 1.43 38.73 Max CU 4.61 7.17 8.10 8.81 7.13 4.80 1.44 37.29 CIR 4.34 6.58 7.85 9.13 7.57 4.82 1.27 31.54 CIR 3.96 7.13 7.66 8.70 7.11 4.55 1.31 30.31
Min CU 2.57 4.05 4.72 6.64 5.30 2.66 0.62 31.10 Min CU 2.38 4.10 4.60 6.38 5.12 2.68 0.64 31.00 CIR 0.00 0.00 0.00 2.59 2.88 0.00 0.00 13.89 CIR 0.00 0.00 0.00 1.93 2.86 0.00 0.00 16.93
Mean CU 3.67 4.99 6.32 7.05 5.91 4.09 1.23 33.17 Mean CU 3.62 4.94 6.13 6.85 5.67 3.98 1.24 32.44 CIR 2.10 2.83 4.22 5.14 4.91 3.02 0.57 22.60 CIR 2.18 2.87 4.20 5.18 4.62 2.92 0.61 22.57
Max CU 5.02 6.39 7.79 8.33 7.08 5.11 1.48 36.79 M a x CU 4.82 6.75 7.56 7.95 6.60 4.86 1.49 35.47 CIR 4.56 6.20 7.31 8.23 7.00 4.88 1.31 29.68 CIR 4.17 6.71 7.14 7.84 6.58 4.61 1.36 28.48
Min CU 2.68 3.81 4.40 6.00 4.90 2.69 0.64 29.59 Min CU 2.49 3.86 4.29 5.76 4.74 2.71 0.66 29.46 CIR 0.00 0.00 0.00 1.89 2.47 0.00 0.00 12.74 CIR 0.00 0.00 0.00 1.17 2.45 0.00 0.00 15.43
Mean CU 0.90 4.47 7.70 5.82 -- -- -- 18.83 Mean CU 0.90 4.44 7.49 5.67 -- -- -- 18.51 A CIR 0.09 2.26 5.51 4.05 -- -- -- 11.82 CIR 0.12 2.27 5.37 4.13 -- -- -- 11.90
Max CU 1.26 5.80 9.48 6.90 -- -- -- 21.32 Max CU 1.21 6.12 9.19 6.58 -- -- -- 20.95 CIR 0.80 9.62 8.92 6.80 -- -- -- 17.94 CIR 0.69 6.08 8.69 6.47 -- -- -- 16.34
Min CU 0.67 3.46 5.36 4.97 -- -- -- 15.29 Min CU 0.62 3.50 5.22 4.77 -- -- -- 14.95 CIR 0.00 0.00 0.00 0.77 -- -- -- 1.75 CIR 0.00 0.00 0.60 0.00 -- -- -- 4.72
Mean CU 2.22 5.64 7.50 5.21 -- -- -- 20.52 Mean CU 2.22 5.60 7.30 5.08 -- -- -- 20.20 CIR 0.80 3.38 5.32 3.44 -- -- -- 12.95 CIR 1.00 3.34 5.18 3.56 -- -- -- 13.09
Max CU 3.08 7.31 9.23 6.18 -- -- -- 23.51 Max CU 2.96 7.73 8.96 5.90 -- -- -- 23.04 CIW 2.62 7.10 8.69 6.08 -- -- -- 19.77 CIR 2.35 7.69 8.47 5.79 -- -- -- 18.28
Min CU 1.65 4.36 5.22 4.45 -- -- -- 17.08 Min CU 1.53 4.42 5.08 4.27 -- -- -- 16.76 CIR 0.00 0.00 0.00 0.21 -- -- -- 3.37 CIR 0.00 0.00 0.46 0.00 -- -- -- 5.92 corn ..................................................... cow .....................................................
Mean CU -- 1.22 3.91 7.56 8.11 5.05 0.30 26.09 Mean CU -- 1.21 3.81 7.37 7.83 4.93 0.30 25.44 CIR -- 0.18 1.98 5.78 7.15 3.86 0.05 18.87 CIR -- 0.18 1.91 5.82 6.87 3.78 0.05 18.60
Max CU - - 1.58 4.82 8 96 9.71 8.37 0.39 29.49 Max CU -- 1.67 4.67 8.55 9.05 6.06 0.39 27.36 CIR -- 1.50 4.46 8.86 9.63 6.14 0.29 24.43 CIR -- 1.63 4.40 8.44 9.03 5.81 0.29 23.29
Yin CU -- 0.94 2.72 6.45 6.73 3.36 0.16 22.31 Min CU -- 0.96 2.65 6.19 6.50 3.38 0.16 22.27 CIR -- 0.00 0.00 2.38 4.37 0.00 0.00 11.41 CIR -* 0.00 0.00 1.70 4.35 0.00 0.00 12.18
Mean CU -- -- 2.87 7.86 6.74 1.47 -- 18.94 Mean CU -- -- 2.79 7.66 6.50 1.44 -- 18.39 CIR -- -- 1.17 6.09 5.78 0.67 -- 13.71 CIR -- -- 1.16 6.12 5.54 0.67 -- 13.48
Max CU -- -- 3.53 9.32 8.07 1.86 -- 21.13 Max CU -- -- 3.43 8.89 7.52 1.77 -- 19.84 CIR -- -- 3.23 9.22 7.99 1.66 -- 17.60 CIR -- -- 3.22 8.78 7.50 1.64 -- 17.36
Min C'J -- -- 2.00 6.71 5.59 0.98 -- 16.57 Min CU -- -- 1.94 6.44 5.40 0.99 -- 16.47 CIR -- -- 0.00 2.66 3.18 0.00 -- 9.28 CIR -- -- 0.00 2.00 3.16 0.00 -- 10.43
Mean CU -- 0.76 3.98 8.01 7.42 2.21 -- 22.33 Mean CU -- 0.76 3.87 7.81 7.16 2.16 -- 21.76 CIR -- 0.07 2.03 6.24 6.46 1.23 -- 15.92 CIR -- 0.05 1.96 6.26 6.20 1.25 -- 15.73
Max CU -- 0.99 4.90 9.50 8.89 2.79 -- 25.00 Max CU -- 1.04 4.75 9.06 8.28 2.65 -- 23.42 CIR -- 0.92 4.54 9.40 8.81 2.58 -- 20.73 CIR -- 1.00 4.47 8.95 8.26 2.48 -- 20.20
Min CU -- 0.59 2.77 6.84 6.16 1.47 -- 19.43 Min CU -- 0.60 2.70 6.56 5.95 1.48 -- 19.36 CIR -- 0.00 0.00 2.80 3.77 0.00 -- 10.07 CIR -- 0.00 0.00 2.16 3.76 0.00 -- 11.93
Mean CU 0.41 2.44 5.35 8.31 7.56 4.52 -- 28.53 Mean CU 0.41 2.42 5.20 8.10 7.29 4.42 -- 27,85 CIR 0.01 0.78 3.25 6.54 6.60 3.34 -- 20.39 CIR 0.00 0.76 3.13 6.56 6.33 3.30 -- 20.09
Max CU 0.57 3.16 6.58 9.86 9.05 5.71 -- 32.03 Max CU 0.55 3.34 6.39 9.41 8.44 5.43 -- 30.06 CIR 0.19 3.04 6.16 9.76 8.97 5.48 -- 25.70 CIR 0.14 3.30 6.03 9.30 8.42 5.18 -- 24.74
Min CU 0.31 1.89 3.72 7.09 6.27 3.01 -- 24.47 Min CU 0.28 1.91 3.62 6.81 6.06 3.03 -- 24.51 CIR 0.00 0.00 0.00 3.08 3.89 0.00 -- 11.22 CIR 0.CO 0.00 0.00 2.46 3.88 0.00 -- 12.85
ALFALFA my .............................................. ALFALFA my .............................................. -
- CIR 4.62 6.91 8.23 9.58 7.99 5.08 1.33 33.40 CIR 4.22 7.48 8.03 9.12 7.50 4.ao 1.38 32.19
PMTW GRASS AND GRASS my .............................. PASTURE GRASS GRASS my ..............................
_ _ GRASS ............................................... LAWN GRASS --------------------__________________I_-------
SPRING GRAINS ............................................ SXING GRAINS ............................................
.--..- WINTER WHEAT _-----___------------------------------------ WINTER WHEAT .............................................
DRY BEANS ____-------------------------------------------- DRY BE'S --I--------------------------------------------- -
-- POTATOES ___________---------_I__________________--------- POTATOES .................................................
SUGAR BEETS ____I-_--------------------------------------- SUGAR BEETS .............................................. . -
--
I -- -----===-=am -DI~I=P---~====
CU and CIR are i n inches. CU and CIR are i n inches.
52
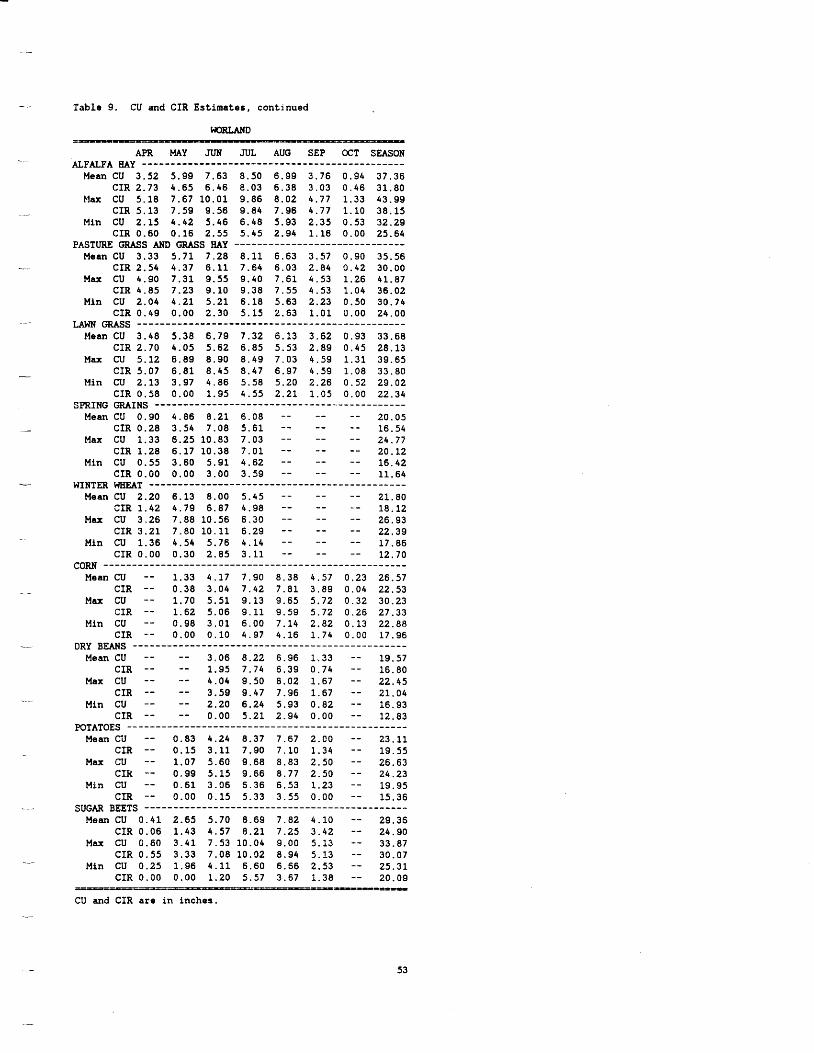
Table 9. CU and CIR Estimates, continued
WORLAND
APR MAY JlJN JUL AUG SEP OCT SEASON
Mean CU 3.52 5.99 7.63 8.50 6.99 3.76 0.94 37.36
Max CU 5.18 7.67 10.01 9.86 8.02 4.77 1.33 43.99 CIR 5.13 7.59 9.56 9.84 7.96 4.77 1.10 38.15
Min CU 2.15 4.42 5.46 6.48 5.93 2.35 0.53 32.29 CIR 0.60 0.16 2.55 5.45 2.94 1.16 0.00 25.64
Mean CU 3.33 5.71 7.28 8.11 6.63 3.57 0.90 35.56 CIR 2.54 4.37 6.11 7.64 6.03 2.84 0.42 30.00
Max CU 4.90 7.31 9.55 9.40 7.61 4.53 1.26 41.87 CIR 4.85 7.23 9.10 9.38 7.55 4.53 1.04 36.02
Min CU 2.04 4.21 5.21 6.18 5.63 2.23 0.50 30.74 CIR 0.49 0.00 2.30 5.15 2.63 1.01 0.00 24.00
GRASS ___------------^-------------------------------
Mean CU 3.48 5.38 6.79 7.32 6.13 3.62 0.93 33.68 CIR 2.70 4.05 5.62 6.85 5.53 2.89 0.45 28.13
Max CU 5.12 6.89 8.90 8.49 7.03 4.59 1.31 39.65 CIR 5.07 6.81 8.45 8.47 6.97 4.59 1.08 33.80
Min CU 2.13 3.97 4.86 5.58 5.20 2.26 0.52 29.02 CIR 0.58 0.00 1.95 4.55 2.21 1.05 0.00 22.34
Mean CU 0.90 4.86 8.21 6.08 -- -- -- 20.05 CIR 0.28 3.54 7.08 5.61 -- -- -- 16.54
Max CU 1.33 6.25 10.83 7.03 -- -- -- 24.77 CIR 1.28 6.17 10.38 7.01 -- -- -- 20.12
Min CU 0.55 3.60 5.91 4.62 -- -- -- 16.42 CIR 0.00 0.00 3.00 3.59 -- -- -- 11.64
Mean CU 2.20 6.13 8.00 5.45 -- -- -- 21.80 CIR 1.42 4.79 6.87 4.98 -- -- - - 18.12
Max CU 3.26 7.88 10.56 6.30 -- -- -- 26.93 CIR 3.21 7.80 10.11 6.29 -- -- -- 22.39
Min CU 1.36 4.54 5.76 4.14 -- -- -- 17.86 CIR 0.00 0.30 2.85 3.11 -- -- -- 12.70
CORN -------I------------I___________________-------------
ALFALFA my ..............................................
CIR 2-73 4.65 6.46 8.03 6.38 3.03 0.46 31.80
PASTURE a s U S my ..............................
SPRING GRAINS ............................................
WINTER =T _-------------------___I________________-----
Mean CU -- 1.33 4.17 7.90 8.38 4.57 0.23 26.57 - - CIR -- 0.38 3.04 7.42 7.81 3.09 0.04 22.53
Max CU -- 1.70 5.51 9.13 9.65 5.72 0.32 30.23 CIR -- 1.62 5.06 9.11 9.59 5.72 0.26 27.33
Min CU -- 0.98 3.01 6.00 7.14 2.82 0.13 22.88 CIR -- 0.00 0.10 4.97 4.16 1.74 0.00 17.96
Mean CU -- -- 3.06 8.22 6.96 i.33 -- 19.57 CIR -- -- 1.95 7.74 6.39 0.74 -- 16.80
Max CU -- -- 4.04 9.50 8.02 1.67 -- 22.45 CIR -- -- 3.59 9.47 7.96 1.67 -- 21.04
2.20 6.24 5.93 0.82 -- 16.93 Min CU -- -- CIR -- -- 0.00 5.21 2.94 0.00 -- 12.83
Mean c'd -- 0.83 4.24 8.37 7.67 2.00 -- 23.11 _ - CIR -- 0.15 3.11 7.90 7.10 1.34 -- 19.55
Max CU -- 1.07 5.60 9.68 8.83 2.50 -- 26.63 CIR -- 0.99 5.15 9.66 8.77 2.50 -- 24.23
Min CU -- 0.61 3.06 6.36 6.53 1.23 -- 19.95 CIR -- 0.90 0.15 5.33 3.55 0.00 -- 15.36
Mean CU 0.41 2.65 5.70 8.69 7.82 4.10 -- 29.36 CIR 0.06 1.43 4.57 8.21 7.25 3.42 -- 24.90
Max CU 0.60 3.41 7.53 10.04 9.00 5.13 -- 33.87 CIR 0.55 3.33 7.08 10.02 8.94 5.13 -- 30.07
Min CU 0.25 1.96 4.11 6.60 6.56 2.53 -- 25.31 CIR 0.00 0.00 1.20 5.57 3.67 1.38 -- 20.09
DRY B M S - - - - - - I - - - - - - - - - - - - -__________________I_-- . - - - - - - -
_._
POTATOES -_----_------------------------------------------
- - SUGAR BEETS ..............................................
-A
CU and CIR are in inches. ./
53
APPENDIX
This Appendix provides information on three items plus a list of references. Mean monthly precipitation and the period of record used to calculate the means are given in Table Al. The period of record shown extends from the first to last years used, however, there are some missing data for a few locations. Comparsions of the mean CU and CIR estimates of Table 9 versus estimates given in Report #5 (Trelease, et al., 1970) are shown in Table A2. Report #5 estimates are usually lower than Table 9 estimates. In the case of wheat, Report #5 did not distinguish between spring wheat and winter wheat. Thus, this needs to be considered when reviewing the Table A2 comparisons for wheat. Crop curves, used to determine the crop coefficients of Table 6 and 7, are given in Figures A1 and A2.
54
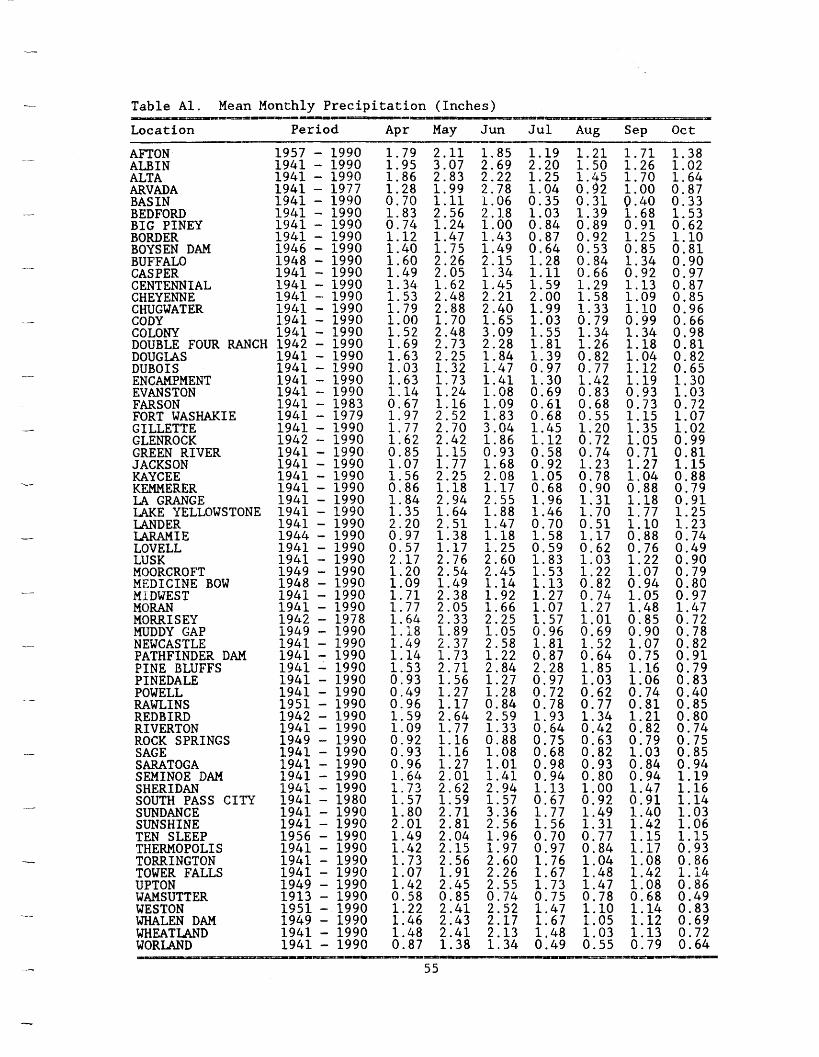
Table A l . Mean Monthly Precipitation (Inches) Location Period Apr May Jun Jul Aug Sep O c t
-- ------- =-- i -
AF'TON ALJ3IN ALTA ARVADA BAS IN BEDFORD BIG PINEY BORDER BOYSEN DAM BUFFALO CASPER CENTENNIAL CHEYENNE CHUGWATER CODY COLONY DQUBLE FOUR RANCH DOUGLAS DUBOIS ENCAMPMENT EVANSTON FARSON FORT WASHAKIE G I LLETT E GLENROCK GREEN RIVER JACKSON KAYCEE KEMMERER LA GRANGE LAKE YELLOWSTONE LANDER LARAMIE LOVELL LUSK MOORCROFT MEDICINE BOW MIDWEST M O W MORRISEY MUDDY GAP NEWCASTLE PATHFINDER DAM PINE BLUFFS P 1. NEDALE POWELL RAWLINS REDBIRD RIVERTON ROCK SPRINGS SAGE SARATOGA SEMINBE DAM SHERIDAN SOUTH PASS CITY SUNDANCE SUNSHINE TEN SLEEP THERMOPOLIS TORRINGTON TOWER FALLS UPTON WAMSUTTER WESTON WHALEN DAM WHEATLAND WORLAND
1957 1941 1941 1941 1941 1941 1941 1941 1946 1948 1941 1941 1941 1941 1.941 1941 1942
1990 1990 1990 1977 1990 1990 1990 1990 1990 1990 1990 1990 1990 1990 1990 1990 1990
1941 - 1990 1941 - 1990 1941 - 1990 1941 - 1990 1941 - 1983 1941 - 1979 1941 - 1990 1942 - 1990 1941 - 1990 1941 - 1990 1941 - 1990 1941 - 1990 1941 - 1990 1941 - 1990 1941 - 1990 1944 - 1990 1941 - 1990 1941 - 1990 1949 - 1990 1948 - 1990 1941 - 1990 1941 - 1990 1942 - 1978 i949 - 1990 1941 - 1990 1941 - 1990 1941 - 1990 1941 - 1990 1941 - 1990 1951 - 1990 1942 - 1990 1941 - 1990 1949 - 1990 1941 - 1990 1941 - 1990 I941 - 1990 1941 - 1990 1941 - 1980 1941 - 1990 1941 - 1990 1956 - 1990 1941 - 1990 1941 - 1990 1941 - 1990 1949 - 1990 1913 - 1990 1951 - 1990 1949 - 1990 1941 - 1990 1941 - 1990
1.79 1.95 1.86 1.28 0.70 1.83 0.74 1.12 1.40 1.60 1.49 1.34. 1.53 1.79 1.00 1.52 1.69 1.63 1.03 1.. 63 1.14 0.67 1.97 1.77 1.62 0.85 1.07 1.56 0.86 1.. 84 1.35 2.20 0.97 0.57 2.17 1.20 1.09 1.71 1.77 1.64 1.18 1.49 1.14 1.53 0.93 0.49 0.96 1.59 1.09 0.92 0.93 0.96 1.64 1.73 1.57 1.80 2.01 1.49 1.42 1.73 1.07 1.42 0.58 1.22 1.46 1.48 0.87
2.11 3.07 2.83 1.99 1.11 2.56 1.24 1.47 1.75 2.26 2.05 1.62 2 . 4 8 2.88 1.70 2.48 2.73 2.25 1.32 1.73 1.24 1.16 2.52 2.70 2.42 1.15 1.77 2.25 1.18 2.94 1.64 2.51 1.38 1.17 2.76 2.54 1.49 2.38 2.05 2.33 1.89 2.37 1.73 2.71 1.56 1.27 1.17 2.64 1.77 1.16 1.16 1.27 2.01 2.62 1.59 2.71 2.81 2.04 2.15 2.56 1.91 2.45 0.85 2.41 2.43 2.41 1.38
1.85 2.69 2.22 2.78 1.06 2.3.8 1.00 1.43 1.49 2.15 1.34 1.45 2.21 2.40 1.65 3.09 2.28 1.84 1.47 1.41 1.08 1.09 1 . 8 3 3.04 1.86 0.93 1.68 2.08 1.17 2.55 1.88 1.47 1.18 1.25 2.60 2.45 1.14 1.92 1.66 2.25 1.05 2.58 1.22 2.84 1.27 1.28 0.84 2.59 1.33 0.88 1.08 1.01 1.41 2.94 1.57 3.36 2.56 1.96 1.97 2.60 2.26 2.55 0.74 2.52 2.17 2.13 1.34
1.19 2.20 1.25 1.04 0.35 1.03 0.84 0.87 0.64 1.28 1.11 1.59 2.00 1.99 1.03 1.55 1.81 7.. 39 0.97 1.30 0.69 0.61 0.68 1.45 1.12 0.58 0.92 1.05 0.68 1.96 1.46 0.70 1.58 0.59 1.83 1.53 1.13 1.27 1.07 1.57 0.96 1.81 0.87 2.28 0.97 0.72 0.78 1.93 0.64 0.75 0.68 0.98 0.94 1.13 0.67 1.77 1.56 0.70 0.97 1.76 1.67 1.73 0.75 1.47 1.67 1.48 0.49
1.21 1.50 1.45 0.92 0.31 1.39 0.89 0.92 0.53 0.84 0.66 1.29 1.58 1.33 0.79 1.34 1.26 0.82 0.77 1.42 0.83 0.68 0.55 1.20 0.72 0.74 1.23 0.78 0.90 1.31 1 .70 0.51 1.17 0.62 1.03 1.22 0.82 0 .74 1.27 1.01 0.69 1.52 0.64 1.85 1.03 0.62 0.77 1.34 0.42 0.63 0.82 0.93 0.80 1.00 0.92 1.49 1.31 0.77 0.84 1.04 1 .48 1.47 0.78 1.10 1.05 1.03 0.55
1.71 1.26 1.71) 1.00 0.40 1.68 0.91 1.25 0.85 1.34 0.92 1.13 1.09 1.10 0.99 1.34 1.18 1.04 1.12 1.19 0.93 0.73 1.15 1.35 1.05 0 . 7 1 1.27 1.04 0.88 1.18 1.77 1.10 0.88 0.76 1.22 1.07 0.94 1.05 1.48 0.85 0.90 1.07 0.75 1.16 1.06 0.74 0.81 1.21 0.82 0.79 1.03 0.84 0.94 1.47 0.91 1.40 1.42 1.15 1.17 1.08 1.42 1.08 0 . 6 8 1.14 1.12 1 . 1 3 0.79
1.38 1.02 1.64 0.87 0.33 1.53 0.62 1.10 0.81 0.90 0.97 0.87 0.85 0.96 0.66 0.98 0.81 0.82 0.65 1.30 1.03 0.72 1.07 1.02 0.99 0.81 1.15 0.88 0.79 0.91 1.25 1.23 0.74 0.49 0.90 0.79 0 . 8 0 0.97 1.47 0.72 0.78 0.82 0.91 0.79 0.83 0.40 0.85 0.80 0.74 0.75 0.85 0.94 1.19 1.16 1.14 1.03 1.06 1.15 0.93 0.86 1.14 0.86 0.49 0.83 0.69 0.72 0.64
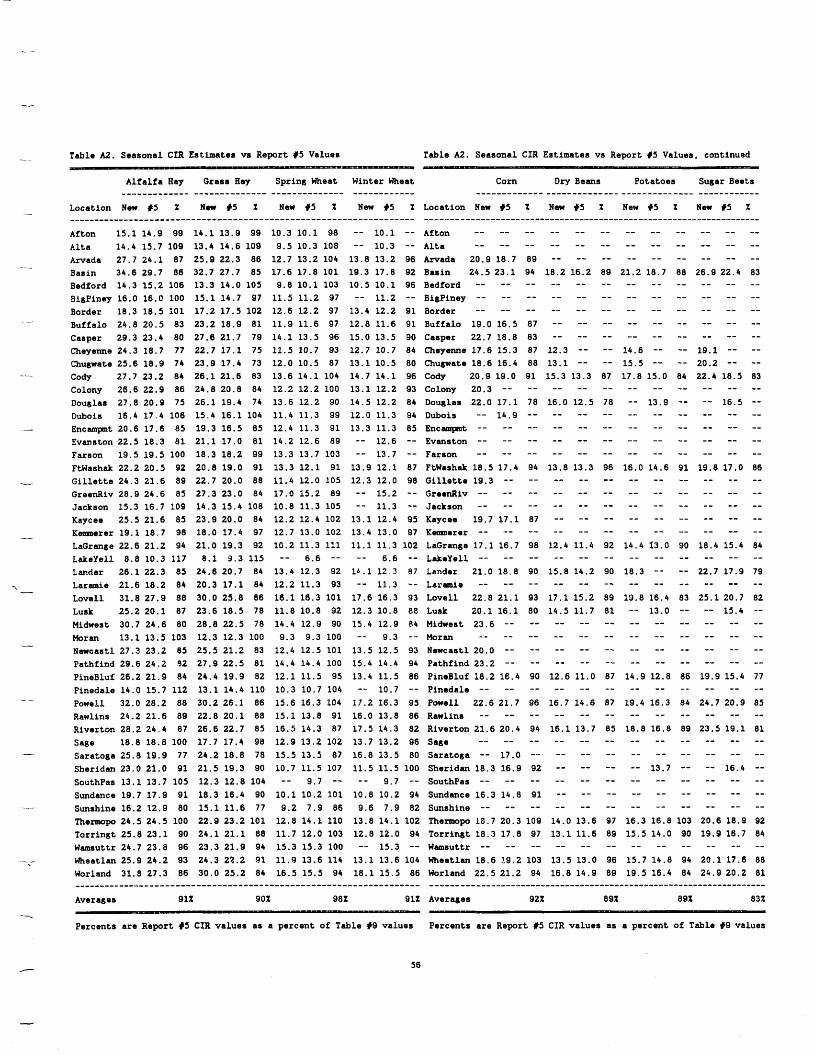
...-
Table A2. Seasonal CIR Estimates vs Report #5 Values Table A2. Seasonal CIR Estimates vs Report #5 Values, continued
Alfalfa Hay Grass Aay Spring Wheat Winter Wheat corn Dry Bean5 Potatoes Sugar Beets __________--- -------------- ------------I- ------------ ------------- ----.-------_--_____-_-__--__ ----I-----_-
Location N e w #S % New #5 X New 1 5 % New #5 X Location Nem 1 5 % N e w #5 X New #5 X New #5 %
Afton 15.1 14.9 99 14.1 13.9 99 10.3 10.1 98 -- Alta 14.4 15.7 109 13.4 14.6 109 9.5 10.3 108 -- Arvada 27.7 24.1 87 25.9 22.3 86 12.7 13.2 104 13.8 13.2 96 Arvada 20.9 18.7 89 -- -- -- -- -- -- -- -- -- Basin 34.6 29.7 86 32.7 27.7 85 17.6 17.8 101 19.3 17.8 92 Basin 24.5 23.1 94 18.2 16.2 89 21.2 18.7 88 26.9 22.4 83 Bedford 14.3 15.2 106 13.3 14.0 105 9.8 10.1 103 10.5 10.1 96 Bedford -- -- -- -- -- -- -- - - -- -- -- -- Bigpiney 16.0 16.0 100 15,l 14.7 97 11.5 11.2 97 -- Border 18.3 18.5 101 17.2 17.5 102 12.6 12.2 97 13.4 12.2 91 Border -- -- -- -- -- -- -- -- -- -- -- -- Buffalo 24.8 29.5 83 23.2 18.9 81 11.9 11.6 97 12.8 11.6 91 Buffalo 19.0 16.5 87 -- -- -- -- -- -- -- -- -- Casper 29.3 23.4 80 27.6 21.7 79 14.1 13.5 96 15.0 13.5 90 Casper 22.7 18.8 83 -- -- -- -- -- -- -- -- --
-- 20.2 -- -- Chugwate 25.6 18.9 74 23.9 17.4 73 12.0 10.5 87 13.1 10.5 80 Chu8wate 18.6 16.4 88 13.1 -- -- 15.5 -- Cody 27.7 23.2 84 26.1 21.6 83 13.6 14.1 104 14.7 14.1 96 Cody 20.9 19.0 91 15.3 13.3 87 17.8 15.0 84 22.4 18.5 83 Colony 26.6 22.9 86 24.8 20.8 84 12.2 12.2 100 13.1 12.2 93 Colony 20.3 -- -- -- -- -- -- -- -- -- -- -- Douglas 27.8 20.9 75 26.1 19.4 74 13.6 12.2 90 14.5 12.2 84 Douglas 22.0 17.1 78 16.0 12.5 78 -- 13.9 -- -- 16.5 --
14.9 -- -- _- -- _ _ _ _ _ _ -- _ _ _ _ DubOi5 16.4 17.4 106 15.4 16.1 104 11.4 11.3 99 12.0 11.3 94 Dubois -- Encampnt 20.6 17.6 85 19.3 16.5 85 12.4 11.3 91 13.3 11.3 85 Encatnpnt -- -- -- -- -- -- -- -- -- -- -- -- Evanstan 22.5 18.3 81 21.1 17.0 81 14.2 12.6 89 --
13.7 -- rarson -- -- -- -- _ _ -- -- _ _ -_ _- -- a- Farson 19.5 19.5 100 18.3 18.2 99 13.3 13.7 103 -- FtWashak 22.2 20.5 92 20.8 19.0 91 13.3 12.1 91 13.9 12.1 87 FtWashak 18.5 17.4 94 13.8 13.3 96 16.0 14.6 91 19.8 17.0 86
................................................................... ----p-----------------------------------------------_---------------
10.1 -- Afton -- -- -- -- -- -- -- -- -- -- -- -- 10.3 -- Alta -- -- -- -- _ _ -- -- -- -- _ _ -- _ _
11.2 -- Bigpiney -- -- -- -- -- -- _- -- -- -- I- _ _
Cheyenne 24.3 18.7 77 22.7 17.1 75 11.5 10.7 93 12.7 10.7 84 Cheyenne 17.6 15.3 87 12.3 -- -- 14.6 -- -- 19.1 -- --
12.6 -- Evanston -- -- -- -- -- -- -- -- -- -- -- --
Gillette 24.3 21.6 89 22.7 20.0 88 11.4 12.0 105 12.3 12.0 98 Gillette 19.3 -- -- -- -- -- -- -- -- -- -- -- 15.2 -- Greediv _ _ _- _- -- _ _ _ _ _- _ _ -_ _ _ _ _ _ _ GrsenRiv 28.9 24.6 85 27.3 23.0 84 17.0 15.2 89 --
Jackson 15.3 16.7 109 14.3 15.4 108 10.8 11.3 105 -- Kaycee 25.5 21.6 85 23.9 20.0 84 12.2 12.4 102 13.1 12.4 95 Kaycee 19.7 17.1 87 -- -- -- -- -- -- -- -- -- KemPerer 19.1 18.7 98 18.0 17.4 97 12.7 13.0 102 13.4 13.0 97 Keranerer -- -- -- -- -- -- -- -- -- -- -- -- LaGrange 22.6 21.2 94 21.0 19.3 92 10.2 11.3 1:1 11.1 11.3 102 LaGrange 17.116.7 98 12.4 11.4 92 14.4 13.0 90 18.4 15.4 84 Lakeyell 8.8 10.3 117 8.1 3.3 115 -- 6.6 -- -- Lander 26.1 22.3 85 24.6 20.7 84 13.4 12.3 92 lb.1 12 3 87 Lander 21.0 18.8 90 15.8 14.2 90 18.3 -- -- 22.7 17.9 79
11.3 - - Laramie -- ..- -- -- -- -- -- -- -- -- -- -- Laramie 21.6 18.2 84 20.3 17.1 84 12.2 11.3 93 -- Lovell 31.8 27.9 88 30.0 25.8 86 16.1 16.3 101 17.6 16.3 93 Lovell 22.8 21.1 93 17.1 15.2 89 18.8 16.4 83 25.1 20.7 82 Lusk 25.2 20.1 87 23.6 18.5 78 11.8 10.8 92 12.3 10.8 88 Lusk 20.1 16.1 80 14.5 11.7 81 -- 13.0 -- -- 15.4 -- Midwest 30.7 24.6 80 28.8 22.5 78 14.4 12.9 90 15.4 12.9 84 Midwest 23.6 -- -- -- -- -- -- -- -- -- -- --
9.3 -- Mran ..- -- -- -- -- -- -- -- -- -- -- -- Moran 13.1 13.5 103 12.3 12.3 100 9.3 9.3 100 -- Newcastl 27.3 23.2 85 25.5 21.2 83 12.4 12.5 101 13.5 12.5 93 Newcastl 20.0 -- -- -- -- -- -- -- -- -- -- -- Pathfind 29.6 24.2 82 27.9 22.5 81 14.4 14.4 100 15.4 14.4 94 Pathfind 23.2 -- -- -- -- -- -- -- -- -- -- -- PineBluf 26.2 21.9 84 24.4 19.9 82 12.1 11.5 95 13.4 11.5 86 PineBluf 18.2 18.4 90 12.6 11.0 87 14.9 12.8 86 19.9 15.4 77 Pinedale 14.0 15.7 112 13.1 14.4 110 10.3 10.7 104 -- P o w e l l 32.0 28.2 88 30.2 26.1 86 15.6 16.3 104 17.2 16.3 95 Powel l 22.6 21.7 96 16.7 14.6 87 19.4 16.3 8b 24.7 20.9 85 Rawlins 24.2 21.6 89 22.8 20.1 88 15.1 13.8 91 16.0 13.8 86 Rawlins -- -- -- -- -- -- -- -- -- -- -- -- Riverton 28.2 24.4 87 26.6 22.7 85 16.5 14.3 87 17.5 14.3 82 Riverton 21.6 20.4 94 16.1 13.7 85 18.8 16.8 89 23.5 19.1 81 Sage 18.8 18.8 100 17.7 17.4 98 12.9 13.2 102 13.7 13.2 96 Sage -- -- -- -- -- -- -- -- -- -- -- -- Saratoga 25.8 19.9 77 24.2 18.8 78 15.5 13.5 87 16.8 13.5 80 Saratoga -- 17.0 -- -- -- -- -- -- -- -- -- -- Sheridan 23.0 21.0 91 21.5 19.3 90 i0.7 11.5 107 11.5 11.5 100 Sheridan 18.3 16.9 92 -- -- -- -- 13.7 -- -- 16.4 -- SouthPas 13.1 13.7 105 12.3 12.8 104 -- 9.7 -- -- Sundance 19.7 17.9 91 18.3 16.4 90 10.1 10.2 101 10.8 10.2 94 Sundance 16.3 14.8 91 -- -- -- -- -- -- -- -- -- Sunshine 16.2 12.9 80 15.1 11.6 77 9.2 7.9 86 9.6 7.9 82 Sunshine -- -- -- -- -- -- -- -- -- -- -- -- Thormopo 24.5 24.5 100 22.9 23.2 101 12.8 14.1 110 13.8 14.1 102 Thermopo 18.7 20.3 109 14.0 13.6 97 16.3 16.8 103 20.6 18.9 92 Torringt 25.8 23.1 90 24.1 21.1 88 11.7 12.0 103 12.8 12.0 94 Torringt 18.3 17.8 97 13.1 11.6 89 15.5 14.0 90 19.9 16.7 84
15.3 -- Wamsuttr -- -- _ _ _ _ -- -_ _ _ -- _ _ -- _ _ Wamsuttr 24.7 23.8 96 23.3 21.9 94 15.3 15.3 100 -- Wheatlan 25.9 24.2 93 24.3 22.2 91 11.9 13.6 114 13.1 13.6 104 Wheatlan 18.6 7.9.2 103 13.5 13.0 96 15.7 14.8 94 20.1 17.6 88 Worland 31.8 27.3 86 30.0 25.2 84 16.5 15.5 94 18.1 15.5 86 Worland 22.5 21.2 94 16.8 14.9 89 19.5 16.4 84 24.9 20.2 81
11.3 -- Jackson -- -- -- -- - - -- -- -- -- -- -- --
6.6 -- L&eYell -- -- -- -- -- -- _ _ -- -- -- -- _-
10.7 -- Pingdale -- -- -- -- -- -- -- -- _- -- -- --
9.7 -- Southpas -- -- -- -- -- -- -- -- -- -- -- --
................................................................... .................................................................... Averages 9 1% 90% 98% 91% Averages 92% 89% 89% 83%
Percents are Report #5 C I R values a1 a percent of Table #9 values Percents are Report #5 CIR values as a percent of Table #9 values
56
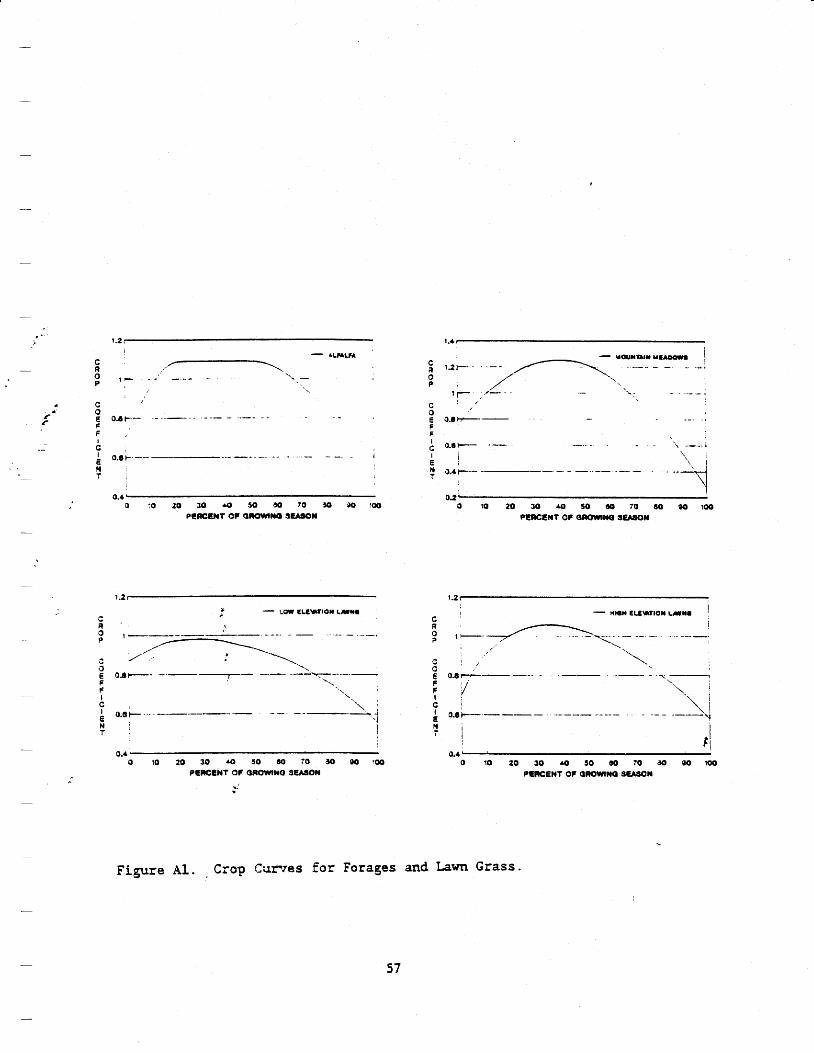
I Q.4 '
0 10 20 30 rg 5 0 80 10 do 90 -00 PERCENT OC dROWtNO SeAson
v. 'I
C
0
\I I I 0 lo 20 30 40 5 0 00 70 ?lo 90 loo
PEllCENT O f SSMOW
0.2
. Figure Al. Crop Cumes f o r Forages and Lawn Grass.
57
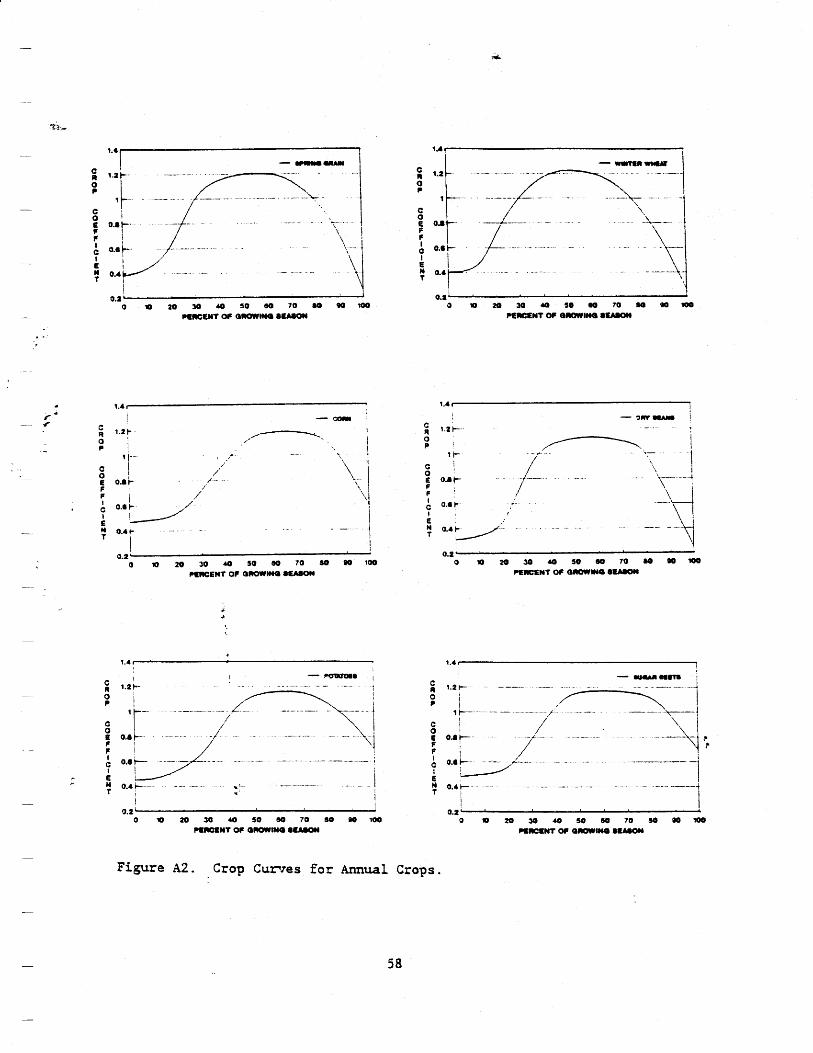
i
1.4 r 1.4 1 1 C
0
C
9 ......... - -
.- . . . . -.
I I
0.2 ' I 0 Q 20 30 40 SO 60 7 0 BO
?aRCEMT Of O m m O 8-
1.4 I ! I
i 4 - . /
1.4 I
c 0
C 4 0
C
e c I
' C
e t
C 0
C
0
f I C
E t
1.2 I- t
1l- i
I I . .- . +
/
/' I
\ 1 / i
F . P . / u '?
......... ........... "--.. ... .... - ..............
Figure h2. Crop Curres for Annual Crons. L
58
BIBLIOGBAPEIY
-
Allen, R . G . and Brockway, C.E. 1983. Estimating consumptive irrigation requirements for crops in Idaho. Res. Tech. Completion Rep., Idaho Water and Energy Resour. Res.Inst., Univ. of Idaho, Moscow, ID, 183 p .
- Allen, R.G., Jensen, M . E . , Wright, J.L., and 3uman, R.D., 1989. Operational estimates of evapotranspiration. Agron. J., 81:650-662.
Barnes, J., Borrelli, J., and Pocnop, L., 1979. Optimum lawn watering rates - for esthetics and conservation. 3 . h e r . Water Works Assoc., 71:4:204-209.
Becker, C.F., Pochop, L.O., and Alyea, J., 1977. Probabilities of Freeze in Wyoming. Bulletin 381R., Ag. Zxp. Station, Univ. of Wyoming, Laramie, WY.
Blaney, H.F. and Criddle. W.D., 1950. Determining water requirements in - irrigated areas from climatological and irrigation data. USDA S o i l Conserv
F S e n . SCS-TP 96. (processed). 4L p . Dastane, N., 1974. Effecti-qe rainfall in irrigated agriculture. Irrig. and
Doorenbos, J. and Pruitt, W.O.. 1977. Guidelines €or predicting crop water
Doorenbos, J . and Kassam, A.H. , 1979. Yield response to vater. Irrtg. and
Drain. Paper No. 25, FAO, Unized Nations.
requirements. Irris. and Drain. Paper No. 2 4 , FAO, United ;Nations. 144 p . t
- Drain. ?aper No. 3 3 , FAO, Unized Nations. 193 p .
northwest region. geport PNL-3195, WERA-l,VC-60, Facific Northwest Laboratories, Ricnland, WA, 176 p .
Jensen, X.E . , Burman, X.3., and Allen, R.C., 1990. Evapotranspiration and . irrigation vater requirements. ASCE Manuals and Reports on Engineering
Practice No. 70. 3 3 2 ? . Martner, B.E., 1986. gyoming ClLfnate Atlas. Wyoming Vater Research Center,
Univ. of Wyoming, Laramie. 'L'niversity o f Nebraska Press, Lincoln and London.
Monteith, J.L., 1965. Evaporatron and the environment. In: The srate and movement of wat%r in living 3rganisms. X I X Symp. S O C . Exp. Biol., Cambridge Univ. 'Press, pp. 2 0 5 - 2 3 6 .
Penman, H.L. , 1948.' Naturai wa9oration from open wate r , bare soil, and grass. Proc. Roy. S O C , London, A193:120-146.
Pochop, L., and Borrelli, J . , 1979. Water requirements €or urban lawns. Water Resources Series 'No. 7 5 . Uni-r. of Wyoming, Laramie, 'LY.
Pochop. L. and Burman, Z . , 1987. Development of evapotranspiration crop coefficients, climatological data, and evapotranspiration models for the upper green river basin. P r o j e c t completion report, Project 59-6986-13,
S o i l Conservation Service (SCS), 1967. Irrigation watzr requirements. Tech. -- Release 21, SCS, USDA, 88 p . Teegarden, T . P . , 1992. Quantification of evapotranspiration and irrigation
Elliott, 9 . L . and Sarchet, W.X., 1980. Wind energy resource atlas, the
Wyoming Vater Research Center, Laramie, WY. i
water requirements f o r Wyoming. Univ. of Wyoming, X.S. Thesis, Dept. Civil and Arch. Engr., University of Wyoming, Laramie, WY, 2 3 4 p .
Consumptive use of irrigation water in Wyoming. Report. No.5, yater &sources Series 19, Water Resources Research Institute, University of Vyoming, Laramie, WY.
Trelease, F.J., Swartz, T . J . , Rechard, P . A . , and Burman, R . D . , 1970. Wyoming Water Planning
Wyoming Dept. of Agric. 1986-1989. Wyoming agricultural statistics. 9 1 p .
59