Embed Size (px)
Citation preview

A Comparative Study of SVM and LSTM Deep Learning
Algorithms for Stock Market Prediction
Sai Krishna Lakshminarayanan, John McCrae
National University of Ireland Galway {s.lakshminarayanan1,john.mccrae}@nuigalway.ie
Abstract. The paper presents a comparative study of the performance of Long Short-Term Memory (LSTM) neural network models with Support Vector Ma- chine (SVM) regression models. The framework built as a part of this study comprises of eight models. In this, 4 models are built using LSTM and 4 mod-els using SVM respectively. Two major datasets are used for this paper. One is the base standard Dow Jones Index (DJI) stock price dataset and another is the combination of this stock price dataset along with external added input parame-ters of crude oil and gold prices. This comparative study shows the best model in combination with our input dataset. The performance of the models is meas-ured in terms of their Root Mean Squared Error (RMSE), Mean Squared Error (MSE), Mean Absolute Error, Mean Absolute Percentage Error (MAPE) and R squared (R2) score values. The methodologies and the results of the models are discussed and possible enhancements to this work are also provided.
Keywords: Long short-term memory, support vector machine, moving average, gold price, crude oil price, dow jones index, machine learning, deep learning.
1 Introduction
Stock market prediction is one of the most painstaking tasks due to its volatility. The challenge of stock market prediction is so lucrative that even a small increase in pre- diction by the new model can bring about huge profits. Stock prices are an essential part of the prediction. The stock price is the price of the solitary stock from the entire stocks sold by a corporation. When these stocks are bought, the person can own the corresponding portion of the public company. These stocks are sold by the founders of the corporations at a regular interval to generate new funds. The stock prices are determined based on the supply and demand for the stocks of the corporation. The stock prices increase with a surge in demand to buy the stocks and decrease with a surge in demand to sell the stocks. This demand can be linked to several external factors that determine the nature of the stock market. The external factors include the socio-economic conditions, government policies and political conditions. Therefore, when the stock prediction is done by analysing the external factors, it can lead to a lot of noise and volatility. This made it difficult to apply stock market prediction using simple time series or regression methods. To overcome this hurdle, researchers have taken machine learning techniques and studied their feasibility in stock market predic-
Copyright © 2019 for this paper by its authors. Use permitted under Creative Commons License Attribution 4.0 International (CC BY 4.0).

tion. This has become more popular now with the increased interest in the fields of big data and artificial intelligence coupled with boosted computational capabilities for supporting automated methods for forecasting the stock prices (Lin,2019). Deep learning, which is considered as a sub-discipline of machine learning is becoming more prevalent now in research communities to provide solutions for forecasting problems. A lot of sophisticated research is being carried out in this problem for pre-dicting the stock prices correctly with the least error possible.
The main intention of this paper is to find various conditions that are used in stock
market prediction and to combine them and see whether they hold like when they used separately. Three main research problem objectives are pondered upon in this thesis. They are as follows,
1. Comparison of stock market prediction by using the base dataset of stock price and then a combination of the stock price with additional external parameters of crude oil and gold prices. The goal is to find whether the addition of this external parameters helps to improve the effectiveness of the stock market prediction.
2. Comparison of stock market prediction by using machine learning algorithms such as Support Vector Machine (SVM) and deep learning algorithms such as Long Short-Term Memory (LSTM). The goal is to find whether the conventional way of performing the regression task with SVM holds good for stock market prediction or whether the newer concepts like LSTM deliver better prediction outcomes.
3. Comparison of stock market prediction by using Moving Average (MA) with the SVM and LSTM algorithms on the basic stock price and advanced dataset of stock price along with crude oil and gold prices. The goal is to find out whether the addi-tion of MA to the present models using SVM and LSTM improves the effect when applied on the base and advanced dataset respectively.
2 Related Study
This section presents a brief discussion on the existing studies on time series models, machine learning models, deep learning models and a comparative study that has been conducted for stock market prediction and forecasting. Paper Overview Xiaotao,Keung (2016)
Data- S&P500 Model- SVM Comments-SVM outperforms common statistical methods and enhances tracking performance of VWAP strategy.

Hiransha,Gopal Krishnan (2018)
Data- NSE Model- MLP, RNN, CNN, LSTM Comments-CNN outperformed all others. Didn’t consider hybrid networks and used a simple model. Able to predict NYSE using NSE.
Kale,Khanvilkar (2019)
Data-NSE Model-ANN, SMA Comments-Correlation technique used. Additional Input parame-ters like gold, forex rates used.
Abe,Nakayama (2018)
Data-Japanese Stock Market Model-Deep Neural Network, Shallow Neural Network
Liew,Kyung-Soo (2017)
Data-NASDAQ Model-SVM, Deep Neural Networks
Madge (2018) Data-NASDAQ Model-SVM
Henrique et al. (2018)
Data-Brazilian, Chinese Stock Market Model-SVM
Patel et al. (2014)
Data-BSE Model-SVM, ANN, Naïve Bayes, Random Forest Comments-Performance is improved for all prediction models when technical parameters are represented as deterministic data.
Gerlein et al. (2016)
Data-FOREX Model-SVM, Neural Networks Comments-Combination of external attributes along with input technical indicators as inputs have improved the classification accuracy to increase profitability.
Xiao et al. (2013)
Data-Chinese Stock Market Model-Ensemble model of Elman Network, GRNN, WNN
Nayak et al. (2015)
Data-BSE, NSE Model-Hybrid model of SVM and KNN
Reddy(2018) Data-BSE Model-SVM
Qian et al. (2019)
Data-Chinese Stock Market Model-ARIMA, LSTM Comments- LSTM is insensitive to stability responses and per-forms better than ARIMA giving higher prediction accuracy.

Wang et al. (2018)
Data-Chinese Stock Market Model-LSTM Comments-LSTM provides higher accuracy than backpropagation neural networks through effective optimization of dropout rates.
Table 1. Literature study overview table
As shown in Table 1, much of the related research has used SVM for stock predic-tion. Only a few papers have considered using external input parameters to check whether it improves the prediction model. It is also seen that only a handful of re-search study compared the performance of SVM and LSTM models for stock predic-tion. Moving averages is used only in few papers to smooth the data before feeding into the model. Therefore, the research work is designed by addressing these gaps in the previous studies. The major focus of this research is to compare the performance of LSTM model and SVM model. The SVM models are built based on following the design decisions taken in papers like Xiaotao, Keung(2016), Madge (2018) and Hen-rique et al. (2018). The LSTM models are built based on following the design deci-sions taken in papers like Abe, Nakayama(2018) and Wang et al. (2018). The original data for stock prediction is considered as DJI in S & P 500 based on the paper Xiaotao, Keung(2016) and external input parameters like crude oil prices and gold prices are added to this data based on the papers Kale, Khanvilkar(2019) and Gerlein et al. (2016). The moving averages are applied to these datasets based on the paper Kale, Khanvilkar(2019). The performance of SVM models and LSTM models is evaluated on the original data and the original data with external input parameters and moving averages based on the metrics used in the papers like Henrique et al.(2018),Patel et al.(2014),Gerlein et al.(2016) and Xiao et al. (2013). The perfor-mances are then compared to understand whether the additional external input param-eters and moving averages provide enhancement to the performance of the base SVM and LSTM models on the original data and improves it overall.
3 Data Used
The main dataset for this paper is the stock price data. For this, the Dow Jones Indus- trial Average (DJIA) is considered. The Dow Jones index is a price-weighted index of 30 components traded on the New York Stock Exchange (NYSE). This is considered because it covers a wide range of companies from a variety of sectors. The Dow Jones is considered due to its relatively lower number of components when compared to the S & P 500 which has more than 500 components. When these many components are analysed, it takes a huge toll on the computational requirements. The mixture of availability of enormous data and lesser computational needs made Dow Jones an ideal pick.
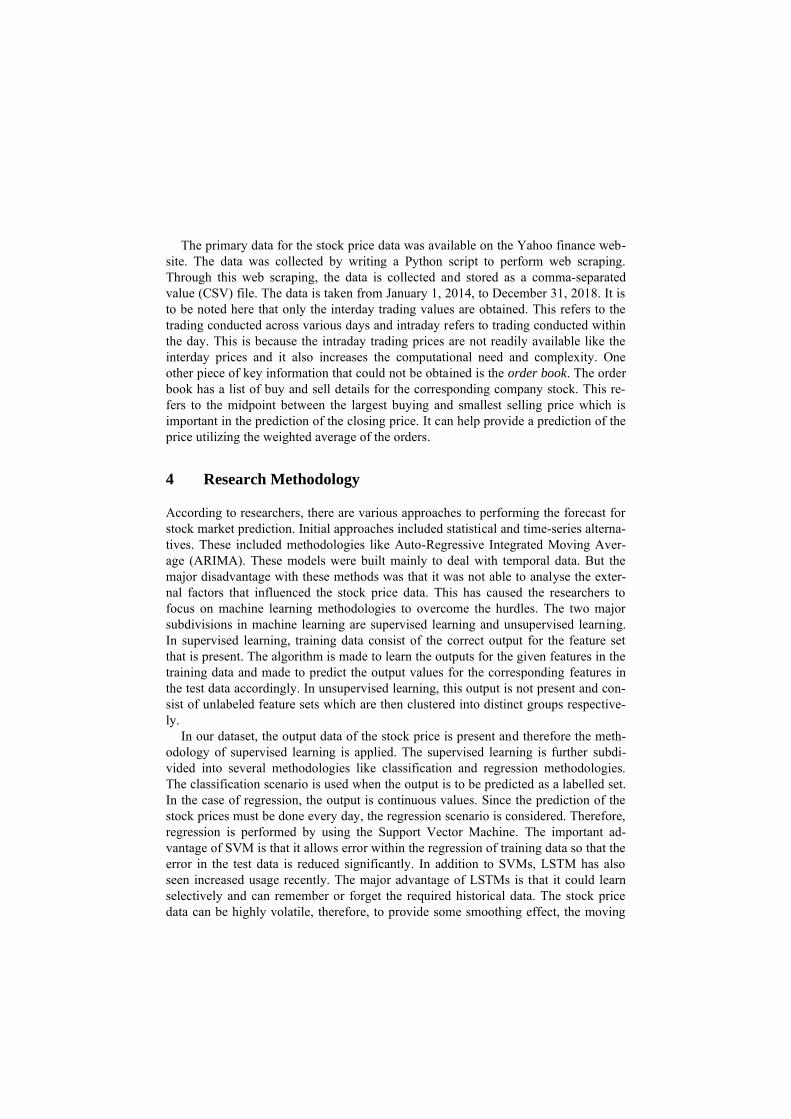
The primary data for the stock price data was available on the Yahoo finance web-
site. The data was collected by writing a Python script to perform web scraping. Through this web scraping, the data is collected and stored as a comma-separated value (CSV) file. The data is taken from January 1, 2014, to December 31, 2018. It is to be noted here that only the interday trading values are obtained. This refers to the trading conducted across various days and intraday refers to trading conducted within the day. This is because the intraday trading prices are not readily available like the interday prices and it also increases the computational need and complexity. One other piece of key information that could not be obtained is the order book. The order book has a list of buy and sell details for the corresponding company stock. This re-fers to the midpoint between the largest buying and smallest selling price which is important in the prediction of the closing price. It can help provide a prediction of the price utilizing the weighted average of the orders.
4 Research Methodology
According to researchers, there are various approaches to performing the forecast for stock market prediction. Initial approaches included statistical and time-series alterna-tives. These included methodologies like Auto-Regressive Integrated Moving Aver-age (ARIMA). These models were built mainly to deal with temporal data. But the major disadvantage with these methods was that it was not able to analyse the exter-nal factors that influenced the stock price data. This has caused the researchers to focus on machine learning methodologies to overcome the hurdles. The two major subdivisions in machine learning are supervised learning and unsupervised learning. In supervised learning, training data consist of the correct output for the feature set that is present. The algorithm is made to learn the outputs for the given features in the training data and made to predict the output values for the corresponding features in the test data accordingly. In unsupervised learning, this output is not present and con-sist of unlabeled feature sets which are then clustered into distinct groups respective-ly.
In our dataset, the output data of the stock price is present and therefore the meth-odology of supervised learning is applied. The supervised learning is further subdi-vided into several methodologies like classification and regression methodologies. The classification scenario is used when the output is to be predicted as a labelled set. In the case of regression, the output is continuous values. Since the prediction of the stock prices must be done every day, the regression scenario is considered. Therefore, regression is performed by using the Support Vector Machine. The important ad- vantage of SVM is that it allows error within the regression of training data so that the error in the test data is reduced significantly. In addition to SVMs, LSTM has also seen increased usage recently. The major advantage of LSTMs is that it could learn selectively and can remember or forget the required historical data. The stock price data can be highly volatile, therefore, to provide some smoothing effect, the moving

average algorithm can be considered along with the SVM and LSTM algorithms. The algorithm learns the outputs for the given features in the training data and predicts the outputs for the corresponding features in the test data.
5 Project Architecture
The cross-industry standard process for data mining (CRISP-DM) is the data mining process model that describes the stages or approaches involved in solving any data analytics problem. It involves a list of processes required to be performed in a step-wise manner for approaching any data mining project. Project flow based on the CRISP-DM cycle is depicted in Figure 1. Based on this flow-through, the project architecture is built.
Fig. 1. This architecture gives the workflow of the research study in terms of the CRISP-
DM process. The raw datasets of DJI stock price, crude oil price and gold price are obtained by
web scraping. As depicted in Figure 2, it is seen that raw data is preprocessed and maintained as DJI stock price data separately and combined data of DJI stock price,
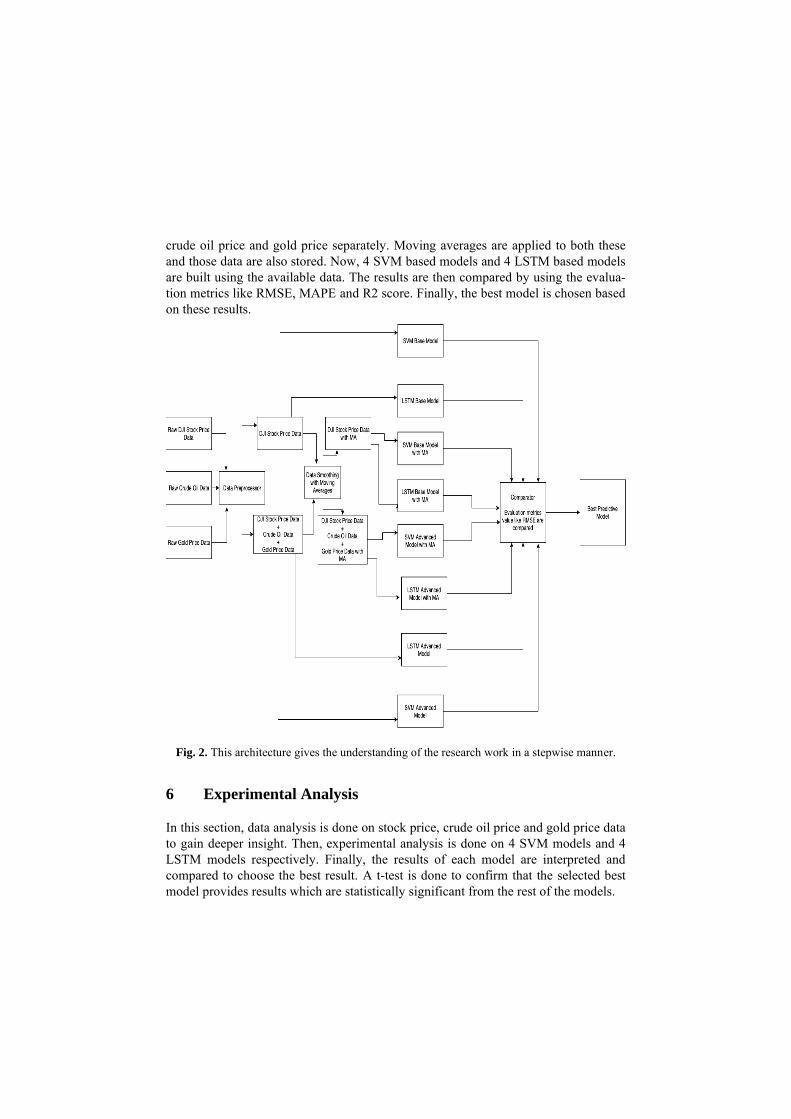
crude oil price and gold price separately. Moving averages are applied to both these and those data are also stored. Now, 4 SVM based models and 4 LSTM based models are built using the available data. The results are then compared by using the evalua-tion metrics like RMSE, MAPE and R2 score. Finally, the best model is chosen based on these results.
Fig. 2. This architecture gives the understanding of the research work in a stepwise manner.
6 Experimental Analysis
In this section, data analysis is done on stock price, crude oil price and gold price data to gain deeper insight. Then, experimental analysis is done on 4 SVM models and 4 LSTM models respectively. Finally, the results of each model are interpreted and compared to choose the best result. A t-test is done to confirm that the selected best model provides results which are statistically significant from the rest of the models.

• Model 1- SVM Base Model
In this model, the input data is considered as the DJI stock price data. The input data is then split into training data and test data. This is done as 75% and 25% respective-ly. Scalar transformation is then done for training data and required input parameters are given to the SVM base model and trained. The model is then fitted based on these values and stored for future use. The fitted model is then used to predict the test data and finally, the predicted test data is then compared with the actual test data. The evaluation measures like MSE, RMSE, MAE, MAPE and R2 scores are obtained based on this. Finally, a visual output is given to display the predicted data vs ex-pected data to understand the performance of the model.
• Model 2- SVM Base Model with moving averages
In this model, change is performed in the DJI stock price data by applying moving averages to the input parameters present. Rest of the steps are like the first SVM model and evaluation measures are carried out on the results.
• Model 3- SVM Advanced Model
In SVM advanced model, the input data is taken as the combination of DJI stock price, crude oil price and gold price data. The combined data is split like 75% training and 25% test data. The SVM model is fitted based on the training data with the neces-sary input parameters.
• Model 4- SVM Advanced Model with moving averages
In this model, moving averages are applied to the input parameters present in they combined data used in SVM advanced model. Rest of the steps are like the previous model and results are produced based on it.
• Model 5- LSTM Base Model
The input data is considered as the DJI stock price data. The input data is then split into training data 75% and test data 25%. The data is then normalised by using a min-max scaler to fit the scaling of the model. Keras model tensors are created and the input and output dataset are tuned accordingly. The activation function is used to normalise the input layers. It helps in enhancing the process of learning. Batch nor-malization is done by LSTM to reduce the amount of shifting around of hidden unit values. This is called a covariance shift (Ioffe et al. ,2015). Keras model can perform this normalisation as part of model building using its in-built function (Keras Docu-mentation, 2015). Sequential model in Keras is built with all the required parameters and compiled for further analysis.

The compiled model is fitted on the input data for the defined number of epochs
and the predictions on the test data are made. The predicted output is evaluated in terms of MSE, RMSE, MAE, MAPE and R2 values. A graphical plot of the predicted outcome vs the expected outcome gives us a visual understanding of the model’s per-formance.
• Model 6- LSTM Base Model with moving averages
In this model, moving averages are applied to the data used in LSTM base model. Rest of the steps are identical to the base model and results are obtained based on it.
• Model 7- LSTM Advanced Model
In the LSTM advanced model, input data is combined data of DJI stock price, crude oil price and gold price. Data is normalised using min-max scaler similar to the base model approach and then split to 75 % training data and 25 % testing data. LSTM model is then fitted with training data and used to predict test data based on it. Eval-uation measures are performed on predicted output and results are stored. The graph-ical plot is used to show the difference between the predicted data and actual test data present.
• Model 8- LSTM Advanced Model with moving averages
In the final model, moving averages are applied to combined data and then similar steps are followed like in LSTM advanced model.
6.1 Model Comparison results
Model RMSE MSE MAE R2 MAPE
SVR Base 682.63 467214.38 597.96 0.30 2.47 SVR Base+ MV 651.27 424163.43 570.54 0.36 2.25
SVR Advanced 768.74 590974.85 700.34 0.15 2.77
SVR Advanced +MV 582.29 339067.29 486.09 0.51 1.91
LSTM Base 399.39 159519.52 356.04 0.76 1.41 LSTM Base + MV 349.54 122183.47 275.73 0.81 1.05
LSTM Advanced 683.68 467426.27 603.93 0.32 2.52

LSTM Advanced + MV 347.46 120731.41 262.42 0.83 1.03
Table 2. Evaluation Metrics Values for the 8 models
From the results in Table 2, it is seen that LSTM advanced model to be the one with the best result for the prediction of stock prices. Now, to confirm that this is a statistically significant change from the rest of the models, a t-test is conducted with the LSTM advanced model with moving averages and other 7 models. The null hy-pothesis or H0 considers that there is no statistically significant change between the two models and alternate hypothesis or H1 considers that there is a statistically signif-icant change between the two models. When the p-value is less than 0.05, the null hypothesis is rejected.
Models P-value
SVR Base - LSTM Advanced + MV 9.38e-25 SVR Base + MV - LSTM Advanced + MV 1.25e-20 SVR Advanced - LSTM Advanced + MV 2.17e-29 SVR Advanced + MV - LSTM Advanced + MV 1.97e-13 LSTM Base - LSTM Advanced + MV 3.53e-58 LSTM Base + MV - LSTM Advanced + MV 1.57e-4 LSTM Advanced - LSTM Advanced + MV 4.82e-97
Table 3. Table 4. t-test table
From Table 3, it is seen that p-value is less than 0.05 for all the cases. Therefore,
the null hypothesis is rejected, and it is concluded that there is a statistically signifi-cant change in predicting the stock prices by using LSTM advanced model with mov-ing averages. Therefore, it is concluded that the LSTM advanced model with moving averages has the best result for predicting stock prices.
7 Conclusion and Future Work
The overall conclusions from this research work are as follows,
• Without moving averages, the SVM and LSTM models on base stock price dataset perform better individually without the addition of external parameters like crude oil and gold price. This is because of the noise present as a result of the merging of the data without adequate preprocessing and smoothing by moving averages.

• Overall, LSTM performs better than SVM in all the scenarios. This is because of its ability to remember or forget the data in an efficient manner than SVM.
• With moving averages, the SVM and LSTM models both perform significantly better on the combined dataset over the standard base dataset. This is because of the smoothing effect of the moving averages on the data which helps in learning the influence of the external parameters on the base stock price in a much better manner.
• Overall, the LSTM model with moving averages applied over the combined dataset was evaluated to be the most efficient model in predicting the stock prices for the future. It is also confirmed that there is a statistically significant change in predict-ing the stock prices by using LSTM advanced model with moving averages. There-fore, it is concluded that the LSTM advanced model with moving averages has the best result for predicting stock prices.
In this paper, the implementation of SVM and LSTM using moving averages are
done separately. For future works, intraday prices can also be used to compare the values and to understand the volatility of the stock, crude oil and gold prices in a bet-ter manner. The stock sell and buy data can also be used to understand how the stock price and external factors surge and dip have influenced the buying and selling pat-tern. This will help in developing a more accurate prediction. The models can also be extended to provide live interactive predictions based on the user given data and sub-sequently can be used for other forecasting problems like weather forecasting, disease forecasting and house price forecasting etc.
References
1. Ahmed, N. K. et al. (2010) ‘An Empirical Comparison of Machine Learning Models for Time Series Forecasting’, Econometric Reviews, 29(5–6) doi:10.1080/07474938.2010.481556.
2. Ashutosh Kale, Omkaar Khanvilkar (2018) ‘Forecasting Indian Stock Market Using Arti- ficial Neural Networks’. Published in 2018 Fourth International Conference on Computing Communication Control and Automation (ICCUBEA). DOI:10.1109/ICCUBEA.2018.8697724.
3. Barak et al. (2014) ‘Developing an approach to evaluate stocks by forecasting effective features with data mining methods’. In 2014 Expert Systems with Applications. https://doi.org/10.1016/j.eswa.2014.09.026.
4. Bruno Miranda Henrique, Vinicius Amorim Sobreiro, Herbert Kimura(2018), Stock price prediction using support vector regression on daily and up to the minute prices’. In the Journal of Finance and Data Science, Volume 4, Issue 3, September 2018, Pages 183-201. https://doi.org/10.1016/j.jfds.2018.04.003.

5. Gerlein et al. (2016) ‘Evaluating machine learning classification for financial trading: An empirical approach’. In 2016 Expert Systems with Applications. https://doi.org/10.1016/j.eswa.2016.01.018.
6. Hiransha Ma, Gopalakrishnan E.Ab, Vijay Krishna Menonab, Soman K.P(2018) ‘NSE Stock Market Prediction Using Deep-Learning Models’. In 2018 International Journal of Pure and Applied Mathematics, Volume 118 No. 20 2018, Page 217-223.
7. Ioffe et al. (2015) ‘Batch Normalization: Accelerating Deep Network Training by Reduc-ing Internal Covariate Shift’. Available at: https://arxiv.org/pdf/1502.03167v3.pdf.
8. Jigar Patel et al. (2014) ‘Predicting stock and stock price index movement using Trend De- terministic Data Preparation and machine learning techniques. In 2014 Expert Systems with Applications Page 259-268. https://doi.org/10.1016/j.eswa.2014.07.040.
9. Karen Lin (2019) Role of Data Science in Artificial Intelligence. Available at: https://towardsdatascience.com/role-of-data-science-in-artificial-intelligence-95 0efedd2579.
10. Keras Documentation (2015) Normalization Layers - Keras document Available at: https://keras.io/layers/normalization.
11. Liew, Jim Kyung-Soo and Mayster, Boris, ‘Forecasting ETFs with Machine Learning Al-gorithms’ (2017). Available at SSRN: https://ssrn.com/abstract=2899520 or http://dx.doi.org/10.2139/ssrn.2899520.
12. Masaya Abe, Hideki Nakayama (2018) ‘Deep Learning for Forecasting Stock Returns in the Cross-Section’. Published in PAKDD 2018. DOI:10.1007/978-3-319-93034-3_22.
13. Nayak et al. (2015) ‘A Na�ve SVM-KNN based stock market trend reversal analysis for Indian benchmark indices.’ In 2015Applied Soft Computing archive, Volume 35 Issue C, Pages 670-680. https://doi.org/10.1016/j.asoc.2015.06.040.
14. Qian et al. (2019) ‘Stock Prediction Based on LSTM under Different Stability’. In 2019 IEEE 4th International Conference on Cloud Computing and Big Data Analysis (ICCCBDA). doi: 10.1109/ICCCBDA.2019.8725709.
15. Reddy (2018) ‘Stock Market Prediction Using Machine Learning’. In 2018 International Research Journal of Engineering and Technology (IRJET), Volume: 05 Issue: 10. doi: 10.13140/RG.2.2.12300.77448.
16. Saahil Madge (2018), ‘Predicting Stock Price Direction using Support Vector Machines’. In 2015 Independent Work Spring. Available at: https://www.cs.princeton.edu/sites/default/files/uploads/saahil_madge.pdf.
17. Wang et al. (2018) ‘LSTM Model Optimization on Stock Price Forecasting’. In 2018 17th International Symposium on Distributed Computing and Applications for Business Engi-neering and Science (DCABES). doi: 10.1109/DCABES.2018.00052.
18. Xiao et al. (2013) ‘Ensemble ANNs-PSO-GA Approach for Day-ahead Stock E-exchange Prices Forecasting’. In 2013 International Journal of Computational Intelligence Systems Volume 6, Issue 1, Pages 96-114. doi: 10.1080/18756891.2013.756227
19. Xiatao Liu, X. & Lai, K.K. J Syst Sci Complex (2017) 30: 421. https://doi.org/10.1007/s11424-016-5020-9.
20. Yuxi Liu (2017) ‘Python Machine Learning By Example’. Available at: https://www.oreilly.com/library/view/python-machine-learning/9781783553112/.


![LSTM-in-LSTM for generating long descriptions of …LSTM-in-LSTM for generating long descriptions of images 381 VggNet [17]). Object detection systems based on a well trained DeepCNN](https://img.dokumen.tips/doc/110x75/5ed4612b9fae68113534086d/lstm-in-lstm-for-generating-long-descriptions-of-lstm-in-lstm-for-generating-long.jpg)