Embed Size (px)
Citation preview
A CITY PERSPECTIVE FOR
INCLUSIVE GROWTH
RSA Conference Dublin, 5 June 2017
Joaquim Oliveira Martins
Regional Development Policy Division
OECD Centre for Entrepreneurship
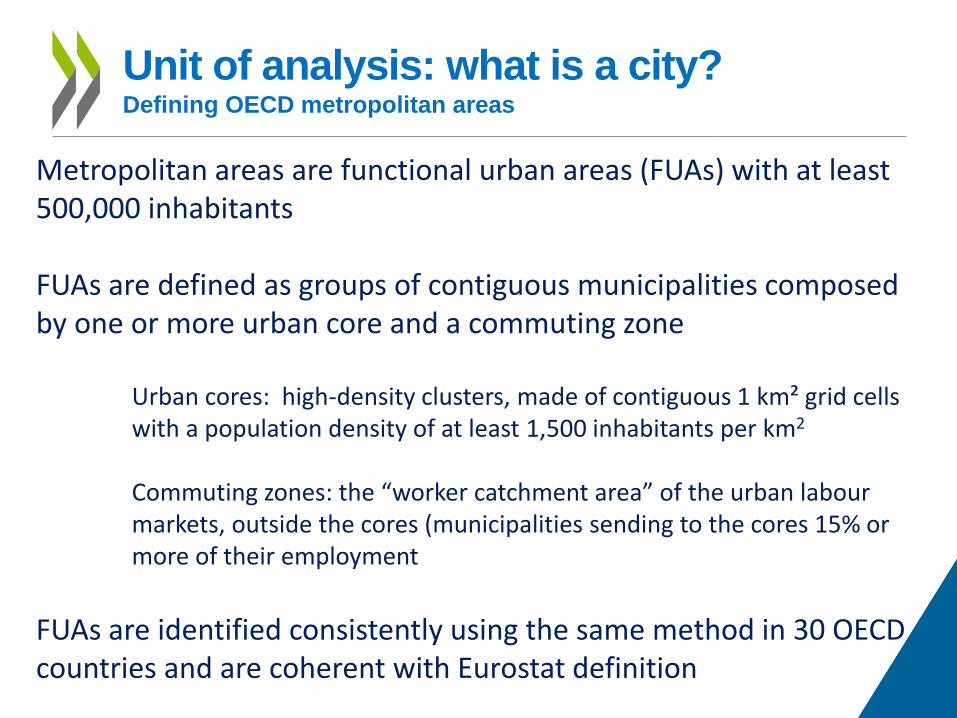
Unit of analysis: what is a city? Defining OECD metropolitan areas
Metropolitan areas are functional urban areas (FUAs) with at least 500,000 inhabitants FUAs are defined as groups of contiguous municipalities composed by one or more urban core and a commuting zone Urban cores: high-density clusters, made of contiguous 1 km² grid cells with a population density of at least 1,500 inhabitants per km2
Commuting zones: the “worker catchment area” of the urban labour markets, outside the cores (municipalities sending to the cores 15% or more of their employment
FUAs are identified consistently using the same method in 30 OECD countries and are coherent with Eurostat definition
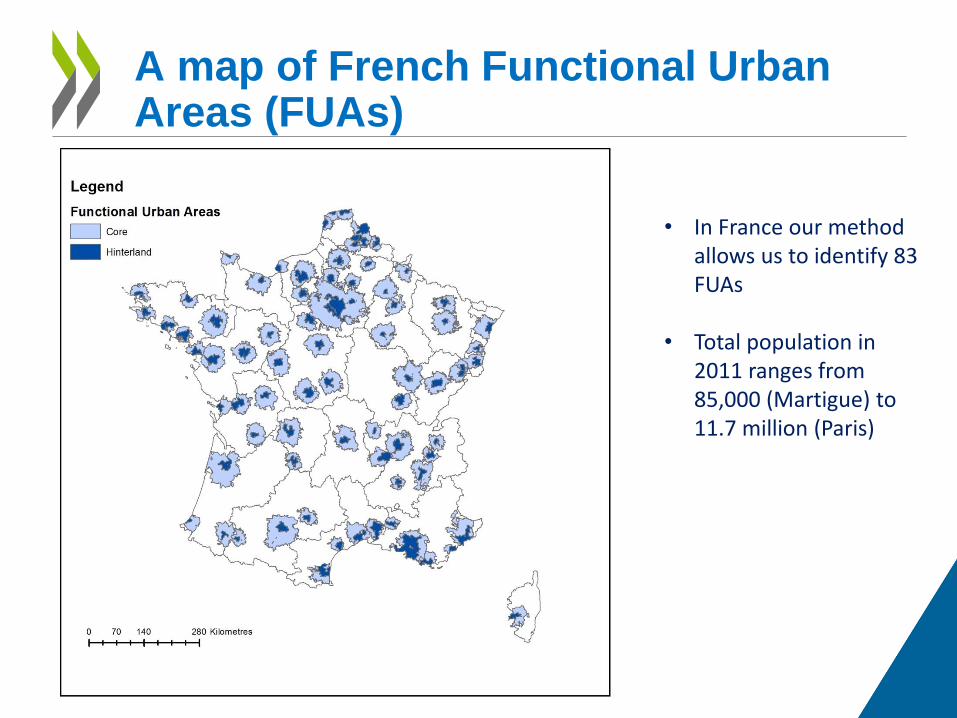
A map of French Functional Urban Areas (FUAs)
• In France our method allows us to identify 83 FUAs
• Total population in
2011 ranges from 85,000 (Martigue) to 11.7 million (Paris)

City growth &
productivity
5
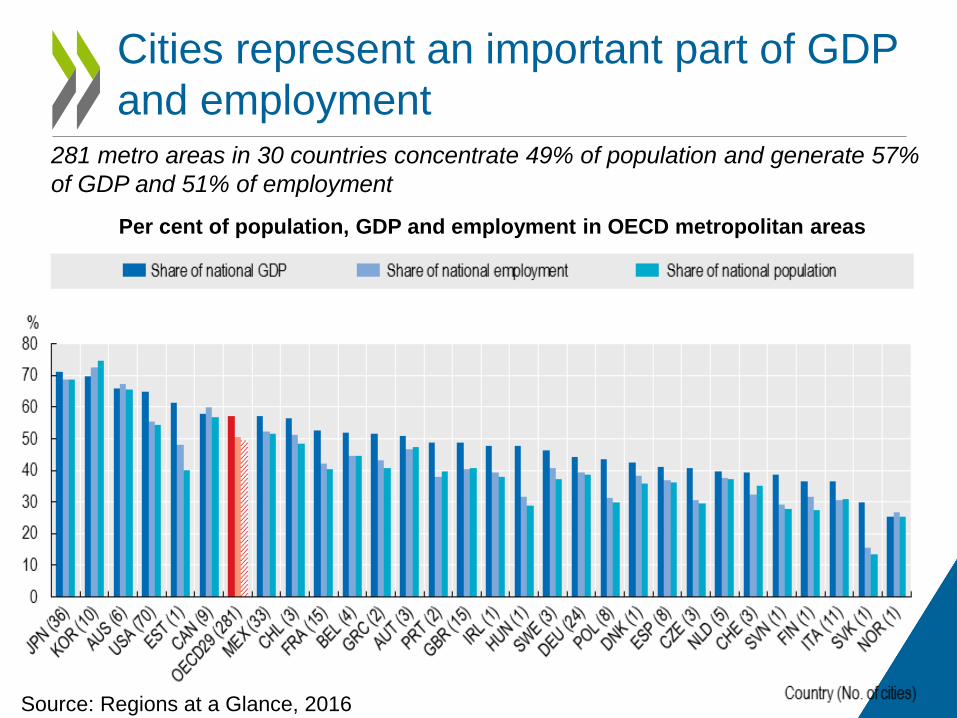
Cities represent an important part of GDP
and employment
Source: Regions at a Glance, 2016
281 metro areas in 30 countries concentrate 49% of population and generate 57%
of GDP and 51% of employment
Per cent of population, GDP and employment in OECD metropolitan areas
6
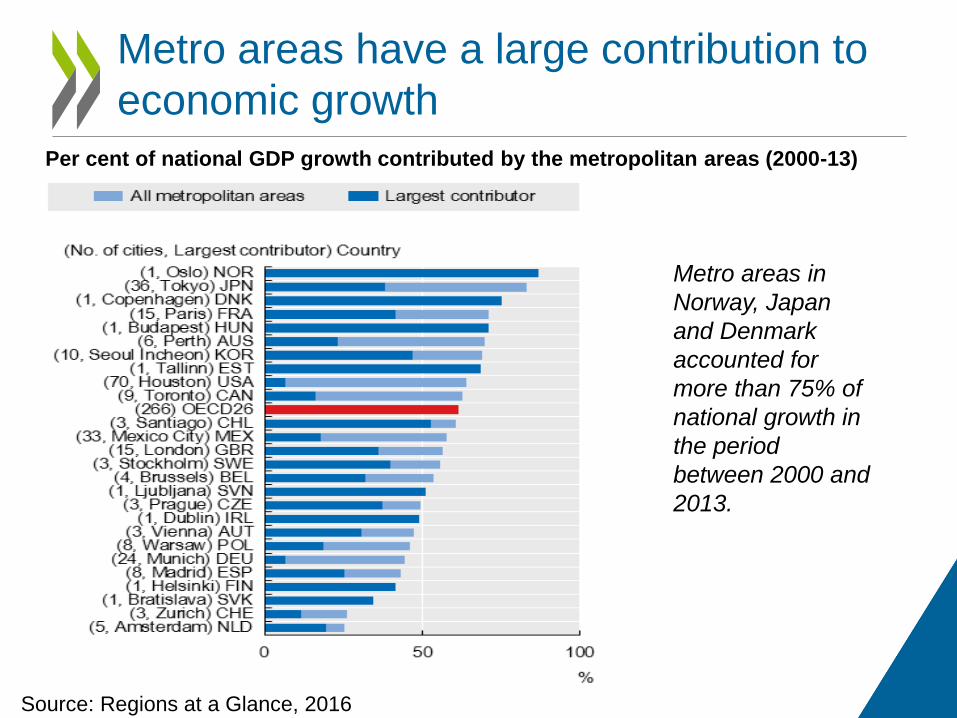
Metro areas have a large contribution to
economic growth
Source: Regions at a Glance, 2016
Metro areas in
Norway, Japan
and Denmark
accounted for
more than 75% of
national growth in
the period
between 2000 and
2013.
Per cent of national GDP growth contributed by the metropolitan areas (2000-13)
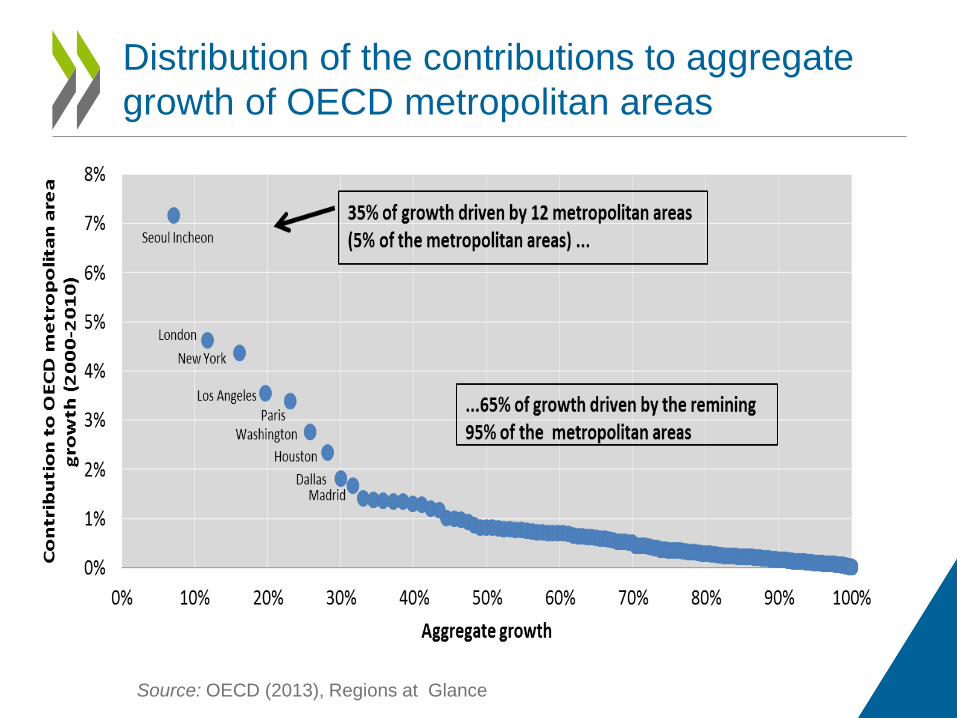
Distribution of the contributions to aggregate
growth of OECD metropolitan areas
Source: OECD (2013), Regions at Glance
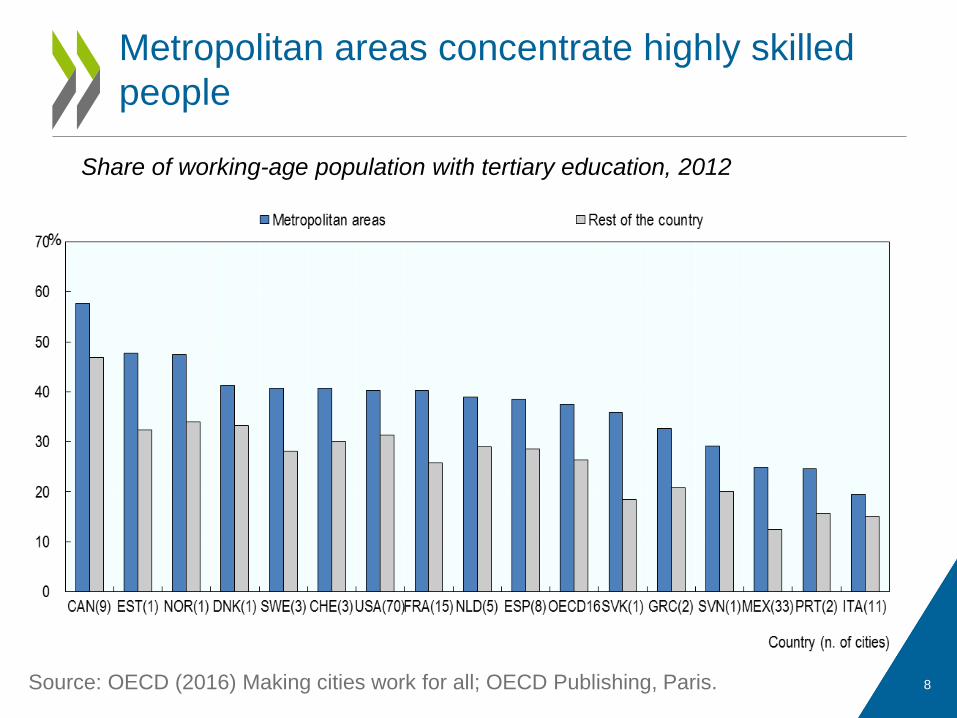
Metropolitan areas concentrate highly skilled
people
8
Share of working-age population with tertiary education, 2012
Source: OECD (2016) Making cities work for all; OECD Publishing, Paris.
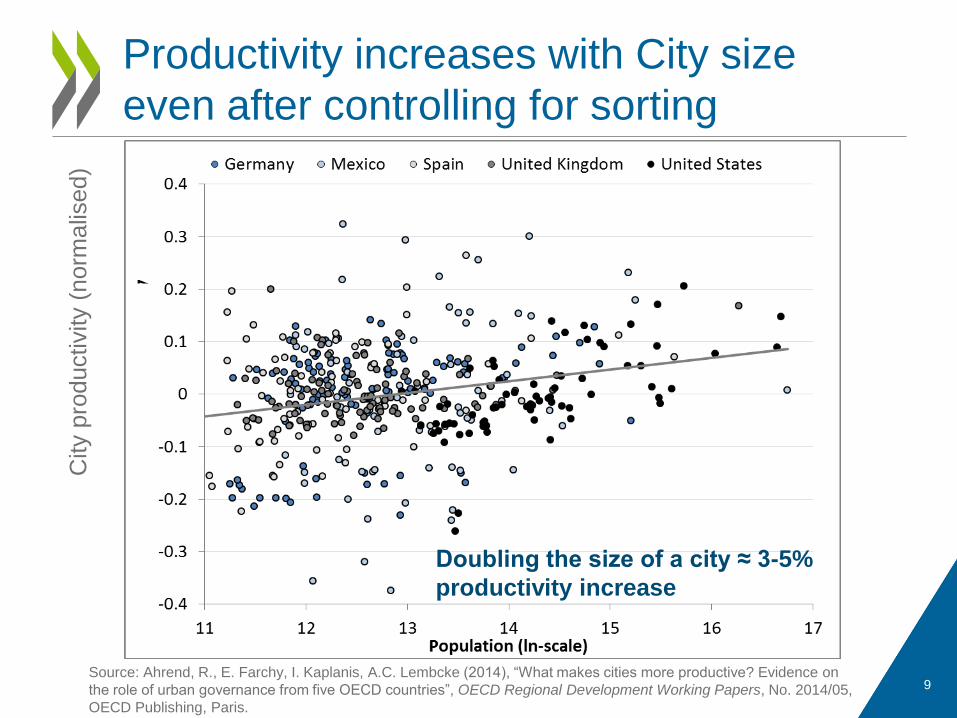
Productivity increases with City size
even after controlling for sorting
9
Doubling the size of a city ≈ 3-5%
productivity increase
City p
roductivity (
norm
alis
ed)
Source: Ahrend, R., E. Farchy, I. Kaplanis, A.C. Lembcke (2014), “What makes cities more productive? Evidence on
the role of urban governance from five OECD countries”, OECD Regional Development Working Papers, No. 2014/05,
OECD Publishing, Paris.
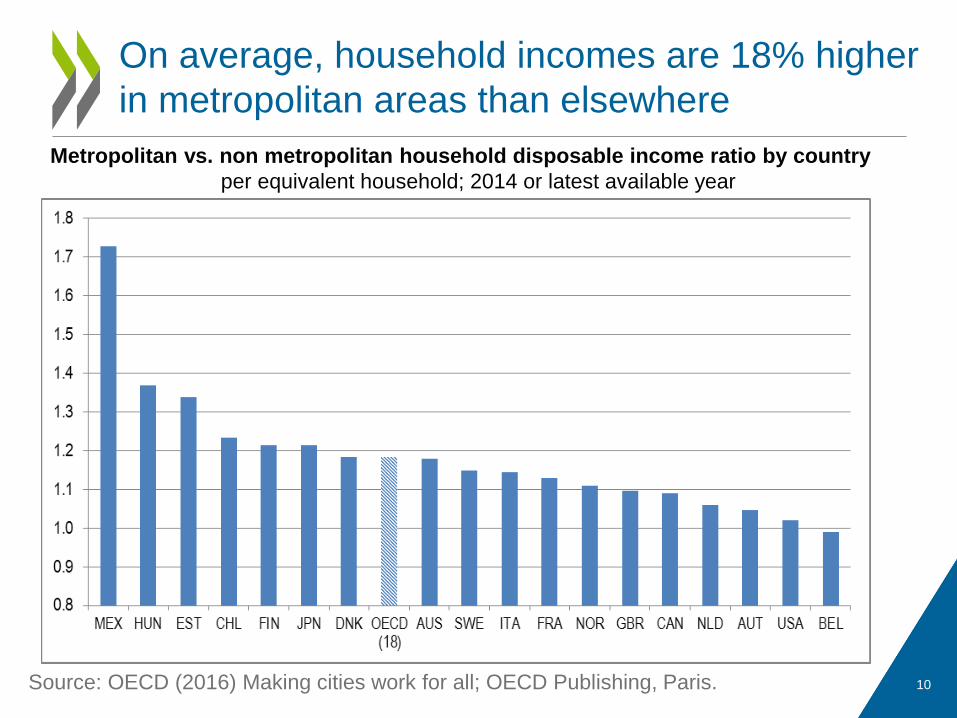
On average, household incomes are 18% higher
in metropolitan areas than elsewhere
10
Metropolitan vs. non metropolitan household disposable income ratio by country
per equivalent household; 2014 or latest available year
Source: OECD (2016) Making cities work for all; OECD Publishing, Paris.
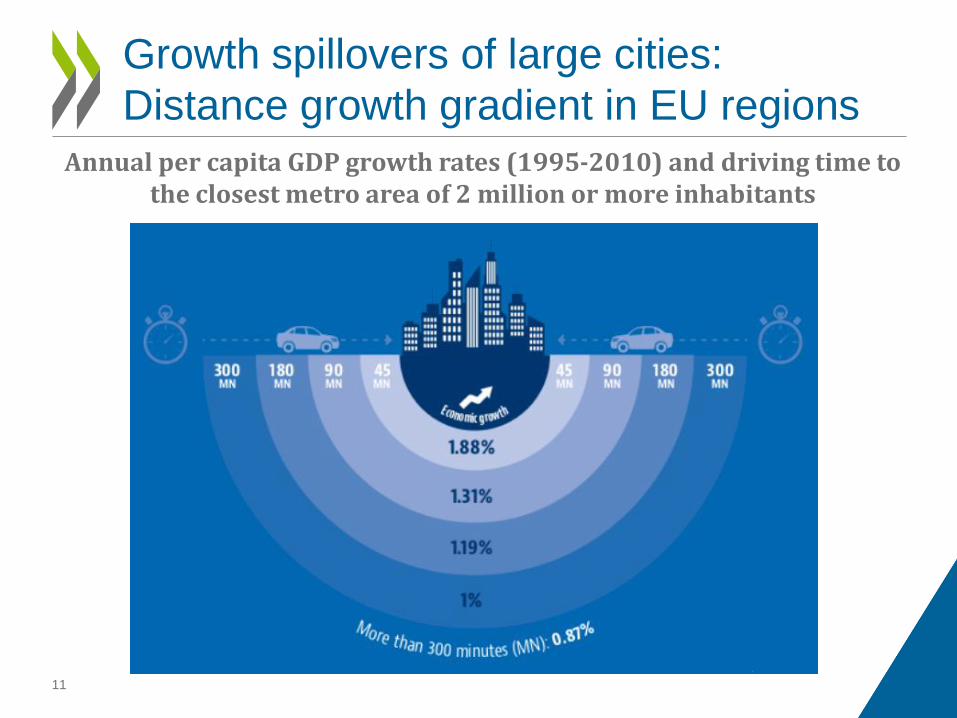
Annual per capita GDP growth rates (1995-2010) and driving time to the closest metro area of 2 million or more inhabitants
Growth spillovers of large cities:
Distance growth gradient in EU regions
11
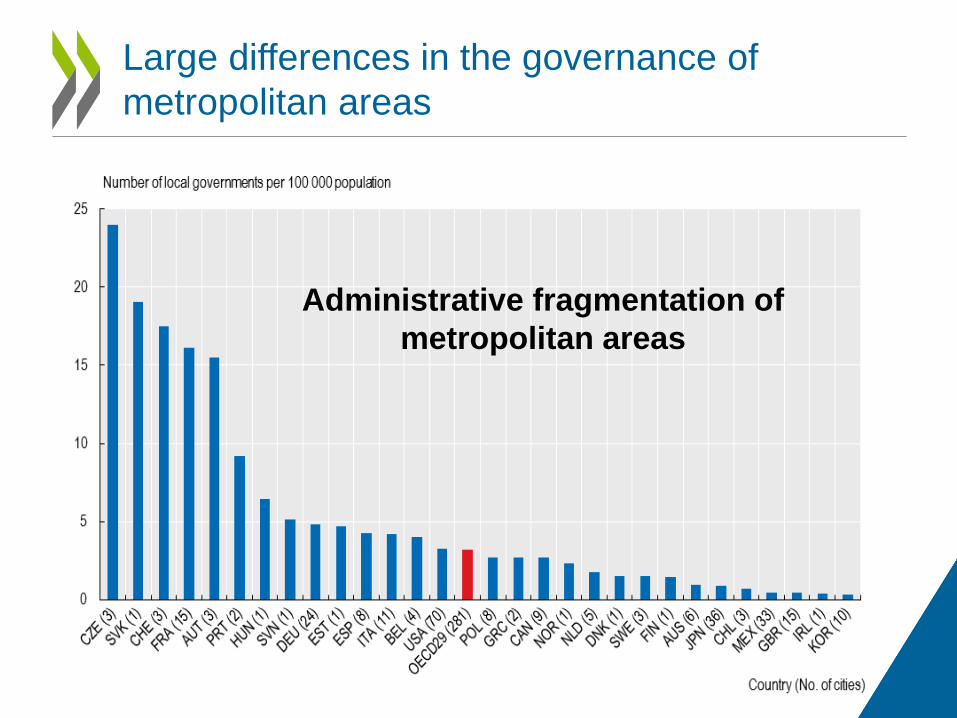
Large differences in the governance of
metropolitan areas
12
Administrative fragmentation of
metropolitan areas
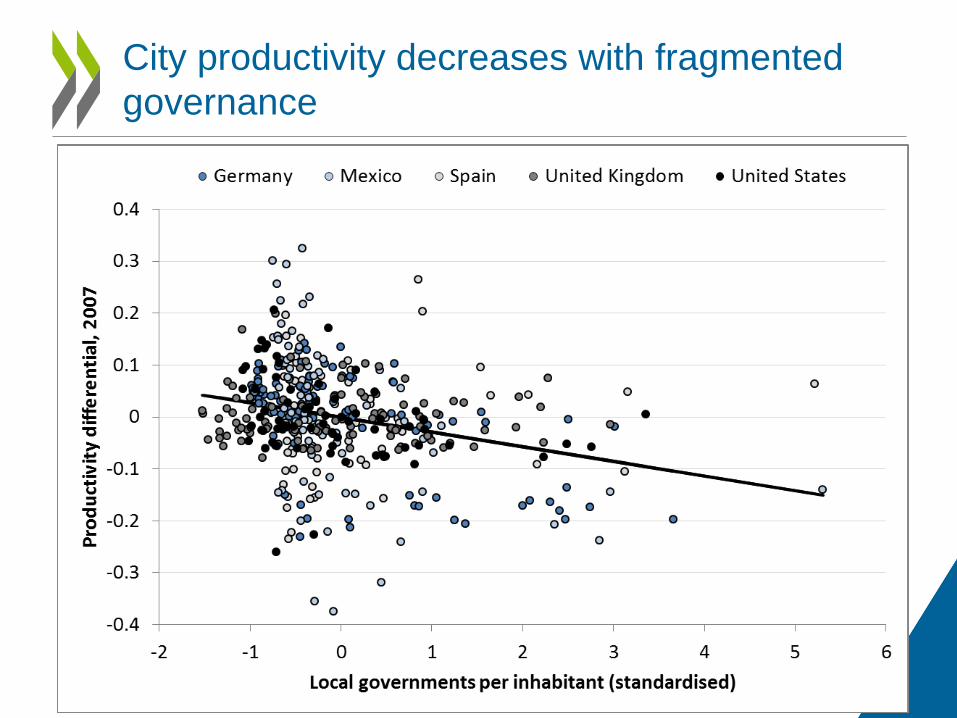
City productivity decreases with fragmented
governance
13
Inequalities in cities
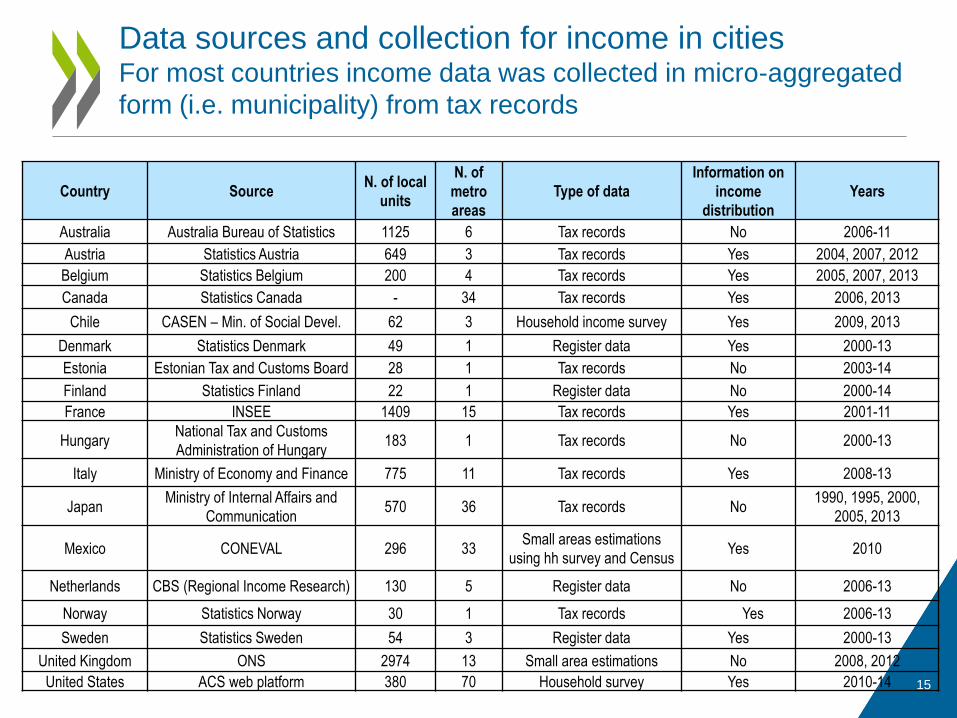
Data sources and collection for income in cities For most countries income data was collected in micro-aggregated
form (i.e. municipality) from tax records
15
Country Source N. of local
units
N. of
metro
areas
Type of data
Information on
income
distribution
Years
Australia Australia Bureau of Statistics 1125 6 Tax records No 2006-11
Austria Statistics Austria 649 3 Tax records Yes 2004, 2007, 2012
Belgium Statistics Belgium 200 4 Tax records Yes 2005, 2007, 2013
Canada Statistics Canada - 34 Tax records Yes 2006, 2013
Chile CASEN – Min. of Social Devel. 62 3 Household income survey Yes 2009, 2013
Denmark Statistics Denmark 49 1 Register data Yes 2000-13
Estonia Estonian Tax and Customs Board 28 1 Tax records No 2003-14
Finland Statistics Finland 22 1 Register data No 2000-14
France INSEE 1409 15 Tax records Yes 2001-11
Hungary National Tax and Customs
Administration of Hungary 183 1 Tax records No 2000-13
Italy Ministry of Economy and Finance 775 11 Tax records Yes 2008-13
Japan Ministry of Internal Affairs and
Communication 570 36 Tax records No
1990, 1995, 2000,
2005, 2013
Mexico CONEVAL 296 33 Small areas estimations
using hh survey and Census Yes 2010
Netherlands CBS (Regional Income Research) 130 5 Register data No 2006-13
Norway Statistics Norway 30 1 Tax records Yes 2006-13
Sweden Statistics Sweden 54 3 Register data Yes 2000-13
United Kingdom ONS 2974 13 Small area estimations No 2008, 2012
United States ACS web platform 380 70 Household survey Yes 2010-14
16
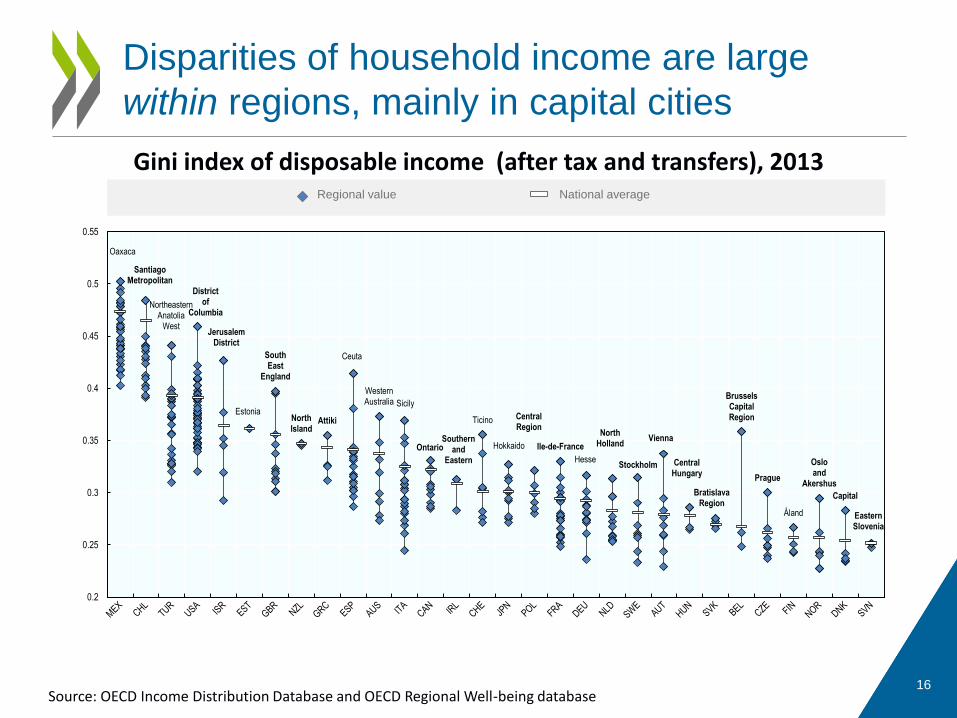
Gini index of disposable income (after tax and transfers), 2013
Disparities of household income are large
within regions, mainly in capital cities
Source: OECD Income Distribution Database and OECD Regional Well-being database
Eastern Slovenia
Capital
Oslo and
Akershus
Åland
Prague
Brussels Capital Region
Bratislava Region
Central Hungary
Vienna
Stockholm
North Holland
Hesse
Ile-de-France
Central Region
Hokkaido
Ticino
Southern and
Eastern
Ontario
Sicily
Western Australia
Ceuta
Attiki North Island
South East
England
Estonia
Jerusalem District
District of
Columbia Northeastern
Anatolia West
Santiago Metropolitan
Oaxaca
0.2
0.25
0.3
0.35
0.4
0.45
0.5
0.55
#REF!
Regional value National average
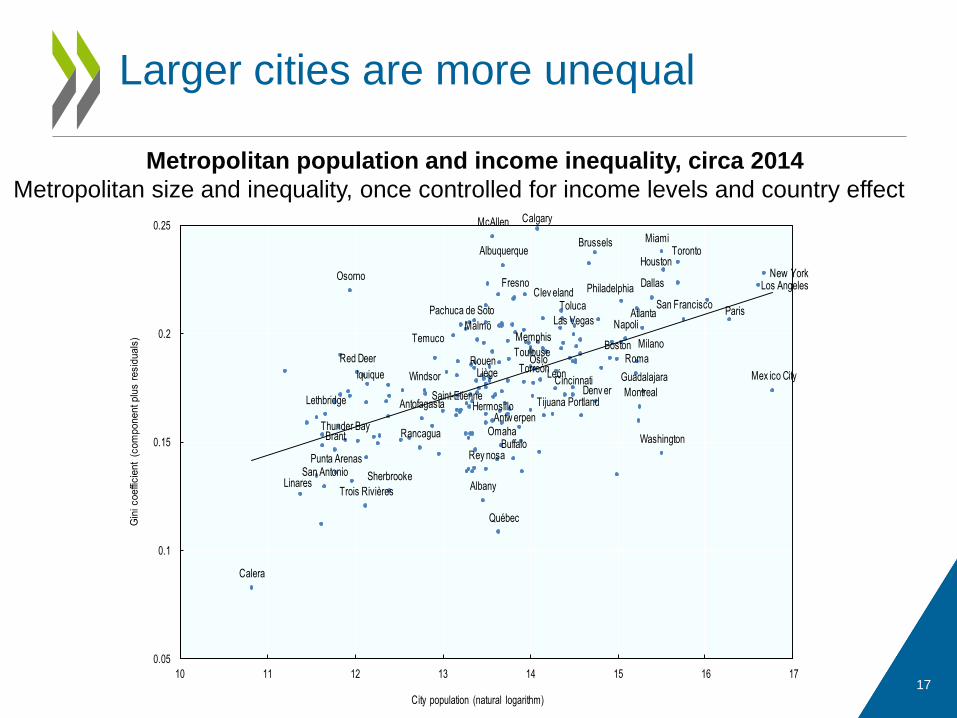
Larger cities are more unequal
17
Metropolitan population and income inequality, circa 2014
Metropolitan size and inequality, once controlled for income levels and country effect
Brussels
Antw erpen
Liège
Red Deer
Calgary
Lethbridge
Thunder Bay
Québec
Trois Rivières
Montreal
Sherbrooke
Toronto
Brant
Windsor
Iquique
Antofagasta
Calera
San Antonio
Rancagua
Linares
Temuco
Osorno
Punta Arenas
Paris
Toulouse
Saint-Etienne
Rouen Roma
Milano
Napoli
Tijuana
Hermosillo
Rey nosa
Torreón
León Guadalajara
Pachuca de Soto
Mex ico City
Toluca
Oslo
Malmö
Portland
Buffalo
Albany
Boston
Clev eland
Omaha
New York
Philadelphia
Denv er
Cincinnati
Washington
San Francisco
Fresno
Las Vegas
Albuquerque
Memphis
Los Angeles
Atlanta
Dallas
Houston
Miami
McAllen
0.05
0.1
0.15
0.2
0.25
10 11 12 13 14 15 16 17
Gin
i coeffi
cie
nt
(com
ponent plu
s r
esid
uals
)
City population (natural logarithm)
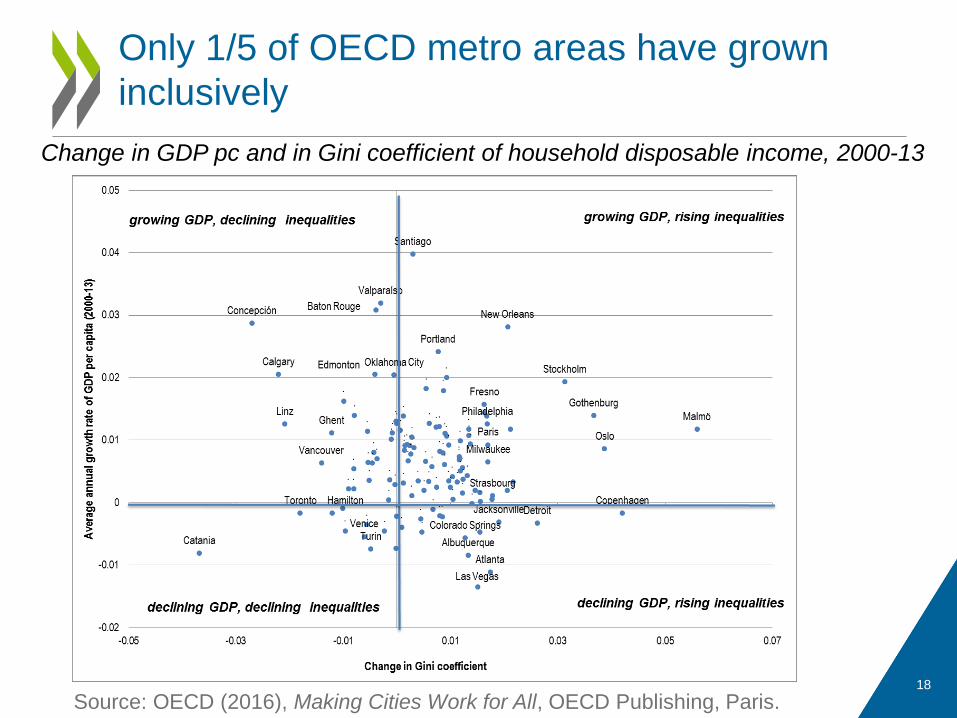
Only 1/5 of OECD metro areas have grown
inclusively
18
Change in GDP pc and in Gini coefficient of household disposable income, 2000-13
Source: OECD (2016), Making Cities Work for All, OECD Publishing, Paris.
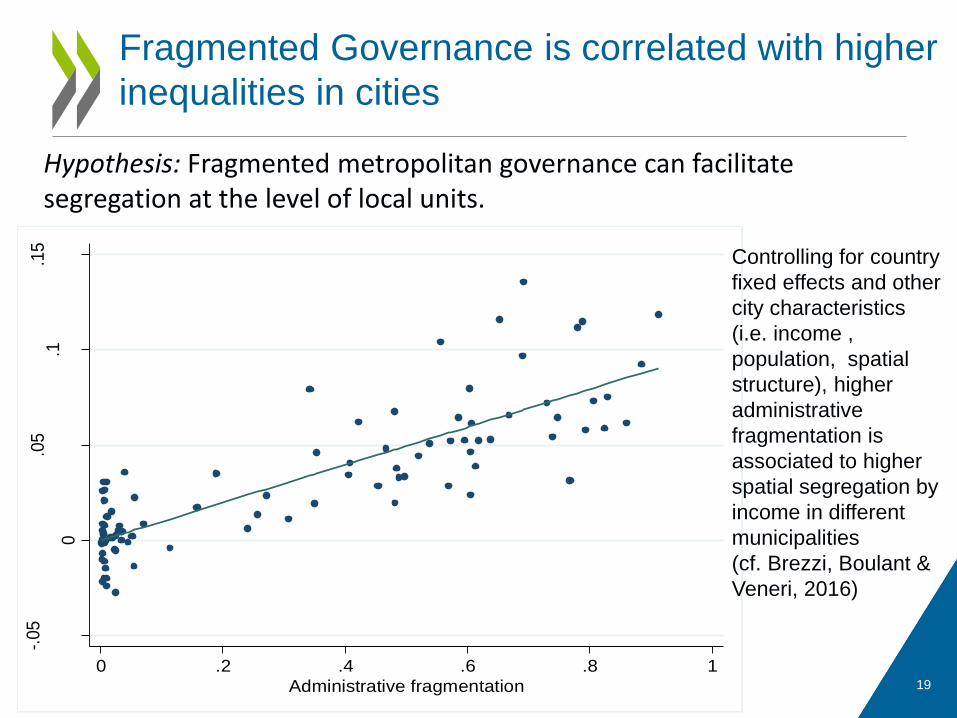
Fragmented Governance is correlated with higher
inequalities in cities
19
Hypothesis: Fragmented metropolitan governance can facilitate segregation at the level of local units.
-.05
0
.05
.1.1
5
Ine
qu
alit
y b
etw
een
loca
l ju
risd
ictio
ns,
(C
om
po
ne
nt p
lus
resi
dua
l)
0 .2 .4 .6 .8 1
Administrative fragmentation
Controlling for country
fixed effects and other
city characteristics
(i.e. income ,
population, spatial
structure), higher
administrative
fragmentation is
associated to higher
spatial segregation by
income in different
municipalities
(cf. Brezzi, Boulant &
Veneri, 2016)
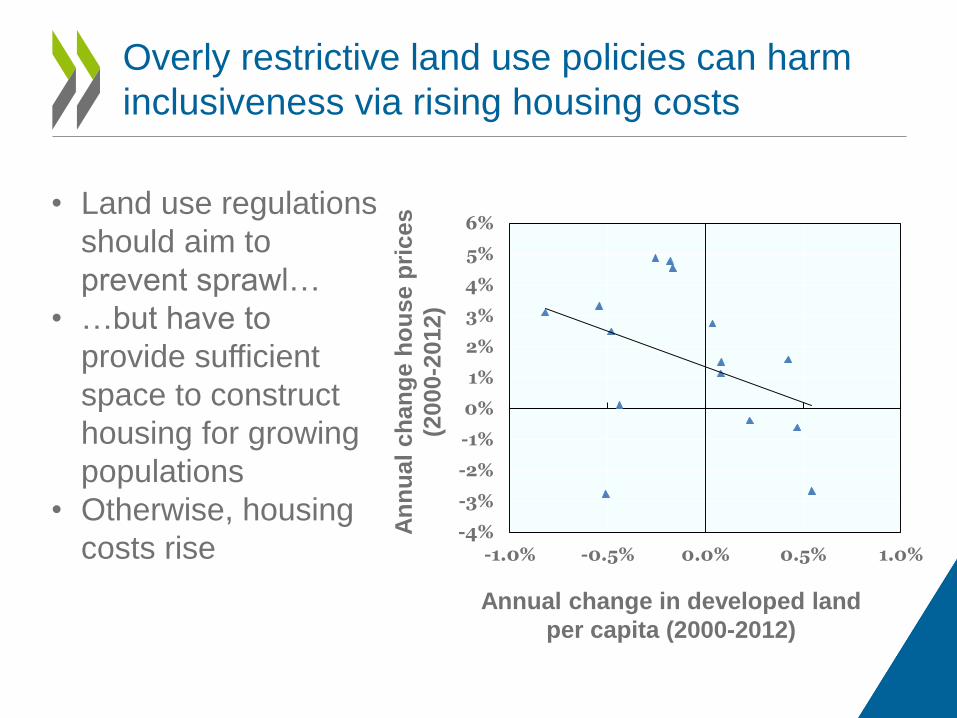
Overly restrictive land use policies can harm
inclusiveness via rising housing costs
An
nu
al
ch
an
ge h
ou
se p
rices
(2000-2
012)
Annual change in developed land
per capita (2000-2012)
• Land use regulations
should aim to
prevent sprawl…
• …but have to
provide sufficient
space to construct
housing for growing
populations
• Otherwise, housing
costs rise -4%
-3%
-2%
-1%
0%
1%
2%
3%
4%
5%
6%
-1.0% -0.5% 0.0% 0.5% 1.0%

Policies & Governance
1. Inequality goes beyond income City level data on different well-being dimensions can help design integrated multi-dimensional policies.
2. Polarization of skills in cities Comprehensive packages of structural policies targeted to the local conditions aligned between national and local government.
3. Inequality in cities also mean spatial segregation Appropriate governance systems of metropolitan areas can reduce the cost of administrative fragmentation which is associated to higher inequality between municipalities
How to tackle inequalities in cities?
How are cities being governed?
• Case studies suggest that governance bodies can reduce the “cost” of administrative fragmentation
• OECD Metropolitan Governance Survey:
– Collect data on governance structures for all ~270 metropolitan areas in the OECD
– Provide representative country overviews
– Develop categories to classify governance structures and enable quantitative analyses
– Use the data for quantitative studies on the effect of metropolitan area governance
23
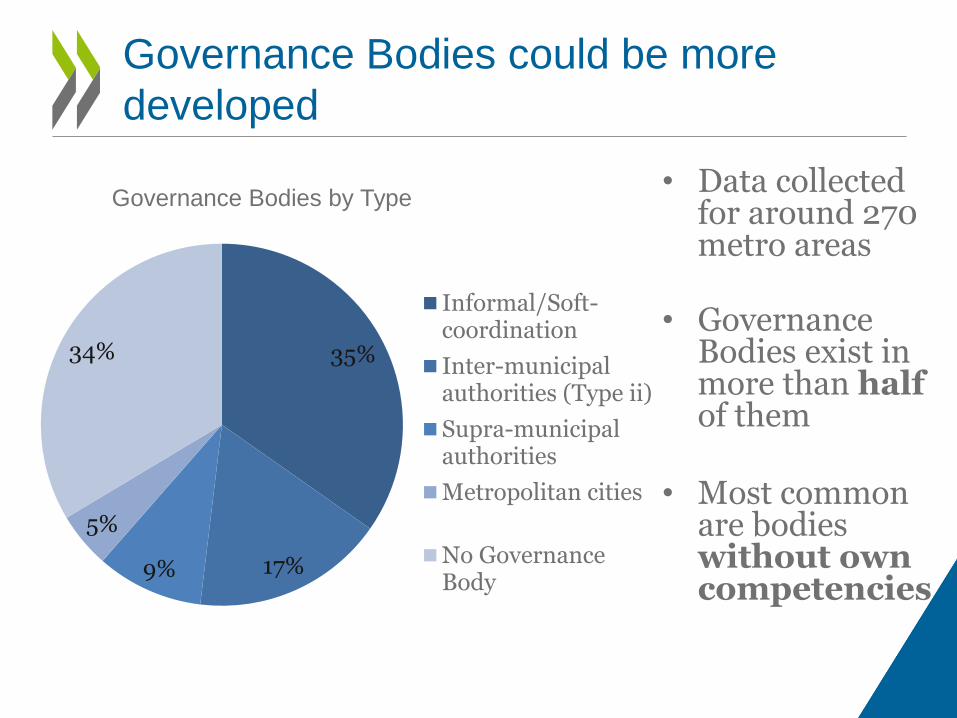
• Data collected for around 270 metro areas
• Governance Bodies exist in more than half of them
• Most common are bodies without own competencies
Governance Bodies could be more
developed
Governance Bodies by Type
35%
17% 9%
5%
34%
Informal/Soft-coordination
Inter-municipalauthorities (Type ii)
Supra-municipalauthorities
Metropolitan cities
No GovernanceBody
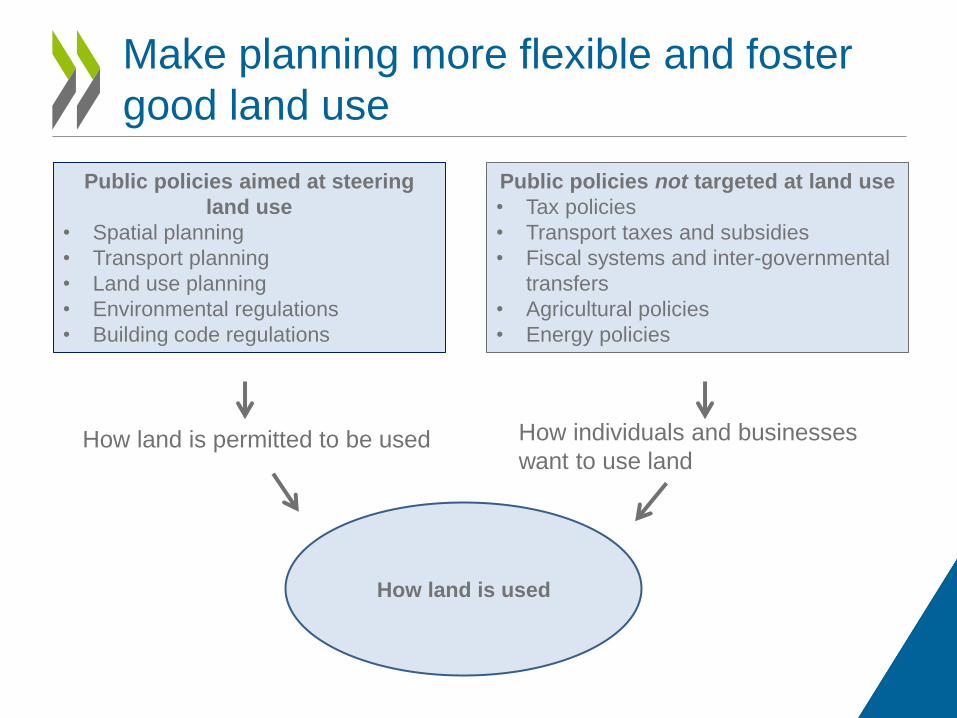
Make planning more flexible and foster
good land use
How land is used
Public policies aimed at steering
land use
• Spatial planning
• Transport planning
• Land use planning
• Environmental regulations
• Building code regulations
Public policies not targeted at land use
• Tax policies
• Transport taxes and subsidies
• Fiscal systems and inter-governmental
transfers
• Agricultural policies
• Energy policies
How land is permitted to be used How individuals and businesses
want to use land
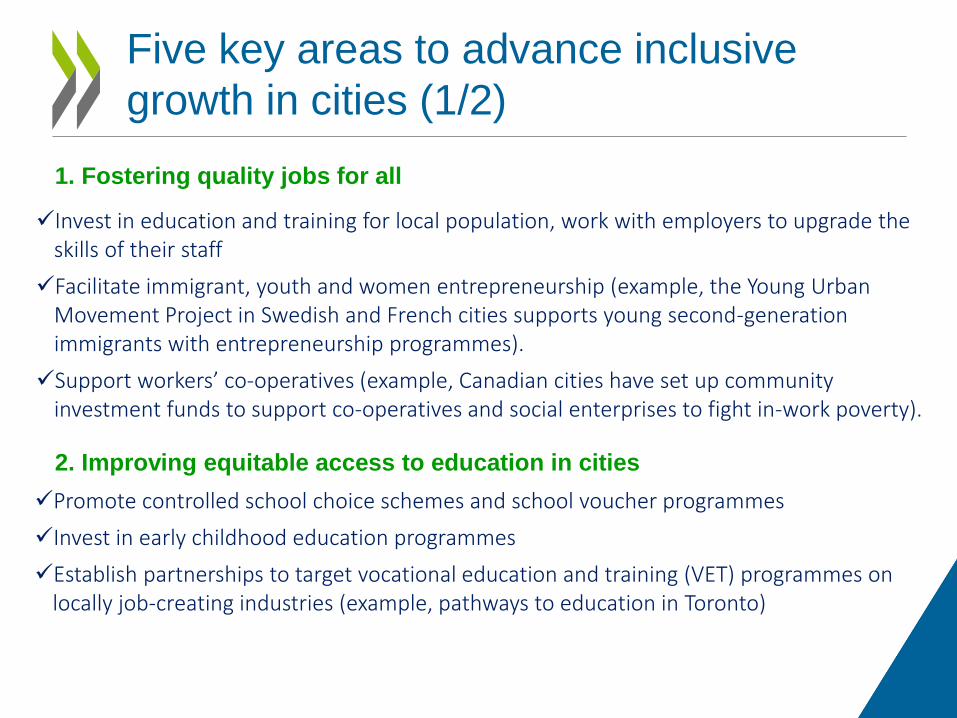
Five key areas to advance inclusive
growth in cities (1/2)
Invest in education and training for local population, work with employers to upgrade the skills of their staff
Facilitate immigrant, youth and women entrepreneurship (example, the Young Urban Movement Project in Swedish and French cities supports young second-generation immigrants with entrepreneurship programmes).
Support workers’ co-operatives (example, Canadian cities have set up community investment funds to support co-operatives and social enterprises to fight in-work poverty).
1. Fostering quality jobs for all
2. Improving equitable access to education in cities
Promote controlled school choice schemes and school voucher programmes
Invest in early childhood education programmes
Establish partnerships to target vocational education and training (VET) programmes on locally job-creating industries (example, pathways to education in Toronto)
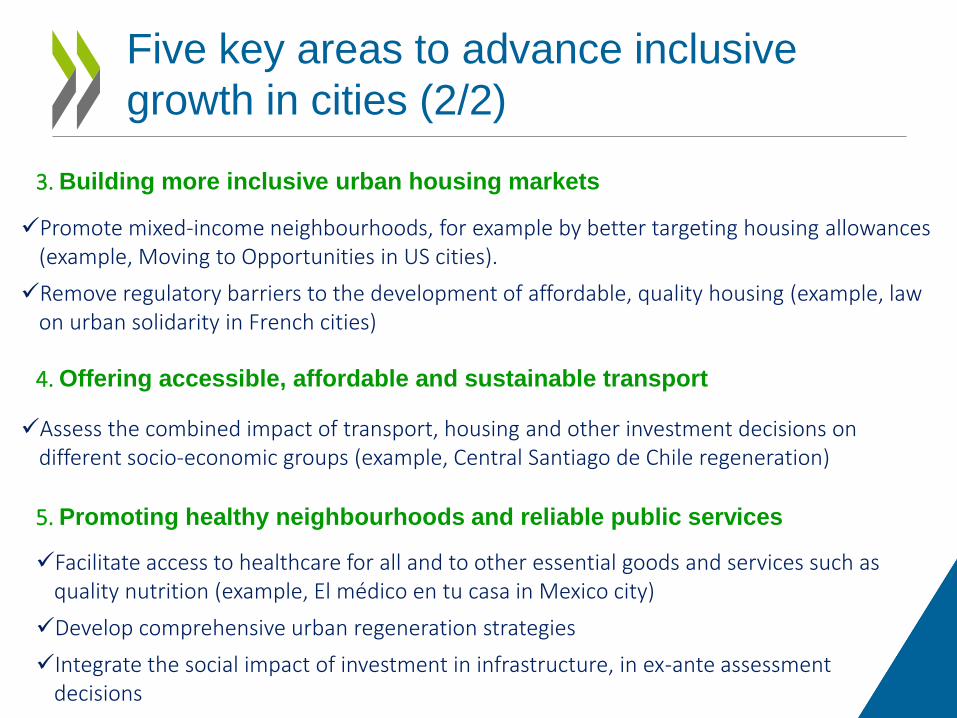
Five key areas to advance inclusive
growth in cities (2/2)
3. Building more inclusive urban housing markets
Promote mixed-income neighbourhoods, for example by better targeting housing allowances (example, Moving to Opportunities in US cities).
Remove regulatory barriers to the development of affordable, quality housing (example, law on urban solidarity in French cities)
4. Offering accessible, affordable and sustainable transport
Assess the combined impact of transport, housing and other investment decisions on different socio-economic groups (example, Central Santiago de Chile regeneration)
5. Promoting healthy neighbourhoods and reliable public services
Facilitate access to healthcare for all and to other essential goods and services such as quality nutrition (example, El médico en tu casa in Mexico city)
Develop comprehensive urban regeneration strategies
Integrate the social impact of investment in infrastructure, in ex-ante assessment decisions

Bottom-line
• Positive Economics (what to do?) need to
be combined with Governance (How to do
it?) in order to provide a better set of
policies to deal with inclusive growth
• Place-based policies help introducing a
systems approach to inclusive growth
• Place-based policies also support the
construction of a more integrated
structural policy package
Thank you!
https://www.oecd.org/gov/making-cities-work-for-all-
9789264263260-en.htm
References
Ahrend, R., Gamper C., Schumann A. (2014), The OECD Metropolitan governance survey. OECD Regional Development Working Papers , 2014/04. Boulant, J, Brezzi, M., Veneri, P. (2016), Income levels and inequality in OECD metropolitan areas. A Comparative Approach in OECD Countries”, OECD Regional Development Working Papers, 2016/06, OECD Publishing, Paris. http://dx.doi.org/10.1787/5jlwj02zz4mr-en OECD (2015), The Metropolitan Century. Understanding Urbanisation and its Consequences, OECD Publishing, Paris. OECD (2016) ,Regions at a Glance 2016, OECD Publishing. http://dx.doi.org/10.1787/reg_glance-2016-en OECD (2016), Making Cities Work for All, OECD Publishing. http://dx.doi.org/10.1787/9789264263260-en OECD (2012), Redefining “Urban”: A New Way to Measure Metropolitan Areas, OECD Publishing. http://dx.doi.org/10.1787/9789264174108-en Veneri P. (2017) “Urban Spatial Structure in OECD Cities: is Urban Population Decentralising or Clustering?”, Papers in Regional Science Veneri, P., Ruiz, V. (2016), “Rural-to-urban population growth linkages: evidence from OECD TL3 regions. Journal of Regional Science, Vol. 56(1), pp. 3-24.