Embed Size (px)
Citation preview

applied sciences
Article
A Case Study on the Application of the Steel TubeSlab Structure in Construction of a Subway Station
Peng-jiao Jia 1,2 ID , Wen Zhao 1,*, Yang Chen 1, Shen-gang Li 1,*, Jian-yong Han 1 andJia-chao Dong 1
1 School of Resources & Civil Engineering, Northeastern University, Shenyang 110819, China;[email protected] (P.-j.J.); [email protected] (Y.C.); [email protected] (J.-y.H.);[email protected] (J.-c.D.)
2 School of Civil and Environmental Engineering, University of New South Wales, UNSW, Sydney,NSW 2052, Australia
* Correspondence: [email protected] (W.Z.); [email protected] (S.-g.L.);Tel.: +86-137-0002-8971 (W.Z.)
Received: 10 July 2018; Accepted: 20 August 2018; Published: 23 August 2018�����������������
Abstract: It is an effective approach to use Steel Tube Slab (STS) structure combined withthe Pile-Beam-Arch (PBA) method to construct a large-space underground station. Traditionalconstruction methods cannot meet the requirement of construction because of the complicated soillayers and high building densities in urban areas. The STS method can effectively increase therigidity of the supporting system by using steel tubes. Firstly, the stress of bolts and steel tubes areinvestigated in the construction process based on the field monitoring data. Subsequently, FLAC3D isused to establish a three-dimensional model, which is verified based on the in-situ monitoring data;the effect of excavation process on ground settlement, deformation of STS structure and bridge pileare studied by numerical results. Moreover, the key parameters such as welding of flanges and thestep length are studied. The results show that the stress of the steel tubes and flanges does not exceedthe designed strength during the construction process. Based on the numerical simulation data, it isindicated that the STS structure can be a very effective and dependable measure in controlling andreducing the surface settlement and the existing adjacent buildings. The numerical results can beused to guide the later construction.
Keywords: large span underground spaces; Steel Tube Slab structure; excavation sequence; groundsettlement; structural deformation
1. Introduction
The stress redistribution induced by underground excavations causes soil movements around theexcavation face in the earth mass, which is also translated to ground settlement. These soil movementscan cause severe damage to adjacent buildings and underground facilities [1,2]. Control of the soilmovements due to excavations is of utter importance in subway projects, because they are oftenplanned in the populated areas of cities that are already well developed. Several methods for surfacesettlement prediction due to underground excavations are currently available including those proposedby Peck, Reilly and Novozhenin [3–5].
Underground excavations in urban area have some characteristic features such as large spans,ultra-shallow buried depth, complex environments, and heavy overburdens due to street traffic.Hence, excavation-induced instability and settlement has become a major concern in the design andconstruction of the new underground excavations [6].
The pipe roofing method evolved from pipe umbrella method adopted in shallow ground coverand poor ground conditions during underground construction. As for this method, steel pipes are
Appl. Sci. 2018, 8, 1437; doi:10.3390/app8091437 www.mdpi.com/journal/applsci
Appl. Sci. 2018, 8, 1437 2 of 29
jacked to the design location by pipe jacking machines to act as the initial support system. Theseadjacent pipes are connected together and form a supporting structure, filled with grout or concrete inthe inside and outside of the steel pipes before tunnel excavation. The pipe roofing method was firstlyto be used to construct an underpass railway in 1971 and a total of six such projects were completedin the next decade [7]. The Antwerp subway station in Belgium was an early engineering feature,constructed by applying pipe roofing method in Europe in 1979 [8,9]. It was first used in Americain 1994 for a large shallow covered tunnel [10]. Subsequently, this method is applied to constructhighways in Japan, and on the basis of the pipe roofing method, Endless Self-Advancing (ESA) andFront Jacking (FJ) were proposed [11,12]. Meanwhile, the methods were widely applied to certainengineering projects in Singapore and Malaysia [7,13]. A typical engineering project, 923 stations ofthe Seoul subway line 9 in Korea was constructed by using the pipe roofing method in the complexenvironments [14,15].
Based on some engineering examples of previous pipe roofing method in China, it was used tobuild an underpass in Hong Kong in 1984, and the Taipei Songshan airport underpass was constructedusing the pipe roofing method in 1989. The pipe roofing method was employed to construct the vehicletunnel, which passes the Taipei International Airport [16]. The Roof-Box Jacking Method (RBJ) wasused for the underpass project of Shanghai Beihong street in 2004. This support structure formed arectangular section and was made up of 80 steel pipes with a diameter of 0.97 m and longitudinal lengthof 125 m [17]. By an arc-shaped supporting system, Xinle Yizhi station of Shenyang subway line 2 wasconstructed by the new roof tubular of method with 19 steel pipes with diameter of approximately2 m in 2011 [18]. The Gongbei tunnel, as a part of Hongkong-Zhuhai-Macao Bridge project, wasconstructed a combination technology of curved pipe jacking roof for ground support and groundfreezing for waterproof. This pipe roofing structure is composed of 36 steel pipe strings of 1.620 mdiameter with a 355–358 mm gap between adjacent strings [19,20].
In term of studies on the working mechanism of the pipe-roofing support systems, these haveshown that the maximum bending moment of the steel grid is often much larger than that of thepipe-roofing system in the longitudinal direction [21]. Therefore, to ensure the stability of thepipe-roofing system during excavation, an intensive temporary supporting structure is often required.The tedious and expensive set up of the steel supporting structure is a big disadvantage of thetraditional pipe-roofing method. And as for forming an arch structure, the space utilization is lowerthan the rectangular section.
To overcome the problem associated with supporting system requirements as mentioned above, anew pipe-roofing structure, also known as the Steel Tube Slab (STS) structure, has been proposed [22].STS design considerably improves the transverse load-carrying capacity of the traditional pipe-roofingsystem by inclusion of high strength transverse bolts and flange plates between the tubes. Such asystem is attractive as it can avoid the use of temporary support during excavation.
In the current study, the application of the proposed method in the design and construction ofNortheastern Street station of line 10 of the Shenyang Subway is then thoroughly discussed. Datafrom monitoring stations in the construction site are presented and compared with the results ofthe numerical simulations. The effect excavation process on ground settlement, deformation of STSstructure and bridge pile are studied; moreover the key parameter such as welding of flanges and thestep length are investigated by conducting a suite of numerical simulations.
2. Support Structures in Underground Excavations
Different types of supporting structures have so far been used to control the soil movement duringunderground excavations. These methods are briefly discussed in the following sections.
2.1. Pile, Beam and Arch (PBA) Method
The concept of the traditional Pile, Beam and Arch (PBA) method is to develop a supportingstructure in underground excavations to control soil movements and ground settlements. In this
Appl. Sci. 2018, 8, 1437 3 of 29
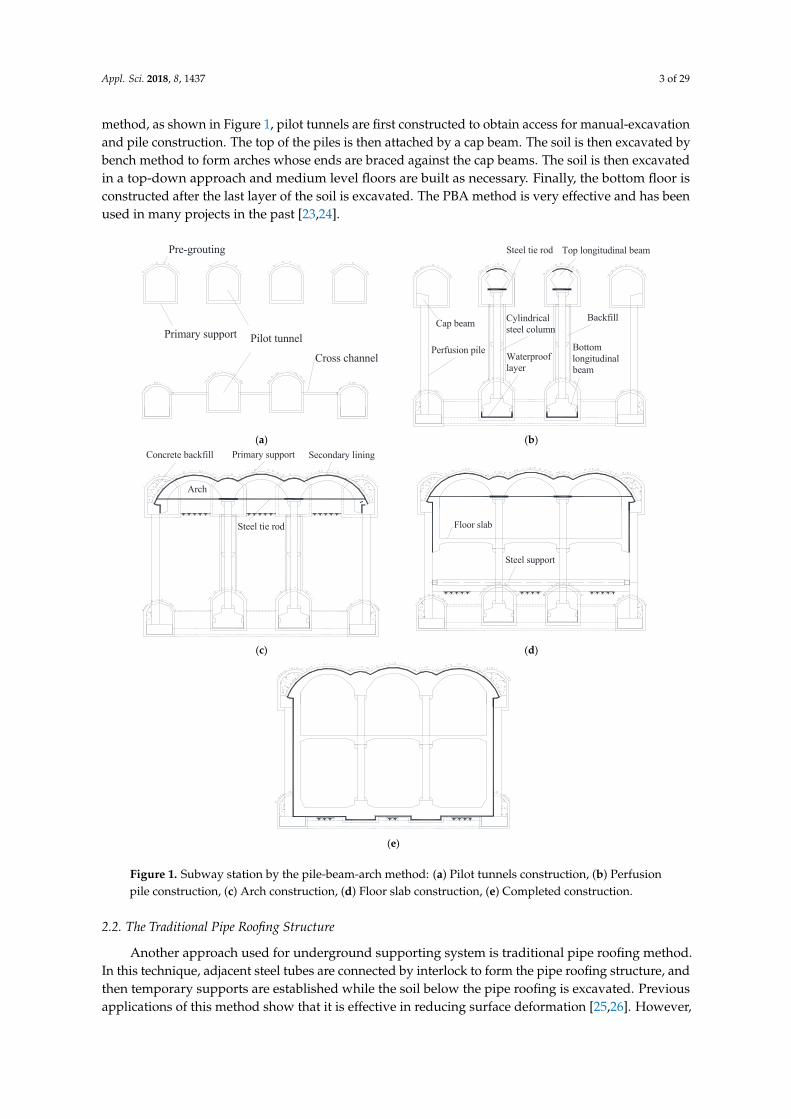
method, as shown in Figure 1, pilot tunnels are first constructed to obtain access for manual-excavationand pile construction. The top of the piles is then attached by a cap beam. The soil is then excavated bybench method to form arches whose ends are braced against the cap beams. The soil is then excavatedin a top-down approach and medium level floors are built as necessary. Finally, the bottom floor isconstructed after the last layer of the soil is excavated. The PBA method is very effective and has beenused in many projects in the past [23,24].
Appl. Sci. 2017, 7, x 3 of 29
soil is then excavated by bench method to form arches whose ends are braced against the cap beams. The soil is then excavated in a top-down approach and medium level floors are built as necessary. Finally, the bottom floor is constructed after the last layer of the soil is excavated. The PBA method is very effective and has been used in many projects in the past [23,24].
Pre-grouting
Primary support Pilot tunnel
Cross channel
Cap beam
Perfusion pile
Top longitudinal beam
Bottomlongitudinalbeam
BackfillCylindricalsteel column
Steel tie rod
Waterprooflayer
(a) (b)
Primary support Secondary liningConcrete backfill
Arch
Steel tie rod
Floor slab
Steel support
(c) (d)
(e)
Figure 1. Subway station by the pile-beam-arch method: (a) Pilot tunnels construction, (b) Perfusion pile construction, (c) Arch construction, (d) Floor slab construction, (e) Completed construction.
2.2. The Traditional Pipe Roofing Structure
Another approach used for underground supporting system is traditional pipe roofing method. In this technique, adjacent steel tubes are connected by interlock to form the pipe roofing structure, and then temporary supports are established while the soil below the pipe roofing is excavated. Previous applications of this method show that it is effective in reducing surface deformation [25,26]. However, in this technique, adjacent steel tubes are only connected by interlock, resulting in low
Figure 1. Subway station by the pile-beam-arch method: (a) Pilot tunnels construction, (b) Perfusionpile construction, (c) Arch construction, (d) Floor slab construction, (e) Completed construction.
2.2. The Traditional Pipe Roofing Structure
Another approach used for underground supporting system is traditional pipe roofing method.In this technique, adjacent steel tubes are connected by interlock to form the pipe roofing structure, andthen temporary supports are established while the soil below the pipe roofing is excavated. Previousapplications of this method show that it is effective in reducing surface deformation [25,26]. However,
Appl. Sci. 2018, 8, 1437 4 of 29
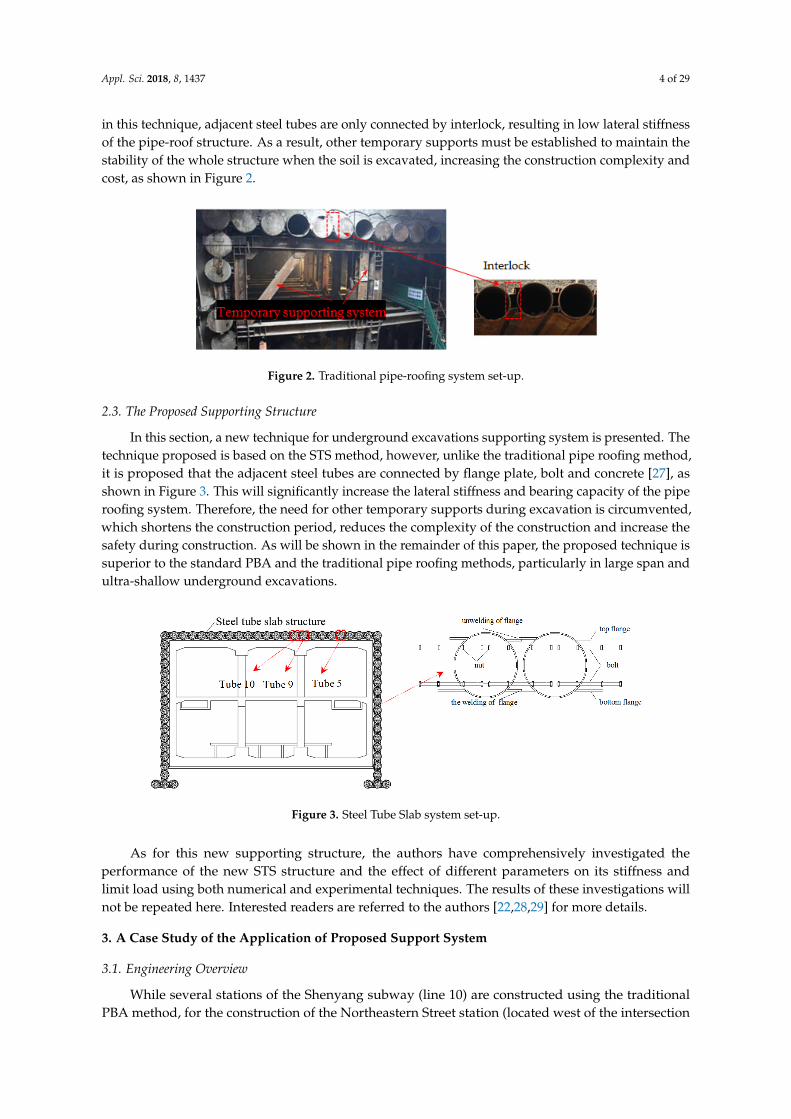
in this technique, adjacent steel tubes are only connected by interlock, resulting in low lateral stiffnessof the pipe-roof structure. As a result, other temporary supports must be established to maintain thestability of the whole structure when the soil is excavated, increasing the construction complexity andcost, as shown in Figure 2.
Appl. Sci. 2017, 7, x 4 of 29
lateral stiffness of the pipe-roof structure. As a result, other temporary supports must be established to maintain the stability of the whole structure when the soil is excavated, increasing the construction complexity and cost, as shown in Figure 2.
Figure 2. Traditional pipe-roofing system set-up.
2.3. The Proposed Supporting Structure
In this section, a new technique for underground excavations supporting system is presented. The technique proposed is based on the STS method, however, unlike the traditional pipe roofing method, it is proposed that the adjacent steel tubes are connected by flange plate, bolt and concrete [27], as shown in Figure 3. This will significantly increase the lateral stiffness and bearing capacity of the pipe roofing system. Therefore, the need for other temporary supports during excavation is circumvented, which shortens the construction period, reduces the complexity of the construction and increase the safety during construction. As will be shown in the remainder of this paper, the proposed technique is superior to the standard PBA and the traditional pipe roofing methods, particularly in large span and ultra-shallow underground excavations.
Figure 3. Steel Tube Slab system set-up.
As for this new supporting structure, the authors have comprehensively investigated the performance of the new STS structure and the effect of different parameters on its stiffness and limit load using both numerical and experimental techniques. The results of these investigations will not be repeated here. Interested readers are referred to the authors [22,28,29] for more details.
3. A Case Study of the Application of Proposed Support System
3.1. Engineering Overview
While several stations of the Shenyang subway (line 10) are constructed using the traditional PBA method, for the construction of the Northeastern Street station (located west of the intersection of Beihai street and Northeastern Road) the traditional PBA method could not be used due to the complexity of the existing structures close to the station, and the heavy traffic load that had to be
Figure 2. Traditional pipe-roofing system set-up.
2.3. The Proposed Supporting Structure
In this section, a new technique for underground excavations supporting system is presented. Thetechnique proposed is based on the STS method, however, unlike the traditional pipe roofing method,it is proposed that the adjacent steel tubes are connected by flange plate, bolt and concrete [27], asshown in Figure 3. This will significantly increase the lateral stiffness and bearing capacity of the piperoofing system. Therefore, the need for other temporary supports during excavation is circumvented,which shortens the construction period, reduces the complexity of the construction and increase thesafety during construction. As will be shown in the remainder of this paper, the proposed technique issuperior to the standard PBA and the traditional pipe roofing methods, particularly in large span andultra-shallow underground excavations.
Appl. Sci. 2017, 7, x 4 of 29
lateral stiffness of the pipe-roof structure. As a result, other temporary supports must be established to maintain the stability of the whole structure when the soil is excavated, increasing the construction complexity and cost, as shown in Figure 2.
Figure 2. Traditional pipe-roofing system set-up.
2.3. The Proposed Supporting Structure
In this section, a new technique for underground excavations supporting system is presented. The technique proposed is based on the STS method, however, unlike the traditional pipe roofing method, it is proposed that the adjacent steel tubes are connected by flange plate, bolt and concrete [27], as shown in Figure 3. This will significantly increase the lateral stiffness and bearing capacity of the pipe roofing system. Therefore, the need for other temporary supports during excavation is circumvented, which shortens the construction period, reduces the complexity of the construction and increase the safety during construction. As will be shown in the remainder of this paper, the proposed technique is superior to the standard PBA and the traditional pipe roofing methods, particularly in large span and ultra-shallow underground excavations.
Figure 3. Steel Tube Slab system set-up.
As for this new supporting structure, the authors have comprehensively investigated the performance of the new STS structure and the effect of different parameters on its stiffness and limit load using both numerical and experimental techniques. The results of these investigations will not be repeated here. Interested readers are referred to the authors [22,28,29] for more details.
3. A Case Study of the Application of Proposed Support System
3.1. Engineering Overview
While several stations of the Shenyang subway (line 10) are constructed using the traditional PBA method, for the construction of the Northeastern Street station (located west of the intersection of Beihai street and Northeastern Road) the traditional PBA method could not be used due to the complexity of the existing structures close to the station, and the heavy traffic load that had to be
Figure 3. Steel Tube Slab system set-up.
As for this new supporting structure, the authors have comprehensively investigated theperformance of the new STS structure and the effect of different parameters on its stiffness andlimit load using both numerical and experimental techniques. The results of these investigations willnot be repeated here. Interested readers are referred to the authors [22,28,29] for more details.
3. A Case Study of the Application of Proposed Support System
3.1. Engineering Overview
While several stations of the Shenyang subway (line 10) are constructed using the traditionalPBA method, for the construction of the Northeastern Street station (located west of the intersection
Appl. Sci. 2018, 8, 1437 5 of 29
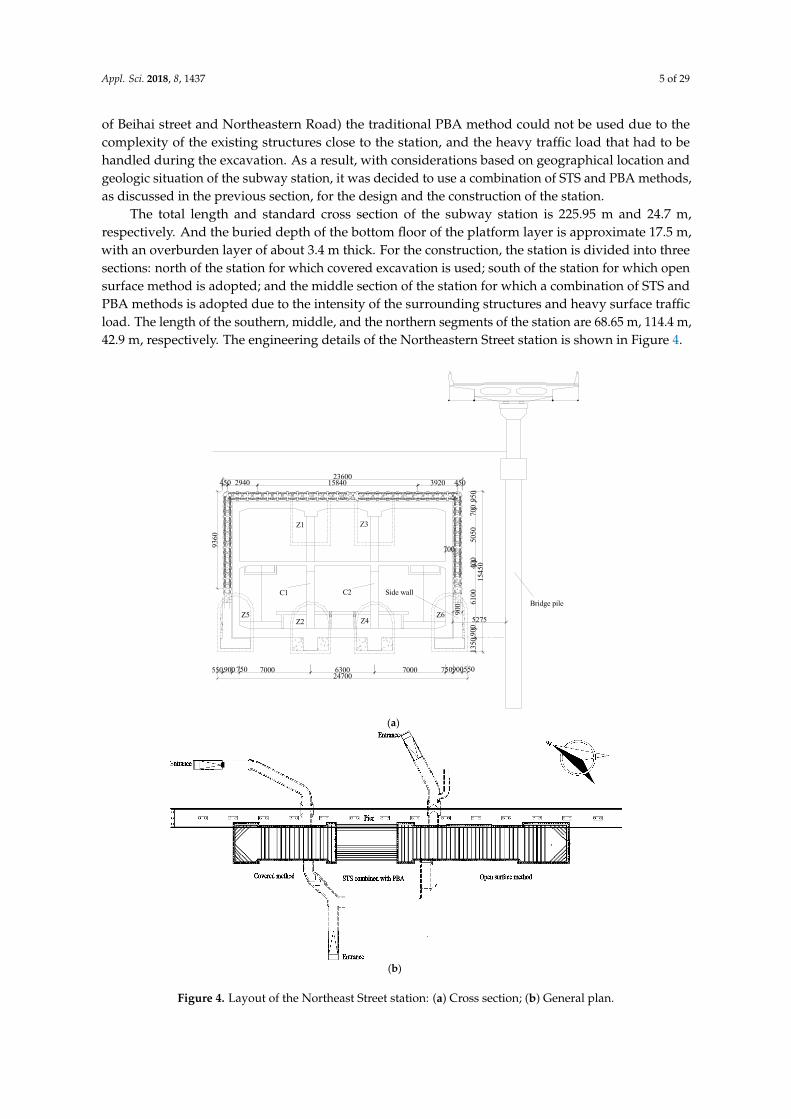
of Beihai street and Northeastern Road) the traditional PBA method could not be used due to thecomplexity of the existing structures close to the station, and the heavy traffic load that had to behandled during the excavation. As a result, with considerations based on geographical location andgeologic situation of the subway station, it was decided to use a combination of STS and PBA methods,as discussed in the previous section, for the design and the construction of the station.
The total length and standard cross section of the subway station is 225.95 m and 24.7 m,respectively. And the buried depth of the bottom floor of the platform layer is approximate 17.5 m,with an overburden layer of about 3.4 m thick. For the construction, the station is divided into threesections: north of the station for which covered excavation is used; south of the station for which opensurface method is adopted; and the middle section of the station for which a combination of STS andPBA methods is adopted due to the intensity of the surrounding structures and heavy surface trafficload. The length of the southern, middle, and the northern segments of the station are 68.65 m, 114.4 m,42.9 m, respectively. The engineering details of the Northeastern Street station is shown in Figure 4.
Appl. Sci. 2017, 7, x 5 of 29
handled during the excavation. As a result, with considerations based on geographical location and geologic situation of the subway station, it was decided to use a combination of STS and PBA methods, as discussed in the previous section, for the design and the construction of the station.
The total length and standard cross section of the subway station is 225.95 m and 24.7 m, respectively. And the buried depth of the bottom floor of the platform layer is approximate 17.5 m, with an overburden layer of about 3.4 m thick. For the construction, the station is divided into three sections: north of the station for which covered excavation is used; south of the station for which open surface method is adopted; and the middle section of the station for which a combination of STS and PBA methods is adopted due to the intensity of the surrounding structures and heavy surface traffic load. The length of the southern, middle, and the northern segments of the station are 68.65 m, 114.4 m, 42.9 m, respectively. The engineering details of the Northeastern Street station is shown in Figure 4.
6300 700024700
400
6100
1545
050
5090
0
750900750900
700
9360
900
700
5275
45045023600
15840 39202940
550
1350
550
950
7000
Z1 Z3
Z2 Z4Z5 Z6
Bridge pile
Side wallC1 C2
(a)
(b)
Figure 4. Layout of the Northeast Street station: (a) Cross section; (b) General plan. Figure 4. Layout of the Northeast Street station: (a) Cross section; (b) General plan.

Appl. Sci. 2018, 8, 1437 6 of 29
The soil stratigraphy at the station location was determined from geological and geotechnicalinvestigations. Accordingly, the soil deposit can be divided into five layers based on the mechanicalproperties and formation lithology, as shown in Figure 5. And depth of the water table is from 5.2 m to14.9 m in the construction area. In order to get the strength parameters of sandy soils, a series of superheavy Dynamic cone Penetration test (DPSH) were performed, as shown in Table 1.
Appl. Sci. 2017, 7, x 6 of 29
The soil stratigraphy at the station location was determined from geological and geotechnical investigations. Accordingly, the soil deposit can be divided into five layers based on the mechanical properties and formation lithology, as shown in Figure 5. And depth of the water table is from 5.2 m to 14.9 m in the construction area. In order to get the strength parameters of sandy soils, a series of super heavy Dynamic cone Penetration test (DPSH) were performed, as shown in Table 1.
Figure 5. Geological profile of the soil.
Table 1. The results of super heavy dynamic cone penetration test.
Soil Index
Medium Coarse Sand
Gravel Sand
Round Gravel
Boulder Clay
Count 6 49 125 97 maximum value 14.1 19 17.4 17 minimum value 10.6 7.3 7.0 7.2 average value 12.9 12.3 10.5 10.4
standard deviation 1.265 3.293 2.267 3.324
variation coefficient
0.098 0.268 0.216 0.262
correction factors 0.919 0.934 0.967 0.955 standard value 11.9 11.5 10.2 12.1
3.2. Structural Elements
3.2.1. Construction Process of the Support Structure
Several steps are involved in the construction of the proposed supporting structure based on combination of STS and PBA methods. These steps are demonstrated in details in Figure 6.
(1) The steel tubes are pushed into the soil by the jacking machine, and then the soil inside the steel tubes are extracted using horizontal directional drilling (Figure 6a).
(2) Lateral connecting bolts are installed between adjacent steel tubes by artificial operations. Blocking plate at both ends of the steel tubes are then installed, and concrete is poured through grouting holes on the blocking plates (Figure 6b).
(3) The top pilot tunnels (Z1) and bottom pilot tunnel (Z2) are then excavated, respectively. Then the cylindrical steel column (C1) is constructed. Then do the right parts (Z3, Z4 and C2) (Figure 6c).
(4) The inter grid of the top pilot tunnels is removed, and the waterproof layer at the top and the middle floor slab are constructed. When the strength of the floor slab reaches to the 80% of the design strength, the soil above the middle floor slab is excavated for the whole cross section of the station, followed by the construction of the middle longitudinal beams and side walls (Figure 6d).
Figure 5. Geological profile of the soil.
Table 1. The results of super heavy dynamic cone penetration test.
Index Soil Medium Coarse Sand Gravel Sand Round Gravel Boulder Clay
Count 6 49 125 97maximum value 14.1 19 17.4 17minimum value 10.6 7.3 7.0 7.2average value 12.9 12.3 10.5 10.4
standard deviation 1.265 3.293 2.267 3.324variation coefficient 0.098 0.268 0.216 0.262
correction factors 0.919 0.934 0.967 0.955standard value 11.9 11.5 10.2 12.1
3.2. Structural Elements
3.2.1. Construction Process of the Support Structure
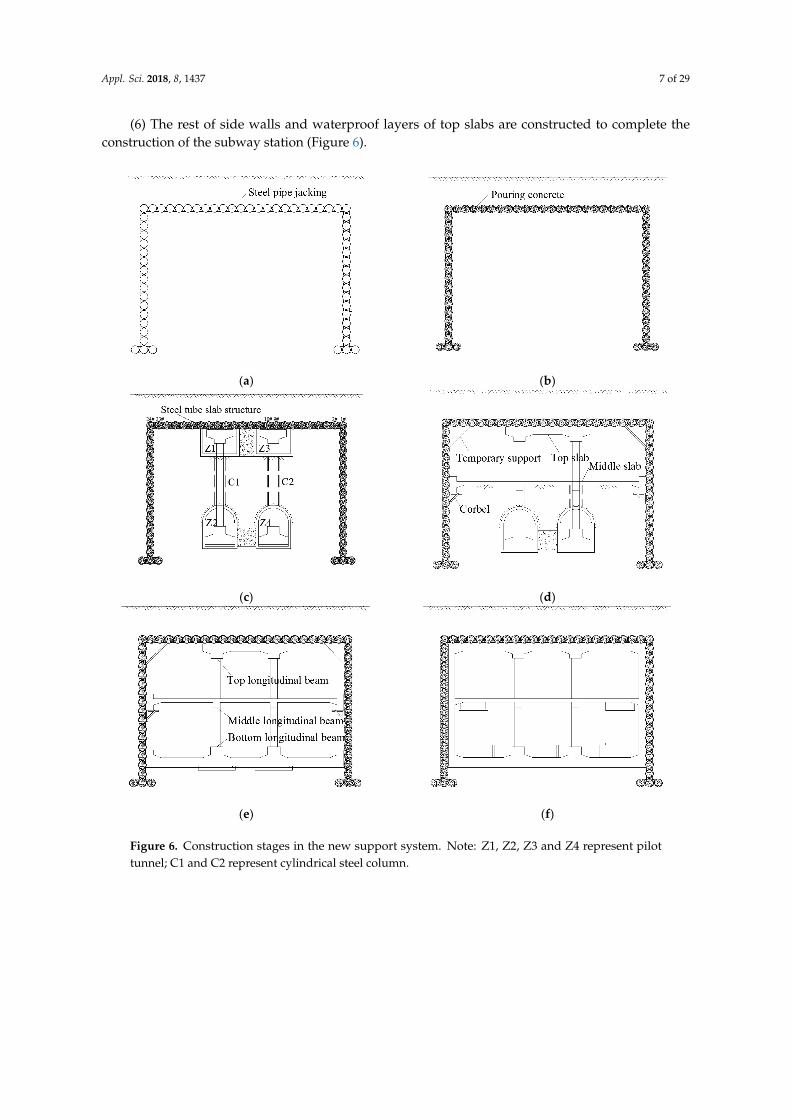
Several steps are involved in the construction of the proposed supporting structure based oncombination of STS and PBA methods. These steps are demonstrated in details in Figure 6.
(1) The steel tubes are pushed into the soil by the jacking machine, and then the soil inside thesteel tubes are extracted using horizontal directional drilling (Figure 6a).
(2) Lateral connecting bolts are installed between adjacent steel tubes by artificial operations.Blocking plate at both ends of the steel tubes are then installed, and concrete is poured throughgrouting holes on the blocking plates (Figure 6b).
(3) The top pilot tunnels (Z1) and bottom pilot tunnel (Z2) are then excavated, respectively. Thenthe cylindrical steel column (C1) is constructed. Then do the right parts (Z3, Z4 and C2) (Figure 6c).
(4) The inter grid of the top pilot tunnels is removed, and the waterproof layer at the top and themiddle floor slab are constructed. When the strength of the floor slab reaches to the 80% of the designstrength, the soil above the middle floor slab is excavated for the whole cross section of the station,followed by the construction of the middle longitudinal beams and side walls (Figure 6d).
(5) When the strength of the middle floor slabs and side walls of the station hall reach up to 80%of the design values, the soil from the middle span to the bottom slab is excavated. Followed by theconstruction of the waterproof layer and the bottom slab (Figure 6e).
Appl. Sci. 2018, 8, 1437 7 of 29
(6) The rest of side walls and waterproof layers of top slabs are constructed to complete theconstruction of the subway station (Figure 6).
Appl. Sci. 2017, 7, x 7 of 29
(5) When the strength of the middle floor slabs and side walls of the station hall reach up to 80% of the design values, the soil from the middle span to the bottom slab is excavated. Followed by the construction of the waterproof layer and the bottom slab (Figure 6e).
The rest of side walls and waterproof layers of top slabs are constructed to complete the construction of the subway station.
(a) (b)
(c) (d)
(e) (f)
Figure 6. Construction stages in the new support system. Note: Z1, Z2, Z3 and Z4 represent pilot tunnel; C1 and C2 represent cylindrical steel column. Figure 6. Construction stages in the new support system. Note: Z1, Z2, Z3 and Z4 represent pilottunnel; C1 and C2 represent cylindrical steel column.
Appl. Sci. 2018, 8, 1437 8 of 29
The characteristics of this construction method combining STS and PBA methods are as follows:(1) The support structure can be designed to have adequate bearing capacity to provide support
for the overburden pressure when soil below the structure is excavated. So other temporary supportsmay not be required resulting in a flexibility of the method and potential for wide applications.
(2) Not only can the proposed supporting system effectively control the soil surface deformation,but also the intensive temporary supports during excavation stage can be avoided owing to supportprovided by the cylindrical columns involved in the proposed technique.
(3) The proposed method results in a rectangular cross section for the excavated area, whichincreases the utilization of the underground space compared to the traditional arch formation.
3.2.2. Connection of Adjacent Steel Tube
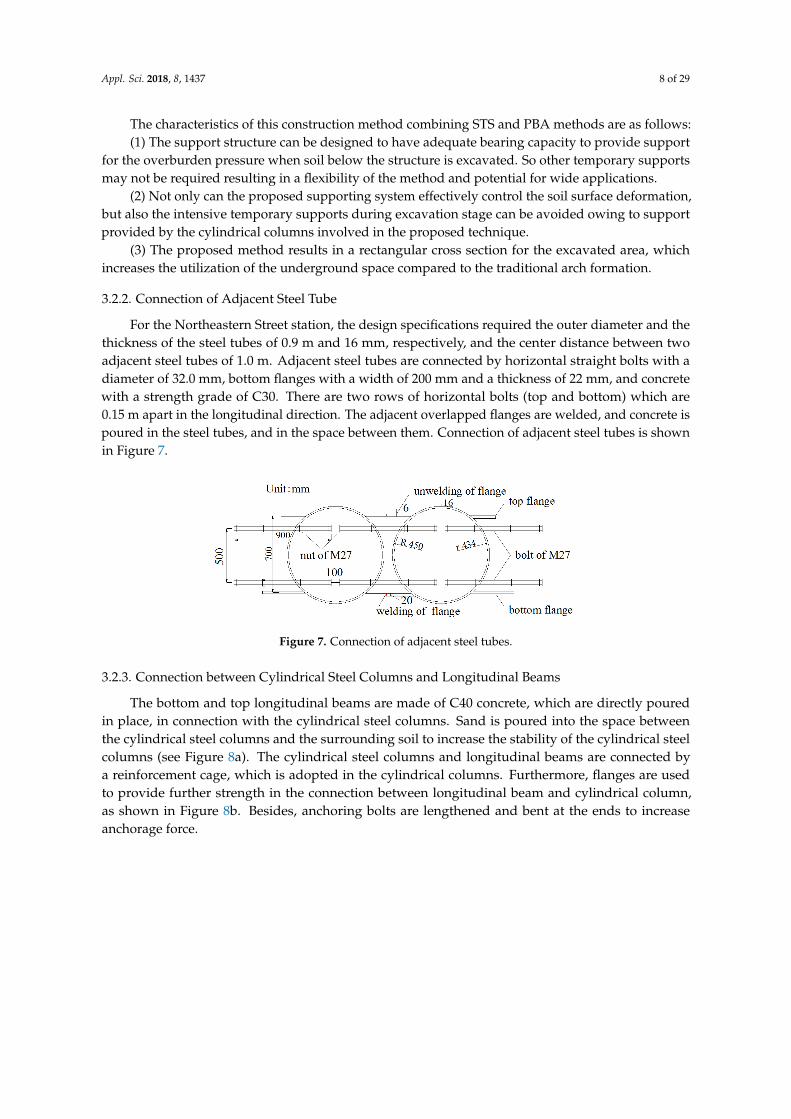
For the Northeastern Street station, the design specifications required the outer diameter and thethickness of the steel tubes of 0.9 m and 16 mm, respectively, and the center distance between twoadjacent steel tubes of 1.0 m. Adjacent steel tubes are connected by horizontal straight bolts with adiameter of 32.0 mm, bottom flanges with a width of 200 mm and a thickness of 22 mm, and concretewith a strength grade of C30. There are two rows of horizontal bolts (top and bottom) which are0.15 m apart in the longitudinal direction. The adjacent overlapped flanges are welded, and concrete ispoured in the steel tubes, and in the space between them. Connection of adjacent steel tubes is shownin Figure 7.
Appl. Sci. 2017, 7, x 8 of 29
The characteristics of this construction method combining STS and PBA methods are as follows: (1) The support structure can be designed to have adequate bearing capacity to provide support
for the overburden pressure when soil below the structure is excavated. So other temporary supports may not be required resulting in a flexibility of the method and potential for wide applications.
(2) Not only can the proposed supporting system effectively control the soil surface deformation, but also the intensive temporary supports during excavation stage can be avoided owing to support provided by the cylindrical columns involved in the proposed technique.
(3) The proposed method results in a rectangular cross section for the excavated area, which increases the utilization of the underground space compared to the traditional arch formation.
3.2.2. Connection of Adjacent Steel Tube
For the Northeastern Street station, the design specifications required the outer diameter and the thickness of the steel tubes of 0.9 m and 16 mm, respectively, and the center distance between two adjacent steel tubes of 1.0 m. Adjacent steel tubes are connected by horizontal straight bolts with a diameter of 32.0 mm, bottom flanges with a width of 200 mm and a thickness of 22 mm, and concrete with a strength grade of C30. There are two rows of horizontal bolts (top and bottom) which are 0.15 m apart in the longitudinal direction. The adjacent overlapped flanges are welded, and concrete is poured in the steel tubes, and in the space between them. Connection of adjacent steel tubes is shown in Figure 7.
Figure 7. Connection of adjacent steel tubes.
3.2.3. Connection between Cylindrical Steel Columns and Longitudinal Beams
The bottom and top longitudinal beams are made of C40 concrete, which are directly poured in place, in connection with the cylindrical steel columns. Sand is poured into the space between the cylindrical steel columns and the surrounding soil to increase the stability of the cylindrical steel columns (see Figure 8a). The cylindrical steel columns and longitudinal beams are connected by a reinforcement cage, which is adopted in the cylindrical columns. Furthermore, flanges are used to provide further strength in the connection between longitudinal beam and cylindrical column, as shown in Figure 8b. Besides, anchoring bolts are lengthened and bent at the ends to increase anchorage force.
Figure 7. Connection of adjacent steel tubes.
3.2.3. Connection between Cylindrical Steel Columns and Longitudinal Beams
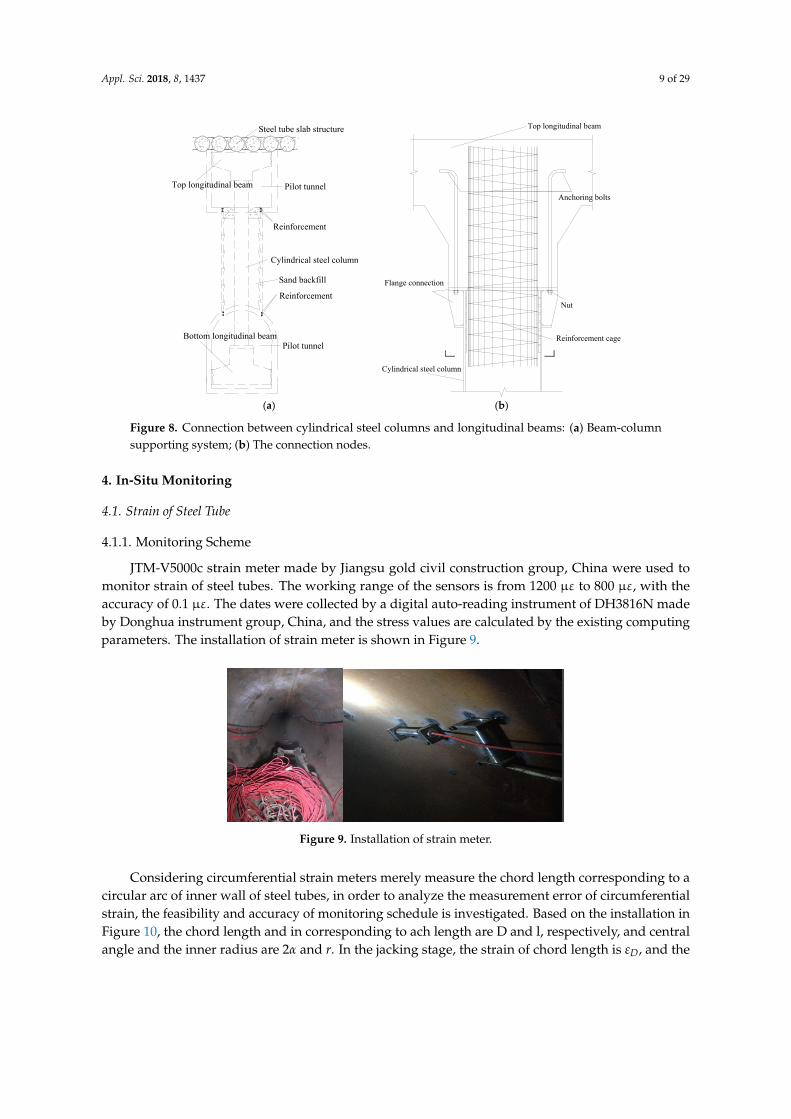
The bottom and top longitudinal beams are made of C40 concrete, which are directly pouredin place, in connection with the cylindrical steel columns. Sand is poured into the space betweenthe cylindrical steel columns and the surrounding soil to increase the stability of the cylindrical steelcolumns (see Figure 8a). The cylindrical steel columns and longitudinal beams are connected bya reinforcement cage, which is adopted in the cylindrical columns. Furthermore, flanges are usedto provide further strength in the connection between longitudinal beam and cylindrical column,as shown in Figure 8b. Besides, anchoring bolts are lengthened and bent at the ends to increaseanchorage force.
Appl. Sci. 2018, 8, 1437 9 of 29
Appl. Sci. 2017, 7, x 9 of 29
Steel tube slab structure
Pilot tunnelTop longitudinal beam
Pilot tunnelBottom longitudinal beam
Reinforcement
Sand backfill
Cylindrical steel column
Reinforcement
Top longitudinal beam
Anchoring bolts
Nut
Reinforcement cage
Cylindrical steel column
Flange connection
(a) (b)
Figure 8. Connection between cylindrical steel columns and longitudinal beams: (a) Beam-column supporting system; (b) The connection nodes.
4. In-Situ Monitoring
4.1. Strain of Steel Tube
4.1.1. Monitoring Scheme
JTM-V5000c strain meter made by Jiangsu gold civil construction group, China were used to monitor strain of steel tubes. The working range of the sensors is from 1200 με to 800 με, with the accuracy of 0.1 με. The dates were collected by a digital auto-reading instrument of DH3816N made by Donghua instrument group, China, and the stress values are calculated by the existing computing parameters. The installation of strain meter is shown in Figure 9.
Figure 9. Installation of strain meter.
Considering circumferential strain meters merely measure the chord length corresponding to a circular arc of inner wall of steel tubes, in order to analyze the measurement error of circumferential strain, the feasibility and accuracy of monitoring schedule is investigated. Based on the installation in Figure 10, the chord length and in corresponding to ach length are D and l, respectively, and central angle and the inner radius are 2α and r. In the jacking stage, the strain of chord length is εD, and the circumferential deformation and strain are Δl and εr. So, the relative error is calculated based on the Formula 1 [30].
Figure 8. Connection between cylindrical steel columns and longitudinal beams: (a) Beam-columnsupporting system; (b) The connection nodes.
4. In-Situ Monitoring
4.1. Strain of Steel Tube
4.1.1. Monitoring Scheme
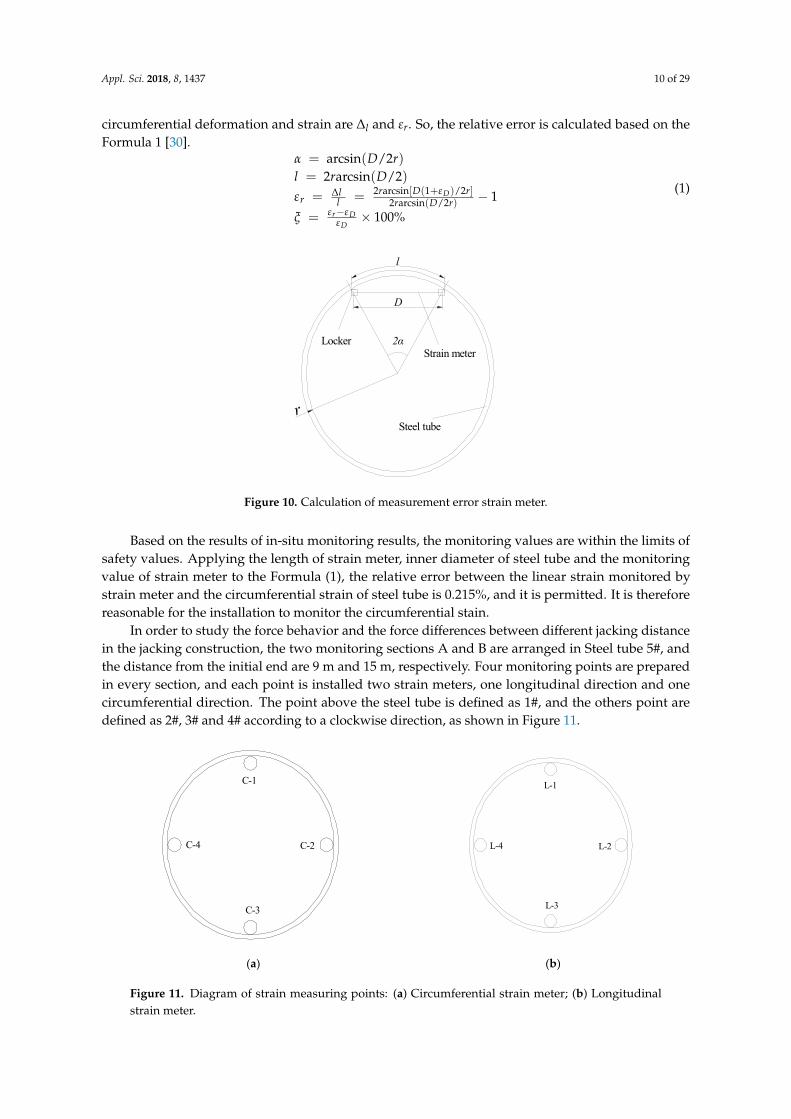
JTM-V5000c strain meter made by Jiangsu gold civil construction group, China were used tomonitor strain of steel tubes. The working range of the sensors is from 1200 µε to 800 µε, with theaccuracy of 0.1 µε. The dates were collected by a digital auto-reading instrument of DH3816N madeby Donghua instrument group, China, and the stress values are calculated by the existing computingparameters. The installation of strain meter is shown in Figure 9.
Appl. Sci. 2017, 7, x 9 of 29
Steel tube slab structure
Pilot tunnelTop longitudinal beam
Pilot tunnelBottom longitudinal beam
Reinforcement
Sand backfill
Cylindrical steel column
Reinforcement
Top longitudinal beam
Anchoring bolts
Nut
Reinforcement cage
Cylindrical steel column
Flange connection
(a) (b)
Figure 8. Connection between cylindrical steel columns and longitudinal beams: (a) Beam-column supporting system; (b) The connection nodes.
4. In-Situ Monitoring
4.1. Strain of Steel Tube
4.1.1. Monitoring Scheme
JTM-V5000c strain meter made by Jiangsu gold civil construction group, China were used to monitor strain of steel tubes. The working range of the sensors is from 1200 με to 800 με, with the accuracy of 0.1 με. The dates were collected by a digital auto-reading instrument of DH3816N made by Donghua instrument group, China, and the stress values are calculated by the existing computing parameters. The installation of strain meter is shown in Figure 9.
Figure 9. Installation of strain meter.
Considering circumferential strain meters merely measure the chord length corresponding to a circular arc of inner wall of steel tubes, in order to analyze the measurement error of circumferential strain, the feasibility and accuracy of monitoring schedule is investigated. Based on the installation in Figure 10, the chord length and in corresponding to ach length are D and l, respectively, and central angle and the inner radius are 2α and r. In the jacking stage, the strain of chord length is εD, and the circumferential deformation and strain are Δl and εr. So, the relative error is calculated based on the Formula 1 [30].
Figure 9. Installation of strain meter.
Considering circumferential strain meters merely measure the chord length corresponding to acircular arc of inner wall of steel tubes, in order to analyze the measurement error of circumferentialstrain, the feasibility and accuracy of monitoring schedule is investigated. Based on the installation inFigure 10, the chord length and in corresponding to ach length are D and l, respectively, and centralangle and the inner radius are 2α and r. In the jacking stage, the strain of chord length is εD, and the
Appl. Sci. 2018, 8, 1437 10 of 29
circumferential deformation and strain are ∆l and εr. So, the relative error is calculated based on theFormula 1 [30].
α = arcsin(D/2r)l = 2rarcsin(D/2)εr = ∆l
l = 2rarcsin[D(1+εD)/2r]2rarcsin(D/2r) − 1
ξ = εr−εDεD
× 100%
(1)
Appl. Sci. 2017, 7, x 10 of 29
arcsin( / 2 )
2 arcsin( / 2)
2 arcsin[ (1 ) / 2 ]1
2 arcsin( / 2 )
100%
Dr
r D
D
D rl r D
r D rll r D r
α
εε
ε εξε
==
+Δ= = −
−= ×
(1)
l
D
2αStrain meter
Locker
rSteel tube
Figure 10. Calculation of measurement error strain meter.
Based on the results of in-situ monitoring results, the monitoring values are within the limits of safety values. Applying the length of strain meter, inner diameter of steel tube and the monitoring value of strain meter to the Formula (1), the relative error between the linear strain monitored by strain meter and the circumferential strain of steel tube is 0.215%, and it is permitted. It is therefore reasonable for the installation to monitor the circumferential stain.
In order to study the force behavior and the force differences between different jacking distance in the jacking construction, the two monitoring sections A and B are arranged in Steel tube 5#, and the distance from the initial end are 9 m and 15 m, respectively. Four monitoring points are prepared in every section, and each point is installed two strain meters, one longitudinal direction and one circumferential direction. The point above the steel tube is defined as 1#, and the others point are defined as 2#, 3# and 4# according to a clockwise direction, as shown in Figure 11.
C-1
C-2
C-3
C-4
L-1
L-2
L-3
L-4
(a) (b)
Figure 11. Diagram of strain measuring points: (a) Circumferential strain meter; (b) Longitudinal strain meter.
Figure 10. Calculation of measurement error strain meter.
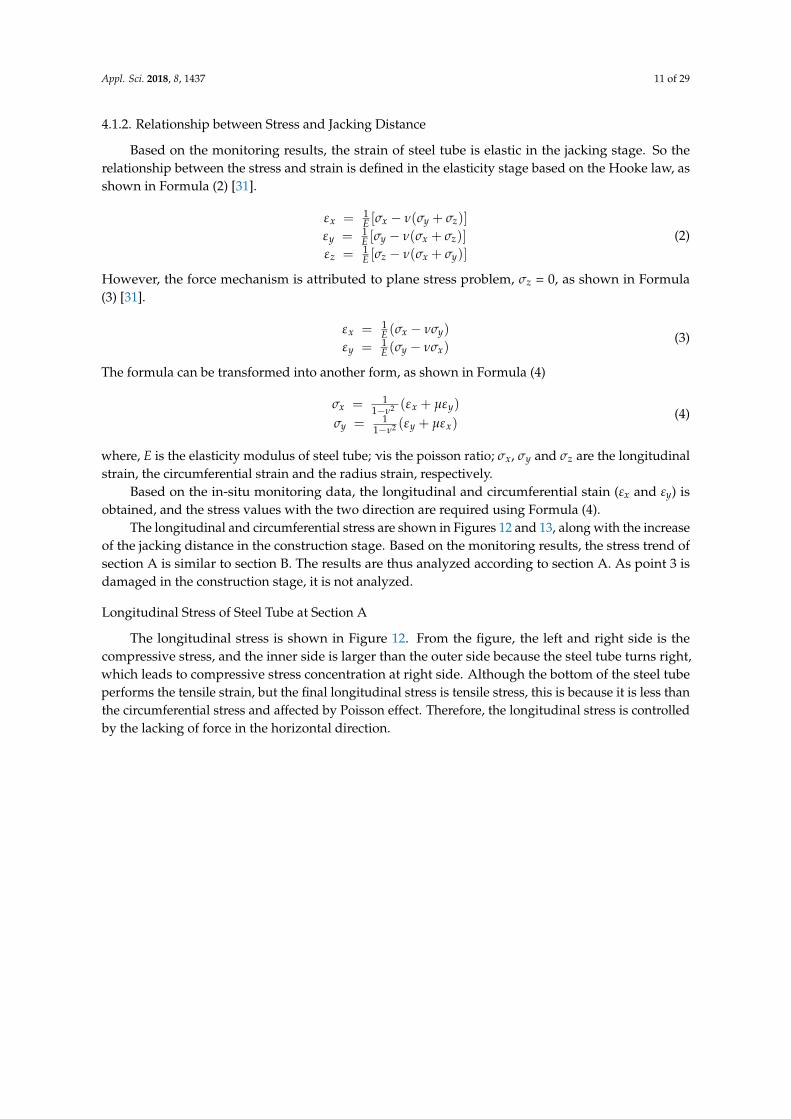
Based on the results of in-situ monitoring results, the monitoring values are within the limits ofsafety values. Applying the length of strain meter, inner diameter of steel tube and the monitoringvalue of strain meter to the Formula (1), the relative error between the linear strain monitored bystrain meter and the circumferential strain of steel tube is 0.215%, and it is permitted. It is thereforereasonable for the installation to monitor the circumferential stain.
In order to study the force behavior and the force differences between different jacking distancein the jacking construction, the two monitoring sections A and B are arranged in Steel tube 5#, andthe distance from the initial end are 9 m and 15 m, respectively. Four monitoring points are preparedin every section, and each point is installed two strain meters, one longitudinal direction and onecircumferential direction. The point above the steel tube is defined as 1#, and the others point aredefined as 2#, 3# and 4# according to a clockwise direction, as shown in Figure 11.
Appl. Sci. 2017, 7, x 10 of 29
arcsin( / 2 )
2 arcsin( / 2)
2 arcsin[ (1 ) / 2 ]1
2 arcsin( / 2 )
100%
Dr
r D
D
D rl r D
r D rll r D r
α
εε
ε εξε
==
+Δ= = −
−= ×
(1)
l
D
2αStrain meter
Locker
rSteel tube
Figure 10. Calculation of measurement error strain meter.
Based on the results of in-situ monitoring results, the monitoring values are within the limits of safety values. Applying the length of strain meter, inner diameter of steel tube and the monitoring value of strain meter to the Formula (1), the relative error between the linear strain monitored by strain meter and the circumferential strain of steel tube is 0.215%, and it is permitted. It is therefore reasonable for the installation to monitor the circumferential stain.
In order to study the force behavior and the force differences between different jacking distance in the jacking construction, the two monitoring sections A and B are arranged in Steel tube 5#, and the distance from the initial end are 9 m and 15 m, respectively. Four monitoring points are prepared in every section, and each point is installed two strain meters, one longitudinal direction and one circumferential direction. The point above the steel tube is defined as 1#, and the others point are defined as 2#, 3# and 4# according to a clockwise direction, as shown in Figure 11.
C-1
C-2
C-3
C-4
L-1
L-2
L-3
L-4
(a) (b)
Figure 11. Diagram of strain measuring points: (a) Circumferential strain meter; (b) Longitudinal strain meter.
Figure 11. Diagram of strain measuring points: (a) Circumferential strain meter; (b) Longitudinalstrain meter.
Appl. Sci. 2018, 8, 1437 11 of 29
4.1.2. Relationship between Stress and Jacking Distance
Based on the monitoring results, the strain of steel tube is elastic in the jacking stage. So therelationship between the stress and strain is defined in the elasticity stage based on the Hooke law, asshown in Formula (2) [31].
εx = 1E [σx − ν(σy + σz)]
εy = 1E [σy − ν(σx + σz)]
εz = 1E [σz − ν(σx + σy)]
(2)
However, the force mechanism is attributed to plane stress problem, σz = 0, as shown in Formula(3) [31].
εx = 1E (σx − νσy)
εy = 1E (σy − νσx)
(3)
The formula can be transformed into another form, as shown in Formula (4)
σx = 11−ν2 (εx + µεy)
σy = 11−ν2 (εy + µεx)
(4)
where, E is the elasticity modulus of steel tube; νis the poisson ratio; σx, σy and σz are the longitudinalstrain, the circumferential strain and the radius strain, respectively.
Based on the in-situ monitoring data, the longitudinal and circumferential stain (εx and εy) isobtained, and the stress values with the two direction are required using Formula (4).
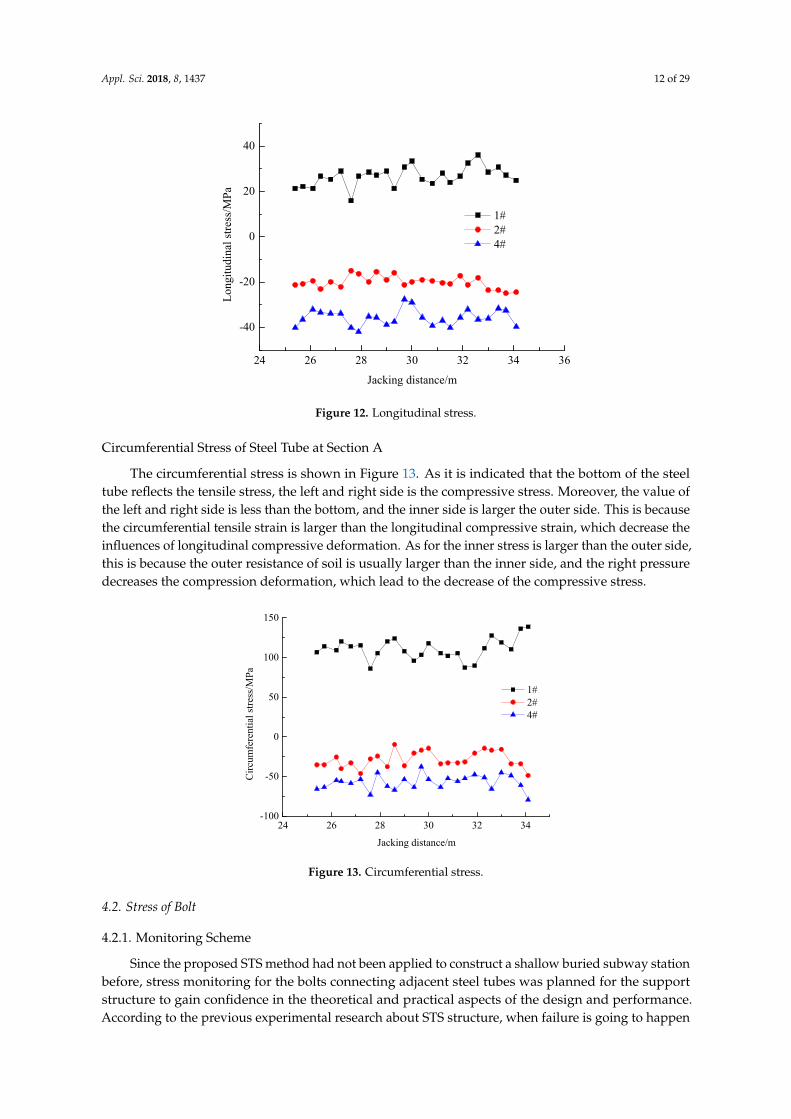
The longitudinal and circumferential stress are shown in Figures 12 and 13, along with the increaseof the jacking distance in the construction stage. Based on the monitoring results, the stress trend ofsection A is similar to section B. The results are thus analyzed according to section A. As point 3 isdamaged in the construction stage, it is not analyzed.
Longitudinal Stress of Steel Tube at Section A
The longitudinal stress is shown in Figure 12. From the figure, the left and right side is thecompressive stress, and the inner side is larger than the outer side because the steel tube turns right,which leads to compressive stress concentration at right side. Although the bottom of the steel tubeperforms the tensile strain, but the final longitudinal stress is tensile stress, this is because it is less thanthe circumferential stress and affected by Poisson effect. Therefore, the longitudinal stress is controlledby the lacking of force in the horizontal direction.
Appl. Sci. 2018, 8, 1437 12 of 29Appl. Sci. 2017, 7, x 12 of 29
24 26 28 30 32 34 36
-40
-20
0
20
40
Lon
gitu
dina
l str
ess/
MP
a
Jacking distance/m
1# 2# 4#
Figure 12. Longitudinal stress.
4.1.2.2. Circumferential Stress of Steel Tube at Section A The circumferential stress is shown in Figure 13. As it is indicated that the bottom of the steel
tube reflects the tensile stress, the left and right side is the compressive stress. Moreover, the value of the left and right side is less than the bottom, and the inner side is larger the outer side. This is because the circumferential tensile strain is larger than the longitudinal compressive strain, which decrease the influences of longitudinal compressive deformation. As for the inner stress is larger than the outer side, this is because the outer resistance of soil is usually larger than the inner side, and the right pressure decreases the compression deformation, which lead to the decrease of the compressive stress.
24 26 28 30 32 34-100
-50
0
50
100
150
Cir
cum
fere
ntia
l str
ess/
MPa
Jacking distance/m
1# 2# 4#
Figure 13. Circumferential stress.
4.2. Stress of Bolt
4.2.1. Monitoring Scheme
Since the proposed STS method had not been applied to construct a shallow buried subway station before, stress monitoring for the bolts connecting adjacent steel tubes was planned for the support structure to gain confidence in the theoretical and practical aspects of the design and performance. According to the previous experimental research about STS structure, when failure is
Figure 12. Longitudinal stress.
Circumferential Stress of Steel Tube at Section A
The circumferential stress is shown in Figure 13. As it is indicated that the bottom of the steeltube reflects the tensile stress, the left and right side is the compressive stress. Moreover, the value ofthe left and right side is less than the bottom, and the inner side is larger the outer side. This is becausethe circumferential tensile strain is larger than the longitudinal compressive strain, which decrease theinfluences of longitudinal compressive deformation. As for the inner stress is larger than the outer side,this is because the outer resistance of soil is usually larger than the inner side, and the right pressuredecreases the compression deformation, which lead to the decrease of the compressive stress.
Appl. Sci. 2017, 7, x 12 of 29
24 26 28 30 32 34 36
-40
-20
0
20
40
Lon
gitu
dina
l str
ess/
MP
a
Jacking distance/m
1# 2# 4#
Figure 12. Longitudinal stress.
4.1.2.2. Circumferential Stress of Steel Tube at Section A The circumferential stress is shown in Figure 13. As it is indicated that the bottom of the steel
tube reflects the tensile stress, the left and right side is the compressive stress. Moreover, the value of the left and right side is less than the bottom, and the inner side is larger the outer side. This is because the circumferential tensile strain is larger than the longitudinal compressive strain, which decrease the influences of longitudinal compressive deformation. As for the inner stress is larger than the outer side, this is because the outer resistance of soil is usually larger than the inner side, and the right pressure decreases the compression deformation, which lead to the decrease of the compressive stress.
24 26 28 30 32 34-100
-50
0
50
100
150
Cir
cum
fere
ntia
l str
ess/
MPa
Jacking distance/m
1# 2# 4#
Figure 13. Circumferential stress.
4.2. Stress of Bolt
4.2.1. Monitoring Scheme
Since the proposed STS method had not been applied to construct a shallow buried subway station before, stress monitoring for the bolts connecting adjacent steel tubes was planned for the support structure to gain confidence in the theoretical and practical aspects of the design and performance. According to the previous experimental research about STS structure, when failure is
Figure 13. Circumferential stress.
4.2. Stress of Bolt
4.2.1. Monitoring Scheme
Since the proposed STS method had not been applied to construct a shallow buried subway stationbefore, stress monitoring for the bolts connecting adjacent steel tubes was planned for the supportstructure to gain confidence in the theoretical and practical aspects of the design and performance.According to the previous experimental research about STS structure, when failure is going to happen
Appl. Sci. 2018, 8, 1437 13 of 29
for the component beams, the bolts are also damaged simultaneously [32]. So the construction risk canbe predicted by the bolts of field observation.
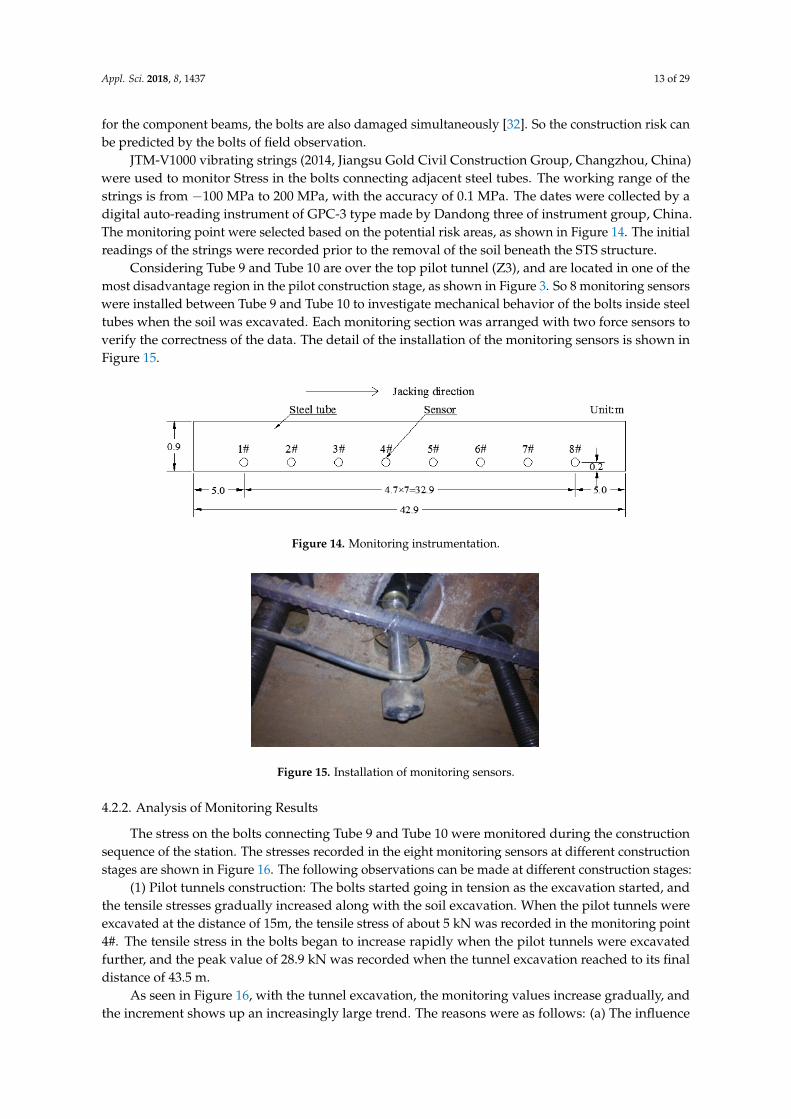
JTM-V1000 vibrating strings (2014, Jiangsu Gold Civil Construction Group, Changzhou, China)were used to monitor Stress in the bolts connecting adjacent steel tubes. The working range of thestrings is from −100 MPa to 200 MPa, with the accuracy of 0.1 MPa. The dates were collected by adigital auto-reading instrument of GPC-3 type made by Dandong three of instrument group, China.The monitoring point were selected based on the potential risk areas, as shown in Figure 14. The initialreadings of the strings were recorded prior to the removal of the soil beneath the STS structure.
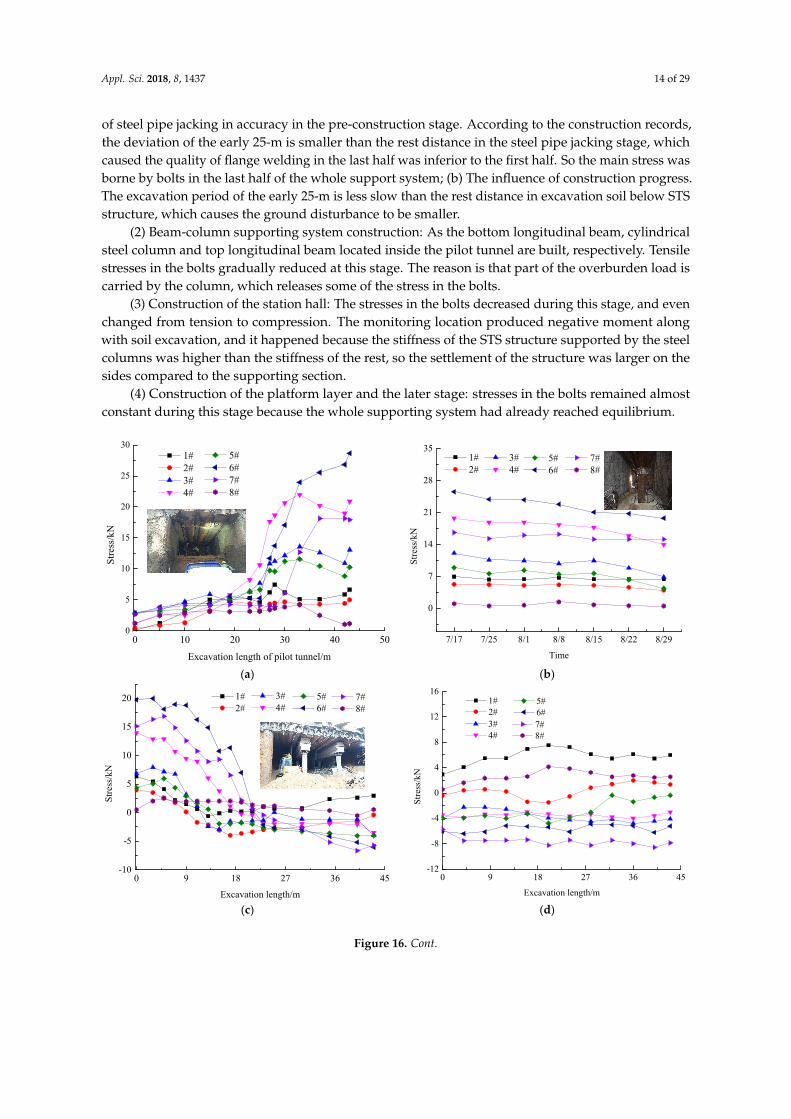
Considering Tube 9 and Tube 10 are over the top pilot tunnel (Z3), and are located in one of themost disadvantage region in the pilot construction stage, as shown in Figure 3. So 8 monitoring sensorswere installed between Tube 9 and Tube 10 to investigate mechanical behavior of the bolts inside steeltubes when the soil was excavated. Each monitoring section was arranged with two force sensors toverify the correctness of the data. The detail of the installation of the monitoring sensors is shown inFigure 15.
Appl. Sci. 2017, 7, x 13 of 29
going to happen for the component beams, the bolts are also damaged simultaneously [32]. So the construction risk can be predicted by the bolts of field observation.
JTM-V1000 vibrating strings (2014, Jiangsu Gold Civil Construction Group, Changzhou, China) were used to monitor Stress in the bolts connecting adjacent steel tubes. The working range of the strings is from −100 MPa to 200 MPa, with the accuracy of 0.1 MPa. The dates were collected by a digital auto-reading instrument of GPC-3 type made by Dandong three of instrument group, China. The monitoring point were selected based on the potential risk areas, as shown in Figure 14. The initial readings of the strings were recorded prior to the removal of the soil beneath the STS structure.
Considering Tube 9 and Tube 10 are over the top pilot tunnel (Z3), and are located in one of the most disadvantage region in the pilot construction stage, as shown in Figure 3. So 8 monitoring sensors were installed between Tube 9 and Tube 10 to investigate mechanical behavior of the bolts inside steel tubes when the soil was excavated. Each monitoring section was arranged with two force sensors to verify the correctness of the data. The detail of the installation of the monitoring sensors is shown in Figure 15.
Figure 14. Monitoring instrumentation.
Figure 15. Installation of monitoring sensors.
4.2.2. Analysis of Monitoring Results
The stress on the bolts connecting Tube 9 and Tube 10 were monitored during the construction sequence of the station. The stresses recorded in the eight monitoring sensors at different construction stages are shown in Figure 16. The following observations can be made at different construction stages:
(1) Pilot tunnels construction: The bolts started going in tension as the excavation started, and the tensile stresses gradually increased along with the soil excavation. When the pilot tunnels were excavated at the distance of 15m, the tensile stress of about 5 kN was recorded in the monitoring point 4#. The tensile stress in the bolts began to increase rapidly when the pilot tunnels were excavated further, and the peak value of 28.9 kN was recorded when the tunnel excavation reached to its final distance of 43.5 m.
As seen in Figure 16, with the tunnel excavation, the monitoring values increase gradually, and the increment shows up an increasingly large trend. The reasons were as follows: (a) The influence of steel pipe jacking in accuracy in the pre-construction stage. According to the construction records,
Figure 14. Monitoring instrumentation.
Appl. Sci. 2017, 7, x 13 of 29
going to happen for the component beams, the bolts are also damaged simultaneously [32]. So the construction risk can be predicted by the bolts of field observation.
JTM-V1000 vibrating strings (2014, Jiangsu Gold Civil Construction Group, Changzhou, China) were used to monitor Stress in the bolts connecting adjacent steel tubes. The working range of the strings is from −100 MPa to 200 MPa, with the accuracy of 0.1 MPa. The dates were collected by a digital auto-reading instrument of GPC-3 type made by Dandong three of instrument group, China. The monitoring point were selected based on the potential risk areas, as shown in Figure 14. The initial readings of the strings were recorded prior to the removal of the soil beneath the STS structure.
Considering Tube 9 and Tube 10 are over the top pilot tunnel (Z3), and are located in one of the most disadvantage region in the pilot construction stage, as shown in Figure 3. So 8 monitoring sensors were installed between Tube 9 and Tube 10 to investigate mechanical behavior of the bolts inside steel tubes when the soil was excavated. Each monitoring section was arranged with two force sensors to verify the correctness of the data. The detail of the installation of the monitoring sensors is shown in Figure 15.
Figure 14. Monitoring instrumentation.
Figure 15. Installation of monitoring sensors.
4.2.2. Analysis of Monitoring Results
The stress on the bolts connecting Tube 9 and Tube 10 were monitored during the construction sequence of the station. The stresses recorded in the eight monitoring sensors at different construction stages are shown in Figure 16. The following observations can be made at different construction stages:
(1) Pilot tunnels construction: The bolts started going in tension as the excavation started, and the tensile stresses gradually increased along with the soil excavation. When the pilot tunnels were excavated at the distance of 15m, the tensile stress of about 5 kN was recorded in the monitoring point 4#. The tensile stress in the bolts began to increase rapidly when the pilot tunnels were excavated further, and the peak value of 28.9 kN was recorded when the tunnel excavation reached to its final distance of 43.5 m.
As seen in Figure 16, with the tunnel excavation, the monitoring values increase gradually, and the increment shows up an increasingly large trend. The reasons were as follows: (a) The influence of steel pipe jacking in accuracy in the pre-construction stage. According to the construction records,
Figure 15. Installation of monitoring sensors.
4.2.2. Analysis of Monitoring Results
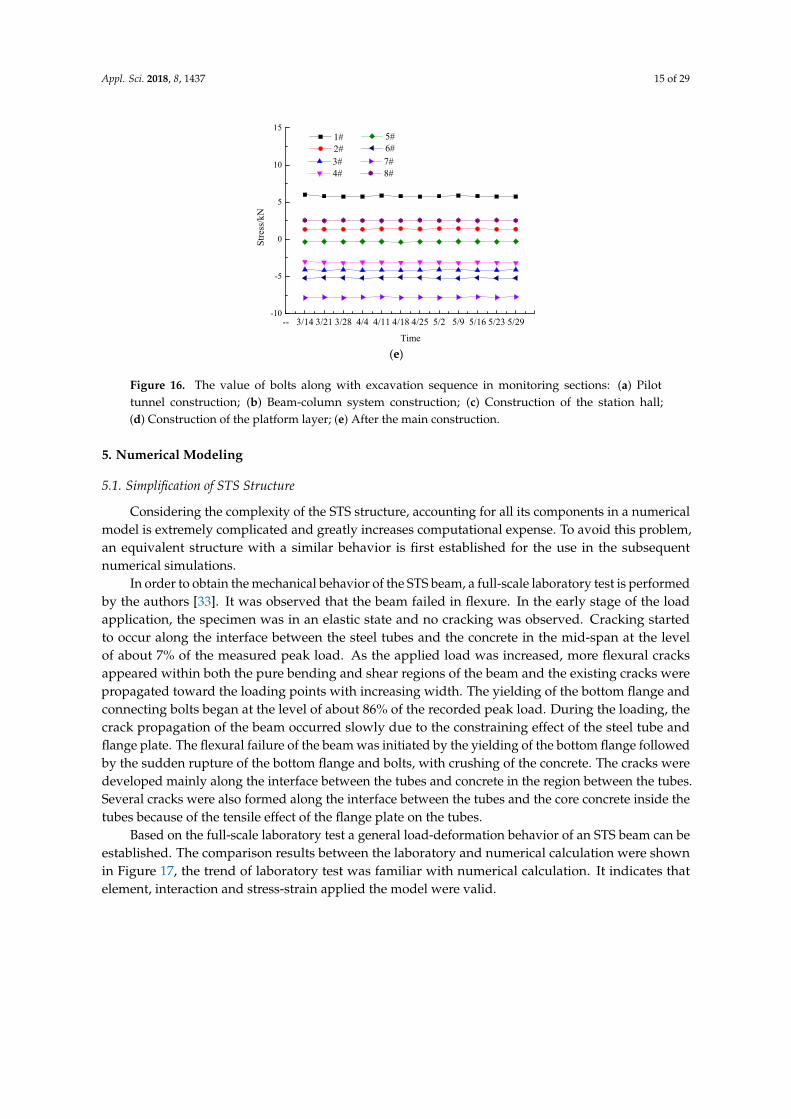
The stress on the bolts connecting Tube 9 and Tube 10 were monitored during the constructionsequence of the station. The stresses recorded in the eight monitoring sensors at different constructionstages are shown in Figure 16. The following observations can be made at different construction stages:
(1) Pilot tunnels construction: The bolts started going in tension as the excavation started, andthe tensile stresses gradually increased along with the soil excavation. When the pilot tunnels wereexcavated at the distance of 15m, the tensile stress of about 5 kN was recorded in the monitoring point4#. The tensile stress in the bolts began to increase rapidly when the pilot tunnels were excavatedfurther, and the peak value of 28.9 kN was recorded when the tunnel excavation reached to its finaldistance of 43.5 m.
As seen in Figure 16, with the tunnel excavation, the monitoring values increase gradually, andthe increment shows up an increasingly large trend. The reasons were as follows: (a) The influence
Appl. Sci. 2018, 8, 1437 14 of 29
of steel pipe jacking in accuracy in the pre-construction stage. According to the construction records,the deviation of the early 25-m is smaller than the rest distance in the steel pipe jacking stage, whichcaused the quality of flange welding in the last half was inferior to the first half. So the main stress wasborne by bolts in the last half of the whole support system; (b) The influence of construction progress.The excavation period of the early 25-m is less slow than the rest distance in excavation soil below STSstructure, which causes the ground disturbance to be smaller.
(2) Beam-column supporting system construction: As the bottom longitudinal beam, cylindricalsteel column and top longitudinal beam located inside the pilot tunnel are built, respectively. Tensilestresses in the bolts gradually reduced at this stage. The reason is that part of the overburden load iscarried by the column, which releases some of the stress in the bolts.
(3) Construction of the station hall: The stresses in the bolts decreased during this stage, and evenchanged from tension to compression. The monitoring location produced negative moment alongwith soil excavation, and it happened because the stiffness of the STS structure supported by the steelcolumns was higher than the stiffness of the rest, so the settlement of the structure was larger on thesides compared to the supporting section.
(4) Construction of the platform layer and the later stage: stresses in the bolts remained almostconstant during this stage because the whole supporting system had already reached equilibrium.
Appl. Sci. 2017, 7, x 14 of 29
the deviation of the early 25-m is smaller than the rest distance in the steel pipe jacking stage, which caused the quality of flange welding in the last half was inferior to the first half. So the main stress was borne by bolts in the last half of the whole support system; (b) The influence of construction progress. The excavation period of the early 25-m is less slow than the rest distance in excavation soil below STS structure, which causes the ground disturbance to be smaller.
(2) Beam-column supporting system construction: As the bottom longitudinal beam, cylindrical steel column and top longitudinal beam located inside the pilot tunnel are built, respectively. Tensile stresses in the bolts gradually reduced at this stage. The reason is that part of the overburden load is carried by the column, which releases some of the stress in the bolts.
(3) Construction of the station hall: The stresses in the bolts decreased during this stage, and even changed from tension to compression. The monitoring location produced negative moment along with soil excavation, and it happened because the stiffness of the STS structure supported by the steel columns was higher than the stiffness of the rest, so the settlement of the structure was larger on the sides compared to the supporting section.
(4) Construction of the platform layer and the later stage: stresses in the bolts remained almost constant during this stage because the whole supporting system had already reached equilibrium.
0 10 20 30 40 500
5
10
15
20
25
30 5# 6# 7# 8#
Str
ess/
kN
Excavation length of pilot tunnel/m
1# 2# 3# 4#
7/17 7/25 8/1 8/8 8/15 8/22 8/29
0
7
14
21
28
35 7# 8#
5# 6#
3# 4#
Stre
ss/k
N
Time
1# 2#
(a) (b)
0 9 18 27 36 45-10
-5
0
5
10
15
20 7# 8#
5# 6#
3# 4#
Str
ess/
kN
Excavation length/m
1# 2#
0 9 18 27 36 45
-12
-8
-4
0
4
8
12
16
7# 8#
5# 6#
3# 4#
Str
ess/
kN
Excavation length/m
1# 2#
(c) (d)
Figure 16. Cont.
Appl. Sci. 2018, 8, 1437 15 of 29
Appl. Sci. 2017, 7, x 15 of 29
-- 3/14 3/21 3/28 4/4 4/11 4/18 4/25 5/2 5/9 5/16 5/23 5/29-10
-5
0
5
10
15
7# 8#
5# 6#
3# 4#
Str
ess/
kN
Time
1# 2#
(e)
Figure 16. The value of bolts along with excavation sequence in monitoring sections: (a) Pilot tunnel construction; (b) Beam-column system construction; (c) Construction of the station hall; (d) Construction of the platform layer; (e) After the main construction.
5. Numerical Modeling
5.1. Simplification of STS Structure
Considering the complexity of the STS structure, accounting for all its components in a numerical model is extremely complicated and greatly increases computational expense. To avoid this problem, an equivalent structure with a similar behavior is first established for the use in the subsequent numerical simulations.
In order to obtain the mechanical behavior of the STS beam, a full-scale laboratory test is performed by the authors [33]. It was observed that the beam failed in flexure. In the early stage of the load application, the specimen was in an elastic state and no cracking was observed. Cracking started to occur along the interface between the steel tubes and the concrete in the mid-span at the level of about 7% of the measured peak load. As the applied load was increased, more flexural cracks appeared within both the pure bending and shear regions of the beam and the existing cracks were propagated toward the loading points with increasing width. The yielding of the bottom flange and connecting bolts began at the level of about 86% of the recorded peak load. During the loading, the crack propagation of the beam occurred slowly due to the constraining effect of the steel tube and flange plate. The flexural failure of the beam was initiated by the yielding of the bottom flange followed by the sudden rupture of the bottom flange and bolts, with crushing of the concrete. The cracks were developed mainly along the interface between the tubes and concrete in the region between the tubes. Several cracks were also formed along the interface between the tubes and the core concrete inside the tubes because of the tensile effect of the flange plate on the tubes.
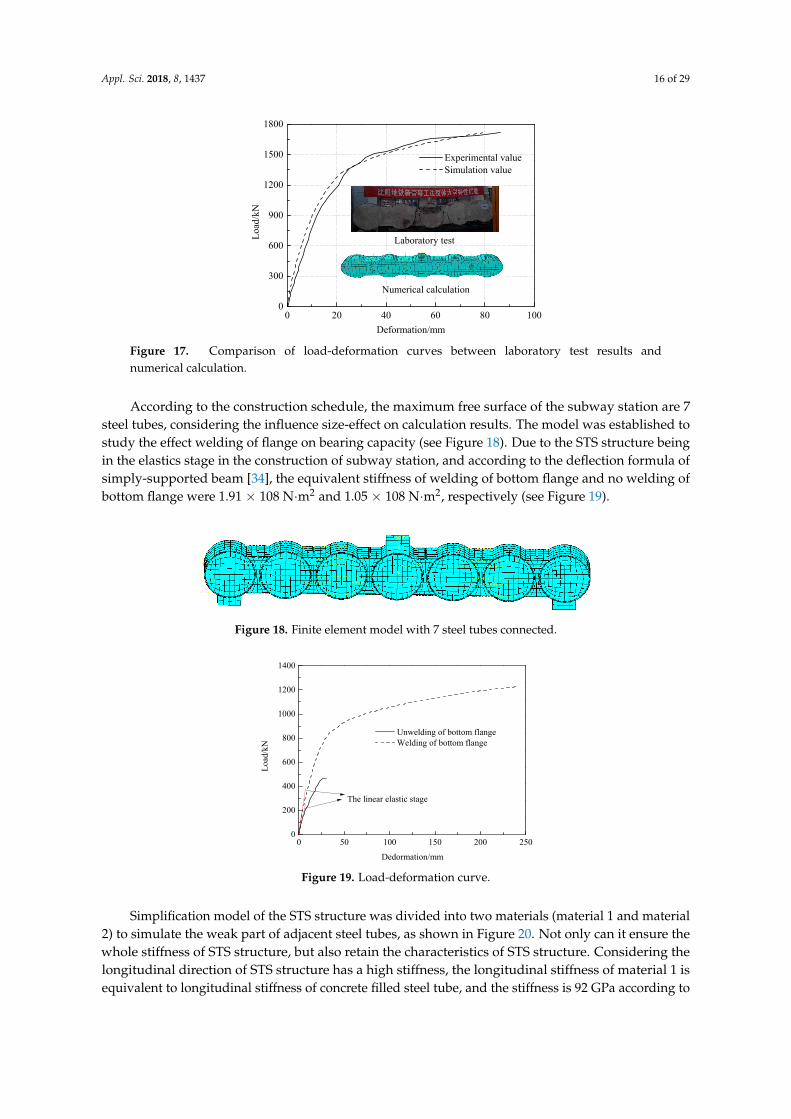
Based on the full-scale laboratory test a general load-deformation behavior of an STS beam can be established. The comparison results between the laboratory and numerical calculation were shown in Figure 17, the trend of laboratory test was familiar with numerical calculation. It indicates that element, interaction and stress-strain applied the model were valid.
Figure 16. The value of bolts along with excavation sequence in monitoring sections: (a) Pilottunnel construction; (b) Beam-column system construction; (c) Construction of the station hall;(d) Construction of the platform layer; (e) After the main construction.
5. Numerical Modeling
5.1. Simplification of STS Structure
Considering the complexity of the STS structure, accounting for all its components in a numericalmodel is extremely complicated and greatly increases computational expense. To avoid this problem,an equivalent structure with a similar behavior is first established for the use in the subsequentnumerical simulations.
In order to obtain the mechanical behavior of the STS beam, a full-scale laboratory test is performedby the authors [33]. It was observed that the beam failed in flexure. In the early stage of the loadapplication, the specimen was in an elastic state and no cracking was observed. Cracking startedto occur along the interface between the steel tubes and the concrete in the mid-span at the levelof about 7% of the measured peak load. As the applied load was increased, more flexural cracksappeared within both the pure bending and shear regions of the beam and the existing cracks werepropagated toward the loading points with increasing width. The yielding of the bottom flange andconnecting bolts began at the level of about 86% of the recorded peak load. During the loading, thecrack propagation of the beam occurred slowly due to the constraining effect of the steel tube andflange plate. The flexural failure of the beam was initiated by the yielding of the bottom flange followedby the sudden rupture of the bottom flange and bolts, with crushing of the concrete. The cracks weredeveloped mainly along the interface between the tubes and concrete in the region between the tubes.Several cracks were also formed along the interface between the tubes and the core concrete inside thetubes because of the tensile effect of the flange plate on the tubes.
Based on the full-scale laboratory test a general load-deformation behavior of an STS beam can beestablished. The comparison results between the laboratory and numerical calculation were shownin Figure 17, the trend of laboratory test was familiar with numerical calculation. It indicates thatelement, interaction and stress-strain applied the model were valid.
Appl. Sci. 2018, 8, 1437 16 of 29
Appl. Sci. 2017, 7, x 16 of 29
0 20 40 60 80 1000
300
600
900
1200
1500
1800
Numerical calculation
Loa
d/kN
Deformation/mm
Experimental value Simulation value
Laboratory test
Figure 17. Comparison of load-deformation curves between laboratory test results and numerical calculation.
According to the construction schedule, the maximum free surface of the subway station are 7 steel tubes, considering the influence size-effect on calculation results. The model was established to study the effect welding of flange on bearing capacity (see Figure 18). Due to the STS structure being in the elastics stage in the construction of subway station, and according to the deflection formula of simply-supported beam [34], the equivalent stiffness of welding of bottom flange and no welding of bottom flange were 1.91 × 10⁸ N·m2 and 1.05 × 10⁸ N·m2, respectively (see Figure 19).
Figure 18. Finite element model with 7 steel tubes connected.
0 50 100 150 200 2500
200
400
600
800
1000
1200
1400
Loa
d/kN
Dedormation/mm
Unwelding of bottom flange Welding of bottom flange
The linear elastic stage
Figure 19. Load-deformation curve.
Simplification model of the STS structure was divided into two materials (material 1 and material 2) to simulate the weak part of adjacent steel tubes, as shown in Figure 20. Not only can it ensure the whole stiffness of STS structure, but also retain the characteristics of STS structure. Considering the longitudinal direction of STS structure has a high stiffness, the longitudinal stiffness of material 1 is equivalent to longitudinal stiffness of concrete filled steel tube, and the stiffness is 92
Figure 17. Comparison of load-deformation curves between laboratory test results andnumerical calculation.
According to the construction schedule, the maximum free surface of the subway station are 7steel tubes, considering the influence size-effect on calculation results. The model was established tostudy the effect welding of flange on bearing capacity (see Figure 18). Due to the STS structure beingin the elastics stage in the construction of subway station, and according to the deflection formula ofsimply-supported beam [34], the equivalent stiffness of welding of bottom flange and no welding ofbottom flange were 1.91 × 10⁸ N·m2 and 1.05 × 10⁸ N·m2, respectively (see Figure 19).
Appl. Sci. 2017, 7, x 16 of 29
0 20 40 60 80 1000
300
600
900
1200
1500
1800
Numerical calculation
Loa
d/kN
Deformation/mm
Experimental value Simulation value
Laboratory test
Figure 17. Comparison of load-deformation curves between laboratory test results and numerical calculation.
According to the construction schedule, the maximum free surface of the subway station are 7 steel tubes, considering the influence size-effect on calculation results. The model was established to study the effect welding of flange on bearing capacity (see Figure 18). Due to the STS structure being in the elastics stage in the construction of subway station, and according to the deflection formula of simply-supported beam [34], the equivalent stiffness of welding of bottom flange and no welding of bottom flange were 1.91 × 10⁸ N·m2 and 1.05 × 10⁸ N·m2, respectively (see Figure 19).
Figure 18. Finite element model with 7 steel tubes connected.
0 50 100 150 200 2500
200
400
600
800
1000
1200
1400
Loa
d/kN
Dedormation/mm
Unwelding of bottom flange Welding of bottom flange
The linear elastic stage
Figure 19. Load-deformation curve.
Simplification model of the STS structure was divided into two materials (material 1 and material 2) to simulate the weak part of adjacent steel tubes, as shown in Figure 20. Not only can it ensure the whole stiffness of STS structure, but also retain the characteristics of STS structure. Considering the longitudinal direction of STS structure has a high stiffness, the longitudinal stiffness of material 1 is equivalent to longitudinal stiffness of concrete filled steel tube, and the stiffness is 92
Figure 18. Finite element model with 7 steel tubes connected.
Appl. Sci. 2017, 7, x 16 of 29
0 20 40 60 80 1000
300
600
900
1200
1500
1800
Numerical calculation
Loa
d/kN
Deformation/mm
Experimental value Simulation value
Laboratory test
Figure 17. Comparison of load-deformation curves between laboratory test results and numerical calculation.
According to the construction schedule, the maximum free surface of the subway station are 7 steel tubes, considering the influence size-effect on calculation results. The model was established to study the effect welding of flange on bearing capacity (see Figure 18). Due to the STS structure being in the elastics stage in the construction of subway station, and according to the deflection formula of simply-supported beam [34], the equivalent stiffness of welding of bottom flange and no welding of bottom flange were 1.91 × 10⁸ N·m2 and 1.05 × 10⁸ N·m2, respectively (see Figure 19).
Figure 18. Finite element model with 7 steel tubes connected.
0 50 100 150 200 2500
200
400
600
800
1000
1200
1400
Loa
d/kN
Dedormation/mm
Unwelding of bottom flange Welding of bottom flange
The linear elastic stage
Figure 19. Load-deformation curve.
Simplification model of the STS structure was divided into two materials (material 1 and material 2) to simulate the weak part of adjacent steel tubes, as shown in Figure 20. Not only can it ensure the whole stiffness of STS structure, but also retain the characteristics of STS structure. Considering the longitudinal direction of STS structure has a high stiffness, the longitudinal stiffness of material 1 is equivalent to longitudinal stiffness of concrete filled steel tube, and the stiffness is 92
Figure 19. Load-deformation curve.
Simplification model of the STS structure was divided into two materials (material 1 and material2) to simulate the weak part of adjacent steel tubes, as shown in Figure 20. Not only can it ensure thewhole stiffness of STS structure, but also retain the characteristics of STS structure. Considering thelongitudinal direction of STS structure has a high stiffness, the longitudinal stiffness of material 1 isequivalent to longitudinal stiffness of concrete filled steel tube, and the stiffness is 92 GPa according to
Appl. Sci. 2018, 8, 1437 17 of 29
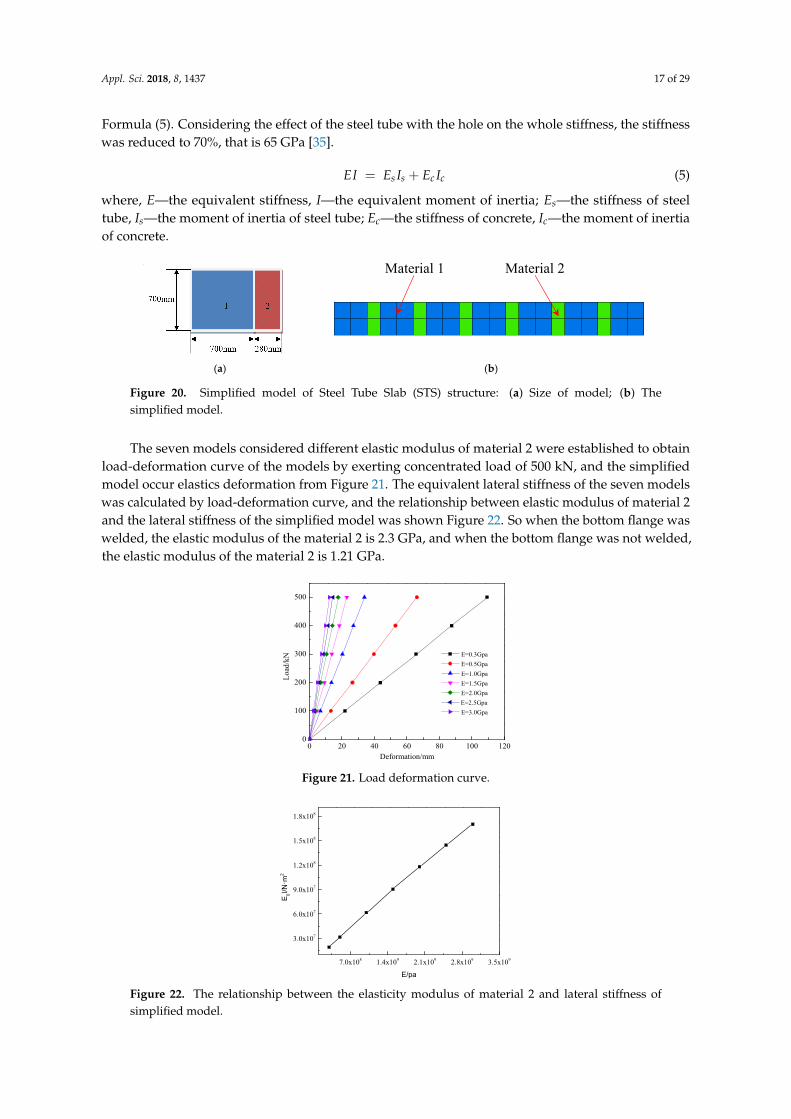
Formula (5). Considering the effect of the steel tube with the hole on the whole stiffness, the stiffnesswas reduced to 70%, that is 65 GPa [35].
EI = Es Is + Ec Ic (5)
where, E—the equivalent stiffness, I—the equivalent moment of inertia; Es—the stiffness of steeltube, Is—the moment of inertia of steel tube; Ec—the stiffness of concrete, Ic—the moment of inertiaof concrete.
Appl. Sci. 2017, 7, x 17 of 29
GPa according to Formula (5). Considering the effect of the steel tube with the hole on the whole stiffness, the stiffness was reduced to 70%, that is 65 GPa [35].
s s c cEI E I E I= + (5)
where, E—the equivalent stiffness, I—the equivalent moment of inertia; Es—the stiffness of steel tube, Is—the moment of inertia of steel tube; Ec—the stiffness of concrete, Ic—the moment of inertia of concrete.
(a) (b)
Figure 20. Simplified model of Steel Tube Slab (STS) structure: (a) Size of model; (b) The simplified model.
The seven models considered different elastic modulus of material 2 were established to obtain load-deformation curve of the models by exerting concentrated load of 500 kN, and the simplified model occur elastics deformation from Figure 21. The equivalent lateral stiffness of the seven models was calculated by load-deformation curve, and the relationship between elastic modulus of material 2 and the lateral stiffness of the simplified model was shown Figure 22. So when the bottom flange was welded, the elastic modulus of the material 2 is 2.3 GPa, and when the bottom flange was not welded, the elastic modulus of the material 2 is 1.21 GPa.
0 20 40 60 80 100 1200
100
200
300
400
500
Loa
d/kN
Deformation/mm
E=0.3Gpa
E=0.5Gpa
E=1.0Gpa
E=1.5Gpa
E=2.0Gpa
E=2.5Gpa
E=3.0Gpa
Figure 21. Load deformation curve.
7.0x10⁸ 1.4x10⁹ 2.1x10⁹ 2.8x10⁹ 3.5x10⁹
3.0x10⁷
6.0x10⁷
9.0x10⁷
1.2x10⁸
1.5x10⁸
1.8x10⁸
E0I/
N·m
2
E/pa
Figure 22. The relationship between the elasticity modulus of material 2 and lateral stiffness of simplified model.
Material 1 Material 2
Figure 20. Simplified model of Steel Tube Slab (STS) structure: (a) Size of model; (b) Thesimplified model.
The seven models considered different elastic modulus of material 2 were established to obtainload-deformation curve of the models by exerting concentrated load of 500 kN, and the simplifiedmodel occur elastics deformation from Figure 21. The equivalent lateral stiffness of the seven modelswas calculated by load-deformation curve, and the relationship between elastic modulus of material 2and the lateral stiffness of the simplified model was shown Figure 22. So when the bottom flange waswelded, the elastic modulus of the material 2 is 2.3 GPa, and when the bottom flange was not welded,the elastic modulus of the material 2 is 1.21 GPa.
Appl. Sci. 2017, 7, x 17 of 29
GPa according to Formula (5). Considering the effect of the steel tube with the hole on the whole stiffness, the stiffness was reduced to 70%, that is 65 GPa [35].
s s c cEI E I E I= + (5)
where, E—the equivalent stiffness, I—the equivalent moment of inertia; Es—the stiffness of steel tube, Is—the moment of inertia of steel tube; Ec—the stiffness of concrete, Ic—the moment of inertia of concrete.
(a) (b)
Figure 20. Simplified model of Steel Tube Slab (STS) structure: (a) Size of model; (b) The simplified model.
The seven models considered different elastic modulus of material 2 were established to obtain load-deformation curve of the models by exerting concentrated load of 500 kN, and the simplified model occur elastics deformation from Figure 21. The equivalent lateral stiffness of the seven models was calculated by load-deformation curve, and the relationship between elastic modulus of material 2 and the lateral stiffness of the simplified model was shown Figure 22. So when the bottom flange was welded, the elastic modulus of the material 2 is 2.3 GPa, and when the bottom flange was not welded, the elastic modulus of the material 2 is 1.21 GPa.
0 20 40 60 80 100 1200
100
200
300
400
500
Loa
d/kN
Deformation/mm
E=0.3Gpa
E=0.5Gpa
E=1.0Gpa
E=1.5Gpa
E=2.0Gpa
E=2.5Gpa
E=3.0Gpa
Figure 21. Load deformation curve.
7.0x10⁸ 1.4x10⁹ 2.1x10⁹ 2.8x10⁹ 3.5x10⁹
3.0x10⁷
6.0x10⁷
9.0x10⁷
1.2x10⁸
1.5x10⁸
1.8x10⁸
E0I/
N·m
2
E/pa
Figure 22. The relationship between the elasticity modulus of material 2 and lateral stiffness of simplified model.
Material 1 Material 2
Figure 21. Load deformation curve.
Appl. Sci. 2017, 7, x 17 of 29
GPa according to Formula (5). Considering the effect of the steel tube with the hole on the whole stiffness, the stiffness was reduced to 70%, that is 65 GPa [35].
s s c cEI E I E I= + (5)
where, E—the equivalent stiffness, I—the equivalent moment of inertia; Es—the stiffness of steel tube, Is—the moment of inertia of steel tube; Ec—the stiffness of concrete, Ic—the moment of inertia of concrete.
(a) (b)
Figure 20. Simplified model of Steel Tube Slab (STS) structure: (a) Size of model; (b) The simplified model.
The seven models considered different elastic modulus of material 2 were established to obtain load-deformation curve of the models by exerting concentrated load of 500 kN, and the simplified model occur elastics deformation from Figure 21. The equivalent lateral stiffness of the seven models was calculated by load-deformation curve, and the relationship between elastic modulus of material 2 and the lateral stiffness of the simplified model was shown Figure 22. So when the bottom flange was welded, the elastic modulus of the material 2 is 2.3 GPa, and when the bottom flange was not welded, the elastic modulus of the material 2 is 1.21 GPa.
0 20 40 60 80 100 1200
100
200
300
400
500
Loa
d/kN
Deformation/mm
E=0.3Gpa
E=0.5Gpa
E=1.0Gpa
E=1.5Gpa
E=2.0Gpa
E=2.5Gpa
E=3.0Gpa
Figure 21. Load deformation curve.
7.0x10⁸ 1.4x10⁹ 2.1x10⁹ 2.8x10⁹ 3.5x10⁹
3.0x10⁷
6.0x10⁷
9.0x10⁷
1.2x10⁸
1.5x10⁸
1.8x10⁸
E0I/
N·m
2
E/pa
Figure 22. The relationship between the elasticity modulus of material 2 and lateral stiffness of simplified model.
Material 1 Material 2
Figure 22. The relationship between the elasticity modulus of material 2 and lateral stiffness ofsimplified model.
Appl. Sci. 2018, 8, 1437 18 of 29
5.2. Model and Material Properties
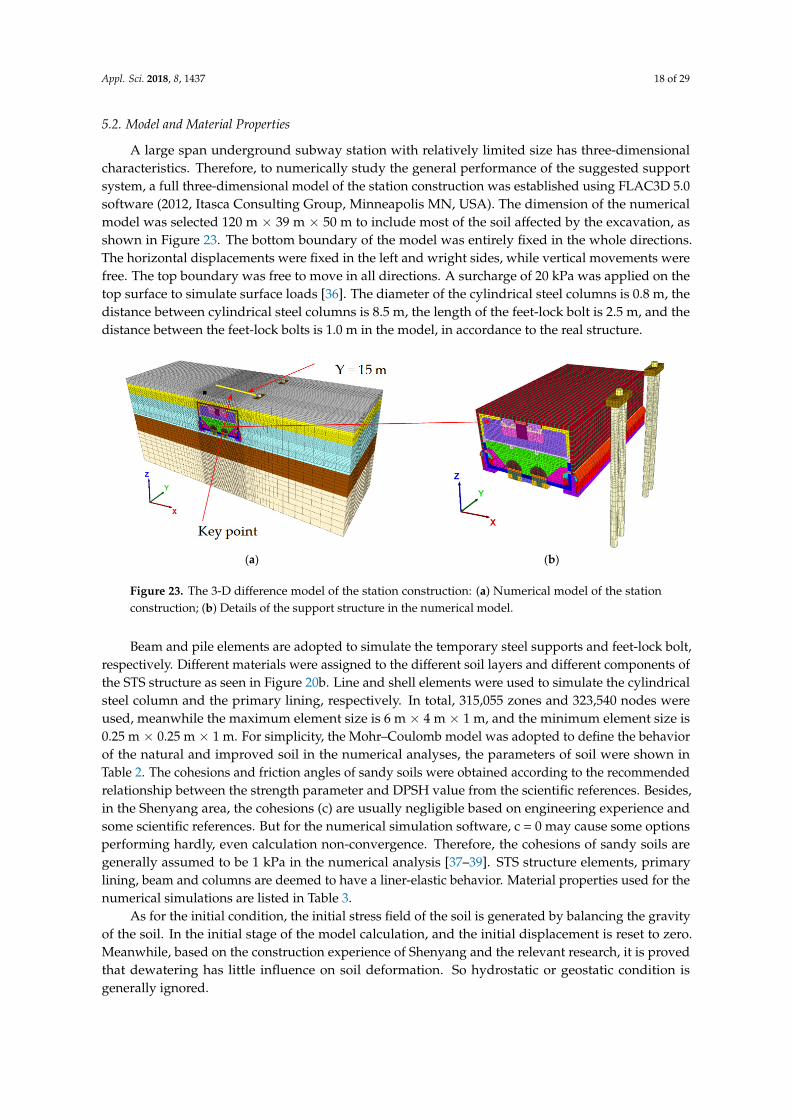
A large span underground subway station with relatively limited size has three-dimensionalcharacteristics. Therefore, to numerically study the general performance of the suggested supportsystem, a full three-dimensional model of the station construction was established using FLAC3D 5.0software (2012, Itasca Consulting Group, Minneapolis MN, USA). The dimension of the numericalmodel was selected 120 m × 39 m × 50 m to include most of the soil affected by the excavation, asshown in Figure 23. The bottom boundary of the model was entirely fixed in the whole directions.The horizontal displacements were fixed in the left and wright sides, while vertical movements werefree. The top boundary was free to move in all directions. A surcharge of 20 kPa was applied on thetop surface to simulate surface loads [36]. The diameter of the cylindrical steel columns is 0.8 m, thedistance between cylindrical steel columns is 8.5 m, the length of the feet-lock bolt is 2.5 m, and thedistance between the feet-lock bolts is 1.0 m in the model, in accordance to the real structure.
Appl. Sci. 2017, 7, x 18 of 29
5.2. Model and Material Properties
A large span underground subway station with relatively limited size has three-dimensional characteristics. Therefore, to numerically study the general performance of the suggested support system, a full three-dimensional model of the station construction was established using FLAC3D 5.0 software (2012, Itasca Consulting Group, Minneapolis MN, USA). The dimension of the numerical model was selected 120 m × 39 m × 50 m to include most of the soil affected by the excavation, as shown in Figure 23. The bottom boundary of the model was entirely fixed in the whole directions. The horizontal displacements were fixed in the left and wright sides, while vertical movements were free. The top boundary was free to move in all directions. A surcharge of 20 kPa was applied on the top surface to simulate surface loads [36]. The diameter of the cylindrical steel columns is 0.8 m, the distance between cylindrical steel columns is 8.5 m, the length of the feet-lock bolt is 2.5 m, and the distance between the feet-lock bolts is 1.0 m in the model, in accordance to the real structure.
(a) (b)
Figure 23. The 3-D difference model of the station construction: (a) Numerical model of the station construction; (b) Details of the support structure in the numerical model.
Beam and pile elements are adopted to simulate the temporary steel supports and feet-lock bolt, respectively. Different materials were assigned to the different soil layers and different components of the STS structure as seen in Figure 20b. Line and shell elements were used to simulate the cylindrical steel column and the primary lining, respectively. In total, 315,055 zones and 323,540 nodes were used, meanwhile the maximum element size is 6 m × 4 m × 1 m, and the minimum element size is 0.25 m × 0.25 m × 1 m. For simplicity, the Mohr–Coulomb model was adopted to define the behavior of the natural and improved soil in the numerical analyses, the parameters of soil were shown in Table 2. The cohesions and friction angles of sandy soils were obtained according to the recommended relationship between the strength parameter and DPSH value from the scientific references. Besides, in the Shenyang area, the cohesions (c) are usually negligible based on engineering experience and some scientific references. But for the numerical simulation software, c = 0 may cause some options performing hardly, even calculation non-convergence. Therefore, the cohesions of sandy soils are generally assumed to be 1 kPa in the numerical analysis [37–39]. STS structure elements, primary lining, beam and columns are deemed to have a liner-elastic behavior. Material properties used for the numerical simulations are listed in Table 3.
As for the initial condition, the initial stress field of the soil is generated by balancing the gravity of the soil. In the initial stage of the model calculation, and the initial displacement is reset to zero. Meanwhile, based on the construction experience of Shenyang and the relevant research, it is proved that dewatering has little influence on soil deformation. So hydrostatic or geostatic condition is generally ignored.
The interface elements are used to simulate the interaction between soil and structure, and the interface elements are comprised of a series of the triangular elements contained three nodes, as is
Figure 23. The 3-D difference model of the station construction: (a) Numerical model of the stationconstruction; (b) Details of the support structure in the numerical model.
Beam and pile elements are adopted to simulate the temporary steel supports and feet-lock bolt,respectively. Different materials were assigned to the different soil layers and different components ofthe STS structure as seen in Figure 20b. Line and shell elements were used to simulate the cylindricalsteel column and the primary lining, respectively. In total, 315,055 zones and 323,540 nodes wereused, meanwhile the maximum element size is 6 m × 4 m × 1 m, and the minimum element size is0.25 m × 0.25 m × 1 m. For simplicity, the Mohr–Coulomb model was adopted to define the behaviorof the natural and improved soil in the numerical analyses, the parameters of soil were shown inTable 2. The cohesions and friction angles of sandy soils were obtained according to the recommendedrelationship between the strength parameter and DPSH value from the scientific references. Besides,in the Shenyang area, the cohesions (c) are usually negligible based on engineering experience andsome scientific references. But for the numerical simulation software, c = 0 may cause some optionsperforming hardly, even calculation non-convergence. Therefore, the cohesions of sandy soils aregenerally assumed to be 1 kPa in the numerical analysis [37–39]. STS structure elements, primarylining, beam and columns are deemed to have a liner-elastic behavior. Material properties used for thenumerical simulations are listed in Table 3.
As for the initial condition, the initial stress field of the soil is generated by balancing the gravityof the soil. In the initial stage of the model calculation, and the initial displacement is reset to zero.Meanwhile, based on the construction experience of Shenyang and the relevant research, it is provedthat dewatering has little influence on soil deformation. So hydrostatic or geostatic condition isgenerally ignored.
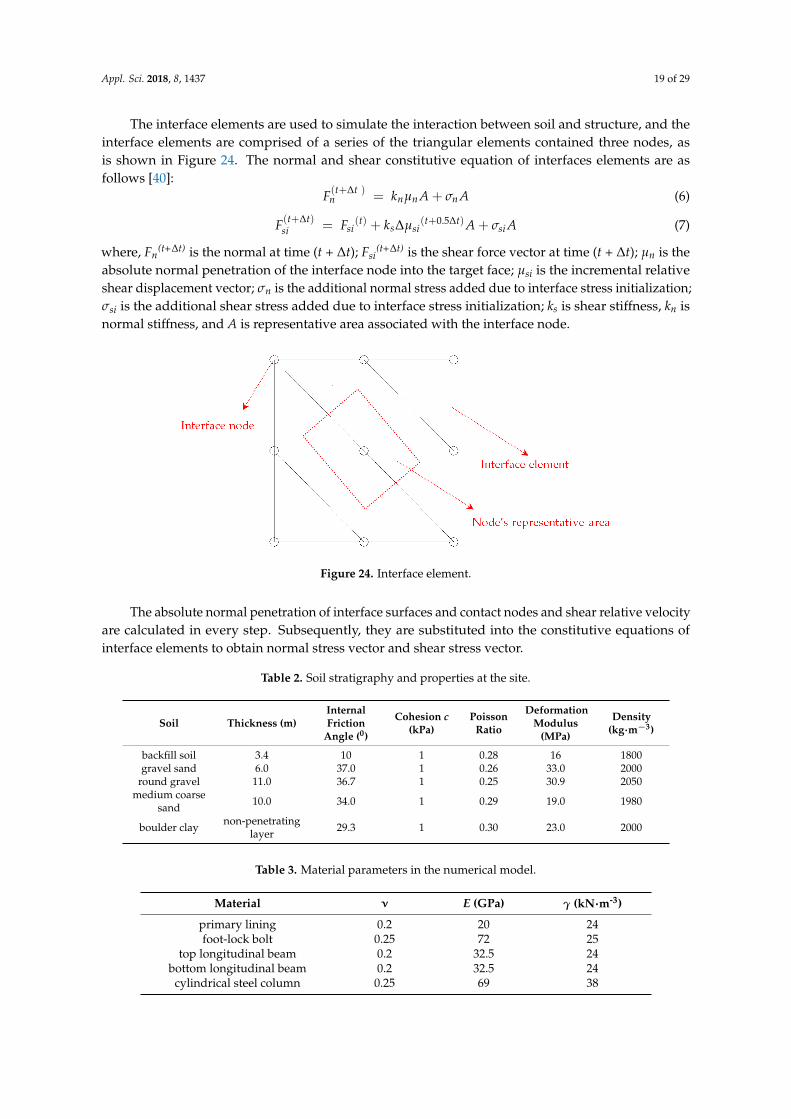
Appl. Sci. 2018, 8, 1437 19 of 29
The interface elements are used to simulate the interaction between soil and structure, and theinterface elements are comprised of a series of the triangular elements contained three nodes, asis shown in Figure 24. The normal and shear constitutive equation of interfaces elements are asfollows [40]:
F(t+∆t )n = knµn A + σn A (6)
F(t+∆t)si = Fsi
(t) + ks∆µsi(t+0.5∆t)A + σsi A (7)
where, Fn(t+∆t) is the normal at time (t + ∆t); Fsi
(t+∆t) is the shear force vector at time (t + ∆t); µn is theabsolute normal penetration of the interface node into the target face; µsi is the incremental relativeshear displacement vector; σn is the additional normal stress added due to interface stress initialization;σsi is the additional shear stress added due to interface stress initialization; ks is shear stiffness, kn isnormal stiffness, and A is representative area associated with the interface node.
Appl. Sci. 2017, 7, x 19 of 29
shown in Figure 24. The normal and shear constitutive equation of interfaces elements are as follows [40]:
( )t tn n n nF k A Aμ σ+Δ = + (6)
( ) ( ) ( )0.5t t t t tsi si s si siF F k A Aμ σ+Δ + Δ= + Δ + (7)
where, Fn(t+Δt) is the normal at time (t + Δt); Fsi(t+Δt) is the shear force vector at time (t + Δt); μn is the absolute normal penetration of the interface node into the target face; μsi is the incremental relative shear displacement vector; σn is the additional normal stress added due to interface stress initialization; σsi is the additional shear stress added due to interface stress initialization; ks is shear stiffness, kn is normal stiffness, and A is representative area associated with the interface node.
Figure 24. Interface element.
The absolute normal penetration of interface surfaces and contact nodes and shear relative velocity are calculated in every step. Subsequently, they are substituted into the constitutive equations of interface elements to obtain normal stress vector and shear stress vector.
Table 2. Soil stratigraphy and properties at the site.
Soil Thickness (m) Internal Friction Angle (0)
Cohesion c (kPa)
Poisson Ratio
Deformation Modulus (MPa)
Density (kg·m−3)
backfill soil 3.4 10 1 0.28 16 1800 gravel sand 6.0 37.0 1 0.26 33.0 2000
round gravel 11.0 36.7 1 0.25 30.9 2050 medium coarse
sand 10.0 34.0 1 0.29 19.0 1980
boulder clay non-penetrating layer
29.3 1 0.30 23.0 2000
Table 3. Material parameters in the numerical model.
Material ν E (GPa) γ (kN·m-3) primary lining 0.2 20 24 foot-lock bolt 0.25 72 25
top longitudinal beam 0.2 32.5 24 bottom longitudinal beam 0.2 32.5 24
cylindrical steel column 0.25 69 38
Figure 24. Interface element.
The absolute normal penetration of interface surfaces and contact nodes and shear relative velocityare calculated in every step. Subsequently, they are substituted into the constitutive equations ofinterface elements to obtain normal stress vector and shear stress vector.
Table 2. Soil stratigraphy and properties at the site.
Soil Thickness (m)InternalFriction
Angle (0)
Cohesion c(kPa)
PoissonRatio
DeformationModulus
(MPa)
Density(kg·m−3)
backfill soil 3.4 10 1 0.28 16 1800gravel sand 6.0 37.0 1 0.26 33.0 2000
round gravel 11.0 36.7 1 0.25 30.9 2050medium coarse
sand 10.0 34.0 1 0.29 19.0 1980
boulder clay non-penetratinglayer 29.3 1 0.30 23.0 2000
Table 3. Material parameters in the numerical model.
Material ν E (GPa) γ (kN·m-3)
primary lining 0.2 20 24foot-lock bolt 0.25 72 25
top longitudinal beam 0.2 32.5 24bottom longitudinal beam 0.2 32.5 24
cylindrical steel column 0.25 69 38
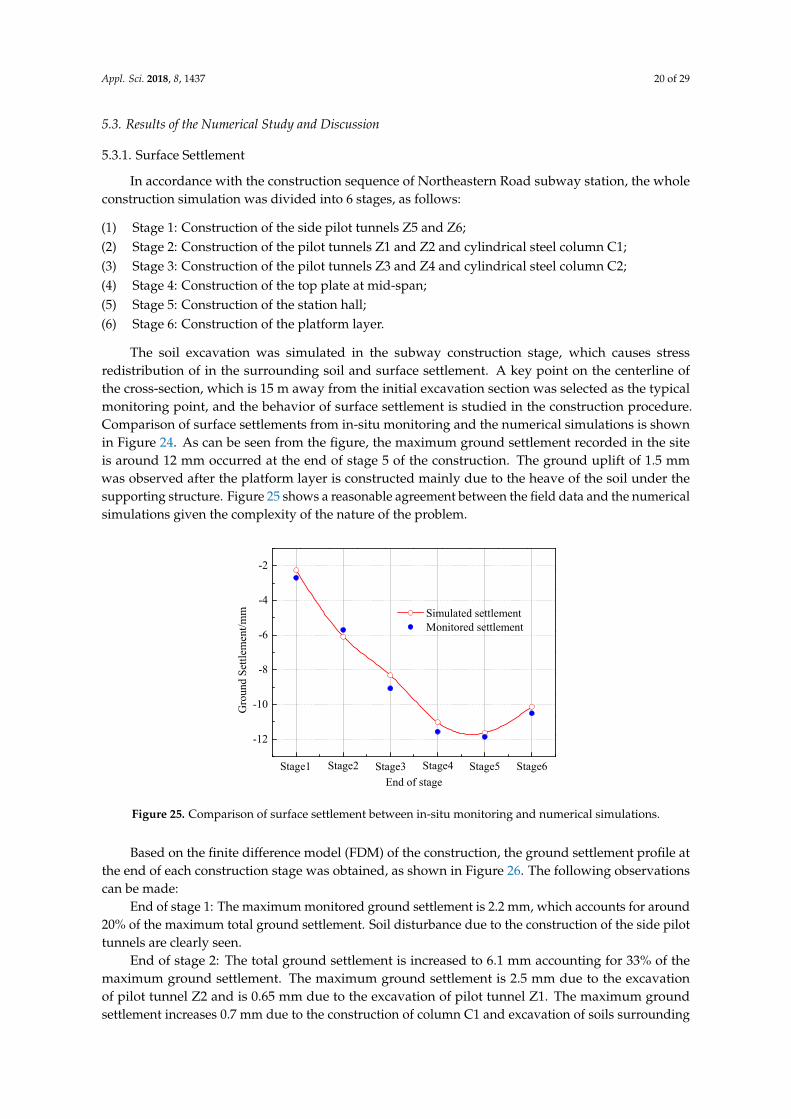
Appl. Sci. 2018, 8, 1437 20 of 29
5.3. Results of the Numerical Study and Discussion
5.3.1. Surface Settlement
In accordance with the construction sequence of Northeastern Road subway station, the wholeconstruction simulation was divided into 6 stages, as follows:
(1) Stage 1: Construction of the side pilot tunnels Z5 and Z6;(2) Stage 2: Construction of the pilot tunnels Z1 and Z2 and cylindrical steel column C1;(3) Stage 3: Construction of the pilot tunnels Z3 and Z4 and cylindrical steel column C2;(4) Stage 4: Construction of the top plate at mid-span;(5) Stage 5: Construction of the station hall;(6) Stage 6: Construction of the platform layer.
The soil excavation was simulated in the subway construction stage, which causes stressredistribution of in the surrounding soil and surface settlement. A key point on the centerline ofthe cross-section, which is 15 m away from the initial excavation section was selected as the typicalmonitoring point, and the behavior of surface settlement is studied in the construction procedure.Comparison of surface settlements from in-situ monitoring and the numerical simulations is shownin Figure 24. As can be seen from the figure, the maximum ground settlement recorded in the siteis around 12 mm occurred at the end of stage 5 of the construction. The ground uplift of 1.5 mmwas observed after the platform layer is constructed mainly due to the heave of the soil under thesupporting structure. Figure 25 shows a reasonable agreement between the field data and the numericalsimulations given the complexity of the nature of the problem.
Appl. Sci. 2017, 7, x 20 of 29
5.3. Results of the Numerical Study and Discussion
5.3.1. Surface Settlement
In accordance with the construction sequence of Northeastern Road subway station, the whole construction simulation was divided into 6 stages, as follows:
(1) Stage 1: Construction of the side pilot tunnels Z5 and Z6; (2) Stage 2: Construction of the pilot tunnels Z1 and Z2 and cylindrical steel column C1; (3) Stage 3: Construction of the pilot tunnels Z3 and Z4 and cylindrical steel column C2; (4) Stage 4: Construction of the top plate at mid-span; (5) Stage 5: Construction of the station hall; (6) Stage 6: Construction of the platform layer.
The soil excavation was simulated in the subway construction stage, which causes stress redistribution of in the surrounding soil and surface settlement. A key point on the centerline of the cross-section, which is 15 m away from the initial excavation section was selected as the typical monitoring point, and the behavior of surface settlement is studied in the construction procedure. Comparison of surface settlements from in-situ monitoring and the numerical simulations is shown in Figure 24. As can be seen from the figure, the maximum ground settlement recorded in the site is around 12 mm occurred at the end of stage 5 of the construction. The ground uplift of 1.5 mm was observed after the platform layer is constructed mainly due to the heave of the soil under the supporting structure. Figure 25 shows a reasonable agreement between the field data and the numerical simulations given the complexity of the nature of the problem.
-12
-10
-8
-6
-4
-2
Stage1 Stage6Stage5Stage4Stage3Stage2
Gro
und
Set
tlem
ent/
mm
End of stage
Simulated settlement Monitored settlement
Figure 25. Comparison of surface settlement between in-situ monitoring and numerical simulations.
Based on the finite difference model (FDM) of the construction, the ground settlement profile at the end of each construction stage was obtained, as shown in Figure 26. The following observations can be made:
End of stage 1: The maximum monitored ground settlement is 2.2 mm, which accounts for around 20% of the maximum total ground settlement. Soil disturbance due to the construction of the side pilot tunnels are clearly seen.
End of stage 2: The total ground settlement is increased to 6.1 mm accounting for 33% of the maximum ground settlement. The maximum ground settlement is 2.5 mm due to the excavation of pilot tunnel Z2 and is 0.65 mm due to the excavation of pilot tunnel Z1. The maximum ground settlement increases 0.7 mm due to the construction of column C1 and excavation of soils surrounding it. The ground settlement due to the construction of pilot tunnel Z2 accounts for 65% of the ground settlement of this stage, indicating that the excavation of lower pilot tunnels results in a
Figure 25. Comparison of surface settlement between in-situ monitoring and numerical simulations.
Based on the finite difference model (FDM) of the construction, the ground settlement profile atthe end of each construction stage was obtained, as shown in Figure 26. The following observationscan be made:
End of stage 1: The maximum monitored ground settlement is 2.2 mm, which accounts for around20% of the maximum total ground settlement. Soil disturbance due to the construction of the side pilottunnels are clearly seen.
End of stage 2: The total ground settlement is increased to 6.1 mm accounting for 33% of themaximum ground settlement. The maximum ground settlement is 2.5 mm due to the excavationof pilot tunnel Z2 and is 0.65 mm due to the excavation of pilot tunnel Z1. The maximum groundsettlement increases 0.7 mm due to the construction of column C1 and excavation of soils surrounding
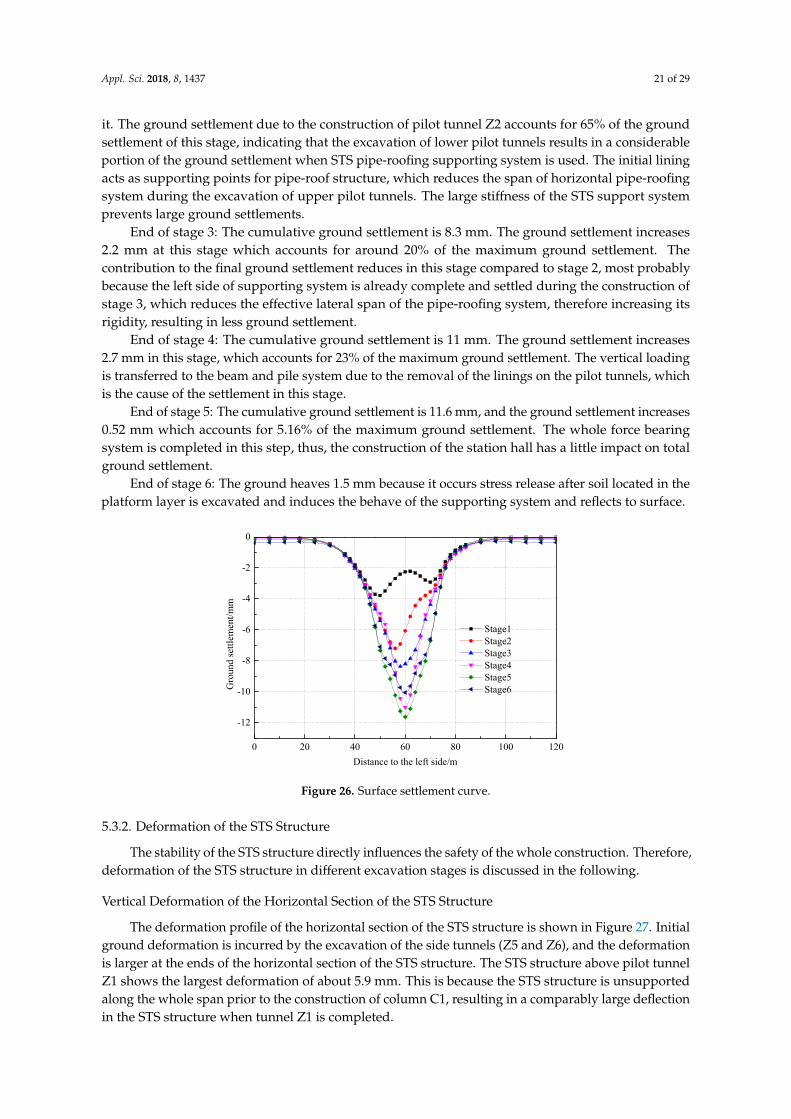
Appl. Sci. 2018, 8, 1437 21 of 29
it. The ground settlement due to the construction of pilot tunnel Z2 accounts for 65% of the groundsettlement of this stage, indicating that the excavation of lower pilot tunnels results in a considerableportion of the ground settlement when STS pipe-roofing supporting system is used. The initial liningacts as supporting points for pipe-roof structure, which reduces the span of horizontal pipe-roofingsystem during the excavation of upper pilot tunnels. The large stiffness of the STS support systemprevents large ground settlements.
End of stage 3: The cumulative ground settlement is 8.3 mm. The ground settlement increases2.2 mm at this stage which accounts for around 20% of the maximum ground settlement. Thecontribution to the final ground settlement reduces in this stage compared to stage 2, most probablybecause the left side of supporting system is already complete and settled during the construction ofstage 3, which reduces the effective lateral span of the pipe-roofing system, therefore increasing itsrigidity, resulting in less ground settlement.
End of stage 4: The cumulative ground settlement is 11 mm. The ground settlement increases2.7 mm in this stage, which accounts for 23% of the maximum ground settlement. The vertical loadingis transferred to the beam and pile system due to the removal of the linings on the pilot tunnels, whichis the cause of the settlement in this stage.
End of stage 5: The cumulative ground settlement is 11.6 mm, and the ground settlement increases0.52 mm which accounts for 5.16% of the maximum ground settlement. The whole force bearingsystem is completed in this step, thus, the construction of the station hall has a little impact on totalground settlement.
End of stage 6: The ground heaves 1.5 mm because it occurs stress release after soil located in theplatform layer is excavated and induces the behave of the supporting system and reflects to surface.
Appl. Sci. 2017, 7, x 21 of 29
considerable portion of the ground settlement when STS pipe-roofing supporting system is used. The initial lining acts as supporting points for pipe-roof structure, which reduces the span of horizontal pipe-roofing system during the excavation of upper pilot tunnels. The large stiffness of the STS support system prevents large ground settlements.
End of stage 3: The cumulative ground settlement is 8.3 mm. The ground settlement increases 2.2 mm at this stage which accounts for around 20% of the maximum ground settlement. The contribution to the final ground settlement reduces in this stage compared to stage 2, most probably because the left side of supporting system is already complete and settled during the construction of stage 3, which reduces the effective lateral span of the pipe-roofing system, therefore increasing its rigidity, resulting in less ground settlement.
End of stage 4: The cumulative ground settlement is 11 mm. The ground settlement increases 2.7 mm in this stage, which accounts for 23% of the maximum ground settlement. The vertical loading is transferred to the beam and pile system due to the removal of the linings on the pilot tunnels, which is the cause of the settlement in this stage.
End of stage 5: The cumulative ground settlement is 11.6 mm, and the ground settlement increases 0.52 mm which accounts for 5.16% of the maximum ground settlement. The whole force bearing system is completed in this step, thus, the construction of the station hall has a little impact on total ground settlement.
End of stage 6: The ground heaves 1.5 mm because it occurs stress release after soil located in the platform layer is excavated and induces the behave of the supporting system and reflects to surface.
0 20 40 60 80 100 120
-12
-10
-8
-6
-4
-2
0
Gro
und
sett
lem
ent/
mm
Distance to the left side/m
Stage1 Stage2 Stage3 Stage4 Stage5 Stage6
Figure 26. Surface settlement curve.
5.3.2. Deformation of the STS Structure
The stability of the STS structure directly influences the safety of the whole construction. Therefore, deformation of the STS structure in different excavation stages is discussed in the following.
Vertical Deformation of the Horizontal Section of the STS Structure
The deformation profile of the horizontal section of the STS structure is shown in Figure 27. Initial ground deformation is incurred by the excavation of the side tunnels (Z5 and Z6), and the deformation is larger at the ends of the horizontal section of the STS structure. The STS structure above pilot tunnel Z1 shows the largest deformation of about 5.9 mm. This is because the STS structure is unsupported along the whole span prior to the construction of column C1, resulting in a comparably large deflection in the STS structure when tunnel Z1 is completed.
The largest deformation of the STS structure is at the top of pilot tunnel Z3 with a deformation of about 3.3 mm during the construction of pilot tunnel Z3, Z4 and steel column C2. The deflection in
Figure 26. Surface settlement curve.
5.3.2. Deformation of the STS Structure
The stability of the STS structure directly influences the safety of the whole construction. Therefore,deformation of the STS structure in different excavation stages is discussed in the following.
Vertical Deformation of the Horizontal Section of the STS Structure
The deformation profile of the horizontal section of the STS structure is shown in Figure 27. Initialground deformation is incurred by the excavation of the side tunnels (Z5 and Z6), and the deformationis larger at the ends of the horizontal section of the STS structure. The STS structure above pilot tunnelZ1 shows the largest deformation of about 5.9 mm. This is because the STS structure is unsupportedalong the whole span prior to the construction of column C1, resulting in a comparably large deflectionin the STS structure when tunnel Z1 is completed.

Appl. Sci. 2018, 8, 1437 22 of 29
The largest deformation of the STS structure is at the top of pilot tunnel Z3 with a deformation ofabout 3.3 mm during the construction of pilot tunnel Z3, Z4 and steel column C2. The deflection in theSTS structure after stage 3 of the construction is not as pronounced as stage 2, given that the structureis now partly supported by column C1, as discussed previously. The largest deflection in the STSstructure, which is 12.7 mm, happens when the soil is excavated, and the station hall is constructed.
Appl. Sci. 2017, 7, x 22 of 29
the STS structure after stage 3 of the construction is not as pronounced as stage 2, given that the structure is now partly supported by column C1, as discussed previously. The largest deflection in the STS structure, which is 12.7 mm, happens when the soil is excavated, and the station hall is constructed.
0 5 10 15 20 25-18
-15
-12
-9
-6
-3
0
C2
Ver
tica
l def
orm
atio
n of
ST
S st
ruct
ure/
mm
Distance to the left side/m
Stage1 Stage2 Stage3 Stage4 Stage5 Stage6
C1
Figure 27. Deformation of STS structure.
Horizontal Deformation of the Vertical Section of the STS Structure and the Side Walls
Figure 28 shows the horizontal deformation of the vertical section of the STS structure and the side walls at y = 15 m. The deformation profiles for both the right and left sections are almost identical, however, the right section shows slightly more deformation due to unsymmetrical nature of the construction sequence. The largest deformation of around 5 mm appears at the intersection of the right vertical section of the STS structure and the right-side wall, where a weak joint may have resulted in the large deformation. The largest horizontal deformation of the bottom of the side walls is 2.4 mm. After construction of the station hall, the largest deformation of STS structure is 3.4 mm, which occurs at the temporary braces. The three steps excavation is applied during the construction of the station hall, and when the first step is excavated the temporary braces were not installed in time, which may cause a large releasing of stress.
0 1 2 3 4 5 6-16
-12
-8
-4
0
Bottom Slab
Middle Slab
vert
ical
leng
th o
f S
TS
str
uctu
re
and
side
wal
l/m
Horizontal deformation/mm
Stage4 Stage5 Stage6
Top Slab
0 -1 -2 -3 -4 -5 -6
-16
-12
-8
-4
0
Bottom slab
Middle slab
Ver
tical
def
orm
atio
n of
ST
S s
truc
ture
and
side
wal
l/m
Horizontal deformation/mm
Stage4 Stage5 Stage6
Top slab
(a) (b)
Figure 28. Horizontal displacement profile of vertical sections of the STS structure and the side walls: (a) Left vertical section of STS structure and left side wall; (b) Right vertical section of STS structure and right-side wall.
5.3.3. Horizontal Deformation of Bridge Piles
As shown in Figure 29, the horizontal deformation profile for all four bridge piles are almost the same, which indicates that it is not sensitive for time effect of construction compared to surface
Figure 27. Deformation of STS structure.
Horizontal Deformation of the Vertical Section of the STS Structure and the Side Walls
Figure 28 shows the horizontal deformation of the vertical section of the STS structure and theside walls at y = 15 m. The deformation profiles for both the right and left sections are almost identical,however, the right section shows slightly more deformation due to unsymmetrical nature of theconstruction sequence. The largest deformation of around 5 mm appears at the intersection of the rightvertical section of the STS structure and the right-side wall, where a weak joint may have resulted inthe large deformation. The largest horizontal deformation of the bottom of the side walls is 2.4 mm.After construction of the station hall, the largest deformation of STS structure is 3.4 mm, which occursat the temporary braces. The three steps excavation is applied during the construction of the stationhall, and when the first step is excavated the temporary braces were not installed in time, which maycause a large releasing of stress.
Appl. Sci. 2017, 7, x 22 of 29
the STS structure after stage 3 of the construction is not as pronounced as stage 2, given that the structure is now partly supported by column C1, as discussed previously. The largest deflection in the STS structure, which is 12.7 mm, happens when the soil is excavated, and the station hall is constructed.
0 5 10 15 20 25-18
-15
-12
-9
-6
-3
0
C2
Ver
tica
l def
orm
atio
n of
ST
S st
ruct
ure/
mm
Distance to the left side/m
Stage1 Stage2 Stage3 Stage4 Stage5 Stage6
C1
Figure 27. Deformation of STS structure.
Horizontal Deformation of the Vertical Section of the STS Structure and the Side Walls
Figure 28 shows the horizontal deformation of the vertical section of the STS structure and the side walls at y = 15 m. The deformation profiles for both the right and left sections are almost identical, however, the right section shows slightly more deformation due to unsymmetrical nature of the construction sequence. The largest deformation of around 5 mm appears at the intersection of the right vertical section of the STS structure and the right-side wall, where a weak joint may have resulted in the large deformation. The largest horizontal deformation of the bottom of the side walls is 2.4 mm. After construction of the station hall, the largest deformation of STS structure is 3.4 mm, which occurs at the temporary braces. The three steps excavation is applied during the construction of the station hall, and when the first step is excavated the temporary braces were not installed in time, which may cause a large releasing of stress.
0 1 2 3 4 5 6-16
-12
-8
-4
0
Bottom Slab
Middle Slab
vert
ical
leng
th o
f S
TS
str
uctu
re
and
side
wal
l/m
Horizontal deformation/mm
Stage4 Stage5 Stage6
Top Slab
0 -1 -2 -3 -4 -5 -6
-16
-12
-8
-4
0
Bottom slab
Middle slab
Ver
tical
def
orm
atio
n of
ST
S s
truc
ture
and
side
wal
l/m
Horizontal deformation/mm
Stage4 Stage5 Stage6
Top slab
(a) (b)
Figure 28. Horizontal displacement profile of vertical sections of the STS structure and the side walls: (a) Left vertical section of STS structure and left side wall; (b) Right vertical section of STS structure and right-side wall.
5.3.3. Horizontal Deformation of Bridge Piles
As shown in Figure 29, the horizontal deformation profile for all four bridge piles are almost the same, which indicates that it is not sensitive for time effect of construction compared to surface
Figure 28. Horizontal displacement profile of vertical sections of the STS structure and the side walls:(a) Left vertical section of STS structure and left side wall; (b) Right vertical section of STS structureand right-side wall.
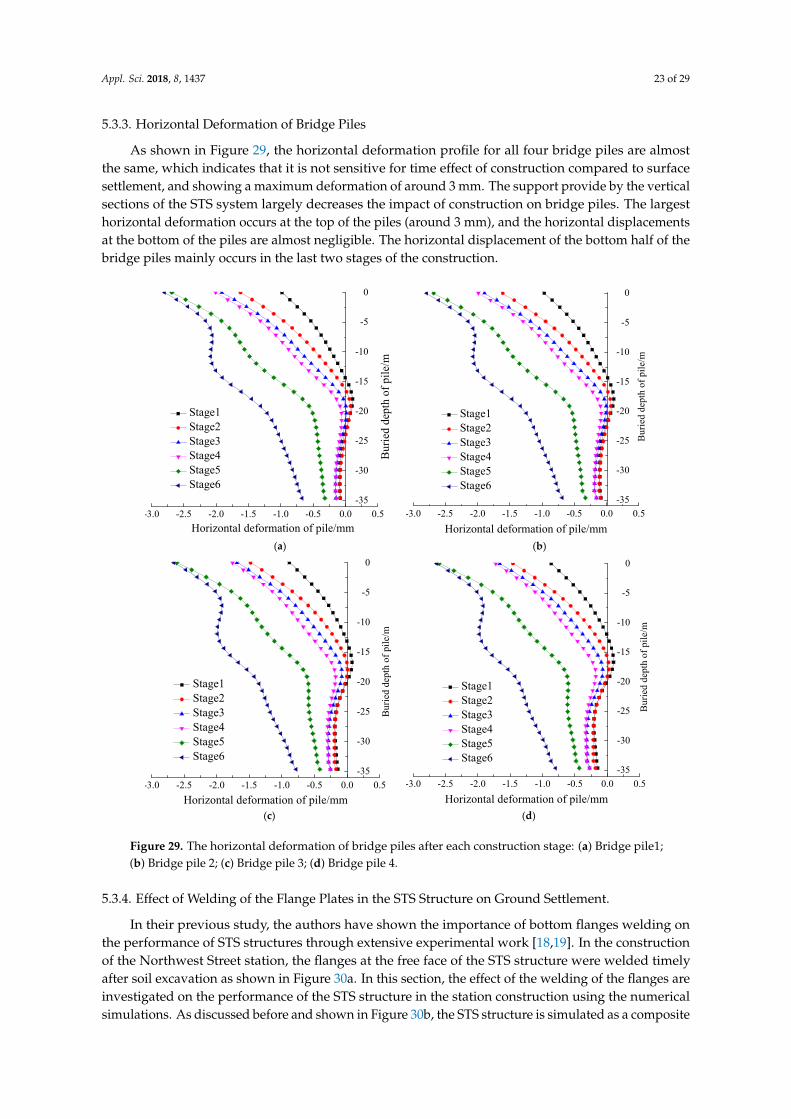
Appl. Sci. 2018, 8, 1437 23 of 29
5.3.3. Horizontal Deformation of Bridge Piles
As shown in Figure 29, the horizontal deformation profile for all four bridge piles are almostthe same, which indicates that it is not sensitive for time effect of construction compared to surfacesettlement, and showing a maximum deformation of around 3 mm. The support provide by the verticalsections of the STS system largely decreases the impact of construction on bridge piles. The largesthorizontal deformation occurs at the top of the piles (around 3 mm), and the horizontal displacementsat the bottom of the piles are almost negligible. The horizontal displacement of the bottom half of thebridge piles mainly occurs in the last two stages of the construction.
Appl. Sci. 2017, 7, x 23 of 29
settlement, and showing a maximum deformation of around 3 mm. The support provide by the vertical sections of the STS system largely decreases the impact of construction on bridge piles. The largest horizontal deformation occurs at the top of the piles (around 3 mm), and the horizontal displacements at the bottom of the piles are almost negligible. The horizontal displacement of the bottom half of the bridge piles mainly occurs in the last two stages of the construction.
-3.0 -2.5 -2.0 -1.5 -1.0 -0.5 0.0 0.5
-35
-30
-25
-20
-15
-10
-5
0
Bur
ied
dept
h of
pil
e/m
Horizontal deformation of pile/mm
Stage1 Stage2 Stage3 Stage4 Stage5 Stage6
-3.0 -2.5 -2.0 -1.5 -1.0 -0.5 0.0 0.5
-35
-30
-25
-20
-15
-10
-5
0
Bur
ied
dept
h of
pil
e/m
Horizontal deformation of pile/mm
Stage1 Stage2 Stage3 Stage4 Stage5 Stage6
(a) (b)
-3.0 -2.5 -2.0 -1.5 -1.0 -0.5 0.0 0.5
-35
-30
-25
-20
-15
-10
-5
0
Bur
ied
dept
h of
pil
e/m
Horizontal deformation of pile/mm
Stage1 Stage2 Stage3 Stage4 Stage5 Stage6
-3.0 -2.5 -2.0 -1.5 -1.0 -0.5 0.0 0.5
-35
-30
-25
-20
-15
-10
-5
0
Bur
ied
dept
h of
pil
e/m
Horizontal deformation of pile/mm
Stage1 Stage2 Stage3 Stage4 Stage5 Stage6
(c) (d)
Figure 29. The horizontal deformation of bridge piles after each construction stage: (a) Bridge pile1; (b) Bridge pile 2; (c) Bridge pile 3; (d) Bridge pile 4.
5.3.4. Effect of Welding of the Flange Plates in the STS Structure on Ground Settlement.
In their previous study, the authors have shown the importance of bottom flanges welding on the performance of STS structures through extensive experimental work [18,19]. In the construction of the Northwest Street station, the flanges at the free face of the STS structure were welded timely after soil excavation as shown in Figure 30a. In this section, the effect of the welding of the flanges are investigated on the performance of the STS structure in the station construction using the numerical simulations. As discussed before and shown in Figure 30b, the STS structure is simulated as a composite of two different materials. The STS structure with or without welding of the flanges can be simulated by appropriately adjusting the material properties of the composite system as discussed earlier in the paper. The impact of welding of the flanges in the STS system on the ground
Figure 29. The horizontal deformation of bridge piles after each construction stage: (a) Bridge pile1;(b) Bridge pile 2; (c) Bridge pile 3; (d) Bridge pile 4.
5.3.4. Effect of Welding of the Flange Plates in the STS Structure on Ground Settlement.
In their previous study, the authors have shown the importance of bottom flanges welding onthe performance of STS structures through extensive experimental work [18,19]. In the constructionof the Northwest Street station, the flanges at the free face of the STS structure were welded timelyafter soil excavation as shown in Figure 30a. In this section, the effect of the welding of the flanges areinvestigated on the performance of the STS structure in the station construction using the numericalsimulations. As discussed before and shown in Figure 30b, the STS structure is simulated as a composite

Appl. Sci. 2018, 8, 1437 24 of 29
of two different materials. The STS structure with or without welding of the flanges can be simulatedby appropriately adjusting the material properties of the composite system as discussed earlier in thepaper. The impact of welding of the flanges in the STS system on the ground displacement is studiedby simulating different welding conditions for the upper left pilot tunnel (Z1).
Appl. Sci. 2017, 7, x 24 of 29
displacement is studied by simulating different welding conditions for the upper left pilot tunnel (Z1).
(a) (b)
Figure 30. Welding of flanges in the STS structure: (a) Welding of flanges in the site; (b) Different welding conditions for the flanges in the simulations.
The settlement profile for the crown of Z1 and Z2 tunnels, and after the bottom (Z2) is completed, the ground with and without welding of the flanges are shown in Figures 31 and 32 for the section at y = 15 m. The ground settlement above the pilot tunnel Z1 increases around 1.3 mm with the welding of flanges during the excavation, and the ground settlement increases 1.35 mm without welding of the flange, increasing 5.47%. The crown settlement of the pilot tunnel Z1 also shows only a slight decrease (from 2.1 mm to 1.9 mm) when flanges are welded. It can be concluded that the welding of flanges during the excavation of the upper pilot tunnel Z1 has little impact on the settlement of the whole structure.
0 30 60 90 120
-7
-6
-5
-4
-3
-2
-1
0
Gro
und
settl
emen
t/m
m
Distance from the left boundary /m
Z2 Z1 (with welding) Z1 (without welding)
0 5 10 15 20 25
-7.5
-7.0
-6.5
-6.0
-5.5
-5.0
-4.5
-4.0
-3.5
Z2 Z1 (with welding) Z1(without welding)
Ver
tica
l set
tlem
ent o
f ho
rizo
ntal
S
TS
str
uctu
re/m
m
Distance from the left boundary/m
(a) (b)
Figure 31. Settlement profiles at a section with y = 15 m: (a) Ground settlement; (b) Vertical deformation of horizontal section of the STS structure.
Figure 30. Welding of flanges in the STS structure: (a) Welding of flanges in the site; (b) Differentwelding conditions for the flanges in the simulations.
The settlement profile for the crown of Z1 and Z2 tunnels, and after the bottom (Z2) is completed,the ground with and without welding of the flanges are shown in Figures 31 and 32 for the section aty = 15 m. The ground settlement above the pilot tunnel Z1 increases around 1.3 mm with the weldingof flanges during the excavation, and the ground settlement increases 1.35 mm without welding ofthe flange, increasing 5.47%. The crown settlement of the pilot tunnel Z1 also shows only a slightdecrease (from 2.1 mm to 1.9 mm) when flanges are welded. It can be concluded that the welding offlanges during the excavation of the upper pilot tunnel Z1 has little impact on the settlement of thewhole structure.
Appl. Sci. 2017, 7, x 24 of 29
displacement is studied by simulating different welding conditions for the upper left pilot tunnel (Z1).
(a) (b)
Figure 30. Welding of flanges in the STS structure: (a) Welding of flanges in the site; (b) Different welding conditions for the flanges in the simulations.
The settlement profile for the crown of Z1 and Z2 tunnels, and after the bottom (Z2) is completed, the ground with and without welding of the flanges are shown in Figures 31 and 32 for the section at y = 15 m. The ground settlement above the pilot tunnel Z1 increases around 1.3 mm with the welding of flanges during the excavation, and the ground settlement increases 1.35 mm without welding of the flange, increasing 5.47%. The crown settlement of the pilot tunnel Z1 also shows only a slight decrease (from 2.1 mm to 1.9 mm) when flanges are welded. It can be concluded that the welding of flanges during the excavation of the upper pilot tunnel Z1 has little impact on the settlement of the whole structure.
0 30 60 90 120
-7
-6
-5
-4
-3
-2
-1
0
Gro
und
settl
emen
t/m
m
Distance from the left boundary /m
Z2 Z1 (with welding) Z1 (without welding)
0 5 10 15 20 25
-7.5
-7.0
-6.5
-6.0
-5.5
-5.0
-4.5
-4.0
-3.5
Z2 Z1 (with welding) Z1(without welding)
Ver
tica
l set
tlem
ent o
f ho
rizo
ntal
S
TS
str
uctu
re/m
m
Distance from the left boundary/m
(a) (b)
Figure 31. Settlement profiles at a section with y = 15 m: (a) Ground settlement; (b) Vertical deformation of horizontal section of the STS structure. Figure 31. Settlement profiles at a section with y = 15 m: (a) Ground settlement; (b) Vertical deformationof horizontal section of the STS structure.

Appl. Sci. 2018, 8, 1437 25 of 29
Appl. Sci. 2017, 7, x 25 of 29
0 10 20 30 40-7.0
-6.5
-6.0
-5.5
-5.0
-4.5
Z2 Z1(with welding) Z1(without welding)
Gro
und
sett
lem
ent/
mm
Longitudinal loction/m 0 10 20 30 40
-7.5
-7.0
-6.5
-6.0
-5.5
-5.0
-4.5
Z2 Z1(with welding) Z1(without welding)
Gro
und
settl
emen
t/mm
Longitudinal loction/m (a) (b)
Figure 32. Longitudinal deformation curve: (a) Ground longitudinal settlement; (b) Longitudinal deformation of horizontal STS structure.
5.3.5. Impact of the Step Length in the Construction of the Pilot Tunnels
Different step lengths of 1 m, 2 m, 3 m, 4 m and 5 m were selected to investigate the impact of the excavation step length on the stability of the excavation face, and also on the final surface settlement and crown settlement. The height of each step is half of the pilot tunnel diameter.
(1) Stability analysis of excavation face
The stability of the excavation face must be considered in tunnel construction. Pilot construction supported by STS structure is different from other arching excavation face. Considering the bottom tunnel pilots (Z1 and Z3) satisfy the symmetry, the tunnel pilot (Z1) is listed as an example to investigate the stability of top pilot tunnel in this section.
The horizontal displacement of the excavation face in the pilot tunnel Z1 is shown in Figure 33. When the step length is 3 m, the maximum horizontal displacement is 3.4 mm which occurs slightly lower than the center of the upper step section. The displacements decrease gradually with the increase of step length. When the step length is larger than 3 m, the step length has a little effect on the displacement of the excavation face. The numerical results indicate that sliding between upper and lower steps may happen when the step length is less than 3 m. The numerical results highlight the importance of adopting an appropriate step length in the stability of the excavation face. Based on the results of the numerical analysis, it seems that one tunnel diameter, which is 3 m in the case of this simulation, is appropriate for this purpose. Although larger step lengths will also have similar face displacements, they may result in larger ground settlement due to the delay they cause in installation of the initial supports of the tunnel.
-4 -3 -2 -1 0
-4
-3
-2
-1
0
Hei
ght o
f pi
lot t
unne
l/m
Horizontal displacement/mm
1m 2m 3m 4m 5m
Step location
Figure 33. Horizontal displacement at the tunnel face for different step lengths.
Figure 32. Longitudinal deformation curve: (a) Ground longitudinal settlement; (b) Longitudinaldeformation of horizontal STS structure.
5.3.5. Impact of the Step Length in the Construction of the Pilot Tunnels
Different step lengths of 1 m, 2 m, 3 m, 4 m and 5 m were selected to investigate the impact of theexcavation step length on the stability of the excavation face, and also on the final surface settlementand crown settlement. The height of each step is half of the pilot tunnel diameter.
(1) Stability analysis of excavation face
The stability of the excavation face must be considered in tunnel construction. Pilot constructionsupported by STS structure is different from other arching excavation face. Considering the bottomtunnel pilots (Z1 and Z3) satisfy the symmetry, the tunnel pilot (Z1) is listed as an example to investigatethe stability of top pilot tunnel in this section.
The horizontal displacement of the excavation face in the pilot tunnel Z1 is shown in Figure 33.When the step length is 3 m, the maximum horizontal displacement is 3.4 mm which occurs slightlylower than the center of the upper step section. The displacements decrease gradually with the increaseof step length. When the step length is larger than 3 m, the step length has a little effect on thedisplacement of the excavation face. The numerical results indicate that sliding between upper andlower steps may happen when the step length is less than 3 m. The numerical results highlight theimportance of adopting an appropriate step length in the stability of the excavation face. Based on theresults of the numerical analysis, it seems that one tunnel diameter, which is 3 m in the case of thissimulation, is appropriate for this purpose. Although larger step lengths will also have similar facedisplacements, they may result in larger ground settlement due to the delay they cause in installationof the initial supports of the tunnel.
Appl. Sci. 2017, 7, x 25 of 29
0 10 20 30 40-7.0
-6.5
-6.0
-5.5
-5.0
-4.5
Z2 Z1(with welding) Z1(without welding)
Gro
und
sett
lem
ent/
mm
Longitudinal loction/m 0 10 20 30 40
-7.5
-7.0
-6.5
-6.0
-5.5
-5.0
-4.5
Z2 Z1(with welding) Z1(without welding)
Gro
und
settl
emen
t/mm
Longitudinal loction/m (a) (b)
Figure 32. Longitudinal deformation curve: (a) Ground longitudinal settlement; (b) Longitudinal deformation of horizontal STS structure.
5.3.5. Impact of the Step Length in the Construction of the Pilot Tunnels
Different step lengths of 1 m, 2 m, 3 m, 4 m and 5 m were selected to investigate the impact of the excavation step length on the stability of the excavation face, and also on the final surface settlement and crown settlement. The height of each step is half of the pilot tunnel diameter.
(1) Stability analysis of excavation face
The stability of the excavation face must be considered in tunnel construction. Pilot construction supported by STS structure is different from other arching excavation face. Considering the bottom tunnel pilots (Z1 and Z3) satisfy the symmetry, the tunnel pilot (Z1) is listed as an example to investigate the stability of top pilot tunnel in this section.
The horizontal displacement of the excavation face in the pilot tunnel Z1 is shown in Figure 33. When the step length is 3 m, the maximum horizontal displacement is 3.4 mm which occurs slightly lower than the center of the upper step section. The displacements decrease gradually with the increase of step length. When the step length is larger than 3 m, the step length has a little effect on the displacement of the excavation face. The numerical results indicate that sliding between upper and lower steps may happen when the step length is less than 3 m. The numerical results highlight the importance of adopting an appropriate step length in the stability of the excavation face. Based on the results of the numerical analysis, it seems that one tunnel diameter, which is 3 m in the case of this simulation, is appropriate for this purpose. Although larger step lengths will also have similar face displacements, they may result in larger ground settlement due to the delay they cause in installation of the initial supports of the tunnel.
-4 -3 -2 -1 0
-4
-3
-2
-1
0
Hei
ght o
f pi
lot t
unne
l/m
Horizontal displacement/mm
1m 2m 3m 4m 5m
Step location
Figure 33. Horizontal displacement at the tunnel face for different step lengths. Figure 33. Horizontal displacement at the tunnel face for different step lengths.

Appl. Sci. 2018, 8, 1437 26 of 29
(2) Ground Settlement
Monitoring points were installed on the crown of the pilot tunnel Z1 in longitudinal direction aty = 20 m in order to investigate the impact of step length on ground settlement.
In this section, the effect of different step lengths on the ground settlement and crown settlementat cross section with y = 20 m is investigated through the numerical simulations, and the groundsettlement profile and crown settlement profile are showed in Figures 34 and 35.
Appl. Sci. 2017, 7, x 26 of 29
(2) Ground Settlement
Monitoring points were installed on the crown of the pilot tunnel Z1 in longitudinal direction at y = 20 m in order to investigate the impact of step length on ground settlement.
In this section, the effect of different step lengths on the ground settlement and crown settlement at cross section with y = 20 m is investigated through the numerical simulations, and the ground settlement profile and crown settlement profile are showed in Figures 34 and 35.
0 20 40 60 80 100 120-0.7
-0.6
-0.5
-0.4
-0.3
-0.2
-0.1
0.0
0.1
0.2G
roun
d se
ttle
men
t/m
m
Distance from left boundary/m
1m 2m 3m 4m 5m
Figure 34. Ground settlement curve of different step length.
0 10 20 30 40
-2.5
-2.0
-1.5
-1.0
-0.5
0.0
Vau
lt c
row
n se
ttle
men
t/mm
Longitudinal location/m
1m 2m 3m 4m 5m
Excavation face
Figure 35. Vault crown settlement curve.
As seen from Figures 33 and 34, the step length has great influence on the ground and tunnel crown settlement above the excavation face. The ground settlement increases with the increase of step length. This is because when the step length is large, it is hard to effectively control the settlement because the ring supports can only be installed when both steps of the excavation are completed. The small local heaves observed in the ground settlement profiles are mainly due to the negative moment created at the end of the horizontal section of the STS system due to settlements of the middle section of the STS system. As shown in Figure 35, larger stage length can cause more crown settlement, appropriate step length must be selected so that the support rings can be quickly installed and the ground settlements can be controlled.
5.3.6. Longitudinal Displacement Profile of the Pilot Tunnel
The longitudinal displacement profile (LDT) of the pilot tunnel Z1 is investigated here. The step length is assumed 3 m in the numerical simulations in accordance to what was used in the site.
As for the ground and the crown of the pilot tunnel, the simulation and monitoring value show similar settlement profiles when pilot tunnel Z1 is excavated, and the largest difference of both is within 10%, as shown in Figure 36. The maximum settlement of ground is no more than 1.25 mm, and the crown settlement is less than 2.0 mm. Settlements are noticeable only for sections that are more than 15 m away from the initial face of the tunnel, and the settlement tends to be a constant
Figure 34. Ground settlement curve of different step length.
Appl. Sci. 2017, 7, x 26 of 29
(2) Ground Settlement
Monitoring points were installed on the crown of the pilot tunnel Z1 in longitudinal direction at y = 20 m in order to investigate the impact of step length on ground settlement.
In this section, the effect of different step lengths on the ground settlement and crown settlement at cross section with y = 20 m is investigated through the numerical simulations, and the ground settlement profile and crown settlement profile are showed in Figures 34 and 35.
0 20 40 60 80 100 120-0.7
-0.6
-0.5
-0.4
-0.3
-0.2
-0.1
0.0
0.1
0.2
Gro
und
sett
lem
ent/
mm
Distance from left boundary/m
1m 2m 3m 4m 5m
Figure 34. Ground settlement curve of different step length.
0 10 20 30 40
-2.5
-2.0
-1.5
-1.0
-0.5
0.0
Vau
lt c
row
n se
ttle
men
t/mm
Longitudinal location/m
1m 2m 3m 4m 5m
Excavation face
Figure 35. Vault crown settlement curve.
As seen from Figures 33 and 34, the step length has great influence on the ground and tunnel crown settlement above the excavation face. The ground settlement increases with the increase of step length. This is because when the step length is large, it is hard to effectively control the settlement because the ring supports can only be installed when both steps of the excavation are completed. The small local heaves observed in the ground settlement profiles are mainly due to the negative moment created at the end of the horizontal section of the STS system due to settlements of the middle section of the STS system. As shown in Figure 35, larger stage length can cause more crown settlement, appropriate step length must be selected so that the support rings can be quickly installed and the ground settlements can be controlled.
5.3.6. Longitudinal Displacement Profile of the Pilot Tunnel
The longitudinal displacement profile (LDT) of the pilot tunnel Z1 is investigated here. The step length is assumed 3 m in the numerical simulations in accordance to what was used in the site.
As for the ground and the crown of the pilot tunnel, the simulation and monitoring value show similar settlement profiles when pilot tunnel Z1 is excavated, and the largest difference of both is within 10%, as shown in Figure 36. The maximum settlement of ground is no more than 1.25 mm, and the crown settlement is less than 2.0 mm. Settlements are noticeable only for sections that are more than 15 m away from the initial face of the tunnel, and the settlement tends to be a constant
Figure 35. Vault crown settlement curve.
As seen from Figures 33 and 34, the step length has great influence on the ground and tunnelcrown settlement above the excavation face. The ground settlement increases with the increase of steplength. This is because when the step length is large, it is hard to effectively control the settlementbecause the ring supports can only be installed when both steps of the excavation are completed.The small local heaves observed in the ground settlement profiles are mainly due to the negativemoment created at the end of the horizontal section of the STS system due to settlements of the middlesection of the STS system. As shown in Figure 35, larger stage length can cause more crown settlement,appropriate step length must be selected so that the support rings can be quickly installed and theground settlements can be controlled.
5.3.6. Longitudinal Displacement Profile of the Pilot Tunnel
The longitudinal displacement profile (LDT) of the pilot tunnel Z1 is investigated here. The steplength is assumed 3 m in the numerical simulations in accordance to what was used in the site.
As for the ground and the crown of the pilot tunnel, the simulation and monitoring value showsimilar settlement profiles when pilot tunnel Z1 is excavated, and the largest difference of both is
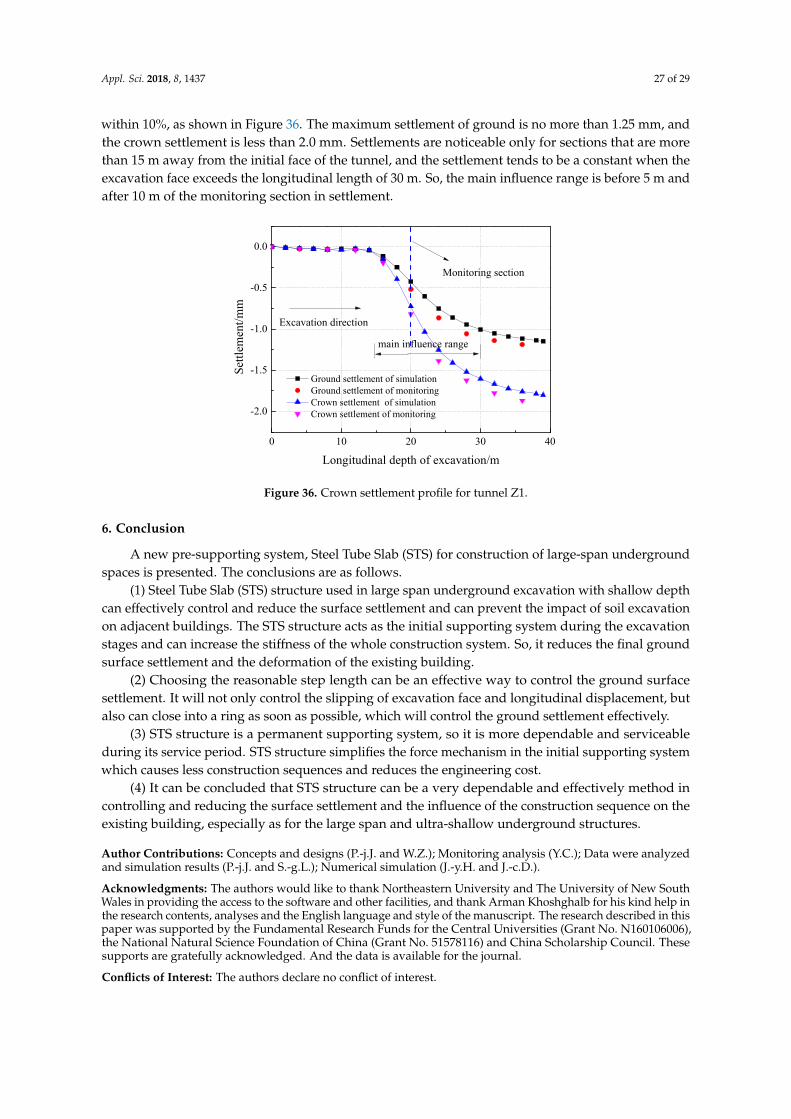
Appl. Sci. 2018, 8, 1437 27 of 29
within 10%, as shown in Figure 36. The maximum settlement of ground is no more than 1.25 mm, andthe crown settlement is less than 2.0 mm. Settlements are noticeable only for sections that are morethan 15 m away from the initial face of the tunnel, and the settlement tends to be a constant when theexcavation face exceeds the longitudinal length of 30 m. So, the main influence range is before 5 m andafter 10 m of the monitoring section in settlement.
Appl. Sci. 2017, 7, x 27 of 29
when the excavation face exceeds the longitudinal length of 30 m. So, the main influence range is before 5 m and after 10 m of the monitoring section in settlement.
0 10 20 30 40
-2.0
-1.5
-1.0
-0.5
0.0
main influence range
Excavation direction
Set
tlem
ent/m
m
Longitudinal depth of excavation/m
Ground settlement of simulation Ground settlement of monitoring Crown settlement of simulation Crown settlement of monitoring
Monitoring section
Figure 36. Crown settlement profile for tunnel Z1.
6. Conclusion
A new pre-supporting system, Steel Tube Slab (STS) for construction of large-span underground spaces is presented. The conclusions are as follows.
(1) Steel Tube Slab (STS) structure used in large span underground excavation with shallow depth can effectively control and reduce the surface settlement and can prevent the impact of soil excavation on adjacent buildings. The STS structure acts as the initial supporting system during the excavation stages and can increase the stiffness of the whole construction system. So, it reduces the final ground surface settlement and the deformation of the existing building.
(2) Choosing the reasonable step length can be an effective way to control the ground surface settlement. It will not only control the slipping of excavation face and longitudinal displacement, but also can close into a ring as soon as possible, which will control the ground settlement effectively.
(3) STS structure is a permanent supporting system, so it is more dependable and serviceable during its service period. STS structure simplifies the force mechanism in the initial supporting system which causes less construction sequences and reduces the engineering cost.
(4) It can be concluded that STS structure can be a very dependable and effectively method in controlling and reducing the surface settlement and the influence of the construction sequence on the existing building, especially as for the large span and ultra-shallow underground structures.
Author Contributions: Concepts and designs (P.-j.J. and W.Z.); Monitoring analysis (Y.C.); Data were analyzed and simulation results (P.-j.J. and S.-g.L.); Numerical simulation (J.-y.H. and J.-c.D.).
Acknowledgments: The authors would like to thank Northeastern University and The University of New South Wales in providing the access to the software and other facilities, and thank Arman Khoshghalb for his kind help in the research contents, analyses and the English language and style of the manuscript. The research described in this paper was supported by the Fundamental Research Funds for the Central Universities (Grant No. N160106006), the National Natural Science Foundation of China (Grant No. 51578116) and China Scholarship Council. These supports are gratefully acknowledged. And the data is available for the journal.
Conflicts of Interest: The authors declare no conflict of interest.
Figure 36. Crown settlement profile for tunnel Z1.
6. Conclusion
A new pre-supporting system, Steel Tube Slab (STS) for construction of large-span undergroundspaces is presented. The conclusions are as follows.
(1) Steel Tube Slab (STS) structure used in large span underground excavation with shallow depthcan effectively control and reduce the surface settlement and can prevent the impact of soil excavationon adjacent buildings. The STS structure acts as the initial supporting system during the excavationstages and can increase the stiffness of the whole construction system. So, it reduces the final groundsurface settlement and the deformation of the existing building.
(2) Choosing the reasonable step length can be an effective way to control the ground surfacesettlement. It will not only control the slipping of excavation face and longitudinal displacement, butalso can close into a ring as soon as possible, which will control the ground settlement effectively.
(3) STS structure is a permanent supporting system, so it is more dependable and serviceableduring its service period. STS structure simplifies the force mechanism in the initial supporting systemwhich causes less construction sequences and reduces the engineering cost.
(4) It can be concluded that STS structure can be a very dependable and effectively method incontrolling and reducing the surface settlement and the influence of the construction sequence on theexisting building, especially as for the large span and ultra-shallow underground structures.
Author Contributions: Concepts and designs (P.-j.J. and W.Z.); Monitoring analysis (Y.C.); Data were analyzedand simulation results (P.-j.J. and S.-g.L.); Numerical simulation (J.-y.H. and J.-c.D.).
Acknowledgments: The authors would like to thank Northeastern University and The University of New SouthWales in providing the access to the software and other facilities, and thank Arman Khoshghalb for his kind help inthe research contents, analyses and the English language and style of the manuscript. The research described in thispaper was supported by the Fundamental Research Funds for the Central Universities (Grant No. N160106006),the National Natural Science Foundation of China (Grant No. 51578116) and China Scholarship Council. Thesesupports are gratefully acknowledged. And the data is available for the journal.
Conflicts of Interest: The authors declare no conflict of interest.
Appl. Sci. 2018, 8, 1437 28 of 29
References
1. Sadaghiani, M.H.; Dadizadeh, S. Study on the effect of a new construction method for a large span metrounderground station in Tabriz-Iran. Tunn. Undergr. Space Technol. 2010, 25, 63–69. [CrossRef]
2. Anastasopoulos, I. Building damage during nearby construction: Forensic analysis. Eng. Fail. Anal. 2013, 34,252–267. [CrossRef]
3. Peck, R.B. Deep Excavation and Tunneling in Soft Ground. In Proceedings of the 7th International Conferenceon Soil Mechanics and Foundation Engineering, Balkema, Mexico, July 1969.
4. O’reilly, M.P.; New, B.M. Settlement above tunnels in the United Kingdom—Their magnitude and prediction.Tunnelling 1982, 82, 173–181. [CrossRef]
5. Novozhenina, S.U.; Vystrchila, M.G. New method of surface settlement prediction for saint-petersburg metroescalator tunnels excavated by EPB TBM. Procedia Eng. 2016, 150, 2266–2271. [CrossRef]
6. Kivi, A.V.; Sadaghiani, M.H.; Ahmadi, M.M. Numerical modeling of ground settlement control oflarge span underground metro station in Tehran Metro using Central Beam Column (CBC) structure.Tunn. Undergr. Space Technol. 2012, 28, 1–9. [CrossRef]
7. Coller, P.J.; Abbott, D.G. Microtunneling Techniques to Form an Insitu Barrier around Existing Structures.In High Level Radioactive Waste Management, Proceedings of the Fifth Annual International Conference, Las Vegas,NV, USA, 22–26 May 1994; American Society of Civil Engineers: Reston, VA, USA, 1994.
8. Musso, G. Jacked pipe provides roof for underground construction in busy urban area. Civ. Eng. 1979, 49,79–82.
9. Ire, H. Tubular trust jacking for underground roof construction on the Antwerp Metro. Tunnelling 1985, 5,13–15.
10. Wang, H. Optimization of pipe roof reinforcement applied in tunnel construction under complex conditions.Electron. J. Geotech. Eng. 2012, 17, 301–310.
11. Yamazoyi, T.; Yomura, J.; Takahara, Y.; Ikeda, T.; Fujita, Y. Construction work in Hio section of Kainan routeof Kinki Expressway: Large diameter box culvert jacking work by ESA method. Civ. Constr. 1991, 32, 17–28.
12. Kaneke, M.; Sibata, Y.; Katou, K. The construction of large section tunnel under highway using FJ method inOosawa Narita Line. Civ. Constr. 2003, 41, 2–9.
13. Yasuhisa, B. Construction methods of the structures passing through under railway lines. Jpn. Railw. Eng.1987, 4, 6–9.
14. Jeon, H.T.; Kim, Y.H.; Kim, S.K. The construction of Lot 923 subway station using the trenchless TRCM(Tubular Roof Construction Method). Harmony Nat. Civiliz. 2007, 55, 39–47.
15. Lee, W.G.; Lee, S.B.; Lee, R.C. A study on the damage reinforcement of gallery pipes under the groundsubjected to various railway loads. J. Korean Soc. Railw. 2004, 9, 277–282.
16. Yao, D.J.; Wu, Z.H.; Zhang, Y.H. Design and analysis of pipe roofing method in soft clay.Chin. J. Rock Mech. Eng. 2004, 23, 4999–5005.
17. Zhu, H.H.; Yan, Z.G.; Li, X.Y.; Liu, X.Z.; Shen, G.P. Analysis of construction risks for pipe-roofing tunnel insaturated soft soil. Chin. J. Rock Mech. Eng. 2005, 24, 5549–5554.
18. Li, Y.S.; Zhang, K.N.; Huang, C.B. Analysis of surface subsidence of tunnel built by pipe-roof pre-constructionmethod. Rock Soil Mech. 2011, 32, 3701–3706.
19. Zhang, P.; Ma, B.S.; Zeng, C.; Xie, H.M.; Li, X.; Wang, D.W. Key techniques for the largest curved pipe jackingroof to date: A case study of Gongbei tunnel. Tunn. Undergr. Space Technol. 2016, 59, 134–145. [CrossRef]
20. Kang, Y.S.; Liu, Q.S.; Cheng, Y.; Liu, X.Y. Combined freeze-sealing and New Tubular Roof constructionmethods for seaside urban tunnel in soft ground. Tunn. Undergr. Space Technol. 2016, 58, 1–10. [CrossRef]
21. Gou, D.M.; Yang, J.S.; Zhang, G. Deformation monitoring and mechanical behaviors of pipe-roof in shallowtunnels. Chin. J. Rock Mech. Eng. 2007, 26, 1258–1264.
22. Zhao, W.; Jia, P.J.; Wang, L.G.; Guan, Y.P.; Li, S.G.; Zhao, Z. Experimental study on the flexural capacity ofsteel tube slab members of subway station. Eng. Mech. 2016, 33, 167–176.
23. Guan, Y.P.; Zhao, W.; Li, S.G.; Zhang, G.B. Key techniques and risk management for the application of thePile-Beam-Arch (PBA) excavation method: A case study of the Zhongjie subway station. Sci. World J. 2014,7, 1–16. [CrossRef]
Appl. Sci. 2018, 8, 1437 29 of 29
24. Liu, X.R.; Liu, Y.Q.; Qu, W.B.; Tu, Y.L. Internal force calculation and supporting parameters sensitivity analysisof side piles in the subway station excavated by Pile-Beam-Arch method. Tunn. Undergr. Space Technol. 2016,56, 186–201. [CrossRef]
25. Hemerijckx, E. Tubular thrust jacking for underground roof construction on the Antwerp Metro Part 2.Tunn. Tunn. Int. 1983, 15, 27–30.
26. Hisatake, M.; Ohno, S. Effects of pipe roof supports and the excavation method on the displacements abovea tunnel face. Tunn. Undergr. Space Technol. 2008, 23, 120–127. [CrossRef]
27. Xin, X.; Zhao, W.; Guan, Y.P. Numerical Simulation Research on Transverse Anti—bending Characteristics ofConcrete Filled Steel Tubes in STS Method for Subway Stations. J. Water Resour. Arch. Eng. 2014, 12, 74–77.
28. Jia, P.J.; Zhao, W.; Hao, Y.C.; Han, J.Y. Numerical analysis of the mechanical properties of steel tube slabcomponent under different structural parameters. J. Northeast. Univ. 2016, 37, 1177–1181.
29. Guan, Y.P.; Zhao, W.; Wang, L.G.; Jia, P.J.; Zhao, Z.; Hao, Y.C. Study on parameters optimization and theflexural behavior of steel tube slab structures. Eng. Mech. 2017, 34, 83–91.
30. Zhang, P.; Wang, X.Y.; Zeng, P.; Ma, B.S. Situ monitoring of mechanical characteristics of pipes during steelcurved pipe jacking under large buried depth. Chin. J. Geotech. Eng. 2016, 38, 1842–1848.
31. Love, A.E.H. A Treatise on the Mathematical Theory of Elasticity; Cambridge University Press: Cambridge,UK, 1927.
32. Xiao, J.H. Study on Flexural Behavior of STS Structure with Steel Pipe Diameter and Concrete Filling Rate.Master’s Thesis, Northeastern University, Liaoning, China, 2017.
33. Jia, P.J.; Zhao, W.; Guan, Y.P.; Li, S.G.; Han, J.Y.; Hou, W.Y.; Wang, C.; Liu, Y.A. Numerical simulation andexperimental study on flexural behavior of steel tube slab members. J. Cent. South Univ. 2016, 47, 2738–2746.
34. Liu, H.W. Material Mechanics; Higher Education Press: Beijing, China, 2005.35. Liu, J.; Fang, Q.; He, S.; Wang, E.; Zhou, H. Enlarging a large-diameter shield tunnel using the Pile-Beam-Arch
method to create a metro station. Tunn. Undergr. Space Technol. 2015, 49, 130–143. [CrossRef]36. GB50157, Code Design of Design; Architecture & Building Press: Beijing, China, 2013.37. Zhao, W.; Han, J.Y.; Chen, Y.; Jia, P.J.; Li, S.G.; Li, Y.; Zhao, Z. A numerical study on the influence of anchorage
failure for a deep excavation retained by anchored pile walls. Adv. Mech. Eng. 2018, 10. [CrossRef]38. Khoiri, M.; Ou, C.Y. Evaluation of deformation parameter for deep excavation in sand through case histories.
Comput. Geotech. 2013, 47, 57–67. [CrossRef]39. Li, B.; Ji, F.Y. Influence of shield tunneling on adjacent deep foundation pit. J. Shenyang Jianzhu Univ. 2018,
34, 639–644.40. Itasca Consulting Group. Fast Lagrangian Analysis of Continua in 3 dimensions, interfaces. In User Manual
of FLAC3D 5.0; Itasca Consulting Group: Minneapolis, MN, USA, 2012.
© 2018 by the authors. Licensee MDPI, Basel, Switzerland. This article is an open accessarticle distributed under the terms and conditions of the Creative Commons Attribution(CC BY) license (http://creativecommons.org/licenses/by/4.0/).