Embed Size (px)
Citation preview

About OMICS Group
OMICS Group International is an amalgamation of Open Access
publications and worldwide international science conferences and
events. Established in the year 2007 with the sole aim of making the
information on Sciences and technology Open Access , OMICS Group
publishes 400 online open access scholarly journals in all aspects of
Science, Engineering, Management and Technology journals. OMICS
Group has been instrumental in taking the knowledge on Science &
technology to the doorsteps of ordinary men and women. Research
Scholars, Students, Libraries, Educational Institutions, Research centers
and the industry are main stakeholders that benefitted greatly from this
knowledge dissemination. OMICS Group also organizes 300 International
conferences annually across the globe, where knowledge transfer takes
place through debates, round table discussions, poster presentations,
workshops, symposia and exhibitions.

About OMICS Group Conferences
OMICS Group International is a pioneer and leading science event
organizer, which publishes around 400 open access journals and
conducts over 300 Medical, Clinical, Engineering, Life Sciences,
Pharma scientific conferences all over the globe annually with the
support of more than 1000 scientific associations and 30,000 editorial
board members and 3.5 million followers to its credit.
OMICS Group has organized 500 conferences, workshops and
national symposiums across the major cities including San Francisco,
Las Vegas, San Antonio, Omaha, Orlando, Raleigh, Santa Clara,
Chicago, Philadelphia, Baltimore, United Kingdom, Valencia, Dubai,
Beijing, Hyderabad, Bengaluru and Mumbai.
Progress on the Studies on Visual
Detection and Surface Modification
Testing of Glass Microfiber Filter
Based Biosensor
Yekbun ADIGUZELa, Haluk KULAHb,c
a Department of Biophysics, School of Medicine, Istanbul Kemerburgaz University,
Mahmutbey Dilmenler Caddesi, No:26, 34217 Bagcilar, Istanbul, Turkey; email:
[email protected] b METU-MEMS Research and Application Center, Middle East Technical University
(METU), Ankara, Turkey; email: [email protected] c Electrical and Electronics Engineering Department, Middle East Technical University
(METU), Universiteler Mah., Dumlupinar Bulv. No: 1, 06800 Cankaya, Ankara, Turkey
Y. ADIGUZEL, 12.08.2014

Summary of Previous Work
► Surface of glass microfiber paper was modified with 3-
aminopropyltriethoxysilane (APTES) and was suggested to
be used as a biosensor in this surface-modified form.
► As an application, visual detection of the surface-
immobilized yeast cells was achieved by Gram staining and
shown to be increasing by modification with APTES. (This’ll not be presented here.)
► DNA detection was performed by using unmodified and
APTES-modified surface as well and visualized with YOYO-1
fluorescence upon 200 nM double stranded DNA binding.
► Surface adsorption tendency of YOYO-1 was offered as a
testing method of proper surface coverage, for sensors with
glass-based active surfaces.
Y. ADIGUZEL, 12.08.2014
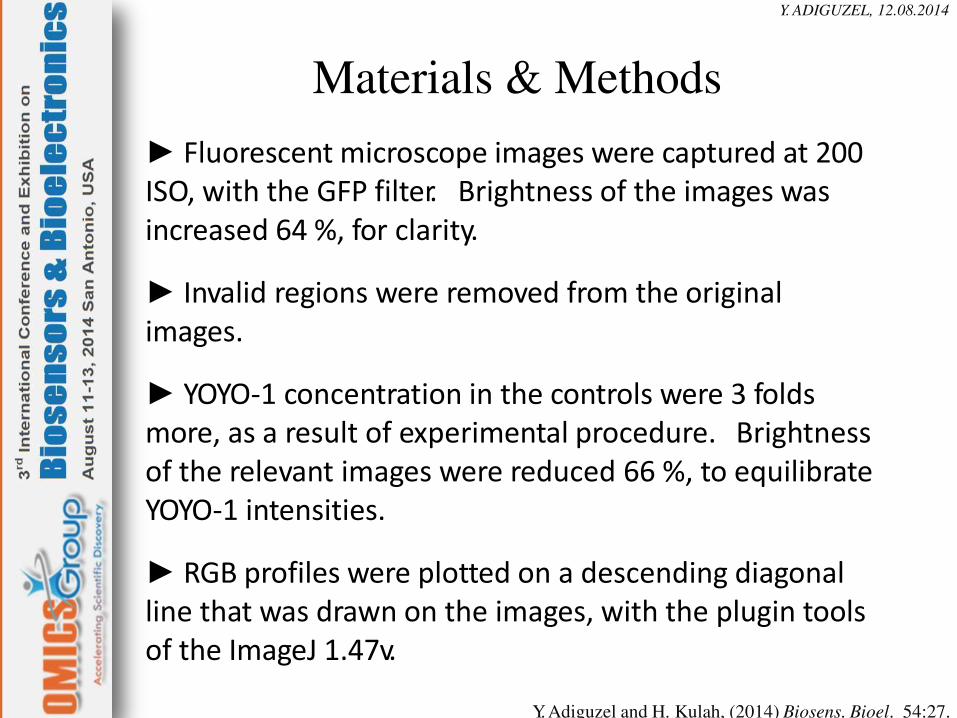
Materials & Methods
► Fluorescent microscope images were captured at 200
ISO, with the GFP filter. Brightness of the images was
increased 64 %, for clarity.
► Invalid regions were removed from the original
images.
► YOYO-1 concentration in the controls were 3 folds
more, as a result of experimental procedure. Brightness
of the relevant images were reduced 66 %, to equilibrate
YOYO-1 intensities.
► RGB profiles were plotted on a descending diagonal
line that was drawn on the images, with the plugin tools
of the ImageJ 1.47v.
Y. Adiguzel and H. Kulah, (2014) Biosens. Bioel. 54:27.
Y. ADIGUZEL, 12.08.2014

APTES Modification of the Surface Scanning electron microscopic (SEM) characterization by QUANTA
400F Field Emission SEM of the Middle East Technical University,
SEM images of unmodified and APsTuErfaSc-modified glass microfiber
paper surfaces. Samples were coated with gold-palladium.
Central Lab:
2
40
µm
40
µm
0.5 µm
Unmodified surface APTES-modified
surface
Unmodified surface APTES-modified
Results Y. ADIGUZEL, 12.08.2014

*
* “Different treatment” stands for: Presence or absence of APTES-
modification; or application of YOYO-1 preliminary to DNA; or
changing incubation durations after washing, following treatments.
Results
Background Image: Exemplary image for YOYO-1 interaction with DNA on glass microfiber filter paper.
Y. ADIGUZEL, 12.08.2014
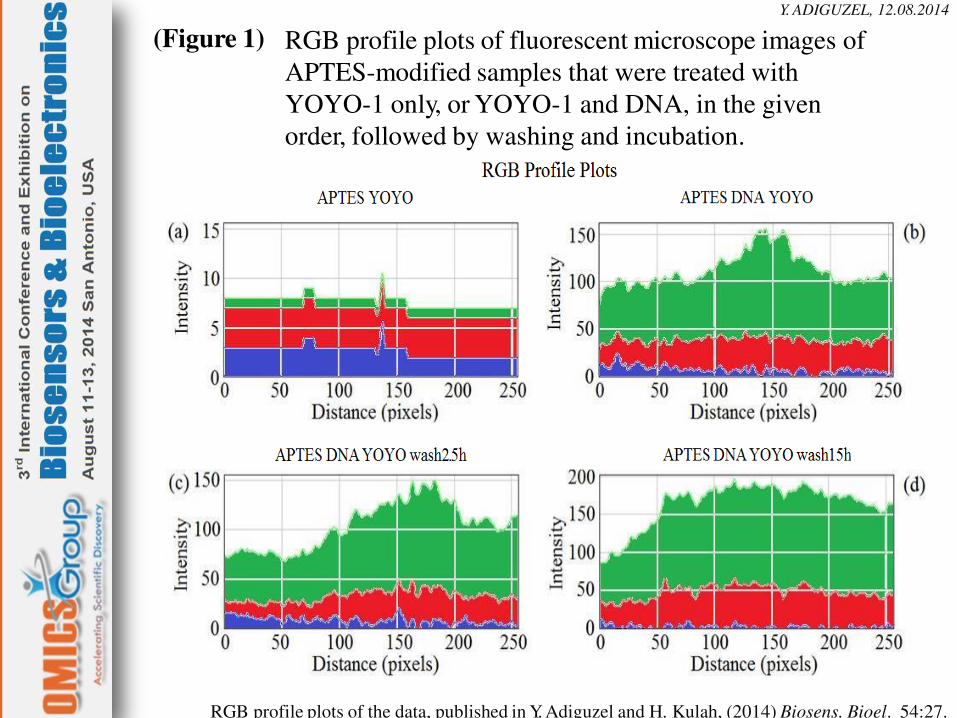
RGB profile plots of fluorescent microscope images of
APTES-modified samples that were treated with
YOYO-1 only, or YOYO-1 and DNA, in the given
order, followed by washing and incubation.
RGB profile plots of the data, published in Y. Adiguzel and H. Kulah, (2014) Biosens. Bioel. 54:27.
(Figure 1)
Y. ADIGUZEL, 12.08.2014

Interpretation of Figure 1
► YOYO-1 leads to a characteristic green fluorescence,
when intercalated into the double-stranded DNA, as can
be seen through the green channel values in (a)
compared to the rest.
RGB profile plots of the data, published in Y. Adiguzel and H. Kulah, (2014) Biosens. Bioel. 54:27.
Y. ADIGUZEL, 12.08.2014

(Figure 2) RGB profile plots of fluorescent microscope images of
unmodified samples that were treated with YOYO-1
only, or YOYO-1 and DNA, in the given order, followed
by washing and incubation.
RGB profile plots of the data, published in Y. Adiguzel and H. Kulah, (2014) Biosens. Bioel. 54:27.
Y. ADIGUZEL, 12.08.2014
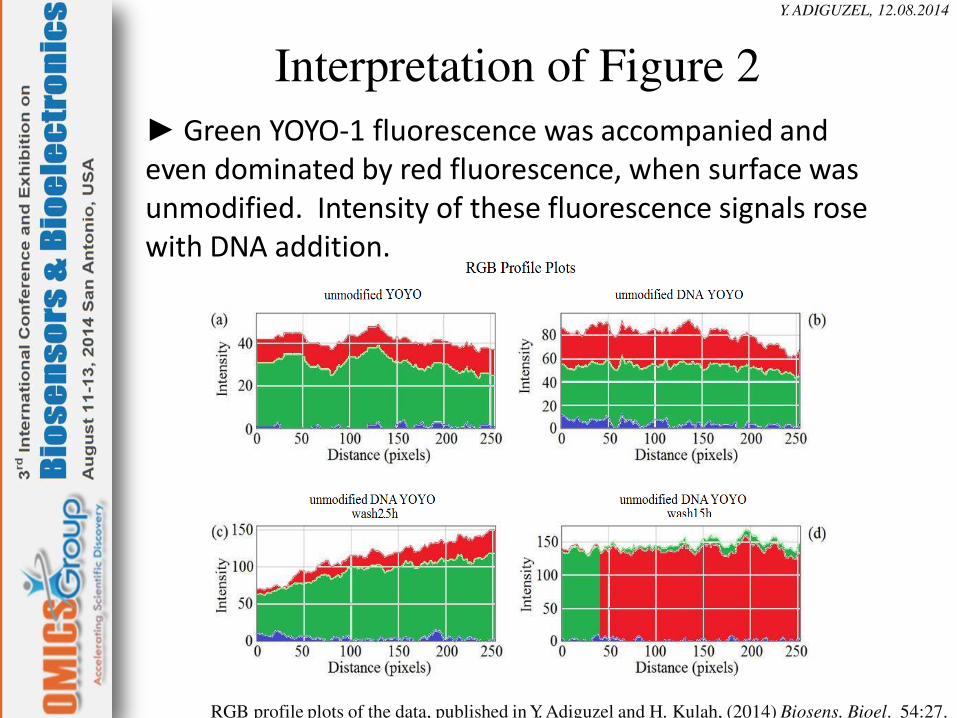
► Green YOYO-1 fluorescence was accompanied and
even dominated by red fluorescence, when surface was
unmodified. Intensity of these fluorescence signals rose
with DNA addition.
RGB profile plots of the data, published in Y. Adiguzel and H. Kulah, (2014) Biosens. Bioel. 54:27.
Interpretation of Figure 2
Y. ADIGUZEL, 12.08.2014

(Figure 3)
Interpretation of Figure 3
► Green YOYO-1 fluorescence was accompanied by red
fluorescence, when surface was unmodified, due to
adsorption of YOYO-1 directly onto the glass surface.
► Apt coverage of the glass surfaces is important for
surface modifications and following interaction kinetics.
► So, YOYO-1 can be used to test proper surface coverage.
RGB profile plots of the data, published in Y. Adiguzel and H. Kulah, (2014) Biosens. Bioel. 54:27.
Y. ADIGUZEL, 12.08.2014
RGB profile plots of fluorescent microscope images of
YOYO-1 on APTES-modified versus unmodified samples.

Conclusions of the Previous Work ► YOYO-1 leads to green fluorescence, when intercalated
into double-stranded DNA, on APTES-modified glass surface.
► Sensitivity was found to be 2 nM (Data was not presented here.)
► YOYO-1 sourced emission remained with little intensity
loss, after sample washing and incubation for 2.5 h more.
This loss was remediated till 15 h.
► YOYO-1 fluorescence was accompanied and dominated by
red fluoresĐeŶĐe, wheŶ surfaĐe was uŶŵodified. It s proďaďle
that this was sourced by YOYO-1 adsorption on surface.
► YOYO-1 sourced emission did not undergo any intensity
loss, after sample washing and incubation for 2.5 h more.
► Apt coverage of the glass surfaces is important for surface
modifications and following interaction kinetics.
► YOYO-1 can be used to test proper surface coverage.
Y. Adiguzel and H. Kulah, (2014) Biosens. Bioel. 54:27.
Y. ADIGUZEL, 12.08.2014

Further Analysis:
Analysis of R/G Mean
Ratios
Y. ADIGUZEL, 12.08.2014
Analysis of R/G Mean Ratios
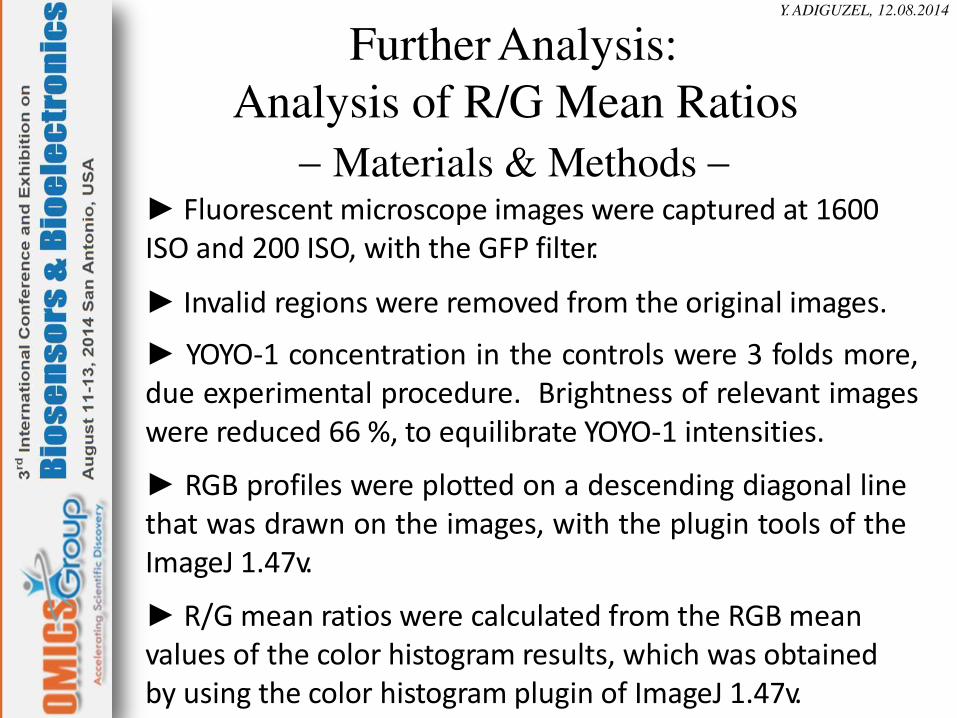
Materials & Methods ► Fluorescent microscope images were captured at 1600
ISO and 200 ISO, with the GFP filter.
► Invalid regions were removed from the original images.
► YOYO-1 concentration in the controls were 3 folds more,
due experimental procedure. Brightness of relevant images
were reduced 66 %, to equilibrate YOYO-1 intensities.
► RGB profiles were plotted on a descending diagonal line
that was drawn on the images, with the plugin tools of the
ImageJ 1.47v.
► R/G mean ratios were calculated from the RGB mean
values of the color histogram results, which was obtained
by using the color histogram plugin of ImageJ 1.47v.
Further Analysis: Y. ADIGUZEL, 12.08.2014

Changes in R/G Mean Ratios by Exposure
Y. ADIGUZEL, 12.08.2014
YOYO-1 on
APTES-
modified
samples
Change in the R/G mean ratio of images, when
measured with 200iso, after the 1600iso measurements
0 min
incubation
1 min
incubation
1 h
incubation
4 h
incubation
12 h
incubation
Before
washing
(1st test)
from
1.46 to
1.53
from
1.00 to
1.23
from
1.05 to
1.25
from
1.04 to
1.11
from
0.93 to
0.91
Before
washing
(2nd test)
from
1.02 to
1.54
from
1.00 to
1.23
from
1.04 to
1.23
from
0.99 to
1.02
from
0.93 to
0.92
After washing
(1st test)
from
1.02 to
1.55
from
1.09 to
1.22
from
1.04 to
1.22
from
0.77 to
0.78
from
0.75 to
0.69
After washing
(2nd test)
from
1.02 to
1.54
from
1.00 to
1.22
from
1.06 to
1.17
from
0.68 to
0.70
from
0.74 to
0.70
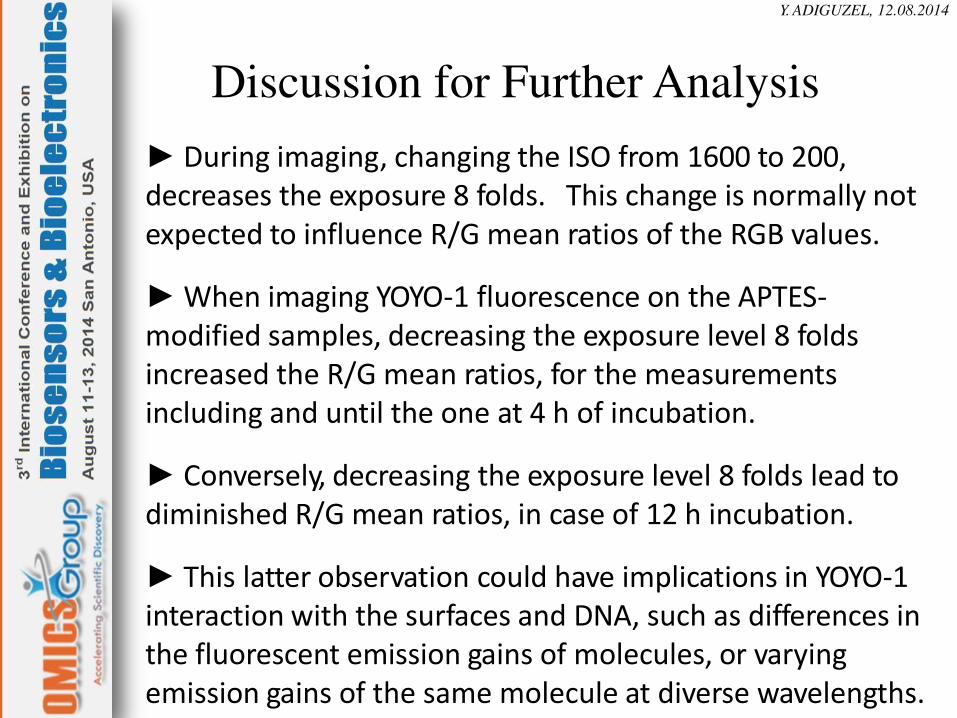
Discussion for Further Analysis
► During imaging, changing the ISO from 1600 to 200,
decreases the exposure 8 folds. This change is normally not
expected to influence R/G mean ratios of the RGB values.
► When imaging YOYO-1 fluorescence on the APTES-
modified samples, decreasing the exposure level 8 folds
increased the R/G mean ratios, for the measurements
including and until the one at 4 h of incubation.
► Conversely, decreasing the exposure level 8 folds lead to
diminished R/G mean ratios, in case of 12 h incubation.
► This latter observation could have implications in YOYO-1
interaction with the surfaces and DNA, such as differences in
the fluorescent emission gains of molecules, or varying
emission gains of the same molecule at diverse wavelengths.
Y. ADIGUZEL, 12.08.2014
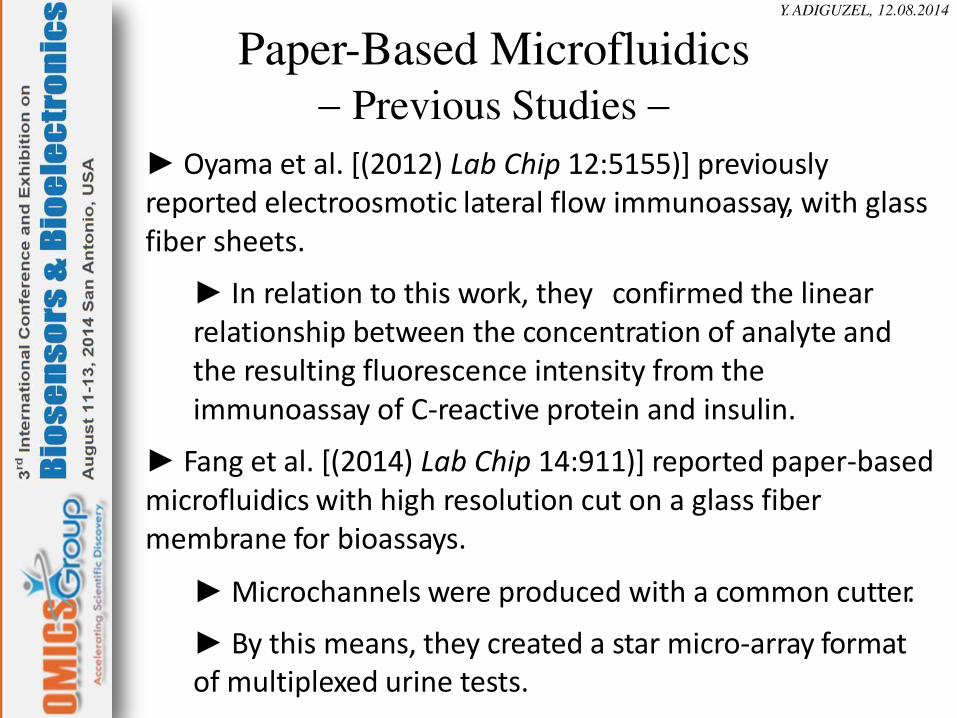
Paper-Based Microfluidics
Previous Studies ► Oyama et al. [(2012) Lab Chip 12:5155)] previously
reported electroosmotic lateral flow immunoassay, with glass
fiber sheets.
► In relation to this work, they confirmed the linear
relationship between the concentration of analyte and
the resulting fluorescence intensity from the
immunoassay of C-reactive protein and insulin.
► Fang et al. [(2014) Lab Chip 14:911)] reported paper-based
microfluidics with high resolution cut on a glass fiber
membrane for bioassays.
► Microchannels were produced with a common cutter.
► By this means, they created a star micro-array format
of multiplexed urine tests.
Y. ADIGUZEL, 12.08.2014
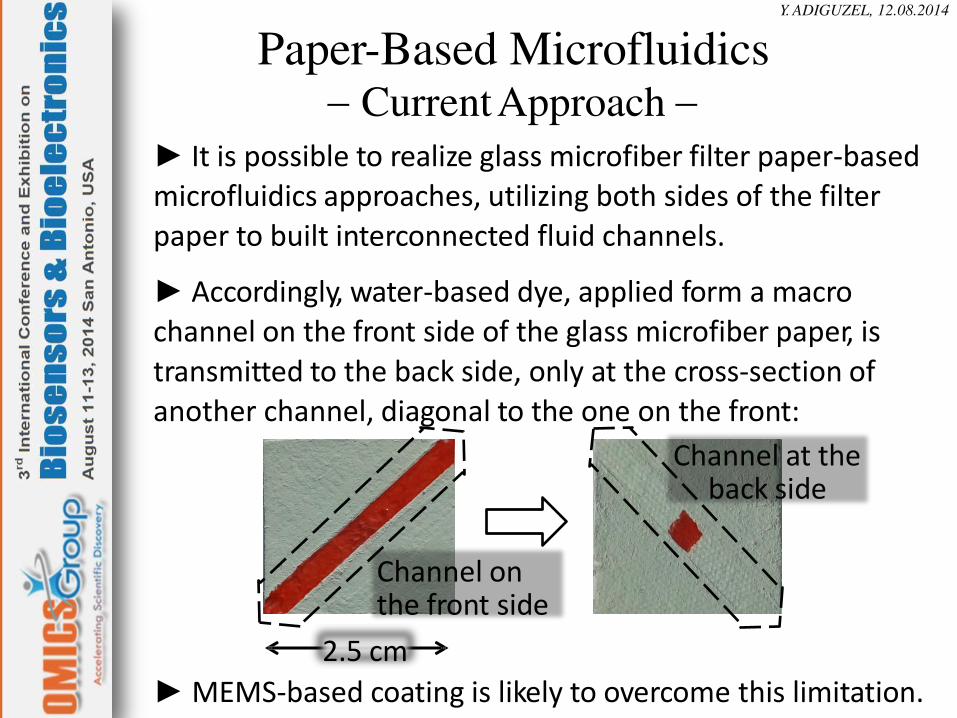
Current Approach ► It is possible to realize glass microfiber filter paper-based
microfluidics approaches, utilizing both sides of the filter
paper to built interconnected fluid channels.
► Accordingly, water-based dye, applied form a macro
channel on the front side of the glass microfiber paper, is
transmitted to the back side, only at the cross-section of
another channel, diagonal to the one on the front:
Channel at the back side
Channel on the front side
2.5 cm
► MEMS-based coating is likely to overcome this limitation.
Paper-Based Microfluidics Y. ADIGUZEL, 12.08.2014

► Progress on the Studies on Visual Detection and Surface
Modification Testing of Glass Microfiber Filter Based
Biosensor is presented through:
1-) Data of the previous work for DNA detection by YOYO-1
fluorescence on glass microfiber paper [Y. Adiguzel and H.
Kulah, (2014) Biosens. Bioel. 54:27], which was presented &
discussed through the re-drawn RGB profile plots of the data.
2-) Performing further analysis of the data, by calculating the
R/G mean ratios. R/G mean ratios were changing, along with
the ISO level that resulted in 8 folds less exposure. This
outcome can have relevance to some physical phenomena, and
YOYO-1 interaction kinetics with DNA.
3-) Initial and early paper-based microfluidics approaches that
are utilizing glass microfiber papers were presented.
Summary
Y. ADIGUZEL, 12.08.2014

We would like to thank to the:
► European Union 7th Framework Program, Capacities
Special Program - "Research Potentials" area
(REGPOT), by the framework of call: FP7-REGPOT-
2009-1 "METU-MEMS Research and Applications
Center (METU-MEMS)“, for financial support.
► Istanbul Kemerburgaz University, for financial
support.
► BioMEMS group of METU-MEMS.
Acknowledgments
Y. ADIGUZEL, 12.08.2014

Let Us Meet Again
We welcome you all to our future conferences of OMICS Group International
Please Visit:
www.omicsgroup.com www.conferenceseries.com
www.pharmaceuticalconferences.com