Embed Size (px)
Citation preview
A 3D scanning primer
0
Marco CallieriMatteo DellepianeVisual Computig LabISTI-CNR
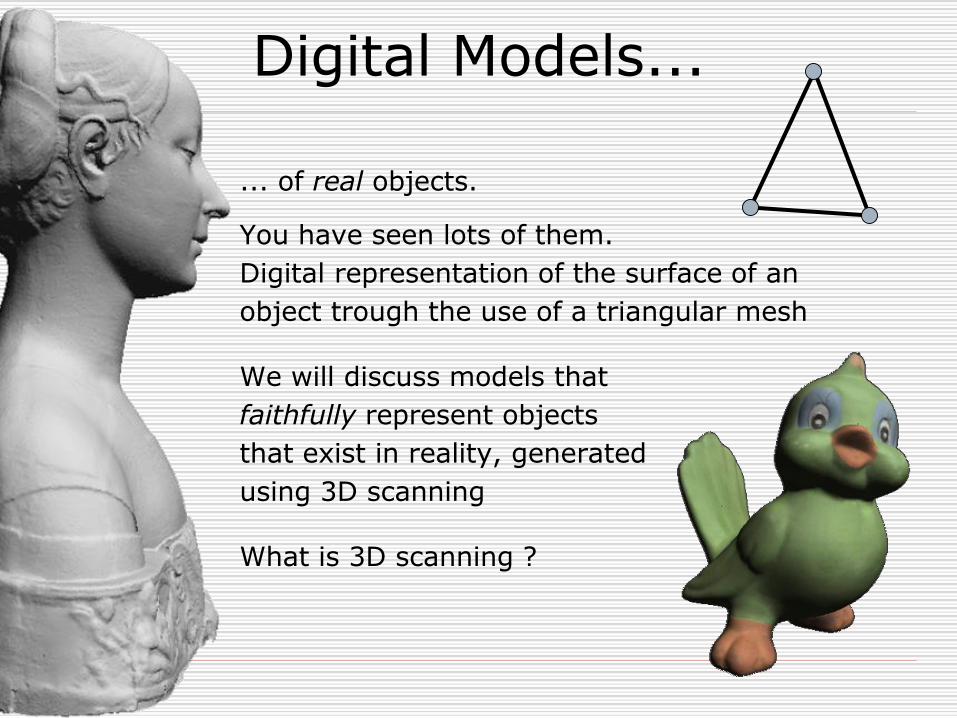
Digital Models...
... of real objects.
You have seen lots of them.
Digital representation of the surface of an
object trough the use of a triangular mesh
We will discuss models that
faithfully represent objects
that exist in reality, generated
using 3D scanning
What is 3D scanning ?

3D scanning
3D scanning is not a technology, but a family of technologies
(and a quite large one)
In all its incarnation, it is a form of automatic
measurement of geometric properties of objects.
The produced digital model is formed by geometric information
that have been measured and have a metric quality.
It may be imprecise and incomplete, but still has all the
characteristics of a measurement result
The long and winding road

Unfortunately
3D scanning is not, as 2D scanning is, a “single button”
operation…Things are slowly changing, but still, some
skill and work is needed to turn raw data into usable 3D
models.
Measuring 3D information is just a step in the process of
creating a 3D model.
This process generally goes under the name of
3D Scanning Pipeline
3D Scanning Pipeline
5
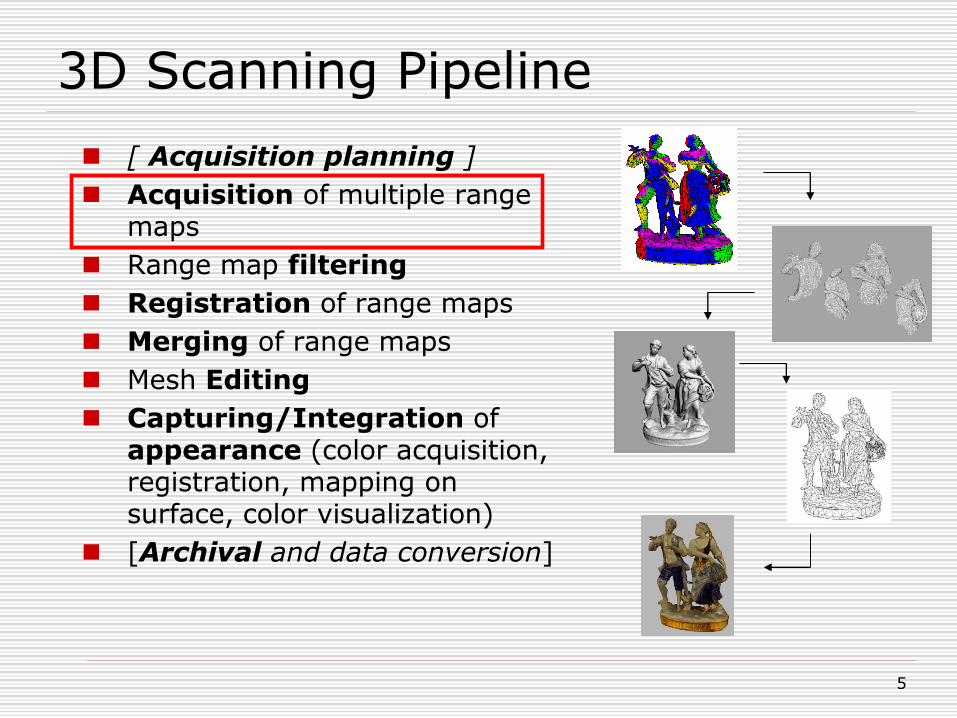
[ Acquisition planning ]
Acquisition of multiple range maps
Range map filtering
Registration of range maps
Merging of range maps
Mesh Editing
Capturing/Integration of appearance (color acquisition, registration, mapping on surface, color visualization)
[Archival and data conversion]
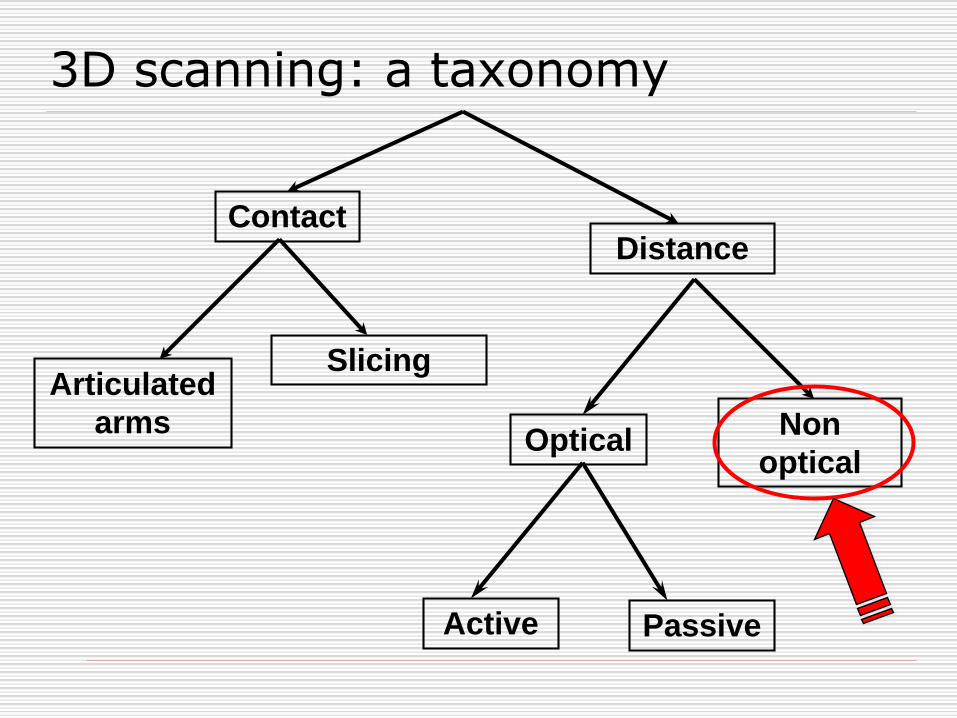
Measurement
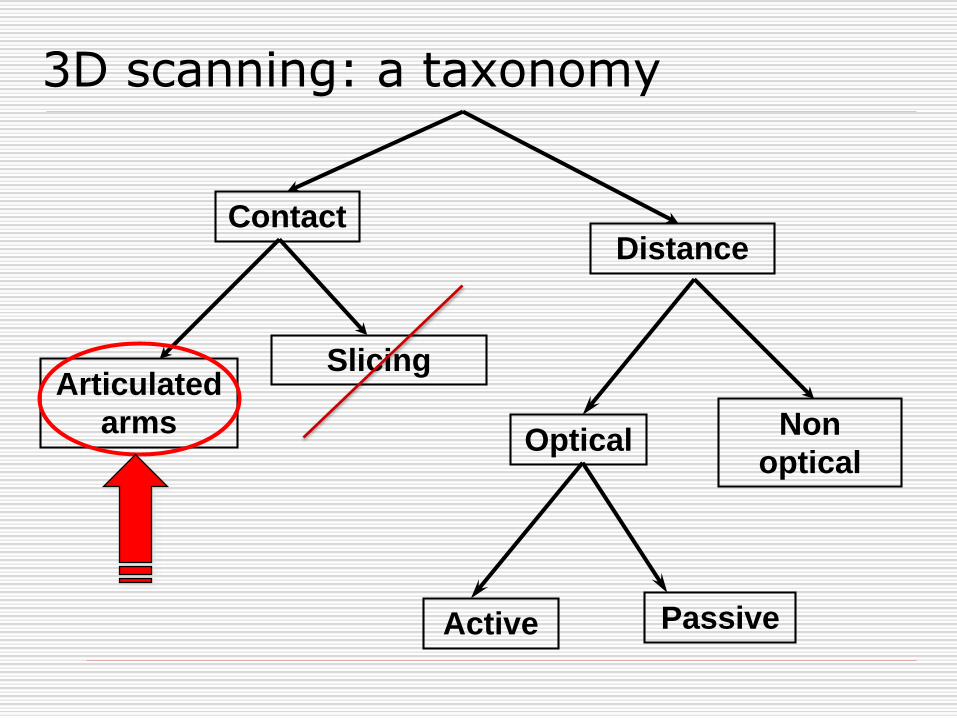
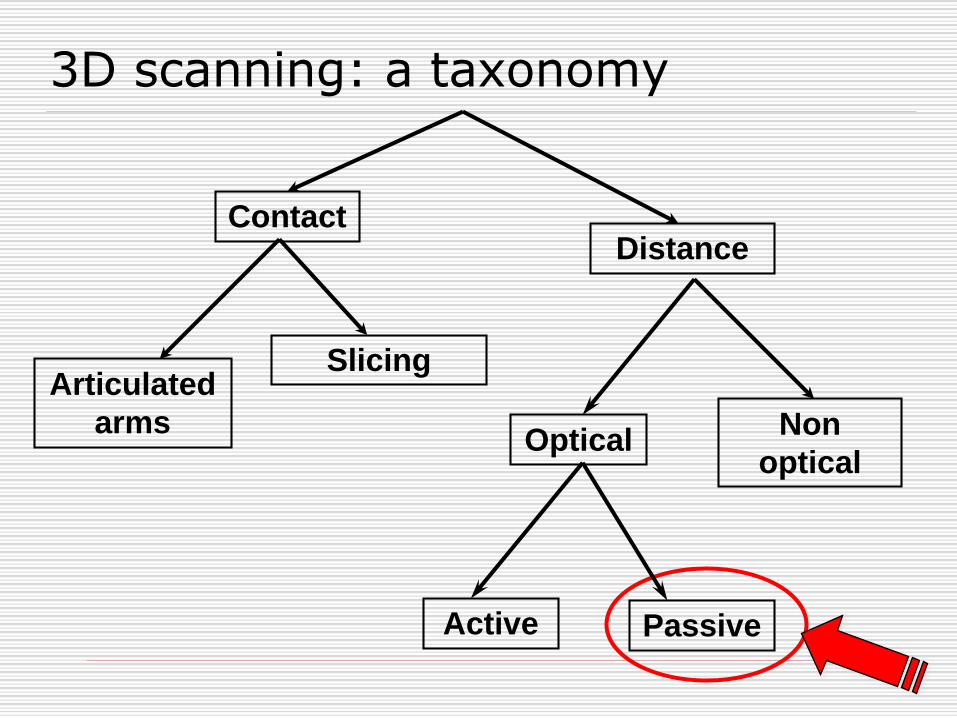
Contact
Articulated
arms
Slicing
Distance
OpticalNon
optical
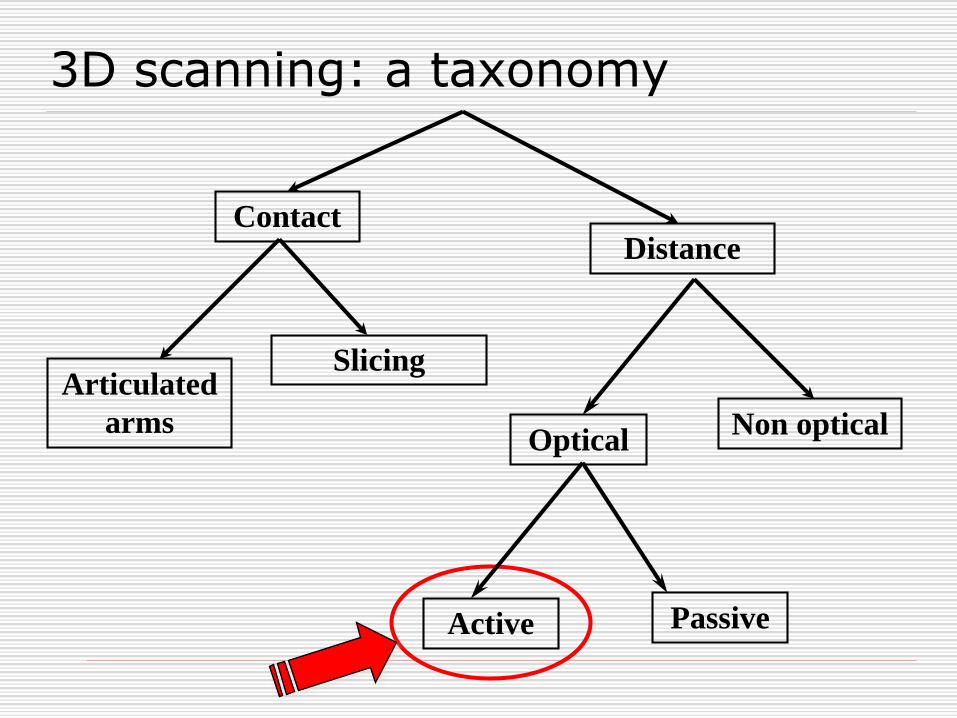
3D scanning: a taxonomy
Active Passive

Articulated arm
The probing point has a known position in every moment, thanks to the angle sensor at joints
Object is “probed” in various points, generating a grid that wll use as a guide for modeling
Very “manual” method, still with lot of artistic influence
Industrial sensors:
The arm is autonomous and touches the surface using a predefined, regular, grid. Precisions in the order of microns
Contact
Articulated
arms
Slicing
Distance
OpticalNon
optical
3D scanning: a taxonomy
Active Passive
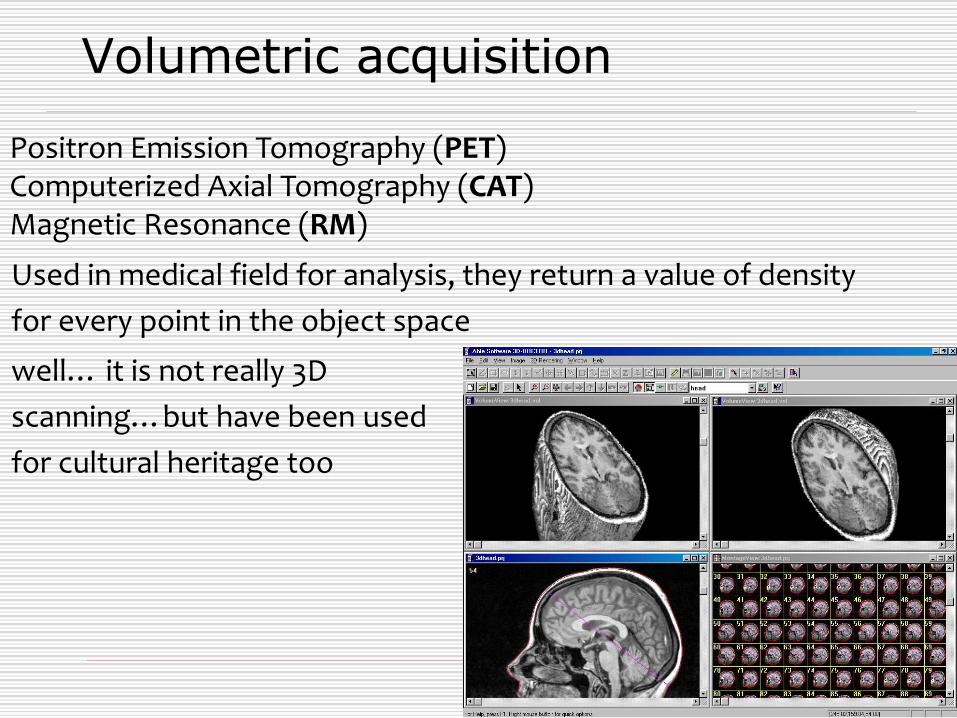
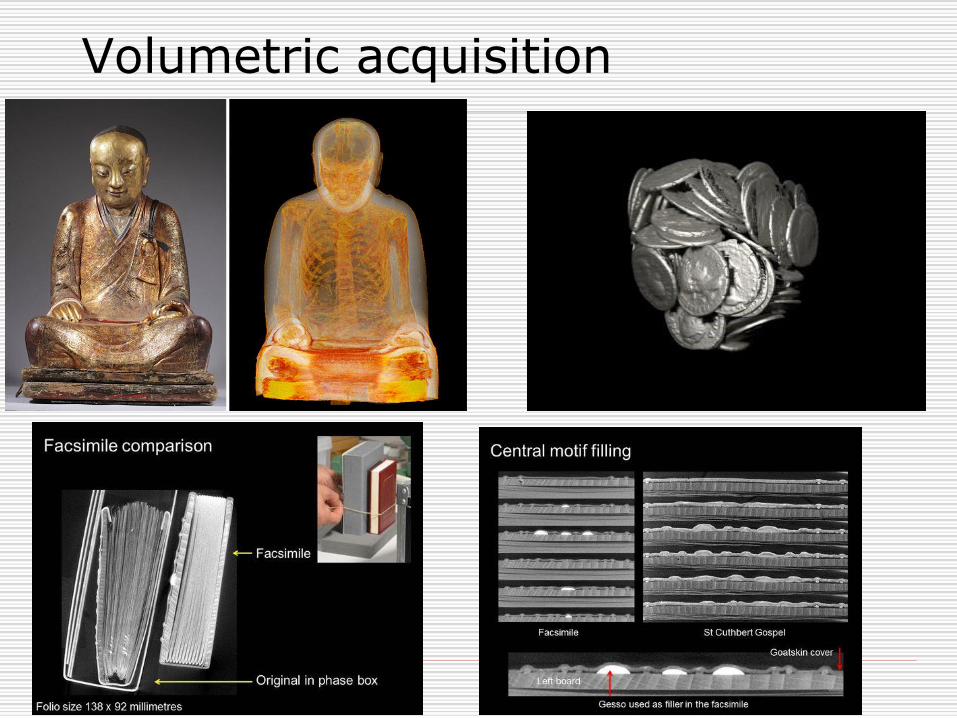
Volumetric acquisition
Used in medical field for analysis, they return a value of density
for every point in the object space
Positron Emission Tomography (PET)Computerized Axial Tomography (CAT)Magnetic Resonance (RM)
well… it is not really 3D
scanning…but have been used
for cultural heritage too
Volumetric acquisition
Contact
Articulated
arms
Slicing
Distance
OpticalNon
optical
3D scanning: a taxonomy
Active Passive
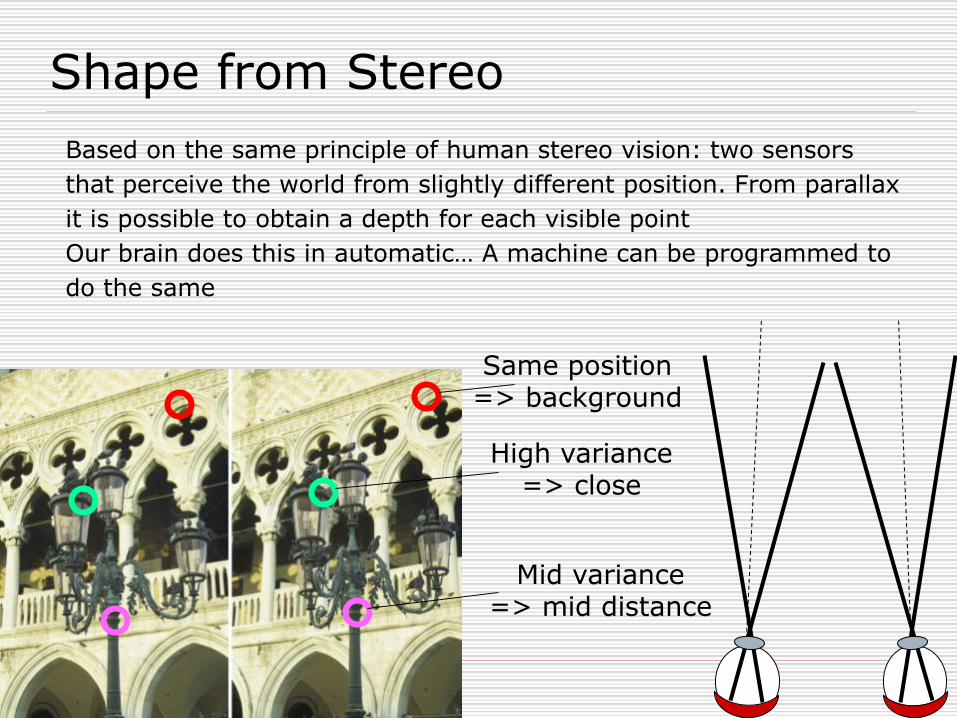
Shape from Stereo
Based on the same principle of human stereo vision: two sensors
that perceive the world from slightly different position. From parallax
it is possible to obtain a depth for each visible point
Our brain does this in automatic… A machine can be programmed to
do the same
Same position=> background
High variance=> close
Mid variance=> mid distance
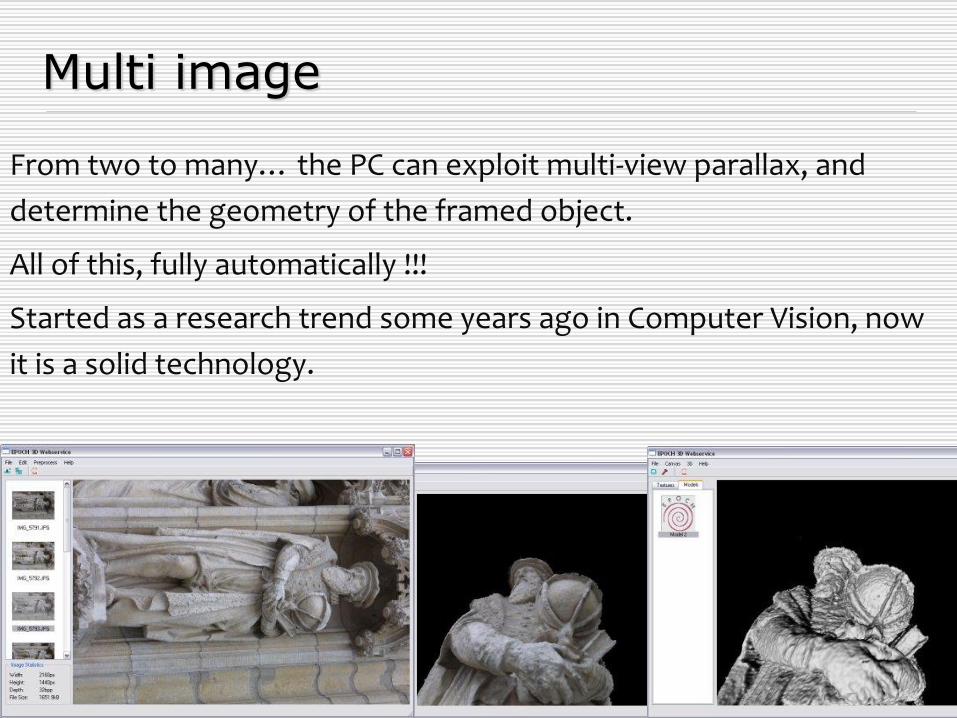
Multi image
From two to many… the PC can exploit multi-view parallax, and
determine the geometry of the framed object.
All of this, fully automatically !!!
Started as a research trend some years ago in Computer Vision, now
it is a solid technology.
The new trend
In the past 4-5 years, from zero to hero…Now is one of the
most used digitization technologies in the CH field, under
many names
• Multiview stereo
• Dense stereo match
• 3D from photos
• Dense Photogrammetry
Many different tools, all uses the same basic technique.
We will spend at least one day on this…
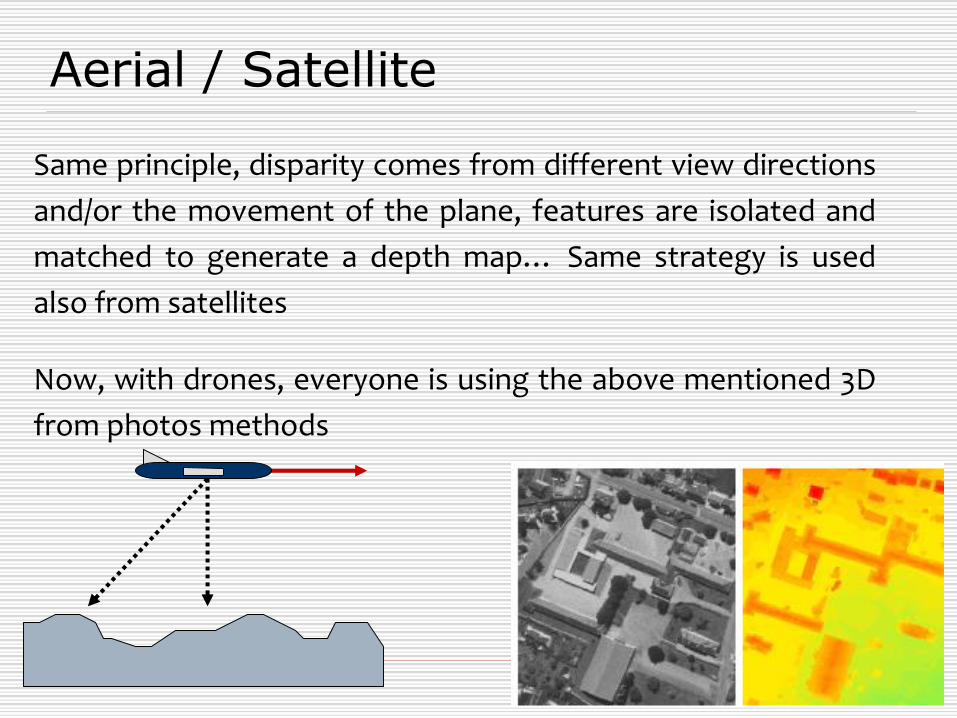
Aerial / Satellite
Same principle, disparity comes from different view directions
and/or the movement of the plane, features are isolated and
matched to generate a depth map… Same strategy is used
also from satellites
Now, with drones, everyone is using the above mentioned 3D
from photos methods
Contact
Articulated
arms
Slicing
Distance
OpticalNon optical
Active Passive
3D scanning: a taxonomy
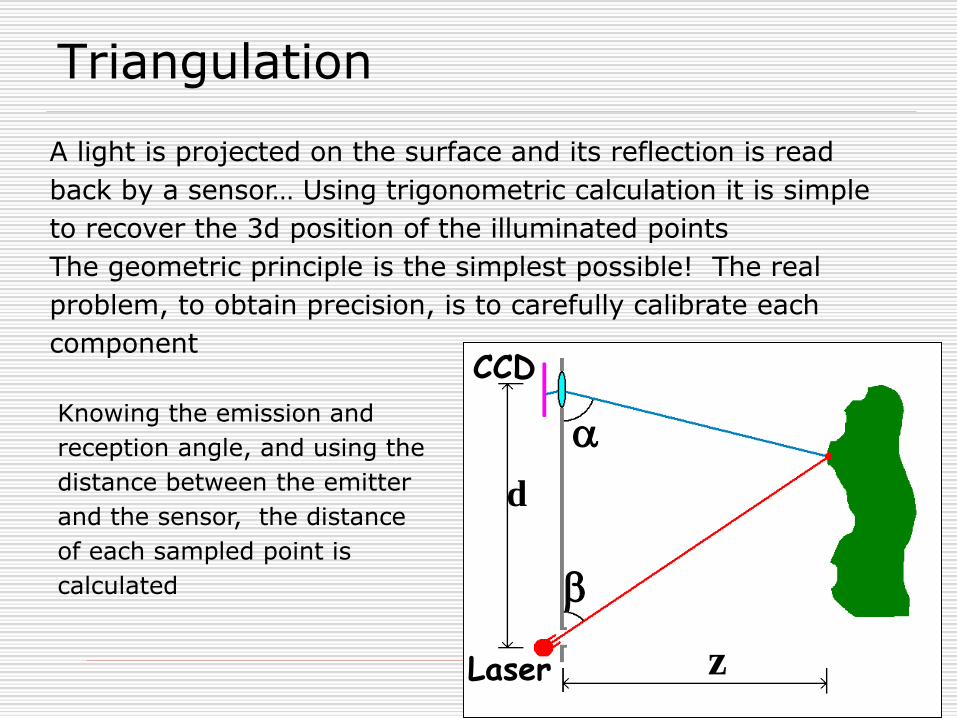
Triangulation
d
z
CCD
Laser
Knowing the emission and
reception angle, and using the
distance between the emitter
and the sensor, the distance
of each sampled point is
calculated
A light is projected on the surface and its reflection is read
back by a sensor… Using trigonometric calculation it is simple
to recover the 3d position of the illuminated points
The geometric principle is the simplest possible! The real
problem, to obtain precision, is to carefully calibrate each
component

Minolta Vivid 910
A commercial scanner, with high precision (0.2-0.3mm), but high cost (>30K euros).
A laser line is swept over the object: 300K points are measured in 2.5 seconds.
Accuracy: 0.3 mm
Cost: 15k Euro (only 2nd hand)
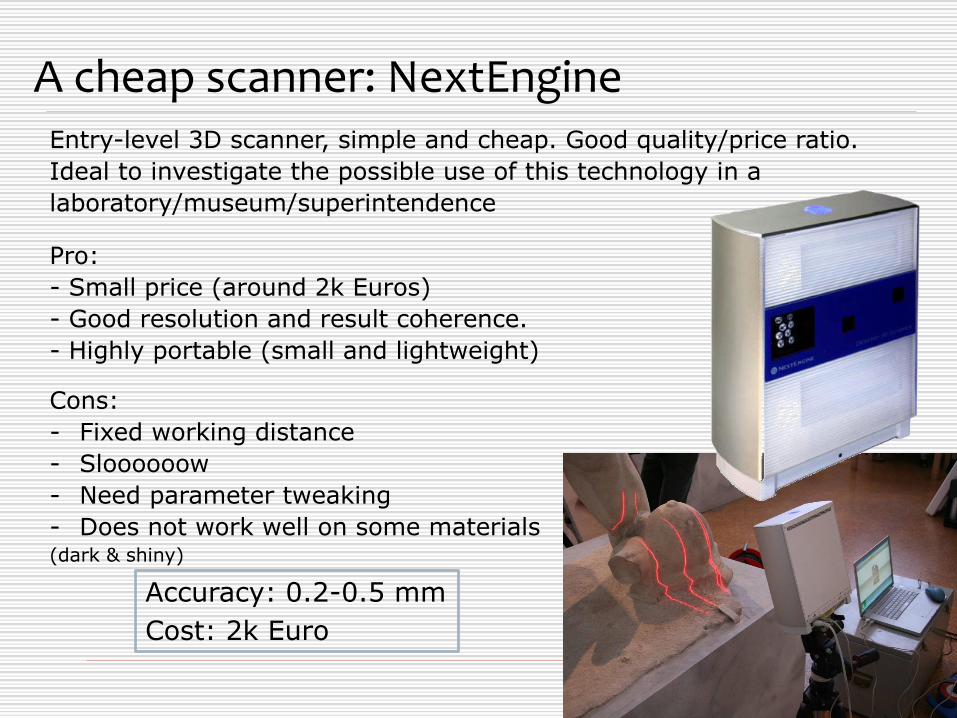
Entry-level 3D scanner, simple and cheap. Good quality/price ratio.
Ideal to investigate the possible use of this technology in a
laboratory/museum/superintendence
Pro:
- Small price (around 2k Euros)
- Good resolution and result coherence.
- Highly portable (small and lightweight)
Cons:
- Fixed working distance
- Sloooooow
- Need parameter tweaking
- Does not work well on some materials (dark & shiny)
A cheap scanner: NextEngine
Accuracy: 0.2-0.5 mm
Cost: 2k Euro
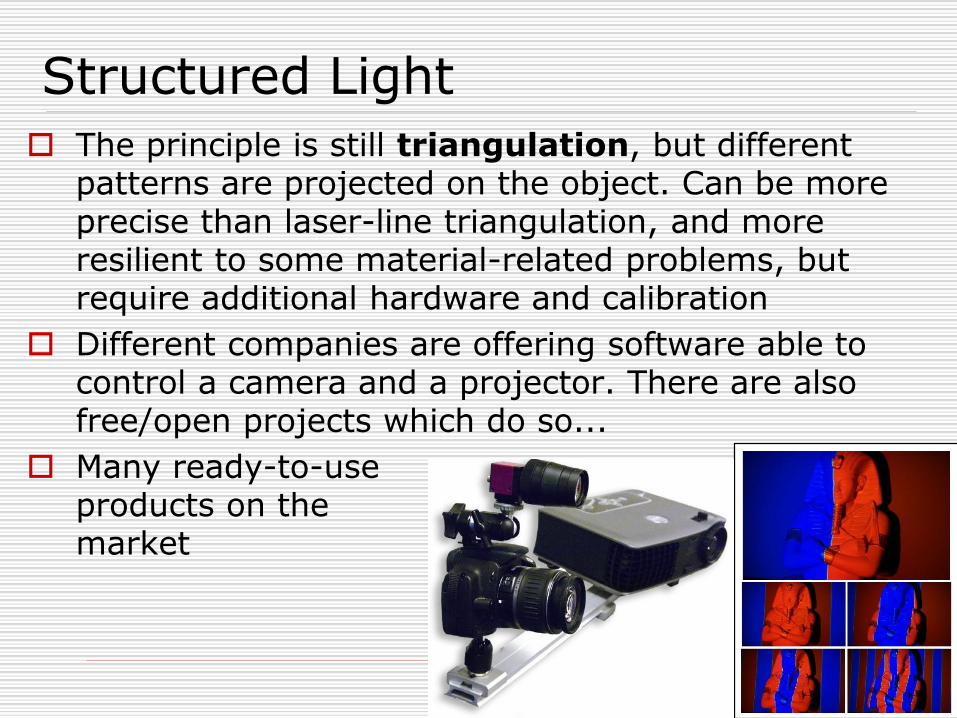
Structured Light
The principle is still triangulation, but different patterns are projected on the object. Can be more precise than laser-line triangulation, and more resilient to some material-related problems, but require additional hardware and calibration
Different companies are offering software able to control a camera and a projector. There are also free/open projects which do so...
Many ready-to-use products on the market
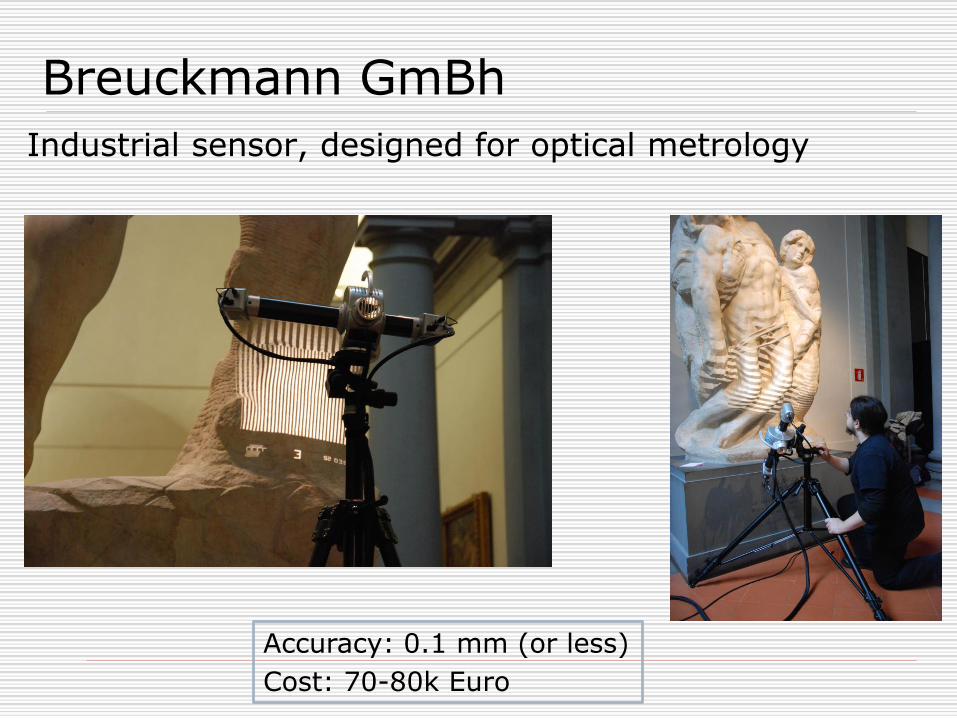
Breuckmann GmBh
Industrial sensor, designed for optical metrology
Accuracy: 0.1 mm (or less)
Cost: 70-80k Euro
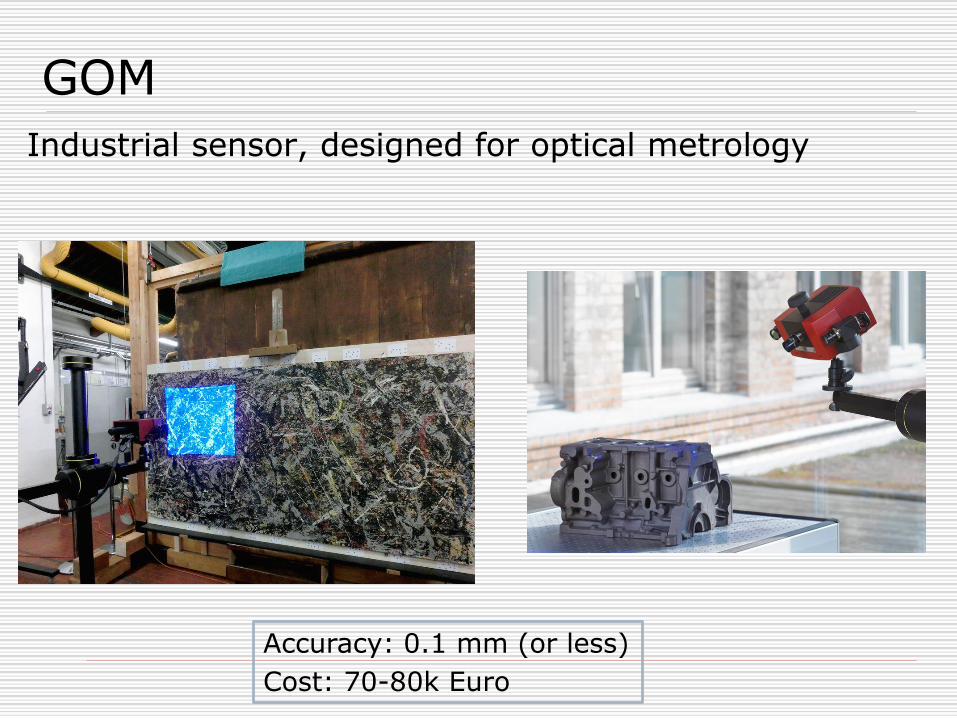
GOM
Industrial sensor, designed for optical metrology
Accuracy: 0.1 mm (or less)
Cost: 70-80k Euro
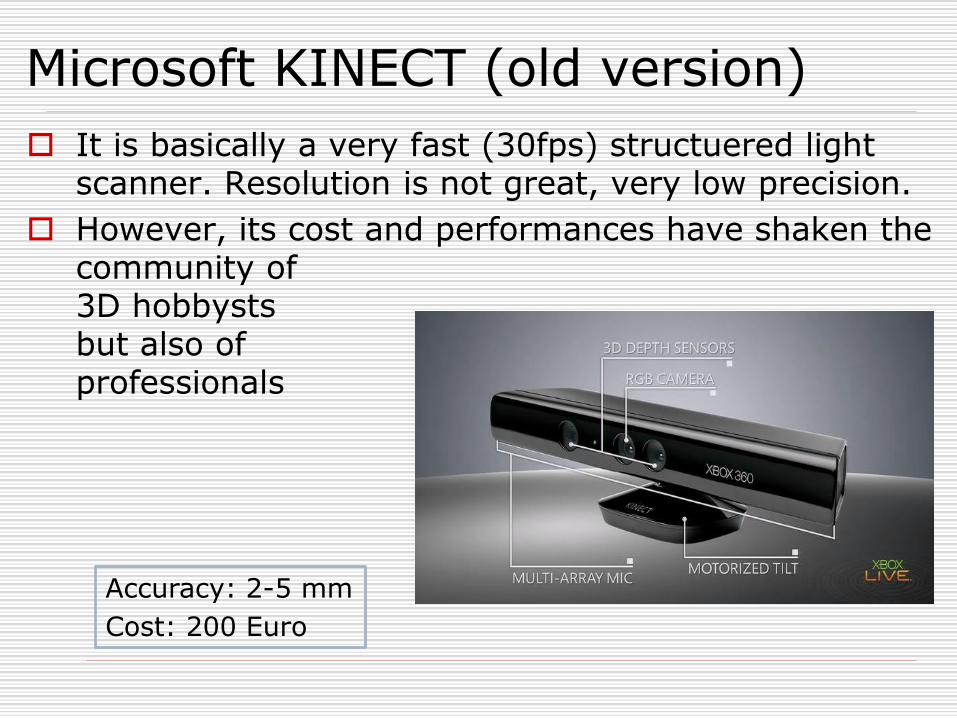
Microsoft KINECT (old version)
It is basically a very fast (30fps) structuered light scanner. Resolution is not great, very low precision.
However, its cost and performances have shaken the community of 3D hobbysts but also of professionals
Accuracy: 2-5 mm
Cost: 200 Euro
Microsoft KINECT
It is possible (in theory) to use the Kinect to do a 3D scanning, however:
The kinect has been built for speed, not precision: you need a stable position of both the device and the subject. You may need to get more than a shot from the same position and combine it to reduce noise
The depth information is compressed, especially in the far area: the subject should stay as close as possible to the device
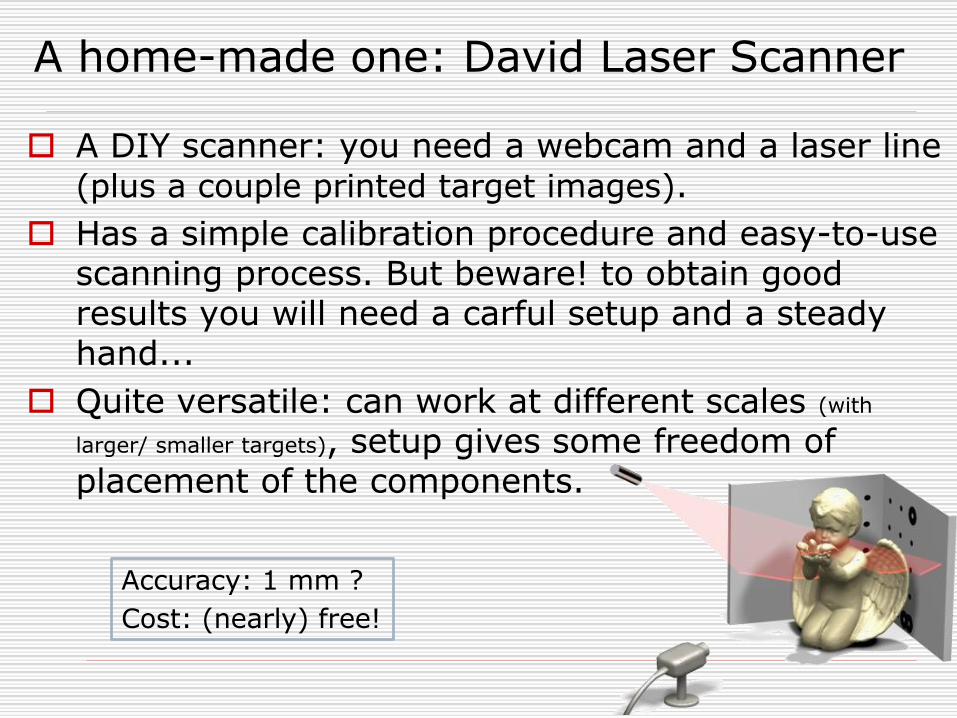
A home-made one: David Laser Scanner
A DIY scanner: you need a webcam and a laser line (plus a couple printed target images).
Has a simple calibration procedure and easy-to-use scanning process. But beware! to obtain good results you will need a carful setup and a steady hand...
Quite versatile: can work at different scales (with
larger/ smaller targets), setup gives some freedom of placement of the components.
Accuracy: 1 mm ?
Cost: (nearly) free!
David Laser Scanner
Free version output a lower resolution meshes, but still good enough for home-made projects... Pay version has higher resolution, more options and implement the complete processing pipeline (even if MeshLab still works better :) ).
In the latest version, is also supported the use of a digital projector (structured light).
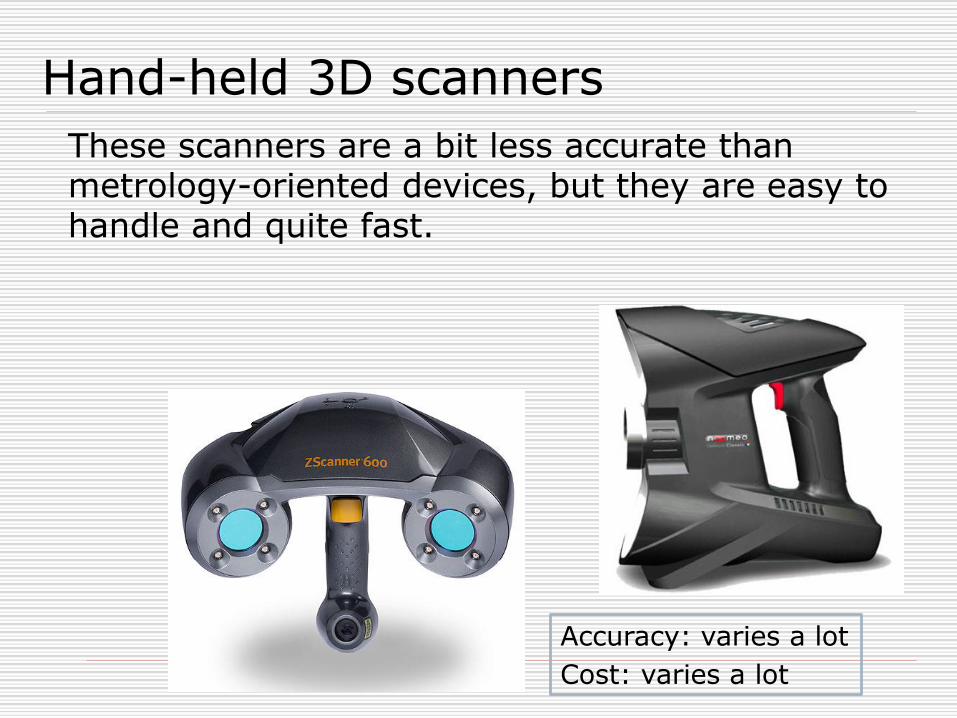
Hand-held 3D scanners
These scanners are a bit less accurate than metrology-oriented devices, but they are easy to handle and quite fast.
Accuracy: varies a lot
Cost: varies a lot
Hand-held 3D scanners
They use:
Time of flight camera (more info later)
Triangulation
Phase shift (more info later)
Stereo
A combination of the above methods
This market segment is expanding... There is a progressive separation of the market between high-end metrology devices and this kind of "quick and easy" scanners...
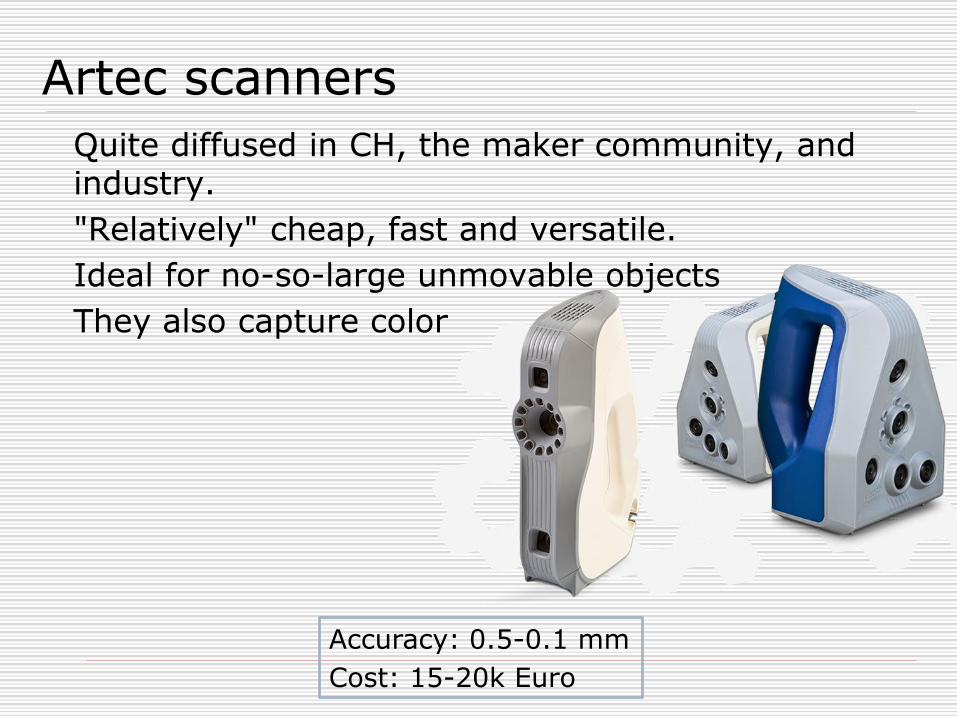
Artec scanners
Quite diffused in CH, the maker community, and industry.
"Relatively" cheap, fast and versatile.
Ideal for no-so-large unmovable objects
They also capture color
Accuracy: 0.5-0.1 mm
Cost: 15-20k Euro
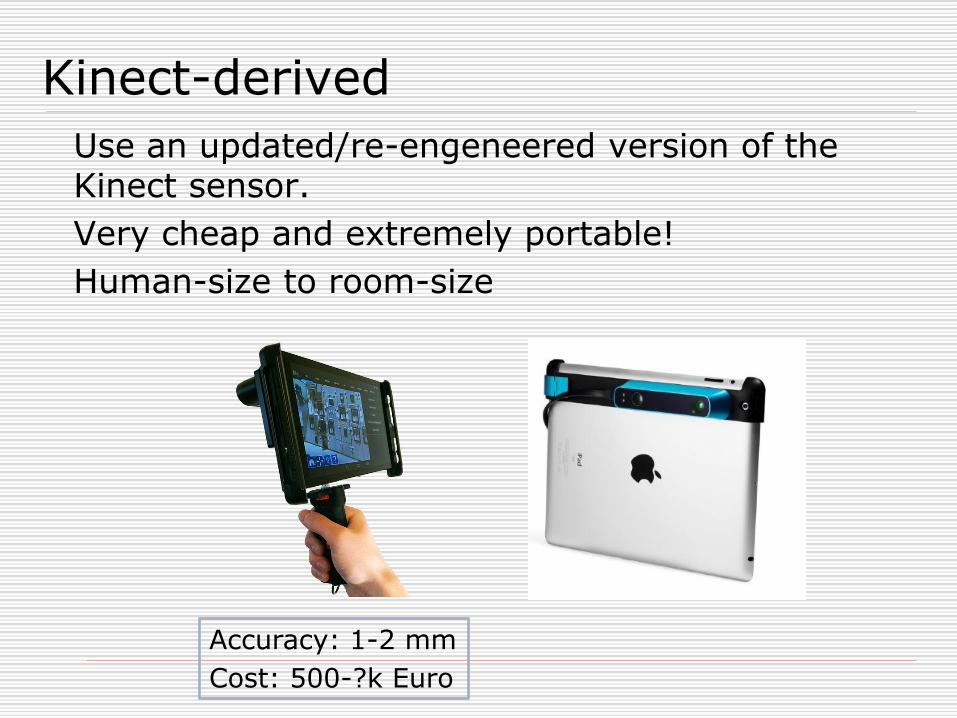
Kinect-derived
Use an updated/re-engeneered version of the Kinect sensor.
Very cheap and extremely portable!
Human-size to room-size
Accuracy: 1-2 mm
Cost: 500-?k Euro
What about larger Objects ?
This is a very common question... The answer is, you do need a different instrument
Triangulation cannot work on very large objects, it would require an extremely large baseline...
Always remaining in the kingdom of light signals and optical properties, a different strategy is used
These scanners are often indicated as TERRESTRIAL LASER SCANNERS...
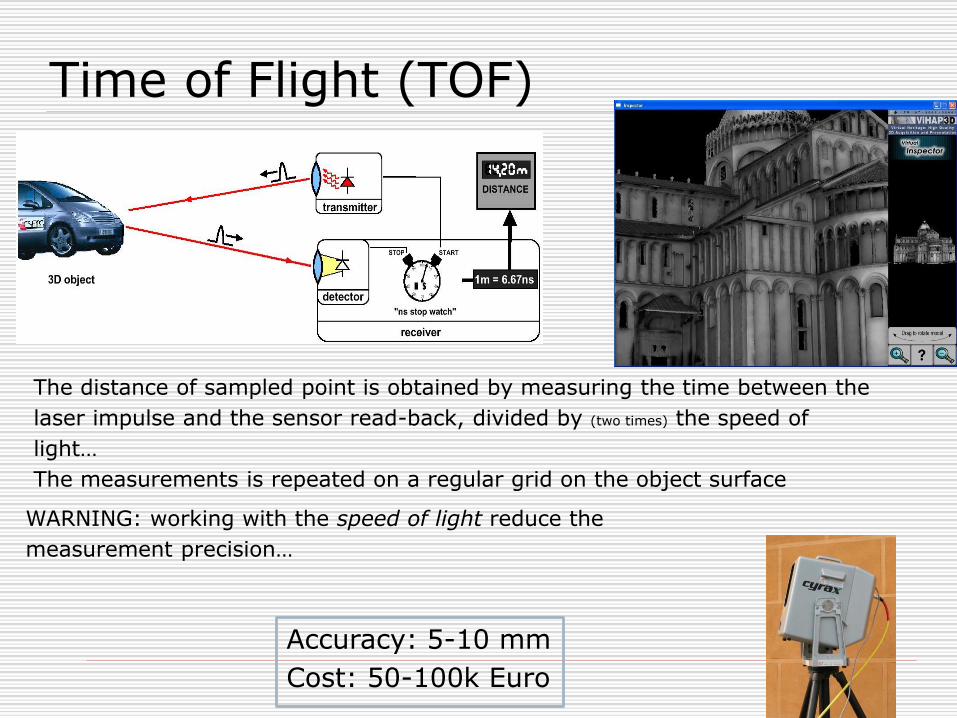
Time of Flight (TOF)
The distance of sampled point is obtained by measuring the time between the
laser impulse and the sensor read-back, divided by (two times) the speed of
light…
The measurements is repeated on a regular grid on the object surface
WARNING: working with the speed of light reduce the
measurement precision…
Accuracy: 5-10 mm
Cost: 50-100k Euro

Phase interference
The same principle is used on two different scales:
CONOSCOPY: coins, paintings, small relief
INTERFERENCE TOF: buildings
actually, three: interference cameras for human-size objects,
using fast, synchronized “flashes”
The direct and the reflected beam arrive on the crystal, frequencies are no longer aligned, producing interference… interference bands are used to determine the distance of the sample
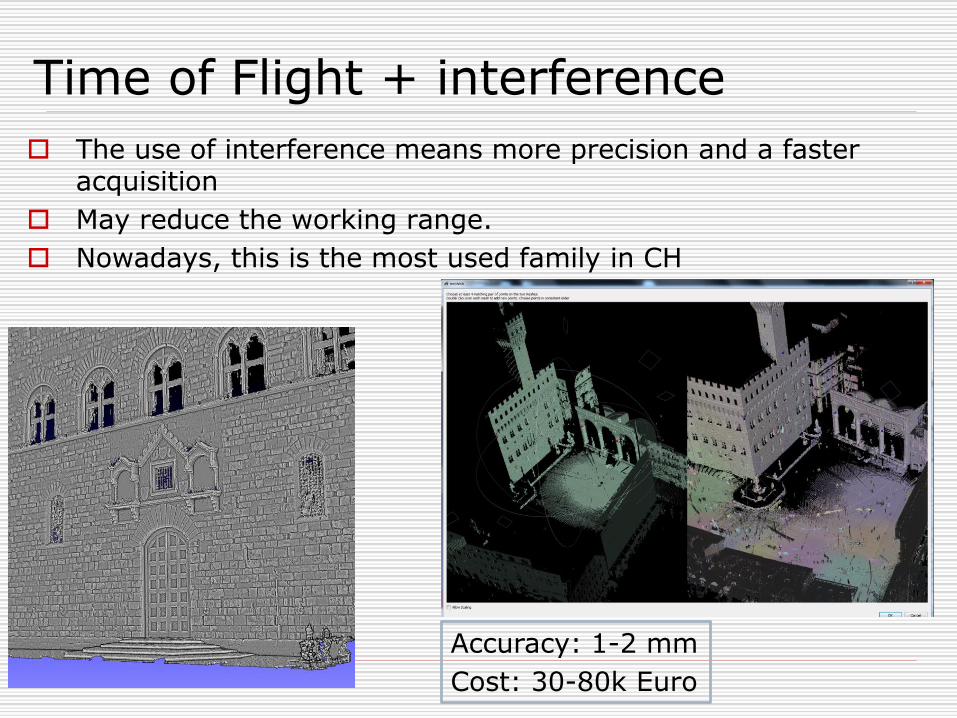
Time of Flight + interference
The use of interference means more precision and a faster acquisition
May reduce the working range.
Nowadays, this is the most used family in CH
Accuracy: 1-2 mm
Cost: 30-80k Euro
Big Names
Leica (Cyrax): most diffused, produces all possible tools for survey
FARO: affordable and most portable, also produces small-scale 3D scanners
RIEGL: long range scanners, and inertial platforms
Z+F: produces sensor hardware, sometimes re-branded by other companies
TOPCON: extremely popular in US for engineering and construction works
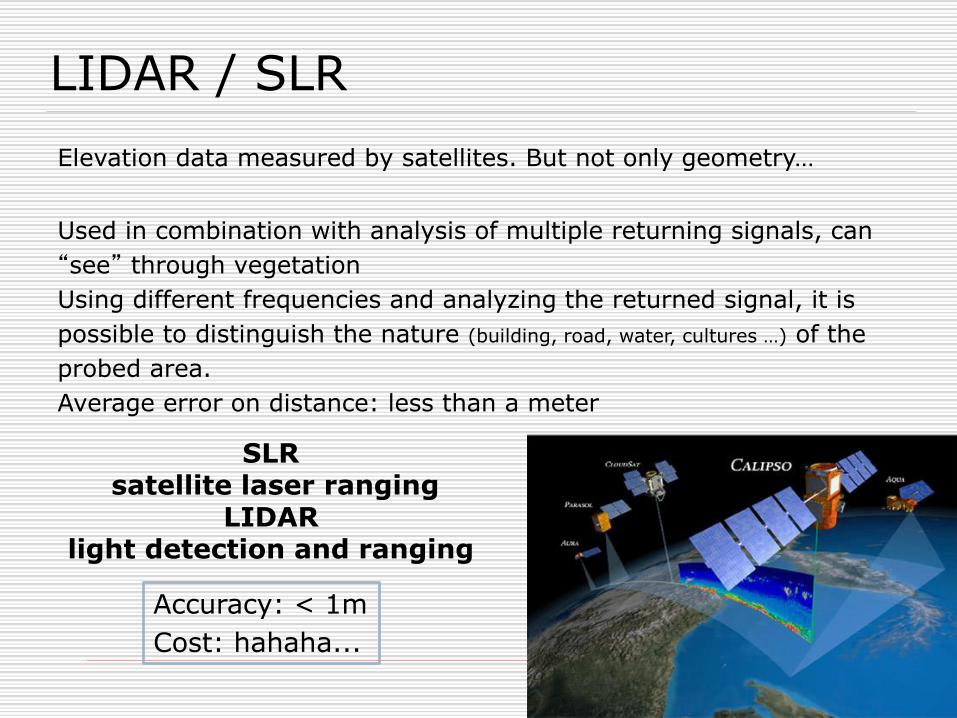
LIDAR / SLR
Elevation data measured by satellites. But not only geometry…
Used in combination with analysis of multiple returning signals, can
“see” through vegetation
Using different frequencies and analyzing the returned signal, it is
possible to distinguish the nature (building, road, water, cultures …) of the
probed area.
Average error on distance: less than a meter
SLRsatellite laser ranging
LIDAR light detection and ranging
Accuracy: < 1m
Cost: hahaha...

Microsoft KINECT v2
New version, much better capabilities... Uses a Time of Flight camera. Resolution is better, as also accuracy.
The kind of noise is different, some of the software tools for kinect V1 do not work with the new version
A set of tools to
exploit this new
performances is
still missing
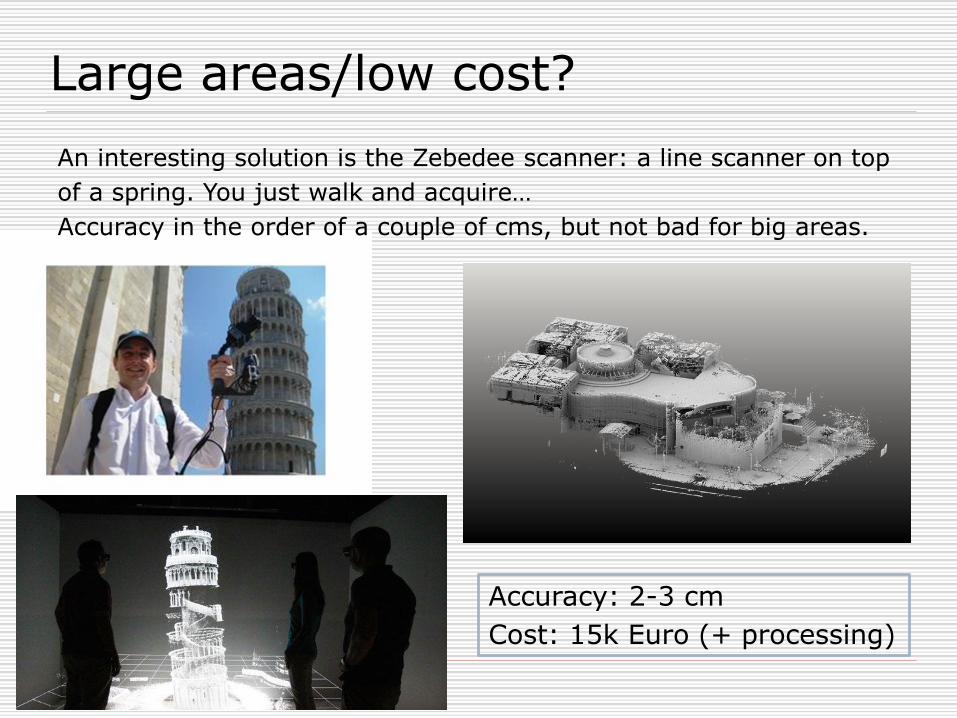
Large areas/low cost?
An interesting solution is the Zebedee scanner: a line scanner on top
of a spring. You just walk and acquire…
Accuracy in the order of a couple of cms, but not bad for big areas.
Accuracy: 2-3 cm
Cost: 15k Euro (+ processing)
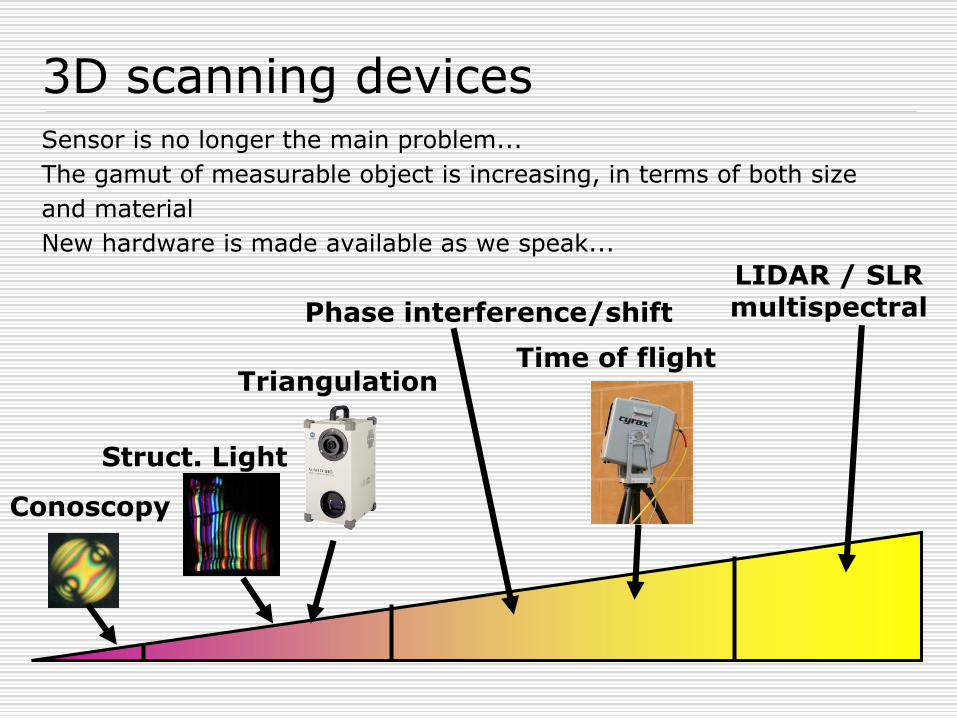
3D scanning devicesSensor is no longer the main problem...
The gamut of measurable object is increasing, in terms of both size
and material
New hardware is made available as we speak...
TriangulationTime of flight
Conoscopy
LIDAR / SLRmultispectral
Struct. Light
Phase interference/shift
Only points
Regardless of the technology, 3D scanners only
measure the spatial position of POINTS.
All that is returned from a single “shot” is just a series
of points in the 3D space.
The characteristics of the points generated by the
scanner do depends from the kind of scanner used.

Range map
Almost all optical scanners uses a camera as input device.
What is recovered after a single shot is a depth value for each
pixel in its sensor which is converted in a 3D point.
So, from the point of view of the scanner, all the 3D points are
on a REGULAR GRID, that is promptly triangulated using this
intrinsic regularity.
This is possible (without introducing much error) because of the
limited Z-span.
The result of a single scan is generally
called a RANGE MAP
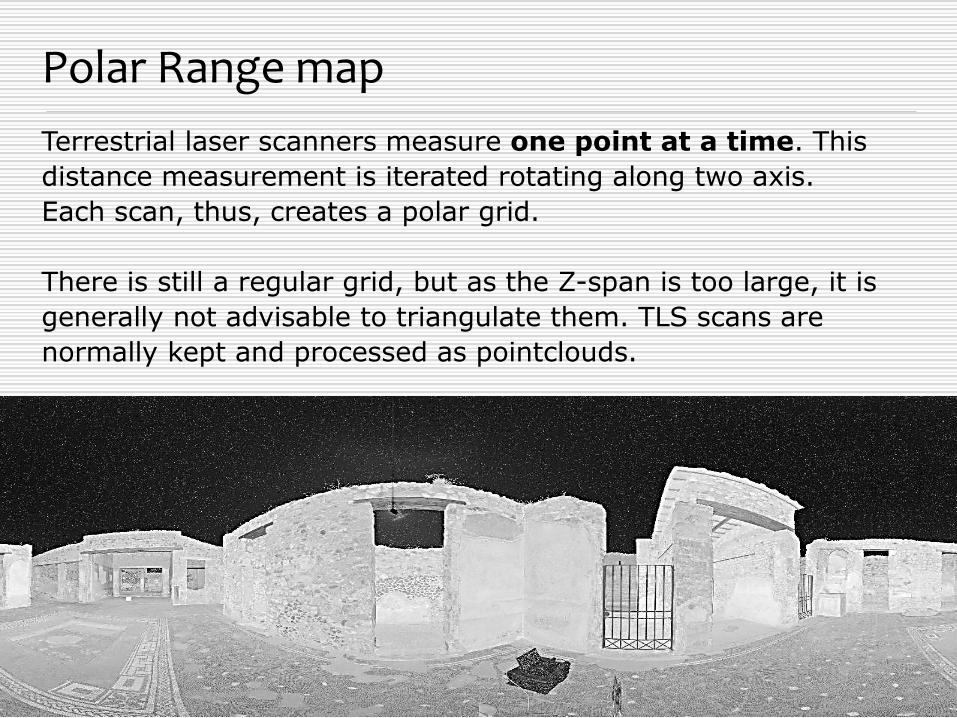
Polar Range map
Terrestrial laser scanners measure one point at a time. This
distance measurement is iterated rotating along two axis.
Each scan, thus, creates a polar grid.
There is still a regular grid, but as the Z-span is too large, it is
generally not advisable to triangulate them. TLS scans are
normally kept and processed as pointclouds.
Aggregated clouds
Some scanners (mostly handhelds) do produce aggregated clouds, where the grid/radial structure is lost.
This is because some processing (alignment, as we will see later) has already been done.
This restricts the kind of filtering, cleaning and processing you may do on the raw data.
There is not much you can do about it, save that to use it as a whole.
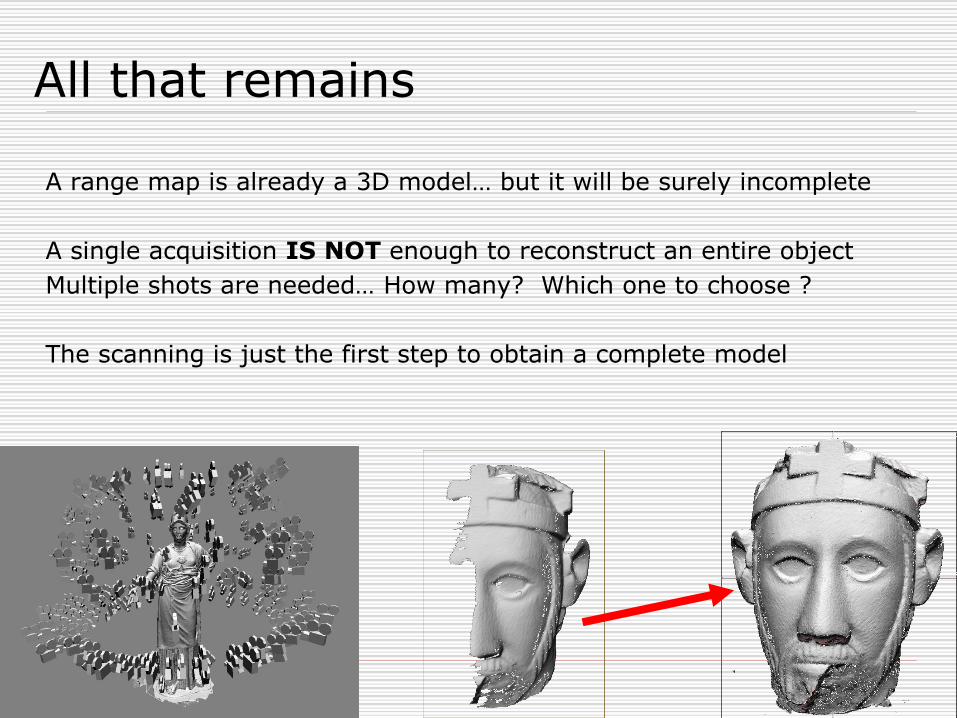
All that remains
A range map is already a 3D model… but it will be surely incomplete
A single acquisition IS NOT enough to reconstruct an entire object
Multiple shots are needed… How many? Which one to choose ?
The scanning is just the first step to obtain a complete model
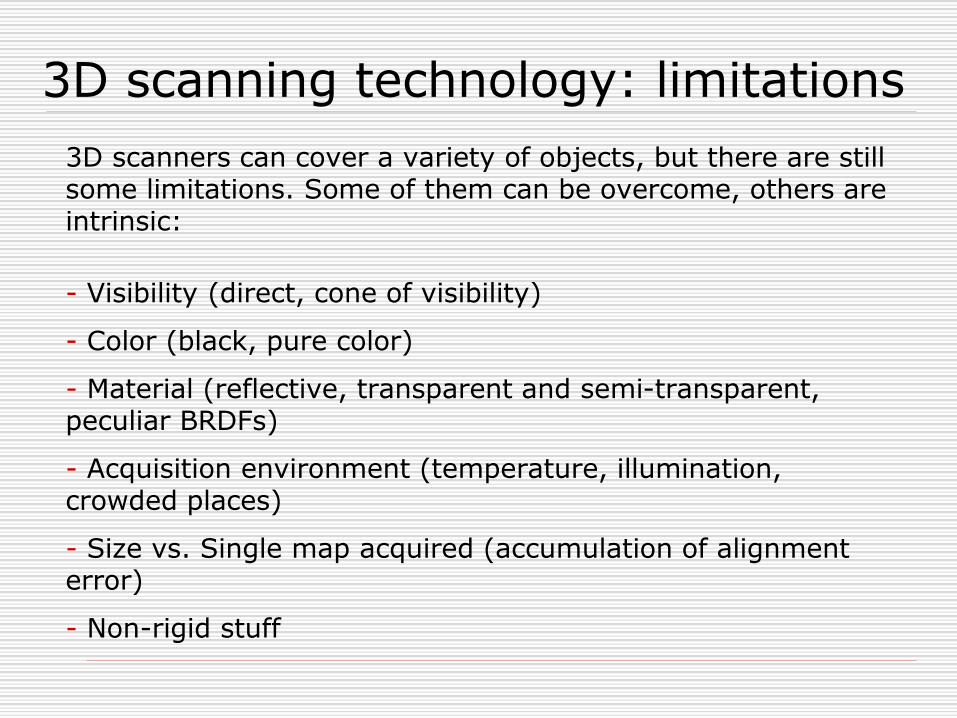
3D scanning technology: limitations
3D scanners can cover a variety of objects, but there are still some limitations. Some of them can be overcome, others are intrinsic:
- Visibility (direct, cone of visibility)
- Color (black, pure color)
- Material (reflective, transparent and semi-transparent, peculiar BRDFs)
- Acquisition environment (temperature, illumination, crowded places)
- Size vs. Single map acquired (accumulation of alignment error)
- Non-rigid stuff

The «Error»
Everyone asks “how precise is this scanner / 3D model?”. But this is a very tricky question…
Scanner data sheets are laboratory condition, determined with metrology tests. They are significant as the tech specs of your car (i.e. not that much)
On-the-field conditions do affect the data quite a lot, so do the material of the object, so do the scanner distance/angle. So, it is not even possible to give a single number for the accuracy of a single shot of the scanner, as the value changes point by point.
X-Y error is different from Z error:
X-Y position is determined by the scanning grid (low error)
Z (depth) is calculated, and here is most of the error
The «Error»
It has been proven error in a single scan is not “white noise”, but still, it can be lessened by redundancy.
There are systematic and recurring errors, sometimes local (specular highlights, black-to-white), sometimes global (vibrations, moiré patterns).
Determination of the error is often a matter of “thumbing it”
Error is bound by the greatest of:
Resolution (how far are two measured points)
Actually, should be half of the resolution for the sampling theorem
Scanner sampling error (at leas the value in the data sheets, but normally higher)

ModelGeneration
And now?
Now the real work begins... From single shots to a complete, usable 3D model.
Every scanner is bundled with a control software. The software is able to do all the processing. This is true in some cases, but often you will rely on external tools
Software tools
Beside a series of very specialized tools for 3D data processing, these three software are the most used general-purpose tools in CH:
GEOMAGIC: commercial, the most used tool by professionals.
MeshLab: opensource, 3D meshes and pointclouds processing, powerful and versatile. Not really user friendly.
CloudCompare: opensource, for the processing of pointclouds. Very advanced and versatile. Even less user friendly.
3D Scanning Pipeline
52
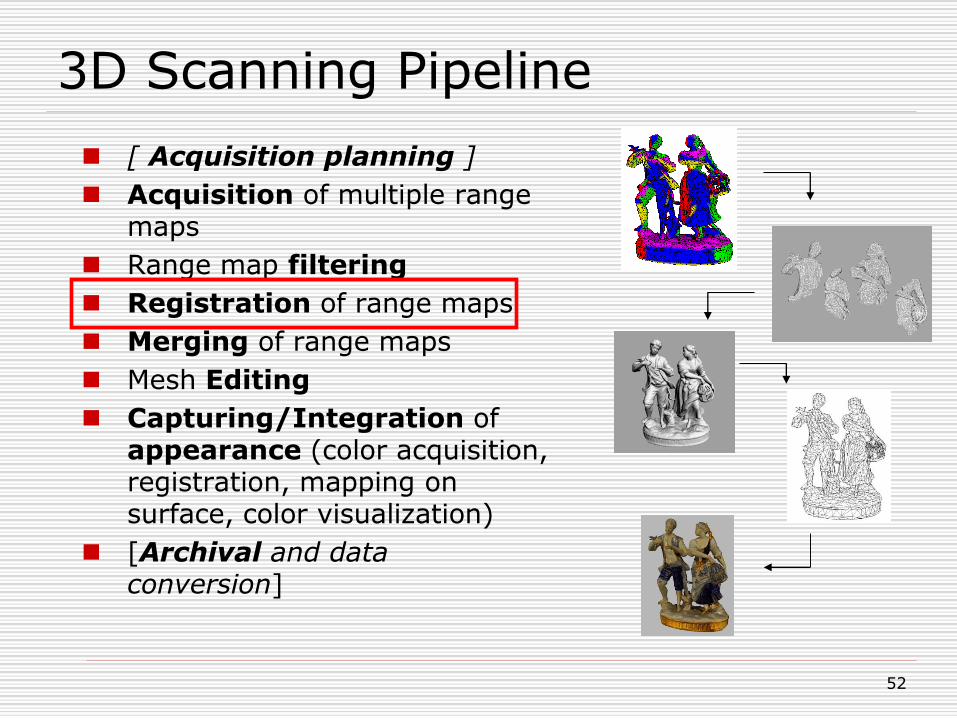
[ Acquisition planning ]
Acquisition of multiple range maps
Range map filtering
Registration of range maps
Merging of range maps
Mesh Editing
Capturing/Integration of appearance (color acquisition, registration, mapping on surface, color visualization)
[Archival and data conversion]
Alignment
Each part of the model is in its own coordinate system. There is no
spatial relationship between the different parts, as they have been
generated in a different shot
Goal: bring all the parts in a common reference system (like a 3D
jigsaw puzzle)
Beware: lot of manual intervention is needed!
Two steps:
1. Rough alignment: user manually positions the various chunks in more or less the correct position
2. Fine alignment: the computer automatically perfecs the alignment using the shared area between the range maps
Redundancy is MANDATORY
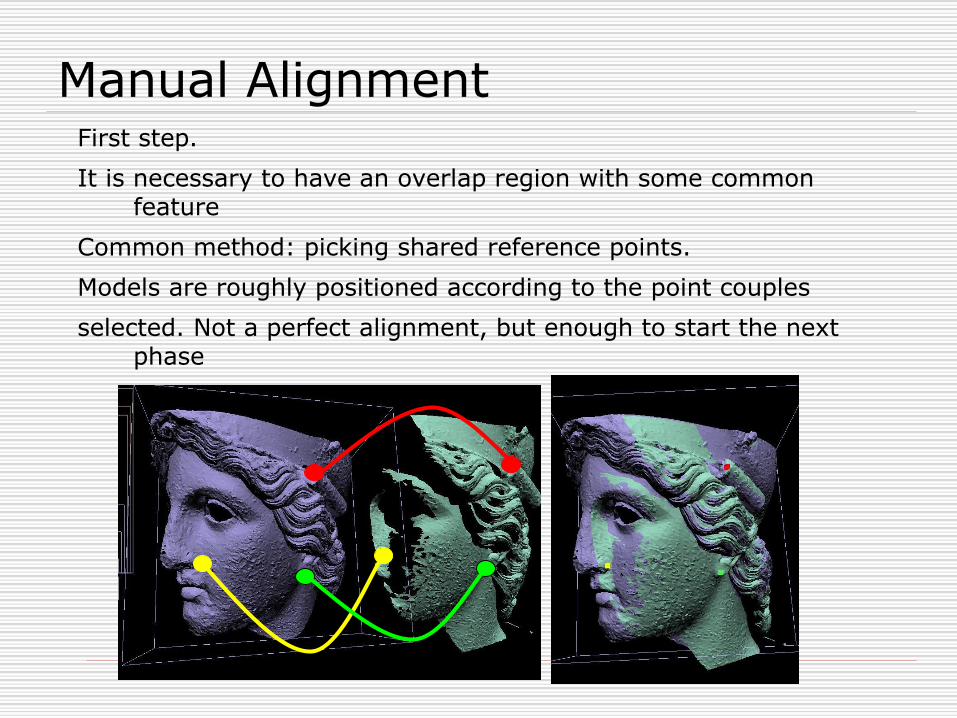
Manual AlignmentFirst step.
It is necessary to have an overlap region with some common feature
Common method: picking shared reference points.
Models are roughly positioned according to the point couples
selected. Not a perfect alignment, but enough to start the next phase

Fine alignment
All the range maps are finely registered using redundant areas
that are present in adjacent range maps.
Range maps are moved until the common parts are sticked
together
More than 2
This strategy is for two meshes. What happens when there are more than 2?
ICP alignment is done on all the overlapping couples
Global optimization, a.k.a. Bundle adjustement is used to combine all individual movements, and evenly distribute the error
This ICP+global strategy is used by all software tools, with a lot of differences in implementation and interface.
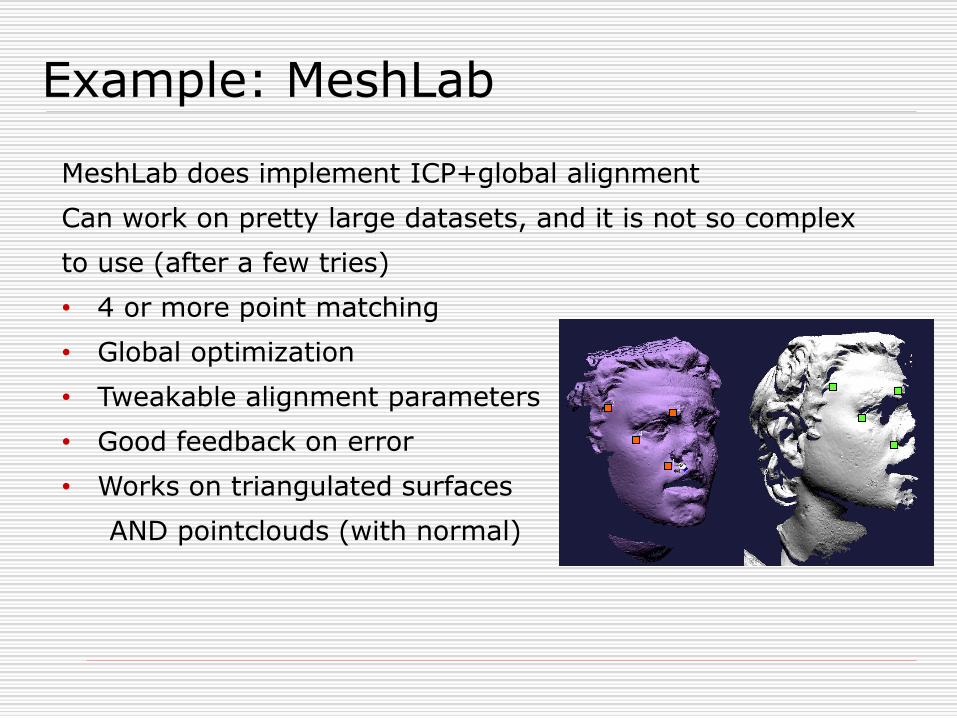
Example: MeshLab
MeshLab does implement ICP+global alignment
Can work on pretty large datasets, and it is not so complex
to use (after a few tries)
• 4 or more point matching
• Global optimization
• Tweakable alignment parameters
• Good feedback on error
• Works on triangulated surfaces
AND pointclouds (with normal)
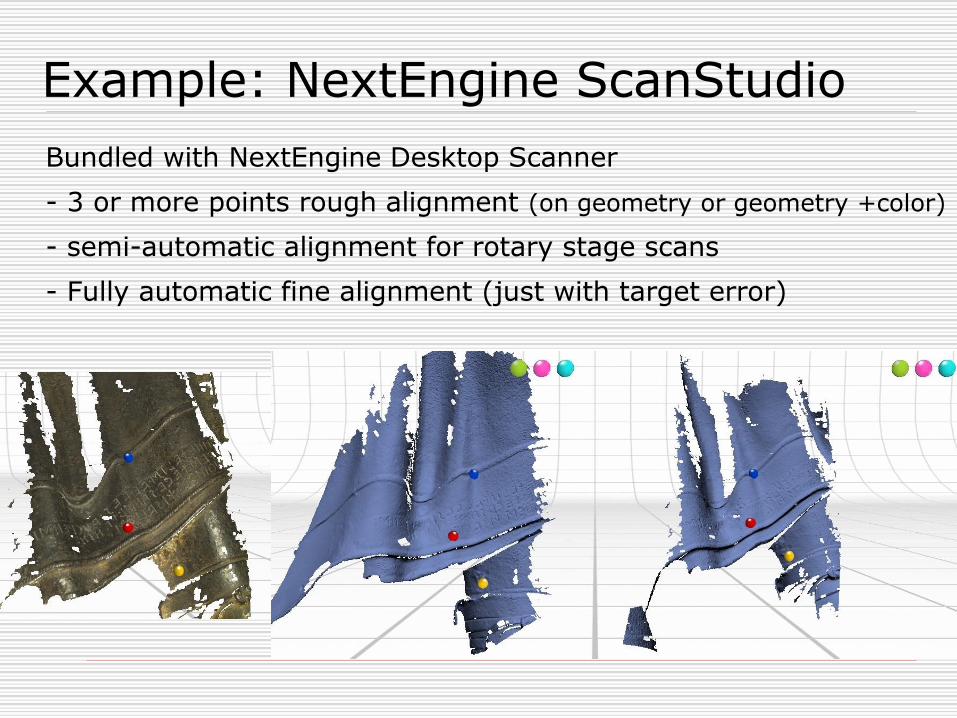
Example: NextEngine ScanStudio
Bundled with NextEngine Desktop Scanner
- 3 or more points rough alignment (on geometry or geometry +color)
- semi-automatic alignment for rotary stage scans
- Fully automatic fine alignment (just with target error)

Example: Minolta PET
- alignment during acquisition, selecting points on the viewfinder
- 1 point alignment (if possible)
- Automatic alignment for rotary stage scans
- Fully automatic fine alignment (some parameters)
Example: Breuckman / GOM
Metrology devices have a more advanced processing software…
- Align while scanning: software automatically finds alignment of new scans, comparing the new scan with the previous one and what has already been scanned.
- If automatic alignment fails, software asks for 1 reference point (GOM) or multiple reference points until convergence (Breuckman)
- Fully automatic fine alignment
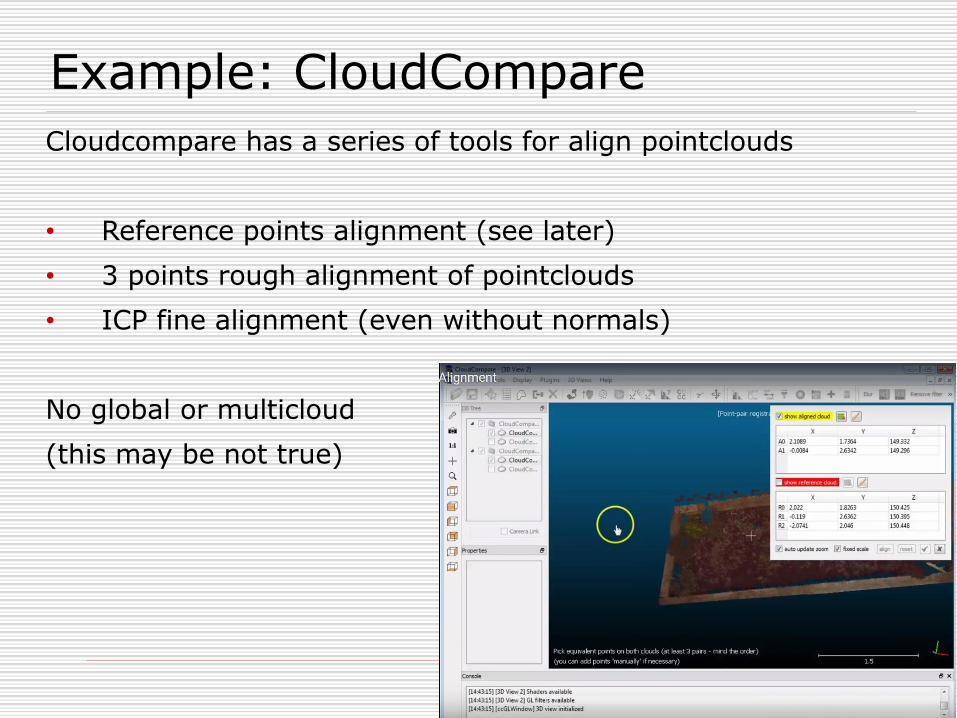
Example: CloudCompare
Cloudcompare has a series of tools for align pointclouds
• Reference points alignment (see later)
• 3 points rough alignment of pointclouds
• ICP fine alignment (even without normals)
No global or multicloud
(this may be not true)
Not always necessary
Not all scans need the alignment step or, at least, an
explicit alignment step.
Satellite data generally comes already geo-referenced
Scanner tracking / Progressive tracking
Scans can be aligned using reference markers…
Automatic matching and alignment is possible in some cases
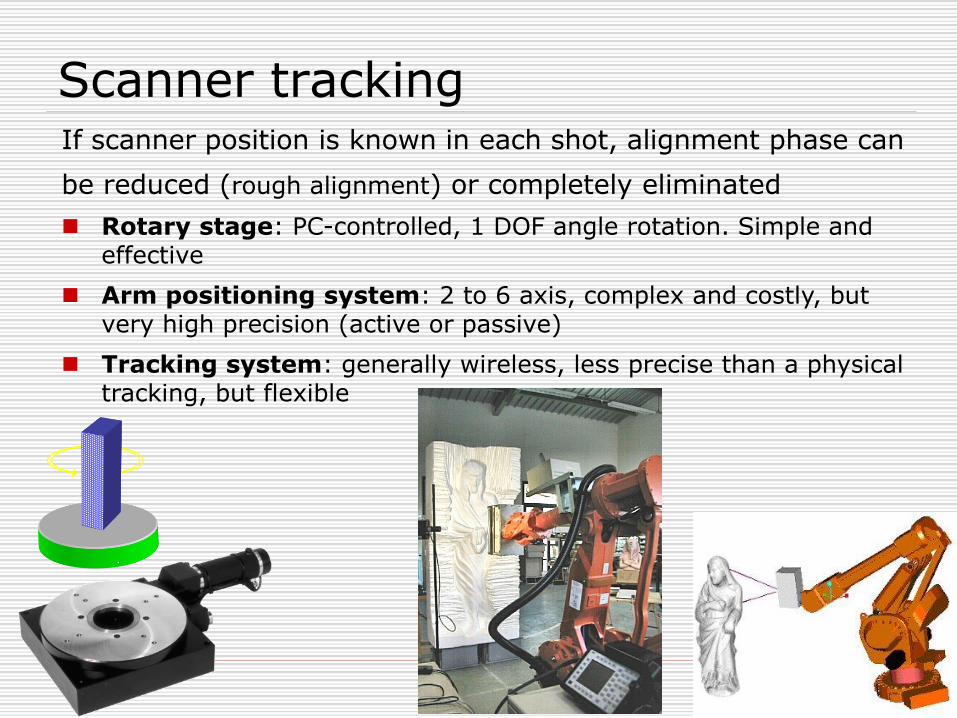
Scanner trackingIf scanner position is known in each shot, alignment phase can
be reduced (rough alignment) or completely eliminated
Rotary stage: PC-controlled, 1 DOF angle rotation. Simple and effective
Arm positioning system: 2 to 6 axis, complex and costly, but very high precision (active or passive)
Tracking system: generally wireless, less precise than a physical tracking, but flexible

Progressive tracking
Most hand-held scanners scan continuosly (or a few times per second)...
Each «shot» is aligned to the previous one (or to the accumulated pointcloud)
Error accumulates... So, in most cases, a global optimization is carried out at the end of the scan session.
Different session has to be aligned as described here.
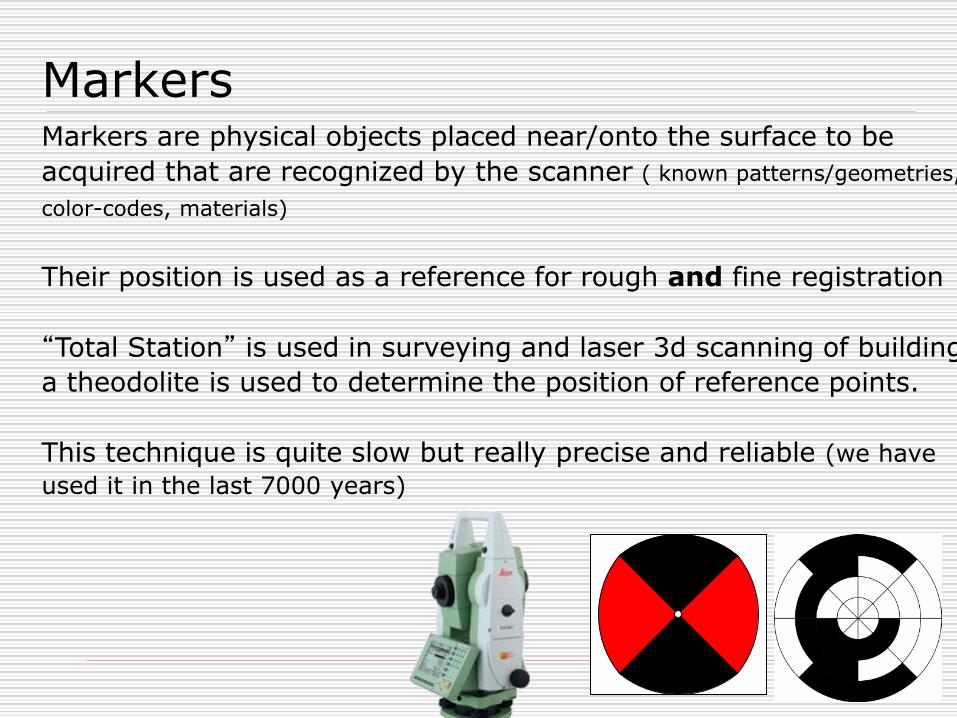
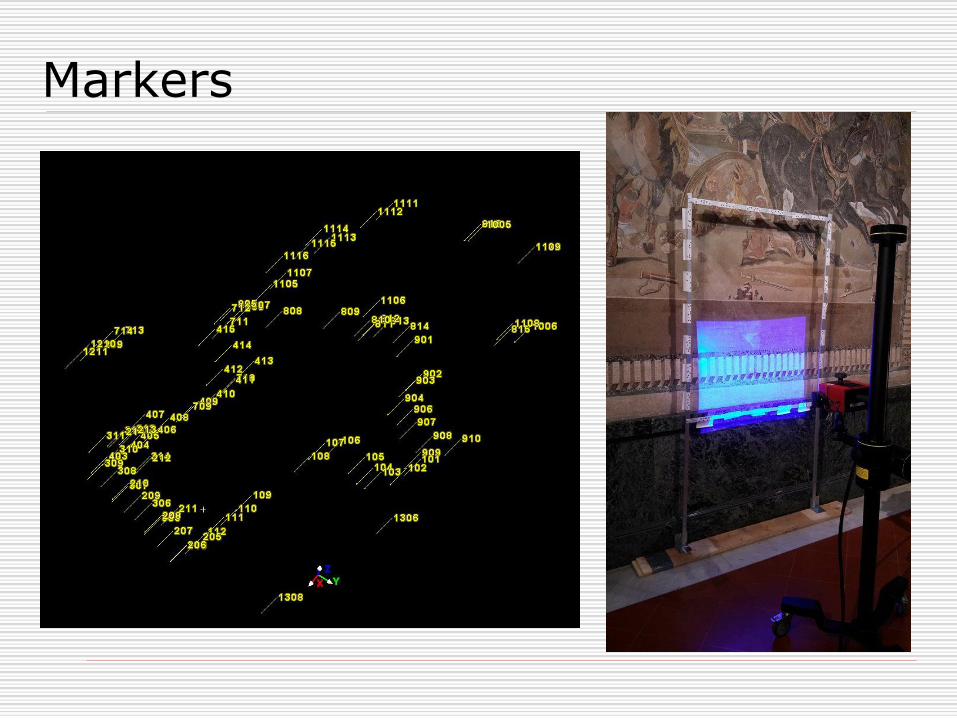
MarkersMarkers are physical objects placed near/onto the surface to be
acquired that are recognized by the scanner ( known patterns/geometries,
color-codes, materials)
Their position is used as a reference for rough and fine registration
“Total Station” is used in surveying and laser 3d scanning of building,
a theodolite is used to determine the position of reference points.
This technique is quite slow but really precise and reliable (we have
used it in the last 7000 years)
Markers
Markers
All terrestrial laser scanners uses markers, and this option is natively present in their software
All terrestrial laser scanners software tools do accept external total station reference points
Some triangulation scanners support markers (natively or with an add-on)
It may be possile to mix reference points / markers / geometric aligment, but heavily depends on the software.

Alignment: comments
The alignment step is a key one in the scanning pipeline. In order to go on with the merging phase, an indication about the error is needed. Final error is bounded by the sum of these two values, but if alignment>>acquisition, acquisition is masked out:
- Acquisition error: the error for the single acquisition. Dependent on object, hardware, acquisition environment.
- Alignment error: the error in alignment of the range maps. Dependent on object, scans quality and number, overlapping.
Both the values are “statistically” known, and:
the alignment error cannot be less than the acquisition error.
the alignment error cannot be less than half of the acquisition resolution.
3D Scanning Pipeline
69
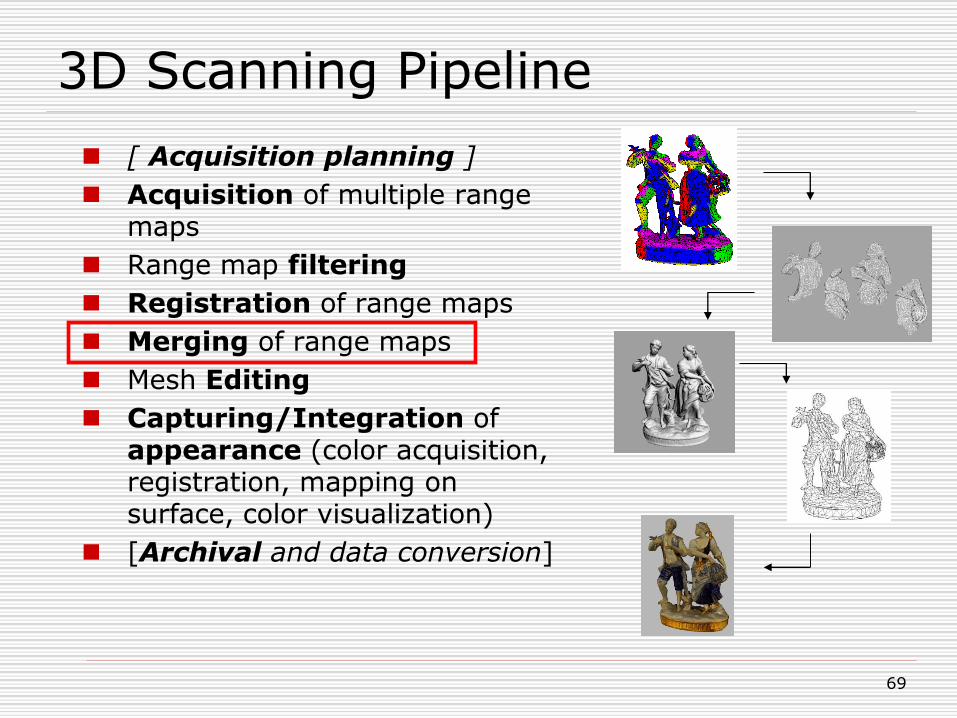
[ Acquisition planning ]
Acquisition of multiple range maps
Range map filtering
Registration of range maps
Merging of range maps
Mesh Editing
Capturing/Integration of appearance (color acquisition, registration, mapping on surface, color visualization)
[Archival and data conversion]
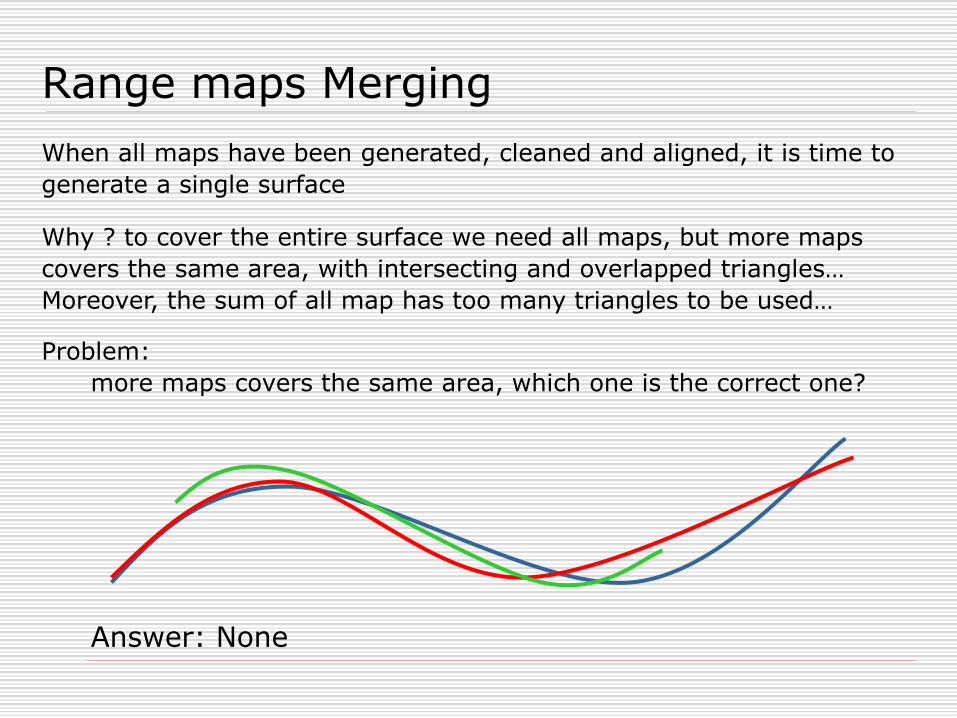
Range maps Merging
When all maps have been generated, cleaned and aligned, it is time to
generate a single surface
Why ? to cover the entire surface we need all maps, but more maps
covers the same area, with intersecting and overlapped triangles…
Moreover, the sum of all map has too many triangles to be used…
Problem:
more maps covers the same area, which one is the correct one?
Answer: None
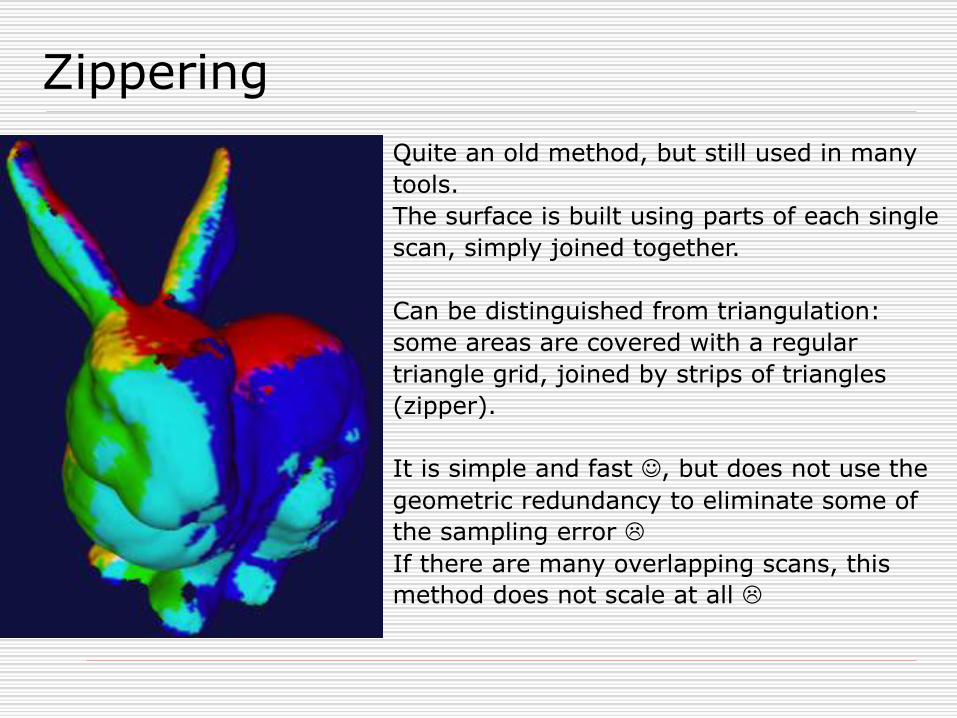
Zippering
Quite an old method, but still used in many
tools.
The surface is built using parts of each single
scan, simply joined together.
Can be distinguished from triangulation:
some areas are covered with a regular
triangle grid, joined by strips of triangles
(zipper).
It is simple and fast , but does not use the
geometric redundancy to eliminate some of
the sampling error
If there are many overlapping scans, this
method does not scale at all
Volumetric Methods
I
n
s
i
d
e
o
u
t
s
i
d
e
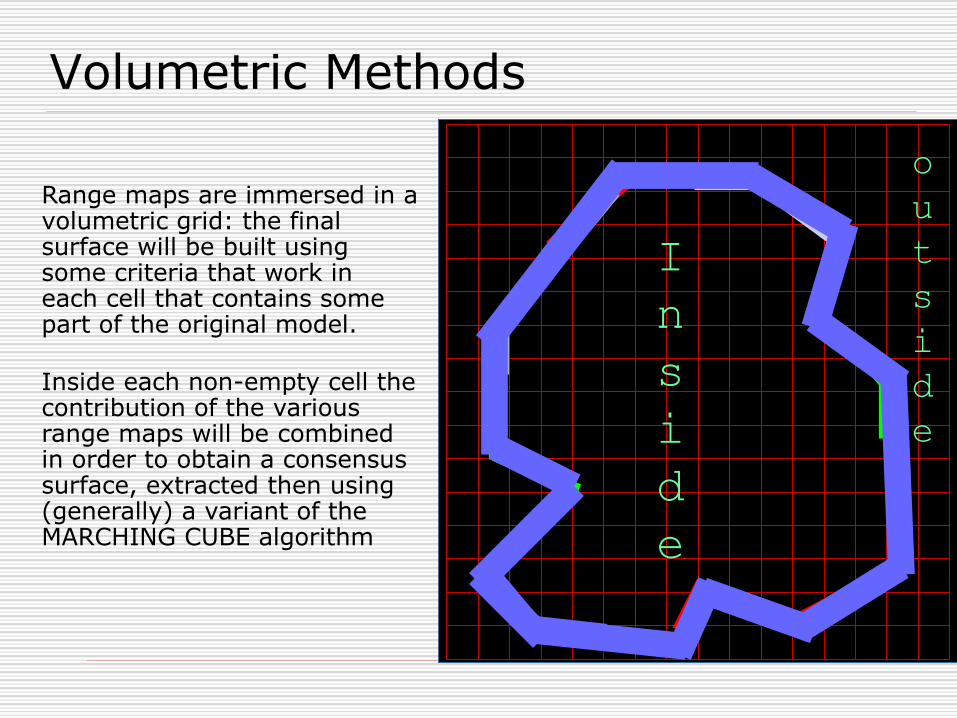
Range maps are immersed in a volumetric grid: the final surface will be built using some criteria that work in each cell that contains some part of the original model.
Inside each non-empty cell the contribution of the various range maps will be combined in order to obtain a consensus surface, extracted then using (generally) a variant of the MARCHING CUBE algorithm
Marching Cube
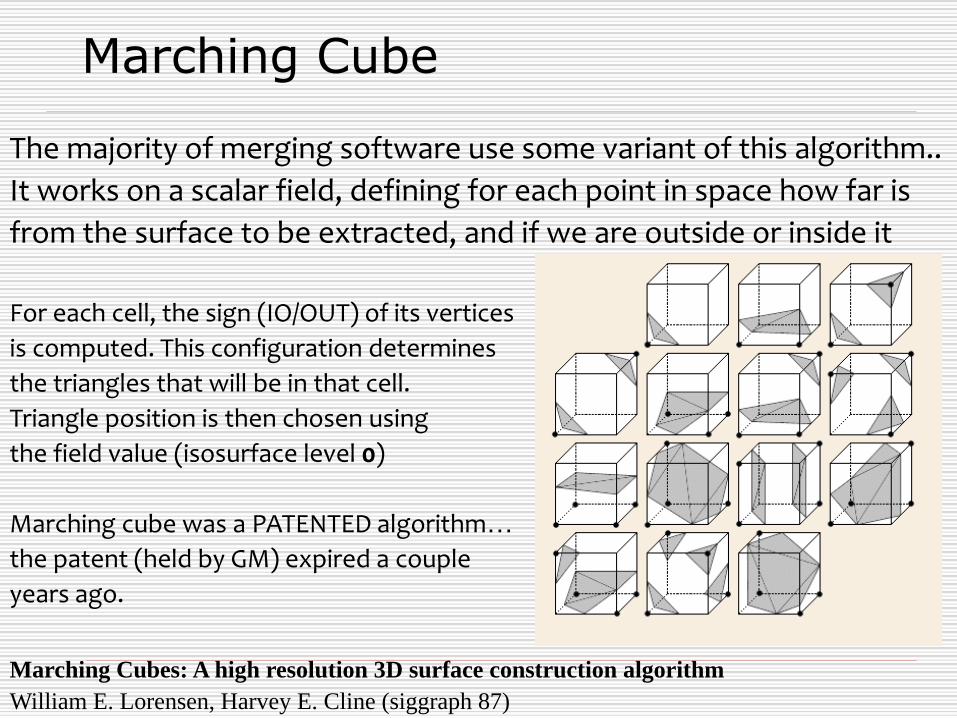
The majority of merging software use some variant of this algorithm..
It works on a scalar field, defining for each point in space how far is
from the surface to be extracted, and if we are outside or inside it
For each cell, the sign (IO/OUT) of its vertices
is computed. This configuration determines
the triangles that will be in that cell.
Triangle position is then chosen using
the field value (isosurface level 0)
Marching cube was a PATENTED algorithm…
the patent (held by GM) expired a couple
years ago.
Marching Cubes: A high resolution 3D surface construction algorithm
William E. Lorensen, Harvey E. Cline (siggraph 87)
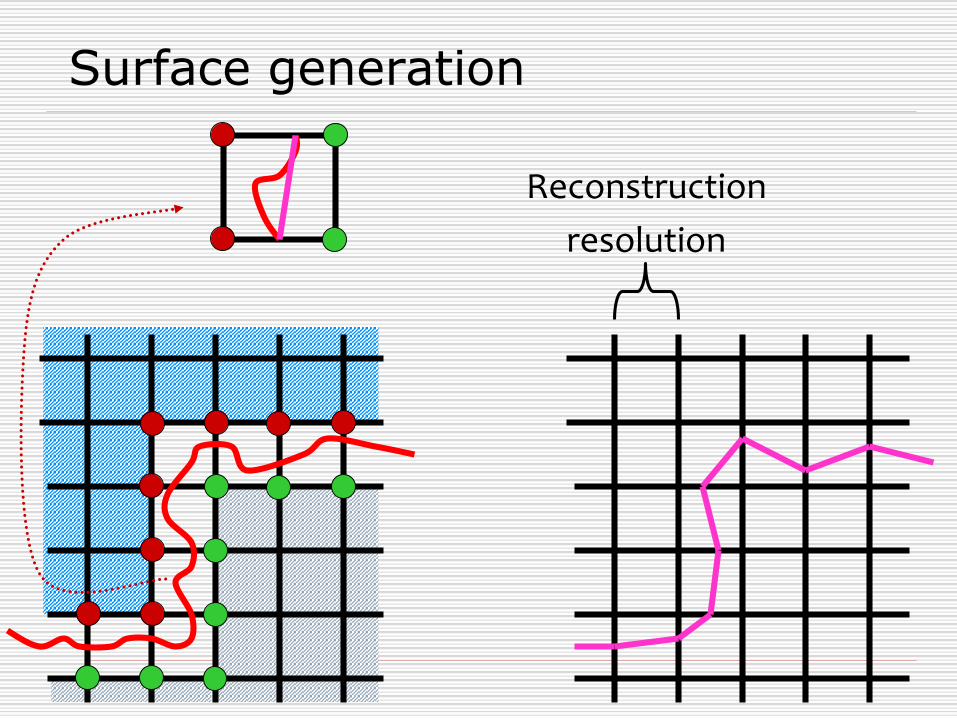
Surface generation
Reconstruction
resolution
Distance Field
In order to use the Marching Cube, we need a scalar field in the
object volume… It is easy to obtain this in medical data (density
field); but what about range maps/3d scans ?
Each surface produces a field: zero on the surface itself, positive
growing towards the inside, negative growing towards the outside
(just following the normal orientation)
Contribution from the various surfaces are added…
The isosurface 0 is extracted by marching cube…
A Volumetric Method for Building Complex Models from Range Images
Brian Curless and Marc Levoy
Filling Holes in Complex Surfaces using Volumetric Diffusion
James Davis Stephen R. Marschner Matt Garr Marc Levoy

Distance Field
MLS: Moving Least Squares
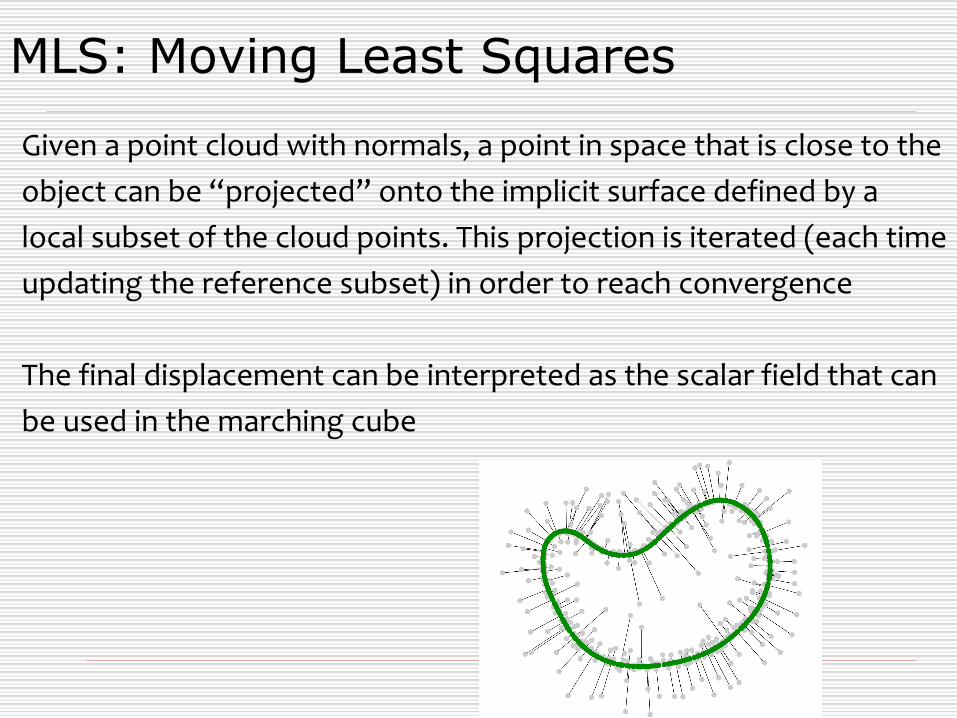
Given a point cloud with normals, a point in space that is close to the
object can be “projected” onto the implicit surface defined by a
local subset of the cloud points. This projection is iterated (each time
updating the reference subset) in order to reach convergence
The final displacement can be interpreted as the scalar field that can
be used in the marching cube
MLS: Moving Least Squares
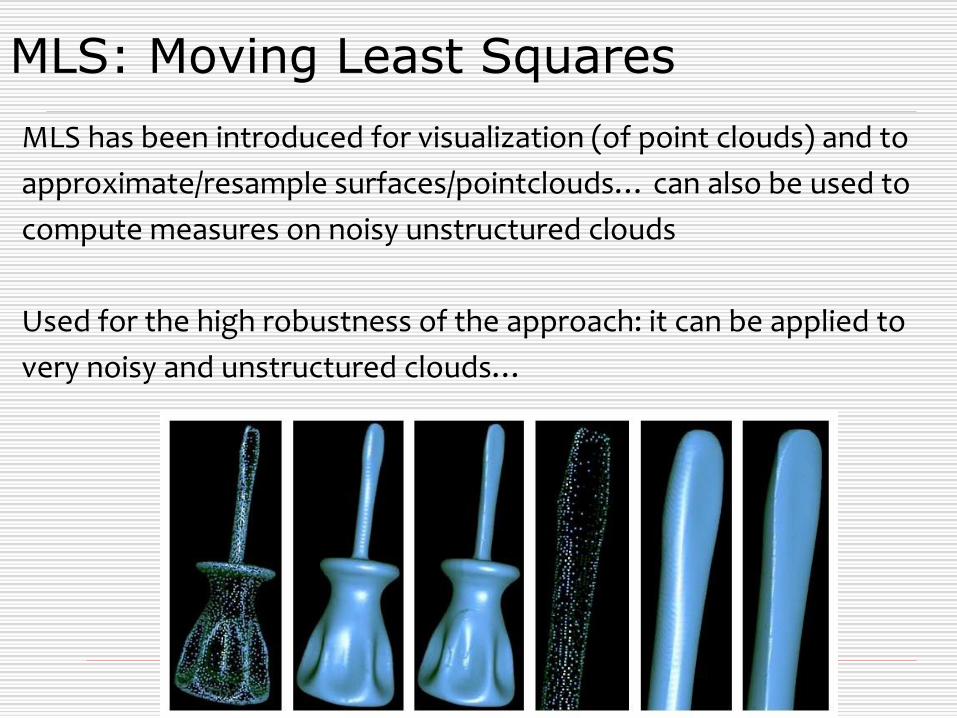
MLS has been introduced for visualization (of point clouds) and to
approximate/resample surfaces/pointclouds… can also be used to
compute measures on noisy unstructured clouds
Used for the high robustness of the approach: it can be applied to
very noisy and unstructured clouds…
MLS: Moving Least Squares
Original paper, general application:
Defining Point-Set Surfaces
Nina Amenta, Yong Joo Kil
Another paper, both projection and merging:
Volume MLS Ray Casting
C. Ledergerber, G. Guennebaud, M. Meyer, M. Bacher, H. Pfister
Implicit surfaces
Another possible approach:
Use the data to build a mathematical surface of approximation
Triangulate the mathematical surface using some tessellation OR similarly to the volumetric methods (computing triangulation in each cell)
The use of an intermediate mathematical/analytical
representation helps creating smoother surfaces
and correct problems in the input data (like closing
holes)
Radial Basis Functions
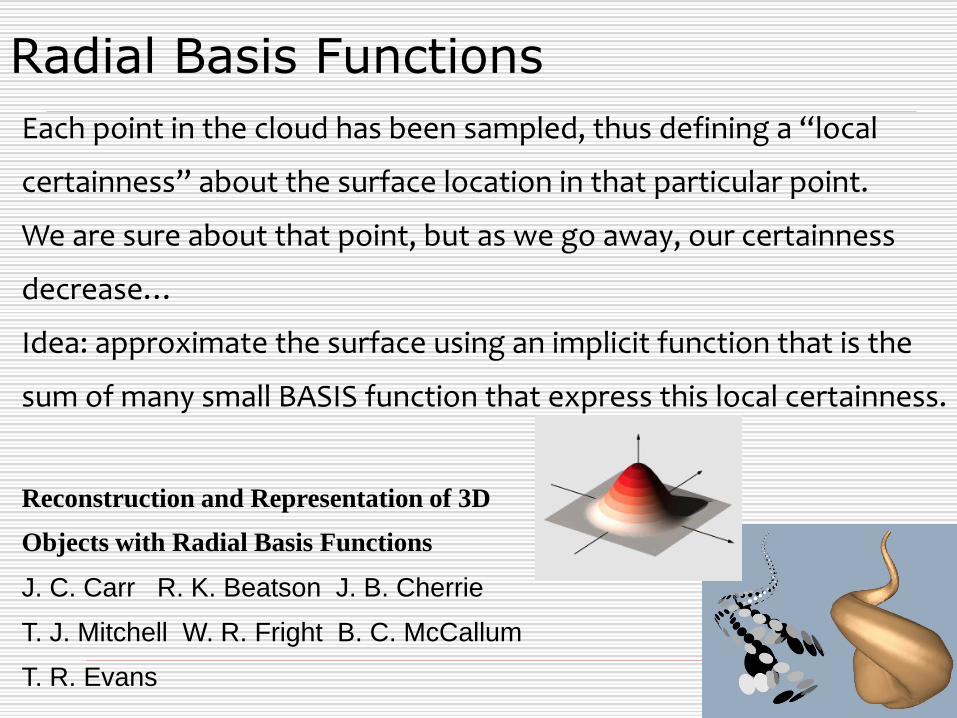
Each point in the cloud has been sampled, thus defining a “local
certainness” about the surface location in that particular point.
We are sure about that point, but as we go away, our certainness
decrease…
Idea: approximate the surface using an implicit function that is the
sum of many small BASIS function that express this local certainness.
Reconstruction and Representation of 3D
Objects with Radial Basis Functions
J. C. Carr R. K. Beatson J. B. Cherrie
T. J. Mitchell W. R. Fright B. C. McCallum
T. R. Evans
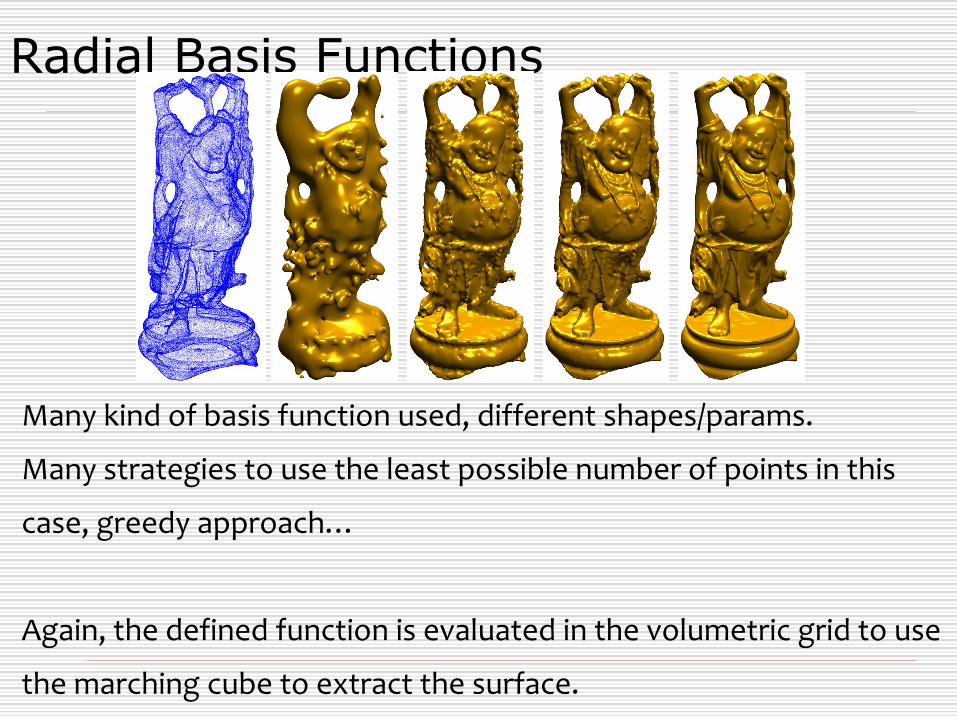
Radial Basis Functions
Many kind of basis function used, different shapes/params.
Many strategies to use the least possible number of points in this
case, greedy approach…
Again, the defined function is evaluated in the volumetric grid to use
the marching cube to extract the surface.
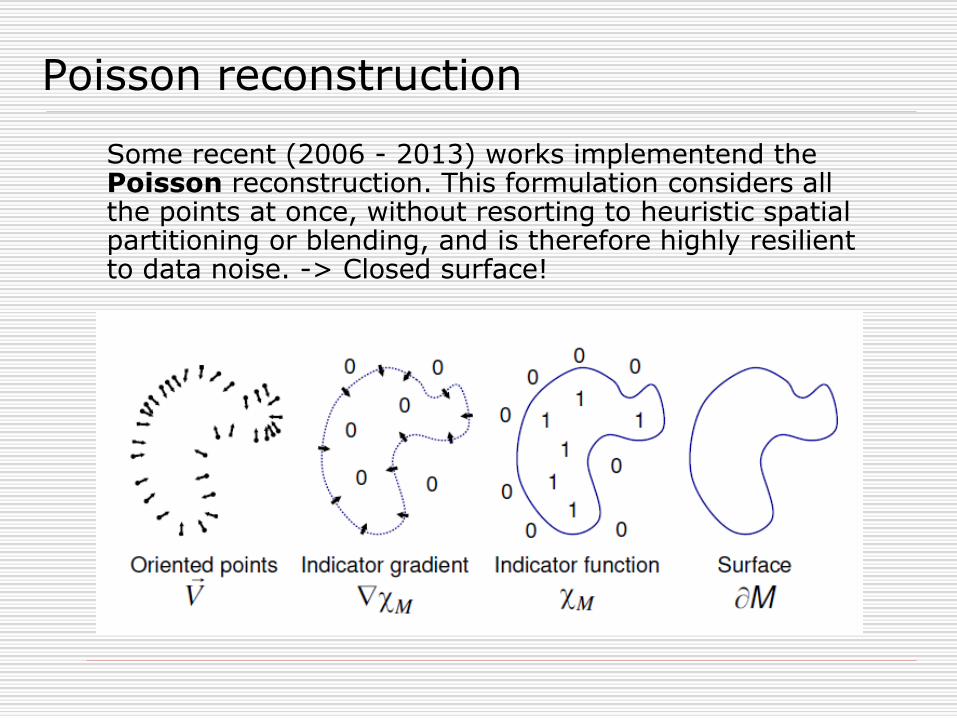
Poisson reconstruction
Some recent (2006 - 2013) works implementend the Poisson reconstruction. This formulation considers all the points at once, without resorting to heuristic spatial partitioning or blending, and is therefore highly resilient to data noise. -> Closed surface!
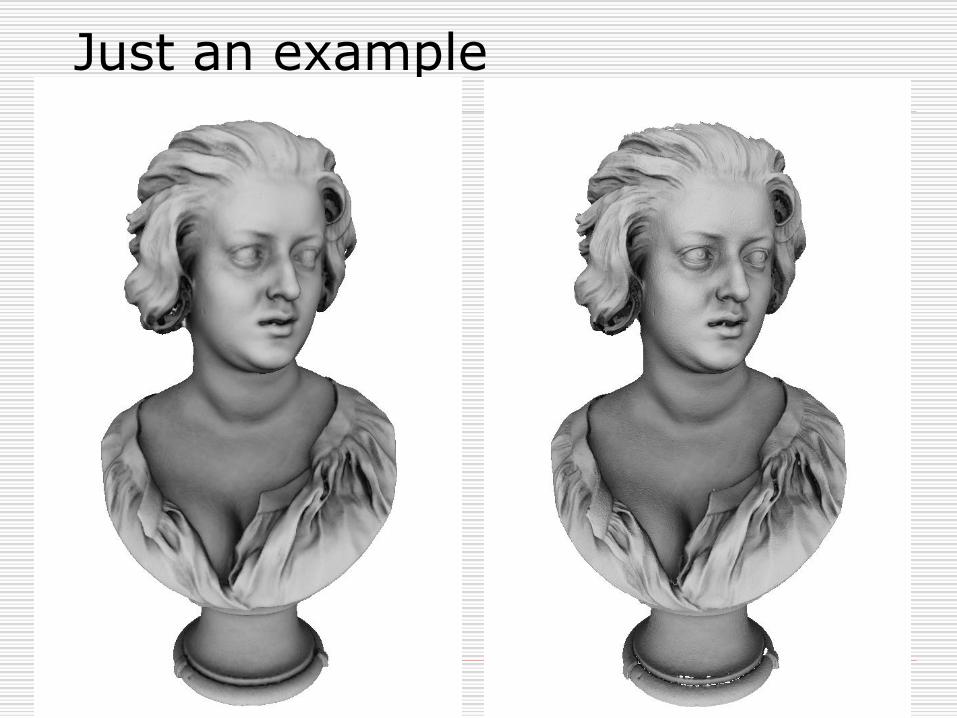
Just an example
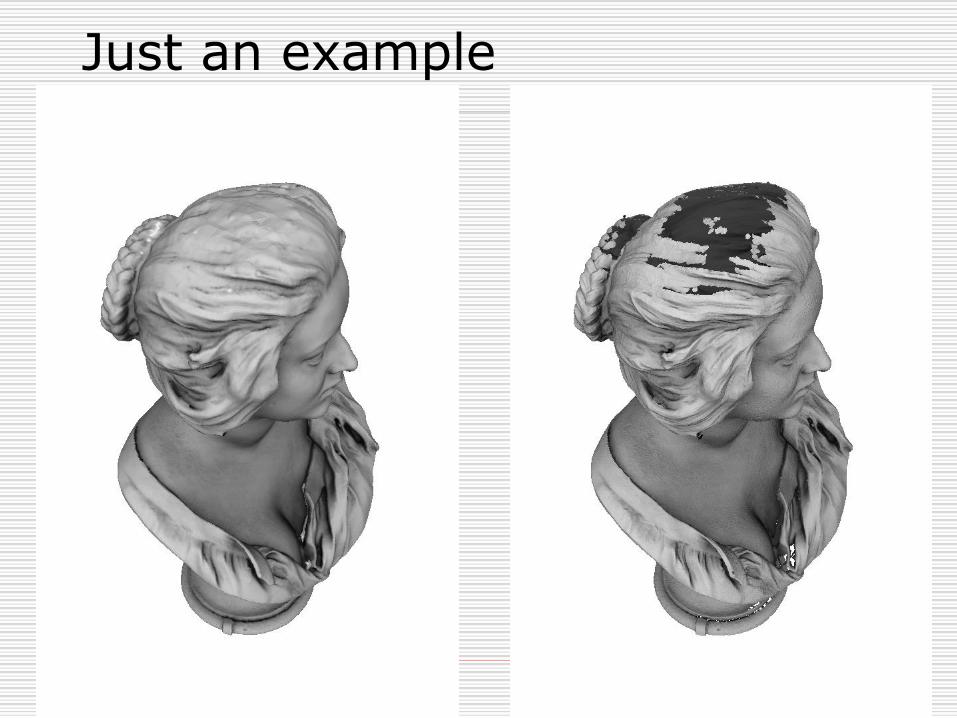
Just an example
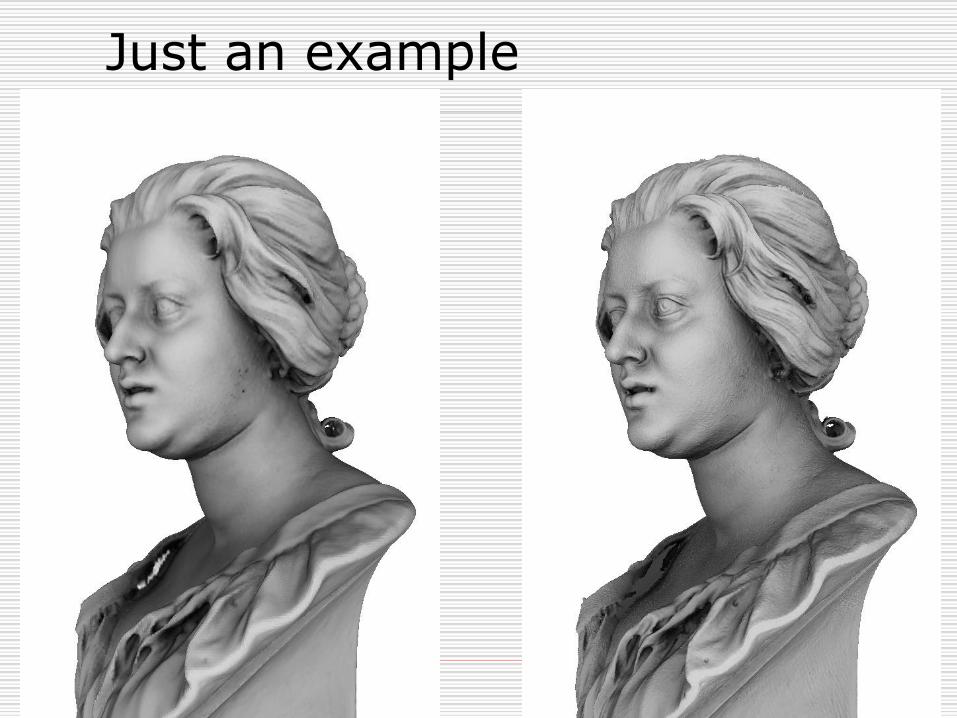
Just an example
Merging: comments
All merging methods have pro and cons… you have to find the one suitable for your project.
The software you will use will have one (or more, if you are lucky) merging method. Problem is, in some tools, merging is a complete black box, and you do have to learn its characteristics by trial and error
Beware: some methods are restricted to certain kind of data / dataset size
Merging: comments
The eternal question: what resolution should I use?
Higher resolution means more time and memory, and a heavier 3D model. RAM, Disk, CPU and GPU have limits…
You cannot go beyond the limits of your error (sampling + alignment).
It is perfectly useless to go smaller than the sampling rate.
It all depends on the use you are planning for your models
It may be fine to try getting the highest possible resolution, and then decimate (risky, but fine, also considering technology advance)
Sometimes, a pointcloud is just fine.


![Grafica 3D per i beni culturali: 3D scanning in MeshLabvcg.isti.cnr.it/corsi/G3D_InfoUma/Slides_2018/10_3DScanning_in... · 3D Scanning Pipeline 1 [ Acquisition planning] Acquisition](https://img.dokumen.tips/doc/110x75/5b14f0b17f8b9af15d8cac5d/grafica-3d-per-i-beni-culturali-3d-scanning-in-3d-scanning-pipeline-1-acquisition.jpg)