Embed Size (px)
Citation preview

Knowledge and Management of Aquatic Ecosystems (2010) 398, 02 http://www.kmae-journal.orgc© ONEMA, 2010
DOI: 10.1051/kmae/2010023
A 2-year survey of phytoplankton in the Marne Reservoir(France): A case study to validate the use of an in situspectrofluorometer by comparison with algal taxonomyand chlorophyll a measurementsA. Rolland(1), F. Rimet(1), S. Jacquet(1)
Received October 9, 2009 / Reçu le 9 octobre 2009
Revised July 8, 2010 / Révisé le 8 juillet 2010
Accepted July 16, 2010 / Accepté le 16 juillet 2010
ABSTRACT
Key-words:phytoplankton,chlorophyll a,taxonomy,bbeFluoroprobeTM,monitoring,reservoir
For almost two years (2006–2007), phytoplankton structure and distribu-tion were monitored using a combination of methods in the Marne Reser-voir (France). We used the bbe FluoroprobeTM spectrofluorometer, whichprovides vertical profiles for different algal classes and chlorophyll anal-ysis, based on the in vivo autofluorescence characteristics of the phy-toplankton. In parallel, we measured chlorophyll a (chl a) concentrationsusing the classical extraction method coupled with spectrophotometricanalyses, and calculated the biovolume of all the taxa identified usinginverted light microscopy. A very close correlation (ρ = 0.93, n = 243,p < 0.0001) was found between the total equivalent chl a concentrationsgiven by the bbe FluoroprobeTM and the total chl a concentrations (μg·L−1)provided by the spectrophotometric analysis. The closest correlation wasobtained for concentrations below 6.9 μg·L−1 whereas little or no correla-tion was found for those above 21.6 μg·L−1. The relationship was highlysignificant when total phytoplankton biovolume was compared with datafrom the probe (ρ = 0.6, n = 243, p < 0.0001), the strongest correla-tion being found for the group composed of diatoms, dinoflagellates andchrysophyceae (ρ = 0.67, p < 0.0001), while the weakest relationship wasfor the blue-green cyanobacteria (ρ = 0.33, p < 0.0001), although it wasstill highly significant. Our analysis, based on a large dataset, indicatesthat the FluoroprobeTM appears to be a reliable tool suitable for use byfresh water managers to monitor phytoplankton on any relevant time andspace scales.
RÉSUMÉ
Deux années de suivi du phytoplancton du réservoir Marne (France) : Étude de casafin de valider l’utilisation d’un spectrofluorimètre de terrain par comparaisonavec de la taxonomie et des mesures de chlorophylle a
Mots-clés :phytoplancton,chlorophylle a,taxonomie,sonde bbeFluoroprobeTM,monitoring,réservoir
La structure et la distribution du phytoplancton dans le réservoir Marne ont étéétudiées par différentes méthodes sur la période 2006–2007. Nous avons utilisé lasonde immergeable spectrofluorimétrique bbe FluoroprobeTM, qui fournit des pro-fils verticaux de différents groupes d’algues et l’analyse de la chlorophylle a, grâceaux propriétés d’autofluorescence des cellules algales. Parallèlement, la concen-tration de la chlorophylle a a été mesurée par la méthode classique d’extractionpigmentaire et d’analyse spectrophotométrique, et nous avons calculé le biovo-lume de tous les taxons identifiés par microscopie. Une très bonne corrélation
(1) INRA, UMR 42 (CARRTEL), Station d’Hydrobiologie Lacustre, 75 avenue de Corzent, 74203 Thonon-les-Bainscedex, France, [email protected]
Article published by EDP Sciences

A. Rolland et al.: Knowl. Managt. Aquatic Ecosyst. (2010) 398, 02
(ρ = 0,93 ; n = 243 ; p < 0,0001) a été trouvée entre les concentrations en chloro-phylle a totales équivalentes fournies par la sonde bbe FluororobeTM et les concen-trations totales mesurées classiquement. La corrélation la plus élevée était trou-vée pour des concentrations n’excédant pas 6,9 μg·L−1 alors qu’elle était faibleou non significative pour des concentrations supérieures à 21,6 μg·L−1. La rela-tion était hautement significative quand le biovolume phytoplanctonique total étaitcomparé avec les données de la sonde (ρ = 0,6 ; n = 243 ; p < 0,0001), la cor-rélation la plus forte étant pour le groupe des diatomées, dinoflagellés et chryso-phycées (ρ = 0,67 ; p < 0,0001), la plus faible étant celle pour les cyanobactériesbleues-vertes (ρ = 0,33 ; p < 0,0001) bien qu’encore hautement significative. Notreanalyse, réalisée à partir d’un grand nombre de données, semble indiquer que lasonde bbe FluroroprobeTM est un outil parfaitement adapté au monitoring du phy-toplancton des eaux douces réalisé par les gestionnaires.
INTRODUCTION
Since the second half of the 20th century, many water bodies have suffered from eutrophi-cation, which promotes microalgal (phytoplankton) proliferation and is caused by increasingnutrient pollution (especially with phosphorus), leading to severe deterioration of water quality(Sommer, 1983; Reynolds, 1984; Tilman et al., 1986). The aim of the European Water Frame-work Directive (WFD) (European Parliament, 2000) is to reduce eutrophication, which is ofparticular concern for water management and treatment, in order to reach what has beentermed “good ecological status” by the year 2015. This concept is defined as restoring “thestate of an ecosystem to a close approximation of its condition prior to disturbance whereecological damage is repaired. Both the structure and the functions of the ecosystem arerecreated” (US National Research Council, 1992 in Higgs, 1997). Ecological quality is basedon the status of the biological (phytoplankton, macroalgae, macrophytes, benthos and fishes),hydromorphological and physico-chemical quality parameters.The phytoplankton biomass constitutes a bio-monitoring index of major importance for theecological survey and understanding of hydrosystems, and it has been a required part ofthe estimation of water quality for many decades (CIPEL, 1984; Brettum, 1989; Dokulil et al.,2005; Wolfram et al., 2007). In addition, chlorophyll a measurements have also been shown toprovide a good estimate of phytoplankton biomass (Smayda, 1978; Harris, 1986; Wetzel andLikens, 2000). However, recent studies have shown that there are some problems with usingthe direct estimation of chlorophyll a (chl a) to deduce phytoplankton biomass, because spa-tial and temporal variations can occur on very short scales (Felip and Catalan, 2000), and theratio of chl a to cell carbon depends on external and internal factors, such as phytoplanktonictaxonomy composition, cell physiological conditions, temperature, nutrient concentrationsand light intensity. Phytoplankton biomass, via the estimation of chl a concentration, has alsobeen used to obtain an indication of the trophic status of the water system (Vollenweider andKerekes, 1982). The WFD therefore decided to include both the chl a concentration and thephytoplankton biovolume as two of the estimators used to define the ecological state of a lake(European Commission, 2008), even though it was recently suggested that the proportions ofthe different algal classes should also be considered to give an indication of the trophic sta-tus of the ecosystem (Reynolds et al., 2002) and furthermore, that taxon specificity must beassessed to provide a precise estimate of the trophic status of a lake (Anneville et al., 2002).Different techniques, materials and methods have become available for surveying phyto-plankton development, from species identification and counts using microscopy (Utermöhl,1958) to satellite images on a larger spatial scale (Allee and Johnson, 1999). It is notewor-thy, however, that phytoplankton identification and microscopy counts are known to be verytime-consuming and labor-intensive. This is one of the reasons why conventional taxonomy-based surveys have generally been limited in scale and duration. Also, the Utermohl tech-nique is not suited to measuring both eukaryotic and prokaryotic picoplankton (< 2 μm)which can, however, represent a significant chl a component (e.g. 30%) in some oligotrophic
02p2

A. Rolland et al.: Knowl. Managt. Aquatic Ecosyst. (2010) 398, 02
and mesotrophic lakes. Here, fluorimetric techniques (typically epi-fluorescence microscopy)or flow cytometry are required. Satellite images are not suitable for surveying restricted ar-eas, and provide only partial information (i.e. for the water near the surface). As a compro-mise, many in situ sensors providing immediate information have been developed to facilitatemonitoring for water managers; these include fluorometers (Desiderio et al., 1997), and de-vices such as flow cytometers that can be deployed on moored systems (Thyssen et al.,2008). Beutler et al. (2002) designed a multi-wavelength probe, the bbe FluoroprobeTM (bbe-Moldaenke, Kiel, Germany), which is a submersible spectrofluorometer that can operate downto a depth of 100 m, and provides automatic algal class and chlorophyll analysis, based onthe in vivo autofluorescence characteristics of pigment-containing micro-organisms, such ascyanobacteria and eukaryotic microalgae. Such a device provides a measurement of totalequivalent chl a fluorescence, which is a commonly-used, reliable proxy for total phytoplank-ton biomass. The main advantage of the bbe FluoroprobeTM is that it can cope with the con-straints associated with water monitoring, such as the need for immediacy of response, lowmaintenance costs, specificity, sensitivity, ease of handling and rapidity of interpretation. Vari-ous algal groups can be identified by detecting diagnostic marker pigments, known as acces-sory pigments, typically by using high performance liquid chromatography or hyperspectralabsorption curves. These marker pigments include peridinin (a marker for dinoflagellates orPyrrophyta), chlorophyll b (an indicator of green algae mainly), fucoxanthin (a diatom marker)and zeaxanthin, as well as phycobiliproteins (indicators of cyanobacteria and cryptophyceae)(Wright and Jeffrey, 1987; Moline and Prezelin, 1997; Moline et al., 1997a, 1997b; Trees et al.,2000; Millie et al., 2002).To the best of our knowledge, only one study has so far attempted to confirm the quality of thewhole dataset provided by this device over time and space (Gregor et al., 2005). Gregor andMaršalek (2004) had suggested earlier that the device could be recommended as a sensitivetool for water managers, but only for total equivalent chl a measurements. Both the studiesmentioned above were performed on a relatively small number of samples. Leboulanger et al.(2002) successfully configured the bbe FluoroprobeTM, adding a specific fingerprint, and cali-brated using both in situ populations during a mono-specific bloom and cultures to detect andquantify the PE (phycoeryhtrin)-rich cyanobacterium Planktothrix rubescens bloom on LakeBourget (France). Note that the device is still used to survey the water quality of this large anddeep peri-alpine lake and a reliably good correlation is found between P. rubescens countsand the bbe FluoroprobeTM (Jacquet et al., 2008). Finally, Pinel-alloul et al. (unpublished data),also using a bbe FluoroprobeTM, described the formation and summer maintenance of deepchlorophyll maxima in Canadian oligotrophic lakes with different watershed land uses. Clearly,data are not yet available about the in situ application and accuracy of such a device with re-gard to all the microalgal groups that it can detect and over lengthy periods of time (i.e. forseveral successive seasons).The aim of our study was therefore to compare and validate over a 2-year period the data ob-tained with the bbe FluoroprobeTM with: (i) the total chl a concentrations provided by classicalspectrophotometric measurements following pigment extraction; (ii) the total phytoplanktonbiovolume obtained after cell counts, and as estimated by the different formulae proposed byHillebrand et al. (1999) and finally; (iii) the biovolume of the different phytoplankton classesidentified after microscopic analyses.
MATERIALS AND METHODS
> SITE DESCRIPTION
The Marne Reservoir (Figure 1) is one of the largest reservoirs in Western Europe (48 km2). Itis situated in the Champagne region, 200 km east of the Paris Basin (France). It is subdividedinto two shallow artificial “lakes”: the smaller lake (Champaubert Lake, 0.5 km2, mean depth3.5–4.5 m), which was completed in 1938, receives water from the Marne and Blaise rivers,whereas water is released from the larger one (Der Lake, 47.5 km2, mean depth 7–9 m).
02p3

A. Rolland et al.: Knowl. Managt. Aquatic Ecosyst. (2010) 398, 02
K
GH
J
I N
Canal de restitution Marne
Canal de restitution Marne
Restitutionen Droyesen Droyes
Canal d’amenéeBlaise
Canal d’amenéeBlaise
Canal d’amenéeMarne
Canal de restitution Blaise
Canal d’amenéeMarne
Canal de restitution Blaise
K
GH
J
I N
Canal de restitution Marne
Canal de restitution Marne
en Restitutionen Droyes
Canal d’amenéeBlaise
Canal d’amenéeBlaise
Canal d’amenéeMarne
Canal de restitution Blaise
Canal d’amenéeMarne
Canal de restitution Blaise
Figure 1Map of the Marne Reservoir with its two main basins (lake Der and lake Champaubert) and localization ofthe sampling stations H (station Giffaumont), I (tour de restitution), N (lac du der), G (lac de Champaubert),K (bassin sud-est), J (bassin nord-ouest) (image from Google earth, 2008).
Figure 1Image Google earth du Réservoir Marne permettant d’observer ses deux principaux bassins (le lac duDer et le lac Champaubert) et la localisation des sites d’échantillonnage : H (station Giffaumont), I (tourde restitution), N (lac du der), G (lac de Champaubert), K (bassin sud-est), J (bassin nord-ouest).
This large reservoir was completed in 1974 and is intended to prevent flooding of Paris duringwinter and early spring, and to enhance low flows in summer. The water level varies between 2and 15 m over the hydrological cycle, with water volume being greatest in summer (July) andlowest in late fall (November). Depending on summer weather conditions (wind, temperature)and management strategies, the water column may be stratified for a few weeks in summer,and the water residence time varies between approximately 3 and 12 months. The reservoir isclassed as a mesotrophic water body, with annual mean concentrations of total phosphorusof about 15 μg·L−1, ranging from 8 μg·L−1 in winter to 32 μg·L−1 in summer (Rolland andJacquet, 2010).
> SAMPLING STRATEGY
The samples used for this study were collected every two to three weeks between March andSeptember in 2006 and 2007. Six different stations in the reservoir were investigated duringeach campaign. The FluoroprobeTM was lowered down the water column in order to visualizethe distribution of the microalgal biomass as a whole, and that of the different pigment classesthat are related to phytoplankton classes in particular (see details below). Simultaneously,water samples were collected at specific depths (3, 6 and 8 m) using a Van Dorn samplingbottle. The water collected in the bottle was homogenized, and samples were separated forchl a extraction and quantification, and for species determination. For the latter, 100 mL were
02p4

A. Rolland et al.: Knowl. Managt. Aquatic Ecosyst. (2010) 398, 02
immediately fixed with Lugol’s solution on board the ship. All samples were kept in the dark atbetween 4 and 6 ◦C until they reached the laboratory and underwent immediate processing.
> FLUORESCENT-BASED METHOD
Since 2002, a multi-wavelength submersible probe (FluoroProbeTM, bbe-Moldaenke) hasbeen available to scientists and water managers (Beutler et al., 2002). This device can dif-ferentiate between “spectral groups” of microalgae both in vivo and in situ, and providesvertical profiles (down to 100 m) within a few minutes (e.g. Leboulanger et al., 2002), on thebasis of the relative fluorescence intensity of chl a at 680 nm (due to the photosystem II corepigments). The use of spectral fluorescence where multiple excitation and/or emission wave-lengths are used to characterize taxonomic composition was recognized quite a long timeago as a promising technique because measurements could also be made in continuousmode (Yentsch and Yentsch, 1979). The spectral fluorescence is based on selective excita-tion of the differing antenna and accessory pigments between taxonomic groups of algae.This emission of fluorescence with the bbe FluoroprobeTM follows sequential light excita-tion by 6 Light-Emitting Diodes (LEDs), which segregate the green group (chlorophyceae andeuglenophyceae) (450 nm), the brown group (diatoms, chrysophyceae and dinoflagellates,or the Heterokontophyta and Pyrrophyta for the dinoflagellates) (525 nm), the phycoerythrin-containing (PE-rich) group (cryptophytes and red cyanobacteria) (570 nm), and the blue-greengroup (blue-green cyanobacteria) (590 and 610 nm), respectively. The “brown” group havephotosynthetic carotenoids, fucoxanthin or peridinin pigments for which absorbing wave-lengths of light are poorly absorbed by the chlorophylls. The same can be said for the “blue-green” and the “red” groups, characterized mainly by phycobilin accessory pigments (i.e.phycocyanin and phycoerythrin, respectively) that also absorb in a spectral region whereit is minimal for chlorophylls. In other words, depending on the accessory pigments of thelight-harvesting complexes, and thus on the phylogenetic position of the phytoplanktonic in-dividuals present in the sample, a set of characteristic fingerprints can be detected. The UVLED (370 nm), which has been added to the latest generation of devices, is used to measurethe fluorescence of colored dissolved organic matter (cDOM), which is referred to as “yellowsubstances”. In our case, it allowed us to ascertain that water transparency was importantand was unlikely to have a strong bearing on the ability of the device to differentiate amongthe various groupings of phytoplankton. It is noteworthy here that cDOM determination in thereservoir was not made, provided that the fairly good correlation between the total equiva-lent chlorophyll a fluorescence provided by the bbe FluoroprobeTM and the real chlorophyll aconcentration, measured after extraction (see results), suggested that cDOM influence wasprobably negligible and/or that the probe was already adequately calibrated for yellow sub-stance concentrations present in the reservoir. Measurements were performed every 0.5 sfrom the surface down to 50 cm above the sediment at each of the sampling stations. Thisgenerated between 10 and 15 data for every meter of the water column. The values given bythe FluoroprobeTM were integrated, and averaged from 2.2 to 3 m, 5.2 to 6 m and 7.2 to 8 min order to make the data comparable with those from the Van Dorn sampling bottle, that is80 cm long. We also compared the results obtained using a single depth (i.e. 3, 6 or 8 m), anddid not find any significant difference between the two approaches. The excitation spectrumobtained was then compared with normal standard curves stored in the probe. Dedicatedsoftware (Fluoroprobe 1.9, bbe Moldaenke) was then used to calculate the relative amountsof each of the phytoplankton spectral groups present, expressed in terms of the equivalentamount of chl a per liter of water (equiv. μg chl a·L−1), and which reflects the recorded fluo-rescence values. Details about the design, functioning and data output of this software canbe obtained directly from http://www.bbe-moldaenke.de/chlorophyll/fluoroprobe/. The datawere transferred to a PC connected to the probe, which immediately displayed the results intables and graphs (Beutler et al., 2002; Leboulanger et al., 2002; Gregor and Maršálek, 2004;Jacquet et al., 2005).
02p5

A. Rolland et al.: Knowl. Managt. Aquatic Ecosyst. (2010) 398, 02
> CHLOROPHYLL A EXTRACTION AND CONCENTRATION MEASUREMENTS
The samples were first filtered throughout a 200-μm mesh filter in order to remove large organ-isms (i.e. metazooplankton). Next, the chlorophyll was collected on a GF/F (nominal porosity:0.7 μm) glass filter. The volume filtered varied from 0.5 to 1 L, depending on the chl a con-centrations provided by the FluoroprobeTM. Each filter was immersed for 5 min in 12 mL of90% acetone that had previously been heated to 78–80 ◦C to extract the pigment. The filterswere kept in the dark at 4 ◦C for a period of 24 h to maximize extraction. They were thenground for 30 s to facilitate cell degradation. The extract was then filtered through a 45-μmfilter to eliminate the cellular constituents, and to collect the solvent containing the pigments.Chl a extracts were then measured spectrophotometrically, in a 4-cm-long cuvette at 750 and665 nm before and after acidifying the sample with hydrochloric acid (0.1 mL of HCl 0.1 N). Ac-cording to Lorenzen (1967), this corrects for interference due to the presence of phaeophytin(a chlorophyll decomposition product that absorbs at the same wavelength). Moreover, as wehave already mentioned, a reading was also carried out at 750 nm to eliminate the absorbancedue to turbidity. These values were subtracted from those obtained at 665 nm. Calculationswere done according to Lorenzen (1967). The AFNOR (Agence Française de Normalisation)standard (1999) provides a complete and detailed description of the procedure.
> PHYTOPLANKTON ANALYSIS
Phytoplankton identification and counts were performed with an inverted microscope (ZeissAxiovert 135) following the Utermöhl procedure (Utermöhl, 1958; AFNOR, 2006). Algal,species were observed at high magnification (× 640) along both the diameters of the sedi-mentation chamber, and counted until at least 400 cells in each group had been identified.Species abundance was calculated taking into consideration the surface area of the 2 di-ameters counted, the surface area of the sedimentation chamber, and the volume of watersedimented. The biovolume (measured for each cell counted, and calculated for the total)was then estimated using the various formulae proposed by Hillebrand et al. (1999). TheFluoroprobeTM provides concentrations for the four pigment classes that can theoretically beassigned to four taxonomic phytoplankton classes: the “Greens” that include chlorophyceaeand Desmidiates (CD), the “Blue-Greens” that consist of blue-green cyanobacteria (BGC), the“Browns” that consist of diatoms, dinoflagellates and chrysophyceae (DDC), and the “Reds”containing cryptophyceae and phycoerythrin-rich cyanobacteria (CRC).
> DATA ANALYSIS AND STATISTICS
As the distributions of the data were not normal even after logarithmic transformation, non-parametric Spearman rank correlations were used to identify the relationships between: (i) thetotal equivalent chl a provided by the bbe FluoroprobeTM and the usual spectrophotometricmeasurements; (ii) the total equivalent chl a given by the bbe FluoropobeTM and the total phy-toplankton biovolume obtained by microscopy; and (iii) the pigment class chl a equivalentsobtained by the bbe FluoroprobeTM and phytoplankton class biovolumes. All the analyseswere carried out using the statistical software Sigma Stat (Stat32). In order to provide anoverall assessment of the correlations between the data provided by the fluoroprobe and theresults given by the Utermöhl technique, a canonical correspondence analysis (CCA), i.e. amultivariate direct gradient analysis method aimed at looking at the relationships between twosets of variables (ter Braak, 1986, 1987), was computed using the PC-Ord software (McCuneand Mefford, 2006). The biovolumes of the different algal groups (DDC, BGC, CD and CRC)obtained with the Utermöhl technique were used as a secondary matrix to explain the chloro-phyll a results of the four algal groups obtained with the FluoroprobeTM (main matrix).
02p6

A. Rolland et al.: Knowl. Managt. Aquatic Ecosyst. (2010) 398, 02
Figure 2Relationship between total chl a concentrations (μg·L−1) given by the bbe FluoroprobeTM and thoseprovided by the spectrophotometric analyses. The dashed line corresponds to a 1:1 relationship.
Figure 2Relation entre les concentrations (μg·L−1) en chl a totales obtenues par la sonde bbe FluoroprobeTM etcelles fournies après analyse spectrophométrique. La ligne en pointillé symbolise la relation 1:1.
RESULTS
> COMPARISON OF THE BBE FLUOROPROBETM AND THE SPECTROPHOTO-METRIC ANALYSES FOR MEASURING TOTAL CHL A CONCENTRATIONS
The dataset was obtained from the measurements made over the two sampling years(23 sampling dates) at six stations and three different depths (3, 6 and 8 m), where the waterwas deep enough to permit this. This yielded a total of 243 chl a concentration measure-ments for this period, ranging from 0.5 to 38.6 μg·L−1 for the bbe FluoroprobeTM and from 0.1to 40.4 μg.L−1 for the spectrophotometric analyses. As shown by Figure 2, the relationshipbetween the total equivalent chl a concentrations (i.e. the sum of the chlorophyll a concentra-tions from each spectral group) given by the bbe FluoroprobeTM and the spectrophotometrywas very strong (ρ = 0.93, p < 0.0001). Moreover, when this relationship was analyzed forthe different depths separately, we also obtained highly significant correlations between thechl a concentrations obtained by the two methods (3 m: ρ = 0.94, p < 0.0001, n = 135; 6 m:ρ = 0.93, p < 0.0001, n = 68; 8 m: ρ = 0.79, p < 0.0001, n = 40).In order to assess the ecological potential of the Marne Reservoir in the context of the WaterFramework Directive, the research institute for sustainable management of water and land-scapes (i.e. the CEMAGREF) established a range of five water quality classes based on chl aconcentrations (De Bortoli and Argillier, 2008): very good quality for chl a concentrations thatare below or equal to 3.9 μg·L−1, good, moderate and passable qualities for chl a concentra-tions comprised between 3.9 and 6.9 μg·L−1, 6.9 and 12.2 μg·L−1, and 12.2 and 21.6 μg·L−1,respectively, and poor quality for chl a concentrations that are above 21.6 μg·L−1. Data fromour spectrophotometric analyses were assigned to these classes, and the associated fluo-rometric chl a concentrations were plotted to test whether the bbe FluoroprobeTM was ableto detect the different chl a concentrations accurately. As a result, we tested the relation-ship between each chl a concentration class established from spectrophotometric analysisand the chl a concentrations obtained by fluorometry (Figure 3). The first class, which in-cluded 61 observations, was significantly correlated with the fluorometric chl a concentrations(ρ = 0.66, p < 0.0001) (Figure 3a). The best correlation we found was between the secondclass of chl a concentrations given by the spectrophotometric analyses and the associated
02p7

A. Rolland et al.: Knowl. Managt. Aquatic Ecosyst. (2010) 398, 02
Figure 3Relationships between total chl a concentrations (μg·L−1) given by the FluoroprobeTM and those providedby the spectrophotometric analyses subdivided into five concentration classes (as proposed by theCEMAGREF in the context of the WFD) i.e. a) < 4.6 μg·L−1; b) [4.6–8[ μg·L−1; c) [8–12.2[ μg·L−1; d)[12.2–21.6[ μg·L−1; e) ≥ 21.6 μg·L−1. The dashed line corresponds to a 1:1 relationship.
Figure 3Relation entre les concentrations (μg·L−1) en chl a totales obtenues par la sonde bbe FluoroprobeTM etcelles fournies après analyse spectrophométrique, subdivisées en cinq classes telles que proposées parle CEMAGREF, c’est-à-dire a) < 4,6 μg·L−1 ; b) [4,6–8[ μg·L−1 ; c) [8–12,2[ μg·L−1 ; d) [12,2–21,6[ μg·L−1 ;e) ≥ 21,6 μg·L−1. La ligne en pointillé symbolise la relation 1:1.
02p8

A. Rolland et al.: Knowl. Managt. Aquatic Ecosyst. (2010) 398, 02
Table IProportion of the spectrofluorometric chl a concentrations that fit into the spectrophotometric chl a con-centration classes established by De Bortoli and Argillier (2008) of the research institute for sustainablemanagement of water and landscapes (CEMAGREF).
Tableau ICorrespondances entre les proportions de concentrations en chl a obtenues par spectrofluorimétrie etles classes de chl a obtenues par spectrophotométrie telles qu’établies par De Bortoli et Argillier (2008)du CEMAGREF.
Chl a concentration classes Proportion of chl a concentrations obtained with theestablished by the CEMAGREF* FluoroprobeTM found in the CEMAGREF classesin the context of the WFD < 3.9 [3.9–6.9[ [6.9–12.2[ [12.2–21.6[ ≥ 21.6< 3.9 0.97 0.03 0 0 0[3.9–6.9[ 0.33 0.62 0.05 0 0[6.9–12.2[ 0 0.44 0.51 0.05 0[12.2–21.6[ 0 0 0.45 0.50 0.05≥ 21.6 0 0 0 0.38 0.62
* Institut de recherche pour l’ingénierie de l’agriculture et de l’environnement.
bbe FluoroprobeTM measurements (ρ = 0.71, p < 0.0001, n = 60) (Figure 3b). For the dataincluded in the third class (n = 84), the Spearman correlation coefficient, linking chl a concen-trations given by spectrophotometric analyses and those from the bbe FluoroprobeTM, wasslightly lower although still highly significant (ρ = 0.54, p < 0.0001) (Figure 3c). The fourthclass, including chl a concentrations between 12.2 and 21.6 μg·L−1 (n = 22), still exhibiteda strong relationship with the associated fluorometric measurements (ρ = 0.50, p = 0.02)(Figure 3d). The weakest relationship was found for the highest concentrations: for concen-trations above 21.6 μg·L−1 (n = 16), the correlation with the results given by the FluoroprobeTM
was weak, and the Spearman coefficient was nearly zero (ρ = 0.009, p = 0.97) (Figure 3e).Although n was relatively small in the latter case, the relationships between the chl a concen-trations obtained by the two methods was still valid. However, this does not tell us whetherthe concentration range was the same for both methods. Therefore, from the data obtainedby spectrophometric analyses and used to determine the CEMAGREF water quality classes,we calculated the proportion of the FluoroprobeTM chl a concentrations that could be fittedinto these classes (Table I). If we look at the ranges of concentrations, all the values appear tobe correlated; bbe-based fluorometry tends to suggest lower chl a concentrations than spec-trophotometry, and we observed that on average the spectrophotometric data were indeedabout 1.2 times higher than the bbe data (data not shown). This was not surprising, as ex-tracted chlorophyll methods should (almost) always provide a higher concentration estimatethan fluorescence or absorption measurements from living cells.
> COMPARISON BETWEEN CHL A CONCENTRATIONS GIVENBY THE BBE FLUOROPROBETM AND PHYTOPLANKTON BIOVOLUME
As chl a concentration is used as an estimation of phytoplankton biomass, the total equivalentchl a concentrations given by the FluoroprobeTM and the total biovolume estimates obtainedafter microscopic counting were plotted and compared. For the whole dataset (Figure 4), thecorrelation between the two variables was highly significant (ρ = 0.6, p < 0.0001, n = 243),but the correlation between the chl a concentrations and the total biovolume estimates wasweaker, although still significant, for the spectrophotometric analyses.The strength of the correlation between chl a and biovolume depended on the algal classconsidered. The strongest correlation was found between the equivalent amount of chl afor the “Browns” and the biovolume of the Diatoms, Dinoflagellates and Chrysophyceae(ρ = 0.67, p < 0.0001, n = 242) (Figure 5a). The correlation between the amount of chl afor the “Reds” and the biovolume of the Cryptophyceae and PE-rich cyanobacteria was also
02p9

A. Rolland et al.: Knowl. Managt. Aquatic Ecosyst. (2010) 398, 02
Figure 4Relationship between the total phytoplankton biovolume (μm3·L−1) and total chl a concentrations (μg·L−1)given by the FluoroprobeTM.
Figure 4Relation entre le biovolume phytoplanctonique total (μm3·L−1) et les concentrations (μg·L−1) en chl atotales obtenues avec la sonde FluoroprobeTM.
strong (ρ = 0.55, p < 0.0001, n = 242) (Figure 5b). Despite the highly significant relation-ship between the amount of chl a for the “Greens” and the biovolume of the Chlorophyceae(p < 0.0001), the Spearman correlation coefficient was lower (ρ = 0.46) (Figure 5c), as wasthe correlation coefficient for the amount of chl a of the “Blue-Greens” and the biovolume ofthe Cyanobacteria (ρ = 0.33, p < 0.0001) (Figure 5d).Figure 6 shows the results of the CCA, revealing that the overall explained variance on thetwo first axes was 56.3%. The Utermöhl technique and the FluoroprobeTM were correlated,since the biovolumes measured with the Utermöhl technique and the chl a measured withthe FluoroprobeTM are in the same parts of the graph for the Browns/DDC, for the Blue-Greens/BGC and for the Reds/CRC. The only algal class which did not show close corre-lation between the two techniques was the “Greens”. As the length of the vectors refers tothe strength of the correlations between the two techniques, we can see that the closestcorrelations were obtained for the “Blue-Greens” and the “Browns”.
DISCUSSION
Our aim was to check the accuracy of the FluoroprobeTM bbe spectrofluorometer using alarge dataset covering a succession of different seasons in one large reservoir. We did this bythe parallel use of a spectrophotometric method to quantify the total chl a concentration, andof light microscopy to assess phytoplankton diversity and biovolume. The only comparableprevious studies were those done by Gregor and Maršálek (2004) and Gregor et al. (2005),but these authors used considerably fewer values and lower taxonomic resolution than wedid.
> DIFFERENCE BETWEEN SPECTROPHOTOMETRIC ANALYSESAND SPECTROFLUOROMETRIC MEASUREMENTS
We found a strong and highly significant correlation between the spectrophotometric andspectrofluorometric determinations of the chl a concentrations, i.e. between the classical
02p10

A. Rolland et al.: Knowl. Managt. Aquatic Ecosyst. (2010) 398, 02
Figure 5Relationships between the total chl a concentrations (μg·L−1) given by the FluoroprobeTM for each pig-ment class, and the total biovolume (μm3·L−1) for each phytoplankton class, i.e. a) the “Browns” as-sociated with the Diatoms, Dinoflagellates and Chrysophyceae (DDC); b) the “Reds” associated withthe Cryptophyceae and the PE-rich Cyanobacteria (CRC); c) the “Greens” associated with the Chloro-phyceae and Euglenophyceae (CD); d) the “Blue-Greens” associated with the Blue-Green Cyanobacteria(BGC).
Figure 5Relation entre les concentrations (μg·L−1) en chl a totales obtenues avec la sonde bbe FluoroprobeTM
pour chaque groupe pigmentaire et le biovolume total pour chaque classe phytoplanctonique, c’est-à-dire les « Browns (marrons) » avec les diatomées, dinoflagellées et chrysophycées (DDC) ; b) les « Reds(rouge) » avec les cryptophycées et les cyanobactéries riches en phycoérythrine (CRC) ; c) les « Greens(vertes) » avec les chlorophycées et euglénophycées (CD) ; d) les « Blue-Greens (bleues-vertes) » repré-sentés par les cyanobactéries bleues-vertes (BGC).
measurement of chl a after pigment extraction and the bbe FluoroprobeTM used in situ.This had also been observed by Gregor and Maršálek (2004), who revealed an excellentcorrelation between the total (equivalent) chl a measured by the bbe FluoroprobeTM, andthe chl a determined by spectrophotometry after pigment extraction (r = 0.97, p < 0.05,n = 18). Gregor et al. (2005) found much the same relationship (r = 0.95, p < 0.01, n = 96).However, the spectrofluorometric values (for equivalent chl a) were always lower than spec-trophotometric ones (Pinckney et al., 1994), which was probably due to the fact that the bbeFluoroprobeTM was originally calibrated on the basis of HPLC analysis, which usually reportslower chl a concentrations than spectrophometric methods, especially if ethanol is used forthe extraction process. This is probably due to the presence of other chlorophyll-like pigmentsthat interfere with the spectrophotometric measurements (Meyns et al., 1994; Gregor et al.,2005). In contrast, it has also been shown that the presence of certain accessory pigments,
02p11

A. Rolland et al.: Knowl. Managt. Aquatic Ecosyst. (2010) 398, 02
Figure 6Canonical correspondence analysis computed from 243 determinations of the total chl a concentrations(μg·L−1) given by the FluoroprobeTM for each pigment class in relation to the total biovolume (μm3·L−1) foreach phytoplankton class obtained with the Utermöhl technique. The percentage of variance explainedis 56.3% in the two first axes. The following abbreviations are used in this graph. For the Utermöhltechnique: “DDC” corresponds to the sum of biovolumes of the Diatoms, Dinoflagellates and Chryso-phyceae, “CRC” to the Cryptophyceae and the PE-rich Cyanobacteria, “CD” to the Chlorophyceae andEuglenophyceae, and “BGC” to the Blue-Green Cyanobacteria. For the FluoroprobeTM results: “Browns”corresponds to the chl a concentrations of Diatoms, Dinoflagellates and Chrysophyceae, “Reds” to theCryptophyceae and the PE-rich Cyanobacteria, “Greens” to the Chlorophyceae and the Desmidiates,and “Blue-Greens” to the Blue-Green Cyanobacteria.
Figure 6Analyse canonique des correspondances effectuée à partir de 243 points de mesure de la concentra-tion en chl a obtenue avec la sonde bbe FluoroprobeTM pour chacun des groupes pigmentaires et lebiovolume total mesuré par microscopie. Le pourcentage de variance expliquée est de 56,3 % pour lesdeux axes principaux. « DDC » représente la somme des biovolumes des diatomées, dinoflagellées etchrysophycées, « CRC » celle des cryptophycées et cyanobactéries riches en phycoérythrine, « CD »celle des chlorophycées et euglénophycées, et « BGC » celle des cyanobactéries bleues-vertes. Pour lasonde bbe, « Browns (marrons) » correspond à la concentration en chlorophylle a totale des diatomées,dinoflagellées et chrysophycées, « Reds (rouges) » à celle des cryptophycées et cyanobactéries richesen phycoérythrine, « Greens (vertes) » à celle des chlorophycées et euglénophycées, et « Blue-Greens(bleues-vertes) » à celle des cyanobactéries bleues-vertes.
such as pheophytin, can interfere with the fluorometric measurements and consequently leadto an underestimation of chl a concentrations by producing lower values than spectrophoto-metric analyses (Pinto et al., 2001). Another explanation for the difference between the twomethods lies in what is being measured. Typically, spectrophotometry measures the totalchl a concentration, whereas spectrofluorometry estimates chl a for specific algal classes,and consequently does not provide an accurate estimation of all the phytoplankton presentin the water column. In addition, the fluorometry-based method with the bbe measured fluo-rescence, which means that the chl a concentration is estimated from physiologically activecells, whereas spectrophotometry is a measure of absorbance, and is independent of thephysiological status of the cells, which may be active, senescent and/or lysed. The physio-logical status of cells can indeed affect their pigment content and fluorescence (Meeks, 1974;Vörös and Padisák, 1991). Thus, the two methods do not measure exactly the same thing.Furthermore, the accuracy of in vivo fluorometric determination is limited by the quantumefficiency (quanta emitted to quanta absorbed), as well as the species composition, and thephysiological status of the phytoplankton. Consequently, spectrophotometry can be expected
02p12

A. Rolland et al.: Knowl. Managt. Aquatic Ecosyst. (2010) 398, 02
to indicate higher chl a concentrations than spectrofluorometry. However, it remains true that,when evaluating the chlorophyll a present in living cells it is more convenient to measure thefluorescence of the water containing them (Pinto et al., 2001).
> DEPTH-RELATED DIFFERENCES (3, 6 AND 8 M)
As we have shown, the correlation between the chl a concentrations obtained with the bbeFluoroprobeTM and those provided by spectrophotometric analyses were close, and highlysignificant at 3 and 6 m, whereas the correlation was weaker at 8 m, although still highlysignificant. This can seem surprising, because fluorescence is known to be significantly in-hibited in subsurface layers due to the “quenching” effect of high irradiance on surface waters(Long et al., 1994; Falkowski and Raven, 1997). This phenomenon was identified as a poten-tially important drawback by Leboulanger et al. (2002), since it could reduce the fluorescencedetected for a given population (e.g. Planktothrix rubescens) by up to 40%. This effect is as-sociated with days characterized by high irradiance, and the fact that we did not detect itwas probably because the irradiance of the Marne Reservoir was low while we were workingthere. However, as light transmission is significantly lower at greater depths than on the sur-face, suspended particles could also explain the weaker relationship found for deeper layers.In fact, the Marne Reservoir is a wind-exposed, shallow water system with a long fetch thatleads to water mixing, and sediment particles are likely to be suspended at the bottom of thewater column. This phenomenon may induce an increase in water turbidity low in the watercolumn, and affect the scatter of the excitation light from diodes, as well as that of the fluores-cence emitted by the phytoplanktonic cells. Using the percentage transmission of the waterdetected by the bbe with the 710 nm LED placed opposite to the detector, we observed thatthe percentage of transmission could fall from 90% at the surface, to less than 75% near thebottom sediments. It was difficult to assess whether this could have influenced the intensityof light emitted by the diodes reaching the cells or their fluorescence response, but this wasclearly not impossible. Interestingly, Beutler et al. (2002) reported that even when transmissionwas reduced by 50%, the chl a detected decreased by only 5%, but we can postulate that astheir test was done using cultured green alga (Chlorella vulgaris), other species, especially inthe field, could behave differently.
> THE EFFICIENCY OF THE FLUOROPROBETM DEPENDSON THE CONCENTRATION RANGE CONSIDERED
The closest correlations between the two methods were found for total chl a concentrationsranging from 3.9 to 6.9 μg·L−1 and for chl a concentrations below 3.9 μg·L−1 which indicatesthat the FluoroprobeTM is likely to be more suitable for detecting the low levels of chl a inthe Marne Reservoir. In fact, what we found was that on the contrary, there was no correla-tion between the two methods for concentrations above 21.6 μg·L−1. We are aware, however,that the very small number of points and dynamic range in values for these “high chlorophyllconditions” could drive the significance of the statistical relationships. The underestimationof the chl a level in the context of a high phytoplankton biomass has already been reported,especially when colonial species are present (Gregor and Maršálek, 2004). Optical density,increased by the presence of large amounts of phytoplankton, could severely limit the use ofthis method. Light emitted by the instrument, or by phytoplankton, can be shaded, scatteredor re-absorbed, all of which can all lead to a biased estimate of the quantity of phytoplanktonpresent (Gregor et al., 2005). Another possible reason for the lack of relationship found at highconcentrations of chl a is the fact that values for chlorophyll a given by the FluoroprobeTM
can be affected by the fluorescence of various cDOMs also present in the water. At lowerconcentrations of chl a particularly, there is no interference between these substances andphytoplankton cells, whereas in the presence of high concentrations of phytoplankton asso-ciated with high concentrations of these chemicals, the cDOM fluorescence can be falselyattributed to fluorescence of non-phytoplanktonic origin (Gregor and Maršálek, 2004). It is
02p13

A. Rolland et al.: Knowl. Managt. Aquatic Ecosyst. (2010) 398, 02
also noteworthy that there were far more measurements below 6.9 than above 21.6 μg·L−1
and we cannot completely exclude the possibility that this could have influenced the results,although we believe it was not the case (see Materials and methods).
> THE STRENGTH OF THE RELATIONSHIP BETWEEN BIOVOLUMEESTIMATES AND CHLOROPHYLL A CONCENTRATIONS PROVIDEDBY THE BBE FLUOROPROBETM
Keeping in mind that pigment content per unit biovolume may vary as a function of physio-logical state, light exposure history, and the type of phytoplankton present, we found signifi-cant relationships between total phytoplankton biovolume estimates and chl a concentrationsgiven by the FluoroprobeTM, for both the whole dataset and for the spectral groups taken sep-arately. However, the trends differed considerably in the different algal groups. Moreover, theCCA analysis highlighted a close correlation between the two matrices for the “Browns” andthe “DDC”, the “Reds” and the “CRC”, the “Blue-Greens” and the “BGC”, but poor correlationbetween the two matrices for the “Greens” and the “CD”.On the one hand, it is important to remember that an average biovolume was used for all thesamples analyzed whatever the sampling date, the station or the depth. However, biovolumecan change with season and with depth, just as the chl a content of the phytoplanktonic cellscan vary with time and place (Harris, 1986; Tadonléké et al., 1998). Moreover, chl a content candepend on the taxonomic composition. In fact, the difference in the taxonomic compositionof phytoplankton can account for most of the variability in the chlorophyll-biovolume relation-ship, which depends on the life form of the predominant group and its average cell size (Felipand Catalan, 2000). Consequently, it is generally difficult to look for a clear correlation betweenbiovolume and chl a concentrations (Labaugh, 1995) (determined by the standard method orby the bbe FluororobeTM), since these parameters are not strictly related, and because thevariation in cell size and chl a content is high not only within divisions, but often even within agiven genus during different seasons (Desortová, 1981; Gregor et al., 2005). Finally, the weakrelationship between total phytoplankton biovolume, and (equivalent) chl a concentrationscan depend on internal cellular factors, such as their physiological status (a large biovolume,but low photosynthesis activity) as well as external factors such as temperature and lightconditions (Soohoo et al., 1986; Felip and Catalan, 2000; Staehr et al., 2002), and nutrientavailability (Pannard et al., 2007; Twiss and McLeod, 2008). For instance, Beutler et al. (2002)reported that when the culture reached nutrient limitation the fluorescence intensity was 50%higher (due to changes in the pigment composition of the peripheral antennae).On the other hand, when the spectral groups associated with phytoplankton classes weretaken into consideration, the relationships highlighted a close correlation between the amountof chl a in the “Browns”, and the biovolume of diatoms, dinoflagellates and chrysophytes,which is also observed in the CCA analysis between the “Browns” and the DDC. The speciesthat belong to these classes consist mainly of high-biovolume cells that are likely to be de-tected by the FluoroprobeTM. Thus, it might be possible that when they are present they mayinterfere with the detection of other minority communities present. The correlation betweenthe amount of chl a for the “Reds” and the biovolume of cryptophytes and PE-rich cyanobac-teria was not as strong, although still significant. PE-rich cyanobacteria were not abundantin our samples, but cryptophytes were. These are flagellated algae that are readily distorted,and so their biovolume can be misestimated when a fixative such as Lugol’s solution is addedto the samples. Moreover, these algae display a wide range of cell sizes and seasonal shapeplasticity. Reynolds (1984) reported a cell volume for Cryptomonas ovata between 1950 and3750 μm3, which suggests that the mean biovolume that we calculated for each sample maynot have strictly corresponded to the species biovolume of this group throughout both sam-pling periods. Furthermore, the weak correlation between the amount of chl a for the “Greens”and the biovolume of chlorophytes and euglenophytes, which is confirmed by the inverse cor-relation of the CCA, can be partly explained by the fact that they aggregate in larger coloniesthat do not allow the excitation light to penetrate the cells inside the colony. Moreover, Felip
02p14

A. Rolland et al.: Knowl. Managt. Aquatic Ecosyst. (2010) 398, 02
and Catalan (2000) proposed that there might be a time lag between the change in biovol-ume and the cell chlorophyll a content. This could explain the weak relationship found forthis group. Finally, the weakest relationship was found for the amount of chl a for the “Blue-Greens” and the biovolume of blue-green cyanobacteria. This can be explained by the lowproportion of cyanobacteria in our samples, which generated many low values. In fact, as onlyeight chl a concentrations were above 5 μg·L−1
, and these were associated with biovolumesabove 2.5 × 106 μm3·L−1, it would have been difficult to demonstrate a strong relationship.This can partly explain the reason for the contradictory result provided by the CCA for the“Blue-Greens” and the “BGC” that tends to highlight a close relationship between the twomatrices for these two groups. In fact, the CCA compares the two matrices, and is less sensi-tive to a high number of null values. It should also be mentioned that the phycocyanin contentper cell in cyanobacteria sometimes varies (Rodriguez et al., 1991; Foy, 1993; Takano et al.,1995). Thus, estimating an average biovolume for colonies and filaments can lead to mistakesthat are reflected in the relationship between the biovolume and the chl a content. Finally, aspicophytoplankton (which although, on one hand, may represent a small portion of the totalbiovolume but, on the other hand, may represent a large component of the chl a content) wasnot considered here, this could also explain the weak relationships observed for some of thegroups.Overall, our results support the proposal that this in situ method can be used to providequantitative data, whereas microscopic analyses should be used to provide information aboutdominant species, and provide a way to check the approximately measured ratio betweenthe different algal groups. We can thus recommend the bbe FluoroprobeTM as an efficienttool for water quality analysis, bathing water surveillance, and bloom detection in the MarneReservoir. For cyanobacterial assessment, however, microscopic observations are required,and other systems, such as the bbe AlgaeTorch, Moldaenke, that provides the total chl aconcentration and the relative proportion of blue-green cyanobacteria specifically, could bemore appropriate.
> CONCLUSION AND PROSPECTS
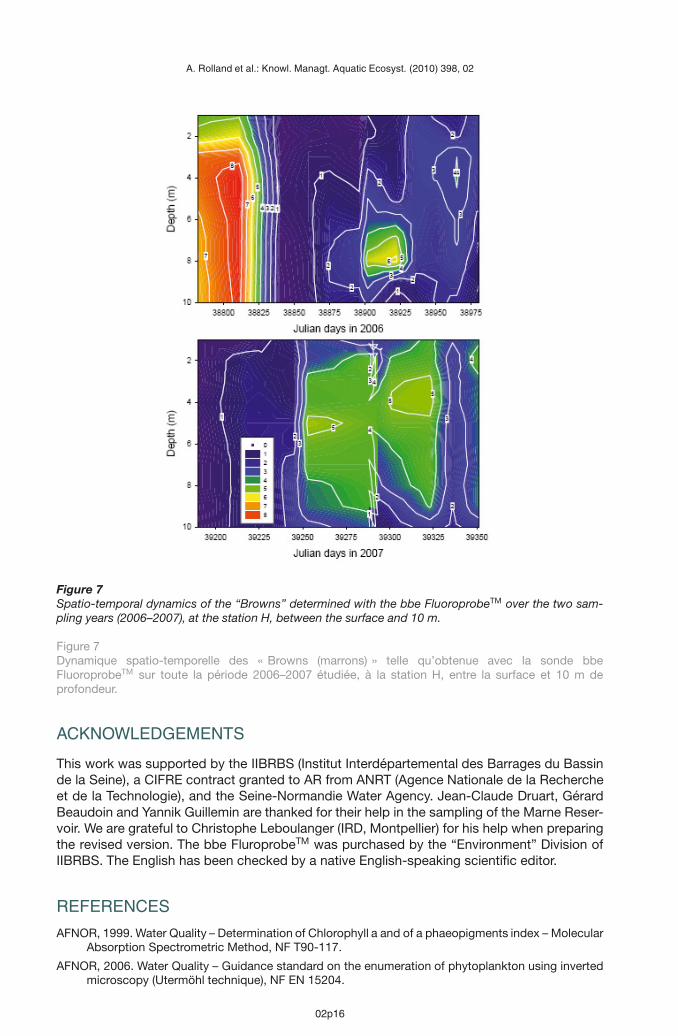
The relationships between the different chl a concentrations were fairly close, and these re-sults encouraged us to use the whole dataset provided by the bbe FluoroprobeTM from theMarne Reservoir to study the spatial and temporal variability in the phytoplankton dynamicsin detail, as illustrated for the “Browns” in Figure 7. This is the aim of a forthcoming study(Rolland et al., unpublished). We have to keep in mind, however, that the results obtained foreach class compared with biovolume estimates remain somewhat problematic, especially forthe blue-green cyanobacteria, a group of major interest in the context of water quality sur-veys. It remains true that we can conclude from our findings that the FluoroprobeTM offersa very efficient way of monitoring phytoplankton in reservoirs, especially for water managersand researchers who require quick and accurate methods. This sensor can serve as a goodscreening tool for phytoplankton quantification, as well as for preliminary taxonomic identifi-cation, and it could be particularly advantageous for the routine monitoring of water quality, atany depth where detailed microscopic analyses are not necessary or difficult. The two meth-ods used here are still complementary rather than mutually exclusive, and can be used toprovide reliable data for device validation with regard to the ecosystem studied. In the future,water managers will increasingly require fast and effective diagnostic methods, and the bbeFluoroprobeTM and related devices will be of great interest, provided that the findings are crit-ically assessed and checked for accuracy. There are numerous possible applications: mon-itoring blue or red cyanobacteria in drinking water, control testing bathing water for harmfulalgal blooms, limnological research, supervision of aquaculture systems, early warning sys-tems, and, since it can also be used to provide continuous measurements along the watercolumn, avoiding missing a local phenomenon (typically the concentration of a population ina thin layer) and/or rapid changes in some localities (at a specific depth or recruitment fromthe sediments).
02p15
A. Rolland et al.: Knowl. Managt. Aquatic Ecosyst. (2010) 398, 02
Figure 7Spatio-temporal dynamics of the “Browns” determined with the bbe FluoroprobeTM over the two sam-pling years (2006–2007), at the station H, between the surface and 10 m.
Figure 7Dynamique spatio-temporelle des « Browns (marrons) » telle qu’obtenue avec la sonde bbeFluoroprobeTM sur toute la période 2006–2007 étudiée, à la station H, entre la surface et 10 m deprofondeur.
ACKNOWLEDGEMENTS
This work was supported by the IIBRBS (Institut Interdépartemental des Barrages du Bassinde la Seine), a CIFRE contract granted to AR from ANRT (Agence Nationale de la Rechercheet de la Technologie), and the Seine-Normandie Water Agency. Jean-Claude Druart, GérardBeaudoin and Yannik Guillemin are thanked for their help in the sampling of the Marne Reser-voir. We are grateful to Christophe Leboulanger (IRD, Montpellier) for his help when preparingthe revised version. The bbe FluroprobeTM was purchased by the “Environment” Division ofIIBRBS. The English has been checked by a native English-speaking scientific editor.
REFERENCES
AFNOR, 1999. Water Quality – Determination of Chlorophyll a and of a phaeopigments index – MolecularAbsorption Spectrometric Method, NF T90-117.
AFNOR, 2006. Water Quality – Guidance standard on the enumeration of phytoplankton using invertedmicroscopy (Utermöhl technique), NF EN 15204.
02p16

A. Rolland et al.: Knowl. Managt. Aquatic Ecosyst. (2010) 398, 02
Allee R.J. and Johnson J.E., 1999. Use of satellite imagery to estimate surface chlorophyll a and Secchidisc depth of Full Shoals Reservoir, Arkansas, USA. Int. J. Remote Sens., 20, 1057–1072.
Anneville O., Ginot V., Druart J.-C. and Angeli N., 2002. Long term study (1974–1998) of seasonalchanges in the phytoplankton in Lake Geneva: a multiple table approach. J. Plankton Res., 24,993–1007.
Beutler M., Wilshire K.H., Meyer B., Moldaenke C., Lüring C., Meyerhöfer M., Hansen H.P. and DauH., 2002. A fluorometric method for the differentiation of algal populations in vivo and in situ.Photosynth. Res., 72, 39–53.
Brettum P., 1989. Algen als Indikatoren für die Gewässerqualität in norwegischen Binnenseen. NorskInstitutt for Vannforskning, NIVA, 2344, 1–111.
CIPEL, 1984. Le Léman : Synthèse des travaux de la Commission internationale pour la protection deseaux du Léman contre la pollution 1957–1982, Presses de l’imprimerie de l’ère nouvelle, Lausanne.
De Bortoli J. and Argillier C., 2008. Définition des conditions de référence et des limites des classesd’état sur la base d’une approche pressions/impacts – Plans d’eau – Paramètre Chlorophylle a.Rapport CEMAGREF.
Desiderio R.A., Moore C., Lantz C. and Cowles T.J., 1997. Multiple excitation fluorometer for in situoceanographic applications. Applied Optics, 36, 1289–1296.
Desortová B., 1981. Relationship between chlorophyll a concentration and phytoplankton biomass inseveral reservoirs in Czechloslovakia. Int. Rev. gesamten Hydrobiol., 66, 153–169.
Dokulil M.T., Teubner K. and Greisberger S., 2005. Typenspezifische Referenzbedingungen für die in-tegrierende Bewertung des ökologischen Zustandes stehender Gewässer Österreichs gemäβder EU-Wasserrahmenrichtlinie. Modul 1: Die Bewertung der Phytoplankton struktur nach demBrettum-Index. Projekstudie Phase 3, Abschlussbericht. Im Auftrag des Bundesministeriums fürLand- und Forstwirtschaft, Umwelt und Wasserwirtschaft, Wien.
European Commission, 2008. Commission Decision of 30 October 2008 establishing, pursuant toDirective 2000/60/EC of the European Parliament and of the Council, the values of the MemberState monitoring system classifications as a result of the intercalibration exercise. Official Journalof the European Communities, 332, 20–44.
European Parliament, 2000. Directive 2000/60/EC of the European Parliament and of the Council of23 October 2000 establishing a Framework for Community action in the field of water policy.Official Journal of the European Communities, 327, 1–72.
Falkowski P.G. and Raven J.A., 1997. Aquatic Photosynthesis, Blackwell Sciences, Oxford.
Felip M. and Catalan J., 2000. The relationship between phytoplankton biovolume and chlorophyll ina deep oligotrophic lake: decoupling in their spatial and temporal maxima. J. Plankton Res., 22,91–105.
Foy R.H., 1993. The phycocyanin to chlorophyll a ratio and other cell components as indicators ofnutrient limitation in 2 planktonic cyanobacteria subjected to low-light exposures. J. Plankton Res.,15, 1263–1276.
Gregor J. and Maršálek B., 2004. Freshwater phytoplankton quantification by chlorophyll a: a compara-tive study of in vitro, in vivo and in situ methods. Water Res., 38, 517–522.
Gregor J., Geriš R., Maršálek B., Hetesá J. and Marvan P., 2005. In situ quantification of phytoplanktonin reservoirs using a submersible spectrofluorometer. Hydrobiologia, 548, 141–151.
Harris G.P., 1986. Phytoplankton Ecology: Structure, Function and Fluctuation, 1st edition, Chapman &Hall, London.
Higgs E.S., 1997. What is Good Ecological Restoration? Conserv. Biol., 11, 338–348.
Hillebrand H., Dürselen C.D., Kieschtel D., Zohary T. and Pollingher U., 1999. Biovolume calculation forpelagic and benthic microalgae. J. Phycol., 35, 403–424.
Jacquet S., Briand J.F., Leboulanger C., Avois-Jacquet C., Paolini G., Oberhaus L., Tassin B., Vinçon-Leite B., Druart J.C., Anneville O. and Humbert J.F., 2005. The proliferation of the toxic cyanobac-terium Planktothrix rubescens following restoration of the largest natural French lake (Lac duBourget). Harmful Algae, 4, 651–672.
Jacquet S., Paolini G., Lazzarotto J., Girel C., Druart J.C., Perga M., Berdjeb L., Kerrien S., Humbert J.F.,Domaizon I., Perney P. and Laine L., 2008. Suivi de la qualité des eaux du lac du Bourget pourl’année 2007, Rapport CISALB.
02p17

A. Rolland et al.: Knowl. Managt. Aquatic Ecosyst. (2010) 398, 02
Labaugh J.W., 1995. Relation of algal biovolume to chlorophyll-a in selected lakes and wetlands in theNorth Central United States. Can. J. Fish. Aquat. Sci., 52, 416–424.
Leboulanger C., Dorigo U., Jacquet S., Le Berre B., Paolini G. and Humbert J.F., 2002. Application of asubmersible spectrofluorometer for rapid monitoring of freshwater cyanobacterial blooms: a casestudy. Aquat. Microb. Ecol., 30, 83–89.
Long S.P., Humphries S. and Falkowski P.G., 1994. Photoinhibition of photosynthesis in nature. Annu.Rev. Plant Physiol. Plant Mol. Biol., 45, 633–662.
Lorenzen C.J., 1967. Determination of chlorophyll and pheopigments by spectrophotometric equations.Limnol. Oceanog., 12, 343–346.
McCune B. and Mefford J., 2006. PC-ORD – Multivariate Analysis of Ecological Data, Version 5.18, MjMSoftware, Gleneden Beach, Oregon.
Meeks J.C., 1974. Chlorophylls. In: Stewart W.D.P. (ed.), Algal Physiology and Biochemistry, BlackwellScientific Publications, Oxford, 161–175.
Meyns S., Illi R. and Ribi B., 1994. Comparison of chlorophyll-a analysis by HPLC and spectrophotom-etry: Where do the differences come from? Arch. Hydrobiol., 132, 129–139.
Millie D.F., Fahnenstiel G.L., Carrick H.J., Lohrenz S.E. and Schofield O.M.E., 2002. Phytoplankton pig-ments in coastal Lake Michigan: distributions during the spring isothermal period and relation withepisodic sediment resuspension. J. Phycol., 38, 639–648.
Moline M.A. and Prezelin B.B., 1997. High-resolution time-series data for in situ carbon fixation at aPalmer LTER site and its implications for modeling primary production in the Southern Ocean.Polar Biol., 17, 39–53.
Moline M.A., Prezelin B.B. and Schofield O., 1997a. Palmer LTER: Stable interannual successional pat-terns of phytoplankton communities in the coastal waters off Palmer Station. Antarctic Journal ofthe United States, 32, 151–153.
Moline M.A., Prezelin B.B., Schofield O. and Smith R.C., 1997b. Temporal dynamics of coastal Antarcticphytoplankton: Environmental driving forces and impact of a 1991–1992 summer diatom bloom onthe nutrient regimes. In: Battaglia B., Valencia J. and Walton D.W.H. (eds.), Antarctic communities,Cambridge University Press, Cambridge, 67–72.
Pannard A., Bormans M., Lefebvre S., Claquin P. and Lagadeuc Y., 2007. Phytoplankton size distributionand community structure: influence of nutrient input and sedimentary loss. J. Plankton Res., 29,583–598.
Pinckney J., Papa R. and Zingmark R., 1994. Comparison of high-performance liquid-chromatographic,spectrophotometric and fluorometric methods for determining chlorophyll a concentrations in es-tuarine sediments. J. Microbiol. Methods, 19, 59–66.
Pinto A.M.F., Von Sperling E. and Moreira R.M., 2001. Chlorophyll-a determination via continuous mea-surement of plankton fluorescence: Methodology development. Water Res., 35, 3977–3981.
Reynolds C.S., 1984. The ecology of freshwater phytoplankton, Cambridge University Press,Cambridge.
Reynolds C.S., Huszar V., Kruk C., Naselli-Flores L. and Melo S., 2002. Towards a functional classifica-tion of the freshwater phytoplankton. J. Plankton Res., 24, 417–428.
Rodriguez H., Rivas J., Guerrero M.G. and Losada M., 1991. Enhancement of phycobiliprotein produc-tion in nitrogen-fixing cyanoabcteria. J. Biotechnol., 20, 263–270.
Rolland A. and Jacquet S., 2010. Classification de l’état écologique du réservoir Marne via l’utilisationde 3 métriques : chlorophylle a, indice planctonique lacustre et phosphore total. Hydroécol. Appl.,17, DOI: 10.1051/hydroecol/2010003.
Smayda T.J., 1978. From phytoplankters to biomass. In: Sournia A. (ed.), Phytoplankton Manual, UnescoParis, 273–279.
Sommer U., 1983. Nutrient competition between phytoplankton species in multispecies chemostat ex-periments. Arch. Hybrobiol., 96, 399–416.
Soohoo J.B., Kiefer D.A., Collins D.J. and McDermid I.S., 1986. In vivo fluorescence excitation andabsorption spectra of marine phytoplankton. J. Plankton Res., 8, 197–214.
Staehr P.A., Henricksen P. and Markager S., 2002. Photoacclimation of four marine phytoplanktonspecies to irradiance and nutrient availability. Mar. Ecol. Progr. Ser., 238, 47–59.
Tadonléké R.D., Jugnia L.B., Sime-Ngando T., Zebaze S. and Nola M., 1998. Short-term vertical distribu-tion of phytoplankton populations in a shallow tropical lake (Lake Municipal, Yaounde, Cameroon).Arch. Hydrobiol., 143, 469–485.
02p18

A. Rolland et al.: Knowl. Managt. Aquatic Ecosyst. (2010) 398, 02
Takano H., Arai T., Hirano M. and Matsunaga T., 1995. Effects of intensity and quality of light onphycocyanin production by a marine cyanobacterium Synechococcus sp. NKBG-042902. Appl.Microbiol. Biotechnol., 43, 1014–1018.
ter Braak C.J.F., 1986. Canonical correspondence analysis: A new eigenfactor technique for multivariatedirect gradient analysis. Ecology, 67, 1167–1179.
ter Braak C.J.F., 1987. The analysis of vegetation-environment relationships by canonical correspon-dence analysis. Vegetatio, 64, 69–77.
Thyssen M., Mathieu D., Garcia N. and Denis M., 2008. Short-term variation of phytoplankton as-semblages in Mediterranean coastal waters recorded with an automated submerged cytometer.J. Plankton Res., 30, 1027–1040.
Tilmann D., Kiesling R., Sterner R., Kilham S. and Johnson F.A., 1986. Green, blue-green and diatomalgae: taxonomic differences in competitive ability for phosphorus, silicon and nitrogen. Arch.Hydrobiol., 106, 473–485.
Trees C.C., Clark D.K., Bidigare R.R., Ondrusek M.E. and Mueller J.L., 2000. Accessory pigmentsversus chlorophyll a concentrations within the euphotic zone: A ubiquitous relationship. Limnol.Oceanog., 45, 1130–1143.
Twiss M. and McLeod I., 2008. Phytoplankton community assessment in eight Lake Ontario tributariesmade using fluorimetric methods. Aquat. Ecosyst. Health Manag., 11, 422–431.
Utermöhl H., 1958. Zur Vervollkommung der quantitativen Phytoplankton-Methodik. Mitteillungen derInternationalen Vereinigung für Limnologie, 9, 1–38.
Vollenweider R.A. and Kerekes J., 1982. Eutrophication of waters. Monitoring, assessment and con-trol. OECD Cooperative Programme on monitoring of inland waters (Eutrophication control),Environment Directorate, OECD, Paris.
Vörös L. and Padisák J., 1991. Phytoplankton biomass and chlorophyll a in some shallow lakes in centralEurope. Hydrobiologia, 215, 111–119.
Wetzel R.G. and Likens G.E., 2000. Limnological Analyses, 3rd edition, Springer, London.
Wolfram G., Dokulil M.T., Pall K., Reichmann M., Schulz L., Argillier C., de Bortoli J., Martinez P.-J.,Rioury C., Hoehn E., Riedmüller U., Schaumburg J., Stelzer D., Buzzi F., Dalmi A., Morabito G.,Marchetto A., Remec-Rekar Š. and Urbanic G., 2007. Intercalibration Exercise, Technical Report+ Annexes, Alpine GIG (Lakes), Vienna – Ispra.
Wright S.W. and Jeffrey S.W., 1987. Fucoxanthin pigment markers of marine phytoplankton analysed byHPLC and HPTLC. Mar. Ecol. Progr. Ser., 38, 259–266.
Yentsch C.S. and Yentsch C.M., 1979. Fluorescence spectral signatures: The characterization of phyto-plankton populations by the use of excitation and emission spectra. J. Mar. Res., 37, 471–483.
02p19