Embed Size (px)
Citation preview
1
Registered office: Deoband, District Saharanpur, Uttar Pradesh 247554. Corporate office: Express Trade Towers, 8th floor, 15-16, Sector 16A, Noida 201301, Ph: 0120-4308000, Fax: 0120-4311011
CIN: L15421UP1932PLC022174 For immediate release
9M FY 18 Consolidated Results ended Dec 31, 2017
Gross Revenue at ` 2677.6 crore, 32% growth
Record Profit after Tax at ` 221.2 crore, a growth of 15%
Sugar Businesses Higher sales volume and lower finance cost resulted in improved Sugar
business performance during 9 months period
Sugar prices considerably declined towards the end of the third quarter
Encouraging sugar operating performance in SS 2017-18
India’s sugar output estimates revised upwards
Engineering Businesses Market has turned around showing good visibility for Gears business;
registered good growth during the quarter in terms of turnover,
profitability and order booking
Muted performance of Water business due to overall Macro-economic
factors, resulting in lower turnover & profitability
Outstanding order book of ` 739.6 crore
NOIDA, February 12, 2018: Triveni Engineering & Industries Ltd. (‘Triveni’), one of the largest
integrated sugar producers in the country; a market leader of engineered-to-order high speed gears
& gearboxes and a leading player in water and wastewater management business, today announced
its performance for the third quarter and nine months ended Dec 31, 2017 (Q3/9M FY 18).
The Company has prepared the Financial Results for the quarter and nine months based on the
Indian Accounting Standards (Ind AS) and as in the past, has been publishing and analyzing results
on a consolidated basis.

2
PERFORMANCE OVERVIEW: Q3/9M FY 18 (Consolidated)
In ` crore
Q3 FY 18 Q3 FY 17 %
Change 9M FY 18 9M FY 17
% Change
Gross Revenue 772.6 723.7 7% 2677.6 2029.4 32%
EBITDA 96.8 131.4 -26% 399.0 369.5 8%
EBITDA Margin 13% 18% 15% 18%
Share of income from Associates 3.3 7.5
10.6 19.5
Profit / (Loss) Before Tax 79.1 102.0 -22% 303.5 254.0 20%
Profit / (Loss) After Tax (PAT) Consolidated
60.1 76.4 -21% 221.2 192.5 15%
Other Comprehensive Income (Net of Tax)
0.9 (0.3) 0.7 0.3
Total Comprehensive Income 61.0 76.1 -20% 221.9 192.8 15%
EPS (not annualized) (`/share) 2.33 2.96
8.58 7.46
The performance of the Company during the nine-month period under review has been better
over previous period mainly due to higher sales volumes (in view of significantly higher
production in the preceding season) and better performance of co-generation business.
Gears business performed well during the quarter and nine months resulting in better order
booking, turnover and profitability.
The performance of Water business has been subdued. Provision has been made for additional
losses in Water Business resulting from delayed projects and the consequent cost overrun.
The total debt of the Company as on Dec 31, 2017 is ` 739.4 crore, which is 57% lower than on
31.03.2017 and 31% lower than on Dec 31, 2016.
The term loan as at Dec 31, 2017 is at ` 194.3 crore (including ` 52.4 crore loans with
concessional interest/interest subvention) and the short term loans including cash credit has
been ` 545.1 crore. During the quarter, the Company repaid total debts amounting to ` 61.3
crore, including prepayment of ` 23.4 crore.
Commenting on the Company’s financial performance, Mr. Dhruv M. Sawhney, Chairman and
Managing Director, Triveni Engineering & Industries Ltd, said:
“The performance of the Company has been satisfactory. The turnover and profitability of 9M FY 18
increased by 32% and 15% respectively as compared to the corresponding period of previous year.
The main reason for this growth is the higher sales volume with healthy contribution margins.
3
The revised estimates of production in the Sugar Season 2017-18 at around 27.5 million tonnes
against 25 million tonnes projected earlier. This, along with supply pressures, has resulted in a
change in market sentiments leading to fall in sugar prices since December 2017 to even below the
cost of production. However, in the last few days there has been an upturn in sugar prices due to the
various Government’s initiatives.
In order to improve the domestic sugar prices and avoid building up of cane dues, the Central
Government has initiated certain measures. The recent welcome move by Government of increasing
the import duty to 100%, withdrawal of stock holding limit on traders and stock limit on sugar sales
by the mills will help the sugar prices to improve. Further, in order to improve the sugar pricing
situation, the Government is also expected to announce mandatory exports to liquidate the surplus
sugar in the country. This should help in bringing more stability to the market which would be
favorable for the sugar prices going forward.
The sugarcane crushing in all our sugar units is in line with our expectations. The cane crushing up to
11th Feb 2018 has increased by 19.3% y-o-y with an increase in sugar production by 22.5% at an
increase in recovery by 28 basis points. We expect that the overall sugar production during the
season will be significantly better than last year, which augurs well for the business going forward.
In view of adequate cane availability and increased operational period, the Cogeneration business
has fared much better than the previous comparable periods. The performance of the distillery has
been impacted during the period under review due to certain regulatory interventions and it is
expected to improve in the coming quarters.
Gears business, during the quarter has performed well in terms of turnover, profitability and the
order booking which augurs well for the business going forward. Our foray into new products is
expected to result in better performance in the coming quarters. In the Water business, the order
inflow is still lumpy with order finalization getting delayed. Similarly, slow progress on certain
projects and delay in completion has resulted in cost escalations, which have adversely impacted the
results. We look forward to stable pipeline of orders and normal execution of projects for the
business to perform better. The total outstanding order book as on Dec 31, 2017 stood at ` 739.6
crore.
- ENDS –
4
Attached: Details to the Announcement and Results Table
About Triveni Engineering & Industries Limited
Triveni Engineering & Industries Limited is a focused, growing corporation having core competencies in the
areas of sugar and engineering. The Company is one amongst the largest integrated sugar manufacturers in
India and the market leader in its engineering businesses comprising high speed gears, gearboxes, and water
treatment solutions. Triveni currently has seven sugar mills in operation at Khatauli, Deoband, Sabitgarh, (all
in western Uttar Pradesh), Chandanpur, Rani Nangal and Milak Narayanpur (all in central Uttar Pradesh) and
Ramkola (eastern Uttar Pradesh). While the Company’s Gears manufacturing facility is located at Mysore, the
Water & Wastewater treatment business is located at Noida. The Company currently operates three grid
connected co-generation plants and three incidental co-generation plants located across five sugar units and
one of the largest single stream molasses based distillery in India, located at Muzaffarnagar.
The Company produces premium quality multi-grade plantation and refined sugar. All of the Sugar units are
FSSC-2000:2010 certified. The sugar is supplied not only to household consumers but also to bulk consumers.
The Company has supply chain relationship with leading multinational beverage, food & FMCG companies and
pharmaceutical companies. It also has a strong presence in branded sugar market through its brand “Shagun”.
The distillery has a flexible manufacturing process allowing it to produce Ethanol, Extra Neutral Alcohol (ENA),
Rectified Spirit (RS) and Special Denatured Spirit (SDS) all of which are renowned for their high quality. Its co-
generation plants in Deoband and Khatauli (Phase I) are registered as Clean Development Mechanism (CDM)
projects with UNFCCC. The Company’s Khatauli, Deoband, Sabitgarh, Chandanpur & Milak Narayanpur units
are also registered as Renewable Energy Certificate (REC) project under CERC.
The Company delivers robust and reliable Gears solutions which cover a range of applications and industries
to meet the ever-changing operating conditions and customers’ requirements. The major product portfolio
includes steam turbines, gas turbines, and compressor gearboxes under the High Power High Speed segment.
In the Low Speed segment, the Company focuses on the gearboxes used in applications such as reciprocating
pumps and compressors, hydel turbines, mill and extruder drives for metal, sugar, rubber and plastic
industries, marine applications, etc. All the products are designed, manufactured and commissioned in
accordance with international quality norms such as DIN/ AGMA/ API/ ISO standards. Its robust and reliable
products are backed by 360 degree service solutions which minimise the downtime for its customers. The
Company provides health monitoring services for all types of critical gearboxes, high speed and low speed, as
well as maintains an inventory of dimension ready sites for immediate solution.
The Company is also one of the leading solutions providers for water treatment, wastewater treatment and
the recycle of water. Advanced Solutions offered for total water management include turnkey / EPC, customer
care, operations and maintenance, life cycle models such as Design, Build Own & Operate (DBOO), Design,
Build Own Operate and Transfer (DBOOT), BOOT, equipment supply for unit processes like screening, grit
separation, clarification and sludge handling. The Customer Care Division offers value added services for
operation management and performance optimisation. The quality service offerings are tailored to
customers’ requirements, which in many cases form an integral part of the main contract - operations and
maintenance, annual maintenance contracts, product & process audit, health check-up and overhauling, pilot
experiments, refreshment, upgradation and automation of existing plants, spares and service consumables
and chemicals and on-site training and assistance.
5
The turbine business of the Company, located at Bengaluru has been demerged through a scheme of
arrangement into Triveni Turbine Limited (TTL) from the appointed date on 1st
October 2010, and the same
has become effective w.e.f. 21st
April, 2011. Triveni Engineering & Industries Limited holds 21.82% equity
capital of Triveni Turbine Limited.
For further information on the Company, its products and services please visit www.trivenigroup.com
C N Narayanan Triveni Engineering & Industries Ltd Ph: +91 120 4308000 Fax: +91 120 4311010, 4311011 E-mail:[email protected]
Gavin Desa/ Rabindra Basu CDR India Ph: +91 22 6645 1237 / 1248 Fax: +91 22 22844561 E-mail: [email protected] [email protected]
Note: Certain statements in this document may be forward-looking statements. Such forward-looking statements are subject to
certain risks and uncertainties like government actions, local political or economic developments, technological risks, and
many other factors that could cause our actual results to differ materially from those contemplated by the relevant
forward looking statements. Triveni Engineering & Industries Ltd. will not be in any way responsible for any action taken
based on such statements and undertakes no obligation to publicly update these forward-looking statements to reflect
subsequent events or circumstances.
6
Q3/9M FY 18: BUSINESS-WISE PERFORMANCE REVIEW
(all figures in ` crore, unless otherwise mentioned)
The consolidated result of the Company includes the results of its associates, Triveni Turbine Limited (TTL) in which the
Company holds 21.82% equity capital and Aqwise-Wise Water Technologies Limited, in which the Company holds 25.04%,
in accordance with Ind AS.
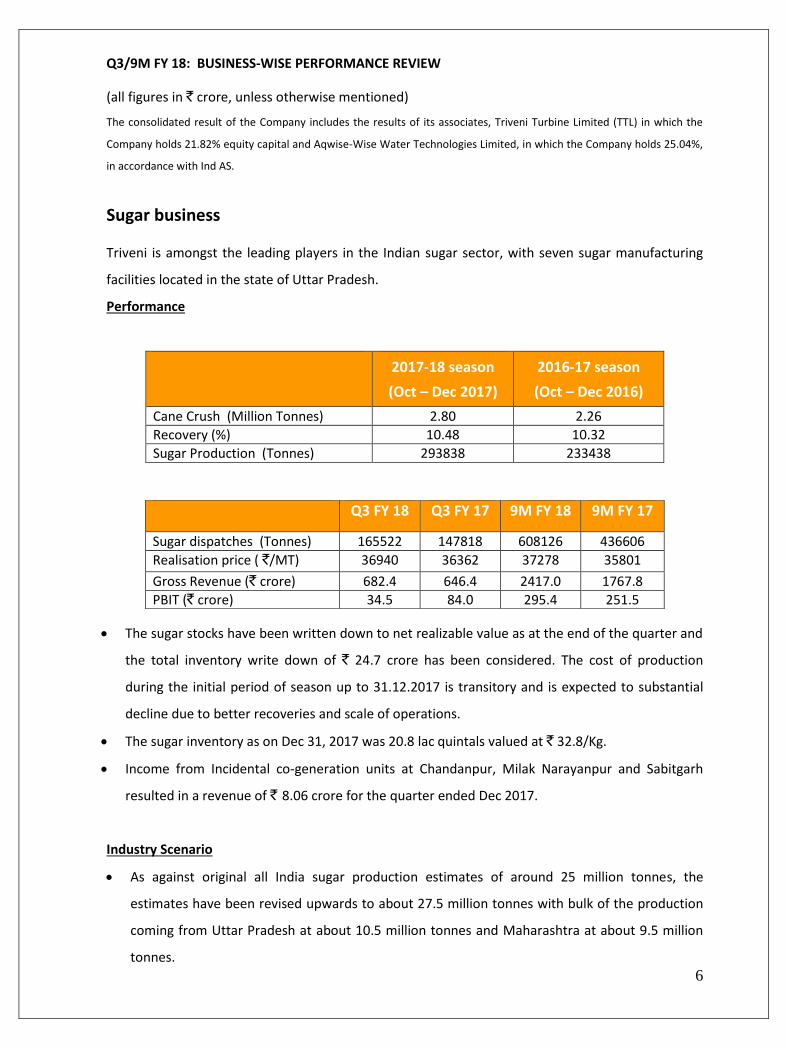
Sugar business Triveni is amongst the leading players in the Indian sugar sector, with seven sugar manufacturing
facilities located in the state of Uttar Pradesh.
Performance
2017-18 season
(Oct – Dec 2017)
2016-17 season
(Oct – Dec 2016)
Cane Crush (Million Tonnes) 2.80 2.26
Recovery (%) 10.48 10.32
Sugar Production (Tonnes) 293838 233438
The sugar stocks have been written down to net realizable value as at the end of the quarter and
the total inventory write down of ` 24.7 crore has been considered. The cost of production
during the initial period of season up to 31.12.2017 is transitory and is expected to substantial
decline due to better recoveries and scale of operations.
The sugar inventory as on Dec 31, 2017 was 20.8 lac quintals valued at ` 32.8/Kg.
Income from Incidental co-generation units at Chandanpur, Milak Narayanpur and Sabitgarh
resulted in a revenue of ` 8.06 crore for the quarter ended Dec 2017.
Industry Scenario
As against original all India sugar production estimates of around 25 million tonnes, the
estimates have been revised upwards to about 27.5 million tonnes with bulk of the production
coming from Uttar Pradesh at about 10.5 million tonnes and Maharashtra at about 9.5 million
tonnes.
Q3 FY 18 Q3 FY 17 9M FY 18 9M FY 17
Sugar dispatches (Tonnes) 165522 147818 608126 436606
Realisation price ( `/MT) 36940 36362 37278 35801
Gross Revenue (` crore) 682.4 646.4 2417.0 1767.8
PBIT (` crore) 34.5 84.0 295.4 251.5
7
In view of supply pressure to pay cane dues and estimates of higher production estimates, the
sugar prices have fallen by about ` 5 per kg and risen shortly recently.
The Government had been pragmatic in comprehending the grave situation and the problems
of resultant cane dues. It has initiated series of actions which have reversed the trend of decline
in prices including withdrawal of stock holding limit on traders and increasing the import duty to
100%. However, the export is the only sustainable solution to liquidate the surplus stocks.
The Central Government has also announced stock limit on sales of sugar by mills under which
each sugar mill will have to keep with at the end of February 2018 not less than 83% of the
closing stock as on January 31 in addition to the February sugar production less sugar exported
during the month and for February 2018, 86% of the closing stock as of February 2018 in
addition to March sugar production less sugar exports for March 2018. This should help in
maintaining the demand-supply balance in the market thus improving sugar prices and helping
in timely payment of sugarcane prices to farmers.
FRP has been declared for SS 2017-18 at ` 255 per quintal, an increase of 11% from the last
season, linked to a basic recovery rate of 9.5% subject to a premium of ` 2.68 per quintal for
every 0.1% point increase in recovery above that level.
The Uttar Pradesh govt. has announced sugarcane SAP at a price hike of ` 10/quintal over the
previous season. The SAP of general variety of sugarcane is ` 315/quintal, ` 325/quintal
and ` 310 per quintal for early maturing and rejected variety respectively.
As per the industry information around 504 factories are operational across India and have
produced around 17.1 million tonnes of sugar till 31st Jan 2018. Sugar production in key states:
Uttar Pradesh – 5.4 million tonnes
Maharashtra – 6.3 million tonnes
Karnataka – 2.7 million tonnes
Tamil Nadu – 0.2 million tonnes
The recovery for the state of UP has increased by 28 basis points at 10.26% till end of Jan 2018
as compared to the corresponding period of last year. The sugar production in UP has increased
by 21% to 5.4 million tonnes at the end of Jan 2018 as against 4.5 million tonnes produced in
the corresponding period of last year.
The Central Government has raised the ethanol price by around 5% from ` 39/ltr to ` 40.85 per
ltr for Marketing Year 2017-18 starting from December 2017 for a total quantity of 313 crore
litres, an increased quantity of ~12% over last year.
Currently, OMCs have released tenders worth ` 313.57 crore litres for the current marketing
year.
8
International sugar scenario
The global sugar surplus is estimated at a further 3.9 million tonnes in 2017/18. The global sugar
prices have been under pressure and at the end of Jan 2018 reached levels of 13.23
Cents/Pound for raw sugar and 352.40 US$/MT.
The sugar production for the 2017-18 harvest is substantially complete in Brazil. The sugar
produced by Brazil CS region mills till Jan 16, 2018 is 35,827 thousand tonnes which is 1.67%
higher than the corresponding period of previous year. The share of sugarcane towards
production of sugar has increased to 46.92% in 2017/18 as compared to 46.60% in 2016/2017.
In Thailand, the sugar production is estimated at ~ 12 million tonnes in 2017/18 owing to
improved sugar extraction rate. The total cane crushing reached 20.1 million tonnes producing
sugar at 1.6 million tonnes by the end of December 2017 as compared to 0.931 million tonnes
produced in the corresponding period of previous year.
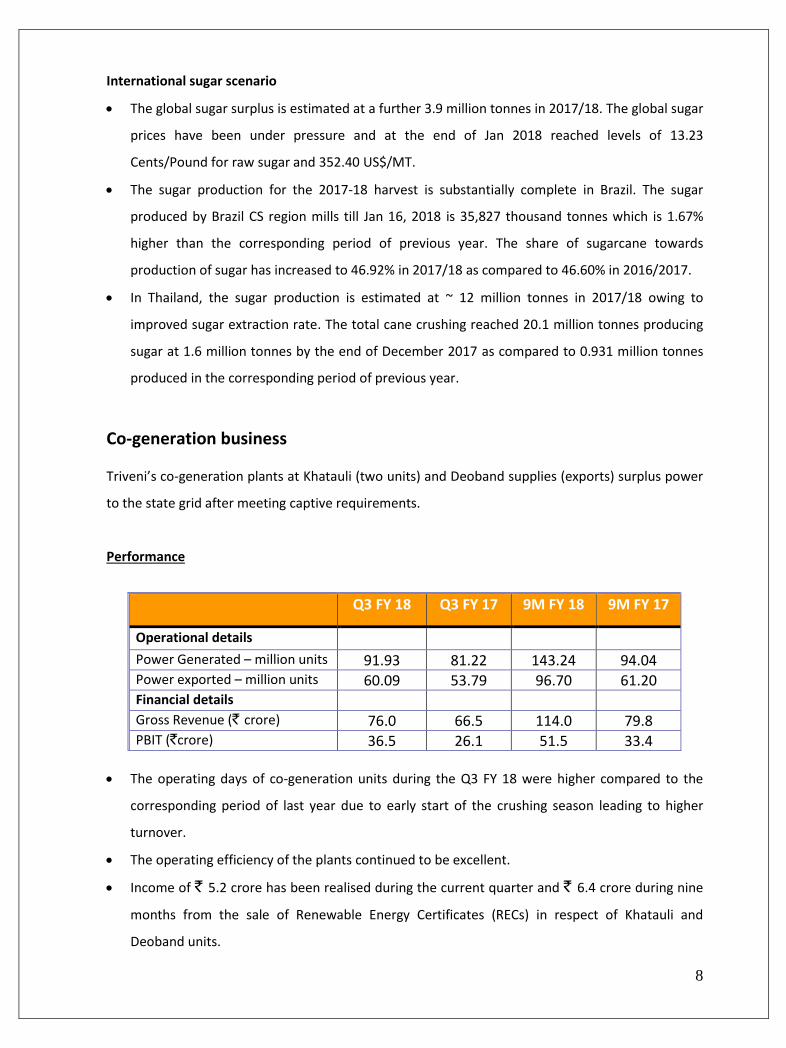
Co-generation business Triveni’s co-generation plants at Khatauli (two units) and Deoband supplies (exports) surplus power
to the state grid after meeting captive requirements.
Performance
Q3 FY 18 Q3 FY 17 9M FY 18 9M FY 17
Operational details
Power Generated – million units 91.93 81.22 143.24 94.04 Power exported – million units 60.09 53.79 96.70 61.20 Financial details Gross Revenue (` crore) 76.0 66.5 114.0 79.8 PBIT (`crore) 36.5 26.1 51.5 33.4
The operating days of co-generation units during the Q3 FY 18 were higher compared to the
corresponding period of last year due to early start of the crushing season leading to higher
turnover.
The operating efficiency of the plants continued to be excellent.
Income of ` 5.2 crore has been realised during the current quarter and ` 6.4 crore during nine
months from the sale of Renewable Energy Certificates (RECs) in respect of Khatauli and
Deoband units.

9
With the estimated increase in cane crush for 2017-18 season, the outlook for the co-
generation business segment is good and we believe the same will be reflected in the
performance in the coming quarters.
Distillery business
Triveni’s distillery produces Extra Neutral Alcohol (ENA), Rectified Spirit (RS), Special Denatured
Spirit (SDS), and Ethanol
Performance
Q3 FY 18 Q3 FY 17 9M FY 18 9M FY 17
Operational details Production (KL) 7590 12412 15608 25785 Sales (KL) 5868 8477 19752 29139 Avg. realisation (`/ ltr) 39.15 40.50 39.04 42.17 Financial details
Gross Revenue (` crore) 23.1 38.1 81.9 129.7 PBIT (`crore) 7.7 8.5 6.5 29.0
The distillery remained closed for over a month in first half of FY 18 which has impacted the
overall production of the distillery.
The ethanol tender for Dec 2017- Nov 18 was delayed and due to which the supplies during
the quarter had affected, which resulted in lower sales volume.
The Company received 2.72 cr ltr of contract for ethanol supply during 2017-18 (Dec 17-
Nov 18) at an administered basic price of ` 40.85 /litre.
The share of Ethanol sales in 9M FY 18 is 92% of the total sales volume, as against 73% in
9M FY 17.
High speed gears and gearboxes business
This business manufactures high-speed gears and gearboxes upto 70MW capacity with speeds of
70,000 rpm. Triveni is the country’s largest one-stop solutions provider in this sector with over 60%
overall market share.

10
Performance
(*) include ` 50.8 crore executable beyond FY 19
The activities during 9M FY 18 have picked up as indicated by the order booking. Order
booking also improved by 115% in the quarter while the increase in the 9-month period has
been high at 151%.
Overall the market looks stable with positive signs from some sectors.
The business has strong enquiries from defence and is hopeful of concluding some more of
them in the coming quarters.
The outstanding order book as on Dec 31, 2017 stood at ` 138.1 crore including order of `
50.8 crore executable beyond FY 18.
Outlook
The market outlook for the capital goods segment is advancing towards recovery. Sectors
where orders have been poor are expected to turn positive in the next couple of quarters.
The turnover from OEMs have gone up by 43% during the nine months in comparison to the
same period last year.
Similarly, Retro business including spares and services have also gone up by 35% year on
year during the nine-month period under review.
Replacement business is doing well and is expected to continue.
The Company is exploring new product & geographies to expand so as to further improve its
turnover and profitability.
Water business
This business is focused on providing world-class solutions in water and wastewater treatment to
customers in industrial and municipal segments. This business is gaining faster momentum and is
getting recognition in a high potential market as a supplier of superior quality products and services
at competitive costs.
Q3 FY 18 Q3 FY 17 9M FY 18 9M FY 17
Gross Revenue (` crore) 28.2 19.7 70.0 53.9 PBIT (` crore) 9.6 3.1 16.6 7.6 Order Booking (` crore) 33.7 15.7 149.4(*) 59.4
11
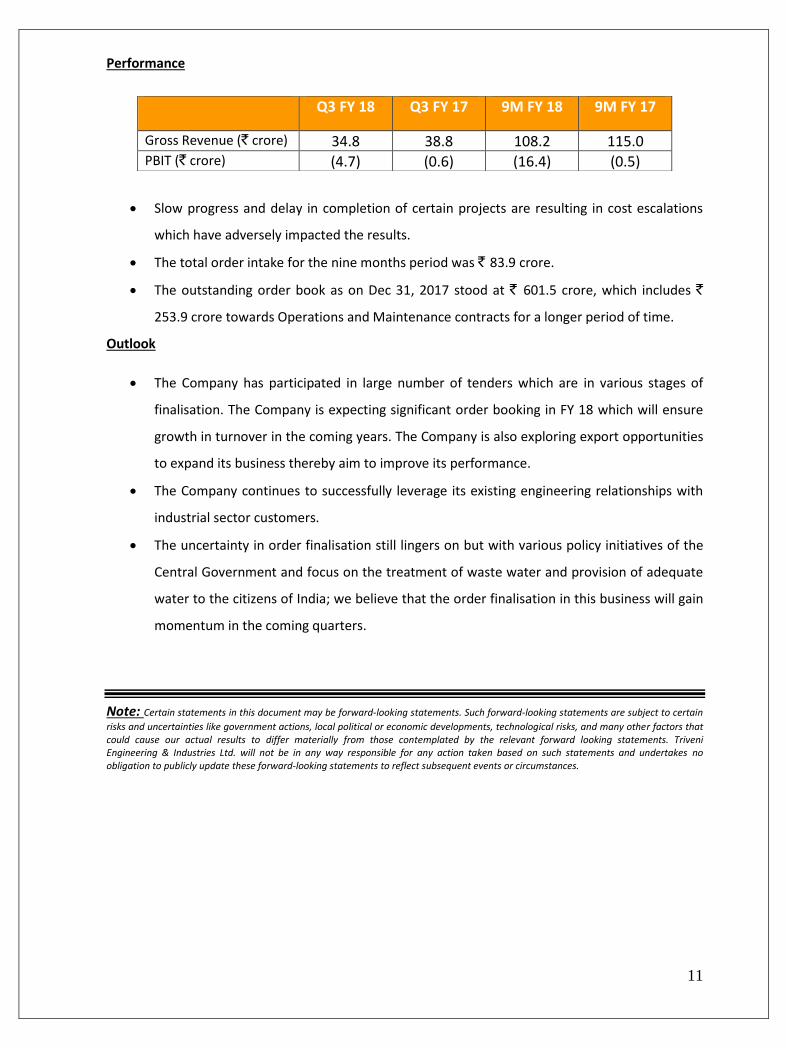
Performance
Slow progress and delay in completion of certain projects are resulting in cost escalations
which have adversely impacted the results.
The total order intake for the nine months period was ` 83.9 crore.
The outstanding order book as on Dec 31, 2017 stood at ` 601.5 crore, which includes `
253.9 crore towards Operations and Maintenance contracts for a longer period of time.
Outlook
The Company has participated in large number of tenders which are in various stages of
finalisation. The Company is expecting significant order booking in FY 18 which will ensure
growth in turnover in the coming years. The Company is also exploring export opportunities
to expand its business thereby aim to improve its performance.
The Company continues to successfully leverage its existing engineering relationships with
industrial sector customers.
The uncertainty in order finalisation still lingers on but with various policy initiatives of the
Central Government and focus on the treatment of waste water and provision of adequate
water to the citizens of India; we believe that the order finalisation in this business will gain
momentum in the coming quarters.
Note: Certain statements in this document may be forward-looking statements. Such forward-looking statements are subject to certain
risks and uncertainties like government actions, local political or economic developments, technological risks, and many other factors that could cause our actual results to differ materially from those contemplated by the relevant forward looking statements. Triveni Engineering & Industries Ltd. will not be in any way responsible for any action taken based on such statements and undertakes no obligation to publicly update these forward-looking statements to reflect subsequent events or circumstances.
Q3 FY 18 Q3 FY 17 9M FY 18 9M FY 17
Gross Revenue (` crore) 34.8 38.8 108.2 115.0 PBIT (` crore) (4.7) (0.6) (16.4) (0.5)

(` in lakhs, except per share data)
Year ended
31/Dec/2017 30/Sep/2017 31/Dec/2016 31/Dec/2017 31/Dec/2016 31/Mar/2017
(Unaudited) (Unaudited) (Unaudited) (Unaudited) (Unaudited) (Audited)
1 Revenue from operations (refer note 3) 77255 106075 72368 267759 202936 296687
2 Other income 665 790 400 1695 2021 3037
Total income 77920 106865 72768 269454 204957 299724
3 Expenses
(a) Cost of materials consumed 96659 3683 77692 117716 84054 206446
(b) Purchases of stock-in-trade 488 243 442 1097 1019 1537 (c) Changes in inventories of finished goods, stock-in-trade and
work-in-progress(45870) 80944 (36342) 78561 48845 (23951)
(d) Excise duty on sale of goods (refer note 3) - - 3572 4168 9927 14232
(e) Employee benefits expense 5343 4570 4748 14374 13569 18771
(f) Finance costs 711 2077 2282 6467 9398 12656
(g) Depreciation and amortisation expense 1390 1378 1410 4142 4103 5721
(h) Off-season expenses (net) (refer note 2) 3100 (5935) 2474 (7340) (8402) -
(i) Other expenses 8201 5789 7042 20112 18668 27493
Total expenses 70022 92749 63320 239297 181181 262905
4 Profit from continuing operations before exceptional items and tax 7898 14116 9448 30157 23776 36819
5 Exceptional items (net) - income/(expense) - - - - - (8547)
6 Profit from continuing operations before tax 7898 14116 9448 30157 23776 28272 7 Tax expense
(a) Current tax 1879 3049 - 6696 - 2336
(b) Deferred tax 21 958 2565 1535 6146 2580
Total tax expense 1900 4007 2565 8231 6146 4916
8 Profit from continuing operations after tax 5998 10109 6883 21926 17630 23356
9 Profit/(loss) from discontinued operations - - - - - -
10 Tax expense of discontinued operations - - - - - -
11 Profit/(loss) from discontinued operations (after tax) - - - - - -
12 Profit for the period 5998 10109 6883 21926 17630 23356
13 Other comprehensive income
A (i) Items that will not be reclassified to profit or loss - - (26) - 32 (686)
A (ii) Income tax relating to items that will not be reclassified to profit or loss - - - - - (237) B (i) Items that will be reclassified to profit or loss - - - - - -
B (ii) Income tax relating to items that will be reclassified to profit or loss - - - - - -
Other comprehensive income for the period, net of tax - - (26) - 32 (449)
14 Total comprehensive income for the period 5998 10109 6857 21926 17662 22907
15 Paid up Equity Share Capital (face value ` 1/-) 2579 2579 2579 2579 2579 2579
16 Other Equity 75188
17 Earnings per share of ` 1/- each (not annualised)
(a) Basic (in `) 2.33 3.92 2.67 8.50 6.84 9.06
(b) Diluted (in `) 2.33 3.92 2.67 8.50 6.84 9.060.50
See accompanying notes to the standalone financial results
Statement of Standalone Unaudited Financial Results for the Quarter and Nine Months ended December 31, 2017
TRIVENI ENGINEERING & INDUSTRIES LIMITED
Regd. Office : Deoband, Distt. Saharanpur, Uttar Pradesh 247 554
Corp. Office : 8th Floor, Express Trade Towers, 15-16, Sector-16A, Noida, U.P - 201 301
CIN : L15421UP1932PLC022174
Particulars
3 Months ended 9 Months ended
(` in lakhs)
Year ended
31/Dec/2017 30/Sep/2017 31/Dec/2016 31/Dec/2017 31/Dec/2016 31/Mar/2017
(Unaudited) (Unaudited) (Unaudited) (Unaudited) (Unaudited) (Audited)
1 Segment Revenue
(a) Sugar Businesses
Sugar 68235 97556 64638 241697 176776 261079
Co-Generation 7595 195 6647 11400 7982 18261
Distillery 2310 1680 3808 8191 12968 16796
78140 99431 75093 261288 197726 296136
(b) Engineering Businesses
Gears 2820 2792 1969 7003 5391 9216
Water 3480 3852 3875 10821 11502 18123
6300 6644 5844 17824 16893 27339
(c) Others 1402 1798 1516 4507 3997 5618
Total Segment revenue 85842 107873 82453 283619 218616 329093
Less : Inter segment revenue 8587 1798 10085 15860 15680 32406
Total Revenue from operations 77255 106075 72368 267759 202936 296687
2 Segment Results
(a) Sugar Businesses
Sugar 3445 15546 8404 29536 25152 36492
Co-Generation 3653 124 2607 5147 3341 6942
Distillery 771 (361) 853 650 2897 4657
7869 15309 11864 35333 31390 48091
(b) Engineering Businesses
Gears 959 602 312 1655 761 1802
Water (472) (839) (60) (1640) (49) (275)
487 (237) 252 15 712 1527
(c) Others 4 23 25 11 31 31
Total Segment results 8360 15095 12141 35359 32133 49649
Less :
(i) Finance costs 711 2077 2282 6467 9398 12656
(ii) Exceptional items (net) - (income)/expense - - - - - 8547
(iii) Other unallocable expenditure net of unallocable income (249) (1098) 411 (1265) (1041) 174
Total Profit before tax 7898 14116 9448 30157 23776 28272
3 Segment Assets
(a) Sugar Businesses
Sugar 143396 101482 165142 143396 165142 225999
Co-Generation 15347 14972 20014 15347 20014 17940
Distillery 11071 12133 14100 11071 14100 17027
169814 128587 199256 169814 199256 260966
(b) Engineering Businesses
Gears 12539 11464 11808 12539 11808 12292
Water 20935 21891 21106 20935 21106 21590
33474 33355 32914 33474 32914 33882
(c) Others 1655 2086 2119 1655 2119 2383
Total Segment Assets 204943 164028 234289 204943 234289 297231
Add : Unallocable assets 11672 11186 10802 11672 10802 7958
Total Assets 216615 175214 245091 216615 245091 305189
4 Segment Liabilities
(a) Sugar Businesses
Sugar 21111 10252 44011 21111 44011 36133
Co-Generation 364 347 1267 364 1267 356
Distillery 763 931 1283 763 1283 979
22238 11530 46561 22238 46561 37468
(b) Engineering Businesses
Gears 2488 1990 1823 2488 1823 1864
Water 9694 9972 8395 9694 8395 10025
12182 11962 10218 12182 10218 11889
(c) Others 1289 1699 1858 1289 1858 1963
Total Segment Liabilities 35709 25191 58637 35709 58637 51320
Add : Unallocable liabilities 82014 57104 113893 82014 113893 176102
Total Liabilities 117723 82295 172530 117723 172530 227422
Particulars3 Months ended 9 Months ended
TRIVENI ENGINEERING & INDUSTRIES LIMITED
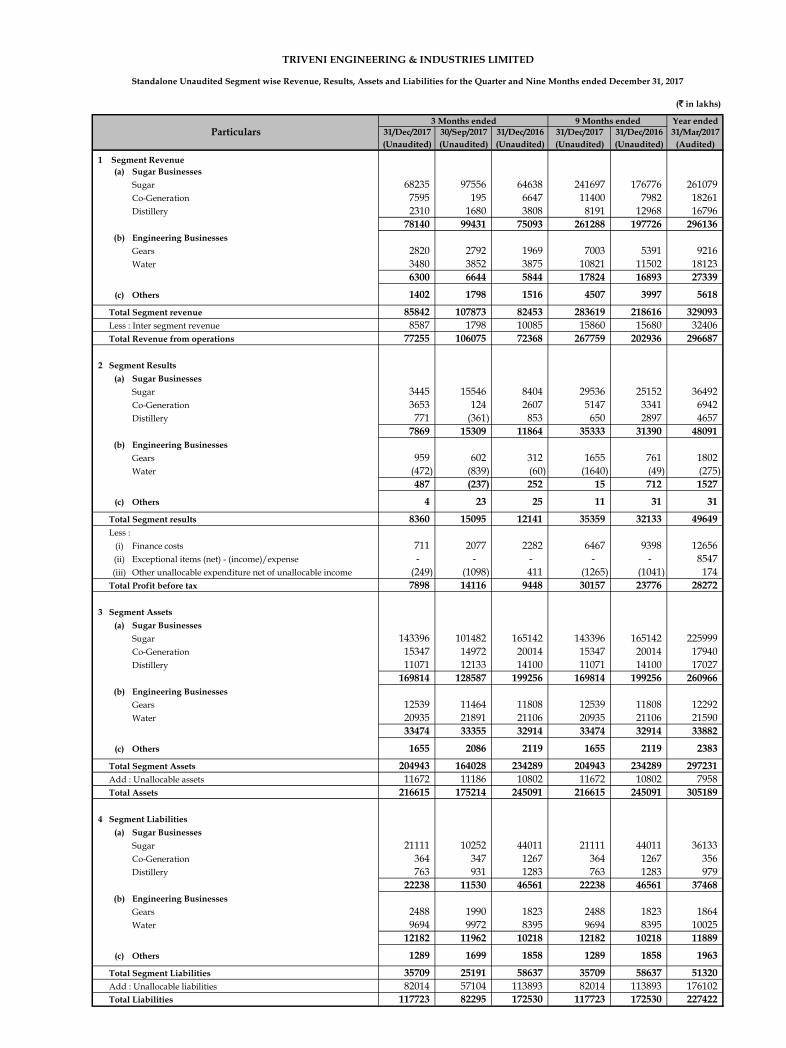
Standalone Unaudited Segment wise Revenue, Results, Assets and Liabilities for the Quarter and Nine Months ended December 31, 2017

TRIVENI ENGINEERING & INDUSTRIES LIMITED
Notes to the Standalone Unaudited Financial Results for the Quarter and Nine
Months ended December 31, 2017
1. In view of the seasonality of the Sugar Business, the performance results may vary from quarter
to quarter.
2. For the purpose of nine months financial results, off-season expenses of sugar and co-generation
units have been deferred for inclusion in the cost of production of the relevant products to be
produced in the remaining part of the year.
3. Post the applicability of Goods and Service Tax (GST) with effect from July 1, 2017, revenue from
operations are disclosed net of GST. Accordingly, the revenue from operations and excise duty
expenses for the quarter and nine months ended December 31, 2017 are not comparable with the
previous periods presented in the results.
4. The above results were reviewed and recommended for adoption by the Audit Committee and
approved by the Board of Directors of the Company at their respective meetings held on
February 12, 2018. The statutory auditors have carried out a limited review of the above financial
results.
For Triveni Engineering & Industries Limited
Place : Noida Dhruv M. Sawhney
Date : February 12, 2018 Chairman & Managing Director

(` in lakhs, except per share data)
Year ended
31/Dec/2017 30/Sep/2017 31/Dec/2016 31/Dec/2017 31/Dec/2016 31/Mar/2017
(Unaudited) (Unaudited) (Unaudited) (Unaudited) (Unaudited) (Audited)
1 Revenue from operations (refer note 3) 77255 106075 72368 267759 202936 296687
2 Other income 341 251 401 831 1697 2713
Total income 77596 106326 72769 268590 204633 299400
3 Expenses
(a) Cost of materials consumed 96659 3683 77692 117716 84054 206446
(b) Purchases of stock-in-trade 488 243 442 1097 1019 1537 (c) Changes in inventories of finished goods, stock-in-trade and
work-in-progress(45870) 80944 (36342) 78561 48845 (23951)
(d) Excise duty on sale of goods (refer note 3) - - 3572 4168 9927 14232
(e) Employee benefits expense 5343 4570 4748 14374 13569 18771
(f) Finance costs 711 2077 2282 6467 9398 12656
(g) Depreciation and amortisation expense 1390 1378 1410 4142 4103 5721
(h) Off-season expenses (net) (refer note 2) 3100 (5935) 2474 (7340) (8402) -
(i) Other expenses 8201 5791 7045 20114 18671 27497
Total expenses 70022 92751 63323 239299 181184 262909 4
7574 13575 9446 29291 23449 36491
5 Share of profit of associates 333 494 753 1063 1946 2268
6 Profit from continuing operations before exceptional items and tax 7907 14069 10199 30354 25395 38759
7 Exceptional items (net) - income/(expense) - - - - - (8547)
8 Profit from continuing operations before tax 7907 14069 10199 30354 25395 30212
9 Tax expense
(a) Current tax 1879 3049 - 6696 - 2337
(b) Deferred tax 21 958 2565 1535 6146 2580
Total tax expense 1900 4007 2565 8231 6146 4917
10 Profit from continuing operations after tax 6007 10062 7634 22123 19249 25295
11 Profit/(loss) from discontinued operations - - - - - -
12 Tax expense of discontinued operations - - - - - -
13 Profit/(loss) from discontinued operations (after tax) - - - - - -
14 Profit for the period 6007 10062 7634 22123 19249 25295
Profit for the period attributable to :
(i) Owners of the Company 6007 10062 7634 22123 19249 25295
(ii) Non-controlling interests - - - - - -
15 Other comprehensive income
A (i) Items that will not be reclassified to profit or loss - - (26) - 32 (714)
A (ii) Income tax relating to items that will not be reclassified to profit or loss - - - - - (237)
B (i) Items that will be reclassified to profit or loss 94 (28) 1 72 (1) (2)
B (ii) Income tax relating to items that will be reclassified to profit or loss - - - - - -
Other comprehensive income for the period, net of tax 94 (28) (25) 72 31 (479)
Other comprehensive income for the period, net of tax attributable to:
(i) Owners of the Company 94 (28) (25) 72 31 (479)
(ii) Non-controlling interests - - - - - -
16 Total comprehensive income for the period 6101 10034 7609 22195 19280 24816
Total comprehensive income for the period attributable to:
(i) Owners of the Company 6101 10034 7609 22195 19280 24816
(ii) Non-controlling interests - - - - - -
17 Paid up Equity Share Capital (face value ` 1/-) 2579 2579 2579 2579 2579 2579
18 Other Equity 80959 19 Earnings per share of ` 1/- each (not annualised)
(a) Basic (in `) 2.33 3.90 2.96 8.58 7.46 9.81
(b) Diluted (in `) 2.33 3.90 2.96 8.58 7.46 9.81
See accompanying notes to the consolidated financial results
Particulars
3 Months ended 9 Months ended
TRIVENI ENGINEERING & INDUSTRIES LIMITEDRegd. Office : Deoband, Distt. Saharanpur, Uttar Pradesh 247 554
Corp. Office : 8th Floor, Express Trade Towers, 15-16, Sector-16A, Noida, U.P - 201 301
CIN : L15421UP1932PLC022174
Statement of Consolidated Unaudited Financial Results for the Quarter and Nine Months ended December 31, 2017
Profit from continuing operations before share of profit of
associates, exceptional items and tax
(` in lakhs)
Year ended
31/Dec/2017 30/Sep/2017 31/Dec/2016 31/Dec/2017 31/Dec/2016 31/Mar/2017
(Unaudited) (Unaudited) (Unaudited) (Unaudited) (Unaudited) (Audited)
1 Segment Revenue
(a) Sugar Businesses
Sugar 68235 97556 64638 241697 176776 261079
Co-Generation 7595 195 6647 11400 7982 18261
Distillery 2310 1680 3808 8191 12968 16796 78140 99431 75093 261288 197726 296136
(b) Engineering Businesses
Gears 2820 2792 1969 7003 5391 9216
Water 3480 3852 3875 10821 11502 18123 6300 6644 5844 17824 16893 27339
(c) Others 1402 1798 1516 4507 3997 5618
Total Segment revenue 85842 107873 82453 283619 218616 329093
Less : Inter segment revenue 8587 1798 10085 15860 15680 32406 Total Revenue from operations 77255 106075 72368 267759 202936 296687
2 Segment Results
(a) Sugar Businesses
Sugar 3445 15546 8404 29536 25152 36492
Co-Generation 3653 124 2607 5147 3341 6942
Distillery 771 (361) 853 650 2897 4657 7869 15309 11864 35333 31390 48091
(b) Engineering Businesses
Gears 959 602 312 1655 761 1802
Water (472) (839) (60) (1640) (49) (275) 487 (237) 252 15 712 1527
(c) Others 4 23 25 11 31 31
Total Segment results 8360 15095 12141 35359 32133 49649
Less :
(i) Finance costs 711 2077 2282 6467 9398 12656
(ii) Exceptional items (net) - (income)/expense - - - - - 8547
(iii) Share of (profit)/loss of associates (333) (494) (753) (1063) (1946) (2268)
(iv) Other unallocable expenditure net of unallocable income 75 (557) 413 (399) (714) 502 Total Profit before tax 7907 14069 10199 30354 25395 30212
3 Segment Assets
(a) Sugar Businesses
Sugar 143396 101482 165142 143396 165142 225999
Co-Generation 15347 14972 20014 15347 20014 17940
Distillery 11071 12133 14100 11071 14100 17027 169814 128587 199256 169814 199256 260966
(b) Engineering Businesses
Gears 12539 11464 11808 12539 11808 12292
Water 20935 21891 21106 20935 21106 21590 33474 33355 32914 33474 32914 33882
(c) Others 1655 2086 2119 1655 2119 2383
Total Segment Assets 204943 164028 234289 204943 234289 297231
Add : Unallocable assets 17511 16924 16004 17511 16004 13530 Total Assets 222454 180952 250293 222454 250293 310761
4 Segment Liabilities
(a) Sugar Businesses
Sugar 21111 10252 44011 21111 44011 36133
Co-Generation 364 347 1267 364 1267 356
Distillery 763 931 1283 763 1283 979 22238 11530 46561 22238 46561 37468
(b) Engineering Businesses
Gears 2488 1990 1823 2488 1823 1864
Water 9694 9972 8395 9694 8395 10025 12182 11962 10218 12182 10218 11889
(c) Others 1289 1699 1858 1289 1858 1963
Total Segment Liabilities 35709 25191 58637 35709 58637 51320
Add : Unallocable liabilities 81815 56905 113693 81815 113693 175903 Total Liabilities 117524 82096 172330 117524 172330 227223
TRIVENI ENGINEERING & INDUSTRIES LIMITED
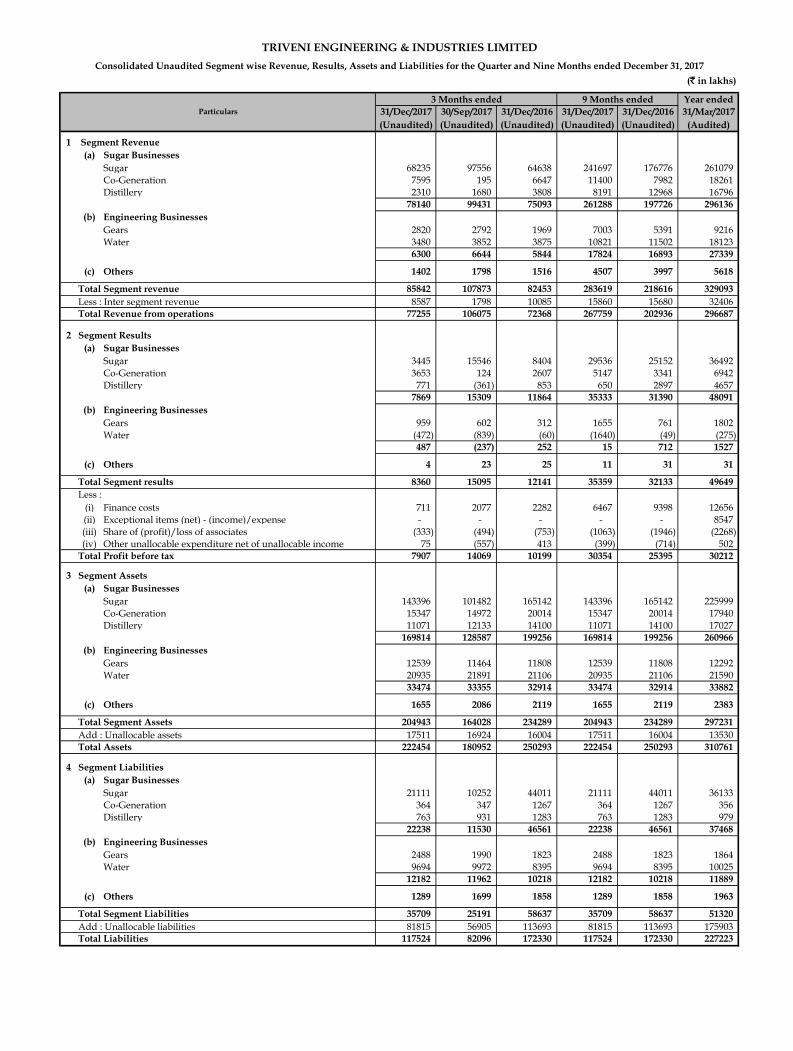
Consolidated Unaudited Segment wise Revenue, Results, Assets and Liabilities for the Quarter and Nine Months ended December 31, 2017
Particulars
3 Months ended 9 Months ended
TRIVENI ENGINEERING & INDUSTRIES LIMITED
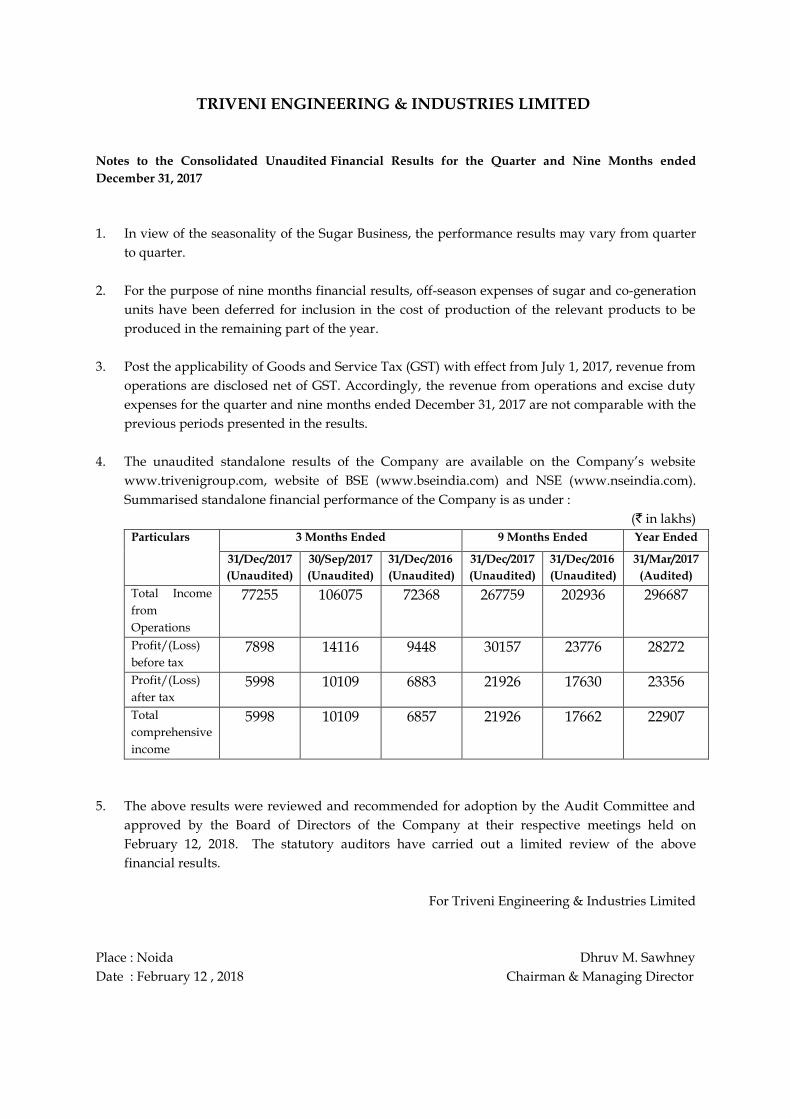
Notes to the Consolidated Unaudited Financial Results for the Quarter and Nine Months ended
December 31, 2017
1. In view of the seasonality of the Sugar Business, the performance results may vary from quarter
to quarter.
2. For the purpose of nine months financial results, off-season expenses of sugar and co-generation
units have been deferred for inclusion in the cost of production of the relevant products to be
produced in the remaining part of the year.
3. Post the applicability of Goods and Service Tax (GST) with effect from July 1, 2017, revenue from
operations are disclosed net of GST. Accordingly, the revenue from operations and excise duty
expenses for the quarter and nine months ended December 31, 2017 are not comparable with the
previous periods presented in the results.
4. The unaudited standalone results of the Company are available on the Company’s website
www.trivenigroup.com, website of BSE (www.bseindia.com) and NSE (www.nseindia.com).
Summarised standalone financial performance of the Company is as under :
(` in lakhs)
Particulars 3 Months Ended 9 Months Ended Year Ended
31/Dec/2017
(Unaudited)
30/Sep/2017
(Unaudited)
31/Dec/2016
(Unaudited)
31/Dec/2017
(Unaudited)
31/Dec/2016
(Unaudited)
31/Mar/2017
(Audited)
Total Income
from
Operations
77255 106075 72368 267759 202936 296687
Profit/(Loss)
before tax 7898 14116 9448 30157 23776 28272
Profit/(Loss)
after tax 5998 10109 6883 21926 17630 23356
Total
comprehensive
income
5998 10109 6857 21926 17662 22907
5. The above results were reviewed and recommended for adoption by the Audit Committee and
approved by the Board of Directors of the Company at their respective meetings held on
February 12, 2018. The statutory auditors have carried out a limited review of the above
financial results.
For Triveni Engineering & Industries Limited
Place : Noida Dhruv M. Sawhney
Date : February 12 , 2018 Chairman & Managing Director