Embed Size (px)
Citation preview

25707.04 9 April 2018 10:09 AM proof 625707.04 9 April 2018 10:09 AM proof 6 25707.04 9 April 2018 10:09 AM proof 625707.04 9 April 2018 10:09 AM proof 6 25707.04 9 April 2018 10:09 AM proof 6
Cap
ital & R
egio
nal plc Annual Report and Accounts for the year ended 30 D
ecember 2017
Stock Code: CALAnnual Report and Accounts for the year ended 30 December 2017
Communities & Retailers
Capital & Regional AR2017.indd 3 10/04/2018 16:03:05

25707.04 9 April 2018 10:09 AM proof 625707.04 9 April 2018 10:09 AM proof 6 25707.04 9 April 2018 10:09 AM proof 625707.04 9 April 2018 10:09 AM proof 6 25707.04 9 April 2018 10:09 AM proof 6
WELCOME TO THE CAPITAL & REGIONAL ANNUAL REPORT 2017
Capital & Regional is a UK focused retail property REIT specialising in community shopping centres that dominate their catchment, serving the non-discretionary and value
orientated needs of their local communities. It has a strong track record of delivering value enhancing retail and leisure asset management opportunities across a c.£1 billion portfolio of tailored in-town community shopping centres.
Capital & Regional is listed on the main market of the London Stock Exchange and has a secondary listing on the Johannesburg Stock Exchange.
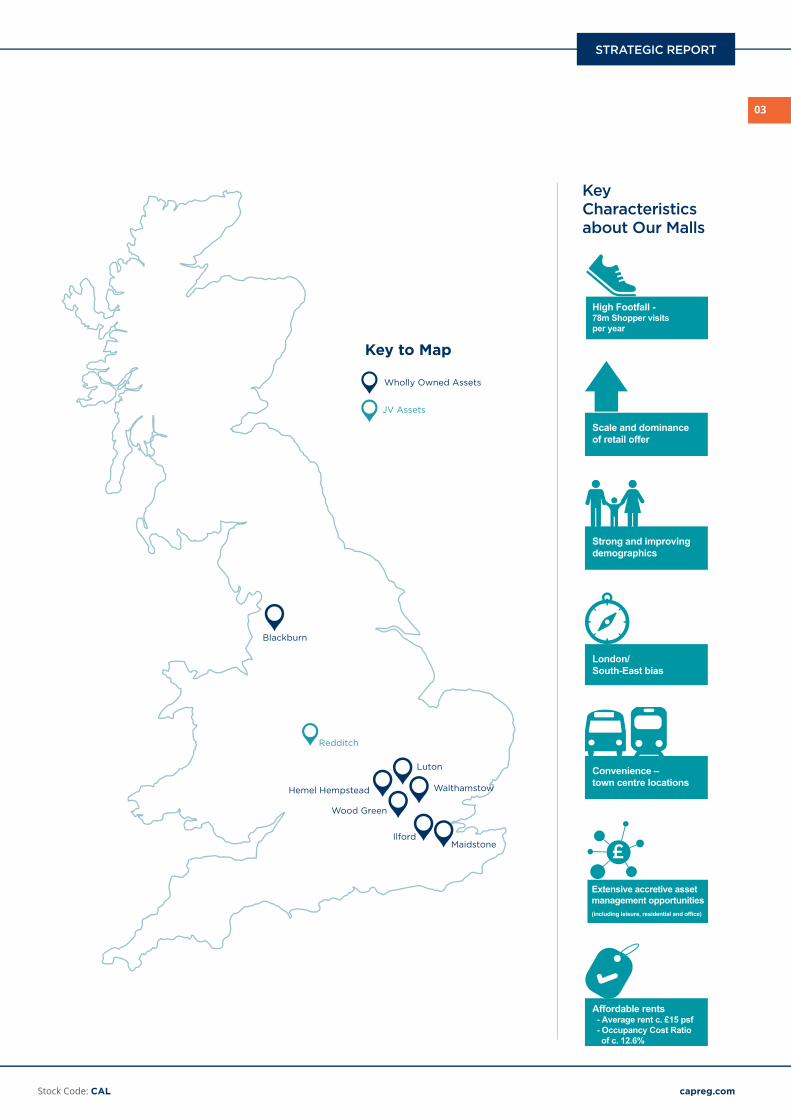
Capital & Regional owns seven shopping centres in Blackburn, Hemel Hempstead, Ilford, Luton, Maidstone, Walthamstow and Wood Green. It also has a 20% joint venture interest
in the Kingfisher Centre in Redditch. Capital & Regional manages these assets through its in-house expert property and asset management platform.
Capital & Regional strategy
Redefine – Redefine and own the Community shopping centre category in the UK, consistent with global best practice
Reposition – Actively remerchandise centres to increase exposure to growth and online resilient categories and differentiate from competition. Tailored to community requirements with focus on local, value, relevance, quality and total experience
Refocus – Agile management, data driven, decentralised to accelerate decision making and delivery
Enhance – Right offer driving footfall, dwell time and ultimately retailer sales, C&R income and shareholder returns
Redefine
community shopping centres
Reposition
assets and retail mix
Refocus
management team
Enhance
shareholder value
Capital & Regional AR2017.indd 4 10/04/2018 16:03:06

Net Rental Income
Adjusted Earnings per share1
Total dividend per share
EPRA NAV per share
Net debt to property value2
Adjusted Profit1
IFRS Profit/(Loss) for the period
Net Asset Value (NAV) per share
Group net debt2
ContentsHighlights
All metrics are for wholly-owned portfolio unless otherwise stated.
1. Adjusted Profit and Adjusted Earnings per share are as defined in the Glossary. Adjusted Profit incorporates profits from operating activities and excludes revaluation of properties and financial instruments, gains or losses on disposal, exceptional items and other defined terms. A reconciliation to the equivalent EPRA and statutory measures is provided in Note 9 to the financial statements.
2. December 2016 figures are proforma, adjusted for the refinancing of Mall assets completed on 4 January 2017, Ipswich disposal completed on 17 February 2017 and Ilford acquisition completed on 8 March 2017.
STRATEGIC REPORTOur Portfolio 02Chairman’s Statement 04The Retail Backdrop 06Our Strategy 08Our Business Model 10Pilot Projects 12Key Performance Indicators 14Chief Executive’s Statement 16Operating Review 18Financial Review 22Managing Risk 26Responsible Business 32
GOVERNANCEDirectors 36Corporate Governance Report 38Audit Committee Report 43Directors’ Remuneration Report 45 Policy 47 2017 Remuneration Report 54Directors’ Report 61Directors’ Responsibilities Statement 65Independent Auditor’s Report 66
FINANCIALSConsolidated Income Statement 74Consolidated Statement of Comprehensive Income 74
Consolidated Balance Sheet 75Consolidated Statement of Changes in Equity 76
Consolidated Cash Flow Statement 77Notes to the Financial Statements 78Glossary of Terms 116Five Year Review (Unaudited) 118Convenant Information (Unaudited) 119Wholly-Owned Assets Portfolio Information (Unaudited) 120EPRA Performance Measures (Unaudited) 121Advisers and Corporate Information 122
£51.6m
+£1.2m +2.4%
2017
2016 £50.4m
+0.28 +7.3%
4.10p2017
2016 3.82p
+0.25p +7.4%
3.64p2017
2016 3.39p
-1p -1.5%
67p2017
2016 68p
46%2017
2016 46%
+£2.3m +8.6%
£29.1m2017
2016 £26.8m
£22.4m2017
2016£(4.4m)
-1p -1.5%
67p2017
2016 68p
+5.9m +1.5%
£404.0m2017
2016 £398.1m
Heading Heading Heading
Table plain text Default Default DefaultBackground 1 2 3Border 1 2 3Border 1 2 3
For further information see capreg.com
Capital & Regional AR2017.indd 1 10/04/2018 16:03:09

OUR PORTFOLIO
Wholly-owned assets
The Mall, Blackburn• Leasehold covered shopping centre on three floors• 600,000 sq ft • 122 lettable unitsPrincipal occupiers:Primark,Debenhams, , ext, ilko,PureGym
The Mall, Luton• Leasehold covered shopping centre on two
floors, with over 65,000 sq ft of offices• 900,000 sq ft • 170 lettable unitsPrincipal occupiers: Primark, Debenhams, H&M, M&S, TK Maxx, Wilko
The Marlowes, Hemel Hempstead • Freehold covered shopping centre and high
street parades• 350,000 sq ft • 109 lettable unitsPrincipal occupiers: Wilko, New Look, Sports Direct, River Island
The Mall, Maidstone• Freehold covered shopping centre on three
floors with over 40,000 sq ft of offices• 500,000 sq ft • 107 lettable unitsPrincipal occupiers: TJ Hughes, Boots, Sports Direct, Wilko, Next, Iceland, Maidstone Borough Council
The Exchange, Ilford• Predominantly freehold covered shopping
centre on three floors• 300,000 sq ft • 79 lettable unitsPrincipal occupiers: Debenhams, Next, H&M, TK Maxx, M&S
The Mall, Walthamstow• Leasehold covered shopping centre on two floors• 260,000 sq ft • 69 lettable unitsPrincipal occupiers: TK Maxx, Sports Direct, Lidl, Asda, Boots, The Gym
The Mall, Wood Green• Freehold partially open shopping centre on two floors • 540,000 sq ft • 109 lettable unitsPrincipal occupiers: Primark, Wilko, H&M, Boots, TK Maxx, Travelodge, Cineworld
Kingfisher Shopping Centre, Redditch• C&R owns 20% in JV with Oaktree Capital
Management• Freehold covered shopping centre on two
principal trading levels• 900,000 sq ft • 174 lettable unitsPrincipal occupiers: Vue Cinema, H&M, The Range, Primark, Next, Debenhams, TK Maxx
• 100% subsidiary• Largest indoor ski slope operator in the UK• Operating at Milton Keynes, Castleford and a
dry indoor slope in Basingstoke• In existence since 2000 and has taught over
2 million people to ski or snowboard
Joint venture assets Snozone Leisure business
Capital & Regional plc Annual Report and Accounts for the year ended 30 December 2017
Stock Code: CALStock Code: CAL capreg.com
02
Capital & Regional AR2017.indd 2 10/04/2018 16:03:17
Blackburn
JV Assets
Wholly Owned Assets
Key to Map
Redditch
Hemel Hempstead
Luton
Wood Green
Walthamstow
IlfordMaidstone
OUR PORTFOLIO
The Exchange, Ilford• Predominantly freehold covered shopping
centre on three floors• 300,000 sq ft • 79 lettable unitsPrincipal occupiers: Debenhams, Next, H&M, TK Maxx, M&S
The Mall, Walthamstow• Leasehold covered shopping centre on two floors• 260,000 sq ft • 69 lettable unitsPrincipal occupiers: TK Maxx, Sports Direct, Lidl, Asda, Boots, The Gym
Key Characteristics about Our Malls
High Footfall -78m Shopper visits per year
Scale and dominance of retail offer
Strong and improving demographics
London/ South-East bias
Convenience – town centre locations
Extensive accretive asset management opportunities(including leisure, residential and office)
Affordable rents - Average rent c. £15 psf - Occupancy Cost Ratio of c. 12.6%
Snozone Leisure business
03
Stock Code: CAL capreg.comcapreg.com
STRATEGIC REPORT
Capital & Regional AR2017.indd 3 10/04/2018 16:03:18

CHAIRMAN’S STATEMENT
Hugh Scott-BarrettChairman
“ C&R is reporting another strong set of results with Adjusted Profit, which reflects the underlying performance of the business, increasing by 8.6% to £29.1 million.”
C&R is reporting another strong set of results. Adjusted profit, which reflects the underlying performance of the business, has risen by 8.6% from £26.8 million to £29.1 million. Given the very challenging retail environment we have seen for much of the year, this result is an endorsement of the resilience of the existing portfolio together with the impact of key asset management initiatives at Walthamstow and Wood Green, in particular, which positively impacted income in 2017. Profit for the period, at £22.4 million, compares with a loss in 2016 of £4.4 million which reflected a revaluation loss and an £11 million charge in relation to implementing the new debt structure.
Both Net Asset Value per share and EPRA Net Asset Value per share of 67 pence compare with 68 pence as at 30 December 2016. This modest decline reflects the strong performance of our assets based in and around London offset by some yield expansion in those outside of the Greater London area.
StrategyThe appointment of a new Chief Executive has afforded the opportunity for a root and branch review of strategy. Lawrence Hutchings has provided the Board with recommendations on how this should evolve and on how execution can be enhanced in light of the fast changing and challenging retail landscape. This has been debated extensively and endorsed by the Board. The management team subsequently communicated the strategy to investors in December 2017.
C&R is well placed to benefit from increasing polarisation within the shopping centre market which is driving consumers to separate visits to premium destinations for their “wants”, and to convenient local venues, which focus on their regular value and essential non-discretionary spending, for their “needs”. The Group’s community malls have benefitted from the rebasing of rents since the global financial crisis. This makes them appealing to retailers, who can generate a high proportion of their profits from this segment due to the attractive dynamic between rental levels and sales performance. To be successful, community malls still need to deliver a quality product tailored to the needs of the individual communities that they serve. Furthermore, creativity and investment are required to deliver a superior experience as the occupier mix continues to evolve, to further
reflect categories which perform best in physical stores in an increasingly omnichannel environment. C&R’s management platform remains a source of real differentiation given the ever more critical need for intensive management of these community malls to continually renew, adapt and implement changes. The success of pilot projects in Ilford and Maidstone demonstrates how responsive consumers can be to this approach and the disproportionately large impact even quite minor changes can have.
Responsible BusinessWe continued our record of year-on-year energy improvements reducing our total consumption by more than 10% in 2017. Our expertise not only helps to reduce our environmental impact but also helps us lower our own costs and maintain a very competitive service charge for our retailer customers.
We have also stepped up the training of our operational teams to ensure that they remain as prepared as possible for any potential threat. Our “go to critical plans” were successfully implemented for periods during the year in response to national security concerns, with our centre teams working closely with local emergency services.
The award of an 11th consecutive Royal Society for the Prevention of Accidents (“ROSPA”) Gold award again underlines our focus on health and occupational safety standards across our shopping centres.
Community engagement remains at the heart of our business and our commitment was demonstrated through a number of initiatives during the year, including the launch of a new dedicated community hub at Maidstone as part of the pilot project.
DividendThe Board is recommending a final dividend of 1.91 pence per share taking the full year dividend to 3.64 pence per share. This represents an increase of 7.4% over the 2016 full year dividend of 3.39 pence per share, in line with previous guidance. The dividend is comfortably covered by underlying earnings with a pay-out ratio of 88.8% compared to 88.7% in 2016. Our strategic asset management masterplans, now implemented across our portfolio following our successes at Ilford and Maidstone, underpin our objective of delivering annual dividend growth in a range of 5–8% over the medium term.
PeopleI would like to thank all our staff for their hard work during what has been an exciting but challenging year for the business while managing the evolution in strategy. I would also like to congratulate the Snozone team who were awarded the Best Sporting Venue at the UK School Travel awards, beating Manchester United’s museum and stadium tours, Twickenham Stadium, Wimbledon Lawn Tennis Association and the National Football Museum to this prestigious award.
Capital & Regional plc Annual Report and Accounts for the year ended 30 December 2017
Stock Code: CALStock Code: CAL capreg.com
04
Capital & Regional AR2017.indd 4 10/04/2018 16:03:22

reflect categories which perform best in physical stores in an increasingly omnichannel environment. C&R’s management platform remains a source of real differentiation given the ever more critical need for intensive management of these community malls to continually renew, adapt and implement changes. The success of pilot projects in Ilford and Maidstone demonstrates how responsive consumers can be to this approach and the disproportionately large impact even quite minor changes can have.
Responsible BusinessWe continued our record of year-on-year energy improvements reducing our total consumption by more than 10% in 2017. Our expertise not only helps to reduce our environmental impact but also helps us lower our own costs and maintain a very competitive service charge for our retailer customers.
We have also stepped up the training of our operational teams to ensure that they remain as prepared as possible for any potential threat. Our “go to critical plans” were successfully implemented for periods during the year in response to national security concerns, with our centre teams working closely with local emergency services.
The award of an 11th consecutive Royal Society for the Prevention of Accidents (“ROSPA”) Gold award again underlines our focus on health and occupational safety standards across our shopping centres.
Community engagement remains at the heart of our business and our commitment was demonstrated through a number of initiatives during the year, including the launch of a new dedicated community hub at Maidstone as part of the pilot project.
DividendThe Board is recommending a final dividend of 1.91 pence per share taking the full year dividend to 3.64 pence per share. This represents an increase of 7.4% over the 2016 full year dividend of 3.39 pence per share, in line with previous guidance. The dividend is comfortably covered by underlying earnings with a pay-out ratio of 88.8% compared to 88.7% in 2016. Our strategic asset management masterplans, now implemented across our portfolio following our successes at Ilford and Maidstone, underpin our objective of delivering annual dividend growth in a range of 5–8% over the medium term.
PeopleI would like to thank all our staff for their hard work during what has been an exciting but challenging year for the business while managing the evolution in strategy. I would also like to congratulate the Snozone team who were awarded the Best Sporting Venue at the UK School Travel awards, beating Manchester United’s museum and stadium tours, Twickenham Stadium, Wimbledon Lawn Tennis Association and the National Football Museum to this prestigious award.
BoardThere have been a number of changes in the composition of the Board during the year, reflecting the significant amount of time the Board had devoted in the previous 12 months to ensuring a successful senior management succession plan was in place. John Clare stepped down as chairman on 13 June 2017 after seven years on the Board. John played a key role in leading C&R through a series of changes that were transformational for the Group’s prospects. Ken Ford stepped down as an Executive Director on 9 May 2017 and left the Group on 31 December 2017 after over 20 years of committed service. Ken was one of the architects of C&R and the Group’s position as a leading owner of community shopping centres. I would like to thank both John and Ken on behalf of the Board for their contribution over many years.
We were very pleased to welcome Lawrence Hutchings to the Board as Chief Executive on 13 June 2017. Lawrence brings extensive retail property expertise from his time at Hammerson and, more recently, Blackstone in Australia. He has quickly made a very positive impact in terms of the repositioning of the business, facilitating in the process my transition to Non-executive Chairman.
Hugh Scott-BarrettChairman
05
Stock Code: CAL capreg.comcapreg.com
STRATEGIC REPORT
Capital & Regional AR2017.indd 5 10/04/2018 16:03:27

THE RETAIL BACKDROP
Polarisation of the retail sectorPolarisation is a structural trend affecting many industries. In retail this is reflected in consumers separating their visits between premium destinations for their “wants”, and to convenient local venues, which focus on their regular value and essential non-discretionary spending, for their “needs”.
The critical role of Community shopping centresOur “Community” shopping centres, which are positioned in highly convenient and accessible locations and characterised by a high conversion and frequency of visits, are focused on this “needs” based end of the spectrum.
The following graph highlights the critical role played by Community centres for occupiers as their mix of affordable occupancy costs (illustrated by Zone A rents) and high footfall traffic driving sales enable them to act as the engine room for retailers’ profits.
Functional(366 assets)
Neighbourhood(888 assets)
Community(254 assets)
Community Plus(226 assets)
Regional Mall(33 assets)
Major Mall(18 assets)
Uber Centre(7 assets)
Smallerconveniencedestinations
Largerdestination
venues
350
300
250
200
150
100
50
Mall
Hea
dlin
e Zo
ne A
ren
t (£/
psf)
Centre
Headline Zone A rent (£/psf)
SHOPSCORE sales productivity index
Mall Centre Mall Centre RetailPark
Outlet
0
FunctionalNeighbourhoodCommunityCommunityPlus
Regional MallMajor MallUber Centre
Source: Javelin Group/SHOPSCORE
Source: Javelin Group/SHOPSCORE
Squeezedmiddle
Squeezedmiddle
NEEDS
WANTS
Capital & Regional plc Annual Report and Accounts for the year ended 30 December 2017
Stock Code: CAL capreg.com
06
Capital & Regional AR2017.indd 6 10/04/2018 16:03:27

capreg.com
Capital & Regional AR2017.indd 7 10/04/2018 16:03:28

OUR STRATEGY
Redefine Our objective is to redefine and own the community shopping centre category in the UK consistent with global best practice. We define and assess our community shopping centre offer across three key aspects:
• Physical attributes – including the location, size and dominance of the centre and its accessibility in terms of local transport links and parking provision
• Products and services – including the retail mix, the provision of grocery, leisure and services offerings and the quality of facilities• Differentiation – being the ways in which a centre stands out as more than just a retail destination including the strength of
community links, how well tailored the offer is to the locality, how it contributes and measures on sustainability and in being a local employer of choice.
RepositionCentral to our strategy is repositioning our centres. We believe retailers and communities are clear in their expectations for what they want to see from their Community Centres with a strong mix of everyday essentials including:
• Grocery, pharmacy and general merchandise;• Catering options covering express food, great coffee and
casual dining;• Personal services including health, beauty, dry cleaners,
shoe repairs; and• Everyday value fashion, leisure and children’s wear.
All need to be tailored to the specific community’s needs and aspirations.
This needs to be supported with exceptional centre services, for example parents’ parking, change facilities and kids’ play. We are competing for our guests’ time against other physical destinations and online options so making the experience as convenient and pleasurable as possible is critical. We believe when we get this proposition right, when it is highly relevant to the community, then we drive footfall and dwell time, which drives retailers’ sales.
RefocusWe have refocused our business and resources with a revised business structure that puts our centres at the heart of what we do facilitating accelerated responsiveness and optimal decision making.
Enhance As has been evidenced from our Pilot Projects (see Case Studies) the right offer drives footfall and dwell time, boosting retailer sales and ultimately letting tension, improving rental income, property values and consequently, C&R revenue and shareholder returns.
Department Stores
Fashion
Casual Dining
Express Food
Leisure
Fresh Food
Supermarkets
Health & Beauty
Non-Retail
Variety Stores
Services (Personal)
Services (Professional)
Footwear
Home & Gifts
Illustrative tenant mix for Community Shopping Centres
General Managers
Investment
Guest Experience
Asset Portfolio
Development
Finance
OUR PEOPLERebecca is entering her sixth year working at The Mall, Walthamstow having previously held senior retail positions for Toys R Us, Gap and Specsavers. Whilst holding the role of local Marketing Manager Rebecca attended the prestigious Oxford Summer School and on her return a succession plan was implemented. This has supported her ambitions of progression within C&R, culminating in her recent promotion to General Manager. Rebecca is a Walthamstow resident and is embedded in the town’s vibrant and rapidly evolving community, priding herself on her local connections and positioning the centre as a key community hub.
Rebecca BirdGeneral Manager, The Mall, Walthamstow
Proposition Relevance Footfall & dwell Sales Income
Redefinecommunity shopping centres
Repositionassets and retail mix
Refocusmanagement team
Enhanceshareholder value
Capital & Regional plc Annual Report and Accounts for the year ended 30 December 2017
Stock Code: CAL capreg.com
08
Capital & Regional AR2017.indd 8 10/04/2018 16:03:28

OUR PEOPLERebecca is entering her sixth year working at The Mall, Walthamstow having previously held senior retail positions for Toys R Us, Gap and Specsavers. Whilst holding the role of local Marketing Manager Rebecca attended the prestigious Oxford Summer School and on her return a succession plan was implemented. This has supported her ambitions of progression within C&R, culminating in her recent promotion to General Manager. Rebecca is a Walthamstow resident and is embedded in the town’s vibrant and rapidly evolving community, priding herself on her local connections and positioning the centre as a key community hub.
Rebecca BirdGeneral Manager, The Mall, Walthamstow
capreg.com
Capital & Regional AR2017.indd 9 10/04/2018 16:03:28

OUR BUSINESS MODEL
RELATIONSHIPS AND RESOURCES
REPOSITION & REMERCHANDISE
IDENTIFY ASSETS
Expert Team
Strong Relationships with Retailers
Our Extensive Community Connections
OUR PEOPLEStewart has been with C&R for over 17 years. He is currently part of the team responsible for financial and management reporting but has previously worked in property management finance within the Group’s previous fund investments. As a qualified accountant with an MSc in Surveying, Stewart brings a strong mix of financial and property expertise. Stewart has a particular focus on analytics, providing and interpreting research to support the business in driving improved and accelerated data driven decision making.
Stewart McKellarFinancial Controller
Our core strength is acquiring, enhancing and managing community shopping centres. With our expert team, our strong retailer relationships and our extensive community connections, we seek to generate sustainableincome and capital value growth by combining active asset management with operational excellence.
There are a number of assets that meet our potential investment criteria. Typically these will be assets that are underperforming in their catchment but have significant asset management opportunities.
Wherever possible we will leverage our deep industry relationships to secure off-market transactions.
• Understand full catchment potential – research/benchmarking, input from Centre teams, engagement with retailers and local communities
• Assess product offering against local community needs and expectations – identify any gaps in offer or amenities
• Execution – engage specialist teams to ensure accelerated delivery with focus on optimal performance
• Establish strategic asset masterplans – comprehensive 3–5 year repositioning plans for each centre profiling Capex spend and evolution of tenant mix. Regularly reviewed in a continual process to ensure ongoing relevance and that assets continue to meet guests’ expectations as they evolve over time
• Review and refine – post implementation reviews to inform future decision making, respond quickly to changes
Our approach to managing centres is summarised as follows:
Improved guest experience
THE RESULT
Attractive retail and leisure environment
Increased footfall and spend
Driving Retailer sales, letting tension and Income and Capital Value Growth
Each asset is held in order to generate sustainable income growth supporting our progressive dividend policy. When asset masterplans have been successfully executed and
future returns are expected to become less accretive we actively seek opportunities to recycle capital to allow us to reinvest into assets with greater growth potential.
Capital & Regional plc Annual Report and Accounts for the year ended 30 December 2017
Stock Code: CAL capreg.com
10
Capital & Regional AR2017.indd 10 10/04/2018 16:03:30

OUR PEOPLEStewart has been with C&R for over 17 years. He is currently part of the team responsible for financial and management reporting but has previously worked in property management finance within the Group’s previous fund investments. As a qualified accountant with an MSc in Surveying, Stewart brings a strong mix of financial and property expertise. Stewart has a particular focus on analytics, providing and interpreting research to support the business in driving improved and accelerated data driven decision making.
Stewart McKellarFinancial Controller
There are a number of assets that meet our potential investment criteria. Typically these will be assets that are underperforming in their catchment but have significant asset management opportunities.
Wherever possible we will leverage our deep industry relationships to secure off-market transactions.
• Establish strategic asset masterplans – comprehensive 3–5 year repositioning plans for each centre profiling Capex spend and evolution of tenant mix. Regularly reviewed in a continual process to ensure ongoing relevance and that assets continue to meet guests’ expectations as they evolve over time
• Review and refine – post implementation reviews to inform future decision making, respond quickly to changes
capreg.com
Capital & Regional AR2017.indd 11 10/04/2018 16:03:31

PILOT PROJECTS
The Exchange, IlfordIn October 2017 we commenced a programme of improvements at the Exchange Ilford, designed to help position the centre to best serve the local community, and to raise standards throughout the scheme after we acquired it in March 2017. Works began with the internal refurbishment and a de-cluttering exercise, improving the environmental and operational standards across all areas including front and back of house.
Guest surveys, focus groups and mystery shopper research helped us identify what the local guests wanted from their shopping experience. Our data-driven approach was supported by consultation with our retailer customers and external data suppliers such as CACI to verify our approach. Research showed that the family shopper group were under provided for at the centre and represented a large growth potential. A spacious, free to use, kids’ play area was introduced which has proved to be hugely popular. Existing toilets and baby-change facilities have been refurbished while the creation of larger parent and child facilities is currently under way. A dedicated parents parking zone was created, giving direct access to the Kids’ Freeplay and family-focused lower shopping level and improving the overall guest journey and experience.
A host of other improvements were rapidly put in place including guest pause points which include new seating, mobile charge points and improved way finding throughout the centre, repositioned grab and go food offers, as well as extended opening hours which have been hugely popular. The work was supported by a focused marketing campaign designed to generate high reach within the local community using new digital channels.
The changes have had a dramatic effect, with Q4 year on year footfall growing by 5.5%, far outperforming the national average fall of 3.3%. This has continued into 2018 with footfall increasing by 7.7% for the first two months of the year. Guest Net Promotor Score, a key measure of customer satisfaction, grew by 63 points while mystery shopper scores improved from 76% to 92%.
The Mall, MaidstoneThe Mall, Maidstone was selected to be part of our strategic pilot programme in Q4 2017. Based on in-depth research and guest feedback, a host of changes and improvements were rapidly implemented, designed to add new facilities to better serve the local community, provide great entertainment and an improved shopping experience for our key target guest groups.
Works included the transformation of unused retail space to create a dedicated parent and child facility which has had a dramatic effect on guest satisfaction levels, generating one of the largest positive social media reactions we’ve seen. The family-focused improvements also included the installation of interactive game units and a large format “Selfie-zone” to provide theatre within the centre.
A new guest lounge and information point was created along with a “Community Hub” which provides free social space within the centre for local groups and organisations, giving them a platform within the community to increase their awareness of the services they offer.
Q4 footfall at Maidstone was up by +1.1% year on year, versus the national retail index which was down 3.3% for the same period. Guest satisfaction levels improved hugely as a result of the works with the Net Promotor Score increasing by 66 points and mystery shopper scores increasing from 84% to 98%.
Digital ConnectionsIn 2017, we expanded our use of digital thinking and explored new channels beyond our typical range of activity across our websites, social media channels, email communications and online advertising.
We trialled the concept of digital interactive spaces within our centres utilising Play9 and NexusEngage installations. This proved to be a successful method of turning empty retail space into interactive experiences for our guests. Play9 transformed previously void space in Luton and Maidstone into a fantastic interactive area for families, accumulating over 100,000 game plays in the first three months and catering to our shoppers visiting with children. With the NexusEngage units installed in Ilford and Maidstone, we received great feedback from our guests and saw an impressive 70,000+ plays with 45,000+ gifts/vouchers distributed which had a direct positive impact on our retail customers’ trade.
To complement our pilot activity at Maidstone and Ilford, we looked at new digital advertising channels – Weve and Blis – to localise our marketing efforts. Weve and Blis allowed us to connect with local members of our local community through SMS, MMS messages and display advertising through geographical targeting techniques. With footfall tracking analytics, we were then able to see if the audience we reached then visited the centre as a result. In a four week period, this activity resulted in more than 3.5 million impressions and approximately 8,000 additional shopper visits.
Head of Asset Development
Joe Swindells
Joe joined C&R in August 2017 and brings to the business expertise and experience in successfully leading significant development and asset management projects in retail, residential and commercial markets. Joe leads the development and project team responsible for delivery of the business’s capital expenditure across the portfolio and strategic development opportunities in line with the strategy to redefine and own the Community shopping centre category in the UK. Joe played a leading role in the Ilford pilot project and is looking forward to working on the further development of the family zone and enhancement of the rest of the scheme as part of the asset masterplan.
In Q4 of 2017 we initiated pilot projects to evidence our assertion that better meeting the local community’s needs will drive increased footfall.
Capital & Regional plc Annual Report and Accounts for the year ended 30 December 2017
Stock Code: CALStock Code: CAL capreg.com
12
Capital & Regional AR2017.indd 12 10/04/2018 16:03:34

The Mall, MaidstoneThe Mall, Maidstone was selected to be part of our strategic pilot programme in Q4 2017. Based on in-depth research and guest feedback, a host of changes and improvements were rapidly implemented, designed to add new facilities to better serve the local community, provide great entertainment and an improved shopping experience for our key target guest groups.
Works included the transformation of unused retail space to create a dedicated parent and child facility which has had a dramatic effect on guest satisfaction levels, generating one of the largest positive social media reactions we’ve seen. The family-focused improvements also included the installation of interactive game units and a large format “Selfie-zone” to provide theatre within the centre.
A new guest lounge and information point was created along with a “Community Hub” which provides free social space within the centre for local groups and organisations, giving them a platform within the community to increase their awareness of the services they offer.
Q4 footfall at Maidstone was up by +1.1% year on year, versus the national retail index which was down 3.3% for the same period. Guest satisfaction levels improved hugely as a result of the works with the Net Promotor Score increasing by 66 points and mystery shopper scores increasing from 84% to 98%.
Digital ConnectionsIn 2017, we expanded our use of digital thinking and explored new channels beyond our typical range of activity across our websites, social media channels, email communications and online advertising.
We trialled the concept of digital interactive spaces within our centres utilising Play9 and NexusEngage installations. This proved to be a successful method of turning empty retail space into interactive experiences for our guests. Play9 transformed previously void space in Luton and Maidstone into a fantastic interactive area for families, accumulating over 100,000 game plays in the first three months and catering to our shoppers visiting with children. With the NexusEngage units installed in Ilford and Maidstone, we received great feedback from our guests and saw an impressive 70,000+ plays with 45,000+ gifts/vouchers distributed which had a direct positive impact on our retail customers’ trade.
To complement our pilot activity at Maidstone and Ilford, we looked at new digital advertising channels – Weve and Blis – to localise our marketing efforts. Weve and Blis allowed us to connect with local members of our local community through SMS, MMS messages and display advertising through geographical targeting techniques. With footfall tracking analytics, we were then able to see if the audience we reached then visited the centre as a result. In a four week period, this activity resulted in more than 3.5 million impressions and approximately 8,000 additional shopper visits.
Retail Asset Manager
Digital Marketing Executive
Gareth Holland
Grace Azcarate
Gareth has been with C&R for over 12 years, having previously been a leasing consultant with a national agency working on shopping centres across the UK. He has the responsibility to drive specific asset management initiatives across three centres, including Maidstone, to implement the renewed focus on delivering community malls that serve theirlocalcatchmentandbeyond. Garethisexcitedabout the future and the drive to establish each mall as a local town hub and delivering a bespoke centre tailored to its community needs. It is apparent from the success of our pilot projects that our retail customers are already seeing the benefits of this approach.
With four years of digital marketing experience, Grace joined C&R in 2016 to oversee digital campaigns and initiatives across the portfolio. She is enthusiastic and eager to trial new technologies and advertising channels. To complement her background, she analyses customer and guest research to create a tailored digital experience for our local communities. Grace belongs to the Revo NextGen committee and is also an active member of the C&R Wellbeing Committee which is dedicated to promoting the health and wellness of staff through education, support and initiatives.
13
Stock Code: CAL capreg.comcapreg.com
STRATEGIC REPORT
Capital & Regional AR2017.indd 13 10/04/2018 16:03:44

KEY PERFORMANCE INDICATORS
KPI Why we use this as an indicator Performance How this links to our strategy Progress during the yearAdjusted Profit1 Adjusted Profit seeks to track the recurring
profits of the business which is the key driver for dividend payments.
£29.1m2017
2016 £26.8m
We target delivering underlying profits to support dividend per share growth of between 5% and 8% per annum in the medium-term.
An increase of 8.6% in Adjusted Profit or 7.3% on a per share basis reflected growth in Net Rental Income, lower interest costs following the refinancing of the Mall assets and a £1.0 million reduction in net central operating costs.
Adjusted Earnings1 per share4.1p2017
2016 3.8p
Dividend per share This is the cash return to be delivered to investors in respect of the year under review. 3.64p2017
2016 3.39p
We target delivering dividend per share growth of between 5% and 8% per annum in the medium-term.
3.64p represented an increase of 7.4% over 2016 and therefore at the top end of our target range. Over the last two years we have averaged 8% dividend growth per annum.
EPRA net assets per share This is a measure of the movement in the underlying value of assets and liabilities underpinning the value of a share.
67p2017
2016 68p
We aim to maximise the value of our assets. Our Capital expenditure investment programme is planned to deliver a capital return over and above the income enhancement.
EPRA NAV fell by 1p due to a small revaluation loss and the slightly higher number of shares in issue as a result of the Scrip dividend and vesting of the Company’s Long Term Incentive Plan.
Net debt to property value2 We aim to manage our balance sheet effectively with the appropriate level of gearing. 46%2017
2016 46%
Having the appropriate level of gearing is important to effectively manage our business through the property cycle. Our target range is 40%–50% with the objective of reducing to the lower end in the medium-term.
Net debt to property value remained stable at 46%.
Net Rental Income This is the key driver of Adjusted Profit.£51.6m2017
2016 £50.4m
We target delivering dividend per share growth of between 5% and 8% per annum in the medium-term.
The increase in Net Rental Income reflected underlying growth of 1.9% on the wholly-owned portfolio together with the Ilford acquisition and full year impact of Hemel Hempstead, net of Camberley, sold in 2016.
Footfall (wholly-owned) Footfall is an important measure of a centre’s popularity with customers. Occupiers use this measure as a key part of their decision-making process.
+0.1%C&R
Index -2.8%
Footfall performance provides an indication of the relevance and attractiveness of our centres, influencing occupier demand and future letting performance.
Footfall at the Group’s UK shopping centres significantly outperformed the national ShopperTrak index by 2.9%.
Occupancy (wholly-owned) We aim to optimise the occupancy of our centres as attracting and retaining the right mix of occupiers will enhance the trading environment.
97.3%2017
2016 95.4%
Occupancy has a direct impact on the profitability of our schemes and also influences footfall and occupier demand.
Strong letting activity during the year resulted in an improvement in occupancy to 97.3%.
Notes
1. Adjusted Profit and Adjusted Earnings per share are as defined in the Glossary and Note 1 to the Financial Statements. Adjusted Profit incorporates profits from operating activities and excludes revaluation of properties and financial instruments, gains or losses on disposal, exceptional items and other defined terms. A reconciliation to the equivalent EPRA and statutory measures is provided in Note 9 to the financial statements.
2. Net debt divided by property valuation. 2016 is adjusted for refinancing of Mall assets on 4 January 2017, Ipswich disposal on 17 February 2017 and Ilford acquisition on 8 March 2017.
Capital & Regional plc Annual Report and Accounts for the year ended 30 December 2017
Stock Code: CALStock Code: CAL capreg.com
14
Capital & Regional AR2017.indd 14 10/04/2018 16:03:47

KPI Why we use this as an indicator Performance How this links to our strategy Progress during the yearAdjusted Profit1 Adjusted Profit seeks to track the recurring
profits of the business which is the key driver for dividend payments.
£29.1m2017
2016 £26.8m
We target delivering underlying profits to support dividend per share growth of between 5% and 8% per annum in the medium-term.
An increase of 8.6% in Adjusted Profit or 7.3% on a per share basis reflected growth in Net Rental Income, lower interest costs following the refinancing of the Mall assets and a £1.0 million reduction in net central operating costs.
Adjusted Earnings1 per share4.1p2017
2016 3.8p
Dividend per share This is the cash return to be delivered to investors in respect of the year under review. 3.64p2017
2016 3.39p
We target delivering dividend per share growth of between 5% and 8% per annum in the medium-term.
3.64p represented an increase of 7.4% over 2016 and therefore at the top end of our target range. Over the last two years we have averaged 8% dividend growth per annum.
EPRA net assets per share This is a measure of the movement in the underlying value of assets and liabilities underpinning the value of a share.
67p2017
2016 68p
We aim to maximise the value of our assets. Our Capital expenditure investment programme is planned to deliver a capital return over and above the income enhancement.
EPRA NAV fell by 1p due to a small revaluation loss and the slightly higher number of shares in issue as a result of the Scrip dividend and vesting of the Company’s Long Term Incentive Plan.
Net debt to property value2 We aim to manage our balance sheet effectively with the appropriate level of gearing. 46%2017
2016 46%
Having the appropriate level of gearing is important to effectively manage our business through the property cycle. Our target range is 40%–50% with the objective of reducing to the lower end in the medium-term.
Net debt to property value remained stable at 46%.
Net Rental Income This is the key driver of Adjusted Profit.£51.6m2017
2016 £50.4m
We target delivering dividend per share growth of between 5% and 8% per annum in the medium-term.
The increase in Net Rental Income reflected underlying growth of 1.9% on the wholly-owned portfolio together with the Ilford acquisition and full year impact of Hemel Hempstead, net of Camberley, sold in 2016.
Footfall (wholly-owned) Footfall is an important measure of a centre’s popularity with customers. Occupiers use this measure as a key part of their decision-making process.
+0.1%C&R
Index -2.8%
Footfall performance provides an indication of the relevance and attractiveness of our centres, influencing occupier demand and future letting performance.
Footfall at the Group’s UK shopping centres significantly outperformed the national ShopperTrak index by 2.9%.
Occupancy (wholly-owned) We aim to optimise the occupancy of our centres as attracting and retaining the right mix of occupiers will enhance the trading environment.
97.3%2017
2016 95.4%
Occupancy has a direct impact on the profitability of our schemes and also influences footfall and occupier demand.
Strong letting activity during the year resulted in an improvement in occupancy to 97.3%.
Notes
1. Adjusted Profit and Adjusted Earnings per share are as defined in the Glossary and Note 1 to the Financial Statements. Adjusted Profit incorporates profits from operating activities and excludes revaluation of properties and financial instruments, gains or losses on disposal, exceptional items and other defined terms. A reconciliation to the equivalent EPRA and statutory measures is provided in Note 9 to the financial statements.
2. Net debt divided by property valuation. 2016 is adjusted for refinancing of Mall assets on 4 January 2017, Ipswich disposal on 17 February 2017 and Ilford acquisition on 8 March 2017.
15
Stock Code: CAL capreg.comcapreg.com
STRATEGIC REPORT
Capital & Regional AR2017.indd 15 10/04/2018 16:03:48

CHIEF EXECUTIVE’S STATEMENT
Lawrence HutchingsChief Executive
“While retailing continues to evolve and is undoubtedly facing cyclical and structural headwinds, we have full confidence that our repositioning programme and rebased affordable occupancy costs will continue to allow our retailer customers to trade profitably in high footfall locations that are the engine room for their profits.”
It is a pleasure to be writing this statement, my first as Chief Executive of C&R after taking up the role in June 2017. I would like to take this opportunity to thank our former CEO, Hugh Scott-Barrett, for all his support and guidance during my transition into the role. Hugh’s continued involvement as chairman is welcome from my perspective.
We have been busy delivering on our 2017 business plans, where we have seen strong momentum in income and leasing with our accretive Capex projects, and implementing our new strategy. This was launched successfully in December 2017 and is designed to ensure that we capitalise fully on the continued evolution in physical retailing.
We believe that our centres are well placed to take advantage of important and ongoing changes in how we live, work, socialise and access goods and services, be it through the physical, online or combined “omnichannel” platforms.
Our renewed focus on better tailoring and aligning our retail and services to the local communities which we serve, coupled with ensuring that our centres are easier and more pleasurable to access and visit, will deliver continued income growth through improved footfall, sales, tenant demand and rents.
The success of the pilot projects completed in Q4 last year reinforces our confidence in our ability to redefine the community shopping centre in the UK, through our asset management masterplans which are fundamental to our ability to continue delivering underlyingrecurringincomegrowth.
Income growth continues to deliver performanceNet rental income within the wholly-owned portfolio grew 2.4% from £50.4 million to £51.6 million, or 1.9% on a like-for-like basis. Delivery of our capital expenditure (“Capex”) programme, which includes unlocking the potential of the former BHS stores, saw the Group invest £17.5 million of Capex during the year which helped drive income growth, and included:
• Travelodge at Wood Green – £6.4 million total project spend (£4.2 million in 2017);
• Conversion of the former BHS unit at Walthamstow into units for Lidl, The Gym and further leisure and retail space – £4.3 million total project investment (£3.9 million in 2017); and
• A new Wilko store in Blackburn formed from the former BHS – £1.0 million total project spend, all of which was undertaken in the year under review.
With average rents currently at c. £15psf, we will see further growth in income as the repositioning Capex is deployed during 2018 and 2019 to improve the productivity of our floor space while maintaining the rental affordability that makes our centres so attractive to retailers. We continue to adopt a conservative approach in assessing the return from our Capex projects and in the majority of cases exclude any “halo” impact across other parts of the centres from the works. These often involve new anchor retailers and significant changes to customer proposition which further increase the appeal of the centres to their communities.
Cost management and operating efficienciesThis focus on income is supported by a renewed approach to cost management as announced at our half year results. We are targeting efficiency savings of at least £1.8 million from our central cost base by the end of 2018, representing a saving of approximately 20% of the total 2016 central overhead. Pleasingly we have delivered over 60% of these savings as of year end, with the balance in varying stages of realisation. We believe that there are further efficiencies in our overhead as the operational restructuring is implemented and with decentralisation empowering the centre teams.
Leasing demand supports our strategyLeasing activity has continued apace in 2017, with 79 new leases and renewals and 32 rent reviews together totalling £9.6 million in annual income, underlining demand for our centres from non-discretionary and value orientated retailers, service providers, hotels, cinemas, supermarkets and food catering. Importantly, our new leasing and renewals were completed at an average spread of 10.3%1 over previous passing rent and 8.4%1 over valuation ERVs. Occupancy improved to 97.3% from 95.4% at December 2016.
Asset recyclingWe remain committed to recycling where we believe that we have optimised the asset through active repositioning and are able to generate more accretive returns from either new acquisitions or additional capital investment in the rest of the portfolio.
As planned, the pace of asset recycling was slower in the second half of the year, after the successful sales of Camberley in late 2016 and the Buttermarket in Ipswich in February 2017. The proceeds of these sales supported the acquisition of The Marlowes, Hemel Hempstead in early 2016 andtheExchange,Ilfordin arch2017.
We believe that there will be increased potential for investment opportunities and that pricing may become more attractive to acquire assets as the importance of active, income driven, strategic, long-term management becomes more critical to the success of our type of assets. Our internal management structure and dedicated team of retail professionals provide us with a real competitive advantage, allowing us to unlock income growth from well-located community shopping centres that meet our criteria.
Balance sheet strengthThe Group continues to benefit from the balance sheet restructuring and refinancing undertaken in January 2017, which covers five of the Group’s seven wholly-owned centres, as well as the subsequent new debt facility for Ilford and the renewal of the Group’s Revolving Credit Facility. The
1. For lettings and renewals (excluding development deals) with a term of five years or longer and which did not include a turnover element.
Capital & Regional plc Annual Report and Accounts for the year ended 30 December 2017
Stock Code: CALStock Code: CAL capreg.com
16
Capital & Regional AR2017.indd 16 10/04/2018 16:03:50

CHIEF EXECUTIVE’S STATEMENT
• Conversion of the former BHS unit at Walthamstow into units for Lidl, The Gym and further leisure and retail space – £4.3 million total project investment (£3.9 million in 2017); and
• A new Wilko store in Blackburn formed from the former BHS – £1.0 million total project spend, all of which was undertaken in the year under review.
With average rents currently at c. £15psf, we will see further growth in income as the repositioning Capex is deployed during 2018 and 2019 to improve the productivity of our floor space while maintaining the rental affordability that makes our centres so attractive to retailers. We continue to adopt a conservative approach in assessing the return from our Capex projects and in the majority of cases exclude any “halo” impact across other parts of the centres from the works. These often involve new anchor retailers and significant changes to customer proposition which further increase the appeal of the centres to their communities.
Cost management and operating efficienciesThis focus on income is supported by a renewed approach to cost management as announced at our half year results. We are targeting efficiency savings of at least £1.8 million from our central cost base by the end of 2018, representing a saving of approximately 20% of the total 2016 central overhead. Pleasingly we have delivered over 60% of these savings as of year end, with the balance in varying stages of realisation. We believe that there are further efficiencies in our overhead as the operational restructuring is implemented and with decentralisation empowering the centre teams.
Leasing demand supports our strategyLeasing activity has continued apace in 2017, with 79 new leases and renewals and 32 rent reviews together totalling £9.6 million in annual income, underlining demand for our centres from non-discretionary and value orientated retailers, service providers, hotels, cinemas, supermarkets and food catering. Importantly, our new leasing and renewals were completed at an average spread of 10.3%1 over previous passing rent and 8.4%1 over valuation ERVs. Occupancy improved to 97.3% from 95.4% at December 2016.
Asset recyclingWe remain committed to recycling where we believe that we have optimised the asset through active repositioning and are able to generate more accretive returns from either new acquisitions or additional capital investment in the rest of the portfolio.
As planned, the pace of asset recycling was slower in the second half of the year, after the successful sales of Camberley in late 2016 and the Buttermarket in Ipswich in February 2017. The proceeds of these sales supported the acquisition of The Marlowes, Hemel Hempstead in early 2016 andtheExchange,Ilfordin arch2017.
We believe that there will be increased potential for investment opportunities and that pricing may become more attractive to acquire assets as the importance of active, income driven, strategic, long-term management becomes more critical to the success of our type of assets. Our internal management structure and dedicated team of retail professionals provide us with a real competitive advantage, allowing us to unlock income growth from well-located community shopping centres that meet our criteria.
Balance sheet strengthThe Group continues to benefit from the balance sheet restructuring and refinancing undertaken in January 2017, which covers five of the Group’s seven wholly-owned centres, as well as the subsequent new debt facility for Ilford and the renewal of the Group’s Revolving Credit Facility. The
Group’s all-in cost of debt is now just 3.25%, allowing us to benefit from historically low interest rates, which have subsequently increased. It also provides us with the stability of a 6.7 year term increasing to 7.3 if all options are exercised.
Our capital expenditure programme is unique amongst our peers in that it comprises a majority of smaller projects, which are often capable of being completed within a 12–18 month period. This provides us with maximum flexibility to dynamically manage the balance sheet to react quickly to changes in market conditions and to new opportunities.
OutlookWhile retailing continues to evolve and is undoubtedly facing cyclical and structural headwinds, we have full confidence that our repositioning programme and rebased affordable occupancy costs will continue to allowourretailercustomerstotradeprofitably in high footfall locations that are the engine room for their profits.
Our weighting to the London and Greater London economy, with its strong population growth and density, is creating demand from non-retail uses including residential, hotel and leisure with on flow benefits to our core retail business and customers. We are committed to maximising the value of the Group’s assets through strategic asset masterplans and delivering on behalf of our shareholders.
We are steadfast in our endeavours to improve the lives of the communities that we serve, through providing best in class environments for retail goods, leisure services, social interaction and facilitating click and collect fulfilment. In short we believe that the intersection of where product and services meet people remains very important.
The Board has announced a 7.4% increase in total dividend for 2017 and, while fully aware that recent occupier failures present some challenges to short-term results, believes that both the momentum we have carried through into 2018 and our strategic asset management masterplans, now established across our entire portfolio following the initial results seen at Ilford and Maidstone, underpin our objective of delivering annual dividend growth in a range of 5% to 8% over the medium term.
Finally, I would like to reinforce Hugh’s thanks and appreciation to all our staff both at the support office in London and in our centres. A significant amount has been achieved during the past nine months in delivering these results whilst creating and implementing our new strategy. These are the first exciting steps on our journey to be the best in class owner managers of community shopping centres.
Lawrence Hutchings Chief Executive
1. For lettings and renewals (excluding development deals) with a term of five years or longer and which did not include a turnover element.
17
Stock Code: CAL capreg.comcapreg.com
STRATEGIC REPORT
Capital & Regional AR2017.indd 17 10/04/2018 16:03:52

OPERATING REVIEW
The core strength and expertise of C&R lies in its ability to create and deliver specialist asset management improvements across its c.£1.0 billion portfolio of UK community shopping centres, which is underpinned by a strong London and South East bias. Key characteristics of our assets are their dominance in their locality, coupled with their ability to offer occupiers attractive, affordable and high footfall space which caters for the non-discretionary and value-orientated needs of the local community.
New lettings, renewals and rent reviewsThere were 79 new lettings and renewals in the period at a combined average premium of 10.3%1 to previous passing rent and an 8.4%1 premium to ERV.
Year ended 30 Dec
2017New LettingsNumber of new lettings 47Rent from new lettings (£m) £2.7mComparison to ERV1 (%) +8.7%Renewals settledRenewals settled 32Revised rent (£m) £1.7mComparison to ERV1 (%) +8.1%Combined new lettings and renewalsComparison to previous rent1 +10.3%Comparison to ERV1 +8.4%Rent reviewsReviews settled 32Revised passing rent (£m) £5.2mUplift to previous rent (%) +1.2%
1. For lettings and renewals (excluding development deals) with a term of five years or longer which do not include a turnover rent element.
Delivery of specialist asset management initiatives During 2017 we invested £17.5 million of capital expenditure. A number of major projects were concluded over the period including:
• At Wood Green, the new 78 bedroom Travelodge opened in October 2017 following a £6.4 million investment project with early trading very encouraging.
• At Walthamstow, Lidl and The Gym both launched successfully around the turn of 2018. Gökyüzü, a new Turkish restaurant for a local operator which has traded very successfully at our Wood Green centre for a number of years, opened in February 2018 and two further retail units totalling 5,000 sq ft have also been created. All of the above have been formed out of the former BHS store.
• At Blackburn, Wilko opened in September 2017 at the refurbished former BHS unit. Sports Direct also continues to trade from the unit, now via a direct lease.
The above units will deliver a combined annual rent of £1.6 million from a total Capex spend of approximately £12 million. 2018 NRI will benefit by approximately £0.8 million from the full year impact of these lettings.
In December 2017 we received a resolution to grant planning consent subject to satisfactory s106 agreement for the proposed extension at Walthamstow. Our plans include the addition of 80,000 sq ft of new retail and leisure space and approximately 500 new homes, as well as improved public spaces and community facilities. A development agreement is in place with the London Borough of Waltham Forest and we anticipate progressing to full planning consent in the first half of 2018.
In Hemel Hempstead we received planning consent in October 2017 for our transformational plans to create a leisure hub with up to six new restaurant units, anchored by a cinema for which terms have been agreed with a leading operator. Work is well advanced on renewing the atrium roof, the cost of which is being met by the previous owner.
Highlights of letting activity across the portfolio in 2017 include:
• At Walthamstow, lettings were made to Smiggle, Gökyüzü Turkish restaurant and Lidl, which opened very successfully just after the year end, in January 2018. At Wood Green, new lettings were completed to River Island, Blue Inc, Five Guys and Pak cosmetics, while Aldo and Superdrug renewed.
• At Blackburn, Specsavers took a new unit and River Island, Scotts, Superdrug, The Perfume Shop and Thorntons renewed. Genus and Superdrug took new leases at Maidstone and Card Factory signed a five year term at Ilford. At Luton, Kiko and Scotts opened new units from a split of the former USC unit, while KFC took a 10 year lease in the new food court and FootLocker renewed for a further five year term.
• The outperformance of new lettings and renewals versus ERV demonstrates the continued affordability and attractiveness of our schemes and this evidence will be supportive of rental tones in the future.
• Since 30 December 2017, the positive letting momentum has continued with 19 new lettings and renewals in the first two months of the year. This includes new lettings to Smiggle at Blackburn and 3G at Walthamstow, together with the leasing of four floors of a vacant office block in Luton, where £5 million of refurbishment expenditure will deliver an income return in excess of 9%.
Future Capex plansAs part of our strategic asset masterplans we have reviewed our planned Capex investment and assessed additional opportunities across our portfolio. In total we have identified more than 50 individual projects totalling over £100 million which we believe will deliver in aggregate an income return of at least 9%.
We expect to deploy Capex at a typical rate of approximately £15-25 million per annum. The depth of opportunities across the portfolio enables us to focus investment on those with the strongest impact and thereby provides flexibility, allowing us to responddynamically to any changes in occupier demand or further evolution of shopper dynamics. Key projects in 2018 include the new office letting at Luton, the leisure hub at Hemel Hempstead and further improvement of the family zone in Ilford.
Rental income and occupancy30 Dec
201730 Dec
2016
Contracted rent (£m) 64.1 55.8Passing rent (£m) 61.0 53.0Occupancy (%) 97.3 95.4
The increase in contracted and passing rent reflects the acquisition of the Exchange Centre, Ilford in March 2017 and like-for-likegrowth of 3.1% and 3.0% respectively. At 30 December 2017 there was £3.1 million of contracted rent where the tenant is in a rentfree period, of which £3.0 million will convert to passing rent in 2018. The strong letting activity during the year has resulted in an improvement in occupancy to 97.3% at the year end.
Insolvencies Year ended December
2017
Year ended December
20162
Insolvencies (units) 15 18Passing rent of insolvencies (£m) 0.7 2.4
2. Comparatives exclude the impact of The Mall, Camberley which was disposed of in November 2016.
The number of insolvencies in 2017 was similar to 2016, but the value was much reduced owing to the impact of BHS last year. Themost significant insolvency was Blue Inc, involving five units with a total rent of £0.3 million. As at 30 December 2017 five of the 15 units affected by insolvency had been re-let and eight were continuing to trade as usual.
To 8 March 2018 there were three national occupier insolvencies or restructurings that impact upon the portfolio since the yearend. Based on information available to date it is expected that their combined impact on 2018 Adjusted Profit will be approximately£0.7 million.
Operational performanceThere were 76 million visits to our centres during 20173.Forthesecondhalfof2017, oursevenwholly-ownedshoppingcentresachieved a 0.5%4 increase in footfall compared to a National Index figure of -2.9%. Footfall for the year as a whole increased by 0.1%4, again significantly ahead of the National Index which showed a decline of 2.8%.
In the second half of 2017, we undertook repositioning pilot projects at Maidstone and Ilford and these two assets recorded particularly strong performances, with Maidstone increasing by 2% in the fourth quarter of 2017, versus 2016, and Ilford increasing by 5.5%.
The positive momentum has continued into the start of 2018 with footfall for the wholly-owned portfolio up 3.1% in the two monthsto the end of February 2018, compared to the National Index which was -2.9%.
Car park usage has been stable and car park income was £10.2 million, an increase of 7.2% on a like-for-like basis. Our Collect+service continues to expand with in excess of 42,000 packages handled in the year, an increase of 24% year on year.
3. 78 million on an annualised basis allowing for a full 12 months of the Exchange Centre, Ilford.
4. Excluding entrances impacted by development work.
Capital & Regional plc Annual Report and Accounts for the year ended 30 December 2017
Stock Code: CALStock Code: CAL capreg.com
18
Capital & Regional AR2017.indd 18 10/04/2018 16:03:52

The core strength and expertise of C&R lies in its ability to create and deliver specialist asset management improvements across its c.£1.0 billion portfolio of UK community shopping centres, which is underpinned by a strong London and South East bias. Key characteristics of our assets are their dominance in their locality, coupled with their ability to offer occupiers attractive, affordable and high footfall space which caters for the non-discretionary and value-orientated needs of the local community.
New lettings, renewals and rent reviewsThere were 79 new lettings and renewals in the period at a combined average premium of 10.3%1 to previous passing rent and an 8.4%1 premium to ERV.
Year ended 30 Dec
2017New LettingsNumber of new lettings 47Rent from new lettings (£m) £2.7mComparison to ERV1 (%) +8.7%Renewals settledRenewals settled 32Revised rent (£m) £1.7mComparison to ERV1 (%) +8.1%Combined new lettings and renewalsComparison to previous rent1 +10.3%Comparison to ERV1 +8.4%Rent reviewsReviews settled 32Revised passing rent (£m) £5.2mUplift to previous rent (%) +1.2%
1. For lettings and renewals (excluding development deals) with a term of five years or longer which do not include a turnover rent element.
Delivery of specialist asset management initiatives During 2017 we invested £17.5 million of capital expenditure. A number of major projects were concluded over the period including:
• At Wood Green, the new 78 bedroom Travelodge opened in October 2017 following a £6.4 million investment project with early trading very encouraging.
• At Walthamstow, Lidl and The Gym both launched successfully around the turn of 2018. Gökyüzü, a new Turkish restaurant for a local operator which has traded very successfully at our Wood Green centre for a number of years, opened in February 2018 and two further retail units totalling 5,000 sq ft have also been created. All of the above have been formed out of the former BHS store.
• At Blackburn, Wilko opened in September 2017 at the refurbished former BHS unit. Sports Direct also continues to trade from the unit, now via a direct lease.
The above units will deliver a combined annual rent of £1.6 million from a total Capex spend of approximately £12 million. 2018 NRI will benefit by approximately £0.8 million from the full year impact of these lettings.
In December 2017 we received a resolution to grant planning consent subject to satisfactory s106 agreement for the proposed extension at Walthamstow. Our plans include the addition of 80,000 sq ft of new retail and leisure space and approximately 500 new homes, as well as improved public spaces and community facilities. A development agreement is in place with the London Borough of Waltham Forest and we anticipate progressing to full planning consent in the first half of 2018.
In Hemel Hempstead we received planning consent in October 2017 for our transformational plans to create a leisure hub with up to six new restaurant units, anchored by a cinema for which terms have been agreed with a leading operator. Work is well advanced on renewing the atrium roof, the cost of which is being met by the previous owner.
Future Capex plansAs part of our strategic asset masterplans we have reviewed our planned Capex investment and assessed additional opportunities across our portfolio. In total we have identified more than 50 individual projects totalling over £100 million which we believe will deliver in aggregate an income return of at least 9%.
We expect to deploy Capex at a typical rate of approximately £15-25 million per annum. The depth of opportunities across the portfolio enables us to focus investment on those with the strongest impact and thereby provides flexibility, allowing us to responddynamically to any changes in occupier demand or further evolution of shopper dynamics. Key projects in 2018 include the new office letting at Luton, the leisure hub at Hemel Hempstead and further improvement of the family zone in Ilford.
Rental income and occupancy30 Dec
201730 Dec
2016
Contracted rent (£m) 64.1 55.8Passing rent (£m) 61.0 53.0Occupancy (%) 97.3 95.4
The increase in contracted and passing rent reflects the acquisition of the Exchange Centre, Ilford in March 2017 and like-for-likegrowth of 3.1% and 3.0% respectively. At 30 December 2017 there was £3.1 million of contracted rent where the tenant is in a rentfree period, of which £3.0 million will convert to passing rent in 2018. The strong letting activity during the year has resulted in an improvement in occupancy to 97.3% at the year end.
Insolvencies Year ended December
2017
Year ended December
20162
Insolvencies (units) 15 18Passing rent of insolvencies (£m) 0.7 2.4
2. Comparatives exclude the impact of The Mall, Camberley which was disposed of in November 2016.
The number of insolvencies in 2017 was similar to 2016, but the value was much reduced owing to the impact of BHS last year. Themost significant insolvency was Blue Inc, involving five units with a total rent of £0.3 million. As at 30 December 2017 five of the 15 units affected by insolvency had been re-let and eight were continuing to trade as usual.
To 8 March 2018 there were three national occupier insolvencies or restructurings that impact upon the portfolio since the yearend. Based on information available to date it is expected that their combined impact on 2018 Adjusted Profit will be approximately£0.7 million.
Operational performanceThere were 76 million visits to our centres during 20173.Forthesecondhalfof2017, oursevenwholly-ownedshoppingcentresachieved a 0.5%4 increase in footfall compared to a National Index figure of -2.9%. Footfall for the year as a whole increased by 0.1%4, again significantly ahead of the National Index which showed a decline of 2.8%.
In the second half of 2017, we undertook repositioning pilot projects at Maidstone and Ilford and these two assets recorded particularly strong performances, with Maidstone increasing by 2% in the fourth quarter of 2017, versus 2016, and Ilford increasing by 5.5%.
The positive momentum has continued into the start of 2018 with footfall for the wholly-owned portfolio up 3.1% in the two monthsto the end of February 2018, compared to the National Index which was -2.9%.
Car park usage has been stable and car park income was £10.2 million, an increase of 7.2% on a like-for-like basis. Our Collect+service continues to expand with in excess of 42,000 packages handled in the year, an increase of 24% year on year.
3. 78 million on an annualised basis allowing for a full 12 months of the Exchange Centre, Ilford.
4. Excluding entrances impacted by development work.
19
Stock Code: CAL capreg.comcapreg.com
STRATEGIC REPORT
Capital & Regional AR2017.indd 19 10/04/2018 16:03:52

OUR PEOPLESarah started as General Manager of the Exchange Centre, Ilford in June 2017, having been appointed following the Group’s acquisition of the scheme in March 2017. The move represented a return to C&R having previously worked in marketing roles at Wood Green and then Romford, whilst in the Group’s ownership, and where Sarah joined from having been General Manager since being promoted from the Deputy Manager position in February 2013. Managing the Ilford pilot projects proved a challenging but hugely rewarding reintroduction to C&R and Sarah and her team are looking forward to further transforming the centre in 2018 with the roll-out of the asset masterplan.
Sarah deCourcy Rolls General Manager, the Exchange Centre, Ilford
OPERATING REVIEWCONTINUED
The Kingfisher Centre, Redditch (C&R ownership 20%, net investment of £7.4 million at 30 December 2017) The Range successfully opened in July 2017 in the former BHS unit. Other significant lettings during the year included Smiggle, HMV and Trespass, although the scheme was impacted by the insolvency of Linens Direct as well as the closure of Argos. The property was valued at £142.9 million at 30 December 2017, reflecting a net initial yield of 6.75%.
SnozoneSnozone enjoyed another strong trading year with revenue increasing 2% to £10.4 million (2016: £10.2 million) and profit up 10% to just over £1.5 million (2016: £1.4 million).
During 2017 Snozone won Best Sporting Venue at the UK School Travel awards, beating Manchester United’s museum and stadium tours, Twickenham Stadium, Wimbledon Lawn Tennis Association and the National Football Museum to this prestigious award.
In September 2017, Snozone purchased the former “Skiplex” business at Basingstoke for less than £0.1 million, comprising two indoor slopes inside the iFLY indoor skydiving centre. Rebranded as “Skizone” this gives Snozone a foothold south of the M25 from which to grow its data base and auxiliary revenue, as well as creating a hub from which to open similar sized businesses across the south, should opportunities present themselves.
Other assets and operations
Capital & Regional plc Annual Report and Accounts for the year ended 30 December 2017
Stock Code: CAL capreg.com
20
Capital & Regional AR2017.indd 20 10/04/2018 16:03:57

OUR PEOPLESarah started as General Manager of the Exchange Centre, Ilford in June 2017, having been appointed following the Group’s acquisition of the scheme in March 2017. The move represented a return to C&R having previously worked in marketing roles at Wood Green and then Romford, whilst in the Group’s ownership, and where Sarah joined from having been General Manager since being promoted from the Deputy Manager position in February 2013. Managing the Ilford pilot projects proved a challenging but hugely rewarding reintroduction to C&R and Sarah and her team are looking forward to further transforming the centre in 2018 with the roll-out of the asset masterplan.
Sarah deCourcy Rolls General Manager, the Exchange Centre, Ilford
SnozoneSnozone enjoyed another strong trading year with revenue increasing 2% to £10.4 million (2016: £10.2 million) and profit up 10% to just over £1.5 million (2016: £1.4 million).
During 2017 Snozone won Best Sporting Venue at the UK School Travel awards, beating Manchester United’s museum and stadium tours, Twickenham Stadium, Wimbledon Lawn Tennis Association and the National Football Museum to this prestigious award.
In September 2017, Snozone purchased the former “Skiplex” business at Basingstoke for less than £0.1 million, comprising two indoor slopes inside the iFLY indoor skydiving centre. Rebranded as “Skizone” this gives Snozone a foothold south of the M25 from which to grow its data base and auxiliary revenue, as well as creating a hub from which to open similar sized businesses across the south, should opportunities present themselves.
capreg.com
Capital & Regional AR2017.indd 21 10/04/2018 16:03:58
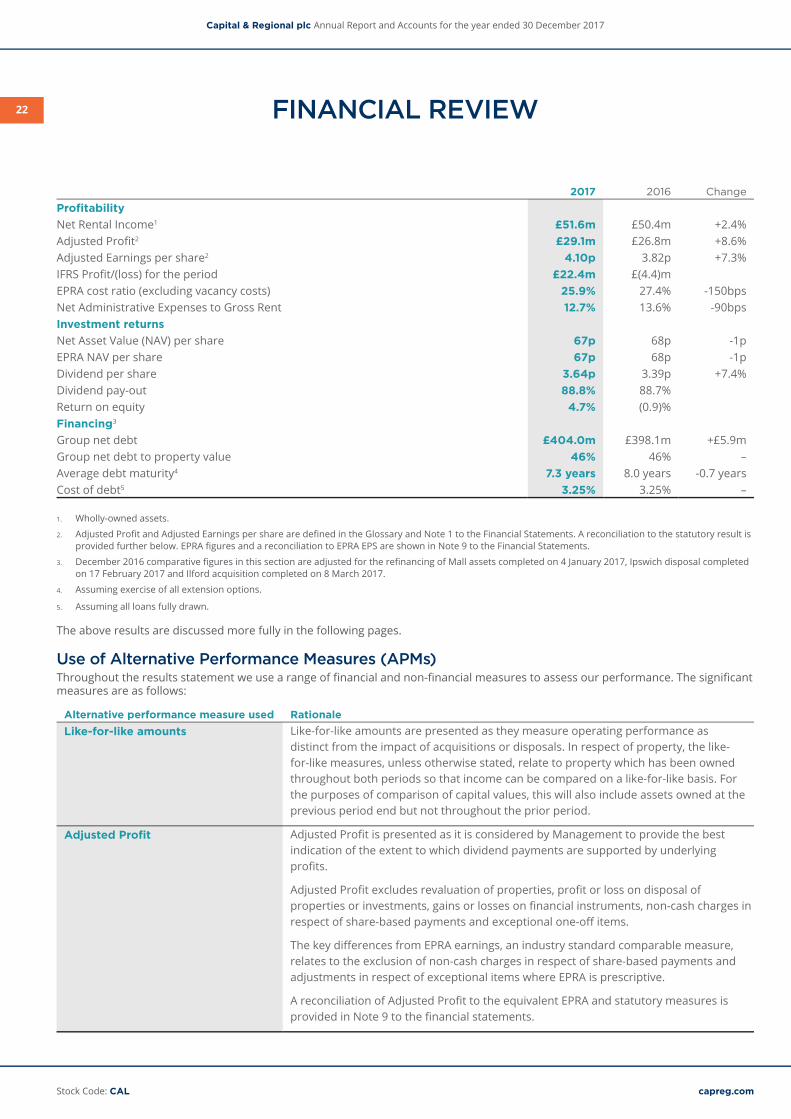
FINANCIAL REVIEW
2017 2016 Change
ProfitabilityNet Rental Income1 £51.6m £50.4m +2.4%Adjusted Profit2 £29.1m £26.8m +8.6%Adjusted Earnings per share2 4.10p 3.82p +7.3%IFRS Profit/(loss) for the period £22.4m £(4.4)mEPRA cost ratio (excluding vacancy costs) 25.9% 27.4% -150bpsNet Administrative Expenses to Gross Rent 12.7% 13.6% -90bpsInvestment returnsNet Asset Value (NAV) per share 67p 68p -1pEPRA NAV per share 67p 68p -1pDividend per share 3.64p 3.39p +7.4%Dividend pay-out 88.8% 88.7%Return on equity 4.7% (0.9)%Financing3
Group net debt £404.0m £398.1m +£5.9mGroup net debt to property value 46% 46% –Average debt maturity4 7.3 years 8.0 years -0.7 yearsCost of debt5 3.25% 3.25% –
1. Wholly-owned assets.
2. Adjusted Profit and Adjusted Earnings per share are defined in the Glossary and Note 1 to the Financial Statements. A reconciliation to the statutory result is provided further below. EPRA figures and a reconciliation to EPRA EPS are shown in Note 9 to the Financial Statements.
3. December 2016 comparative figures in this section are adjusted for the refinancing of Mall assets completed on 4 January 2017, Ipswich disposal completed on 17 February 2017 and Ilford acquisition completed on 8 March 2017.
4. Assuming exercise of all extension options.
5. Assuming all loans fully drawn.
The above results are discussed more fully in the following pages.
Use of Alternative Performance Measures (APMs)Throughout the results statement we use a range of financial and non-financial measures to assess our performance. The significantmeasures are as follows:
Alternative performance measure used RationaleLike-for-like amounts Like-for-like amounts are presented as they measure operating performance as
distinct from the impact of acquisitions or disposals. In respect of property, the like-for-like measures, unless otherwise stated, relate to property which has been owned throughout both periods so that income can be compared on a like-for-like basis. For the purposes of comparison of capital values, this will also include assets owned at the previous period end but not throughout the prior period.
Adjusted Profit Adjusted Profit is presented as it is considered by Management to provide the best indication of the extent to which dividend payments are supported by underlying profits.
Adjusted Profit excludes revaluation of properties, profit or loss on disposal of properties or investments, gains or losses on financial instruments, non-cash charges in respect of share-based payments and exceptional one-off items.
The key differences from EPRA earnings, an industry standard comparable measure, relates to the exclusion of non-cash charges in respect of share-based payments and adjustments in respect of exceptional items where EPRA is prescriptive.
A reconciliation of Adjusted Profit to the equivalent EPRA and statutory measures is provided in Note 9 to the financial statements.
ProfitabilityComponents of Adjusted Profit and reconciliation to IFRS Profit
Amounts in £mYear to
30 December 2017Year to
30 December 2016
Net rental income holly-ownedassets 51.6 50.4 ingfisher,Redditch1 1.6 1.7 Buttermarket,Ipswich2 – 0.5
53.2 52.6Net interest (19.6) (20.3)Snozone profit (indoor ski operation) 1.5 1.4Central operating costs net of external fees (5.9) (6.9)Tax charge (0.1) –Adjusted Profit 29.1 26.8Adjusted Earnings per share (pence)3 4.10p 3.82pReconciliation of Adjusted Profit to statutory resultAdjusted Profit 29.1 26.8Property revaluation (including Deferred Tax) (6.3) (14.5)Loss on disposals – (2.6)Gain/(Loss) on financial instruments 1.1 (2.5)Refinancing costs (0.5) (11.0)Other items4 (1.0) (0.6)IFRS Profit/(loss) for the period 22.4 (4.4)
1. See note 14d to the Financial Statements.
2. See note 14e to the Financial Statements.
3. EPRA figures and a reconciliation to EPRA EPS are shown in Note 9 to the Financial Statements.
4. Includes £0.9 million for the non-cash accounting charge in respect of share-based payments (2016: £0.5 million).
Adjusted Profit and Adjusted Earnings per share showed strong increases of 8.6% and 7.3% respectively, reflecting growth in NRI(see breakdown below), lower interest costs following the refinancing of the Mall assets and a £1.0 million reduction in net centraloperating costs, reflecting the benefit of completed and ongoing cost initiatives. Gross central costs fell from £9.6 million in 2016 to £8.4 million in 2017, a reduction of £1.2 million. A further reduction of at least a further £0.6 million of costs per annum is targeted for 2018.
Wholly-owned assets Net rental income
Amounts in £m
Year to 30 Dec
2017
Year to 30 Dec
2016
Like-for-like (Blackburn, Luton, Maidstone, Walthamstow, Wood Green) 43.5 42.7 +1.9%Hemel Hempstead – acquired February/March 2016 3.7 3.5Camberley (sold November 2016) and other disposals – 4.2Ilford – acquired 8 March 2017 4.4 –Net rental income (NRI) 51.6 50.4 +2.4%
Capital & Regional plc Annual Report and Accounts for the year ended 30 December 2017
Stock Code: CALStock Code: CAL capreg.com
22
Capital & Regional AR2017.indd 22 10/04/2018 16:03:58

2017 2016 Change
ProfitabilityNet Rental Income1 £51.6m £50.4m +2.4%Adjusted Profit2 £29.1m £26.8m +8.6%Adjusted Earnings per share2 4.10p 3.82p +7.3%IFRS Profit/(loss) for the period £22.4m £(4.4)mEPRA cost ratio (excluding vacancy costs) 25.9% 27.4% -150bpsNet Administrative Expenses to Gross Rent 12.7% 13.6% -90bpsInvestment returnsNet Asset Value (NAV) per share 67p 68p -1pEPRA NAV per share 67p 68p -1pDividend per share 3.64p 3.39p +7.4%Dividend pay-out 88.8% 88.7%Return on equity 4.7% (0.9)%Financing3
Group net debt £404.0m £398.1m +£5.9mGroup net debt to property value 46% 46% –Average debt maturity4 7.3 years 8.0 years -0.7 yearsCost of debt5 3.25% 3.25% –
1. Wholly-owned assets.
2. Adjusted Profit and Adjusted Earnings per share are defined in the Glossary and Note 1 to the Financial Statements. A reconciliation to the statutory result is provided further below. EPRA figures and a reconciliation to EPRA EPS are shown in Note 9 to the Financial Statements.
3. December 2016 comparative figures in this section are adjusted for the refinancing of Mall assets completed on 4 January 2017, Ipswich disposal completed on 17 February 2017 and Ilford acquisition completed on 8 March 2017.
4. Assuming exercise of all extension options.
5. Assuming all loans fully drawn.
The above results are discussed more fully in the following pages.
Use of Alternative Performance Measures (APMs)Throughout the results statement we use a range of financial and non-financial measures to assess our performance. The significantmeasures are as follows:
Alternative performance measure used RationaleLike-for-like amounts Like-for-like amounts are presented as they measure operating performance as
distinct from the impact of acquisitions or disposals. In respect of property, the like-for-like measures, unless otherwise stated, relate to property which has been owned throughout both periods so that income can be compared on a like-for-like basis. For the purposes of comparison of capital values, this will also include assets owned at the previous period end but not throughout the prior period.
Adjusted Profit Adjusted Profit is presented as it is considered by Management to provide the best indication of the extent to which dividend payments are supported by underlying profits.
Adjusted Profit excludes revaluation of properties, profit or loss on disposal of properties or investments, gains or losses on financial instruments, non-cash charges in respect of share-based payments and exceptional one-off items.
The key differences from EPRA earnings, an industry standard comparable measure, relates to the exclusion of non-cash charges in respect of share-based payments and adjustments in respect of exceptional items where EPRA is prescriptive.
A reconciliation of Adjusted Profit to the equivalent EPRA and statutory measures is provided in Note 9 to the financial statements.
ProfitabilityComponents of Adjusted Profit and reconciliation to IFRS Profit
Amounts in £mYear to
30 December 2017Year to
30 December 2016
Net rental income holly-ownedassets 51.6 50.4 ingfisher,Redditch1 1.6 1.7 Buttermarket,Ipswich2 – 0.5
53.2 52.6Net interest (19.6) (20.3)Snozone profit (indoor ski operation) 1.5 1.4Central operating costs net of external fees (5.9) (6.9)Tax charge (0.1) –Adjusted Profit 29.1 26.8Adjusted Earnings per share (pence)3 4.10p 3.82pReconciliation of Adjusted Profit to statutory resultAdjusted Profit 29.1 26.8Property revaluation (including Deferred Tax) (6.3) (14.5)Loss on disposals – (2.6)Gain/(Loss) on financial instruments 1.1 (2.5)Refinancing costs (0.5) (11.0)Other items4 (1.0) (0.6)IFRS Profit/(loss) for the period 22.4 (4.4)
1. See note 14d to the Financial Statements.
2. See note 14e to the Financial Statements.
3. EPRA figures and a reconciliation to EPRA EPS are shown in Note 9 to the Financial Statements.
4. Includes £0.9 million for the non-cash accounting charge in respect of share-based payments (2016: £0.5 million).
Adjusted Profit and Adjusted Earnings per share showed strong increases of 8.6% and 7.3% respectively, reflecting growth in NRI(see breakdown below), lower interest costs following the refinancing of the Mall assets and a £1.0 million reduction in net centraloperating costs, reflecting the benefit of completed and ongoing cost initiatives. Gross central costs fell from £9.6 million in 2016 to £8.4 million in 2017, a reduction of £1.2 million. A further reduction of at least a further £0.6 million of costs per annum is targeted for 2018.
Wholly-owned assets Net rental income
Amounts in £m
Year to 30 Dec
2017
Year to 30 Dec
2016
Like-for-like (Blackburn, Luton, Maidstone, Walthamstow, Wood Green) 43.5 42.7 +1.9%Hemel Hempstead – acquired February/March 2016 3.7 3.5Camberley (sold November 2016) and other disposals – 4.2Ilford – acquired 8 March 2017 4.4 –Net rental income (NRI) 51.6 50.4 +2.4%
23
Stock Code: CAL capreg.comcapreg.com
STRATEGIC REPORT
Capital & Regional AR2017.indd 23 10/04/2018 16:03:58

FINANCIAL REVIEW CONTINUED
Net Asset ValueNAV at £481.4 million and EPRA NAV at £482.6 million increased marginally (December 2016: £477.6 million and £481.5 million respectively) with retained profit offsetting the small fall in valuations net of Capex (see below). On a per share basis Basic NAV and EPRA NAV fell by 1p to 67p due to a slightly higher number of shares in issue as a result of the Scrip dividend and vesting of theCompany’s Long Term Incentive Plan.
Property portfolio valuation
Property at independent valuation30 December 2017 30 December 2016
£m NIY % £m NIY %
Blackburn 121.3 6.65% 124.1 6.53%Hemel Hempstead 54.0 6.88% 54.6 7.07%Ilford 82.4 6.54% 78.01 6.70%1
Luton 214.0 6.35% 207.0 6.35%Maidstone 76.0 6.70% 80.0 6.78%Walthamstow 107.7 5.25% 103.3 5.25%Wood Green 231.2 5.25% 225.1 5.25%Wholly-owned portfolio 886.6 6.06% 872.1 6.08%
1. Ilford at acquisition price on 8 March 2017.
The valuation of the wholly-owned portfolio at 30 December 2017 was £886.6 million, reflecting a net initial yield of 6.06%.
This is marginally below the 30 December 2016 valuation of £794.1 million after allowing for capital expenditure in the period of£17.5 million and the £78.0 million acquisition of The Exchange Centre, Ilford in March 2017 (excluding acquisition costs of c.£1.0million). Yields on the Group’s London and South East assets proved resilient and were largely unchanged over the period, with thedecline in Maidstone reflecting the unlet BHS unit. Blackburn saw a small fall in valuation due to outward market yield shift partiallyoffset by an increase in valued income.
FinancingNet interest
Amounts in £m
Year to 30 Dec
2017
Year to 30 Dec
2016
Wholly-owned assets etInterestonloans 14.0 14.0 Amortisationofrefinancingcosts 1.0 1.4 otionalinterestchargeonheadleases2 3.4 3.6
18.4 19.0Kingfisher, Redditch (Group share) 0.9 0.8Buttermarket, Ipswich (Group share) – 0.1Central 0.3 0.4Net Group interest 19.6 20.3
2. Notional interest charge with offsetting opposite and materially equal credit within other property operating expenses.
The decrease in interest reflects the lower interest cost and amortisation charge following the refinancing of the Mall assets thatcompleted on 4 January 2017 and the acquisition of Ilford in March 2017.
Group debt
30 December 2017Debt1
£mCash2
£m
Net debt
£m
Loan to value3
%
Net debt to value3
%
Average interest
rate%
Fixed%
Duration to loan expiryYears
Duration with
extensionsYears
Four Mall assets 255.0 (8.4) 246.6 48% 46% 3.36 100 7.6 8.6Luton 107.5 (5.8) 101.7 50% 48% 3.14 100 6.0 6.0Hemel Hempstead 26.9 (1.1) 25.8 50% 48% 3.32 100 4.1 5.1Ilford 39.0 (2.4) 36.6 47% 44% 2.76 100 6.2 6.2Group RCF – (6.7) (6.7) – – 3.40 – 4.1 4.1On balance sheet debt 428.4 (24.4) 404.0 48% 46% 3.25 94 6.7 7.3
1. Excluding unamortised issue costs.2. Excluding cash beneficially owned by tenants. 3. Debt and net debt divided by investment property at valuation.
The refinancing activity completed in the early part of 2017 has delivered an attractive funding cost of 3.25% that is fixed andsecured over a weighted average 6.7 year maturity, extending to 7.3 years if all extensions are exercised. Our target range for net debt to property value remains 40%–50% with an intention to reduce it to the lower end of that range in the medium term.
CovenantsThe Group was compliant with its banking and debt covenants at 30 December 2017 and throughout the year. Further details are disclosed in the “covenant information” section on page 119.
South African secondary listingThe Company maintains a primary listing on the London Stock Exchange and a secondary listing on the Johannesburg Stock Exchange (JSE) in South Africa. At 30 December 2017, 60,477,452 of the Company’s shares were held on the JSE register representing8.4% of the total shares in issue.
DividendThe Board is proposing a final dividend of 1.91 pence per share, taking the full-year dividend to 3.64 pence per share, representinga 7.4% increase from 2016. The Board has reaffirmed its guidance that the Company will target year on year dividend growth in therange of 5% to 8% per annum over the medium term.
The key dates proposed in relation to the payment of the 2017 final dividend are:
• Confirmation of ZAR equivalent dividend and PID percentage 10 April 2018• Last day to trade on Johannesburg Stock Exchange (JSE) 17 April 2018• Shares trade ex-dividend on the JSE 18 April 2018• Shares trade ex-dividend on the London Stock Exchange (LSE) 19 April 2018• Record date for LSE and JSE 20 April 2018• Annual General Meeting 9 May 2018• Dividend payment date 16 May 2018
The amount to be paid as a PID will be confirmed in the announcement on 10 April 2018. If a Scrip dividend alternative is offered,subject to the requisite regulatory approvals, the deadline for submission of valid election forms will be 20 April 2018. South African shareholders are advised that the final dividend will be regarded as a foreign dividend. Further details relating to Withholding Tax for shareholders on the South African register will be provided within the announcement detailing the currency conversion rate on10 April 2018. Share certificates on the South African register may not be dematerialised or rematerialised between 18 April 2018and 20 April 2018, both dates inclusive. Transfers between the UK and South African registers may not take place between 10 April2018 and 20 April 2018, both dates inclusive.
Charles StaveleyGroup Finance Director
Capital & Regional plc Annual Report and Accounts for the year ended 30 December 2017
Stock Code: CALStock Code: CAL capreg.com
24
Capital & Regional AR2017.indd 24 10/04/2018 16:03:58

Net Asset ValueNAV at £481.4 million and EPRA NAV at £482.6 million increased marginally (December 2016: £477.6 million and £481.5 million respectively) with retained profit offsetting the small fall in valuations net of Capex (see below). On a per share basis Basic NAV and EPRA NAV fell by 1p to 67p due to a slightly higher number of shares in issue as a result of the Scrip dividend and vesting of theCompany’s Long Term Incentive Plan.
Property portfolio valuation
Property at independent valuation30 December 2017 30 December 2016
£m NIY % £m NIY %
Blackburn 121.3 6.65% 124.1 6.53%Hemel Hempstead 54.0 6.88% 54.6 7.07%Ilford 82.4 6.54% 78.01 6.70%1
Luton 214.0 6.35% 207.0 6.35%Maidstone 76.0 6.70% 80.0 6.78%Walthamstow 107.7 5.25% 103.3 5.25%Wood Green 231.2 5.25% 225.1 5.25%Wholly-owned portfolio 886.6 6.06% 872.1 6.08%
1. Ilford at acquisition price on 8 March 2017.
The valuation of the wholly-owned portfolio at 30 December 2017 was £886.6 million, reflecting a net initial yield of 6.06%.
This is marginally below the 30 December 2016 valuation of £794.1 million after allowing for capital expenditure in the period of£17.5 million and the £78.0 million acquisition of The Exchange Centre, Ilford in March 2017 (excluding acquisition costs of c.£1.0million). Yields on the Group’s London and South East assets proved resilient and were largely unchanged over the period, with thedecline in Maidstone reflecting the unlet BHS unit. Blackburn saw a small fall in valuation due to outward market yield shift partiallyoffset by an increase in valued income.
FinancingNet interest
Amounts in £m
Year to 30 Dec
2017
Year to 30 Dec
2016
Wholly-owned assets etInterestonloans 14.0 14.0 Amortisationofrefinancingcosts 1.0 1.4 otionalinterestchargeonheadleases2 3.4 3.6
18.4 19.0Kingfisher, Redditch (Group share) 0.9 0.8Buttermarket, Ipswich (Group share) – 0.1Central 0.3 0.4Net Group interest 19.6 20.3
2. Notional interest charge with offsetting opposite and materially equal credit within other property operating expenses.
The decrease in interest reflects the lower interest cost and amortisation charge following the refinancing of the Mall assets thatcompleted on 4 January 2017 and the acquisition of Ilford in March 2017.
Group debt
30 December 2017Debt1
£mCash2
£m
Net debt
£m
Loan to value3
%
Net debt to value3
%
Average interest
rate%
Fixed%
Duration to loan expiryYears
Duration with
extensionsYears
Four Mall assets 255.0 (8.4) 246.6 48% 46% 3.36 100 7.6 8.6Luton 107.5 (5.8) 101.7 50% 48% 3.14 100 6.0 6.0Hemel Hempstead 26.9 (1.1) 25.8 50% 48% 3.32 100 4.1 5.1Ilford 39.0 (2.4) 36.6 47% 44% 2.76 100 6.2 6.2Group RCF – (6.7) (6.7) – – 3.40 – 4.1 4.1On balance sheet debt 428.4 (24.4) 404.0 48% 46% 3.25 94 6.7 7.3
1. Excluding unamortised issue costs.2. Excluding cash beneficially owned by tenants. 3. Debt and net debt divided by investment property at valuation.
The refinancing activity completed in the early part of 2017 has delivered an attractive funding cost of 3.25% that is fixed andsecured over a weighted average 6.7 year maturity, extending to 7.3 years if all extensions are exercised. Our target range for net debt to property value remains 40%–50% with an intention to reduce it to the lower end of that range in the medium term.
CovenantsThe Group was compliant with its banking and debt covenants at 30 December 2017 and throughout the year. Further details are disclosed in the “covenant information” section on page 119.
South African secondary listingThe Company maintains a primary listing on the London Stock Exchange and a secondary listing on the Johannesburg Stock Exchange (JSE) in South Africa. At 30 December 2017, 60,477,452 of the Company’s shares were held on the JSE register representing8.4% of the total shares in issue.
DividendThe Board is proposing a final dividend of 1.91 pence per share, taking the full-year dividend to 3.64 pence per share, representinga 7.4% increase from 2016. The Board has reaffirmed its guidance that the Company will target year on year dividend growth in therange of 5% to 8% per annum over the medium term.
The key dates proposed in relation to the payment of the 2017 final dividend are:
• Confirmation of ZAR equivalent dividend and PID percentage 10 April 2018• Last day to trade on Johannesburg Stock Exchange (JSE) 17 April 2018• Shares trade ex-dividend on the JSE 18 April 2018• Shares trade ex-dividend on the London Stock Exchange (LSE) 19 April 2018• Record date for LSE and JSE 20 April 2018• Annual General Meeting 9 May 2018• Dividend payment date 16 May 2018
The amount to be paid as a PID will be confirmed in the announcement on 10 April 2018. If a Scrip dividend alternative is offered,subject to the requisite regulatory approvals, the deadline for submission of valid election forms will be 20 April 2018. South African shareholders are advised that the final dividend will be regarded as a foreign dividend. Further details relating to Withholding Tax for shareholders on the South African register will be provided within the announcement detailing the currency conversion rate on10 April 2018. Share certificates on the South African register may not be dematerialised or rematerialised between 18 April 2018and 20 April 2018, both dates inclusive. Transfers between the UK and South African registers may not take place between 10 April2018 and 20 April 2018, both dates inclusive.
Charles StaveleyGroup Finance Director
25
Stock Code: CAL capreg.comcapreg.com
STRATEGIC REPORT
Capital & Regional AR2017.indd 25 10/04/2018 16:03:58

MANAGING RISK
Risk management processThere are a number of risks and uncertainties which could have a material impact on the Group’s future performance and could cause results to differ significantly from expectations.
Ahead of every half year and year end the Group undertakes a comprehensive risk and controls review involving interviews with relevant management teams. The output of this process is an updated risk map and internal control matrix for each component of the business which is then aggregated into a Group risk map and matrix which is reviewed by executive management, the Audit Committee and the Board and forms the basis for the disclosures made below. This process clearly outlines the principal risks, considers their potential impact on the business, the likelihood of them occurring and the actions being taken to manage, and the individual(s) responsible for managing, those risks to the desired level.
This risk matrix is also used in performing our annual assessment of the material financial, operational and compliance controls that mitigate the key risks identified. Each control is assessed or tested for evidence of its effectiveness. The review concluded that all such material controls were operating effectively during 2017.
Principal risks at 30 December 2017Following the risk reviews carried out at 30 June 2017 and 30 December 2017, one further risk has been added to the list of principal Group risks as disclosed in the 2016 Annual Report, being Reputational Risk. Reputational Risk is defined as the potential impact on the Group’s reputation from adverse events or publicity, and has been added reflecting a general business environment in which corporates are under increasing and magnified focus from both mainstream and social media.
Otherwise it was concluded that the nature of the Group’s risks had not significantly changed, although the ongoing economic and political uncertainty in the UK, most prominently due to the result of the EU referendum, continues to impact some of the wider market risks that the Group is subject to.
Risk Impact Mitigation
Property risksProperty investment market risks• Weakening economic conditions and
poor sentiment in commercial real estate markets could lead to low investor demand and an adverse movement in valuation
• Small changes in property market yields can have a significant effect on valuation
• Impact of leverage could magnify the effect on the Group’s net assets
• Monitoring of indicators of market direction and forward planning of investment decisions
• Review of debt levels and consideration of strategies to reduce if relevant
Impact of the economic environment• Tenant insolvency or distress • Prolonged downturn in tenant demand
and pressure on rent levels
• Tenant failures and reduced tenant demand could adversely affect rental income, lease incentive, void costs, cash and ultimately property valuation
• Large, diversified tenant base• Review of tenant covenants before
new leases signed• Long-term leases and active credit
control process• Good relationships with, and active
management of, tenants• Void management though temporary
lettings and other mitigation strategies
Valuation risk• Lack of relevant transactional evidence • Property valuations increasingly
subjective and open to a wider range of possible outcomes
• Use of experienced, external valuers who understand the specific properties
• Use of more than one valuer• Valuations reviewed by internal
valuation experts and key assumptions challenged
Threat from the internet• The trend towards online shopping may
adversely impact consumer footfall in shopping centres
• A change in consumer shopping habits towards online purchasing and delivery may reduce footfall and therefore potentially reduce tenant demand and the levels of rents which can be achieved
• Strong location and dominance of shopping centres (portfolio is weighted to London and South East England)
• Strength of the community shopping experience with tailored relevance to the local community
• Concentration on convenience and value offer which is less impacted by online presence
• Increasing provision of “Click & Collect” within our centres
• Digital marketing initiatives• Monitoring of footfall for evidence of
negative trends• Monitoring of retail trends and
shopping behaviour
The risks noted do not comprise all those potentially faced by the Group and are not intended to be presented in any order of priority. Additional risks and uncertainties currently unknown to the Group, or which the Group currently deems immaterial, may also have an adverse effect on the financial condition or business of the Group in the future. These issues are kept under constant review to allow the Group to react in an appropriate and timely manner to help mitigate the impact of such risks.
Capital & Regional plc Annual Report and Accounts for the year ended 30 December 2017
Stock Code: CALStock Code: CAL capreg.com
26
Capital & Regional AR2017.indd 26 10/04/2018 16:03:59

Risk Impact Mitigation
Property risksProperty investment market risks• Weakening economic conditions and
poor sentiment in commercial real estate markets could lead to low investor demand and an adverse movement in valuation
• Small changes in property market yields can have a significant effect on valuation
• Impact of leverage could magnify the effect on the Group’s net assets
• Monitoring of indicators of market direction and forward planning of investment decisions
• Review of debt levels and consideration of strategies to reduce if relevant
Impact of the economic environment• Tenant insolvency or distress • Prolonged downturn in tenant demand
and pressure on rent levels
• Tenant failures and reduced tenant demand could adversely affect rental income, lease incentive, void costs, cash and ultimately property valuation
• Large, diversified tenant base• Review of tenant covenants before
new leases signed• Long-term leases and active credit
control process• Good relationships with, and active
management of, tenants• Void management though temporary
lettings and other mitigation strategies
Valuation risk• Lack of relevant transactional evidence • Property valuations increasingly
subjective and open to a wider range of possible outcomes
• Use of experienced, external valuers who understand the specific properties
• Use of more than one valuer• Valuations reviewed by internal
valuation experts and key assumptions challenged
Threat from the internet• The trend towards online shopping may
adversely impact consumer footfall in shopping centres
• A change in consumer shopping habits towards online purchasing and delivery may reduce footfall and therefore potentially reduce tenant demand and the levels of rents which can be achieved
• Strong location and dominance of shopping centres (portfolio is weighted to London and South East England)
• Strength of the community shopping experience with tailored relevance to the local community
• Concentration on convenience and value offer which is less impacted by online presence
• Increasing provision of “Click & Collect” within our centres
• Digital marketing initiatives• Monitoring of footfall for evidence of
negative trends• Monitoring of retail trends and
shopping behaviour
27
Stock Code: CAL capreg.comcapreg.com
STRATEGIC REPORT
Capital & Regional AR2017.indd 27 10/04/2018 16:03:59

MANAGING RISK CONTINUED
Risk Impact MitigationConcentration and scale risk• By having a less diversified portfolio the
business is more exposed to specific tenants or types of tenant
• Tenant failures could have a greater impact on rental income
• Reduced purchasing power could impact the ability to drive economies of scale and the feasibility of certain investment decisions regarding the operating platform
• Regular monitoring of retail environment and performance of key tenants
• Maintaining flexibility in operating platform
• Further diversification considered through acquisitions or joint ventures
Competition risk• The threat to the Group’s property
assets of competing in town and out of town retail and leisure schemes
• Competing schemes may reduce footfall and reduce tenant demand for space and the levels of rents which can be achieved
• Monitoring of new planning proposals• Close relationships with local councils
and willingness to support town centres
• Continued investment in schemes to ensure relevance to the local community
• Investment in traditional and digital marketing
Business disruption from a major incident• Major incident takes place • Financial loss if unable to trade or
impacts upon shopper footfall• Trained operational personnel at all
sites and documented major incident procedures
• Updated operational procedures reflecting current threats and major incident testing run
• Regular liaison with the police• Key IT applications hosted offsite• Insurance maintained
Development risk• Delays or other issues may occur to
capital expenditure and development projects
• May lead to increased cost and reputational damage
• Planned value may not be realised
• Approval process for new developments and staged execution to key milestones
• Use of experienced project co-ordinators and external consultants with regular monitoring and Executive Committee oversight
Funding and treasury risks Liquidity and funding• Inability to fund the business or to
refinance existing debt on economic terms when needed
• Inability to meet financial obligations when due
• Limitation on financial and operational flexibility
• Cost of financing could be prohibitive
• Refinancing of debt on the Mall assets in early 2017 improved liquidity and long-term security
• Ensuring that there are significant undrawn facilities
• Efficient treasury management and forecasting with regular reporting to the Board
• Option of asset sales if necessary
Risk Impact MitigationCovenant compliance risks• Breach of any loan covenants
causing default on debt and possible accelerated maturity
• Unremedied breaches can trigger demand for immediate repayment of loan
• Regular monitoring and projections of liquidity, gearing and covenant compliance
• Review of future cash flows and predicted valuations to ensure sufficient headroom
Interest rate exposure risks• Exposure to rising or falling interest
rates• If interest rates rise and are unhedged,
the cost of debt facilities can rise and ICR covenants could be broken
• Hedging transactions used by the Group to minimise interest rate risk may limit gains, result in losses or have other adverse consequences
• Regular monitoring of the performance of derivative contracts and corrective action taken where necessary
• Use of alternative hedges such as caps
Other risksExecution of business plan• Failure to execute business plan in line
with internal and external expectations• Potential loss of income or value
resulting in lower cash flow and property valuation
• Reputational damage negatively impacting investor market perception
• Management of projects and the individual shopping centres by experienced and skilled professionals
• Strong relationships with retailers and contractors/suppliers
• Ongoing monitoring of performance against plan and key milestones
Property acquisition/disposal strategy• Exposure to risks around overpayment
for acquisitions • Portfolio not effectively managed
through the investment cycle, with sales and de-leveraging at the appropriate time
• Overpayment may result in acquisitions not delivering forecast returns
• The Group may not be able to take advantage of investment opportunities as they arise
• Covenants may move adversely when cycle changes
• Regular monitoring of the property market and the use of professional advisers
• Impact of cycle reflected in business planning
Reputational risk• Adverse events or publicity, including
social media, may lead to reputational damage
• Negatively impact investor market perception
• May reduce shopper footfall and demand from tenants for space
• Close Board/Management oversight of major issues and decision making
• Effective pre-planning of announcements and applications
• Monitoring of public opinion through focus groups and review of press and social media
• Use of PR advisers and Media training for Management
Capital & Regional plc Annual Report and Accounts for the year ended 30 December 2017
Stock Code: CALStock Code: CAL capreg.com
28
Capital & Regional AR2017.indd 28 10/04/2018 16:03:59

Risk Impact MitigationConcentration and scale risk• By having a less diversified portfolio the
business is more exposed to specific tenants or types of tenant
• Tenant failures could have a greater impact on rental income
• Reduced purchasing power could impact the ability to drive economies of scale and the feasibility of certain investment decisions regarding the operating platform
• Regular monitoring of retail environment and performance of key tenants
• Maintaining flexibility in operating platform
• Further diversification considered through acquisitions or joint ventures
Competition risk• The threat to the Group’s property
assets of competing in town and out of town retail and leisure schemes
• Competing schemes may reduce footfall and reduce tenant demand for space and the levels of rents which can be achieved
• Monitoring of new planning proposals• Close relationships with local councils
and willingness to support town centres
• Continued investment in schemes to ensure relevance to the local community
• Investment in traditional and digital marketing
Business disruption from a major incident• Major incident takes place • Financial loss if unable to trade or
impacts upon shopper footfall• Trained operational personnel at all
sites and documented major incident procedures
• Updated operational procedures reflecting current threats and major incident testing run
• Regular liaison with the police• Key IT applications hosted offsite• Insurance maintained
Development risk• Delays or other issues may occur to
capital expenditure and development projects
• May lead to increased cost and reputational damage
• Planned value may not be realised
• Approval process for new developments and staged execution to key milestones
• Use of experienced project co-ordinators and external consultants with regular monitoring and Executive Committee oversight
Funding and treasury risks Liquidity and funding• Inability to fund the business or to
refinance existing debt on economic terms when needed
• Inability to meet financial obligations when due
• Limitation on financial and operational flexibility
• Cost of financing could be prohibitive
• Refinancing of debt on the Mall assets in early 2017 improved liquidity and long-term security
• Ensuring that there are significant undrawn facilities
• Efficient treasury management and forecasting with regular reporting to the Board
• Option of asset sales if necessary
Risk Impact MitigationCovenant compliance risks• Breach of any loan covenants
causing default on debt and possible accelerated maturity
• Unremedied breaches can trigger demand for immediate repayment of loan
• Regular monitoring and projections of liquidity, gearing and covenant compliance
• Review of future cash flows and predicted valuations to ensure sufficient headroom
Interest rate exposure risks• Exposure to rising or falling interest
rates• If interest rates rise and are unhedged,
the cost of debt facilities can rise and ICR covenants could be broken
• Hedging transactions used by the Group to minimise interest rate risk may limit gains, result in losses or have other adverse consequences
• Regular monitoring of the performance of derivative contracts and corrective action taken where necessary
• Use of alternative hedges such as caps
Other risksExecution of business plan• Failure to execute business plan in line
with internal and external expectations• Potential loss of income or value
resulting in lower cash flow and property valuation
• Reputational damage negatively impacting investor market perception
• Management of projects and the individual shopping centres by experienced and skilled professionals
• Strong relationships with retailers and contractors/suppliers
• Ongoing monitoring of performance against plan and key milestones
Property acquisition/disposal strategy• Exposure to risks around overpayment
for acquisitions • Portfolio not effectively managed
through the investment cycle, with sales and de-leveraging at the appropriate time
• Overpayment may result in acquisitions not delivering forecast returns
• The Group may not be able to take advantage of investment opportunities as they arise
• Covenants may move adversely when cycle changes
• Regular monitoring of the property market and the use of professional advisers
• Impact of cycle reflected in business planning
Reputational risk• Adverse events or publicity, including
social media, may lead to reputational damage
• Negatively impact investor market perception
• May reduce shopper footfall and demand from tenants for space
• Close Board/Management oversight of major issues and decision making
• Effective pre-planning of announcements and applications
• Monitoring of public opinion through focus groups and review of press and social media
• Use of PR advisers and Media training for Management
29
Stock Code: CAL capreg.comcapreg.com
STRATEGIC REPORT
Capital & Regional AR2017.indd 29 10/04/2018 16:03:59

MANAGING RISK CONTINUED
Risk Impact MitigationTax risks• Exposure to non-compliance with the
REIT regime and changes in the form or interpretation of tax legislation
• Potential exposure to tax liabilities in respect of historic transactions undertaken
• Tax related liabilities and other losses could arise
• Monitoring of REIT compliance• Expert advice taken on tax positions
and other regulations• Maintenance of a regular dialogue
with the tax authorities
Regulation risks• Exposure to changes in existing or
forthcoming property or corporate regulation
• Failure to comply could result in financial penalties, loss of business or credibility
• Training to keep Management aware of regulatory changes
• Expert advice taken on complex regulatory matters
Loss of key management• Dependence of the business on
the skills of a small number of key individuals
• Loss of key individuals or an inability to attract new employees with the appropriate expertise could reduce effectiveness
• Key management are paid market salaries and competitive incentive packages
• New LTIP awards made in 2017• Succession planning for key positions
is undertaken as evidenced by CEO transition in 2017
Historic transactions• Historic sales have included vendor
warranties and indemnities and as such, the Group has potential exposure to future claims from the purchaser
• Warranty and indemnity related liabilities and other losses could arise
• Use of professional advisers to achieve properly negotiated agreements in terms of scope, extent of financial liability and time frame
• Monitoring of ongoing exposure
Viability statementIn accordance with the 2014 revision of the Code, the Directors have assessed the prospect of the Company over a longer period than the 12 months required by the “Going Concern” provision. The Board conducted this review for a three year period to December 2020. This was selected reflecting that the Group’s annual budget and business planning process covers a three year period and all of the Group’s debt financing is secured and fully available for the duration of the period.
The three year budget and business plan review considers the Group’s cash flows, dividend cover and other key financial ratios overthe period. It includes sensitivity analysis to consider adverse scenarios, that could be caused by the principal risks and uncertaintiesoutlined on pages 26 to 30. This incorporated the impact on covenant compliance of a significant fall in property valuations or property income. The three-year review also makes certain assumptions about funding acquisitions, or additional capital expenditure initiatives through capital recycling or raising funding through other means.
Based on the results of this analysis, the Directors have a reasonable expectation that the Company will be able to continue inoperation and meet its liabilities as they fall due over the period to December 2020.
Going ConcernUnder the UK Corporate Governance Code, the Board needs to report whether the business is a going concern. In considering this requirement, the Directors have taken into account the following:
• the Group’s latest rolling forecast, in particular the cash flows, borrowings and undrawn facilities;• the headroom under the Group’s financial covenants; • options for recycling capital and or alternative means of additional financing for funding new investments; and• the principal Group risks that could impact on the Group’s liquidity and solvency over the next 12 months and/or threaten the
Group’s business model and capital adequacy.
The Group’s risks and risk management processes are set out on pages 26 to 30.
Having due regard to these matters and after making appropriate enquiries, the Directors have a reasonable expectation that theGroup has adequate resources to continue in operational existence for the foreseeable future. Therefore, the Board continues toadopt the going concern basis in preparing the financial statements.
Capital & Regional plc Annual Report and Accounts for the year ended 30 December 2017
Stock Code: CAL capreg.com
30
Capital & Regional AR2017.indd 30 10/04/2018 16:04:01

Risk Impact MitigationTax risks• Exposure to non-compliance with the
REIT regime and changes in the form or interpretation of tax legislation
• Potential exposure to tax liabilities in respect of historic transactions undertaken
• Tax related liabilities and other losses could arise
• Monitoring of REIT compliance• Expert advice taken on tax positions
and other regulations• Maintenance of a regular dialogue
with the tax authorities
Regulation risks• Exposure to changes in existing or
forthcoming property or corporate regulation
• Failure to comply could result in financial penalties, loss of business or credibility
• Training to keep Management aware of regulatory changes
• Expert advice taken on complex regulatory matters
Loss of key management• Dependence of the business on
the skills of a small number of key individuals
• Loss of key individuals or an inability to attract new employees with the appropriate expertise could reduce effectiveness
• Key management are paid market salaries and competitive incentive packages
• New LTIP awards made in 2017• Succession planning for key positions
is undertaken as evidenced by CEO transition in 2017
Historic transactions• Historic sales have included vendor
warranties and indemnities and as such, the Group has potential exposure to future claims from the purchaser
• Warranty and indemnity related liabilities and other losses could arise
• Use of professional advisers to achieve properly negotiated agreements in terms of scope, extent of financial liability and time frame
• Monitoring of ongoing exposure
Viability statementIn accordance with the 2014 revision of the Code, the Directors have assessed the prospect of the Company over a longer period than the 12 months required by the “Going Concern” provision. The Board conducted this review for a three year period to December 2020. This was selected reflecting that the Group’s annual budget and business planning process covers a three year period and all of the Group’s debt financing is secured and fully available for the duration of the period.
The three year budget and business plan review considers the Group’s cash flows, dividend cover and other key financial ratios over the period. It includes sensitivity analysis to consider adverse scenarios, that could be caused by the principal risks and uncertainties outlined on pages 26 to 30. This incorporated the impact on covenant compliance of a significant fall in property valuations or property income. The three-year review also makes certain assumptions about funding acquisitions, or additional capital expenditure initiatives through capital recycling or raising funding through other means.
Based on the results of this analysis, the Directors have a reasonable expectation that the Company will be able to continue in operation and meet its liabilities as they fall due over the period to December 2020.
Going ConcernUnder the UK Corporate Governance Code, the Board needs to report whether the business is a going concern. In considering this requirement, the Directors have taken into account the following:
• the Group’s latest rolling forecast, in particular the cash flows, borrowings and undrawn facilities;• the headroom under the Group’s financial covenants; • options for recycling capital and or alternative means of additional financing for funding new investments; and• the principal Group risks that could impact on the Group’s liquidity and solvency over the next 12 months and/or threaten the
Group’s business model and capital adequacy.
The Group’s risks and risk management processes are set out on pages 26 to 30.
Having due regard to these matters and after making appropriate enquiries, the Directors have a reasonable expectation that the Group has adequate resources to continue in operational existence for the foreseeable future. Therefore, the Board continues to adopt the going concern basis in preparing the financial statements.
capreg.com
Capital & Regional AR2017.indd 31 10/04/2018 16:04:03
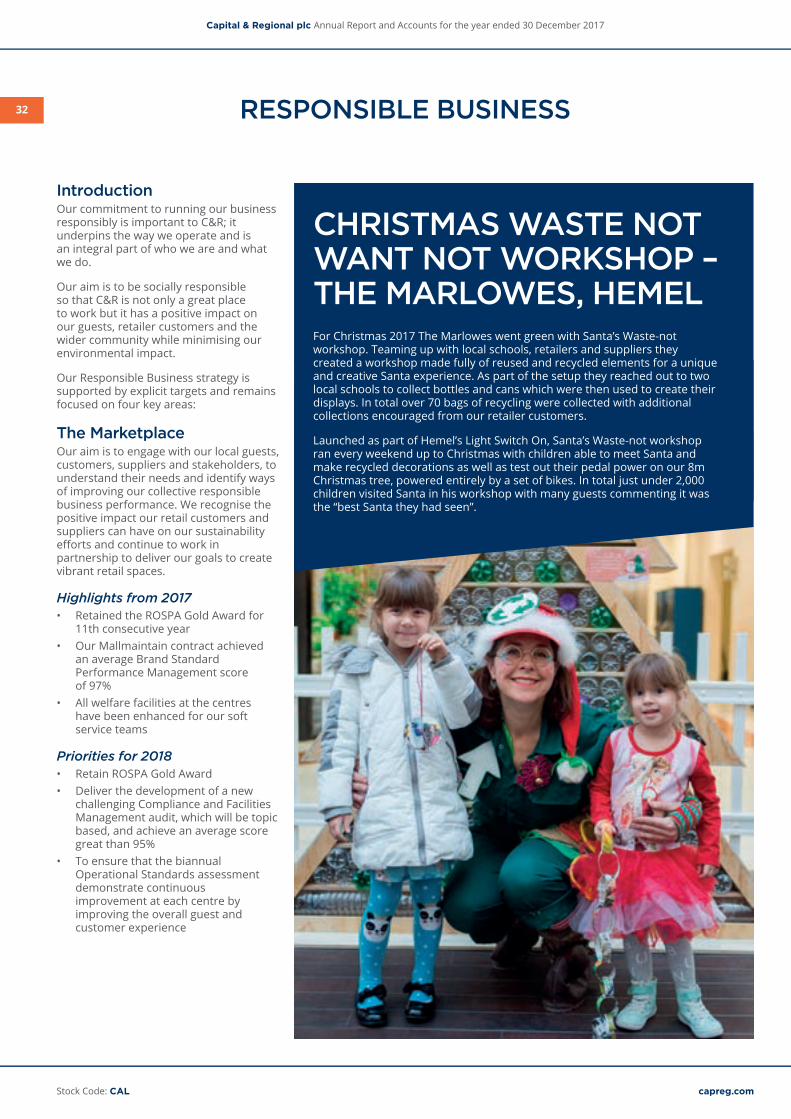
RESPONSIBLE BUSINESS
Introduction Our commitment to running our business responsibly is important to C&R; it underpins the way we operate and is an integral part of who we are and what we do.
Our aim is to be socially responsible so that C&R is not only a great place to work but it has a positive impact on our guests, retailer customers and the wider community while minimising our environmental impact.
Our Responsible Business strategy is supported by explicit targets and remains focused on four key areas:
The MarketplaceOur aim is to engage with our local guests, customers, suppliers and stakeholders, to understand their needs and identify ways of improving our collective responsible business performance. We recognise the positive impact our retail customers and suppliers can have on our sustainability efforts and continue to work in partnership to deliver our goals to create vibrant retail spaces.
Highlights from 2017• Retained the ROSPA Gold Award for
11th consecutive year• Our Mallmaintain contract achieved
an average Brand Standard Performance Management score of 97%
• All welfare facilities at the centres have been enhanced for our soft service teams
Priorities for 2018• Retain ROSPA Gold Award• Deliver the development of a new
challenging Compliance and Facilities Management audit, which will be topic based, and achieve an average score great than 95%
• To ensure that the biannual Operational Standards assessment demonstrate continuous improvement at each centre by improving the overall guest and customer experience
Environmental SustainabilityWe work hard to ensure that our local communities which we serve are better places to be for all. Our commitment is to reduce our impact on the environment in the three key areas of waste, water and energy. In addition, we continue the focus on reducing the carbon footprint of our properties. We have long recognised that any development activity should mirror this and have proactively ensured we minimise energy consumption and mitigate the effects of climate change throughout the design and refurbishment of our centres.
Highlights from 2017• Retained the Global Real Estate
Benchmark (GRESB) Green Star Status• Reduced CO2 emissions by 12% and
water consumption by 6%• Retained the Best in Carbon
Management Award in October 2017• Diverted 98% of waste from landfill
and 96% recycled back to the supply chain
• Launched Evora environmental reporting platform across all centres to assist in monitoring, reporting and targeting usage reductions
Priorities for 2018• Reduce CO2 by 4%• Reduce our water consumption by 1%• Retain GRESB Green Star rating• Establish a robust strategy across
the car parks for electrical vehicle charging using smart technologies
CHRISTMAS WASTE NOT WANT NOT WORKSHOP – THE MARLOWES, HEMELFor Christmas 2017 The Marlowes went green with Santa’s Waste-not workshop. Teaming up with local schools, retailers and suppliers they created a workshop made fully of reused and recycled elements for a unique and creative Santa experience. As part of the setup they reached out to two local schools to collect bottles and cans which were then used to create their displays. In total over 70 bags of recycling were collected with additional collections encouraged from our retailer customers.
Launched as part of Hemel’s Light Switch On, Santa’s Waste-not workshop ran every weekend up to Christmas with children able to meet Santa and make recycled decorations as well as test out their pedal power on our 8m Christmas tree, powered entirely by a set of bikes. In total just under 2,000 children visited Santa in his workshop with many guests commenting it was the “best Santa they had seen”.
Capital & Regional plc Annual Report and Accounts for the year ended 30 December 2017
Stock Code: CALStock Code: CAL capreg.com
32
Capital & Regional AR2017.indd 32 10/04/2018 16:04:04

Environmental SustainabilityWe work hard to ensure that our local communities which we serve are better places to be for all. Our commitment is to reduce our impact on the environment in the three key areas of waste, water and energy. In addition, we continue the focus on reducing the carbon footprint of our properties. We have long recognised that any development activity should mirror this and have proactively ensured we minimise energy consumption and mitigate the effects of climate change throughout the design and refurbishment of our centres.
Highlights from 2017• Retained the Global Real Estate
Benchmark (GRESB) Green Star Status• Reduced CO2 emissions by 12% and
water consumption by 6%• Retained the Best in Carbon
Management Award in October 2017• Diverted 98% of waste from landfill
and 96% recycled back to the supply chain
• Launched Evora environmental reporting platform across all centres to assist in monitoring, reporting and targeting usage reductions
Priorities for 2018• Reduce CO2 by 4%• Reduce our water consumption by 1%• Retain GRESB Green Star rating• Establish a robust strategy across
the car parks for electrical vehicle charging using smart technologies
Report on Greenhouse Gas EmissionsWe have followed the Greenhouse Gas Protocol for reporting CO2 emissions for the 2017 calendar year. The reporting boundary has been defined using the operational control approach, reporting emissions for operations in which Capital & Regional have control. It does not account for GHG emissions from operations in which it owns an interest but has no operational control. Energy use from metered sources identified as fully controlled by third parties (e.g. tenants) have also been excluded.
Scope 1 emissions account for total gas consumption. Emissions from emergency equipment (e.g. standby generators) have been deemed de minimis and therefore are not included in the reported figures. Scope 2 emissions account for the total electricity purchased.
Actual invoice data has been used for reporting wherever possible, however some estimated data has been used where required. It should be noted that the Scope 1 and Scope 2 reporting figures are absolute values. The information in this report represents the best information available at the time of issue.
The data presented below has been independently verified by Hurley Palmer Flatt who are satisfied, based on the information provided, that the reported figures are representative of performance.
Scope 1 & 2 Mandatory Reporting* 2017 2016**
EmissionsScope 1 tCO2e 1,161 1,201Scope 2 tCO2e 8,833 10,985IntensityScope 1 and 2 kgCO2e/sqft 2.05 2.48
* Scope 1: Direct GHG emissions from controlled operations (natural gas consumption) Scope 2: Indirect GHG emissions from the use of purchased electricity, heat or steam (electricity consumption).
** 2016 figures have been restated where material changes were subsequently identified.
The five centres we have had since 2012 now use 43% less electricity. The 4.5 million kWh saved over five years is enough to provide free power at our Maidstone and Wood Green Centres and the cost saving over five years is in excess of £1,250,000.
33
Stock Code: CAL capreg.comcapreg.com
STRATEGIC REPORT
Capital & Regional AR2017.indd 33 10/04/2018 16:04:07

RESPONSIBLE BUSINESS CONTINUED
PeopleBeing a responsible business cannot be achieved without the support and active engagement of our colleagues. They are fundamental to the delivery of our business vision which is to define and lead Community Shopping, through our passionate creation of vibrant retail spaces and exceptional customer and guest experience. Our aim is to ensure that we promote a progressive company culture which is a combination of who we are, how we work together and the pride we generate. Our aim is to engage, develop and reward our people, retaining our reputation as an employer of choice within the sectors in which we operate. We want to provide relevant, engaging training for all our employees in order that they can make their fullest contribution to our success and deliver exceptional customer service. We set out to provide a working environment which supports the wellbeing and health of all our people, taking account of the diversity of our workforce and reflecting our values and ethics.
Highlights from 2017• Retained our focus on Continuous
Improvement as part of the Working Smarter initiative which has driven efficiencies across the business
• Successfully launched the new Management Training programme achieving an average positive evaluation of 90%
• All centres participated in the Revo Achievement in Customer Excellence Awards (ACE) and achieved an average Mystery Shopper rating of 81%, +4% improvement on last year and compared to the industry average of 77%
• Achieved 89% return rate on C&R Pulse, our in-house Staff Engagement Survey
• Launched our advanced Customer Service Training Programme including our 10 Golden Rules of guest engagement
• Launched our Wellbeing Committee across the business
Priorities for 2018• Launch a new Guest Experience Training
Programme which will be evaluated by the mystery shopper results and the Guest Net Promoter scores
• To deliver a revised policy and audit procedures compliant with GDPR legislation
• To launch our new training and development training programme to assist our teams in delivering our refreshed business strategy
• All centres to enter the Revo Achievement in Customer Excellence Awards (ACE) and achieve an average rating of at least 77%
• To launch our new communication platform CARTER (Capital & Regional Team Engagement Resource)
The Community Fundamental to our strategy is the key role our centres play in the ongoing development of the communities and environments in which we operate. We work closely with key stakeholders to ensure that we listen, engage and use feedback to develop or refine our approach. We aim to provide safe, welcoming, clean and attractive shopping and leisure venues where our guests choose to shop, work and socialise. We seek to make a positive contribution to each local community by being a responsible, socially aware and a proactive partner.
Highlights from 2017• Through Mall Cares we raised over
£312k for our local charities in 2017, +11% on 2016
• The Mall Luton launched the Strategic Community Safety Group together with the town centre partners to enable improved focus on business related crime
• The launch of the Community Hub in The Mall, Maidstone
• Launch of The Mall Monster Friends Club
• We handled 42,000 Collect+ parcels in 2017, a 24% increase on 2016
Priorities for 2018• To create as part of the roll-out of
asset masterplans an inclusive and accessible shopping experience to enhance social connections and support the wider community
• To continue to work with our local Mall Cares charities and at least match 2017 fundraising
• Implement the Net Promotor Surveys across all centres on a quarterly basis
Continuous ImprovementOur Continuous Improvement (Ci) initiative has empowered our teams to challenge how we do things and to review and improve the way we work leading to service excellence for our guests, customers and internal teams.
Example projects delivered:
• Batch processing of supplier invoices: streamlined more efficient scanning and automated matching of invoices.
• Purchase order system: removed silo management of data, automation of processes leading to scalable business benefits and enhanced cost monitoring visibility.
• Electronic tenant invoicing: improved communication with our customers, reduced cost and paper, improved efficiency and enhanced revenue management.
Capital & Regional plc Annual Report and Accounts for the year ended 30 December 2017
Stock Code: CALStock Code: CAL capreg.com
34
Capital & Regional AR2017.indd 34 10/04/2018 16:04:08

The Community Fundamental to our strategy is the key role our centres play in the ongoing development of the communities and environments in which we operate. We work closely with key stakeholders to ensure that we listen, engage and use feedback to develop or refine our approach. We aim to provide safe, welcoming, clean and attractive shopping and leisure venues where our guests choose to shop, work and socialise. We seek to make a positive contribution to each local community by being a responsible, socially aware and a proactive partner.
Highlights from 2017• Through Mall Cares we raised over
£312k for our local charities in 2017, +11% on 2016
• The Mall Luton launched the Strategic Community Safety Group together with the town centre partners to enable improved focus on business related crime
• The launch of the Community Hub in The Mall, Maidstone
• Launch of The Mall Monster Friends Club
• We handled 42,000 Collect+ parcels in 2017, a 24% increase on 2016
Priorities for 2018• To create as part of the roll-out of
asset masterplans an inclusive and accessible shopping experience to enhance social connections and support the wider community
• To continue to work with our local Mall Cares charities and at least match 2017 fundraising
• Implement the Net Promotor Surveys across all centres on a quarterly basis
Blackburn sleep outJason Cothliff and Carley McKenna from The Mall, Blackburn took part in the Nightsafe charity sleep out in early December 2017. They joined other fundraisers in sleeping on King William Street, outside the Mall, to raise money for Nightsafe and highlight the plight of homeless people during the harsh winter months. The pair only had a cardboard box, sleeping bag and warm clothing to protect them from the elements during a cold December night.
Nightsafe supports homeless youngsters and ongoing projects such as an emergency night shelter, housing projects, outreach flats, an activity day centre, a volunteer mentor project and an outreach support service, which all support young people within the local community to set up a home.
The Mall Luton VolunteersThe Mall Luton Team helped to clean, paint and set up a new store called Level Trust before it opened on 7 August 2017. The store supports school aged children who are suffering from poverty and allows families to bring in second-hand uniforms and swap them for the uniform they need for the return to school after the summer holidays.
35
Stock Code: CAL capreg.comcapreg.com
STRATEGIC REPORT
Capital & Regional AR2017.indd 35 10/04/2018 16:04:09

Capital & Regional plc Annual Report and Accounts for the year ended 30 December 2017
DIRECTORS
Executive Directors
Lawrence HutchingsChief Executive appointed 2017Chairman of Disclosure Committee and member of Responsible Business Committees
Lawrence joined the Group in 2017 following four years at Blackstone in Australia, two as Managing Director, and has over 20 years’ experience in the property industry. Prior to Blackstone, Lawrence was at Hammerson PLC for four years, the last three as Managing Director – UK Retail, before which he spent almost seven years at Henderson GlobalInvestors,latterlyasDirector(Property)EuropeanRetail.
Charles StaveleyGroup Finance Director appointed 2008Member of Disclosure Committee
Charles joined the Group in 2007 and was appointed Group Finance Director in 2008. He qualified as a Chartered Accountant with Arthur Andersen and previously held senior finance roles with Colt Telecommunications, Novar plc, and Textron Inc. He also has Board responsibility for the Snozone business.
Non-Executive Directors
Hugh Scott-BarrettChairman appointed 2008Chairman of Nominations Committee, Member of Disclosure Committee
Before moving to become Non-Executive Chairman, Hugh was Chief Executive of Capital Regionalfrom200 to2017. ewaspreviouslyamemberofAB A RO’smanagingboardservingasChiefOperatingOfficerandChiefFinancialOfficerandbefore that worked at SBC Warburg and Kleinwort Benson. He was educated both in ParisandatOxford niversity. ughistheChairmanofGA oldingAG,aSwissassetmanagement company, and a non-executive director of RBR Group Limited, a privately owned leisure group.
Non-Executive Directors
Stock Code: CAL capreg.com Stock Code: CAL
36
Capital & Regional AR2017 Governance.indd 36 10/04/2018 16:05:04

DIRECTORS
Executive Directors
Non-Executive Directors
Non-Executive DirectorsTony Hales CBENon-Executive* appointed 2011
Senior Independent Director, Chairman of Remuneration Committee, member of Audit and Nomination Committees
Tony is currently Chairman of the Greenwich Foundation, Senior Independent Director of International Personal Finance plc and chairs NAAFI Pension Fund Trustees. Tony was previously Chief Executive of Allied Domecq plc, a Non-Executive Director of HSBC Bank plc and Chairman of Workspace Group plc and British Waterways.
Wessel HammanNon-Executive appointed 2015
Wessel is Chief Executive of Clearance Capital Limited, a Real Estate investment management firm which he co-founded in 2008. Wessel also serves as a Non-Executive Director of Sirius Real Estate Limited. Wessel qualified as a Chartered Accountant at KPMG in South Africa.
Ian KriegerNon-Executive* appointed 2014
Chairman of Audit Committee, member of Nomination and Remuneration CommitteesIan is the Audit Committee Chairman and Senior Independent Director at both Premier Foods plc and Safestore Holdings plc and a Non-Executive Director of Primary Health Properties PLC where he is due to be appointed chair of the Audit Committee from 18 April 2018. He is also a Trustee and Chairman of the Finance Committee at Nuffield Trust and Chair of Anthony Nolan. Ian was previously a senior partner and vice-chairman at Deloitte.
Louis NorvalNon-Executive appointed 2009
Louis was a co-founder, Executive Chairman and Chief Executive of Attfund Limited (one of the largest private property investment companies in South Africa) until the company was sold to Hyprop Investments Limited (a REIT listed on the Johannesburg Stock Exchange) in 2011. Louis is also Managing Director of the Parkdev Group of Companies, Executive Chairman of Homestead Group Holdings Limited and serves on the board of a number of other companies including Hyprop Investments Limited. He graduated in BSc (QS) (with distinction) from the University of Pretoria.
Guillaume PoitrinalNon-Executive appointed 2016
Guillaume served as Chief Executive of Unibail-Rodamco, one of Europe’s largest commercial property companies, from 2005 until 2013 having joined in 1995. Guillaume is the founderand Chairmanof ICA APInvestments S.àr.l, a specialised investment fund focusing on property stocks.
Laura WhyteNon-Executive* appointed 2015
Chairman of Responsible Business Committee, member of Audit, Nomination and Remuneration Committees
Laura had a long and successful career with John Lewis Partnership where she served on the Management Board for over ten years, firstly as Registrar and latterly as HR Director. Laura is also a Non-Executive Director of the Defence People and Training Board of the Ministry of Defence, where she is also a member of the People Committee, a Non-Executive Director of the British Horseracing Authority and an Executive Trustee of Women in Retail.
* Independent (as per the UK Corporate Governance Code).
capreg.com Stock Code: CAL capreg.com
37
GOVERNANCE
Capital & Regional AR2017 Governance.indd 37 10/04/2018 16:05:21

Capital & Regional plc Annual Report and Accounts for the year ended 30 December 2017
I am pleased to present Capital & Regional’s corporate governance report for 2017.
The primary operational focus of C&R in 2017 has been on the continued delivery of the capital investment plan across our portfolio of assets to drive our income focus and underpin our targeted dividend growth of 5% to 8% per annum. The Board’s activities during the year have reflected this with a number of visits to sites and review of investment initiatives and business plans for all our centres.
The Board has also managed a significant amount of personnel changes over the last 18 months with both Mark Bourgeois and Ken Ford resigning as Executive Directors, John Clare retiring as the Group’s Non-executive Chairman and Lawrence Hutchings taking over from myself as Chief Executive. The appointment of a new Chief Executive has provided an opportunity for a root and branch review of strategy. Lawrence Hutchings has provided the Board with recommendations on how strategy should evolve and on how execution of strategy can be enhanced in light of the fast changing retail landscape. The strategy was debated extensively and endorsed by the Board and subsequently communicated to investors at the Capital Markets Day in December 2017.
The Board is mindful of the revisions to the UK Corporate Governance proposed by the Financial Reporting Council and have commenced the process of assessing the impact and how the Company will respond once the final legislation has been agreed.
Hugh Scott-BarrettChairman
CORPORATE GOVERNANCE REPORTCHAIRMAN’S INTRODUCTION
Compliance statementCompliance with the UK Corporate Governance CodeThe Company has throughout the year ended 30 December 2017, complied with the provisions of the 2014 UK Corporate Governance Code (“the Code”) as they apply to smaller (i.e. non FTSE 350) companies with the exception that Hugh Scott-Barrett was not considered independent on his appointment as Chairman of the Company on 13 June 2017, having previously served as Chief Executive. The rationale for the decision is explained in the Nomination Committee section of this report.
Compliance with the Disclosure and Transparency RulesThe disclosures required under DTR 7.2 of the Disclosure and Transparency Rules are contained in this report, except for those required under DTR 7.2.6 which are contained in the Directors’ Report.
Role of the BoardThe Board has a collective responsibility to promote the long-term success of the Company for its shareholders. Its role includes reviewing and approving key policies and decisions, particularly in relation to strategy and operating plans, governance and compliance with laws and regulations, business development including major investments and disposals and, through its Committees, financial reporting and risk management.
The Board’s agenda is managed to ensure that shareholder value and governance issues play a key part in its decision making and there is a schedule of key matters that are not delegated.
Board Committees
Audit CommitteeMeets at least three times per yearFurther information on pages 43 to 44
Chairman – Ian Krieger Members – Tony Hales, Laura Whyte
Disclosure CommitteeMeets as required
Chairman – Lawrence HutchingsMembers – Hugh Scott-Barrett, Charles Staveley
Nomination CommitteeMeets at least once a yearFurther information on page 42
Chairman – Hugh Scott-BarrettMembers – Tony Hales, Ian Krieger, Laura Whyte
Remuneration CommitteeMeets at least twice per yearFurther information on pages 45 to 60
Chairman – Tony HalesMembers – Ian Krieger, Laura Whyte
Responsible Business CommitteeMeets at least twice per yearFurther information on pages 32 to 35
Chairman – Laura Whyte Members – Lawrence Hutchings
Terms of reference for all Committees are available on the Company’s website.
Hugh Scott-BarrettChairman
Stock Code: CAL capreg.com Stock Code: CAL
38
Capital & Regional AR2017 Governance.indd 38 10/04/2018 16:05:24

I am pleased to present Capital & Regional’s corporate governance report for 2017.
The primary operational focus of C&R in 2017 has been on the continued delivery of the capital investment plan across our portfolio of assets to drive our income focus and underpin our targeted dividend growth of 5% to 8% per annum. The Board’s activities during the year have reflected this with a number of visits to sites and review of investment initiatives and business plans for all our centres.
The Board has also managed a significant amount of personnel changes over the last 18 months with both Mark Bourgeois and Ken Ford resigning as Executive Directors, John Clare retiring as the Group’s Non-executive Chairman and Lawrence Hutchings taking over from myself as Chief Executive. The appointment of a new Chief Executive has provided an opportunity for a root and branch review of strategy. Lawrence Hutchings has provided the Board with recommendations on how strategy should evolve and on how execution of strategy can be enhanced in light of the fast changing retail landscape. The strategy was debated extensively and endorsed by the Board and subsequently communicated to investors at the Capital Markets Day in December 2017.
The Board is mindful of the revisions to the UK Corporate Governance proposed by the Financial Reporting Council and have commenced the process of assessing the impact and how the Company will respond once the final legislation has been agreed.
Hugh Scott-BarrettChairman
CORPORATE GOVERNANCE REPORTCHAIRMAN’S INTRODUCTION
Compliance statementCompliance with the UK Corporate Governance CodeThe Company has throughout the year ended 30 December 2017, complied with the provisions of the 2014 UK Corporate Governance Code (“the Code”) as they apply to smaller (i.e. non FTSE 350) companies with the exception that Hugh Scott-Barrett was not considered independent on his appointment as Chairman of the Company on 13 June 2017, having previously served as Chief Executive. The rationale for the decision is explained in the Nomination Committee section of this report.
Compliance with the Disclosure and Transparency RulesThe disclosures required under DTR 7.2 of the Disclosure and Transparency Rules are contained in this report, except for those required under DTR 7.2.6 which are contained in the Directors’ Report.
Role of the BoardThe Board has a collective responsibility to promote the long-term success of the Company for its shareholders. Its role includes reviewing and approving key policies and decisions, particularly in relation to strategy and operating plans, governance and compliance with laws and regulations, business development including major investments and disposals and, through its Committees, financial reporting and risk management.
The Board’s agenda is managed to ensure that shareholder value and governance issues play a key part in its decision making and there is a schedule of key matters that are not delegated.
The responsibilities, which the Board does delegate, are given to committees that operate within specified terms of reference. The Executive Directors take operational decisions and also approve certain transactions within defined parameters. An Executive Committee, formed of the Executive Directors and other members of senior management as required on specific issues, meets on a regular basis and deals with all major decisions not requiring full Board approval or authorisation by other Board committees. Minutes of these meetings are circulated to the Board. If decisions are not unanimous the matter is referred to the Board for approval.
The Company also maintains a Disclosure Committee, formed of the Chairman, Chief Executive and Group Finance Director, to which it has delegated responsibility for monitoring the Company’s requirements for disclosure of Inside Information. The Committee meets as and when required by specific events. The Committee is quorate with two members. Where the Committee concludes that specific restrictions on share dealings need to be enforced this is immediately communicated to the Board and other relevant individuals. Minutes of all Disclosure Committee meetings are also circulated to the Board.
Board meetings are scheduled to coincide with key events in the Company’s financial calendar, including interim and final resultsandtheAG .Othermeetingsduringtheyearwillreviewthe Company’s strategy and budgets for the next financial year and the Company’s key risks and financial and operating performance.
Board Committees
Audit CommitteeMeets at least three times per yearFurther information on pages 43 to 44
Chairman – Ian Krieger Members – Tony Hales, Laura Whyte
Disclosure CommitteeMeets as required
Chairman – Lawrence HutchingsMembers – Hugh Scott-Barrett, Charles Staveley
Nomination CommitteeMeets at least once a yearFurther information on page 42
Chairman – Hugh Scott-BarrettMembers – Tony Hales, Ian Krieger, Laura Whyte
Remuneration CommitteeMeets at least twice per yearFurther information on pages 45 to 60
Chairman – Tony HalesMembers – Ian Krieger, Laura Whyte
Responsible Business CommitteeMeets at least twice per yearFurther information on pages 32 to 35
Chairman – Laura Whyte Members – Lawrence Hutchings
Terms of reference for all Committees are available on the Company’s website.
capreg.com Stock Code: CAL capreg.com
GOVERNANCE
39
Capital & Regional AR2017 Governance.indd 39 10/04/2018 16:05:24

Capital & Regional plc Annual Report and Accounts for the year ended 30 December 2017
Board balance and independenceDetails of the directors including their qualifications, experience and other commitments are set out on pages 36 to 37. The Board currently comprises of the Chairman, two Executive Directors and six Non-Executive Directors.
The Board reviews the independence of its Non-Executive Directors on an annual basis. Louis Norval and Wessel Hamman are not considered independent as they act as representatives of the Parkdev Group of companies, a significant shareholder of the Company. Guillaume Poitrinal is not considered independent as while his appointment is in a personal capacity he is the Chairman of ICAMAP Investments S.àr.l, a significant shareholder in the Company. The Board has concluded that all other Non-Executive Directors continue to demonstrate their independence.
The Company has well established differentiation between the roles of Chairman and Chief Executive and written terms of reference are available on the Group’s website. As further detailed in the Nominations Committee section, following Hugh Scott-Barrett’s move to Chairman, Tony Hales, as Senior Independent Director, has undertaken regular reviews to ensure the distinction of roles and responsibilities remains appropriate.
In the Company’s view, the breadth of experience and knowledge of the Chairman and the Non-Executive Directors and their detachment from the day-to-day issues within the Company provide a sufficiently strong and experienced balance with the executive members of the Board.
Information and professional developmentThe Board schedules five meetings each year as a minimum, and arranges further meetings as the business requires. Prior to Board meetings, each member receives, as appropriate to the agenda, up-to-date financial and commercial information, management accounts, budgets and forecasts, details of potential or proposed acquisitions and disposals, cash flow forecasts and details of funding availability
Induction training is given to new directors and consists of an introduction to the Board and senior management, visits to our shopping centres, an induction pack, a briefing on governance re uirementsandaccesstoindependentadvisers.Ongoingtraining requirements are reviewed on a regular basis and undertaken individually, as necessary.
Board and committee meetingsThe number of meetings of the Board and its Committees during 2017, and individual attendance by Directors, is set out below.
Board meeting attendance in 2017
Scheduled Total
Number of meetings 6 6
J Clare (resigned 13 June 2017) 3/3 3/3H Scott-Barrett 6/6 6/6L Hutchings (appointed 13 June 2017) 3/3 3/3K Ford (resigned 9 May 2017) 2/2 2/2
C Staveley 6/6 6/6T Hales 6/6 6/6W Hamman 6/6 6/6I Krieger 6/6 6/6L Norval 6/6 6/6G Poitrinal 5/6 5/6L Whyte 6/6 6/6
Other committee meeting attendance
AuditCommittee
Remuneration Committee
Nomination Committee
Responsible Business
Committee
Number of meetings 3 3 2 4J Clare 1/1H Scott-Barrett 1/1 2/2L Hutchings 2/2I Krieger 3 3 1T Hales 3 3 2L Whyte 3 3 2 4
Hugh Scott-Barrett was a member of the Responsible Business Committee until 13 June 2017 when he was replaced by Lawrence Hutchings.
Board evaluationA formal process is undertaken for the annual evaluation of the performance of the Board, its Committees and each Director. This process is led by the Chairman and each Director completes a detailed questionnaire covering:
• performance of themselves as an individual and of the Board together as a unit;
• performance of the Chairman;• processes which underpin the Board’s effectiveness
(including consideration of the balance of skills, experience, independence and knowledge of the persons on the Board);
• strategy; and• performance of the Board’s subcommittees.
The completed questionnaires are collated by the Company Secretary and presented to the Board for a subsequent discussion. This year’s review found that the performance of the Board and its Committees continued to be effective in dealing with both day-to-day and ongoing strategic issues; and that the Board and Committee structure ensured that the governance requirements of the business were met.
The Chairman also meets as necessary, but at least once each year, with the Non-Executive Directors without the Executive Directors present. The Non-Executive Directors meet without the Chairman in order to appraise his performance on an annual basis. This meeting is chaired by the Senior Independent Director. The Chairman evaluates the performance of the Chief Executive having received input from the other Directors. The Chief Executive evaluates the performance of the other Executive Directors. Subsequently, the results are discussed by the Remuneration Committee and relevant consequential changes are made if required.
Shareholder relationsThe Company encourages regular dialogue with its shareholders at the AGM, corporate functions and property visits. The Company also attends road shows, participates in sector conferences and, following the announcement of final and interim results, and throughout the year, as requested, holds update meetings with institutional investors. All the Directors are accessible to all shareholders, and queries received verbally or in writing are addressed as soon as possible.
Announcements are made to the London Stock Exchange, the Johannesburg Stock Exchange and the business media concerning business developments to provide wider dissemination of information. Registered shareholders are sent copies of the annual report and relevant circulars. The Group’s website (capreg.com) is kept up to date with all announcements, reports and shareholder circulars.
CORPORATE GOVERNANCE REPORTCONTINUED
Stock Code: CAL capreg.com Stock Code: CAL
40
Capital & Regional AR2017 Governance.indd 40 10/04/2018 16:05:25

Induction training is given to new directors and consists of an introduction to the Board and senior management, visits to our shopping centres, an induction pack, a briefing on governance re uirementsandaccesstoindependentadvisers.Ongoingtraining requirements are reviewed on a regular basis and undertaken individually, as necessary.
Board and committee meetingsThe number of meetings of the Board and its Committees during 2017, and individual attendance by Directors, is set out below.
Board meeting attendance in 2017
Scheduled Total
Number of meetings 6 6
J Clare (resigned 13 June 2017) 3/3 3/3H Scott-Barrett 6/6 6/6L Hutchings (appointed 13 June 2017) 3/3 3/3K Ford (resigned 9 May 2017) 2/2 2/2
C Staveley 6/6 6/6T Hales 6/6 6/6W Hamman 6/6 6/6I Krieger 6/6 6/6L Norval 6/6 6/6G Poitrinal 5/6 5/6L Whyte 6/6 6/6
Other committee meeting attendance
AuditCommittee
Remuneration Committee
Nomination Committee
Responsible Business
Committee
Number of meetings 3 3 2 4J Clare 1/1H Scott-Barrett 1/1 2/2L Hutchings 2/2I Krieger 3 3 1T Hales 3 3 2L Whyte 3 3 2 4
Hugh Scott-Barrett was a member of the Responsible Business Committee until 13 June 2017 when he was replaced by Lawrence Hutchings.
Board evaluationA formal process is undertaken for the annual evaluation of the performance of the Board, its Committees and each Director. This process is led by the Chairman and each Director completes a detailed questionnaire covering:
• performance of themselves as an individual and of the Board together as a unit;
• performance of the Chairman;• processes which underpin the Board’s effectiveness
(including consideration of the balance of skills, experience, independence and knowledge of the persons on the Board);
• strategy; and• performance of the Board’s subcommittees.
The completed questionnaires are collated by the Company Secretary and presented to the Board for a subsequent discussion. This year’s review found that the performance of the Board and its Committees continued to be effective in dealing with both day-to-day and ongoing strategic issues; and that the Board and Committee structure ensured that the governance requirements of the business were met.
The Chairman also meets as necessary, but at least once each year, with the Non-Executive Directors without the Executive Directors present. The Non-Executive Directors meet without the Chairman in order to appraise his performance on an annual basis. This meeting is chaired by the Senior Independent Director. The Chairman evaluates the performance of the Chief Executive having received input from the other Directors. The Chief Executive evaluates the performance of the other Executive Directors. Subsequently, the results are discussed by the Remuneration Committee and relevant consequential changes are made if required.
Shareholder relationsThe Company encourages regular dialogue with its shareholders at the AGM, corporate functions and property visits. The Company also attends road shows, participates in sector conferences and, following the announcement of final and interim results, and throughout the year, as requested, holds update meetings with institutional investors. All the Directors are accessible to all shareholders, and queries received verbally or in writing are addressed as soon as possible.
Announcements are made to the London Stock Exchange, the Johannesburg Stock Exchange and the business media concerning business developments to provide wider dissemination of information. Registered shareholders are sent copies of the annual report and relevant circulars. The Group’s website (capreg.com) is kept up to date with all announcements, reports and shareholder circulars.
Financial and Business reportingPlease refer to:
• page 65 for the Board’s statement on the Annual report and accounts being fair, balanced and understandable;
• page 30 for the statement on the status of the Company and the Group as a going concern; and
• the Strategic report on pages 2 to 35 for an explanation of the Company’s business model and the strategy for delivering the objectives of the Company.
Risk management and internal control The Board is responsible for maintaining a sound system of internal control and risk management. Such a system is designed to manage, but not eliminate, the risk of failure to achieve business objectives. There are inherent limitations in any control system and, accordingly, even the most effective system can provide only reasonable, and not absolute, assurance.
An ongoing process is in place for identifying, evaluating and managing risk and the Board is satisfied that this accords with relevant corporate governance guidance. Key features of the Group’s system of internal control are as follows:
• Defined organisational responsibilities and authority limits. The day-to-day involvement of the Executive Directors in the running of the business ensures that these responsibilities and limits are adhered to;
• Financial and operating reporting to the Board including the preparation of budgets and forecasts, cash management, variance analysis, property, taxation and treasury reports and a report on financing. Year end and Interim financial statements are reviewed by the Audit Committee and discussed with the Group’s Auditor, Deloitte, before being submitted to the Board for approval;
• Review and approval of the Group’s risk matrix twice a year by senior management, the Audit Committee and the Board as detailed in the Managing Risk section of the Strategic Report;
• Anti-bribery and Corruption policies which are communicated to all staff and for which compliance reviews are conducted on an annual basis; and
• The Group’s whistleblowing policy – see the Audit Committee report for further details.
Steps are continuously being taken to embed internal control and risk management further into the operations of the business and to deal with areas of improvement which come to management’s and the Board’s attention.
During the year the Board through the Audit Committee reviewed the effectiveness of the material financial, operational and compliance controls that mitigate the key risks (as disclosed in the Managing Risk section). This review concluded that all such material controls were operating effectively. A statement of the Directors’ responsibilities regarding the financial statements is on page 65.
CORPORATE GOVERNANCE REPORTCONTINUED
capreg.com Stock Code: CAL capreg.com
GOVERNANCE
41
Capital & Regional AR2017 Governance.indd 41 10/04/2018 16:05:25

Capital & Regional plc Annual Report and Accounts for the year ended 30 December 2017
Nomination CommitteeThe Nomination Committee meets as required to select and recommend to the Board suitable candidates for both Executive and on-Executiveappointments.Onanatleastannualbasis,the Nomination Committee also considers succession planning for the Board.
In the second half of 2016 the Committee, arising from its annual review of succession planning, commenced the search for a new Chief Executive and Chairman. This process culminated in the announcement on 8 February 2017 that, effective from 13 June 2017, Lawrence Hutchings would be appointed as Chief Executive with Hugh Scott-Barrett taking over as Non-Executive Chairman from John Clare who would retire from the Board. The appointment of Lawrence Hutchings followed an extensive and competitive process, which was supported by a leading independent executive search firm which is not connected with the Company in any other way.
While fully cognisant of the UK Code of Corporate Governance recommendations, it was the unanimous conclusion of the Committee that in the specific circumstances, Hugh Scott-Barrett was the most appropriate candidate for the role of Non-Executive Chairman. The Committee and wider Board considered that the need for experience and continuity at the current stage of the Company’s development was critical given the retirement of John Clare, the loss of Mark Bourgeois and the planned stepping down of Ken Ford in relatively quick succession. This, combined with Hugh’s important relationships and excellent attributes for the position, meant the Board concluded that Hugh’s appointment would be strongly in the interests of the Company and its shareholders.
Tony Hales, who led the process as Senior Independent Director (SID), also conducted a consultation with major shareholders prior to the Board approving the appointments and this continued subsequent to the announcement. From this process the Board noted the governance points raised by some shareholders and the requirement for the SID to ensure, on behalf of the Board, the constructive and appropriate relationshipbetweenChairmanandCEO.Reflectingthisduringthe first year of the new arrangements the SID has been meeting at least quarterly with both individuals. Tony Hales and the rest of the Board, to whom Tony has reported on the process, are satisfied the relationship is working appropriately and effectively for the benefit of the Company and its shareholders. Tony has also maintained a dialogue with major shareholders to update them on the processes and reviews that have been undertaken.
DiversityThe Nomination Committee, and the Board, recognises the importance of diversity, is supportive of the Davies Report recommendations and seeks to ensure that all available suitable candidates are taken into account when drawing up shortlists of candidates for possible appointments. The priority of the Committee and the Board is to ensure that the Group continues to have the strongest and most effective Board possible, and therefore all appointments to the Board are made on merit against objective criteria.
Whilst the Group falls below the current threshold for reporting under the Gender Pay Gap Regulations a review is in process to understand the Group’s position and, if any issues are identified, to determine the actions required to appropriately address them.
AUDIT COMMITTEE REPORTCORPORATE GOVERNANCE REPORTCONTINUED
Stock Code: CAL capreg.com Stock Code: CAL
42
Capital & Regional AR2017 Governance.indd 42 10/04/2018 16:05:25

The Audit Committee is chaired by Ian Krieger, a Chartered Accountant who has recent and relevant financial experience as required by the Code. The other members of the Committee are Tony Hales and Laura Whyte. Charles Staveley, the Group Finance Director, attended each of the three Audit Committee meetings by invitation as did other senior members of Finance and representatives from Deloitte LLP, the Company’s external Auditor. The Company’s Chairman and Chief Executive also attended meetings during the year by invitation.
ResponsibilitiesThe Committee’s role is to assist the Board in discharging its duties and responsibilities for financial reporting, internal control and the appointment and remuneration of an independent external Auditor. The Committee is responsible for reviewing the scope and results of audit work and its cost effectiveness, the independence and objectivity of the Auditor and the Group’s arrangements on whistleblowing.
Report on the Committee’s activities during the yearThe Committee has a schedule of events which detail the issues to be discussed at each of the meetings of the Committee in the year. The schedule also allows for new items to be included into the agenda of any of the meetings.
During the year, the Committee met three times and discharged its responsibilities by:
a. reviewing the Group’s draft annual report and financial statements and its interim results statement prior to discussion and approval by the Board;
b. reviewing the continuing appropriateness of the Group’s accounting policies;c. reviewing Deloitte LLP’s plan for the 2017 Group audit and approving their terms of
engagement and proposed fees;d. reviewing reports on internal control matters prepared by management; e. considering the effectiveness and independence of Deloitte LLP as external Auditor
and recommending to the Board their reappointment; f. reviewing management’s biannual Risk Review report and the effectiveness of
the material financial, operational and compliance controls that help mitigate the key risks;
g. reviewing the effectiveness of the Group’s whistleblowing policy;h. reviewing and updating the Group’s policy for the award of non-audit work to its
external Auditor; i. considering management’s approach to the viability statement in the 2017 Annual
Report;j. meeting with the responsible individuals from the Group’s independent valuers,
CBRE Limited and Knight Frank LLP to review and challenge their valuations of the Group’s investment properties; and
k. carrying out an annual performance evaluation exercise and noting the satisfactory operation of the Committee.
The Audit Committee has reviewed the contents of this year’s annual report and accounts and advised the Board that, in its view, the report is fair, balanced and understandable and provides the information necessary for shareholders to assess the Group’s performance, business model and strategy.
DiversityThe Nomination Committee, and the Board, recognises the importance of diversity, is supportive of the Davies Report recommendations and seeks to ensure that all available suitable candidates are taken into account when drawing up shortlists of candidates for possible appointments. The priority of the Committee and the Board is to ensure that the Group continues to have the strongest and most effective Board possible, and therefore all appointments to the Board are made on merit against objective criteria.
Whilst the Group falls below the current threshold for reporting under the Gender Pay Gap Regulations a review is in process to understand the Group’s position and, if any issues are identified, to determine the actions required to appropriately address them.
Ian KriegerChairman of Audit Committee
AUDIT COMMITTEE REPORTCORPORATE GOVERNANCE REPORTCONTINUED
capreg.com Stock Code: CAL capreg.com
GOVERNANCE
43
Capital & Regional AR2017 Governance.indd 43 10/04/2018 16:05:25

Capital & Regional plc Annual Report and Accounts for the year ended 30 December 2017
Significant issues considered in relation to the financial statementsDuring the year, the Committee considered key accounting matters and judgements in respect of the financial statements relating to:
• Investment property valuation – At 30 December 2017 the value of the Group’s investment property assets was £915.2 million including its 20% share of the Kingfisher Centre, Redditch (see Note 10b of the financial statements for further details). The valuation of investment property is inherently judgemental and involves a reliance on the work of independent professional qualified valuers. During 2017 the Audit Committee met with the valuers, considered their independence and qualifications and reviewed and challenged the valuations for both the year end and interim results dates to understand the basis for them and the rationale for movements in the context of both the individual properties and the general property investment market.
• Going concern and covenant compliance – The Committee reviewed, challenged and concluded upon the Group’s going concern review and consideration of its viability statement including giving due consideration to the appropriateness of key judgements, assumptions and estimates underlying the budgets and projections that underpin the review and a review of compliance with key financial covenants.
• Impairment of inter-company investments and receivables – Management perform an annual review of inter-company investments and receivables to determine the values to be maintained in the Plc Company only and individual subsidiary balance sheets. The Committee considered the movement over the year and the key assumptions, particularly where balances were held with reference to value in use as opposed to net assets of the underlying entity.
Oversight of the external AuditorThe Committee carried out a review of the effectiveness of the external audit process and considered the reappointment of Deloitte LLP. The review covered amongst other factors, the quality of the staff, the expertise, the resources, and the independence of Deloitte LLP. The Committee reviews the audit plan for the year and subsequently considers how the Auditor performed to the plan. They consider the quality of written and oral presentations and the overall performance of the lead audit partner.
The Audit Committee is also responsible for reviewing the cost-effectiveness and the volume of non-audit services provided to the Group by its external Auditor. The Group does not impose an automatic ban on the Group’s external Auditor undertaking non-audit work, other than for those services that are prohibited by regulatory guidance. Instead the Group’s aim is always to have any non-audit work involving the Group’s external Auditor carried out in a manner that affords value for money and ensures independence is maintained by monitoring this on a case by case basis.
The Group’s policy on the use of its external Auditor for non-audit services, which was reviewed during the year, precludes the external Auditor from being engaged to perform valuation work, accounting services or any recruitment services or secondments. The policy also stipulates that for any piece of work likely to exceed £20,000 at least one other alternative firm provide a proposal for consideration.
The only fees paid to Deloitte LLP during 2016, other than for their year-end audit, was £40,528 for their review of the Group’s interim statements for the six months to June 2017 and £2,000 for an agreed upon procedures report to verify information relating to the vesting of the Company’s 2014 LTIP scheme award.
Auditor rotation and tender processIn accordance with best practice and professional standards, the external Auditor is required to adhere to a rotation policy whereby the audit engagement partner is rotated at least every five years. The 2017 audit was the fifth and final year of Georgina Robb’s tenure as lead audit engagement partner. Matthew Hall has been selected to take over from Georgina Robb as the lead audit engagement partner for Deloitte.
Deloitte LLP have been Auditor of Capital & Regional plc since 1998 and the audit was last put out to tender in 2009 where Deloitte were reappointed. Considering this and the Committee’s commitment to put the audit out to tender at least every 10 years, a tender process will commence during 2018 for the audit of the year ending 30 December 2018. It is planned that Deloitte LLP, who under EU guidance for mandatory Auditor rotation can serve as Auditor until the year ending 30 December 2023, will be invited to tender along with two further firms.
Internal AuditThe Group does not have a dedicated stand-alone internal audit function but manages an ongoing process of control reviews performed either by staff, independent of the specific area being reviewed, or by external consultants when deemed appropriate. During the year the Committee reviewed reports on Payroll, adherence to the Group’s Travel and Expenses policy, Cyber Security, Fire Risk and the Group’s policies to manage compliance with the Market Abuse Regulation.
While the Committee will continue to review the position at present it continues to believe that the current size and complexity of the Group does not justify establishing a stand-alone internal audit function.
WhistleblowingThe Group has in place a whistleblowing policy which encourages employees to report any malpractice or illegal acts or omissions or matters of similar concern by other employees or former employees, contractors, suppliers or advisers. The policy provides a mechanism to report any ethical wrongdoing or malpractice or suspicion thereof.
Ian KriegerChairman of Audit Committee
DIRECTORS’ REMUNERATION REPORTINTRODUCTION
AUDIT COMMITTEE REPORTCONTINUED
Stock Code: CAL capreg.com Stock Code: CAL
44
Capital & Regional AR2017 Governance.indd 44 10/04/2018 16:05:25

Information not subject to audit:Annual StatementDear Shareholder
OnbehalfoftheBoardIampleasedtopresenttheDirectors’RemunerationReportforthe year ended 30 December 2017.
We last presented our remuneration policy to shareholders at our Annual General Meeting in 2016 when we received strong support with a vote in favour of 89.5%. This policy covers the three year period until the AGM in 2019 and we applied it consistently during 2017.
Board ChangesAs shareholders will be aware, there were significant Board changes during the year. Ken Ford stepped down from the Board as an Executive Director on 9 May 2017 and on 13 June 2017, John Clare stepped down from his position of Non-Executive Chairman. Also on 13 June 2017, Hugh Scott-Barrett ceased to be the Chief Executive and took on the role as Non-Executive Chairman. Hugh was succeeded as Chief Executive by Lawrence Hutchings. These changes obviously impacted the remuneration of the individuals concerned, however, the Committee ensured that remuneration packages were in line with the policy agreed by shareholders.
No exit payments were made to any of the individuals. Ken Ford continued to be employed by the Company on a full-time basis until 31 December 2017 on the same terms as he was employed as a Director. Hugh Scott-Barrett’s appointment as Chairman was on a fixed fee of £135,000 per annum. Hugh did not receive a bonus or LTIP award for 2017, for the period he was Chief Executive. For the purposes of the LTIP Hugh Scott-Barrett and Ken Ford were treated as good leavers with their awards pro-rated relevant to the date of change of role and ceasing to be employed respectively.
The committee was pleased to welcome Lawrence as Chief Executive. His remuneration terms are in line with our policy and are fully disclosed in the report.
Company Performance and Bonus Targets2017 was another good year of operational performance by the business with the Company recording Adjusted Profit growth of 8.6%, an increase of 7.3% on a per share basis. The Company’s strategy continues to focus on strong earnings driving a sustainable and growing dividend for shareholders, and this goal also drives the remuneration policy. For the full year for 2017 shareholders will benefit from an increase in dividend of 7.4%, subject to approval at the AGM.
In setting annual bonus targets the Committee puts a weighting of 80% on Company financial and operating targets with the emphasis on metrics that support dividend growth including Adjusted Profit, Net Rental Income and cost control. 20% of bonus reflects personal objectives. Further detail is provided in the report.
The only fees paid to Deloitte LLP during 2016, other than for their year-end audit, was £40,528 for their review of the Group’s interim statements for the six months to June 2017 and £2,000 for an agreed upon procedures report to verify information relating to the vesting of the Company’s 2014 LTIP scheme award.
Auditor rotation and tender processIn accordance with best practice and professional standards, the external Auditor is required to adhere to a rotation policy whereby the audit engagement partner is rotated at least every five years. The 2017 audit was the fifth and final year of Georgina Robb’s tenure as lead audit engagement partner. Matthew Hall has been selected to take over from Georgina Robb as the lead audit engagement partner for Deloitte.
Deloitte LLP have been Auditor of Capital & Regional plc since 1998 and the audit was last put out to tender in 2009 where Deloitte were reappointed. Considering this and the Committee’s commitment to put the audit out to tender at least every 10 years, a tender process will commence during 2018 for the audit of the year ending 30 December 2018. It is planned that Deloitte LLP, who under EU guidance for mandatory Auditor rotation can serve as Auditor until the year ending 30 December 2023, will be invited to tender along with two further firms.
Internal AuditThe Group does not have a dedicated stand-alone internal audit function but manages an ongoing process of control reviews performed either by staff, independent of the specific area being reviewed, or by external consultants when deemed appropriate. During the year the Committee reviewed reports on Payroll, adherence to the Group’s Travel and Expenses policy, Cyber Security, Fire Risk and the Group’s policies to manage compliance with the Market Abuse Regulation.
While the Committee will continue to review the position at present it continues to believe that the current size and complexity of the Group does not justify establishing a stand-alone internal audit function.
WhistleblowingThe Group has in place a whistleblowing policy which encourages employees to report any malpractice or illegal acts or omissions or matters of similar concern by other employees or former employees, contractors, suppliers or advisers. The policy provides a mechanism to report any ethical wrongdoing or malpractice or suspicion thereof.
Ian KriegerChairman of Audit Committee
DIRECTORS’ REMUNERATION REPORTINTRODUCTION
Tony Hales CBEChairman of Remuneration Committee
AUDIT COMMITTEE REPORTCONTINUED
capreg.com Stock Code: CAL capreg.com
GOVERNANCE
45
Capital & Regional AR2017 Governance.indd 45 10/04/2018 16:05:26

Capital & Regional plc Annual Report and Accounts for the year ended 30 December 2017
Directors’ Remuneration PolicyThis part of the report has been prepared in accordance with the provisions of the Companies Act 2006 and Schedule 8 of the Largeand Medium-sized Companies and Groups (Accounts and Reports) (Amendment) Regulations 2013 (“the Act”).
The Remuneration CommitteeThe Committee met three times during 2017 as well as holding informal meetings and other correspondence to discuss wider remuneration issues. In addition to the Committee members (see page 39), the Chief Executive and other Non-Executive Directors are invited to attend meetings as required, except in circumstances where their own remuneration is being discussed.
The Remuneration Committee agrees the framework for the remuneration of the Chairman and the Executive Directors. The Committee approves salaries and sets the levels, conditions and performance objectives for the annual bonus and share awards forExecutive Directors. It also makes recommendations to the Board on matters which require shareholder approval.
The Committee use independent remuneration consultants PwC to provide advice on an ad hoc basis although no fees were charged for 2017.
The terms of reference of the Committee are available at www.capreg.com/about-us/people/board-committees
Summary of performance and remuneration year ended 30 December 20172017 2016
Net Rental Income1 £51.6m £50.4mAdjusted Profit2 £29.1m £26.8mAdjusted Earnings per share2 4.10p 3.82pIFRS Profit/(loss) for the period £22.4m £(4.4)mTotal dividend per share 3.64p 3.39p
Net Asset Value (NAV) per share 67p 68pEPRA NAV per share 67p 68p
Group net debt3 £404.0m £398.1mNet debt to property value3 46% 46%
1. Wholly-owned assets.
2. Adjusted Profit is as defined in the Glossary. It incorporates profits from operating activities and excludes revaluation of properties and financial instruments, gains or losses on disposal, exceptional items and other defined terms. A reconciliation of this, and Adjusted Earnings per share, to the statutory result is provided in the Financial Review. EPRA figures and a reconciliation to EPRA EPS are shown in Note 9 to the Financial Statements. The EPRA measures used throughout this report are industry best practice performance measures established by the European Public Real Estate Association. They are defined in the Glossary to the Financial Statements.
3. 2016 figures are proforma, adjusted for the refinancing of Mall assets completed on 4 January 2017, Ipswich disposal completed on 17 February 2017 and Ilford acquisition completed on 8 March 2017.
Long Term Incentive Plan (LTIP)During the year the performance period for the 2014 LTIP award ended and 35.26% of the awards have qualified for vesting and will be able to be exercised at the end of the holding period. This is the second LTIP award to have qualified since the scheme was introduced in 2008 and the result reflects a strong period of performance where Total Shareholder Return was 37.61%, significantly outperforming the FTSE 350 Real Estate and FTSE All Share Indices. We intend to make a further LTIP award in 2018 using the same structure as previous awards. Full details are provided within the report.
During 2018 we plan to perform a review of all of our incentive arrangements to ensure alignment with the Group’s strategy and that, as a package, they continue to provide the appropriate balance of incentivisation and challenge. The results of this will help inform the process for renewing our Remuneration Policy ahead of the 2019 AGM for which we will conduct a shareholder consultation in advance of publishing any changes to policy.
Executive Director Salary IncreasesExecutive Director salary increases, applied from 1 January 2018, were 2%, in line with the increase awarded to all employees. The same 2% increase has been applied to the base fees paid to the Chairman and Non-Executive Directors.
Committee AimsOuraimasaCommitteecontinuestobetoensurewerecruitand retain talented individuals who are motivated to deliver outperformance for shareholders receiving a fair base pay with potential for significant rewards on delivering strong shareholder returns.
Tony Hales CBEChairman of Remuneration Committee
DIRECTORS’ REMUNERATION REPORTPOLICY
DIRECTORS’ REMUNERATION REPORTCONTINUED
Stock Code: CAL capreg.com Stock Code: CAL
46
Capital & Regional AR2017 Governance.indd 46 10/04/2018 16:05:26

Directors’ Remuneration PolicyThis part of the report has been prepared in accordance with the provisions of the Companies Act 2006 and Schedule 8 of the Largeand Medium-sized Companies and Groups (Accounts and Reports) (Amendment) Regulations 2013 (“the Act”).
The Remuneration CommitteeThe Committee met three times during 2017 as well as holding informal meetings and other correspondence to discuss wider remuneration issues. In addition to the Committee members (see page 39), the Chief Executive and other Non-Executive Directors are invited to attend meetings as required, except in circumstances where their own remuneration is being discussed.
The Remuneration Committee agrees the framework for the remuneration of the Chairman and the Executive Directors. The Committee approves salaries and sets the levels, conditions and performance objectives for the annual bonus and share awards forExecutive Directors. It also makes recommendations to the Board on matters which require shareholder approval.
The Committee use independent remuneration consultants PwC to provide advice on an ad hoc basis although no fees were charged for 2017.
The terms of reference of the Committee are available at www.capreg.com/about-us/people/board-committees
Summary of performance and remuneration year ended 30 December 20172017 2016
Net Rental Income1 £51.6m £50.4mAdjusted Profit2 £29.1m £26.8mAdjusted Earnings per share2 4.10p 3.82pIFRS Profit/(loss) for the period £22.4m £(4.4)mTotal dividend per share 3.64p 3.39p
Net Asset Value (NAV) per share 67p 68pEPRA NAV per share 67p 68p
Group net debt3 £404.0m £398.1mNet debt to property value3 46% 46%
1. Wholly-owned assets.
2. Adjusted Profit is as defined in the Glossary. It incorporates profits from operating activities and excludes revaluation of properties and financial instruments, gains or losses on disposal, exceptional items and other defined terms. A reconciliation of this, and Adjusted Earnings per share, to the statutory result is provided in the Financial Review. EPRA figures and a reconciliation to EPRA EPS are shown in Note 9 to the Financial Statements. The EPRA measures used throughout this report are industry best practice performance measures established by the European Public Real Estate Association. They are defined in the Glossary to the Financial Statements.
3. 2016 figures are proforma, adjusted for the refinancing of Mall assets completed on 4 January 2017, Ipswich disposal completed on 17 February 2017 and Ilford acquisition completed on 8 March 2017.
DIRECTORS’ REMUNERATION REPORTPOLICY
DIRECTORS’ REMUNERATION REPORTCONTINUED
capreg.com Stock Code: CAL capreg.com
GOVERNANCE
47
Capital & Regional AR2017 Governance.indd 47 10/04/2018 16:05:26

Capital & Regional plc Annual Report and Accounts for the year ended 30 December 2017
Purpose & link to strategy Operation Opportunity Performance metrics
Base salary
Median
• To aid recruitment,retention and motivation of high quality people
• To reflect experience and importance of role
Reviewed annually effective 1 January to reflect:
• general increases throughout the Company or changes in responsibility or role; and
• benchmarking against comparator group to ensure salaries are about the median level and market competitive.
n/a n/a
Pension
Median
• To help recruit and retain high quality people
• To provide an appropriatemarketcompetitiveretirement benefit
The Company does not operate a pension scheme, all pension benefits are paid either to defined contribution pensions schemes of each Executive Director’s choice or as a cash supplement.
From appointment in June 2017, Lawrence Hutchings received an allowance of 15% of basic salary, in line with other Executive Directors.
n/a n/a
Benefits
Median
• To aid recruitment and retention
• To provide market competitivebenefits
The Company offers a package to Executive Directors including:
• private medical insurance;
• critical illness cover;
• life insurance;
• permanent health insurance; and
• holiday and sick pay.
Benefits are brokered and reviewed annually.
n/a n/a
Annual bonus
Median or above
• To incentivise delivery of short-termbusiness targets and individual objectives based on annual KPIs
• To recognise performance whilst controlling costs in reaction to the market context or Company events
The bonus plan is reviewed annually to ensure bonus opportunity, performance measures and weightings are appropriate and support the stated Company strategy.
Deferral applies such that bonus in excess of 60% of maximum for Executive Directors (50% for the Chief Executive) will be deferred for two years and then converted into shares. At the end of the deferral period an additional payment equivalent to the dividends that would have been earned on the shares will be made.
Malus applies to any bonus award up to the date of determination. Clawback provisions apply to the element of any bonus that is deferred into shares for two years from the date of award.
Maximum bonus is 125% of basic salary for Executive Directors/150% for Chief Executive
Targets calibrated so maximum pay-out would represent exceptionalperformance
Measures and weightings may vary from year to year depending on strategic priorities.
2017 objectives were weighted at 80% onGroupObjectivesand20 onIndividual objectives. 2018 objectives will have the same split.
Remuneration philosophy and principlesOurprinciplescontinuetobetomaintainacompetitiveremunerationpackagethatwillattract,retainandmotivateahigh ualityteam,avoid excessive or inappropriate risk taking and align their interests with those of shareholders. These principles are designed to:
• Drive accountability and responsibility; • Provide a balanced range of incentives which align both short-term and long-term performance with the value/returns delivered
to shareholders;• Apply demanding performance conditions to deliver sustainable high performance; setting these conditions with due regard to
actual and expected market conditions and business context;• Ensure that a large part of potential remuneration is delivered in shares in order that executives are expected to build up a
shareholding themselves and therefore they are directly exposed to the same gains or losses as all other shareholders;• Take account of the remuneration of other comparator companies of similar size, scope and complexity within our industry
sector;• Keep under review the relationship of remuneration to risk, the members of the Remuneration Committee are also that of the
Audit Committee; and• Ensure that the incentive structure does not raise any environmental, social or governance risks through compliance with our
Responsible Business ethics and standards of operating.
How the Committee sets remuneration
Salary Fixed compensation Median
Total = Median or above for above Median performance
Pension
Benefits
Bonus Performance basedcompensation
Median or above for above Median performanceShare Awards
The Committee benchmarks remuneration against our selected comparator group companies (see page 51) and seeks to ensure that Directors’ fixed compensation is around the median in the comparator group.
The Committee view is that by putting an emphasis on performance related compensation, executives are encouraged to perform to the highest of their abilities. The performance based compensation is targeted to be at median or above, for above median performance, within the comparator group to ensure that outstanding relative performance is appropriately rewarded. The overalleffect is that our total compensation is at median or above, for above median performance.
DIRECTORS’ REMUNERATION REPORTPOLICY
Stock Code: CAL capreg.com Stock Code: CAL
48
Capital & Regional AR2017 Governance.indd 48 10/04/2018 16:05:26

Purpose & link to strategy Operation Opportunity Performance metrics
Base salary
Median
• To aid recruitment,retention and motivation of high quality people
• To reflect experience and importance of role
Reviewed annually effective 1 January to reflect:
• general increases throughout the Company or changes in responsibility or role; and
• benchmarking against comparator group to ensure salaries are about the median level and market competitive.
n/a n/a
Pension
Median
• To help recruit and retain high quality people
• To provide an appropriatemarketcompetitiveretirement benefit
The Company does not operate a pension scheme, all pension benefits are paid either to defined contribution pensions schemes of each Executive Director’s choice or as a cash supplement.
From appointment in June 2017, Lawrence Hutchings received an allowance of 15% of basic salary, in line with other Executive Directors.
n/a n/a
Benefits
Median
• To aid recruitment and retention
• To provide market competitivebenefits
The Company offers a package to Executive Directors including:
• private medical insurance;
• critical illness cover;
• life insurance;
• permanent health insurance; and
• holiday and sick pay.
Benefits are brokered and reviewed annually.
n/a n/a
Annual bonus
Median or above
• To incentivise delivery of short-termbusiness targets and individual objectives based on annual KPIs
• To recognise performance whilst controlling costs in reaction to the market context or Company events
The bonus plan is reviewed annually to ensure bonus opportunity, performance measures and weightings are appropriate and support the stated Company strategy.
Deferral applies such that bonus in excess of 60% of maximum for Executive Directors (50% for the Chief Executive) will be deferred for two years and then converted into shares. At the end of the deferral period an additional payment equivalent to the dividends that would have been earned on the shares will be made.
Malus applies to any bonus award up to the date of determination. Clawback provisions apply to the element of any bonus that is deferred into shares for two years from the date of award.
Maximum bonus is 125% of basic salary for Executive Directors/150% for Chief Executive
Targets calibrated so maximum pay-out would represent exceptionalperformance
Measures and weightings may vary from year to year depending on strategic priorities.
2017 objectives were weighted at 80% onGroupObjectivesand20 onIndividual objectives. 2018 objectives will have the same split.
Remuneration philosophy and principlesOurprinciplescontinuetobetomaintainacompetitiveremunerationpackagethatwillattract,retainandmotivateahigh ualityteam,avoid excessive or inappropriate risk taking and align their interests with those of shareholders. These principles are designed to:
• Drive accountability and responsibility; • Provide a balanced range of incentives which align both short-term and long-term performance with the value/returns delivered
to shareholders;• Apply demanding performance conditions to deliver sustainable high performance; setting these conditions with due regard to
actual and expected market conditions and business context;• Ensure that a large part of potential remuneration is delivered in shares in order that executives are expected to build up a
shareholding themselves and therefore they are directly exposed to the same gains or losses as all other shareholders;• Take account of the remuneration of other comparator companies of similar size, scope and complexity within our industry
sector;• Keep under review the relationship of remuneration to risk, the members of the Remuneration Committee are also that of the
Audit Committee; and• Ensure that the incentive structure does not raise any environmental, social or governance risks through compliance with our
Responsible Business ethics and standards of operating.
How the Committee sets remuneration
Salary Fixed compensation Median
Total = Median or above for above Median performance
Pension
Benefits
Bonus Performance basedcompensation
Median or above for above Median performanceShare Awards
The Committee benchmarks remuneration against our selected comparator group companies (see page 51) and seeks to ensure that Directors’ fixed compensation is around the median in the comparator group.
The Committee view is that by putting an emphasis on performance related compensation, executives are encouraged to perform to the highest of their abilities. The performance based compensation is targeted to be at median or above, for above median performance, within the comparator group to ensure that outstanding relative performance is appropriately rewarded. The overalleffect is that our total compensation is at median or above, for above median performance.
DIRECTORS’ REMUNERATION REPORTPOLICY
capreg.com Stock Code: CAL capreg.com
GOVERNANCE
49
Capital & Regional AR2017 Governance.indd 49 10/04/2018 16:05:26

Capital & Regional plc Annual Report and Accounts for the year ended 30 December 2017
Employee ContextThe Committee ensures that employees’ remuneration across the Company is taken into consideration when reviewing executive remuneration policy although no direct consultation is performed. The Committee reviews internal data in relation to staff remuneration and is satisfied that the level is appropriate.
Comparator groupIn the review of Remuneration Policy that the Company undertook with assistance from PwC in 2016 the below comparator group was used. The relative size of Capital & Regional in comparison to the constituents was factored into the benchmarking exerciseperformed. In addition to the Companies listed below consideration was also given to the upper quartile benchmarks for the FTSESmall Cap.
The comparator group is used as a guide to set parameters and in this context is only one of a number of factors taken into accountwhen determining the level and elements of remuneration policy.
• A & J Mucklow Group Plc • Assura plc • Big Yellow Group Plc • Capital & Counties Properties Plc • Countrywide Plc • Derwent London Plc• Foxtons Group Plc • Grainger Plc • Great Portland Estates Plc
• Hammerson Plc • Hansteen Holdings Plc • Helical Bar Plc • Intu Properties Plc • Landsec Group Plc• London & Associated Properties Plc• LondonMetric Property Plc• LSL Property Services Plc• McKay Securities Plc
• Safestore Holdings Plc• Savills Plc• Segro Plc• Shaftesbury Plc• St. Modwen Properties Plc• The British Land Company Plc• U and I Group PLC • Unite Group Plc• Workspace Group Plc
Directors’ service agreements and letters of appointment
NameUnexpired term of appointment Date of service agreement Notice period
Potential termination payment
Executive Directors
L Hutchings Rolling contract 13 June 2017 12 months 12 months’ salary and benefits value
C Staveley Rolling contract 1October200 12 months 12 months’ salary and benefits value
Non-Executive Directors Date of initial appointmentH Scott-Barrett Rolling contract 9 March 20081 6 months NoneL Norval Rolling contract 15 September 2009 No notice NoneT Hales Rolling contract 1 August 2011 No notice NoneI Krieger Rolling contract 1 December 2014 No notice NoneW Hamman Rolling contract 2 June 2015 No notice NoneL Whyte Rolling contract 1 December 2015 No notice NoneG Poitrinal Rolling contract 1 November 2016 No Notice None
1. Hugh Scott-Barrett’s contract was amended on 13 June 2017 when he ceased to be Chief Executive and became the Non-Executive Chairman.
Non-Executive Directors are all appointed on rolling contracts with no notice period save for Hugh Scott-Barrett who as Chairmanhas a six month notice period. All Directors stand for re-election annually and Board appointments automatically terminate in theevent of a Director not being re-elected by shareholders. Copies of the Directors’ service agreements are available to view, uponappointment, at the Company’s registered office.
Purpose & link to strategy Operation Opportunity Performance metrics
LTIP
Median or above
• To reinforce delivery of long-term business strategy and targets
• To align participantswithshareholders’interests
• To retain Directors and senior team over the longer term
Awards are based on achieving specified targets over a three year performance period.
An adjustment of the awards may be made in the event of a capital raising or any other event that would have a dilutory impact.
In the event of a liquidity event the Committee will pro-rate awards for performance and will normally pro-rate for time although it has the discretion not to.
A holding period applies after the end oftheperformanceperiod.Onexercise,individuals will receive an additional payment equivalent to dividends paid on shares that have qualified for vesting during the holding period.
Malus and Clawback provisions apply such that the Committee have the discretion to reduce or cancel any awards that have not been exercised, in any of the following situations:
• C&R’s financial statements or results being negatively restated due to the Executive’s behaviour;
• A participant having deliberately misled management or the market regarding Company performance;
• A participant causing significant damage to the Company; or
• A participant’s actions amounting to serious / gross misconduct.
The plan provides annual awards of shares of up to 150% of salary for Executive Directors/200% for the Chief Executive.
Performance measures apply over a three year period from the date of grant.
Details of the performance conditions on existing awards and those proposed for an issue in 2018 are on pages 56-57.
Executive shareholding
• To support alignmentof Executive Directors with shareholders
All Executive Directors are expected to build a shareholding to at least 1 × basic annual salary value (2 × for Chief Executive) based on current market value or the aggregate purchase price of the shares.
Deferred or other unvested share awards not subject to performance conditions can count towards the guideline.
n/a n/a
Non-Executive Director fees
Median
• To reflect experience and importance of role
The Chairman and Non-Executive Director fees are set by the Board taking into account the time commitment, responsibilities, skills and experience and roles on Board Committees.
Details of the fees can be found on page 54. Individuals who are members of both the Audit and Remuneration Committees receive an additional fee of £5,000 per annum. The Senior Independent Director receives an additional fee of £5,000 per annum.
n/a n/a
DIRECTORS’ REMUNERATION REPORTPOLICY
Stock Code: CAL capreg.com Stock Code: CAL
50
Capital & Regional AR2017 Governance.indd 50 10/04/2018 16:05:27

Employee ContextThe Committee ensures that employees’ remuneration across the Company is taken into consideration when reviewing executive remuneration policy although no direct consultation is performed. The Committee reviews internal data in relation to staff remuneration and is satisfied that the level is appropriate.
Comparator groupIn the review of Remuneration Policy that the Company undertook with assistance from PwC in 2016 the below comparator group was used. The relative size of Capital & Regional in comparison to the constituents was factored into the benchmarking exerciseperformed. In addition to the Companies listed below consideration was also given to the upper quartile benchmarks for the FTSESmall Cap.
The comparator group is used as a guide to set parameters and in this context is only one of a number of factors taken into accountwhen determining the level and elements of remuneration policy.
• A & J Mucklow Group Plc • Assura plc • Big Yellow Group Plc • Capital & Counties Properties Plc • Countrywide Plc • Derwent London Plc• Foxtons Group Plc • Grainger Plc • Great Portland Estates Plc
• Hammerson Plc • Hansteen Holdings Plc • Helical Bar Plc • Intu Properties Plc • Landsec Group Plc• London & Associated Properties Plc• LondonMetric Property Plc• LSL Property Services Plc• McKay Securities Plc
• Safestore Holdings Plc• Savills Plc• Segro Plc• Shaftesbury Plc• St. Modwen Properties Plc• The British Land Company Plc• U and I Group PLC • Unite Group Plc• Workspace Group Plc
Directors’ service agreements and letters of appointment
NameUnexpired term of appointment Date of service agreement Notice period
Potential termination payment
Executive Directors
L Hutchings Rolling contract 13 June 2017 12 months 12 months’ salary and benefits value
C Staveley Rolling contract 1October200 12 months 12 months’ salary and benefits value
Non-Executive Directors Date of initial appointmentH Scott-Barrett Rolling contract 9 March 20081 6 months NoneL Norval Rolling contract 15 September 2009 No notice NoneT Hales Rolling contract 1 August 2011 No notice NoneI Krieger Rolling contract 1 December 2014 No notice NoneW Hamman Rolling contract 2 June 2015 No notice NoneL Whyte Rolling contract 1 December 2015 No notice NoneG Poitrinal Rolling contract 1 November 2016 No Notice None
1. Hugh Scott-Barrett’s contract was amended on 13 June 2017 when he ceased to be Chief Executive and became the Non-Executive Chairman.
Non-Executive Directors are all appointed on rolling contracts with no notice period save for Hugh Scott-Barrett who as Chairmanhas a six month notice period. All Directors stand for re-election annually and Board appointments automatically terminate in theevent of a Director not being re-elected by shareholders. Copies of the Directors’ service agreements are available to view, uponappointment, at the Company’s registered office.
Purpose & link to strategy Operation Opportunity Performance metrics
LTIP
Median or above
• To reinforce delivery of long-term business strategy and targets
• To align participantswithshareholders’interests
• To retain Directors and senior team over the longer term
Awards are based on achieving specified targets over a three year performance period.
An adjustment of the awards may be made in the event of a capital raising or any other event that would have a dilutory impact.
In the event of a liquidity event the Committee will pro-rate awards for performance and will normally pro-rate for time although it has the discretion not to.
A holding period applies after the end oftheperformanceperiod.Onexercise,individuals will receive an additional payment equivalent to dividends paid on shares that have qualified for vesting during the holding period.
Malus and Clawback provisions apply such that the Committee have the discretion to reduce or cancel any awards that have not been exercised, in any of the following situations:
• C&R’s financial statements or results being negatively restated due to the Executive’s behaviour;
• A participant having deliberately misled management or the market regarding Company performance;
• A participant causing significant damage to the Company; or
• A participant’s actions amounting to serious / gross misconduct.
The plan provides annual awards of shares of up to 150% of salary for Executive Directors/200% for the Chief Executive.
Performance measures apply over a three year period from the date of grant.
Details of the performance conditions on existing awards and those proposed for an issue in 2018 are on pages 56-57.
Executive shareholding
• To support alignmentof Executive Directors with shareholders
All Executive Directors are expected to build a shareholding to at least 1 × basic annual salary value (2 × for Chief Executive) based on current market value or the aggregate purchase price of the shares.
Deferred or other unvested share awards not subject to performance conditions can count towards the guideline.
n/a n/a
Non-Executive Director fees
Median
• To reflect experience and importance of role
The Chairman and Non-Executive Director fees are set by the Board taking into account the time commitment, responsibilities, skills and experience and roles on Board Committees.
Details of the fees can be found on page 54. Individuals who are members of both the Audit and Remuneration Committees receive an additional fee of £5,000 per annum. The Senior Independent Director receives an additional fee of £5,000 per annum.
n/a n/a
DIRECTORS’ REMUNERATION REPORTPOLICY
capreg.com Stock Code: CAL capreg.com
GOVERNANCE
51
Capital & Regional AR2017 Governance.indd 51 10/04/2018 16:05:27

Capital & Regional plc Annual Report and Accounts for the year ended 30 December 2017
All figures in £’000
£2,000
£1,500
£1,000
£500
£0Low
£458
£745
£1,032
£358
£549
£739
Mid Max Low Mid Max
L Hutchings C Staveley
Salary Bonus LTIP Benefits Pension
Consultation and shareholders’ viewsShareholder voting on the Directors’ remuneration report, which was tabled at the 9 May 2017 AGM, was as follows:
Resolution For Against DiscretionaryTotal Shares
VotedFor/Discretionary as
% of Total Shares VotedTo approve the Directors’ remuneration report for 2016 460,364,341 6,479,856 8,218 466,852,415 98.61%
Shareholder voting on the remuneration policy, which was tabled at the 10 May 2016 AGM, was as follows:
Resolution For Against DiscretionaryTotal Shares
VotedFor/Discretionary as
% of Total Shares VotedTo approve the Directors’ remuneration policy 415,895,797 48,741,878 28,702 464,666,377 89.51%
Where requested, further clarification and discussion can be provided to all shareholders to assist them in making an informed voting decision. If any major concerns are raised by shareholders these can be discussed with the Committee Chairman in the firstinstance and the rest of the Committee as appropriate.
Committee evaluationThe Committee reviews its performance with Board members and other participants, including through the annual Board evaluation.
Recruitment of ExecutivesNew Executive Directors will receive a remuneration package that will reflect the Company’s remuneration policy within the parameters outlined. In certain circumstances, such as an internal promotion, an appointment may be at a salary level discount toreflect experience at that point; the Committee may increase it over time on the evidence of performance achievement and marketconditions. All new Executive Directors’ service agreements will include mitigation of the payment of notice as standard.
The maximum level of sign on awards paid to new joiners will be 100% of salary. This excludes amounts paid to buy out individualsfrom existing performance awards. In the event that the Committee proposes to make a significant payment to buy out an individualfrom their existing awards they will first consult with major shareholders. In addition new Directors may receive share awards onjoining although these will not vest in the first year of joining.
Exit payment policy When considering termination payments the Committee takes into account the best interests of the Company and the individual’s circumstances including the reasons for termination, contractual obligations, bonus and LTIP scheme rules. The Remuneration Committee will ensure that there are no unjustified payments for failure on an Executive Director’s termination of employment. Thepolicy in relation to leavers is summarised as follows:
• In normal circumstances the Executive Director will work their notice period and receive usual remuneration payments and benefits during this time. The Remuneration Committee can exercise discretion on the leaver being treated as a good leaver for the purposes of the LTIP scheme.
• In the event of the termination of an Executive Director’s contract and the Company requesting the Executive cease working immediately, either a compensation for loss of office payment will be made or a payment in lieu of notice plus benefits may be made. The value of the compensation for loss of office will be equivalent to the contractual notice period, pension and benefitsvalue.
• The Executive Director may also be considered for a performance related pay award upon termination. The financial performance of the Company and meeting of KPIs and targets is the prime driver for determining whether to make an award and the quantum. The Remuneration Committee can exercise discretion on the leaver being treated as a good leaver for the purposes of a pro rata cash bonus award.
• In the event of termination for gross misconduct neither notice nor payment in lieu of notice will be given and the Executive will cease to perform their services with immediate effect.
The Committee will seek to mitigate the cost to the Company. In the event that the Committee exercises the discretion detailed above to treat an individual as a Good Leaver and/or to make a performance related bonus payment, the Committee will provide anexplanation in the next remuneration report.
External AppointmentsThe Company allows Executive Directors to take up external positions outside the Group, providing they do not involve a significantcommitment and do not cause conflict with their duties to the Company. These appointments can broaden the experience and knowledge of the Director, from which the Company can benefit. Executives are allowed to retain all remuneration arising from anyexternal position. Hugh Scott-Barrett served as a Non-Executive Director of GAM Holding AG and The Goodwood Estate Company Ltd while he was Chief Executive. No other Executive Directors held external positions during the year.
Senior ManagementThe policy for senior management remuneration is set in line with the policy for the Executive Directors, with a degree of discretionfor the Committee to take into account specific issues identified by the Chief Executive, such as the performance of a specificindividual or division.
Total Compensation The following chart shows the value of each of the main elements of the remuneration package for each of the Executive Directorspotentially available in 2018 dependent on performance scenarios:
• The low scenario is based on nil bonus;• The mid scenario is based on bonus at 50% of maximum; and• The max scenario is based on bonus at 125% salary for Executive Directors/150% for Chief Executive.
No LTIP awards are expected to vest during the year as the March 2015 LTIP issue did not qualify for vesting as the performancecriteria, which were assessed over the three year period ending 6 March 2018, were not met.
DIRECTORS’ REMUNERATION REPORTPOLICY
Stock Code: CAL capreg.com Stock Code: CAL
52
Capital & Regional AR2017 Governance.indd 52 10/04/2018 16:05:27

All figures in £’000
£2,000
£1,500
£1,000
£500
£0Low
£458
£745
£1,032
£358
£549
£739
Mid Max Low Mid Max
L Hutchings C Staveley
Salary Bonus LTIP Benefits Pension
Consultation and shareholders’ viewsShareholder voting on the Directors’ remuneration report, which was tabled at the 9 May 2017 AGM, was as follows:
Resolution For Against DiscretionaryTotal Shares
VotedFor/Discretionary as
% of Total Shares VotedTo approve the Directors’ remuneration report for 2016 460,364,341 6,479,856 8,218 466,852,415 98.61%
Shareholder voting on the remuneration policy, which was tabled at the 10 May 2016 AGM, was as follows:
Resolution For Against DiscretionaryTotal Shares
VotedFor/Discretionary as
% of Total Shares VotedTo approve the Directors’ remuneration policy 415,895,797 48,741,878 28,702 464,666,377 89.51%
Where requested, further clarification and discussion can be provided to all shareholders to assist them in making an informed voting decision. If any major concerns are raised by shareholders these can be discussed with the Committee Chairman in the firstinstance and the rest of the Committee as appropriate.
Committee evaluationThe Committee reviews its performance with Board members and other participants, including through the annual Board evaluation.
Recruitment of ExecutivesNew Executive Directors will receive a remuneration package that will reflect the Company’s remuneration policy within the parameters outlined. In certain circumstances, such as an internal promotion, an appointment may be at a salary level discount toreflect experience at that point; the Committee may increase it over time on the evidence of performance achievement and marketconditions. All new Executive Directors’ service agreements will include mitigation of the payment of notice as standard.
The maximum level of sign on awards paid to new joiners will be 100% of salary. This excludes amounts paid to buy out individualsfrom existing performance awards. In the event that the Committee proposes to make a significant payment to buy out an individualfrom their existing awards they will first consult with major shareholders. In addition new Directors may receive share awards onjoining although these will not vest in the first year of joining.
Exit payment policy When considering termination payments the Committee takes into account the best interests of the Company and the individual’s circumstances including the reasons for termination, contractual obligations, bonus and LTIP scheme rules. The Remuneration Committee will ensure that there are no unjustified payments for failure on an Executive Director’s termination of employment. Thepolicy in relation to leavers is summarised as follows:
• In normal circumstances the Executive Director will work their notice period and receive usual remuneration payments and benefits during this time. The Remuneration Committee can exercise discretion on the leaver being treated as a good leaver for the purposes of the LTIP scheme.
• In the event of the termination of an Executive Director’s contract and the Company requesting the Executive cease working immediately, either a compensation for loss of office payment will be made or a payment in lieu of notice plus benefits may be made. The value of the compensation for loss of office will be equivalent to the contractual notice period, pension and benefitsvalue.
• The Executive Director may also be considered for a performance related pay award upon termination. The financial performance of the Company and meeting of KPIs and targets is the prime driver for determining whether to make an award and the quantum. The Remuneration Committee can exercise discretion on the leaver being treated as a good leaver for the purposes of a pro rata cash bonus award.
• In the event of termination for gross misconduct neither notice nor payment in lieu of notice will be given and the Executive will cease to perform their services with immediate effect.
The Committee will seek to mitigate the cost to the Company. In the event that the Committee exercises the discretion detailed above to treat an individual as a Good Leaver and/or to make a performance related bonus payment, the Committee will provide anexplanation in the next remuneration report.
External AppointmentsThe Company allows Executive Directors to take up external positions outside the Group, providing they do not involve a significantcommitment and do not cause conflict with their duties to the Company. These appointments can broaden the experience and knowledge of the Director, from which the Company can benefit. Executives are allowed to retain all remuneration arising from anyexternal position. Hugh Scott-Barrett served as a Non-Executive Director of GAM Holding AG and The Goodwood Estate Company Ltd while he was Chief Executive. No other Executive Directors held external positions during the year.
Senior ManagementThe policy for senior management remuneration is set in line with the policy for the Executive Directors, with a degree of discretionfor the Committee to take into account specific issues identified by the Chief Executive, such as the performance of a specificindividual or division.
Total Compensation The following chart shows the value of each of the main elements of the remuneration package for each of the Executive Directorspotentially available in 2018 dependent on performance scenarios:
• The low scenario is based on nil bonus;• The mid scenario is based on bonus at 50% of maximum; and• The max scenario is based on bonus at 125% salary for Executive Directors/150% for Chief Executive.
No LTIP awards are expected to vest during the year as the March 2015 LTIP issue did not qualify for vesting as the performancecriteria, which were assessed over the three year period ending 6 March 2018, were not met.
DIRECTORS’ REMUNERATION REPORTPOLICY
capreg.com Stock Code: CAL capreg.com
GOVERNANCE
53
Capital & Regional AR2017 Governance.indd 53 10/04/2018 16:05:27

Capital & Regional plc Annual Report and Accounts for the year ended 30 December 2017
Basic salary increases for Executive Directors:2018 2017 2016 2015 2014
£’000 % £’000 % £’000 % £’000 % £’000 %L Hutchings 383 2.0 375 n/a n/a n/a n/a n/a n/a n/aC Staveley 305 2.0 299 2.0 293 2.0 287 2.5 280 –H Scott-Barrett n/a n/a 427 2.0 418 2.0 410 2.5 400 –K Ford n/a n/a 315 2.0 308 2.0 302 2.5 295 –M Bourgeois n/a n/a n/a n/a 241 4.3 231 2.5 225 –
With effect from his start date of 13 June 2017, Lawrence Hutchings’ salary was £375,000 per annum. All other benefits are as perthe Remuneration Policy. In addition he was reimbursed for relocation costs of £8,090. Lawrence’s bonus for 2017 was pro-rated reflecting his start date part way through the year.
Non-Executive Director feesThe same 2% increase awarded to staff members and Executive Directors has been applied to Non-Executive base fees of £40,800 per annum with effect from 1 January 2018. No increase will be applied to the additional £5,000 per annum for being a member ofthe Audit and Remuneration Committees or the additional £5,000 fee per annum paid to the Senior Independent Director.
With effect from his start date of 13 June 2017, Hugh Scott-Barrett’s fixed fee as Chairman was £135,000 per annum. This has alsobeen increased by 2% effective from 1 January 2018.
2017 bonuses and achievement of objectives:Total % of maximum
bonus awarded for 2017
Bonus paid 2017£’000
Maximum achievable£’000
L Hutchings 45% 1481 3281
C Staveley 40% 149 393K Ford 32.5% 128 373
1. The Bonus paid and maximum bonus achievable amounts were both pro-rated from June 2017.
Theannualbonuscriteriafor2017weredeterminedwithaweightingof 0 forGroupObjectives(ofwhich65 relatedtofinancialtargets and 15% on business development) and 20% on personal objectives.
Group Objectives: Financial Targets (65%)
PerformanceMeasure
Threshold Maximum
Actual achieved
(£m)
Payout as % of
max.% of
bonus
Required performance
(£m) % of bonus
Required performance
(£m)
Adjusted Profit1 10 30.4 15 31.9 29.9 –
Adjusted Earnings per share2 10 4.20 15 4.41 4.21 10
Property Level Net Rental Income3 15 55.0 20 56.4 53.7 –
Growth in Net Rental Income3 5 +2.5% 10 +5.0% +2.5% 5
Cost Management (Central Costs) 5 8.4 5 8.4 8.4 5
Notes:
2. The Adjusted Profit and Adjusted Earnings per share targets are adjusted for one-off restructuring/redundancy costs and Directors’ bonuses (including NIC).
3. Property Level NRI is before management fees and on a see-through basis including the Group’s proportional share of joint venture assets.
Audited information:Single total figure of remuneration for Directors:The table below sets out the remuneration received/receivable in relation to the year ended 30 December 2017.
£’000Executive Director
Salary/FeesTaxable
benefits (i)Other
benefitsTotal
Bonus (xi) PensionTotal
emolumentsLTIP
vesting (xii) Total
2017 2016 2017 2016 2017 2016 2017 2016 2017 2016 2017 2016 2017 2016 2017 2016
L Hutchings (ii) 212 – 1 - 4 - 148 - 28 - 393 - - - 393 -H Scott-Barrett (Chief Executive) (iii) 195 418 3 4 10 14 - 439 38 84 246 959 318 1,153 564 2,112C Staveley 299 292 2 2 6 6 149 238 45 44 501 582 152 606 653 1,188K Ford (iv) 113 308 2 4 3 8 46 241 17 46 181 607 160 638 341 1,245M Bourgeois (v) – 201 – 2 – 4 – – – 30 – 237 – – – 237
TOTAL 819 1,219 8 12 23 32 343 918 128 204 1,321 2,385 630 2,397 1,951 4,782Chairman and Non-Executive DirectorsH Scott-Barrett (iii)(Chairman) 75 – – – – – – – – – 75 – – – 75 –J Clare (ix) 56 125 – – – – – – – – 56 125 – – 56 125T Hales (vii) 51 45 – – – – – – – – 51 45 – – 51 45W Hamman 41 40 – – – – – – – – 41 40 – – 41 40I Krieger (vi) 46 45 – – – – – – – – 46 45 – – 46 45P Newton (viii) – 16 – – – – – – – – – 16 – – – 16L Norval 41 40 – – – – – – – – 41 40 – – 41 40G Poitrinal (x) – – – – – – – – – – – – – – – –L Whyte (vi) 46 45 – – – – – – – – 46 45 – – 46 45TOTAL 356 356 – – – – – – – – 356 356 – – 356 356TOTAL ALL 1,175 1,575 8 12 23 32 343 918 128 204 1,677 2,741 630 2,397 2,307 5,138
(i) Private medical care and critical illness cover.
(ii) L Hutchings was appointed a Director on 13 June 2017.
(iii) H Scott-Barrett stepped down as Chief Executive on 13 June 2017 and became Non-Executive Chairman on the same date.
(iv) K Ford stepped down as a Director on 9 May 2017 but continued to be a full-time employee until 31 December 2017. All remuneration figures shown are up to 9 May 2017 with the total bonus paid of £127,803 pro-rated in the above table.
(v) M Bourgeois resigned from the Board on 1 November 2016, all remuneration figures shown up to that date.
(vi) T Hales, I Krieger and L Whyte receive an additional fee of £5,000 per annum as members of the Audit and Remuneration Committees.
(vii) T Hales receives a further fee of £5,000 as Senior Independent Director.
(viii) P Newton resigned on 10 May 2016.
(ix) J Clare resigned on 13 June 2017.
(x) G Poitrinal does not receive a fee or any remuneration.
(xi) In line with policy, bonus payments above 60% of maximum (50% for the Chief Executive) are deferred into shares for two years. There was no deferral in 2017. The split of the 2016 bonus was as follows:
£’000 CashDeferred into
shares TotalH Scott-BarrettC StaveleyK Ford
314220231
1251810
439238241
(xii) LTIP Vesting – The LTIP award is calculated with reference to the value of the August 2014 issue at the end of the performance period, at which point it was confirmed how many options would qualify for vesting. The awards will be available for individuals to exercise from 14 August 2018 (50% and 50% from 14 August 2019) and are conditional on them remaining in employment (or being deemed a good leaver). The numbers quoted also include payments made to individuals on exercise of options in lieu of dividends paid during the holding period.
DIRECTORS’ REMUNERATION REPORT2017 REMUNERATION REPORT
Stock Code: CAL capreg.com Stock Code: CAL
54
Capital & Regional AR2017 Governance.indd 54 10/04/2018 16:05:28

Basic salary increases for Executive Directors:2018 2017 2016 2015 2014
£’000 % £’000 % £’000 % £’000 % £’000 %L Hutchings 383 2.0 375 n/a n/a n/a n/a n/a n/a n/aC Staveley 305 2.0 299 2.0 293 2.0 287 2.5 280 –H Scott-Barrett n/a n/a 427 2.0 418 2.0 410 2.5 400 –K Ford n/a n/a 315 2.0 308 2.0 302 2.5 295 –M Bourgeois n/a n/a n/a n/a 241 4.3 231 2.5 225 –
With effect from his start date of 13 June 2017, Lawrence Hutchings’ salary was £375,000 per annum. All other benefits are as perthe Remuneration Policy. In addition he was reimbursed for relocation costs of £8,090. Lawrence’s bonus for 2017 was pro-rated reflecting his start date part way through the year.
Non-Executive Director feesThe same 2% increase awarded to staff members and Executive Directors has been applied to Non-Executive base fees of £40,800 per annum with effect from 1 January 2018. No increase will be applied to the additional £5,000 per annum for being a member ofthe Audit and Remuneration Committees or the additional £5,000 fee per annum paid to the Senior Independent Director.
With effect from his start date of 13 June 2017, Hugh Scott-Barrett’s fixed fee as Chairman was £135,000 per annum. This has alsobeen increased by 2% effective from 1 January 2018.
2017 bonuses and achievement of objectives:Total % of maximum
bonus awarded for 2017
Bonus paid 2017£’000
Maximum achievable£’000
L Hutchings 45% 1481 3281
C Staveley 40% 149 393K Ford 32.5% 128 373
1. The Bonus paid and maximum bonus achievable amounts were both pro-rated from June 2017.
Theannualbonuscriteriafor2017weredeterminedwithaweightingof 0 forGroupObjectives(ofwhich65 relatedtofinancialtargets and 15% on business development) and 20% on personal objectives.
Group Objectives: Financial Targets (65%)
PerformanceMeasure
Threshold Maximum
Actual achieved
(£m)
Payout as % of
max.% of
bonus
Required performance
(£m) % of bonus
Required performance
(£m)
Adjusted Profit1 10 30.4 15 31.9 29.9 –
Adjusted Earnings per share2 10 4.20 15 4.41 4.21 10
Property Level Net Rental Income3 15 55.0 20 56.4 53.7 –
Growth in Net Rental Income3 5 +2.5% 10 +5.0% +2.5% 5
Cost Management (Central Costs) 5 8.4 5 8.4 8.4 5
Notes:
2. The Adjusted Profit and Adjusted Earnings per share targets are adjusted for one-off restructuring/redundancy costs and Directors’ bonuses (including NIC).
3. Property Level NRI is before management fees and on a see-through basis including the Group’s proportional share of joint venture assets.
Audited information:Single total figure of remuneration for Directors:The table below sets out the remuneration received/receivable in relation to the year ended 30 December 2017.
£’000Executive Director
Salary/FeesTaxable
benefits (i)Other
benefitsTotal
Bonus (xi) PensionTotal
emolumentsLTIP
vesting (xii) Total
2017 2016 2017 2016 2017 2016 2017 2016 2017 2016 2017 2016 2017 2016 2017 2016
L Hutchings (ii) 212 – 1 - 4 - 148 - 28 - 393 - - - 393 -H Scott-Barrett (Chief Executive) (iii) 195 418 3 4 10 14 - 439 38 84 246 959 318 1,153 564 2,112C Staveley 299 292 2 2 6 6 149 238 45 44 501 582 152 606 653 1,188K Ford (iv) 113 308 2 4 3 8 46 241 17 46 181 607 160 638 341 1,245M Bourgeois (v) – 201 – 2 – 4 – – – 30 – 237 – – – 237
TOTAL 819 1,219 8 12 23 32 343 918 128 204 1,321 2,385 630 2,397 1,951 4,782Chairman and Non-Executive DirectorsH Scott-Barrett (iii)(Chairman) 75 – – – – – – – – – 75 – – – 75 –J Clare (ix) 56 125 – – – – – – – – 56 125 – – 56 125T Hales (vii) 51 45 – – – – – – – – 51 45 – – 51 45W Hamman 41 40 – – – – – – – – 41 40 – – 41 40I Krieger (vi) 46 45 – – – – – – – – 46 45 – – 46 45P Newton (viii) – 16 – – – – – – – – – 16 – – – 16L Norval 41 40 – – – – – – – – 41 40 – – 41 40G Poitrinal (x) – – – – – – – – – – – – – – – –L Whyte (vi) 46 45 – – – – – – – – 46 45 – – 46 45TOTAL 356 356 – – – – – – – – 356 356 – – 356 356TOTAL ALL 1,175 1,575 8 12 23 32 343 918 128 204 1,677 2,741 630 2,397 2,307 5,138
(i) Private medical care and critical illness cover.
(ii) L Hutchings was appointed a Director on 13 June 2017.
(iii) H Scott-Barrett stepped down as Chief Executive on 13 June 2017 and became Non-Executive Chairman on the same date.
(iv) K Ford stepped down as a Director on 9 May 2017 but continued to be a full-time employee until 31 December 2017. All remuneration figures shown are up to 9 May 2017 with the total bonus paid of £127,803 pro-rated in the above table.
(v) M Bourgeois resigned from the Board on 1 November 2016, all remuneration figures shown up to that date.
(vi) T Hales, I Krieger and L Whyte receive an additional fee of £5,000 per annum as members of the Audit and Remuneration Committees.
(vii) T Hales receives a further fee of £5,000 as Senior Independent Director.
(viii) P Newton resigned on 10 May 2016.
(ix) J Clare resigned on 13 June 2017.
(x) G Poitrinal does not receive a fee or any remuneration.
(xi) In line with policy, bonus payments above 60% of maximum (50% for the Chief Executive) are deferred into shares for two years. There was no deferral in 2017. The split of the 2016 bonus was as follows:
£’000 CashDeferred into
shares TotalH Scott-BarrettC StaveleyK Ford
314220231
1251810
439238241
(xii) LTIP Vesting – The LTIP award is calculated with reference to the value of the August 2014 issue at the end of the performance period, at which point it was confirmed how many options would qualify for vesting. The awards will be available for individuals to exercise from 14 August 2018 (50% and 50% from 14 August 2019) and are conditional on them remaining in employment (or being deemed a good leaver). The numbers quoted also include payments made to individuals on exercise of options in lieu of dividends paid during the holding period.
DIRECTORS’ REMUNERATION REPORT2017 REMUNERATION REPORT
capreg.com Stock Code: CAL capreg.com
GOVERNANCE
55
Capital & Regional AR2017 Governance.indd 55 10/04/2018 16:05:28

Capital & Regional plc Annual Report and Accounts for the year ended 30 December 2017
2. L Hutchings’ award was granted on 8 September 2017 which was as soon as was practicable following his joining the Company.
3. As a condition of Hugh Scott-Barrett’s Good Leaver status he is able to exercise his LTIP awards during the Holding period but is not able to sell the shares, other than to meet tax liabilities on exercise, without the prior agreement of the Remuneration Committee. Hugh Scott-Barrett’s awards under the March 2015 and August 2016 issues were reduced pro-rata to 13 June 2017, being the date that he ceased being an Executive Director.
4. The performance period for the March 2015 issue ended on 6 March 2018. Nil awards qualified for vesting as the share price (adjusted for cumulative dividends and distributions paid in the performance period) was below the 65p threshold.
5. Straight-line vesting applies for all LTIP issues in between threshold and maximum vesting.
Vesting of August 2014 LTIP issueThe performance period for the August 2014 LTIP issue ended during the year as noted above 35.26% of the awards qualified for vesting. This is the second LTIP award to qualify for vesting since the scheme was introduced in 2008. In approving the final resultthe Committee engaged Deloitte LLP, the Company’s Auditor, to confirm the relevant inputs and mechanics of the calculation. The Committee also reviewed the relative TSR performance of the Company against three industry peers and the FTSE All Share, FTSE 350 Real Estate and FTSE All Share Real Estate Investment Services. Noting that the Company had significantly outperformedall comparatives, other than one peer, the Committee concluded that the result was a fair reflection of the performance of management and therefore there was no need to utilise its discretionary override. The awards are available for individuals to exercise from 14 August 2018 (50% – 50% from 14 August 2019) and are conditional on them remaining in employment (or being deemed a good leaver).
Early vesting of awardsWhere a liquidity event triggers early vesting the Committee will pro rate awards for performance and, other than in exceptionalcircumstances, for time. In the event of a capital raising or any other such event that would have a dilutive impact upon the awardsthe Remuneration Committee may, in line with the scheme rules, adjust the awards granted to take account of this.
LTIP issue in 2018The Committee intends to make a new LTIP issue in 2018. The award will be made to the Chief Executive at a level equivalent to 200% of salary and to Charles Staveley at a level equivalent to 150% of salary. The Committee intend to use the same weighting andstructure of award as for the 2017 issue:
Performance condition Weighting Time frame NilThreshold
(25%)Maximum
(100%)
Total Shareholder Return relative to the FTSE 350 Real Estate Index
1/3 3 years from effective date of grant
Below index Above index Index + 12%
Average Annual Growth in Adjusted Profit Per Share
1/3 3 financial years from start of year of grant
Below 5% 5% 10%
Total Property Return relative to the IPD UK Retail Quarterly Property Index
1/3 3 years from year end or half year end preceding
effective date of grant
Below index Above index Index + 1.5% p.a.
In the case of each measure if performance is between the Threshold (25%) and Maximum (100%) levels vesting will be calculated ona straight-line basis.
In line with all LTIP awards the Remuneration Committee retains discretion to adjust payout if it concludes that performance measures have only been achieved due to actions that deliver short-term benefit at the cost of longer term performance and financial stability.
Group Objectives: Business development (15%)The Remuneration Committee determined that management’s objectives should also include a focus on the delivery of accretive property acquisitions or investments with the aim of growing the business. In considering performance for the year the Committeetook into account the completion of the disposal of the Buttermarket Ipswich joint venture in February 2017 and the successful integration of the Exchange Centre, Ilford which was acquired in March 2017 and concluded that an award of 5% of bonus was appropriate.
Personal Objectives (20%)Each of the Executive Directors is given a number of personal objectives which account for a maximum of 20% of the overall targetset. These objectives are specific to the individual responsibilities and in 2017 covered implementation of the new business strategy,transition and development of the management team, stakeholder engagement, cost management, the integration of the Ilford acquisition, the exit plan for the Buttermarket Ipswich joint venture and advancing strategic plans for the Group’s major assets. The Committee determined that against these objectives the following awards, relative to maximum payout, be made: 20% to Lawrence Hutchings, 15% to Charles Staveley and 7.5% to Ken Ford.
2018 bonus objectives:Consistent with 2017 Group objectives will account for 80% of the maximum payout, with the primary focus on measures that support delivery of dividend growth given its critical importance to the Group’s strategy. A full split of the relative weighting is provided below. Given their commercial sensitivity, we do not publish specific targets but will report on achievements in the 2018Annual Report.
% of max.
Adjusted Profit 20%
Property Net Rental Income 10%
Underlying growth in Net Rental Income 15%
Cost Management 5%
Operatingmetrics 10%
Implementation of strategy 20%
PersonalObjectives 20%
Long-Term Incentive Plan (LTIP):The number of awards and the performance periods for all outstanding LTIP awards are summarised in the table below. The Company’s Clawback provisions apply during the holding period where the level of vesting may be reduced, including to nil.
NameDate of Award
No. of awards % of salary
Threshold/Maximum vesting
share price3
Qualified for vesting in the year
End of Performance
Period Holding periodL Hutchings 8.9.172 1,260,504 200 see note 1 below – 19.04.20 2 yearsC Staveley 14.08.14 598,930 100 60p/85p 211,182 14.08.17 50% 1 yr/50% 2 yrs
06.03.15 496,969 100 65p/90p – 06.03.184 50% 1 yr/50% 2 yrs23.08.16 615,000 125 see note 1 below – 23.08.19 2 years19.04.17 627,300 125 see note 1 below – 19.04.20 2 years
H Scott-Barrett 14.08.14 1,283,422 150 60p/85p 452,534 14.08.17 50% 1 yr/50% 2 yrs3
06.03.15 806,4743 150 65p/90p – 06.03.184 50% 1 yr/50% 2 yrs3
23.08.16 283,0683 150 see note 1 below – 23.08.19 2 years3
Notes:1. The performance conditions for the August 2016 and April 2017 issues are:
Performance condition Weighting Time frame NilThreshold
(25%)Maximum
(100%)
Total Shareholder Return relative to the FTSE 350 Real Estate Index
1/3 3 years from date of grant Below index
Above index Index + 12%
Average Annual Growth in Adjusted Profit Per Share
1/3 3 financial years from start of year of grant
Below5%
5% 9% (August 2016)10% (April 2017)
Total Property Return relative to the IPD UK Retail Quarterly Property Index
1/3 3 years from year end or half year end immediately preceding
grant
Belowindex
Above index Index + 1.5% p.a.
DIRECTORS’ REMUNERATION REPORT2017 REMUNERATION REPORT
Stock Code: CAL capreg.com Stock Code: CAL
56
Capital & Regional AR2017 Governance.indd 56 10/04/2018 16:05:28

2. L Hutchings’ award was granted on 8 September 2017 which was as soon as was practicable following his joining the Company.
3. As a condition of Hugh Scott-Barrett’s Good Leaver status he is able to exercise his LTIP awards during the Holding period but is not able to sell the shares, other than to meet tax liabilities on exercise, without the prior agreement of the Remuneration Committee. Hugh Scott-Barrett’s awards under the March 2015 and August 2016 issues were reduced pro-rata to 13 June 2017, being the date that he ceased being an Executive Director.
4. The performance period for the March 2015 issue ended on 6 March 2018. Nil awards qualified for vesting as the share price (adjusted for cumulative dividends and distributions paid in the performance period) was below the 65p threshold.
5. Straight-line vesting applies for all LTIP issues in between threshold and maximum vesting.
Vesting of August 2014 LTIP issueThe performance period for the August 2014 LTIP issue ended during the year as noted above 35.26% of the awards qualified for vesting. This is the second LTIP award to qualify for vesting since the scheme was introduced in 2008. In approving the final resultthe Committee engaged Deloitte LLP, the Company’s Auditor, to confirm the relevant inputs and mechanics of the calculation. The Committee also reviewed the relative TSR performance of the Company against three industry peers and the FTSE All Share, FTSE 350 Real Estate and FTSE All Share Real Estate Investment Services. Noting that the Company had significantly outperformedall comparatives, other than one peer, the Committee concluded that the result was a fair reflection of the performance of management and therefore there was no need to utilise its discretionary override. The awards are available for individuals to exercise from 14 August 2018 (50% – 50% from 14 August 2019) and are conditional on them remaining in employment (or being deemed a good leaver).
Early vesting of awardsWhere a liquidity event triggers early vesting the Committee will pro rate awards for performance and, other than in exceptionalcircumstances, for time. In the event of a capital raising or any other such event that would have a dilutive impact upon the awardsthe Remuneration Committee may, in line with the scheme rules, adjust the awards granted to take account of this.
LTIP issue in 2018The Committee intends to make a new LTIP issue in 2018. The award will be made to the Chief Executive at a level equivalent to 200% of salary and to Charles Staveley at a level equivalent to 150% of salary. The Committee intend to use the same weighting andstructure of award as for the 2017 issue:
Performance condition Weighting Time frame NilThreshold
(25%)Maximum
(100%)
Total Shareholder Return relative to the FTSE 350 Real Estate Index
1/3 3 years from effective date of grant
Below index Above index Index + 12%
Average Annual Growth in Adjusted Profit Per Share
1/3 3 financial years from start of year of grant
Below 5% 5% 10%
Total Property Return relative to the IPD UK Retail Quarterly Property Index
1/3 3 years from year end or half year end preceding
effective date of grant
Below index Above index Index + 1.5% p.a.
In the case of each measure if performance is between the Threshold (25%) and Maximum (100%) levels vesting will be calculated ona straight-line basis.
In line with all LTIP awards the Remuneration Committee retains discretion to adjust payout if it concludes that performance measures have only been achieved due to actions that deliver short-term benefit at the cost of longer term performance and financial stability.
Group Objectives: Business development (15%)The Remuneration Committee determined that management’s objectives should also include a focus on the delivery of accretive property acquisitions or investments with the aim of growing the business. In considering performance for the year the Committeetook into account the completion of the disposal of the Buttermarket Ipswich joint venture in February 2017 and the successful integration of the Exchange Centre, Ilford which was acquired in March 2017 and concluded that an award of 5% of bonus was appropriate.
Personal Objectives (20%)Each of the Executive Directors is given a number of personal objectives which account for a maximum of 20% of the overall targetset. These objectives are specific to the individual responsibilities and in 2017 covered implementation of the new business strategy,transition and development of the management team, stakeholder engagement, cost management, the integration of the Ilford acquisition, the exit plan for the Buttermarket Ipswich joint venture and advancing strategic plans for the Group’s major assets. The Committee determined that against these objectives the following awards, relative to maximum payout, be made: 20% to Lawrence Hutchings, 15% to Charles Staveley and 7.5% to Ken Ford.
2018 bonus objectives:Consistent with 2017 Group objectives will account for 80% of the maximum payout, with the primary focus on measures that support delivery of dividend growth given its critical importance to the Group’s strategy. A full split of the relative weighting is provided below. Given their commercial sensitivity, we do not publish specific targets but will report on achievements in the 2018Annual Report.
% of max.
Adjusted Profit 20%
Property Net Rental Income 10%
Underlying growth in Net Rental Income 15%
Cost Management 5%
Operatingmetrics 10%
Implementation of strategy 20%
PersonalObjectives 20%
Long-Term Incentive Plan (LTIP):The number of awards and the performance periods for all outstanding LTIP awards are summarised in the table below. The Company’s Clawback provisions apply during the holding period where the level of vesting may be reduced, including to nil.
NameDate of Award
No. of awards % of salary
Threshold/Maximum vesting
share price3
Qualified for vesting in the year
End of Performance
Period Holding periodL Hutchings 8.9.172 1,260,504 200 see note 1 below – 19.04.20 2 yearsC Staveley 14.08.14 598,930 100 60p/85p 211,182 14.08.17 50% 1 yr/50% 2 yrs
06.03.15 496,969 100 65p/90p – 06.03.184 50% 1 yr/50% 2 yrs23.08.16 615,000 125 see note 1 below – 23.08.19 2 years19.04.17 627,300 125 see note 1 below – 19.04.20 2 years
H Scott-Barrett 14.08.14 1,283,422 150 60p/85p 452,534 14.08.17 50% 1 yr/50% 2 yrs3
06.03.15 806,4743 150 65p/90p – 06.03.184 50% 1 yr/50% 2 yrs3
23.08.16 283,0683 150 see note 1 below – 23.08.19 2 years3
Notes:1. The performance conditions for the August 2016 and April 2017 issues are:
Performance condition Weighting Time frame NilThreshold
(25%)Maximum
(100%)
Total Shareholder Return relative to the FTSE 350 Real Estate Index
1/3 3 years from date of grant Below index
Above index Index + 12%
Average Annual Growth in Adjusted Profit Per Share
1/3 3 financial years from start of year of grant
Below5%
5% 9% (August 2016)10% (April 2017)
Total Property Return relative to the IPD UK Retail Quarterly Property Index
1/3 3 years from year end or half year end immediately preceding
grant
Belowindex
Above index Index + 1.5% p.a.
DIRECTORS’ REMUNERATION REPORT2017 REMUNERATION REPORT
capreg.com Stock Code: CAL capreg.com
GOVERNANCE
57
Capital & Regional AR2017 Governance.indd 57 10/04/2018 16:05:28

Capital & Regional plc Annual Report and Accounts for the year ended 30 December 2017
The table below sets out the total remuneration of the Chief Executive, over the same period as the Total Shareholder Return graph.The quantum of Annual Incentive awards granted each year and long-term incentive vesting rates are given as a percentage of themaximum opportunity available.
2017£’000
2016£’000
2015£’000
2014£’000
2013£’000
2012£’000
2011£’000
2010£’000
2009£’000
Total remuneration (L Hutchings) 393 n/a n/a n/a n/a n/a n/a n/a n/aTotal remuneration (H Scott-Barrett) 564 2,112 796 833 651 765 536 302 402Annual bonus (% of max) (L Hutchings) 45% n/a n/a n/a n/a n/a n/a n/a n/aAnnual bonus (% of max) (H Scott-Barrett) – 70% 70% 85% 40% 69% 71% – –LTIP vesting (% of max) (L Hutchings) n/a n/a n/a n/a n/a n/a n/a n/a n/aLTIP vesting (% of max) (H Scott-Barrett) 35.26% 91.85% – – – – – – –
Percentage increase in Chief Executive remuneration versus the wider workforce
CEOEmployee
group1
Salary -3% 2%All taxable benefits No change No changeAnnual bonuses -42% -5%
TheCEOcomparisonis ughScott-Barrettfor2016toacombinedfigurefor2017comprising ughScott-Barrett’sremunerationforthe period 1 January 2017 to 12 June 2017 and Lawrence Hutchings’ remuneration for the period 13 June 2017 to 31 December 2017.
The ratio of the salary of the Chief Executive to the average employee salary1 (excluding Directors) was 5.6:1 (£407,000:£72,550).
1. Calculated on a like-for-like basis with reference to employees of Capital & Regional plc and Capital & Regional Property Management.
Relative importance of spend on pay compared to distributions to shareholders2017
£m2016
£m %
Employee costs (per Note 7 of the financial statements) 13.1 13.7 -4.4%Dividends paid (Total of Interim and Final Dividend for the respective year) 26.1 23.8 9.7%
Executive share ownership The minimum shareholding guidelines require Executive Directors to hold ordinary shares with a value equal to a set percentage ofsalary based on current market value or aggregate purchase price. These guidelines are set at one year’s basic salary for ExecutiveDirectors and two years for the Chief Executive.
There is no set timescale for Executive Director to reach the prescribed target but they are expected to retain net shares received on the vesting of long-term incentive awards until the target is achieved. Shares that count towards the holding guideline are unfetteredand beneficially owned by the Executive Directors and their connected persons.
Executive Directors
Time from appointment as
Executive DirectorTarget % of
salary
Target currently
met?L Hutchings 6 months 200 NoC Staveley 9 years 3 months 100 Yes
Exit paymentsNo discretionary payments were made to Hugh Scott-Barrett on his change of role from Chief Executive to Chairman on 13 June 2017. Hugh did not receive a bonus or LTIP award for 2017 in light of his impending move. For the purposes of the LTIP Hugh wasregarded as a good leaver and can exercise awards when they qualify for vesting but any sale of shares before the end of the Holding Period, other than to cover tax liabilities on exercise, is subject to Remuneration Committee agreement. Pro-rating for time was applied to the March 2015 and August 2016 awards such that the proportion of his awards that will be available for potentialvesting will only relate to the proportion of the performance period for which he was Chief Executive.
Ken Ford stepped down as an Executive Director of Capital & Regional plc on 9 May 2017. Ken remained an employee of the Group until 31 December 2017 during which time his remuneration arrangements were unchanged. No additional remuneration or payment was made in connection with Ken ceasing to be a Director of the Company. Ken will retain his awards received under the Company’s 2008 Long Term Incentive Plan (“LTIP”). For those LTIP awards with a performance period extending beyond 31 December 2017 a pro-rating adjustment will be made to that date. The Holding Periods applicable to the respective LTIP awards,and to options under the Company’s Deferred Bonus Share Plan, will be varied such that they will no longer apply from after the first anniversary of Ken leaving full-time employment (i.e. 31 December 2018).
Performance graphThe graph below illustrates the Company’s Total Shareholder Return (i.e. share price growth plus dividends paid) performance compared to the FTSE All Share and FTSE 350 Real Estate indices. The graph shows how the total return on a £100 investment in theCompany made on 31 December 2008 would have changed over the nine year period measured, compared with the total return on a £100 investment in the comparable indices.
350
300
250
200
150
100
50
0
FTSE 350 Real EstateCAL
FTSE All Share
2009 2010 2011 20122008 2013 2014 2015 20172016
DIRECTORS’ REMUNERATION REPORT2017 REMUNERATION REPORT
Stock Code: CAL capreg.com Stock Code: CAL
58
Capital & Regional AR2017 Governance.indd 58 10/04/2018 16:05:29

The table below sets out the total remuneration of the Chief Executive, over the same period as the Total Shareholder Return graph.The quantum of Annual Incentive awards granted each year and long-term incentive vesting rates are given as a percentage of themaximum opportunity available.
2017£’000
2016£’000
2015£’000
2014£’000
2013£’000
2012£’000
2011£’000
2010£’000
2009£’000
Total remuneration (L Hutchings) 393 n/a n/a n/a n/a n/a n/a n/a n/aTotal remuneration (H Scott-Barrett) 564 2,112 796 833 651 765 536 302 402Annual bonus (% of max) (L Hutchings) 45% n/a n/a n/a n/a n/a n/a n/a n/aAnnual bonus (% of max) (H Scott-Barrett) – 70% 70% 85% 40% 69% 71% – –LTIP vesting (% of max) (L Hutchings) n/a n/a n/a n/a n/a n/a n/a n/a n/aLTIP vesting (% of max) (H Scott-Barrett) 35.26% 91.85% – – – – – – –
Percentage increase in Chief Executive remuneration versus the wider workforce
CEOEmployee
group1
Salary -3% 2%All taxable benefits No change No changeAnnual bonuses -42% -5%
TheCEOcomparisonis ughScott-Barrettfor2016toacombinedfigurefor2017comprising ughScott-Barrett’sremunerationforthe period 1 January 2017 to 12 June 2017 and Lawrence Hutchings’ remuneration for the period 13 June 2017 to 31 December 2017.
The ratio of the salary of the Chief Executive to the average employee salary1 (excluding Directors) was 5.6:1 (£407,000:£72,550).
1. Calculated on a like-for-like basis with reference to employees of Capital & Regional plc and Capital & Regional Property Management.
Relative importance of spend on pay compared to distributions to shareholders2017
£m2016
£m %
Employee costs (per Note 7 of the financial statements) 13.1 13.7 -4.4%Dividends paid (Total of Interim and Final Dividend for the respective year) 26.1 23.8 9.7%
Executive share ownership The minimum shareholding guidelines require Executive Directors to hold ordinary shares with a value equal to a set percentage ofsalary based on current market value or aggregate purchase price. These guidelines are set at one year’s basic salary for ExecutiveDirectors and two years for the Chief Executive.
There is no set timescale for Executive Director to reach the prescribed target but they are expected to retain net shares received on the vesting of long-term incentive awards until the target is achieved. Shares that count towards the holding guideline are unfetteredand beneficially owned by the Executive Directors and their connected persons.
Executive Directors
Time from appointment as
Executive DirectorTarget % of
salary
Target currently
met?L Hutchings 6 months 200 NoC Staveley 9 years 3 months 100 Yes
Exit paymentsNo discretionary payments were made to Hugh Scott-Barrett on his change of role from Chief Executive to Chairman on 13 June 2017. Hugh did not receive a bonus or LTIP award for 2017 in light of his impending move. For the purposes of the LTIP Hugh wasregarded as a good leaver and can exercise awards when they qualify for vesting but any sale of shares before the end of the Holding Period, other than to cover tax liabilities on exercise, is subject to Remuneration Committee agreement. Pro-rating for time was applied to the March 2015 and August 2016 awards such that the proportion of his awards that will be available for potentialvesting will only relate to the proportion of the performance period for which he was Chief Executive.
Ken Ford stepped down as an Executive Director of Capital & Regional plc on 9 May 2017. Ken remained an employee of the Group until 31 December 2017 during which time his remuneration arrangements were unchanged. No additional remuneration or payment was made in connection with Ken ceasing to be a Director of the Company. Ken will retain his awards received under the Company’s 2008 Long Term Incentive Plan (“LTIP”). For those LTIP awards with a performance period extending beyond 31 December 2017 a pro-rating adjustment will be made to that date. The Holding Periods applicable to the respective LTIP awards,and to options under the Company’s Deferred Bonus Share Plan, will be varied such that they will no longer apply from after the first anniversary of Ken leaving full-time employment (i.e. 31 December 2018).
Performance graphThe graph below illustrates the Company’s Total Shareholder Return (i.e. share price growth plus dividends paid) performance compared to the FTSE All Share and FTSE 350 Real Estate indices. The graph shows how the total return on a £100 investment in theCompany made on 31 December 2008 would have changed over the nine year period measured, compared with the total return on a £100 investment in the comparable indices.
350
300
250
200
150
100
50
0
FTSE 350 Real EstateCAL
FTSE All Share
2009 2010 2011 20122008 2013 2014 2015 20172016
DIRECTORS’ REMUNERATION REPORT2017 REMUNERATION REPORT
capreg.com Stock Code: CAL capreg.com
GOVERNANCE
59
Capital & Regional AR2017 Governance.indd 59 10/04/2018 16:05:29

Capital & Regional plc Annual Report and Accounts for the year ended 30 December 2017
Business reviewInformation on the Group’s business, which is required by section 417 of the Companies Act 2006, can be found in the Strategic Report on pages 2 to 35 which is incorporated into this report by reference. This includes our statutory reporting on greenhousegas emissions. A report on corporate governance and compliance with the provisions of the UK Corporate Governance Code and Disclosure and Transparency Rules, which forms part of this Directors’ Report, is set out on pages 38 to 42.
The results for the year are shown in the Group income statement on page 74. There were no reportable events after the balance sheet date. The use of financial derivatives is set out in Note 18 to the financial statements.
The purpose of this annual report is to provide information to the members of the Company. The annual report contains certain forward-looking statements with respect to the operations, performance and financial condition of the Group. By their nature, thesestatements involve uncertainty since future events and circumstances can cause results and developments to differ materially fromthose anticipated. The forward-looking statements reflect knowledge and information available at the date of preparation of thisannual report and the Group undertakes no obligation to update them. Nothing in this annual report should be construed as a profit forecast.
DividendsAninterimdividendof1.73pencepershare(2016:1.62pencepershare)waspaidon26October2017,allasaPropertyIncomeDistribution (PID). The Directors recommend a final dividend of 1.91 pence per share, making a total distribution for the year ended30 December 2017 of 3.64 pence per share (2016: 3.39 pence per share).
Subject to approval of shareholders at the Annual General Meeting (“AGM”) on 9 May 2018, the final dividend will be paid on 16 May2018. The key dates are set out as below:
• Confirmation of ZAR equivalent dividend and PID percentage 10 April 2018• Last day to trade on Johannesburg Stock Exchange (JSE) 17 April 2018• Shares trade ex-dividend on the JSE 18 April 2018• Shares trade ex-dividend on the London Stock Exchange (LSE) 19 April 2018• Record date for LSE and JSE 20 April 2018• AGM 9 May 2018• Dividend payment date 16 May 2018
The amount to be paid as a PID will be confirmed in the announcement on 10 April 2018. If a Scrip dividend alternative is offeredthe deadline for submission of valid election forms will be 20 April 2018. South African shareholders are advised that the finaldividend will be regarded as a foreign dividend. Further details relating to Withholding Tax for shareholders on the South Africanregister will be provided within the announcement detailing the currency conversion rate on 10 April 2018. Share certificates on the South African register may not be dematerialised or rematerialised between 18 April 2018 and 20 April 2018, both dates inclusive.Transfers between the UK and South African registers may not take place between 10 April 2018 and 20 April 2018, both dates inclusive.
Property Income Distributions (PIDs)As a UK REIT, Capital & Regional plc is exempt from corporation tax on rental income and gains on UK investment properties but isrequired to pay Property Income Distributions (PIDs). UK shareholders will be taxed on PIDs received at their full marginal tax rates. A REIT may in addition pay normal dividends.
For most shareholders, PIDs will be paid after deducting withholding tax at the basic rate. However, certain categories of UK shareholder are entitled to receive PIDs without withholding tax, principally UK resident companies, UK public bodies, UK pensionfunds and managers of ISAs, PEPs and Child Trust Funds. Further information on UK REITs is available on the Company’s website, including a form to be used by shareholders to certify if they qualify to receive PIDs without withholding tax.
PIDs paid to shareholders on the South African share registrar are subject to UK withholding tax at 20%. South African shareholdersmay apply to Her Majesty’s Revenue and Customs after payment of the PID for a refund of the difference between the 20% withholdingtaxandtheprevailing SouthAfricandoubletaxtreatyrate.Otheroverseasshareholdersmaybeeligibletoapplyforsimilar refunds of UK withholding tax under the terms of the relevant tax treaties.
Interests in sharesThe Directors and, where relevant, their connected persons (within the meaning of Section 252 of the Companies Act 2006) were beneficially interested in the ordinary share capital of the Company at the dates shown in the table. This excludes unvested LTIPshare awards, these are disclosed separately on page 56.
30 December 2017
Shares
30 December 2016
Shares
H Scott-Barrett 3,489,676 2,206,826L Hutchings 38,710 n/aC Staveley 1,090,860 540,475T Hales 600,000 500,000W Hamman – –I Krieger 103,133 100,000L Norval 135,899,287 137,102,157G Poitrinal 53,147,931 51,532,964
L Whyte 73,929 57,000
Louis Norval is beneficially interested in the shares registered in the name of MStead Limited and PDI Investment Holdings Limited.Wessel Hamman, by virtue of being the other nominated representative Director of the Parkdev Group of companies, is connected to the MStead Limited, PDI Investment Holdings Limited and other related shareholdings but does not personally have a beneficialinterest in any of these holdings.
The 53,147,931 shares in which Guillaume Poitrinal is noted as having a beneficial interest in at 30 December 2017 were held byICAMAP Investments S.àr.l, of whom he is the Chairman.
The following were the only transactions impacting the above shareholdings from 30 December 2017 to 4 April 2018, being the latest practicable date prior to the issue of this report:
• Hugh Scott-Barrett completed transactions on 9 March 2018 that added a net 25,000 shares to his holding.
Tony Hales CBEChairman of Remuneration Committee
DIRECTORS’ REMUNERATION REPORT2017 REMUNERATION REPORT
DIRECTORS’ REPORT
Stock Code: CAL capreg.com Stock Code: CAL
60
Capital & Regional AR2017 Governance.indd 60 10/04/2018 16:05:29

Business reviewInformation on the Group’s business, which is required by section 417 of the Companies Act 2006, can be found in the Strategic Report on pages 2 to 35 which is incorporated into this report by reference. This includes our statutory reporting on greenhousegas emissions. A report on corporate governance and compliance with the provisions of the UK Corporate Governance Code and Disclosure and Transparency Rules, which forms part of this Directors’ Report, is set out on pages 38 to 42.
The results for the year are shown in the Group income statement on page 74. There were no reportable events after the balance sheet date. The use of financial derivatives is set out in Note 18 to the financial statements.
The purpose of this annual report is to provide information to the members of the Company. The annual report contains certain forward-looking statements with respect to the operations, performance and financial condition of the Group. By their nature, thesestatements involve uncertainty since future events and circumstances can cause results and developments to differ materially fromthose anticipated. The forward-looking statements reflect knowledge and information available at the date of preparation of thisannual report and the Group undertakes no obligation to update them. Nothing in this annual report should be construed as a profit forecast.
DividendsAninterimdividendof1.73pencepershare(2016:1.62pencepershare)waspaidon26October2017,allasaPropertyIncomeDistribution (PID). The Directors recommend a final dividend of 1.91 pence per share, making a total distribution for the year ended30 December 2017 of 3.64 pence per share (2016: 3.39 pence per share).
Subject to approval of shareholders at the Annual General Meeting (“AGM”) on 9 May 2018, the final dividend will be paid on 16 May2018. The key dates are set out as below:
• Confirmation of ZAR equivalent dividend and PID percentage 10 April 2018• Last day to trade on Johannesburg Stock Exchange (JSE) 17 April 2018• Shares trade ex-dividend on the JSE 18 April 2018• Shares trade ex-dividend on the London Stock Exchange (LSE) 19 April 2018• Record date for LSE and JSE 20 April 2018• AGM 9 May 2018• Dividend payment date 16 May 2018
The amount to be paid as a PID will be confirmed in the announcement on 10 April 2018. If a Scrip dividend alternative is offeredthe deadline for submission of valid election forms will be 20 April 2018. South African shareholders are advised that the finaldividend will be regarded as a foreign dividend. Further details relating to Withholding Tax for shareholders on the South Africanregister will be provided within the announcement detailing the currency conversion rate on 10 April 2018. Share certificates on the South African register may not be dematerialised or rematerialised between 18 April 2018 and 20 April 2018, both dates inclusive.Transfers between the UK and South African registers may not take place between 10 April 2018 and 20 April 2018, both dates inclusive.
Property Income Distributions (PIDs)As a UK REIT, Capital & Regional plc is exempt from corporation tax on rental income and gains on UK investment properties but isrequired to pay Property Income Distributions (PIDs). UK shareholders will be taxed on PIDs received at their full marginal tax rates. A REIT may in addition pay normal dividends.
For most shareholders, PIDs will be paid after deducting withholding tax at the basic rate. However, certain categories of UK shareholder are entitled to receive PIDs without withholding tax, principally UK resident companies, UK public bodies, UK pensionfunds and managers of ISAs, PEPs and Child Trust Funds. Further information on UK REITs is available on the Company’s website, including a form to be used by shareholders to certify if they qualify to receive PIDs without withholding tax.
PIDs paid to shareholders on the South African share registrar are subject to UK withholding tax at 20%. South African shareholdersmay apply to Her Majesty’s Revenue and Customs after payment of the PID for a refund of the difference between the 20% withholdingtaxandtheprevailing SouthAfricandoubletaxtreatyrate.Otheroverseasshareholdersmaybeeligibletoapplyforsimilar refunds of UK withholding tax under the terms of the relevant tax treaties.
Interests in sharesThe Directors and, where relevant, their connected persons (within the meaning of Section 252 of the Companies Act 2006) were beneficially interested in the ordinary share capital of the Company at the dates shown in the table. This excludes unvested LTIPshare awards, these are disclosed separately on page 56.
30 December 2017
Shares
30 December 2016
Shares
H Scott-Barrett 3,489,676 2,206,826L Hutchings 38,710 n/aC Staveley 1,090,860 540,475T Hales 600,000 500,000W Hamman – –I Krieger 103,133 100,000L Norval 135,899,287 137,102,157G Poitrinal 53,147,931 51,532,964
L Whyte 73,929 57,000
Louis Norval is beneficially interested in the shares registered in the name of MStead Limited and PDI Investment Holdings Limited.Wessel Hamman, by virtue of being the other nominated representative Director of the Parkdev Group of companies, is connected to the MStead Limited, PDI Investment Holdings Limited and other related shareholdings but does not personally have a beneficialinterest in any of these holdings.
The 53,147,931 shares in which Guillaume Poitrinal is noted as having a beneficial interest in at 30 December 2017 were held byICAMAP Investments S.àr.l, of whom he is the Chairman.
The following were the only transactions impacting the above shareholdings from 30 December 2017 to 4 April 2018, being the latest practicable date prior to the issue of this report:
• Hugh Scott-Barrett completed transactions on 9 March 2018 that added a net 25,000 shares to his holding.
Tony Hales CBEChairman of Remuneration Committee
DIRECTORS’ REMUNERATION REPORT2017 REMUNERATION REPORT
DIRECTORS’ REPORT
capreg.com Stock Code: CAL capreg.com
GOVERNANCE
61
Capital & Regional AR2017 Governance.indd 61 10/04/2018 16:05:29

Capital & Regional plc Annual Report and Accounts for the year ended 30 December 2017
Share capital As at 30 December 2017 the Company’s total issued share capital was 718,275,760 ordinary shares of one pence each, all with equalvoting rights. The changes in the Company’s Issued share capital during 2017 are detailed in Note 19 to the financial statements.
The Company has a Secondary Listing of shares on the Johannesburg Stock Exchange (JSE). At 30 December 2017, 60,477,452 of the Company’s shares were held on the JSE register representing 8.42% of the total shares in issue.
Change in controlThe Group’s core £30 million revolving credit facility can be called in if there is a change in direct control of the borrower, Capital & Regional Holdings, of 50% or more of its issued share capital. The Group’s £39 million debt facility in respect of The Exchange Centre, Ilford allows the lender to demand repayment of the facility with 120 days’ notice following an individual or entity taking control of 50% or more of Capital & Regional Plc’s shares.
In addition, certain potential tax liabilities could be crystallised in some circumstances where there are varying degrees of change of ownership of the Group’s shares.
Furthermore, the Group could lose its status as a REIT as a result of the actions of third parties (for example, in the event of a successful takeover by a company that is not a REIT and which does not qualify as an “institutional investor” for REIT purposes) or due to a breach of the close company condition if it is unable to remedy the breach within a specified period.
Purchase of own sharesThe Company did not make any purchases of its own shares during 2016 or in 2017 up to 4 April 2018 being the latest practicabledate prior to the issue of this report.
The Company was authorised by shareholders at the 2017 AGM held on 9 May 2017 to purchase up to a maximum of 10.0% of its ordinary shares in the market. This authority will expire at the 2018 AGM and the directors will be seeking a new authority for the Company to purchase its ordinary shares. This will only be exercised if market and financial conditions make it advantageousto do so.
Articles of AssociationThe rules governing the appointment and replacement of Directors are contained in the Company’s Articles of Association. Changesto the Articles of Association must be approved by shareholders in accordance with the legislation in force from time to time.
Shares held by Employee Share Ownership TrustTheCapital RegionalEmployeeShareOwnershipTrustdidnotac uireanysharesin2017.At30December2017theTrustheld182,699 shares in the Company. The shares held by the Trust are registered in the nominee name, Forest Nominees Limited, and a dividend waiver is in place to cover the entire holding.
Human rightsThe Group operates in the UK and Jersey and, as such, is subject to the European Convention on Human Rights and the UK Human Rights Act 1998.
The Group respects all human rights and in conducting its business the Group regards those rights relating to non-discrimination,fair treatment and respect for privacy to be the most relevant and to have the greatest potential impact on its key stakeholdergroups of customers, employees and suppliers.
The Board has overall responsibility for ensuring the Group upholds and promotes respect for human rights. The Group seeks to anticipate, prevent and mitigate any potential negative human rights impacts as well as enhance positive impacts through its policiesand procedures and, in particular, through its policies regarding employment, equality and diversity, treating its stakeholders and customers fairly and information security. Group policies seek to ensure that employees comply with the relevant legislation andregulations in place to promote good practice. The Group’s policies are formulated and kept up to date and communicated to all employees through the Staff Policy Manual. The Group has not been made aware of any incident in which the organisation’s activities have resulted in an abuse of human rights.
DirectorsThe names and biographical details of the present Directors of the Company are given on pages 36 to 37. Lawrence Hutchings was appointed on 13 June 2017. Ken Ford and John Clare’s resignations were effective from 9 May 2017 and 13 June 2017, respectively.All other Directors served for the full year.
All current Directors will retire and, being eligible, offer themselves for re-election at the 2018 Annual General Meeting.
Directors’ interests in the share capital and equity of the Company at the year-end are contained in the Directors’ RemunerationReport on page 60. There were no contracts of significance subsisting during or at the end of the year in which a Director of theCompany was materially interested. No Director had a material interest in the share capital of other Group companies during the year.
In connection with the Parkdev Group of Investors (“Parkdev”) acquisition of shares in the Company in 2009 and pursuant to the Relationship Agreement that Parkdev and the Company entered into in 2009, the Company agreed, upon request, to appoint two Non-Executive Directors nominated by Parkdev to the Board for so long as they own 20% or more of the issued ordinary share capital in the Company and one Non-Executive Director to the Board if they own less than 20%, but not less than 15%. Louis Norvaland Wessel Hamman are the Parkdev nominated non-executive directors. All other Directors are appointed in a personal capacity.
The Company maintains insurance for the Directors in respect of liabilities arising from the performance of their duties.
Listing Rule 9.8.4R disclosuresThe following table sets out where disclosures required in compliance with Listing Rule 9.8.4R are located.
Interest capitalised and tax relief n/aDetails of long-term incentive schemes Pages 56 to 57Waiver of emoluments by a Director n/aWaiver of future emoluments by a Director n/aNon pre-emptive issues of equity for cash n/aNon pre-emptive issues of equity for cash by major subsidiary undertakings n/aParent company participation in a placing by a listed subsidiary n/aContracts of significance n/aProvision of services by a controlling shareholder n/aShareholder waivers of dividends Shares held by Employee Share Ownership
Trust – see section belowShareholder waivers of future dividends Shares held by Employee Share Ownership
Trust – see section belowAgreements with controlling shareholders n/a
Substantial shareholdings As at 26 March 2018 (the latest practicable date prior to the issue of this report) the Company has been notified of the followinginterests in its issued ordinary share capital:
No. of shares %
MStead Limited 69,978,847 9.74PDI Investment Holdings 65,462,806 9.11ICAMAP Investments 53,147,931 7.40BlackRock 41,778,069 5.82Peens Family Holdings 32,440,000 4.52Hargreave Hale 32,300,000 4.50New Fortress Finance Holdings 27,535,263 3.83Thames River Capital 24,768,962 3.45Aberforth Partners 23,640,935 3.29
MStead Limited and PDI Investment Holdings are part of the Parkdev Group of investors.
DIRECTORS’ REPORT CONTINUED
Stock Code: CAL capreg.com Stock Code: CAL
62
Capital & Regional AR2017 Governance.indd 62 10/04/2018 16:05:29

Share capital As at 30 December 2017 the Company’s total issued share capital was 718,275,760 ordinary shares of one pence each, all with equalvoting rights. The changes in the Company’s Issued share capital during 2017 are detailed in Note 19 to the financial statements.
The Company has a Secondary Listing of shares on the Johannesburg Stock Exchange (JSE). At 30 December 2017, 60,477,452 of the Company’s shares were held on the JSE register representing 8.42% of the total shares in issue.
Change in controlThe Group’s core £30 million revolving credit facility can be called in if there is a change in direct control of the borrower, Capital & Regional Holdings, of 50% or more of its issued share capital. The Group’s £39 million debt facility in respect of The Exchange Centre, Ilford allows the lender to demand repayment of the facility with 120 days’ notice following an individual or entity taking control of 50% or more of Capital & Regional Plc’s shares.
In addition, certain potential tax liabilities could be crystallised in some circumstances where there are varying degrees of change of ownership of the Group’s shares.
Furthermore, the Group could lose its status as a REIT as a result of the actions of third parties (for example, in the event of a successful takeover by a company that is not a REIT and which does not qualify as an “institutional investor” for REIT purposes) or due to a breach of the close company condition if it is unable to remedy the breach within a specified period.
Purchase of own sharesThe Company did not make any purchases of its own shares during 2016 or in 2017 up to 4 April 2018 being the latest practicabledate prior to the issue of this report.
The Company was authorised by shareholders at the 2017 AGM held on 9 May 2017 to purchase up to a maximum of 10.0% of its ordinary shares in the market. This authority will expire at the 2018 AGM and the directors will be seeking a new authority for the Company to purchase its ordinary shares. This will only be exercised if market and financial conditions make it advantageousto do so.
Articles of AssociationThe rules governing the appointment and replacement of Directors are contained in the Company’s Articles of Association. Changesto the Articles of Association must be approved by shareholders in accordance with the legislation in force from time to time.
Shares held by Employee Share Ownership TrustTheCapital RegionalEmployeeShareOwnershipTrustdidnotac uireanysharesin2017.At30December2017theTrustheld182,699 shares in the Company. The shares held by the Trust are registered in the nominee name, Forest Nominees Limited, and a dividend waiver is in place to cover the entire holding.
Human rightsThe Group operates in the UK and Jersey and, as such, is subject to the European Convention on Human Rights and the UK Human Rights Act 1998.
The Group respects all human rights and in conducting its business the Group regards those rights relating to non-discrimination,fair treatment and respect for privacy to be the most relevant and to have the greatest potential impact on its key stakeholdergroups of customers, employees and suppliers.
The Board has overall responsibility for ensuring the Group upholds and promotes respect for human rights. The Group seeks to anticipate, prevent and mitigate any potential negative human rights impacts as well as enhance positive impacts through its policiesand procedures and, in particular, through its policies regarding employment, equality and diversity, treating its stakeholders and customers fairly and information security. Group policies seek to ensure that employees comply with the relevant legislation andregulations in place to promote good practice. The Group’s policies are formulated and kept up to date and communicated to all employees through the Staff Policy Manual. The Group has not been made aware of any incident in which the organisation’s activities have resulted in an abuse of human rights.
DirectorsThe names and biographical details of the present Directors of the Company are given on pages 36 to 37. Lawrence Hutchings was appointed on 13 June 2017. Ken Ford and John Clare’s resignations were effective from 9 May 2017 and 13 June 2017, respectively.All other Directors served for the full year.
All current Directors will retire and, being eligible, offer themselves for re-election at the 2018 Annual General Meeting.
Directors’ interests in the share capital and equity of the Company at the year-end are contained in the Directors’ RemunerationReport on page 60. There were no contracts of significance subsisting during or at the end of the year in which a Director of theCompany was materially interested. No Director had a material interest in the share capital of other Group companies during the year.
In connection with the Parkdev Group of Investors (“Parkdev”) acquisition of shares in the Company in 2009 and pursuant to the Relationship Agreement that Parkdev and the Company entered into in 2009, the Company agreed, upon request, to appoint two Non-Executive Directors nominated by Parkdev to the Board for so long as they own 20% or more of the issued ordinary share capital in the Company and one Non-Executive Director to the Board if they own less than 20%, but not less than 15%. Louis Norvaland Wessel Hamman are the Parkdev nominated non-executive directors. All other Directors are appointed in a personal capacity.
The Company maintains insurance for the Directors in respect of liabilities arising from the performance of their duties.
Listing Rule 9.8.4R disclosuresThe following table sets out where disclosures required in compliance with Listing Rule 9.8.4R are located.
Interest capitalised and tax relief n/aDetails of long-term incentive schemes Pages 56 to 57Waiver of emoluments by a Director n/aWaiver of future emoluments by a Director n/aNon pre-emptive issues of equity for cash n/aNon pre-emptive issues of equity for cash by major subsidiary undertakings n/aParent company participation in a placing by a listed subsidiary n/aContracts of significance n/aProvision of services by a controlling shareholder n/aShareholder waivers of dividends Shares held by Employee Share Ownership
Trust – see section belowShareholder waivers of future dividends Shares held by Employee Share Ownership
Trust – see section belowAgreements with controlling shareholders n/a
Substantial shareholdings As at 26 March 2018 (the latest practicable date prior to the issue of this report) the Company has been notified of the followinginterests in its issued ordinary share capital:
No. of shares %
MStead Limited 69,978,847 9.74PDI Investment Holdings 65,462,806 9.11ICAMAP Investments 53,147,931 7.40BlackRock 41,778,069 5.82Peens Family Holdings 32,440,000 4.52Hargreave Hale 32,300,000 4.50New Fortress Finance Holdings 27,535,263 3.83Thames River Capital 24,768,962 3.45Aberforth Partners 23,640,935 3.29
MStead Limited and PDI Investment Holdings are part of the Parkdev Group of investors.
DIRECTORS’ REPORT CONTINUED
capreg.com Stock Code: CAL capreg.com
GOVERNANCE
63
Capital & Regional AR2017 Governance.indd 63 10/04/2018 16:05:29

Capital & Regional plc Annual Report and Accounts for the year ended 30 December 2017
The Directors are responsible for preparing the Annual Report and the financial statements in accordance with applicable law andregulations.
Company law requires the Directors to prepare financial statements for each financial year. Under that law the Directors are required to prepare the Group financial statements in accordance with International Financial Reporting Standards (IFRSs) as adopted by the European Union and Article 4 of the IAS Regulation and have elected to prepare the parent Company financial statements in accordance with FRS 101, as published by the Financial Reporting Council, and applicable law in the United Kingdom.Under company law the Directors must not approve the financial statements unless they are satisfied that they give a true and fairview of the state of affairs of the Company and of the profit or loss of the Company for that year.
In preparing the parent Company financial statements, the Directors are required to:
• select suitable accounting policies and then apply them consistently;• make judgements and accounting estimates that are reasonable and prudent;• state whether applicable UK Accounting Standards have been followed, subject to any material departures disclosed and
explained in the financial statements; and• prepare the financial statements on the going concern basis unless it is inappropriate to presume that the Company will
continue in business.
In preparing the Group financial statements, International Accounting Standard 1 requires that Directors:
• properly select and apply accounting policies;• present information, including accounting policies, in a manner that provides relevant, reliable, comparable and understandable
information;• provide additional disclosures when compliance with the specific requirements in IFRSs are insufficient to enable users to
understand the impact of particular transactions, other events and conditions on the entity’s financial position and financial performance; and
• make an assessment of the Company’s ability to continue as a going concern.
The Directors are responsible for keeping adequate accounting records that are sufficient to show and explain the Company’s transactions and disclose with reasonable accuracy at any time the financial position of the Company, and to enable them to ensure that the financial statements and the Directors’ Remuneration Report comply with the Companies Act 2006. They are also responsible for safeguarding the assets of the Company and hence for taking reasonable steps for the prevention and detection offraud and other irregularities.
The Directors are responsible for the maintenance and integrity of the corporate and financial information included on the Company’s website. Legislation in the UK governing the preparation and dissemination of financial statements may differ from legislation in other jurisdictions.
Directors’ responsibilities statementWe confirm that to the best of our knowledge:
• the financial statements, prepared in accordance with the relevant financial reporting framework, give a true and fair view of the assets, liabilities, financial position and profit or loss of the Company and the undertakings included in the consolidation taken as a whole;
• the Strategic Report includes a fair review of the development and performance of the business and the position of the Company and the undertakings included in the consolidation as a whole, together with a description of the principal risks and uncertaintiesthat they face; and
• the Annual Report and financial statements, taken as a whole, are fair, balanced and understandable and provide the information necessary for shareholders to assess the Company’s performance, business model and strategy.
This responsibility statement was approved by the Board of Directors on 5 April 2018 and is signed on its behalf by:
Lawrence HutchingsChief Executive
Charles StaveleyGroup Finance Director
EmployeesThe Group is committed to a policy that treats all of its employees and job applicants equally. No employee or potential employeereceives less favourable treatment or consideration on the grounds of race, colour, religion, nationality, ethnic origin, sex, sexualorientation, marital status, or disability. Nor is any employee or potential employee disadvantaged by any conditions of employmentor requirements of the Group that cannot be justified as necessary on operational grounds.
We give full consideration to applications for employment from disabled persons where the requirements of the job can be adequately fulfilled by people with disabilities. We endeavour to retain the employment of, and arrange suitable retraining for, any employee who becomes disabled during their employment as well as providing training, career development and promotion to disabled employees wherever appropriate.
During the year, the Group maintained arrangements to provide employees with information on matters of concern to them, to regularly consult employees for views on matters affecting them, to encourage employee involvement in the Group’s performance through share schemes, and to make all employees aware of financial and economic factors affecting the performance of the Group.
At 30 December 2017 the total number of employees was as follows:
Employees Male Female TotalDirectors1 8 1 9Employees – Group 22 23 45Employees – Wholly-owned assets 63 21 84Employees – Snozone 160 97 257
1. The Group defines its senior management as the members of the Executive Committee which at 30 December 2017 consisted of the Executive Directors and the Group’s Investment Director, James Ryman.
Political donationsThe Group has not made any political donations during the year and intends to continue its policy of not doing so for the foreseeable future.
Auditor’s informationThe Directors who held office at the date of approval of this Directors’ Report confirm that, so far as they are each aware, there is no relevant audit information of which the Company’s Auditor is unaware; and each Director has taken all the steps that they ought to have taken as a Director to make themselves aware of any relevant audit information and to establish that the Company’s Auditoris aware of that information. This confirmation is given and should be interpreted in accordance with the provisions of s418 of the Companies Act 2006. A resolution to reappoint Deloitte LLP as the Company’s Auditor will be proposed at the forthcoming AGM.
Annual General MeetingA separate document, the Notice of Annual General Meeting 2017, accompanies this report and accounts and explains the business to be covered at the Annual General Meeting of the Company to be held on 9 May 2018.
By order of the Board
Stuart WetherlyCompany Secretary 5 April 2018
Registered Company name: Capital & Regional plc Registered Company number: 01399411 Registered office: 22 Chapter Street, London SW1P 4NP
DIRECTORS’ REPORTCONTINUED
DIRECTORS’ RESPONSIBILITIES STATEMENT
Stock Code: CAL capreg.com Stock Code: CAL
64
Capital & Regional AR2017 Governance.indd 64 10/04/2018 16:05:29

The Directors are responsible for preparing the Annual Report and the financial statements in accordance with applicable law andregulations.
Company law requires the Directors to prepare financial statements for each financial year. Under that law the Directors are required to prepare the Group financial statements in accordance with International Financial Reporting Standards (IFRSs) as adopted by the European Union and Article 4 of the IAS Regulation and have elected to prepare the parent Company financial statements in accordance with FRS 101, as published by the Financial Reporting Council, and applicable law in the United Kingdom.Under company law the Directors must not approve the financial statements unless they are satisfied that they give a true and fairview of the state of affairs of the Company and of the profit or loss of the Company for that year.
In preparing the parent Company financial statements, the Directors are required to:
• select suitable accounting policies and then apply them consistently;• make judgements and accounting estimates that are reasonable and prudent;• state whether applicable UK Accounting Standards have been followed, subject to any material departures disclosed and
explained in the financial statements; and• prepare the financial statements on the going concern basis unless it is inappropriate to presume that the Company will
continue in business.
In preparing the Group financial statements, International Accounting Standard 1 requires that Directors:
• properly select and apply accounting policies;• present information, including accounting policies, in a manner that provides relevant, reliable, comparable and understandable
information;• provide additional disclosures when compliance with the specific requirements in IFRSs are insufficient to enable users to
understand the impact of particular transactions, other events and conditions on the entity’s financial position and financial performance; and
• make an assessment of the Company’s ability to continue as a going concern.
The Directors are responsible for keeping adequate accounting records that are sufficient to show and explain the Company’s transactions and disclose with reasonable accuracy at any time the financial position of the Company, and to enable them to ensure that the financial statements and the Directors’ Remuneration Report comply with the Companies Act 2006. They are also responsible for safeguarding the assets of the Company and hence for taking reasonable steps for the prevention and detection offraud and other irregularities.
The Directors are responsible for the maintenance and integrity of the corporate and financial information included on the Company’s website. Legislation in the UK governing the preparation and dissemination of financial statements may differ from legislation in other jurisdictions.
Directors’ responsibilities statementWe confirm that to the best of our knowledge:
• the financial statements, prepared in accordance with the relevant financial reporting framework, give a true and fair view of the assets, liabilities, financial position and profit or loss of the Company and the undertakings included in the consolidation taken as a whole;
• the Strategic Report includes a fair review of the development and performance of the business and the position of the Company and the undertakings included in the consolidation as a whole, together with a description of the principal risks and uncertaintiesthat they face; and
• the Annual Report and financial statements, taken as a whole, are fair, balanced and understandable and provide the information necessary for shareholders to assess the Company’s performance, business model and strategy.
This responsibility statement was approved by the Board of Directors on 5 April 2018 and is signed on its behalf by:
Lawrence HutchingsChief Executive
Charles StaveleyGroup Finance Director
EmployeesThe Group is committed to a policy that treats all of its employees and job applicants equally. No employee or potential employeereceives less favourable treatment or consideration on the grounds of race, colour, religion, nationality, ethnic origin, sex, sexualorientation, marital status, or disability. Nor is any employee or potential employee disadvantaged by any conditions of employmentor requirements of the Group that cannot be justified as necessary on operational grounds.
We give full consideration to applications for employment from disabled persons where the requirements of the job can be adequately fulfilled by people with disabilities. We endeavour to retain the employment of, and arrange suitable retraining for, any employee who becomes disabled during their employment as well as providing training, career development and promotion to disabled employees wherever appropriate.
During the year, the Group maintained arrangements to provide employees with information on matters of concern to them, to regularly consult employees for views on matters affecting them, to encourage employee involvement in the Group’s performance through share schemes, and to make all employees aware of financial and economic factors affecting the performance of the Group.
At 30 December 2017 the total number of employees was as follows:
Employees Male Female TotalDirectors1 8 1 9Employees – Group 22 23 45Employees – Wholly-owned assets 63 21 84Employees – Snozone 160 97 257
1. The Group defines its senior management as the members of the Executive Committee which at 30 December 2017 consisted of the Executive Directors and the Group’s Investment Director, James Ryman.
Political donationsThe Group has not made any political donations during the year and intends to continue its policy of not doing so for the foreseeable future.
Auditor’s informationThe Directors who held office at the date of approval of this Directors’ Report confirm that, so far as they are each aware, there is no relevant audit information of which the Company’s Auditor is unaware; and each Director has taken all the steps that they ought to have taken as a Director to make themselves aware of any relevant audit information and to establish that the Company’s Auditoris aware of that information. This confirmation is given and should be interpreted in accordance with the provisions of s418 of the Companies Act 2006. A resolution to reappoint Deloitte LLP as the Company’s Auditor will be proposed at the forthcoming AGM.
Annual General MeetingA separate document, the Notice of Annual General Meeting 2017, accompanies this report and accounts and explains the business to be covered at the Annual General Meeting of the Company to be held on 9 May 2018.
By order of the Board
Stuart WetherlyCompany Secretary 5 April 2018
Registered Company name: Capital & Regional plc Registered Company number: 01399411 Registered office: 22 Chapter Street, London SW1P 4NP
DIRECTORS’ REPORTCONTINUED
DIRECTORS’ RESPONSIBILITIES STATEMENT
capreg.com Stock Code: CAL capreg.com
GOVERNANCE
65
Capital & Regional AR2017 Governance.indd 65 10/04/2018 16:05:29

Capital & Regional plc Annual Report and Accounts for the year ended 30 December 2017
Conclusions relating to going concern, principal risks and viability statement
Going concernWe have reviewed the Directors’ statement in note 1 to the financial statements about whether they considered it appropriate to adopt the going concern basis of accounting in preparing them and their identification of any material uncertainties to the Group’s and Company’s ability to continue to do so over a period of at least twelve months from the date of approval of the financial statements.
We are required to state whether we have anything material to add or draw attention to in relation to that statement required by Listing Rule 9.8.6R(3) and report if the statement is materially inconsistent with our knowledge obtained in the audit.
We confirm that we have nothing material to report, add or draw attention to in respect of these matters.
Principal risks and viability statementBased solely on reading the Directors’ statements and considering whether they were consistent with the knowledge we obtained in the course of the audit, including the knowledge obtained in the evaluation of the Directors’ assessment of the Group’s and the Company’s ability to continue as a going concern, we are required to state whether we have anything material to add or draw attention to in relation to:
• the disclosures on pages 26 to 30 that describe the principal risks and explain how they are being managed or mitigated;
• the Directors’ confirmation on page 26 that they have carried out a robust assessment of the principal risks facing the Group, including those that would threaten its business model, future performance, solvency or liquidity; or
• the Directors’ explanation on page 30 as to how they have assessed the prospects of the Group, over what period they have done so and why they consider that period to be appropriate, and their statement as to whether they have a reasonable expectation that the Group will be able to continue in operation and meet its liabilities as they fall due over the period of their assessment, including any related disclosures drawing attention to any necessary qualifications or assumptions.
We are also required to report whether the Directors’ statement relating to the prospects of the Group required by Listing Rule 9.8.6R(3) is materially inconsistent with our knowledge obtained in the audit.
We confirm that we have nothing material to report, add or draw attention to in respect of these matters.
Report on the audit of the financial statementsOpinionIn our opinion:• the financial statements give a true and fair view of the state of the Group’s and of the parent Company’s affairs as at
30 December 2017 and of the Group’s profit for the year then ended;• the Group financial statements have been properly prepared in accordance with International Financial Reporting Standards
(IFRSs) as adopted by the European Union and IFRSs as issued by the International Accounting Standards Board (IASB);• the parent Company financial statements have been properly prepared in accordance with United Kingdom Generally Accepted
Accounting Practice, including FRS 101 “Reduced Disclosure Framework”; and• the financial statements have been prepared in accordance with the requirements of the Companies Act 2006 and, as regards
the Group financial statements, Article 4 of the IAS Regulation.
We have audited the financial statements of Capital and Regional plc (the “parent Company”) and its subsidiaries (the “Group”) whichcomprise:
• the consolidated income statement;• the consolidated statement of comprehensive income;• the consolidated and parent Company balance sheets;• the consolidated and parent Company statements of changes in equity;• the consolidated cash flow statement; and• the related notes 1 to 29.
The financial reporting framework that has been applied in the preparation of the Group financial statements is applicable law andIFRSs as adopted by the European Union. The financial reporting framework that has been applied in the preparation of the parentCompany financial statements is applicable law and United Kingdom Accounting Standards, including FRS 101 “Reduced Disclosure Framework”.
Basis for opinioneconductedourauditinaccordancewithInternationalStandardsonAuditing( )(ISAs( ))andapplicablelaw.Our
responsibilities under those standards are further described in the Auditor’s responsibilities for the audit of the financial statementssection of our report.
We are independent of the Group and the parent Company in accordance with the ethical requirements that are relevant to our audit of the financial statements in the UK, including the FRC’s Ethical Standard as applied to listed public interest entities, and we have fulfilled our other ethical responsibilities in accordance with these requirements. We confirm that the non-audit servicesprohibited by the FRC’s Ethical Standard were not provided to the Group or the parent Company.
We believe that the audit evidence we have obtained is sufficient and appropriate to provide a basis for our opinion.
Summary of our audit approach
Key Audit Matters The key audit matters that we identified in the current year were:
• Property valuations• Going concern and covenant compliance• Impairment of Company only investments
Materiality The materiality that we used in the current year was £9.5 million which was determined on the basis of 2% of net assets.
Scoping OurgroupauditwasscopedbyobtaininganunderstandingoftheGroupanditsenvironment,including Group-wide controls, and assessing the risks of material misstatement at the Group and componentlevels.Ourauditscopingprovidesfullscopeauditcoverageof93 (2017:90 )ofnetassets and 96% (2017: 90%) of Adjusted Profit.
Significant changes in our approach
In the prior year we reported on the risk of fraud in revenue recognition as a key audit matter. In the current year we reassessed our identification of the risks of material misstatement due to fraud and considered this to relate to the valuation of the property portfolio, as discussed below.
INDEPENDENT AUDITOR’S REPORTTO THE MEMBERS OF CAPITAL & REGIONAL PLC
Stock Code: CAL capreg.com Stock Code: CAL
66
Capital & Regional AR2017 Governance.indd 66 10/04/2018 16:05:29

Conclusions relating to going concern, principal risks and viability statement
Going concernWe have reviewed the Directors’ statement in note 1 to the financial statements about whether they considered it appropriate to adopt the going concern basis of accounting in preparing them and their identification of any material uncertainties to the Group’s and Company’s ability to continue to do so over a period of at least twelve months from the date of approval of the financial statements.
We are required to state whether we have anything material to add or draw attention to in relation to that statement required by Listing Rule 9.8.6R(3) and report if the statement is materially inconsistent with our knowledge obtained in the audit.
We confirm that we have nothing material to report, add or draw attention to in respect of these matters.
Principal risks and viability statementBased solely on reading the Directors’ statements and considering whether they were consistent with the knowledge we obtained in the course of the audit, including the knowledge obtained in the evaluation of the Directors’ assessment of the Group’s and the Company’s ability to continue as a going concern, we are required to state whether we have anything material to add or draw attention to in relation to:
• the disclosures on pages 26 to 30 that describe the principal risks and explain how they are being managed or mitigated;
• the Directors’ confirmation on page 26 that they have carried out a robust assessment of the principal risks facing the Group, including those that would threaten its business model, future performance, solvency or liquidity; or
• the Directors’ explanation on page 30 as to how they have assessed the prospects of the Group, over what period they have done so and why they consider that period to be appropriate, and their statement as to whether they have a reasonable expectation that the Group will be able to continue in operation and meet its liabilities as they fall due over the period of their assessment, including any related disclosures drawing attention to any necessary qualifications or assumptions.
We are also required to report whether the Directors’ statement relating to the prospects of the Group required by Listing Rule 9.8.6R(3) is materially inconsistent with our knowledge obtained in the audit.
We confirm that we have nothing material to report, add or draw attention to in respect of these matters.
Report on the audit of the financial statementsOpinionIn our opinion:• the financial statements give a true and fair view of the state of the Group’s and of the parent Company’s affairs as at
30 December 2017 and of the Group’s profit for the year then ended;• the Group financial statements have been properly prepared in accordance with International Financial Reporting Standards
(IFRSs) as adopted by the European Union and IFRSs as issued by the International Accounting Standards Board (IASB);• the parent Company financial statements have been properly prepared in accordance with United Kingdom Generally Accepted
Accounting Practice, including FRS 101 “Reduced Disclosure Framework”; and• the financial statements have been prepared in accordance with the requirements of the Companies Act 2006 and, as regards
the Group financial statements, Article 4 of the IAS Regulation.
We have audited the financial statements of Capital and Regional plc (the “parent Company”) and its subsidiaries (the “Group”) whichcomprise:
• the consolidated income statement;• the consolidated statement of comprehensive income;• the consolidated and parent Company balance sheets;• the consolidated and parent Company statements of changes in equity;• the consolidated cash flow statement; and• the related notes 1 to 29.
The financial reporting framework that has been applied in the preparation of the Group financial statements is applicable law andIFRSs as adopted by the European Union. The financial reporting framework that has been applied in the preparation of the parentCompany financial statements is applicable law and United Kingdom Accounting Standards, including FRS 101 “Reduced Disclosure Framework”.
Basis for opinioneconductedourauditinaccordancewithInternationalStandardsonAuditing( )(ISAs( ))andapplicablelaw.Our
responsibilities under those standards are further described in the Auditor’s responsibilities for the audit of the financial statementssection of our report.
We are independent of the Group and the parent Company in accordance with the ethical requirements that are relevant to our audit of the financial statements in the UK, including the FRC’s Ethical Standard as applied to listed public interest entities, and we have fulfilled our other ethical responsibilities in accordance with these requirements. We confirm that the non-audit servicesprohibited by the FRC’s Ethical Standard were not provided to the Group or the parent Company.
We believe that the audit evidence we have obtained is sufficient and appropriate to provide a basis for our opinion.
Summary of our audit approach
Key Audit Matters The key audit matters that we identified in the current year were:
• Property valuations• Going concern and covenant compliance• Impairment of Company only investments
Materiality The materiality that we used in the current year was £9.5 million which was determined on the basis of 2% of net assets.
Scoping OurgroupauditwasscopedbyobtaininganunderstandingoftheGroupanditsenvironment,including Group-wide controls, and assessing the risks of material misstatement at the Group and componentlevels.Ourauditscopingprovidesfullscopeauditcoverageof93 (2017:90 )ofnetassets and 96% (2017: 90%) of Adjusted Profit.
Significant changes in our approach
In the prior year we reported on the risk of fraud in revenue recognition as a key audit matter. In the current year we reassessed our identification of the risks of material misstatement due to fraud and considered this to relate to the valuation of the property portfolio, as discussed below.
INDEPENDENT AUDITOR’S REPORTTO THE MEMBERS OF CAPITAL & REGIONAL PLC
capreg.com Stock Code: CAL capreg.com
GOVERNANCE
67
Capital & Regional AR2017 Governance.indd 67 10/04/2018 16:05:30

Capital & Regional plc Annual Report and Accounts for the year ended 30 December 2017
Going concern and covenant compliance
Risk description As at 30 December 2017, external borrowings had a carrying value of £422.2 million at 30 December 2017 (30 December 2016: £360.8 million). This includes the Group’s £30 million central revolving credit facility, which matures in January 2022.
We identified a key audit matter relating to the ability of the Group to meet the external loan covenant requirements during the year and for a period of one year from the date of this Auditor’s Report. Whilst there is headroom in the borrowing to property valuation ratio compared to the covenant requirement over this period, a significant downwards movement in property valuations could impact on this headroom. In the unlikely event of a significant fall in property valuations or rental income, the Group may not meet its covenant requirements.
Management’s consideration of the going concern basis of preparation is set out in note 1 to the Group financial statements. Management have adopted the going concern basis of accounting for the Group and parent Company; they have concluded that there are no material uncertainties that may cast significant doubt over the Group’s and parent Company’s ability to adopt this basis for a period of at least twelve months from the date when the financial statements are authorised for issue.
The Audit Committee’s discussion of this key audit matter is set out on page 44.
How the scope of our audit responded to the risk
• We critically assessed the appropriateness of the design and implementation of the Group’s key controls to address the risk of non-compliance with covenants and the going concern status of the Group.
• We challenged the judgements and assumptions applied by management in their going concern assessment and associated forecasts of financial performance and financial position. These included modelling alternative scenarios taking consideration of projected capital expenditure, assumptions around asset sales and purchases, discount rates applied to future cash flows, current business and economic trends and significant developments during and subsequent to the year ended 30 December 2017.
Key observations From the results of our work we concur with management’s conclusions on going concern.
Impairment of company only investments
Risk description There is a risk that the carrying value of the investments and intercompany debtors cannot be supported. The accuracy of forecast future cash flows to support the carrying values of the investments is a key area of judgement and is identified as a significant risk. In particular, this relates to the reasonableness of cash flow forecasts, long-term growth rates and the discount rates applied in the discounted cash flow calculations used to support investments held at above net asset value of the subsidiaries.
Investments had a carrying value of £453.7 million at 30 December 2017 (30 December 2016: £330.0 million), comprising 96% (30 December 2016: 72%) of the parent company’s assets. Intercompany debtors had a carrying value of £18.6 million at 30 December 2017 (30 December 2016: £125.2 million), comprising 3.92% (30 December 2015: 28%) of the parent Company’s assets.
Investments are subject to an impairment review using discount rates between the range of 7.4% and 9.5%. The investment in the year reflects a reorganisation of the Group completed in parallel with and following the completion of the purchase of Ilford Shopping centre and refinancing of the five Mall shopping centre assets that completed on 4 January 2017.
The accounting policies for both investments and intercompany debtors are set out in note A to the parent Company financial statements.
How the scope of our audit responded to the risk
• We tested the appropriateness of the design and implementation of the company’s key controls to address the risk of impairment of investments and debtor balances.
• We challenged management’s investment impairment model and the cash flow forecasts employed therein, including comparison of the input assumptions to externally and internally derived data with the assistance of our internal valuations specialists. The inputs considered included the cash flow projections and discount rates.
• We also assessed whether the forecasts employed are consistent with those used to support other judgements in the financial statements.
Key observations We concur with the level of impairment recognised by management for all investments. We consider that the carrying value of investment and intercompany debtor balances is appropriate.
Key audit mattersKey audit matters are those matters that, in our professional judgement, were of most significance in our audit of the financialstatements of the current period and include the most significant assessed risks of material misstatement (whether or not due tofraud) that we identified. These matters included those which had the greatest effect on: the overall audit strategy, the allocation of resources in the audit; and directing the efforts of the engagement team.
These matters were addressed in the context of our audit of the financial statements as a whole, and in forming our opinion thereon, and we do not provide a separate opinion on these matters.
Property valuations
Risk description Investment property has a carrying value of £930.6 million at 30 December 2017 (30 December 2016: £838.5 million), comprising 92% (30 December 2016: 89%) of the Group’s assets. The portfolio consists of seven shopping centres within the Group. The Group has a further interest in investment properties held by an associate entity, valued at £138.4 million (100%) (30 December 2016: £150.0 million (100%)) within the associate. These are disclosed in note 10b to the Group financial statements.
We deem the fair value of the Group’s property portfolio to be a significant area of focus due to the level and nature of the judgements and estimates from Management that form inputs into the valuation process performed by the Group’s independent valuers, such as occupancy rates, lease incentives, break clauses and yields. Changes in these assumptions and judgements could lead to significant movements in property values and consequently unrealised gains or losses in the consolidated income statement.
There is also a risk of fraud risk in relation to the valuation of the property portfolio, where the use of assumptions and judgements is more critical and could lead to material misstatement.
The accounting policy for investment property is set out in note 1 to the Group financial statements including management’s assessment of this as a critical accounting judgement.
The Audit Committee’s discussion of this key audit matter is set out on page 44.
How the scope of our audit responded to the risk
• We tested the appropriateness of the design and implementation of the Group’s key controls to address the risk over property valuations.
• We met with the third party valuers appointed by management to value the property portfolio and challenged the significant judgements and assumptions applied in their valuation model. We verified movements in the key judgements and assumptions and benchmarked the inputs against market data with the assistance of our internal valuation specialists.
• We analysed the individual property valuations to understand significant movements against prior year and comparative market evidence considered by the valuers.
• We tested the integrity of the information provided to the valuers by management pertaining to rental income, purchasers’ costs and occupancy.
• We considered the competence and independence of the external valuers.
Key observations We found that management’s judgements and assumptions fell within the reasonable range which is based on third party market commentator reports on market movements, and are satisfied that the value of investment properties is reasonably stated.
INDEPENDENT AUDITOR’S REPORTTO THE MEMBERS OF CAPITAL & REGIONAL PLC
Stock Code: CAL capreg.com Stock Code: CAL
68
Capital & Regional AR2017 Governance.indd 68 10/04/2018 16:05:30

Going concern and covenant compliance
Risk description As at 30 December 2017, external borrowings had a carrying value of £422.2 million at 30 December 2017 (30 December 2016: £360.8 million). This includes the Group’s £30 million central revolving credit facility, which matures in January 2022.
We identified a key audit matter relating to the ability of the Group to meet the external loan covenant requirements during the year and for a period of one year from the date of this Auditor’s Report. Whilst there is headroom in the borrowing to property valuation ratio compared to the covenant requirement over this period, a significant downwards movement in property valuations could impact on this headroom. In the unlikely event of a significant fall in property valuations or rental income, the Group may not meet its covenant requirements.
Management’s consideration of the going concern basis of preparation is set out in note 1 to the Group financial statements. Management have adopted the going concern basis of accounting for the Group and parent Company; they have concluded that there are no material uncertainties that may cast significant doubt over the Group’s and parent Company’s ability to adopt this basis for a period of at least twelve months from the date when the financial statements are authorised for issue.
The Audit Committee’s discussion of this key audit matter is set out on page 44.
How the scope of our audit responded to the risk
• We critically assessed the appropriateness of the design and implementation of the Group’s key controls to address the risk of non-compliance with covenants and the going concern status of the Group.
• We challenged the judgements and assumptions applied by management in their going concern assessment and associated forecasts of financial performance and financial position. These included modelling alternative scenarios taking consideration of projected capital expenditure, assumptions around asset sales and purchases, discount rates applied to future cash flows, current business and economic trends and significant developments during and subsequent to the year ended 30 December 2017.
Key observations From the results of our work we concur with management’s conclusions on going concern.
Impairment of company only investments
Risk description There is a risk that the carrying value of the investments and intercompany debtors cannot be supported. The accuracy of forecast future cash flows to support the carrying values of the investments is a key area of judgement and is identified as a significant risk. In particular, this relates to the reasonableness of cash flow forecasts, long-term growth rates and the discount rates applied in the discounted cash flow calculations used to support investments held at above net asset value of the subsidiaries.
Investments had a carrying value of £453.7 million at 30 December 2017 (30 December 2016: £330.0 million), comprising 96% (30 December 2016: 72%) of the parent company’s assets. Intercompany debtors had a carrying value of £18.6 million at 30 December 2017 (30 December 2016: £125.2 million), comprising 3.92% (30 December 2015: 28%) of the parent Company’s assets.
Investments are subject to an impairment review using discount rates between the range of 7.4% and 9.5%. The investment in the year reflects a reorganisation of the Group completed in parallel with and following the completion of the purchase of Ilford Shopping centre and refinancing of the five Mall shopping centre assets that completed on 4 January 2017.
The accounting policies for both investments and intercompany debtors are set out in note A to the parent Company financial statements.
How the scope of our audit responded to the risk
• We tested the appropriateness of the design and implementation of the company’s key controls to address the risk of impairment of investments and debtor balances.
• We challenged management’s investment impairment model and the cash flow forecasts employed therein, including comparison of the input assumptions to externally and internally derived data with the assistance of our internal valuations specialists. The inputs considered included the cash flow projections and discount rates.
• We also assessed whether the forecasts employed are consistent with those used to support other judgements in the financial statements.
Key observations We concur with the level of impairment recognised by management for all investments. We consider that the carrying value of investment and intercompany debtor balances is appropriate.
Key audit mattersKey audit matters are those matters that, in our professional judgement, were of most significance in our audit of the financialstatements of the current period and include the most significant assessed risks of material misstatement (whether or not due tofraud) that we identified. These matters included those which had the greatest effect on: the overall audit strategy, the allocation of resources in the audit; and directing the efforts of the engagement team.
These matters were addressed in the context of our audit of the financial statements as a whole, and in forming our opinion thereon, and we do not provide a separate opinion on these matters.
Property valuations
Risk description Investment property has a carrying value of £930.6 million at 30 December 2017 (30 December 2016: £838.5 million), comprising 92% (30 December 2016: 89%) of the Group’s assets. The portfolio consists of seven shopping centres within the Group. The Group has a further interest in investment properties held by an associate entity, valued at £138.4 million (100%) (30 December 2016: £150.0 million (100%)) within the associate. These are disclosed in note 10b to the Group financial statements.
We deem the fair value of the Group’s property portfolio to be a significant area of focus due to the level and nature of the judgements and estimates from Management that form inputs into the valuation process performed by the Group’s independent valuers, such as occupancy rates, lease incentives, break clauses and yields. Changes in these assumptions and judgements could lead to significant movements in property values and consequently unrealised gains or losses in the consolidated income statement.
There is also a risk of fraud risk in relation to the valuation of the property portfolio, where the use of assumptions and judgements is more critical and could lead to material misstatement.
The accounting policy for investment property is set out in note 1 to the Group financial statements including management’s assessment of this as a critical accounting judgement.
The Audit Committee’s discussion of this key audit matter is set out on page 44.
How the scope of our audit responded to the risk
• We tested the appropriateness of the design and implementation of the Group’s key controls to address the risk over property valuations.
• We met with the third party valuers appointed by management to value the property portfolio and challenged the significant judgements and assumptions applied in their valuation model. We verified movements in the key judgements and assumptions and benchmarked the inputs against market data with the assistance of our internal valuation specialists.
• We analysed the individual property valuations to understand significant movements against prior year and comparative market evidence considered by the valuers.
• We tested the integrity of the information provided to the valuers by management pertaining to rental income, purchasers’ costs and occupancy.
• We considered the competence and independence of the external valuers.
Key observations We found that management’s judgements and assumptions fell within the reasonable range which is based on third party market commentator reports on market movements, and are satisfied that the value of investment properties is reasonably stated.
INDEPENDENT AUDITOR’S REPORTTO THE MEMBERS OF CAPITAL & REGIONAL PLC
capreg.com Stock Code: CAL capreg.com
GOVERNANCE
69
Capital & Regional AR2017 Governance.indd 69 10/04/2018 16:05:30

Capital & Regional plc Annual Report and Accounts for the year ended 30 December 2017
Other informationThe Directors are responsible for the other information. The other information comprises the information included in the annual report, other than the financial statements and our Auditor’s report thereon.
Ouropiniononthefinancialstatementsdoesnotcovertheotherinformationand,excepttotheextent otherwise explicitly stated in our report, we do not express any form of assurance conclusion thereon.
In connection with our audit of the financial statements, our responsibility is to read the other information and, in doing so, consider whether the other information is materially inconsistent with the financial statements or our knowledge obtained in the audit or otherwise appears to be materially misstated.
If we identify such material inconsistencies or apparent material misstatements, we are required to determine whether there is a material misstatement in the financial statements or a material misstatement of the other information. If, based on the work we have performed, we conclude that there is a material misstatement of this other information, we are required to report that fact.
In this context, matters that we are specifically required to report to you as uncorrected material misstatements of the other information include where we conclude that:
• Fair, balanced and understandable – the statement given by the Directors that they consider the annual report and financial statements taken as a whole is fair, balanced and understandable and provides the information necessary for shareholders to assess the Group’s position and performance, business model and strategy, is materially inconsistent with our knowledge obtained in the audit; or
• Audit committee reporting – the section describing the work of the audit committee does not appropriately address matters communicated by us to the audit committee; or
• Directors’ statement of compliance with the UK Corporate Governance Code – the parts of the Directors’ statement required under the Listing Rules relating to the Company’s compliance with the UK Corporate Governance Code containing provisions specified for review by the Auditor in accordance with Listing Rule 9.8.10R(2) do not properly disclose a departure from a relevant provision of the UK Corporate Governance Code.
We have nothing to report in respect of these matters.
Responsibilities of DirectorsAs explained more fully in the Directors’ responsibilities statement, the Directors are responsible for the preparation of the financial statements and for being satisfied that they give a true and fair view, and for such internal control as the Directors determine is necessary to enable the preparation of financial statements that are free from material misstatement, whether due to fraud or error.
In preparing the financial statements, the Directors are responsible for assessing the Group’s and the parent Company’s abilityto continue as a going concern, disclosing as applicable, matters related to going concern and using the going concern basis ofaccounting unless the Directors either intend to liquidate the Group or the parent Company or to cease operations, or have no realistic alternative but to do so.
Our application of materialityWe define materiality as the magnitude of misstatement in the financial statements that makes it probable that the economic decisions of a reasonably knowledgeable person would be changed or influenced. We use materiality both in planning the scope ofour audit work and in evaluating the results of our work.
Based on our professional judgement, we determined materiality for the financial statements as a whole as follows:
Group financial statements Parent financial statements
Materiality £9.5 million (2016: £7.0 million) £9.15 million (2016: £3.5 million)
Basis for determiningmateriality
We determined materiality to be 2% of net assets (2016: 1.5% of net assets).
We applied a lower threshold of £1.4 million (2016: £1.2 million) for testing of all balances impacting Adjusted Profit (as defined in Note 1 to the Group financial statements), which is less than 5% of Adjusted Profit (2016: less than 5% of Adjusted Profit).
We determined materiality to be 2% of net assets (2016: 1.5% of net assets).
Rationale for the benchmark applied
We used net assets as benchmark when determining materiality as it is considered to be the most critical financial performance measure for the Group.
We applied a lower threshold of £1.4 million (2016: £1.2 million) for testing of all balances impacting Adjusted Profit on the basis that it is a key metric used by management, is the basis of the discussion of the financial performance in the strategic report and is a metric used by analysts.
We used net assets as benchmark when determining materiality as it is considered to be the most critical financial performance measure for the Company as a holding company.
We agreed with the Audit Committee that we would report to the Committee all audit differences in excess of £280,000 (2016: £140,000), as well as differences below that threshold that, in our view, warranted reporting on qualitative grounds. We also reportto the Audit Committee on disclosure matters that we identified when assessing the overall presentation of the financial statements.
An overview of the scope of our auditOurgroupauditwasscopedbyobtaininganunderstandingoftheGroupanditsenvironment,includingGroup-widecontrols,andassessing the risks of material misstatement at the Group and component levels.
Ourgroupauditscopefocusedprimarilyontheauditworkonthemajorlinesofbusiness.Thesemajorlinesofbusinessare holly-ownedassets,Other ShoppingCentres,Sno oneandGroup Central.TheseareincludedwithinindividualIFRS segmentsasdisclosedinnote2totheGroupfinancialstatements.Othermajorlinesofbusinessforscopingpurposesincludethe ingfisherLimitedPartnership,incorporatedintotheOtherShoppingCentresegmentandCapital RegionalProperty anagementLimited,which is incorporated into the Group / Central segment in note 2 to the Group financial statements.
All of the above were subject to a full scope audit with the exception of the Kingfisher Limited Partnership which was subject tospecific audit procedures around significant audit risks and key balances including investment property and loans payable. This is consistent with the prior year.
The businesses subject to a full scope audit or specific audit procedures account for 95% (2016: 95%) of the Group’s net assets,100% (2016: 100%) of the Group’s revenue and 99% (2016: 99%) of the Group’s Adjusted Profit. All investment properties have been included within the scope of our work. They were also selected to provide an appropriate basis for undertaking audit work toaddresstherisksofmaterialmisstatementidentifiedabove.AllcomponentsareauditeddirectlybytheGroupauditteam.Ourauditwork at each component was executed at levels of materiality applicable to each individual entity which were between 2% and 90%(2016: 2% and 90%) of Group materiality.
At the parent entity level we also tested the consolidation process and carried out analytical procedures to confirm our conclusionthat there were no significant risks of material misstatement of the aggregated financial information of the remaining componentsnot subject to full scope audit or specific audit procedures.
INDEPENDENT AUDITOR’S REPORTTO THE MEMBERS OF CAPITAL & REGIONAL PLC
Stock Code: CAL capreg.com Stock Code: CAL
70
Capital & Regional AR2017 Governance.indd 70 10/04/2018 16:05:30

Other informationThe Directors are responsible for the other information. The other information comprises the information included in the annual report, other than the financial statements and our Auditor’s report thereon.
Ouropiniononthefinancialstatementsdoesnotcovertheotherinformationand,excepttotheextent otherwise explicitly stated in our report, we do not express any form of assurance conclusion thereon.
In connection with our audit of the financial statements, our responsibility is to read the other information and, in doing so, consider whether the other information is materially inconsistent with the financial statements or our knowledge obtained in the audit or otherwise appears to be materially misstated.
If we identify such material inconsistencies or apparent material misstatements, we are required to determine whether there is a material misstatement in the financial statements or a material misstatement of the other information. If, based on the work we have performed, we conclude that there is a material misstatement of this other information, we are required to report that fact.
In this context, matters that we are specifically required to report to you as uncorrected material misstatements of the other information include where we conclude that:
• Fair, balanced and understandable – the statement given by the Directors that they consider the annual report and financial statements taken as a whole is fair, balanced and understandable and provides the information necessary for shareholders to assess the Group’s position and performance, business model and strategy, is materially inconsistent with our knowledge obtained in the audit; or
• Audit committee reporting – the section describing the work of the audit committee does not appropriately address matters communicated by us to the audit committee; or
• Directors’ statement of compliance with the UK Corporate Governance Code – the parts of the Directors’ statement required under the Listing Rules relating to the Company’s compliance with the UK Corporate Governance Code containing provisions specified for review by the Auditor in accordance with Listing Rule 9.8.10R(2) do not properly disclose a departure from a relevant provision of the UK Corporate Governance Code.
We have nothing to report in respect of these matters.
Responsibilities of DirectorsAs explained more fully in the Directors’ responsibilities statement, the Directors are responsible for the preparation of the financial statements and for being satisfied that they give a true and fair view, and for such internal control as the Directors determine is necessary to enable the preparation of financial statements that are free from material misstatement, whether due to fraud or error.
In preparing the financial statements, the Directors are responsible for assessing the Group’s and the parent Company’s abilityto continue as a going concern, disclosing as applicable, matters related to going concern and using the going concern basis ofaccounting unless the Directors either intend to liquidate the Group or the parent Company or to cease operations, or have no realistic alternative but to do so.
Our application of materialityWe define materiality as the magnitude of misstatement in the financial statements that makes it probable that the economic decisions of a reasonably knowledgeable person would be changed or influenced. We use materiality both in planning the scope ofour audit work and in evaluating the results of our work.
Based on our professional judgement, we determined materiality for the financial statements as a whole as follows:
Group financial statements Parent financial statements
Materiality £9.5 million (2016: £7.0 million) £9.15 million (2016: £3.5 million)
Basis for determiningmateriality
We determined materiality to be 2% of net assets (2016: 1.5% of net assets).
We applied a lower threshold of £1.4 million (2016: £1.2 million) for testing of all balances impacting Adjusted Profit (as defined in Note 1 to the Group financial statements), which is less than 5% of Adjusted Profit (2016: less than 5% of Adjusted Profit).
We determined materiality to be 2% of net assets (2016: 1.5% of net assets).
Rationale for the benchmark applied
We used net assets as benchmark when determining materiality as it is considered to be the most critical financial performance measure for the Group.
We applied a lower threshold of £1.4 million (2016: £1.2 million) for testing of all balances impacting Adjusted Profit on the basis that it is a key metric used by management, is the basis of the discussion of the financial performance in the strategic report and is a metric used by analysts.
We used net assets as benchmark when determining materiality as it is considered to be the most critical financial performance measure for the Company as a holding company.
We agreed with the Audit Committee that we would report to the Committee all audit differences in excess of £280,000 (2016: £140,000), as well as differences below that threshold that, in our view, warranted reporting on qualitative grounds. We also reportto the Audit Committee on disclosure matters that we identified when assessing the overall presentation of the financial statements.
An overview of the scope of our auditOurgroupauditwasscopedbyobtaininganunderstandingoftheGroupanditsenvironment,includingGroup-widecontrols,andassessing the risks of material misstatement at the Group and component levels.
Ourgroupauditscopefocusedprimarilyontheauditworkonthemajorlinesofbusiness.Thesemajorlinesofbusinessare holly-ownedassets,Other ShoppingCentres,Sno oneandGroup Central.TheseareincludedwithinindividualIFRS segmentsasdisclosedinnote2totheGroupfinancialstatements.Othermajorlinesofbusinessforscopingpurposesincludethe ingfisherLimitedPartnership,incorporatedintotheOtherShoppingCentresegmentandCapital RegionalProperty anagementLimited,which is incorporated into the Group / Central segment in note 2 to the Group financial statements.
All of the above were subject to a full scope audit with the exception of the Kingfisher Limited Partnership which was subject tospecific audit procedures around significant audit risks and key balances including investment property and loans payable. This is consistent with the prior year.
The businesses subject to a full scope audit or specific audit procedures account for 95% (2016: 95%) of the Group’s net assets,100% (2016: 100%) of the Group’s revenue and 99% (2016: 99%) of the Group’s Adjusted Profit. All investment properties have been included within the scope of our work. They were also selected to provide an appropriate basis for undertaking audit work toaddresstherisksofmaterialmisstatementidentifiedabove.AllcomponentsareauditeddirectlybytheGroupauditteam.Ourauditwork at each component was executed at levels of materiality applicable to each individual entity which were between 2% and 90%(2016: 2% and 90%) of Group materiality.
At the parent entity level we also tested the consolidation process and carried out analytical procedures to confirm our conclusionthat there were no significant risks of material misstatement of the aggregated financial information of the remaining componentsnot subject to full scope audit or specific audit procedures.
INDEPENDENT AUDITOR’S REPORTTO THE MEMBERS OF CAPITAL & REGIONAL PLC
capreg.com Stock Code: CAL capreg.com
GOVERNANCE
71
Capital & Regional AR2017 Governance.indd 71 10/04/2018 16:05:30

Capital & Regional plc Annual Report and Accounts for the year ended 30 December 2017
Other mattersAuditor tenureFollowing the recommendation of the audit committee, we were appointed by those charged with governance on 19 January 1998 to audit the financial statements for the year ending 31 December 1998 and subsequent financial periods. The period of total uninterrupted engagement including previous renewals and reappointments of the firm is 20 years, covering the years ending 31 December 1998 to 31 December 2017.
Consistency of the audit report with the additional report to the audit committeeOurauditopinionisconsistentwiththeadditionalreporttotheauditcommitteewearere uiredtoprovideinaccordancewithISAs(UK).
Georgina Robb FCA (Senior statutory auditor)For and on behalf of Deloitte LLPStatutory AuditorLondon, United Kingdom5 April 2018
Auditor’s responsibilities for the audit of the financial statementsOurobjectivesaretoobtainreasonableassuranceaboutwhetherthefinancialstatementsasawholearefreefrommaterialmisstatement, whether due to fraud or error, and to issue an Auditor’s report that includes our opinion. Reasonable assurance isa high level of assurance, but is not a guarantee that an audit conducted in accordance with ISAs (UK) will always detect a materialmisstatement when it exists. Misstatements can arise from fraud or error and are considered material if, individually or in theaggregate, they could reasonably be expected to influence the economic decisions of users taken on the basis of these financialstatements.
A further description of our responsibilities for the audit of the financial statements is located on the Financial Reporting Council’swebsite at: www.frc.org.uk/auditorsresponsibilities. This description forms part of our Auditor’s report.
Use of our reportThis report is made solely to the Company’s members, as a body, in accordance with Chapter 3 of Part 16 of the Companies Act 2006.OurauditworkhasbeenundertakensothatwemightstatetotheCompany’smembersthosematterswearere uiredtostate to them in an Auditor’s report and for no other purpose. To the fullest extent permitted by law, we do not accept or assumeresponsibility to anyone other than the Company and the Company’s members as a body, for our audit work, for this report, or forthe opinions we have formed.
Report on other legal and regulatory requirements
Opinions on other matters prescribed by the Companies Act 2006In our opinion the part of the Directors’ remuneration report to be audited has been properly prepared in accordance with the Companies Act 2006.
In our opinion, based on the work undertaken in the course of the audit:
• the information given in the strategic report and the Directors’ report for the financial year for which the financial statements are prepared is consistent with the financial statements; and
• the strategic report and the Directors’ report have been prepared in accordance with applicable legal requirements.
In the light of the knowledge and understanding of the Group and of the parent Company and their environment obtained in the course of the audit, we have not identified any material misstatements in the strategic report or the Directors’ report.
Matters on which we are required to report by exceptionAdequacy of explanations received and accounting recordsUnder the Companies Act 2006 we are required to report to you if, in our opinion:
• we have not received all the information and explanations we require for our audit; or• adequate accounting records have not been kept by the parent Company, or returns adequate for our
audit have not been received from branches not visited by us; or• the parent Company financial statements are not in agreement with the accounting records and returns.
We have nothing to report in respect of these matters.
Directors’ remunerationUnder the Companies Act 2006 we are also required to report if in our opinion certain disclosures of Directors’ remuneration have not been made or the part of the Directors’ remuneration report to be audited is not in agreement with the accounting records and returns.
We have nothing to report in respect of these matters.
INDEPENDENT AUDITOR’S REPORTTO THE MEMBERS OF CAPITAL & REGIONAL PLC
Stock Code: CAL capreg.com Stock Code: CAL
72
Capital & Regional AR2017 Governance.indd 72 10/04/2018 16:05:30

Other mattersAuditor tenureFollowing the recommendation of the audit committee, we were appointed by those charged with governance on 19 January 1998 to audit the financial statements for the year ending 31 December 1998 and subsequent financial periods. The period of total uninterrupted engagement including previous renewals and reappointments of the firm is 20 years, covering the years ending 31 December 1998 to 31 December 2017.
Consistency of the audit report with the additional report to the audit committeeOurauditopinionisconsistentwiththeadditionalreporttotheauditcommitteewearere uiredtoprovideinaccordancewithISAs(UK).
Georgina Robb FCA (Senior statutory auditor)For and on behalf of Deloitte LLPStatutory AuditorLondon, United Kingdom5 April 2018
Auditor’s responsibilities for the audit of the financial statementsOurobjectivesaretoobtainreasonableassuranceaboutwhetherthefinancialstatementsasawholearefreefrommaterialmisstatement, whether due to fraud or error, and to issue an Auditor’s report that includes our opinion. Reasonable assurance isa high level of assurance, but is not a guarantee that an audit conducted in accordance with ISAs (UK) will always detect a materialmisstatement when it exists. Misstatements can arise from fraud or error and are considered material if, individually or in theaggregate, they could reasonably be expected to influence the economic decisions of users taken on the basis of these financialstatements.
A further description of our responsibilities for the audit of the financial statements is located on the Financial Reporting Council’swebsite at: www.frc.org.uk/auditorsresponsibilities. This description forms part of our Auditor’s report.
Use of our reportThis report is made solely to the Company’s members, as a body, in accordance with Chapter 3 of Part 16 of the Companies Act 2006.OurauditworkhasbeenundertakensothatwemightstatetotheCompany’smembersthosematterswearere uiredtostate to them in an Auditor’s report and for no other purpose. To the fullest extent permitted by law, we do not accept or assumeresponsibility to anyone other than the Company and the Company’s members as a body, for our audit work, for this report, or forthe opinions we have formed.
Report on other legal and regulatory requirements
Opinions on other matters prescribed by the Companies Act 2006In our opinion the part of the Directors’ remuneration report to be audited has been properly prepared in accordance with the Companies Act 2006.
In our opinion, based on the work undertaken in the course of the audit:
• the information given in the strategic report and the Directors’ report for the financial year for which the financial statements are prepared is consistent with the financial statements; and
• the strategic report and the Directors’ report have been prepared in accordance with applicable legal requirements.
In the light of the knowledge and understanding of the Group and of the parent Company and their environment obtained in the course of the audit, we have not identified any material misstatements in the strategic report or the Directors’ report.
Matters on which we are required to report by exceptionAdequacy of explanations received and accounting recordsUnder the Companies Act 2006 we are required to report to you if, in our opinion:
• we have not received all the information and explanations we require for our audit; or• adequate accounting records have not been kept by the parent Company, or returns adequate for our
audit have not been received from branches not visited by us; or• the parent Company financial statements are not in agreement with the accounting records and returns.
We have nothing to report in respect of these matters.
Directors’ remunerationUnder the Companies Act 2006 we are also required to report if in our opinion certain disclosures of Directors’ remuneration have not been made or the part of the Directors’ remuneration report to be audited is not in agreement with the accounting records and returns.
We have nothing to report in respect of these matters.
INDEPENDENT AUDITOR’S REPORTTO THE MEMBERS OF CAPITAL & REGIONAL PLC
capreg.com Stock Code: CAL capreg.com
GOVERNANCE
73
Capital & Regional AR2017 Governance.indd 73 10/04/2018 16:05:30

CONSOLIDATED BALANCE SHEET AT 30 DECEMBER 2017
CONSOLIDATED INCOME STATEMENT FOR THE YEAR TO 30 DECEMBER 2017
Notes2017
£m2016
£m
Non-current assetsInvestment properties 10 930.6 838.5Plant and equipment 11 1.8 0.9Fixed asset investments 2.1 1.9Receivables 13 14.2 14.3Investment in associates 14b 7.4 13.9Total non-current assets 956.1 869.5Current assetsReceivables 13 21.6 13.4Cash and cash equivalents 15 30.2 49.1Assets classified as held for sale 14c – 13.9Total current assets 51.8 76.4Total assets 2b 1,007.9 945.9Current liabilitiesBank loans 17a – (334.6)Trade and other payables 16 (39.0) (41.3)Liabilities directly associated with assets held for sale 14c – (0.4)Total current liabilities (39.0) (376.3)Net current assets/(liabilities) 12.8 (299.9)Non-current liabilitiesBank loans 17a (422.2) (26.2)Other payables 16 (4.0) (4.4)Obligations under finance leases 25 (61.3) (61.4)Total non-current liabilities (487.5) (92.0)Total liabilities 2b (526.5) (468.3)Net assets 481.4 477.6EquityShare capital 19 7.2 7.0Share premium 163.3 158.2Merger reserve 60.3 60.3Capital redemption reserve 4.4 4.4Own shares reserve 21 (0.1) (0.4)Retained earnings 246.3 248.1Equity shareholders’ funds 481.4 477.6
Basic net assets per share 23 £0.67 £0.68EPRA triple net assets per share 23 £0.66 £0.67EPRA net assets per share 23 £0.67 £0.68
These financial statements were approved by the Board of Directors, authorised for issue and signed on their behalf on 5 April 2018by:
Charles Staveley Group Finance Director
Notes2017
£m2016
£m
Revenue 3 89.2 87.2Cost of sales 4 (33.5) (32.5)Gross profit 55.7 54.7Administrative costs (10.2) (10.9)Share of (loss)/profit in associates and joint ventures 14a (2.0) 0.3Loss on revaluation of investment properties 10a (3.8) (14.2)Other gains and losses 6 0.3 (1.8)Profit on ordinary activities before financing 40.0 28.1Finance income 5 1.2 0.4Finance costs 5 (18.8) (33.0)Profit/(loss) before tax 6 22.4 (4.5)Tax credit 8a – 0.1Profit/(loss) for the year 2a 22.4 (4.4)All results derive from continuing operations.Basic earnings per share 9a 3.2p (0.6)pDiluted earnings per share 9a 3.1p (0.6)pEPRA basic earnings per share 9a 3.9p 3.7pEPRA diluted earnings per share 9a 3.9p 3.7p
CONSOLIDATED STATEMENT OF COMPREHENSIVE INCOME
FOR THE YEAR TO 30 DECEMBER 2017
Notes2017
£m2016
£mProfit/(loss) for the year 22.4 (4.4)Other comprehensive income:
Items that may be reclassified subsequently to profit or loss:Exchange differences on translation of foreign operations – –Gain on a hedge of a net investment taken to equity – –Total items that may be reclassified subsequently to profit or loss – –Total comprehensive income for the year 22.4 (4.4)
There are no items in other comprehensive income that may not be reclassified to income statement.
Profit for the year and total comprehensive income is all attributable to equity holders of the parent.
The EPRA measures used throughout this report are industry best practice performance measures established by the European Public Real Estate Association. They are defined in the Glossary to the Financial Statements. EPRA Earnings and EPRA EPS are shownin Note 9 to the Financial Statements. EPRA net assets and EPRA triple net assets are shown in Note 23 to the Financial Statements.
Capital & Regional plc Annual Report and Accounts for the year ended 30 December 2017
Stock Code: CAL capreg.com Stock Code: CAL
74
Capital & Regional AR2017 Financials.indd 74 10/04/2018 16:05:59

CONSOLIDATED BALANCE SHEET AT 30 DECEMBER 2017
CONSOLIDATED INCOME STATEMENT FOR THE YEAR TO 30 DECEMBER 2017
Notes2017
£m2016
£m
Non-current assetsInvestment properties 10 930.6 838.5Plant and equipment 11 1.8 0.9Fixed asset investments 2.1 1.9Receivables 13 14.2 14.3Investment in associates 14b 7.4 13.9Total non-current assets 956.1 869.5Current assetsReceivables 13 21.6 13.4Cash and cash equivalents 15 30.2 49.1Assets classified as held for sale 14c – 13.9Total current assets 51.8 76.4Total assets 2b 1,007.9 945.9Current liabilitiesBank loans 17a – (334.6)Trade and other payables 16 (39.0) (41.3)Liabilities directly associated with assets held for sale 14c – (0.4)Total current liabilities (39.0) (376.3)Net current assets/(liabilities) 12.8 (299.9)Non-current liabilitiesBank loans 17a (422.2) (26.2)Other payables 16 (4.0) (4.4)Obligations under finance leases 25 (61.3) (61.4)Total non-current liabilities (487.5) (92.0)Total liabilities 2b (526.5) (468.3)Net assets 481.4 477.6EquityShare capital 19 7.2 7.0Share premium 163.3 158.2Merger reserve 60.3 60.3Capital redemption reserve 4.4 4.4Own shares reserve 21 (0.1) (0.4)Retained earnings 246.3 248.1Equity shareholders’ funds 481.4 477.6
Basic net assets per share 23 £0.67 £0.68EPRA triple net assets per share 23 £0.66 £0.67EPRA net assets per share 23 £0.67 £0.68
These financial statements were approved by the Board of Directors, authorised for issue and signed on their behalf on 5 April 2018by:
Charles Staveley Group Finance Director
Notes2017
£m2016
£m
Revenue 3 89.2 87.2Cost of sales 4 (33.5) (32.5)Gross profit 55.7 54.7Administrative costs (10.2) (10.9)Share of (loss)/profit in associates and joint ventures 14a (2.0) 0.3Loss on revaluation of investment properties 10a (3.8) (14.2)Other gains and losses 6 0.3 (1.8)Profit on ordinary activities before financing 40.0 28.1Finance income 5 1.2 0.4Finance costs 5 (18.8) (33.0)Profit/(loss) before tax 6 22.4 (4.5)Tax credit 8a – 0.1Profit/(loss) for the year 2a 22.4 (4.4)All results derive from continuing operations.Basic earnings per share 9a 3.2p (0.6)pDiluted earnings per share 9a 3.1p (0.6)pEPRA basic earnings per share 9a 3.9p 3.7pEPRA diluted earnings per share 9a 3.9p 3.7p
CONSOLIDATED STATEMENT OF COMPREHENSIVE INCOME
FOR THE YEAR TO 30 DECEMBER 2017
Notes2017
£m2016
£mProfit/(loss) for the year 22.4 (4.4)Other comprehensive income:
Items that may be reclassified subsequently to profit or loss:Exchange differences on translation of foreign operations – –Gain on a hedge of a net investment taken to equity – –Total items that may be reclassified subsequently to profit or loss – –Total comprehensive income for the year 22.4 (4.4)
There are no items in other comprehensive income that may not be reclassified to income statement.
Profit for the year and total comprehensive income is all attributable to equity holders of the parent.
The EPRA measures used throughout this report are industry best practice performance measures established by the European Public Real Estate Association. They are defined in the Glossary to the Financial Statements. EPRA Earnings and EPRA EPS are shownin Note 9 to the Financial Statements. EPRA net assets and EPRA triple net assets are shown in Note 23 to the Financial Statements.
capreg.com Stock Code: CAL capreg.com
FINANCIALS
75
Capital & Regional AR2017 Financials.indd 75 10/04/2018 16:05:59

CONSOLIDATED CASH FLOW STATEMENT FOR THE YEAR TO 30 DECEMBER 2017
CONSOLIDATED STATEMENT OF CHANGES IN EQUITYFOR THE YEAR TO 30 DECEMBER 2017
Share capital
£m
Share premium1
£m
Merger reserve2
£m
Capital redemption
reserve1
£m
Own shares
reserve3 £m
Retained earnings4
£m
Total equity
£m
Balance at 30 December 2015 7.0 157.2 60.3 4.4 (0.6) 274.9 503.2Loss for the year – – – – – (4.4) (4.4)Other comprehensive loss for the year – – – – – – –Total comprehensive income for the year – – – – – (4.4) (4.4)Credit to equity for equity-settled share-based payments (Note 20) – – – – – 0.5 0.5Dividends paid (Note 29), net of Scrip – – – – – (21.7) (21.7)Shares issued, net of costs (Note 19) – 1.0 – – – (1.0) –Other movements – – – – 0.2 (0.2) –Balance at 30 December 2016 7.0 158.2 60.3 4.4 (0.4) 248.1 477.6Profit for the year – – – – – 22.4 22.4Other comprehensive income for the year – – – – – – –Total comprehensive income for the year – – – – – 22.4 22.4Credit to equity for equity-settled share-based payments (Note 20) – – – – – 0.9 0.9Dividends paid (Note 29), net of Scrip – – – – – (19.5) (19.5)Shares issued, net of costs (Note 19) 0.2 5.1 – – – (5.3) –Other movements – – – – 0.3 (0.3) –Balance at 30 December 2017 7.2 163.3 60.3 4.4 (0.1) 246.3 481.4
Notes:
1. These reserves are not distributable.
2. The merger reserve of £60.3 million arose on the Group’s capital raising in 2009 which was structured so as to allow the Company to claim merger relief under section 612 of the Companies Act 2006 on the issue of Ordinary shares. The merger reserve is available for distribution to shareholders.
3. Own shares relate to shares purchased out of distributable profits and therefore reduce reserves available for distribution.
4. The Company has determined what is realised and unrealised in accordance with the guidance provided by ICAEW TECH 2/17 and the requirements of UK law. In accordance with UK Companies Act 2006 s831(2), a public company may make a distribution only if, after giving effect to such distribution, the amount of its net assets is not less than the aggregate of its called up share capital and non-distributable reserves as shown in the relevant accounts.
Notes2017
£m2016
£mOperating activitiesNet cash from operations 22 43.0 41.1Distributions received from associates 14b 4.5 0.5Distributions received from fixed asset investments including German B-note 0.7 4.2Interest paid (14.6) (14.6)Interest received 0.1 0.1Cash flows from operating activities 33.7 31.3Investing activitiesAcquisition of The Exchange, Ilford 10a (79.0) –Disposal of The Mall, Camberley – 85.7Disposal of Buttermarket, Ipswich 14c 9.8 –Other disposals – 0.7Acquisitions in Hemel Hempstead – (56.6)Purchase of plant and equipment (0.6) (0.5)Capital expenditure on investment properties (16.9) (20.6)Cash flows from investing activities (86.7) 8.7Financing activitiesDividends paid, net of Scrip (19.1) (21.7)Bank loans drawn down 401.5 26.9Bank loans repaid (334.6) (45.4)Loan arrangement costs (13.7) (0.6)Cash flows from financing activities 34.1 (40.8)Net (decrease)/increase in cash and cash equivalents (18.9) (0.8)Cash and cash equivalents at the beginning of the year 49.1 49.9Cash and cash equivalents at the end of the year 15 30.2 49.1
Capital & Regional plc Annual Report and Accounts for the year ended 30 December 2017
Stock Code: CAL capreg.com Stock Code: CAL
76
Capital & Regional AR2017 Financials.indd 76 10/04/2018 16:06:00

CONSOLIDATED CASH FLOW STATEMENT FOR THE YEAR TO 30 DECEMBER 2017
CONSOLIDATED STATEMENT OF CHANGES IN EQUITYFOR THE YEAR TO 30 DECEMBER 2017
Share capital
£m
Share premium1
£m
Merger reserve2
£m
Capital redemption
reserve1
£m
Own shares
reserve3 £m
Retained earnings4
£m
Total equity
£m
Balance at 30 December 2015 7.0 157.2 60.3 4.4 (0.6) 274.9 503.2Loss for the year – – – – – (4.4) (4.4)Other comprehensive loss for the year – – – – – – –Total comprehensive income for the year – – – – – (4.4) (4.4)Credit to equity for equity-settled share-based payments (Note 20) – – – – – 0.5 0.5Dividends paid (Note 29), net of Scrip – – – – – (21.7) (21.7)Shares issued, net of costs (Note 19) – 1.0 – – – (1.0) –Other movements – – – – 0.2 (0.2) –Balance at 30 December 2016 7.0 158.2 60.3 4.4 (0.4) 248.1 477.6Profit for the year – – – – – 22.4 22.4Other comprehensive income for the year – – – – – – –Total comprehensive income for the year – – – – – 22.4 22.4Credit to equity for equity-settled share-based payments (Note 20) – – – – – 0.9 0.9Dividends paid (Note 29), net of Scrip – – – – – (19.5) (19.5)Shares issued, net of costs (Note 19) 0.2 5.1 – – – (5.3) –Other movements – – – – 0.3 (0.3) –Balance at 30 December 2017 7.2 163.3 60.3 4.4 (0.1) 246.3 481.4
Notes:
1. These reserves are not distributable.
2. The merger reserve of £60.3 million arose on the Group’s capital raising in 2009 which was structured so as to allow the Company to claim merger relief under section 612 of the Companies Act 2006 on the issue of Ordinary shares. The merger reserve is available for distribution to shareholders.
3. Own shares relate to shares purchased out of distributable profits and therefore reduce reserves available for distribution.
4. The Company has determined what is realised and unrealised in accordance with the guidance provided by ICAEW TECH 2/17 and the requirements of UK law. In accordance with UK Companies Act 2006 s831(2), a public company may make a distribution only if, after giving effect to such distribution, the amount of its net assets is not less than the aggregate of its called up share capital and non-distributable reserves as shown in the relevant accounts.
Notes2017
£m2016
£mOperating activitiesNet cash from operations 22 43.0 41.1Distributions received from associates 14b 4.5 0.5Distributions received from fixed asset investments including German B-note 0.7 4.2Interest paid (14.6) (14.6)Interest received 0.1 0.1Cash flows from operating activities 33.7 31.3Investing activitiesAcquisition of The Exchange, Ilford 10a (79.0) –Disposal of The Mall, Camberley – 85.7Disposal of Buttermarket, Ipswich 14c 9.8 –Other disposals – 0.7Acquisitions in Hemel Hempstead – (56.6)Purchase of plant and equipment (0.6) (0.5)Capital expenditure on investment properties (16.9) (20.6)Cash flows from investing activities (86.7) 8.7Financing activitiesDividends paid, net of Scrip (19.1) (21.7)Bank loans drawn down 401.5 26.9Bank loans repaid (334.6) (45.4)Loan arrangement costs (13.7) (0.6)Cash flows from financing activities 34.1 (40.8)Net (decrease)/increase in cash and cash equivalents (18.9) (0.8)Cash and cash equivalents at the beginning of the year 49.1 49.9Cash and cash equivalents at the end of the year 15 30.2 49.1
capreg.com Stock Code: CAL capreg.com
FINANCIALS
77
Capital & Regional AR2017 Financials.indd 77 10/04/2018 16:06:00

NOTES TO THE FINANCIAL STATEMENTSFOR THE YEAR TO 30 DECEMBER 2017
1 Significant Accounting PoliciesGeneral informationCapital & Regional plc is a company domiciled and incorporated in the United Kingdom under the Companies Act 2006. The address of the registered office became 22 Chapter Street, London, SW1P 4NP on 5 February 2018 but was 52 Grosvenor Gardens, London, SW1W 0AU as at 30 December 2017. The nature of the Group’s operations and its principal activities are disclosed in Note 2a and in the operating and financial reviews.
Basis of accountingThe financial statements comprise the consolidated income statement, the consolidated statement of comprehensive income, the consolidated balance sheet, the consolidated statement of changes in equity, the consolidated cash flow statement and notes 1 to29. They are prepared on the historical cost basis except for the revaluation of certain properties and financial instruments that are measured at revalued amounts or fair values at the end of the reporting year, as explained in the accounting policies below. Otherthan as noted in the “Accounting developments and changes” section below, the accounting policies have been applied consistentlyto the results, other gains and losses, assets, liabilities, income and expenses.
Fair value is the price that would be received to sell an asset or paid to transfer a liability in an orderly transaction between market participants at the measurement date, regardless of whether that price is directly observable or estimated using another valuationtechnique. In estimating the fair value of an asset or liability, the Group takes into account the characteristics of the asset or liability if market participants would take those characteristics into account when pricing the asset or liability at the measurement date. Fair value for measurement and/or disclosure purposes in these financial statements is determined on such basis, except for share-based payments that are within the scope of IFRS 2, leasing transactions that are within the scope of IAS 17, and measurements thathave some similarities to fair value but are not fair value, such as net realisable value in IAS 2 or value in use in IAS 36.
In addition, for financial reporting purposes, fair value measurements are categorised into Level 1, 2 or 3 based on the degree to which the inputs to the fair value measurements are observable and the significance of the inputs to the fair value measurement in its entirety, which are described as follows:
• Level 1 inputs are quoted prices (unadjusted) in active markets for identical assets or liabilities.• Level 2 inputs are inputs other than quoted prices included within Level 1, that are observable for the asset or liability, either
directly (i.e. as prices) or indirectly (i.e. derived from prices).• Level 3 inputs are unobservable inputs for the asset or liability.
The financial statements are presented in pounds sterling because that is the currency of the primary economic environment in which the Group operates. Foreign operations are included in accordance with the accounting policies set out below.
Statement of complianceThe consolidated financial statements have been prepared in accordance with International Financial Reporting Standards (IFRSs) as adopted by the European Union (EU) and therefore the Group financial statements comply with Article 4 of the EU IAS Regulation.
Accounting developments and changesThe accounting policies used in these financial statements are consistent with those applied in the last annual financial statements,as amended where relevant to reflect the adoption of new standards, amendments and interpretations which became effective in the year. These amendments have not had an impact on the financial statements.
A number of new standards and amendments to standards have been issued but are not yet effective for the Group. The most significant of these are set out below:
• IFRS 15 Revenue from Contracts with Customers – does not apply to gross rental income, but does apply to service charge income, other fees and trading property disposals and is effective for the Group’s year ending 30 December 2019. The Group does not expect adoption of IFRS 15 to have a material impact on the measurement of revenue recognition, but additional disclosures will be required with regards to the above sources of income.
• IFRS 9 Financial Instruments – will impact both the measurement and disclosures of financial instruments and is effective for theGroup’s year ending 30 December 2019. The Group does not expect adoption to have a material impact on the measurement of Financial Instruments, but additional disclosures may be required.
• IFRS 16 Leases – will result in the Group recognising on balance sheet assets it leases along with a corresponding liability and is effective for the Group’s year ending 30 December 2019. The primary lease contracts that this will impact are the lease on the Group’s head offices and the leases of the Snozone business on its Basingstoke, Castleford and Milton Keynes sites. The total ofthe future minimum lease payments under these leases is disclosed in Note 25 to the financial statements.
Inaddition,IFRS16couldhaveanindirectimpactontheGroup’sbusinessifitleadstoachangeinoccupierbehaviour. Examplesof this would be if its adoption results in tenants or potential tenants typically seeking shorter lease terms and/or more prevalentuse of turnover-related, as opposed to fixed, rents.
1 Significant Accounting Policies continuedGoing concernThe financial statements have been prepared on a going concern basis. Details on going concern and the viability statement are provided on page 30.
Critical accounting judgements and key sources of estimation uncertainty The preparation of financial statements requires the Directors to make judgements, estimates and assumptions that may affect theapplication of accounting policies and the reported amounts of assets and liabilities, income and expenses.
The following are the critical accounting judgements and/or key sources of estimation uncertainty that the Directors have made inthe process of applying the Group’s accounting policies and that have the most significant effect on the amounts recognised in thefinancial statements:
Property valuationThe valuation of the Group’s property portfolio is inherently subjective due to, among other factors, the individual nature of eachproperty, its location and the expected future rental revenues from that particular property. As a result, the valuations the Groupplaces on its property portfolio are subject to a degree of uncertainty and are made on the basis of assumptions which may not prove to be accurate, particularly in periods of volatility or low transaction flow in the property market.
The investment property valuation contains a number of assumptions upon which the Group’s valuer has based its valuation of theGroup’s properties as at 30 December 2017. The assumptions on which the property valuation reports have been based include, but are not limited to, matters such as the tenure and tenancy details for the properties, ground conditions at the properties, the structural condition of the properties, prevailing market yields and comparable market transactions. These assumptions are marketstandard and accord with the Royal Institution of Chartered Surveyors (RICS) Valuation – Professional Standards UK 2014 (revisedApril 2015).
If the assumptions upon which the external valuer has based its valuations prove to be inaccurate, this may have an impact on thevalue of the Group’s investment properties, which could in turn have an effect on the Group’s financial position and results. Note 10c provides sensitivity analysis estimating the impact that changes in the estimated rental values or equivalent yields would have on the Group’s property valuations.
Derivative financial instrumentsRelianceupontheworkundertakenat30 December2017byindependentthirdpartyexpertsinassessingthefairvaluesoftheGroup’s derivative financial instruments, which are disclosed in Notes 13 and 18e. Note 18b provides figures showing the Group’ssensitivity to a 100bps increase or decrease in interest rate expectations.
Carrying value of investments and intercompany debtor balancesManagement perform an annual review of intercompany investments and receivables to determine the values to be maintained in the Plc Company only and individual subsidiary balance sheets. The carrying values are in part supported by forecast future cashflows and an assessment of long-term growth rates and the Group’s discount rate all of which require Management judgment to varying extents.
Basis of consolidationThe consolidated financial statements incorporate the financial statements of the Company at 30 December. Control is achieved where the Company has the power to govern the financial and operating policies of an investee entity so as to obtain benefits fromits activities.
The results of subsidiaries acquired or disposed of during the year are included in the consolidated income statement from the effective date of acquisition or up to the effective date of disposal. The reporting year for all material subsidiaries and affiliates ends on 31 December and their financial statements are consolidated from this date. All intra-group transactions, balances, income andexpenses are eliminated on consolidation.
Capital & Regional plc Annual Report and Accounts for the year ended 30 December 2017
Stock Code: CAL capreg.com Stock Code: CAL
78
Capital & Regional AR2017 Financials.indd 78 10/04/2018 16:06:00

NOTES TO THE FINANCIAL STATEMENTSFOR THE YEAR TO 30 DECEMBER 2017
1 Significant Accounting PoliciesGeneral informationCapital & Regional plc is a company domiciled and incorporated in the United Kingdom under the Companies Act 2006. The address of the registered office became 22 Chapter Street, London, SW1P 4NP on 5 February 2018 but was 52 Grosvenor Gardens, London, SW1W 0AU as at 30 December 2017. The nature of the Group’s operations and its principal activities are disclosed in Note 2a and in the operating and financial reviews.
Basis of accountingThe financial statements comprise the consolidated income statement, the consolidated statement of comprehensive income, the consolidated balance sheet, the consolidated statement of changes in equity, the consolidated cash flow statement and notes 1 to29. They are prepared on the historical cost basis except for the revaluation of certain properties and financial instruments that are measured at revalued amounts or fair values at the end of the reporting year, as explained in the accounting policies below. Otherthan as noted in the “Accounting developments and changes” section below, the accounting policies have been applied consistentlyto the results, other gains and losses, assets, liabilities, income and expenses.
Fair value is the price that would be received to sell an asset or paid to transfer a liability in an orderly transaction between market participants at the measurement date, regardless of whether that price is directly observable or estimated using another valuationtechnique. In estimating the fair value of an asset or liability, the Group takes into account the characteristics of the asset or liability if market participants would take those characteristics into account when pricing the asset or liability at the measurement date. Fair value for measurement and/or disclosure purposes in these financial statements is determined on such basis, except for share-based payments that are within the scope of IFRS 2, leasing transactions that are within the scope of IAS 17, and measurements thathave some similarities to fair value but are not fair value, such as net realisable value in IAS 2 or value in use in IAS 36.
In addition, for financial reporting purposes, fair value measurements are categorised into Level 1, 2 or 3 based on the degree to which the inputs to the fair value measurements are observable and the significance of the inputs to the fair value measurement in its entirety, which are described as follows:
• Level 1 inputs are quoted prices (unadjusted) in active markets for identical assets or liabilities.• Level 2 inputs are inputs other than quoted prices included within Level 1, that are observable for the asset or liability, either
directly (i.e. as prices) or indirectly (i.e. derived from prices).• Level 3 inputs are unobservable inputs for the asset or liability.
The financial statements are presented in pounds sterling because that is the currency of the primary economic environment in which the Group operates. Foreign operations are included in accordance with the accounting policies set out below.
Statement of complianceThe consolidated financial statements have been prepared in accordance with International Financial Reporting Standards (IFRSs) as adopted by the European Union (EU) and therefore the Group financial statements comply with Article 4 of the EU IAS Regulation.
Accounting developments and changesThe accounting policies used in these financial statements are consistent with those applied in the last annual financial statements,as amended where relevant to reflect the adoption of new standards, amendments and interpretations which became effective in the year. These amendments have not had an impact on the financial statements.
A number of new standards and amendments to standards have been issued but are not yet effective for the Group. The most significant of these are set out below:
• IFRS 15 Revenue from Contracts with Customers – does not apply to gross rental income, but does apply to service charge income, other fees and trading property disposals and is effective for the Group’s year ending 30 December 2019. The Group does not expect adoption of IFRS 15 to have a material impact on the measurement of revenue recognition, but additional disclosures will be required with regards to the above sources of income.
• IFRS 9 Financial Instruments – will impact both the measurement and disclosures of financial instruments and is effective for theGroup’s year ending 30 December 2019. The Group does not expect adoption to have a material impact on the measurement of Financial Instruments, but additional disclosures may be required.
• IFRS 16 Leases – will result in the Group recognising on balance sheet assets it leases along with a corresponding liability and is effective for the Group’s year ending 30 December 2019. The primary lease contracts that this will impact are the lease on the Group’s head offices and the leases of the Snozone business on its Basingstoke, Castleford and Milton Keynes sites. The total ofthe future minimum lease payments under these leases is disclosed in Note 25 to the financial statements.
Inaddition,IFRS16couldhaveanindirectimpactontheGroup’sbusinessifitleadstoachangeinoccupierbehaviour. Examplesof this would be if its adoption results in tenants or potential tenants typically seeking shorter lease terms and/or more prevalentuse of turnover-related, as opposed to fixed, rents.
1 Significant Accounting Policies continuedGoing concernThe financial statements have been prepared on a going concern basis. Details on going concern and the viability statement are provided on page 30.
Critical accounting judgements and key sources of estimation uncertainty The preparation of financial statements requires the Directors to make judgements, estimates and assumptions that may affect theapplication of accounting policies and the reported amounts of assets and liabilities, income and expenses.
The following are the critical accounting judgements and/or key sources of estimation uncertainty that the Directors have made inthe process of applying the Group’s accounting policies and that have the most significant effect on the amounts recognised in thefinancial statements:
Property valuationThe valuation of the Group’s property portfolio is inherently subjective due to, among other factors, the individual nature of eachproperty, its location and the expected future rental revenues from that particular property. As a result, the valuations the Groupplaces on its property portfolio are subject to a degree of uncertainty and are made on the basis of assumptions which may not prove to be accurate, particularly in periods of volatility or low transaction flow in the property market.
The investment property valuation contains a number of assumptions upon which the Group’s valuer has based its valuation of theGroup’s properties as at 30 December 2017. The assumptions on which the property valuation reports have been based include, but are not limited to, matters such as the tenure and tenancy details for the properties, ground conditions at the properties, the structural condition of the properties, prevailing market yields and comparable market transactions. These assumptions are marketstandard and accord with the Royal Institution of Chartered Surveyors (RICS) Valuation – Professional Standards UK 2014 (revisedApril 2015).
If the assumptions upon which the external valuer has based its valuations prove to be inaccurate, this may have an impact on thevalue of the Group’s investment properties, which could in turn have an effect on the Group’s financial position and results. Note 10c provides sensitivity analysis estimating the impact that changes in the estimated rental values or equivalent yields would have on the Group’s property valuations.
Derivative financial instrumentsRelianceupontheworkundertakenat30 December2017byindependentthirdpartyexpertsinassessingthefairvaluesoftheGroup’s derivative financial instruments, which are disclosed in Notes 13 and 18e. Note 18b provides figures showing the Group’ssensitivity to a 100bps increase or decrease in interest rate expectations.
Carrying value of investments and intercompany debtor balancesManagement perform an annual review of intercompany investments and receivables to determine the values to be maintained in the Plc Company only and individual subsidiary balance sheets. The carrying values are in part supported by forecast future cashflows and an assessment of long-term growth rates and the Group’s discount rate all of which require Management judgment to varying extents.
Basis of consolidationThe consolidated financial statements incorporate the financial statements of the Company at 30 December. Control is achieved where the Company has the power to govern the financial and operating policies of an investee entity so as to obtain benefits fromits activities.
The results of subsidiaries acquired or disposed of during the year are included in the consolidated income statement from the effective date of acquisition or up to the effective date of disposal. The reporting year for all material subsidiaries and affiliates ends on 31 December and their financial statements are consolidated from this date. All intra-group transactions, balances, income andexpenses are eliminated on consolidation.
capreg.com Stock Code: CAL capreg.com
FINANCIALS
79
Capital & Regional AR2017 Financials.indd 79 10/04/2018 16:06:00

NOTES TO THE FINANCIAL STATEMENTSCONTINUED
1 Significant Accounting Policies continuedBusiness combinationsAcquisitions of subsidiaries and businesses are accounted for using the acquisition method. The consideration for each acquisitionis measured at the aggregate at the date of exchange of the fair values of assets acquired, liabilities incurred or assumed, and equity instruments issued by the Group in exchange for control of the acquiree. Acquisition-related costs are recognised in the incomestatement as incurred. Where a business combination is achieved in stages, the Group’s previously held interests in the acquiredentity are remeasured to fair value at the acquisition date (i.e. the date the Group attains control) and the resulting gain or loss, if any, is recognised in the income statement.
If the initial accounting for a business combination is incomplete by the end of the reporting year in which the combination occurs,the Group reports provisional amounts for the items for which the accounting is incomplete. Those provisional amounts are adjusted during the remeasurement period or additional assets or liabilities are recognised to reflect new information obtainedabout facts and circumstances that existed as of the acquisition date that, if known, would have affected the amounts recognised as of that date. The measurement period is the period from the date of acquisition to the date the Group obtains complete informationand is subject to a maximum of one year.
Assets held for saleAssets held for sale are measured at the lower of carrying amount and realisable value with associated costs of sale shown separately as liabilities. Assets are classified as held for sale if their carrying amount will be recovered through a sale transactionrather than through continuing use. This condition is regarded as met only when the sale is highly probable and the asset is available for immediate sale in its present condition. Management must be committed to the sale which should be expected to qualify for recognition as a completed sale within one year of the date of classification. The Group considered that its assets held for sale at 30 December 2016 fell within “Level 2”, as defined in Note 1.
Subsidiaries, joint ventures and associates The consolidated financial statements incorporate the financial statements of Capital & Regional plc and all subsidiaries and entitiescontrolled by Capital & Regional plc. Control is assumed where the Group has the power and the ability to affect the financial andoperating policies of an investee entity so as to gain benefits from its activities.
The results of subsidiaries, joint ventures or associates acquired or disposed of during the year are included from the effective date of acquisition or up to the effective date of disposal. Accounting practices of subsidiaries, joint ventures or associates which differ from Group accounting policies are adjusted on consolidation.
All intra-Group transactions, balances, income and expenses are eliminated on consolidation. The Group has assessed the nature ofits joint arrangements under IFRS 11 “Joint arrangements” and determined them to be joint ventures. This assessment required theexercise of judgement as set out in Note 14c.
Joint ventures and associates are accounted for under the equity method, whereby the consolidated balance sheet incorporates the Group’s share (investor’s share) of the net assets of its joint ventures and associates. The consolidated income statement incorporates the Group’s share of joint venture and associate profits after tax, upon elimination of upstream and downstream transactions. Their profits include revaluation movements on investment properties. Interest income, management fees and performance fees are proportionately eliminated.
Foreign currencyForeign currency transactionsTransactions in foreign currencies are translated into sterling at exchange rates approximating to the exchange rate ruling at thedate of the transaction. Monetary assets and liabilities denominated in foreign currencies at the balance sheet date are translatedto sterling at the exchange rate ruling at that date and, unless they relate to the hedging of the net investment in foreign operations,differences arising on translation are recognised in the income statement.
Financial statements of foreign operationsThe assets and liabilities of foreign operations, including goodwill and fair value adjustments arising on consolidation, are translatedinto sterling at the exchange rates ruling at the balance sheet date. The operating income and expenses of foreign operations aretranslated into sterling at the average exchange rates for the year. Significant transactions, such as property sales, are translatedat the foreign exchange rate ruling at the date of each transaction. The principal exchange rate used to translate foreign currencydenominated amounts in the balance sheet is the rate at the end of the year: £1 = €1.127 (2016: £1 = €1.168). The principal exchange rate used for the income statement is the average rate for the year: £1 = €1.141 (2016: £1 = €1.224).
1 Significant Accounting Policies continuedNet investment in foreign operationsExchange differences arising from the translation of the net investment in foreign operations are taken to the foreign currencyreserve and the effective portions of related foreign currency hedges are taken to the net investment hedging reserve. The net investment in foreign operations includes the equity of the underlying entities and the portion of shareholder loans to those entitiesthat is treated as equity where there is no intention of repayment in the foreseeable future. All exchange differences previouslyaccumulated in equity are transferred to the income statement upon disposal or, where control is lost, part-disposal of the foreignoperation.
Property, plant and equipmentPlant and equipment is stated at cost, net of depreciation and any provision for impairment. Depreciation is provided on all tangiblefixed assets, other than investment properties and land, on a straight-line basis over their expected useful lives:
• Leasehold improvements – over the term of the lease• Fixtures and fittings – over three to five years• Motor vehicles – over four years
Property portfolioInvestment propertiesInvestment properties are properties owned or leased under finance leases which are held either for long-term rental income or forcapital appreciation or both. Investment property is initially recognised at cost (including directly related transaction costs) and is revalued at the balance sheet date to fair value, being the market value determined by professionally qualified external or Directorvaluers, with changes in fair value being included in the income statement. Valuations are generally carried out twice a year. Inaccordance with IAS 40 Investment Property, no depreciation is provided in respect of investment properties.
Leasehold propertiesLeasehold properties that are leased to tenants under operating leases are classified as investment properties or development properties, as appropriate, and included in the balance sheet at fair value.
Capital expenditureRefurbishment expenditure in respect of major works is capitalised. Renovation and refurbishment expenditure of a revenue natureis expensed as incurred. Our business model for developments is to use a combination of in-house staff and external advisers. Thecost of external advisers is capitalised to the cost of developments. The cost of staff working on developments is capitalised subjectto meeting certain criteria related to the degree of time spent on and the nature of specific projects.
Property transactionsAcquisitions and disposals are accounted for at the date of legal completion. Investment properties are reclassified as held for sale once contracts have been exchanged and are transferred between categories at the estimated market value on the transfer date.
LeasesLeases are classified as finance leases whenever the terms of the lease transfer substantially all the risks and rewards of ownershipto the lessee. All other leases are classified as operating leases.
The Group as lessorRental income from operating leases is recognised on a straight-line basis over the term of the relevant lease. Initial direct costsincurred in negotiating and arranging an operating lease are added to the carrying amount of the leased asset and recognised on a straight-line basis over the lease term. Incentives and costs associated with entering into tenant leases are amortised on a straight-line basis over the term of the lease.
The Group as lesseeAssets held under finance leases are recognised as assets at their fair value or, if lower, at the present value of the minimum lease payments, each determined at the inception of the lease. The corresponding liability to the lessor is included in the balance sheet as a finance lease obligation.
Lease payments are apportioned between finance expenses and reduction of the lease obligation so as to achieve a constant rate of interest on the remaining balance of the liability. Finance expenses are recognised immediately in profit or loss, unless theyare directly attributable to qualifying assets, in which case they are capitalised in accordance with the Group’s general policy on borrowing costs. Contingent rentals are recognised as expenses in the years in which they are incurred.
Capital & Regional plc Annual Report and Accounts for the year ended 30 December 2017
Stock Code: CAL capreg.com Stock Code: CAL
80
Capital & Regional AR2017 Financials.indd 80 10/04/2018 16:06:00

NOTES TO THE FINANCIAL STATEMENTSCONTINUED
1 Significant Accounting Policies continuedBusiness combinationsAcquisitions of subsidiaries and businesses are accounted for using the acquisition method. The consideration for each acquisitionis measured at the aggregate at the date of exchange of the fair values of assets acquired, liabilities incurred or assumed, and equity instruments issued by the Group in exchange for control of the acquiree. Acquisition-related costs are recognised in the incomestatement as incurred. Where a business combination is achieved in stages, the Group’s previously held interests in the acquiredentity are remeasured to fair value at the acquisition date (i.e. the date the Group attains control) and the resulting gain or loss, if any, is recognised in the income statement.
If the initial accounting for a business combination is incomplete by the end of the reporting year in which the combination occurs,the Group reports provisional amounts for the items for which the accounting is incomplete. Those provisional amounts are adjusted during the remeasurement period or additional assets or liabilities are recognised to reflect new information obtainedabout facts and circumstances that existed as of the acquisition date that, if known, would have affected the amounts recognised as of that date. The measurement period is the period from the date of acquisition to the date the Group obtains complete informationand is subject to a maximum of one year.
Assets held for saleAssets held for sale are measured at the lower of carrying amount and realisable value with associated costs of sale shown separately as liabilities. Assets are classified as held for sale if their carrying amount will be recovered through a sale transactionrather than through continuing use. This condition is regarded as met only when the sale is highly probable and the asset is available for immediate sale in its present condition. Management must be committed to the sale which should be expected to qualify for recognition as a completed sale within one year of the date of classification. The Group considered that its assets held for sale at 30 December 2016 fell within “Level 2”, as defined in Note 1.
Subsidiaries, joint ventures and associates The consolidated financial statements incorporate the financial statements of Capital & Regional plc and all subsidiaries and entitiescontrolled by Capital & Regional plc. Control is assumed where the Group has the power and the ability to affect the financial andoperating policies of an investee entity so as to gain benefits from its activities.
The results of subsidiaries, joint ventures or associates acquired or disposed of during the year are included from the effective date of acquisition or up to the effective date of disposal. Accounting practices of subsidiaries, joint ventures or associates which differ from Group accounting policies are adjusted on consolidation.
All intra-Group transactions, balances, income and expenses are eliminated on consolidation. The Group has assessed the nature ofits joint arrangements under IFRS 11 “Joint arrangements” and determined them to be joint ventures. This assessment required theexercise of judgement as set out in Note 14c.
Joint ventures and associates are accounted for under the equity method, whereby the consolidated balance sheet incorporates the Group’s share (investor’s share) of the net assets of its joint ventures and associates. The consolidated income statement incorporates the Group’s share of joint venture and associate profits after tax, upon elimination of upstream and downstream transactions. Their profits include revaluation movements on investment properties. Interest income, management fees and performance fees are proportionately eliminated.
Foreign currencyForeign currency transactionsTransactions in foreign currencies are translated into sterling at exchange rates approximating to the exchange rate ruling at thedate of the transaction. Monetary assets and liabilities denominated in foreign currencies at the balance sheet date are translatedto sterling at the exchange rate ruling at that date and, unless they relate to the hedging of the net investment in foreign operations,differences arising on translation are recognised in the income statement.
Financial statements of foreign operationsThe assets and liabilities of foreign operations, including goodwill and fair value adjustments arising on consolidation, are translatedinto sterling at the exchange rates ruling at the balance sheet date. The operating income and expenses of foreign operations aretranslated into sterling at the average exchange rates for the year. Significant transactions, such as property sales, are translatedat the foreign exchange rate ruling at the date of each transaction. The principal exchange rate used to translate foreign currencydenominated amounts in the balance sheet is the rate at the end of the year: £1 = €1.127 (2016: £1 = €1.168). The principal exchange rate used for the income statement is the average rate for the year: £1 = €1.141 (2016: £1 = €1.224).
1 Significant Accounting Policies continuedNet investment in foreign operationsExchange differences arising from the translation of the net investment in foreign operations are taken to the foreign currencyreserve and the effective portions of related foreign currency hedges are taken to the net investment hedging reserve. The net investment in foreign operations includes the equity of the underlying entities and the portion of shareholder loans to those entitiesthat is treated as equity where there is no intention of repayment in the foreseeable future. All exchange differences previouslyaccumulated in equity are transferred to the income statement upon disposal or, where control is lost, part-disposal of the foreignoperation.
Property, plant and equipmentPlant and equipment is stated at cost, net of depreciation and any provision for impairment. Depreciation is provided on all tangiblefixed assets, other than investment properties and land, on a straight-line basis over their expected useful lives:
• Leasehold improvements – over the term of the lease• Fixtures and fittings – over three to five years• Motor vehicles – over four years
Property portfolioInvestment propertiesInvestment properties are properties owned or leased under finance leases which are held either for long-term rental income or forcapital appreciation or both. Investment property is initially recognised at cost (including directly related transaction costs) and is revalued at the balance sheet date to fair value, being the market value determined by professionally qualified external or Directorvaluers, with changes in fair value being included in the income statement. Valuations are generally carried out twice a year. Inaccordance with IAS 40 Investment Property, no depreciation is provided in respect of investment properties.
Leasehold propertiesLeasehold properties that are leased to tenants under operating leases are classified as investment properties or development properties, as appropriate, and included in the balance sheet at fair value.
Capital expenditureRefurbishment expenditure in respect of major works is capitalised. Renovation and refurbishment expenditure of a revenue natureis expensed as incurred. Our business model for developments is to use a combination of in-house staff and external advisers. Thecost of external advisers is capitalised to the cost of developments. The cost of staff working on developments is capitalised subjectto meeting certain criteria related to the degree of time spent on and the nature of specific projects.
Property transactionsAcquisitions and disposals are accounted for at the date of legal completion. Investment properties are reclassified as held for sale once contracts have been exchanged and are transferred between categories at the estimated market value on the transfer date.
LeasesLeases are classified as finance leases whenever the terms of the lease transfer substantially all the risks and rewards of ownershipto the lessee. All other leases are classified as operating leases.
The Group as lessorRental income from operating leases is recognised on a straight-line basis over the term of the relevant lease. Initial direct costsincurred in negotiating and arranging an operating lease are added to the carrying amount of the leased asset and recognised on a straight-line basis over the lease term. Incentives and costs associated with entering into tenant leases are amortised on a straight-line basis over the term of the lease.
The Group as lesseeAssets held under finance leases are recognised as assets at their fair value or, if lower, at the present value of the minimum lease payments, each determined at the inception of the lease. The corresponding liability to the lessor is included in the balance sheet as a finance lease obligation.
Lease payments are apportioned between finance expenses and reduction of the lease obligation so as to achieve a constant rate of interest on the remaining balance of the liability. Finance expenses are recognised immediately in profit or loss, unless theyare directly attributable to qualifying assets, in which case they are capitalised in accordance with the Group’s general policy on borrowing costs. Contingent rentals are recognised as expenses in the years in which they are incurred.
capreg.com Stock Code: CAL capreg.com
FINANCIALS
81
Capital & Regional AR2017 Financials.indd 81 10/04/2018 16:06:00
NOTES TO THE FINANCIAL STATEMENTSCONTINUED
1 Significant Accounting Policies continuedHead leasesWhere an investment property is held under a head lease, the head lease is initially recognised as an asset at the present value of the minimum ground rent payable under the lease. The corresponding rent liability to the leaseholder is included in the balancesheet as a finance lease obligation.
Fixed asset investmentsFixed asset investments are stated at cost, together with subsequent capital contributions, less provisions for any impairment in value.
Financial instrumentsFinancial assets and financial liabilities are recognised in the Group’s balance sheet when the Group becomes party to the contractual provisions of the instrument.
Financial assetsFinancial assets are classified into the following specified categories: financial assets “at fair value through profit or loss” (FVTPL), “held to maturity” investments, “available for sale” financial assets and ”loans and receivables”. The classification depends on the nature and purpose of the financial assets and is determined at the time of initial recognition.
Effective interest rate methodThe effective interest rate method is a method of calculating the amortised cost of a debt instrument and of allocating the interestincome over the relevant period. The effective interest rate is the rate that exactly discounts estimated future cash receipts (including all fees and points paid or received that form an integral part of the effective interest rate, transaction costs and other premiums or discounts) through the expected life of the debt instrument, or, where appropriate, a shorter period, to the net carrying amount in initial recognition.
Loans and receivablesLoans and other receivables that have fixed or determinable payments that are not quoted in an active market are classified as “loans and receivables”. Loans and receivables are measured at amortised cost using the effective interest method, less any impairment. Interest income is recognised by applying the effective interest rate, except for short term receivables when the recognition of interest would be immaterial.
Trade receivablesTrade receivables are carried at the original invoice amount less allowances made for doubtful accounts. An allowance for doubtfulaccounts is recorded for the difference between the carrying value and the recoverable amount where there is objective evidencethat the Group will not be able to collect all amounts due. Discounts and similar allowances are recorded on an accrual basis consistent with the recognition of the related sales, using estimates based on existing contractual obligations, historical trends and the Group’s experience. Long-term accounts receivable are discounted to take into account the time value of money, where material.
Cash and cash equivalentsCash and cash equivalents include cash on hand and demand deposits and other short-term highly liquid investments that are readily convertible to a known amount of cash and are subject to an insignificant risk of changes in value.
Financial liabilitiesFinancial liabilities are classified as either financial liabilities “at FVTPL” or “other financial liabilities”.
BorrowingsBorrowings are initially measured at fair value, net of transaction costs. Borrowings are subsequently measured at amortised cost using the effective interest method, with interest expense recognised on an effective yield basis. In accordance with IAS 39Financial Instruments: Recognition and Measurement, a substantial modification of the terms of an existing borrowing is accountedfor as an extinguishment of the original liability and the recognition of a new liability. Where the terms of the modification are not substantially different, any costs paid in connection with the modification are treated as an adjustment to the carrying amount of the liability and are amortised over the remaining life of the modified liability.
1 Significant Accounting Policies continuedDerivative financial instrumentsDerivatives are initially recognised at fair value at the date a derivative contract is entered into and are subsequently remeasuredto their fair value at each balance sheet date. The fair value of forward foreign exchange contracts is calculated by reference to spot and forward exchange rates at the balance sheet date. The fair value of interest rate swaps is calculated by reference to appropriateforecasts of yield curves between the balance sheet date and the maturity of the instrument. Changes in fair value are includedas finance income or finance costs in the income statement, except for gains or losses on the portion of an instrument that is aneffective hedge of the net investment in a foreign operation, which are recognised in the net investment hedging reserve. Derivativefinancial instruments are classified as non-current when they have a maturity of more than twelve months and are not intended tobe settled within one year.
Trade payables Trade payables are carried at fair value, with any gains or losses arising on remeasurement recognised in the income statement.
TaxationIncome tax on the profit for the year comprises current and deferred tax. Current tax is the tax payable on the taxable income forthe year and any adjustment in respect of previous years. Deferred tax is provided in full using the balance sheet liability method on timing differences between the carrying amounts of assets and liabilities for financial reporting purposes and the amounts used for taxation purposes. Deferred tax is determined using tax rates that have been enacted or substantively enacted by the reporting dateand are expected to apply when the asset is realised or the liability is settled.
No provision is made for timing differences (i) arising on the initial recognition of assets or liabilities, other than on a businesscombination, that affect neither accounting nor taxable profit and (ii) relating to investments in subsidiaries to the extent that they will not reverse in the foreseeable future.
Employee benefitsPension costsPension liabilities, all of which relate to defined contribution schemes, are charged to the income statement as incurred.
Share-based payments The Group has applied the arrangements of IFRS 2 Share-based Payment. Equity settled share-based payments are measured at fair value at the date of grant. The fair values of the LTIP and the SAYE scheme are calculated using Monte Carlo simulations and the Black–Scholes model as appropriate. The fair values are dependent on factors including the exercise price, expected volatility, period to exercise and risk free interest rate. Market related performance conditions are reflected in the fair values at the date of grant and are expensed on a straight-line basis over the vesting period. Non-market related performance conditions are not reflected in thefair values at the date of grant. At each reporting date, the Group estimates the number of shares likely to vest under non-marketrelated performance conditions so that the cumulative expense will ultimately reflect the number of shares that do vest. Where awards are cancelled, including when an employee ceases to pay contributions into the SAYE scheme, the remaining fair value is expensed immediately.
Own sharesOwn shares held by the Group are shown as a deduction from shareholders’ funds and included in other reserves. The cost of own shares is transferred to retained earnings when shares in the underlying incentive schemes vest. The shares are held in an Employee Share Ownership Trust.
Revenue The Group recognises revenue on an accruals basis, when the amount of revenue can be reliably measured and it is probable that future economic benefits will flow to the Group.
Gross rental income – Gross rental income is rental income adjusted for tenant incentives, recognised on a straight-line basis overthe term of the underlying lease. Contingent rents, being lease payments that are not fixed at the inception of a lease, for exampleturnover rents, are recorded as income in the periods in which they are earned.
Ancillary income – Ancillary income comprises rent and other income from short term tenancies of mobile units, car park income and other sundry income and is recognised over the period of the lettings and contracts.
Service charge – Service charge income represents recharges of the running costs of the shopping centres made to tenants.
Capital & Regional plc Annual Report and Accounts for the year ended 30 December 2017
Stock Code: CAL capreg.com Stock Code: CAL
82
Capital & Regional AR2017 Financials.indd 82 10/04/2018 16:06:00

NOTES TO THE FINANCIAL STATEMENTSCONTINUED
1 Significant Accounting Policies continuedHead leasesWhere an investment property is held under a head lease, the head lease is initially recognised as an asset at the present value of the minimum ground rent payable under the lease. The corresponding rent liability to the leaseholder is included in the balancesheet as a finance lease obligation.
Fixed asset investmentsFixed asset investments are stated at cost, together with subsequent capital contributions, less provisions for any impairment in value.
Financial instrumentsFinancial assets and financial liabilities are recognised in the Group’s balance sheet when the Group becomes party to the contractual provisions of the instrument.
Financial assetsFinancial assets are classified into the following specified categories: financial assets “at fair value through profit or loss” (FVTPL), “held to maturity” investments, “available for sale” financial assets and ”loans and receivables”. The classification depends on the nature and purpose of the financial assets and is determined at the time of initial recognition.
Effective interest rate methodThe effective interest rate method is a method of calculating the amortised cost of a debt instrument and of allocating the interestincome over the relevant period. The effective interest rate is the rate that exactly discounts estimated future cash receipts (including all fees and points paid or received that form an integral part of the effective interest rate, transaction costs and other premiums or discounts) through the expected life of the debt instrument, or, where appropriate, a shorter period, to the net carrying amount in initial recognition.
Loans and receivablesLoans and other receivables that have fixed or determinable payments that are not quoted in an active market are classified as “loans and receivables”. Loans and receivables are measured at amortised cost using the effective interest method, less any impairment. Interest income is recognised by applying the effective interest rate, except for short term receivables when the recognition of interest would be immaterial.
Trade receivablesTrade receivables are carried at the original invoice amount less allowances made for doubtful accounts. An allowance for doubtfulaccounts is recorded for the difference between the carrying value and the recoverable amount where there is objective evidencethat the Group will not be able to collect all amounts due. Discounts and similar allowances are recorded on an accrual basis consistent with the recognition of the related sales, using estimates based on existing contractual obligations, historical trends and the Group’s experience. Long-term accounts receivable are discounted to take into account the time value of money, where material.
Cash and cash equivalentsCash and cash equivalents include cash on hand and demand deposits and other short-term highly liquid investments that are readily convertible to a known amount of cash and are subject to an insignificant risk of changes in value.
Financial liabilitiesFinancial liabilities are classified as either financial liabilities “at FVTPL” or “other financial liabilities”.
BorrowingsBorrowings are initially measured at fair value, net of transaction costs. Borrowings are subsequently measured at amortised cost using the effective interest method, with interest expense recognised on an effective yield basis. In accordance with IAS 39Financial Instruments: Recognition and Measurement, a substantial modification of the terms of an existing borrowing is accountedfor as an extinguishment of the original liability and the recognition of a new liability. Where the terms of the modification are not substantially different, any costs paid in connection with the modification are treated as an adjustment to the carrying amount of the liability and are amortised over the remaining life of the modified liability.
1 Significant Accounting Policies continuedDerivative financial instrumentsDerivatives are initially recognised at fair value at the date a derivative contract is entered into and are subsequently remeasuredto their fair value at each balance sheet date. The fair value of forward foreign exchange contracts is calculated by reference to spot and forward exchange rates at the balance sheet date. The fair value of interest rate swaps is calculated by reference to appropriateforecasts of yield curves between the balance sheet date and the maturity of the instrument. Changes in fair value are includedas finance income or finance costs in the income statement, except for gains or losses on the portion of an instrument that is aneffective hedge of the net investment in a foreign operation, which are recognised in the net investment hedging reserve. Derivativefinancial instruments are classified as non-current when they have a maturity of more than twelve months and are not intended tobe settled within one year.
Trade payables Trade payables are carried at fair value, with any gains or losses arising on remeasurement recognised in the income statement.
TaxationIncome tax on the profit for the year comprises current and deferred tax. Current tax is the tax payable on the taxable income forthe year and any adjustment in respect of previous years. Deferred tax is provided in full using the balance sheet liability method on timing differences between the carrying amounts of assets and liabilities for financial reporting purposes and the amounts used for taxation purposes. Deferred tax is determined using tax rates that have been enacted or substantively enacted by the reporting dateand are expected to apply when the asset is realised or the liability is settled.
No provision is made for timing differences (i) arising on the initial recognition of assets or liabilities, other than on a businesscombination, that affect neither accounting nor taxable profit and (ii) relating to investments in subsidiaries to the extent that they will not reverse in the foreseeable future.
Employee benefitsPension costsPension liabilities, all of which relate to defined contribution schemes, are charged to the income statement as incurred.
Share-based payments The Group has applied the arrangements of IFRS 2 Share-based Payment. Equity settled share-based payments are measured at fair value at the date of grant. The fair values of the LTIP and the SAYE scheme are calculated using Monte Carlo simulations and the Black–Scholes model as appropriate. The fair values are dependent on factors including the exercise price, expected volatility, period to exercise and risk free interest rate. Market related performance conditions are reflected in the fair values at the date of grant and are expensed on a straight-line basis over the vesting period. Non-market related performance conditions are not reflected in thefair values at the date of grant. At each reporting date, the Group estimates the number of shares likely to vest under non-marketrelated performance conditions so that the cumulative expense will ultimately reflect the number of shares that do vest. Where awards are cancelled, including when an employee ceases to pay contributions into the SAYE scheme, the remaining fair value is expensed immediately.
Own sharesOwn shares held by the Group are shown as a deduction from shareholders’ funds and included in other reserves. The cost of own shares is transferred to retained earnings when shares in the underlying incentive schemes vest. The shares are held in an Employee Share Ownership Trust.
Revenue The Group recognises revenue on an accruals basis, when the amount of revenue can be reliably measured and it is probable that future economic benefits will flow to the Group.
Gross rental income – Gross rental income is rental income adjusted for tenant incentives, recognised on a straight-line basis overthe term of the underlying lease. Contingent rents, being lease payments that are not fixed at the inception of a lease, for exampleturnover rents, are recorded as income in the periods in which they are earned.
Ancillary income – Ancillary income comprises rent and other income from short term tenancies of mobile units, car park income and other sundry income and is recognised over the period of the lettings and contracts.
Service charge – Service charge income represents recharges of the running costs of the shopping centres made to tenants.
capreg.com Stock Code: CAL capreg.com
FINANCIALS
83
Capital & Regional AR2017 Financials.indd 83 10/04/2018 16:06:00

NOTES TO THE FINANCIAL STATEMENTSCONTINUED
1 Significant Accounting Policies continuedManagement fees – Management fees are recognised, in line with the property management contracts, in the year to which they relate. They include income in relation to services provided by CRPM to associates and joint ventures for asset and property management, project co-ordination, procurement, and management of service charges and directly recoverable expenses.
Dividend and interest income – Dividend income from investments is recognised when the shareholders’ right to receive payment has been established. Interest income is accrued on a time basis, by reference to the principal outstanding and at the effectiveinterest rate applicable, which is the rate that exactly discounts estimated future cash receipts through the expected life of thefinancial asset to that asset’s net carrying amount.
Performance fees – Performance fees are recognised as revenue by the Group or the relevant associate or joint venture when boththe amount of performance fee and the stage of completion of the relevant performance conditions can be measured reliably, and when it is probable that the performance fee will be received. No performance fees were recognised in the current or prior year.
Provisions for performance fees payable by the underlying subsidiary, associate or joint venture are made when there is a presentobligation to settle the performance fee, its amount can be measured reliably and it is probable that it will be paid. Further disclosure on performance fees is included in Note 28. No performance fees were recognised in the current or prior year.
Snozone income - Revenue arises from the operation of indoor ski operations. Revenue represents the amounts received from customers (excluding VAT) for admissions tickets, membership, retail, food and beverage sales and sponsorship. Ticket revenue is recognised at point of entry. Revenue from the sale of memberships is deferred and then recognised over the period that the membership is valid. Retail and food and beverage sales revenues are recognised at the point of sale. Sponsorship revenue is recognised over the relevant contract term.
Finance costsAll borrowing costs are recognised under Finance costs in the income statement in the year in which they are incurred. Finance costsalso include the amortisation of loan issue costs, any loss in the value of the Group’s wholly-owned interest rate swaps and any loss in the ineffective portion of the Group’s hedge of its net investment in a foreign operation.
Operating segmentsThe Group’s reportable segments under IFRS 8 are Wholly-owned assets, Other UK Shopping Centres, Snozone and Group/Central. Wholly-owned assets consists of the shopping centres at Blackburn, Hemel Hempstead, Ilford (from acquisition on 8 March 2017), Luton, Maidstone, Walthamstow and Wood Green and, in the prior year, Camberley, until its disposal on 11 November 2016. Other UK Shopping Centres consists of the Group’s interests in Kingfisher Limited Partnership (Redditch) and, in the prior year, until its reclassification as held for sale on 30 December 2016, Buttermarket Ipswich Limited. Group/Central includes management fee income, Group overheads incurred by Capital & Regional Property Management, Capital & Regional plc and other subsidiaries and the interest expense on the Group’s central borrowing facility.
Wholly-owned assets and Other UK Shopping Centres derive their revenue from the rental of investment properties. The Snozone and Group/Central segments derive their revenue from the operation of indoor ski slopes and the management of property funds or schemes respectively. The split of revenue between these classifications satisfies the requirement of IFRS 8 to report revenuesfrom different products and services. Depreciation and charges in respect of share-based payments represent the only significantnon-cash expenses.
The Group’s interests in the assets, liabilities and profit or loss of its associates and joint ventures are proportionately consolidatedand are also shown on a see-through basis as this is how they are reported to the Board of Directors. There are no differences between the measurements of the segments’ assets, liabilities and profit or loss as they are reported to the Board of Directors and their presentation under the Group’s accounting policies.
Adjusted ProfitAdjusted Profit is the total of Contribution from Wholly-owned assets and the Group’s joint ventures and associates, the profit from Snozone and property management fees less central costs (including interest, excluding non-cash charges in respect of share-basedpayments) after tax. Adjusted Profit excludes revaluation of properties, profit or loss on disposal of properties or investments, gains or losses on financial instruments and exceptional one-off items. Results from Discontinued Operations are included up until thepoint of disposal or reclassification as held for sale. Further detail on the use of Adjusted Profit and other Alternative PerformanceMeasures is provided within the Financial Review.
A reconciliation of Adjusted Profit to the statutory result is provided in Note 2a and, on a per share basis, in Note 9, where EPRAearnings figures are also provided.
2a Operating segments
UK Shopping Centres
Year to 30 December 2017 Notes
Wholly-owned assets
£m
Other UKShopping
Centres1
£mSnozone
£m
GroupCentral
£mTotal
£mRental income from external sources 2b 63.9 2.3 – – 66.2Property and void costs (12.3) (0.7) – – (13.0)Net rental income 51.6 1.6 – – 53.2Net interest expense (18.4) (0.9) – (0.3) (19.6)Snozone income/Management fees2 2b – – 10.4 2.2 12.6Management expenses – – (8.8) (6.8) (15.6)Investment income – – – 0.4 0.4Depreciation – – (0.1) (0.1) (0.2)Variable overhead (excluding non-cash items) – – – (1.6) (1.6)Tax charge – (0.1) – – (0.1)Adjusted Profit 33.2 0.6 1.5 (6.2) 29.1Revaluation of properties (3.8) (2.5) – – (6.3)Income from Euro B-Note3 – – – 0.3 0.3Gain on financial instruments 0.7 0.4 – – 1.1Refinancing costs – (0.5) – – (0.5)Share-based payments – – – (0.9) (0.9)Other items – – – (0.4) (0.4)Profit/(loss) 30.1 (2.0) 1.5 (7.2) 22.4Total assets 2b 984.1 30.9 4.4 12.0 1,031.4Total liabilities 2b (518.7) (23.5) (2.2) (5.6) (550.0)Net assets 465.4 7.4 2.2 6.4 481.4
1. Comprises Kingfisher Redditch. For further information see Note 14.
2. Asset management fees of £3.6 million charged from the Group’s Capital & Regional Property Management entity to Wholly-owned assets have been excluded from the table above.
3. £0.3 million of monies were received in the year through the holding of a share in the German Euro B-Note junior loan instrument which had previously been fully impaired. The monies were distributed following the sale of properties by the liquidator of the underlying German entities.
Capital & Regional plc Annual Report and Accounts for the year ended 30 December 2017
Stock Code: CAL capreg.com Stock Code: CAL
84
Capital & Regional AR2017 Financials.indd 84 10/04/2018 16:06:00

NOTES TO THE FINANCIAL STATEMENTSCONTINUED
1 Significant Accounting Policies continuedManagement fees – Management fees are recognised, in line with the property management contracts, in the year to which they relate. They include income in relation to services provided by CRPM to associates and joint ventures for asset and property management, project co-ordination, procurement, and management of service charges and directly recoverable expenses.
Dividend and interest income – Dividend income from investments is recognised when the shareholders’ right to receive payment has been established. Interest income is accrued on a time basis, by reference to the principal outstanding and at the effectiveinterest rate applicable, which is the rate that exactly discounts estimated future cash receipts through the expected life of thefinancial asset to that asset’s net carrying amount.
Performance fees – Performance fees are recognised as revenue by the Group or the relevant associate or joint venture when boththe amount of performance fee and the stage of completion of the relevant performance conditions can be measured reliably, and when it is probable that the performance fee will be received. No performance fees were recognised in the current or prior year.
Provisions for performance fees payable by the underlying subsidiary, associate or joint venture are made when there is a presentobligation to settle the performance fee, its amount can be measured reliably and it is probable that it will be paid. Further disclosure on performance fees is included in Note 28. No performance fees were recognised in the current or prior year.
Snozone income - Revenue arises from the operation of indoor ski operations. Revenue represents the amounts received from customers (excluding VAT) for admissions tickets, membership, retail, food and beverage sales and sponsorship. Ticket revenue is recognised at point of entry. Revenue from the sale of memberships is deferred and then recognised over the period that the membership is valid. Retail and food and beverage sales revenues are recognised at the point of sale. Sponsorship revenue is recognised over the relevant contract term.
Finance costsAll borrowing costs are recognised under Finance costs in the income statement in the year in which they are incurred. Finance costsalso include the amortisation of loan issue costs, any loss in the value of the Group’s wholly-owned interest rate swaps and any loss in the ineffective portion of the Group’s hedge of its net investment in a foreign operation.
Operating segmentsThe Group’s reportable segments under IFRS 8 are Wholly-owned assets, Other UK Shopping Centres, Snozone and Group/Central. Wholly-owned assets consists of the shopping centres at Blackburn, Hemel Hempstead, Ilford (from acquisition on 8 March 2017), Luton, Maidstone, Walthamstow and Wood Green and, in the prior year, Camberley, until its disposal on 11 November 2016. Other UK Shopping Centres consists of the Group’s interests in Kingfisher Limited Partnership (Redditch) and, in the prior year, until its reclassification as held for sale on 30 December 2016, Buttermarket Ipswich Limited. Group/Central includes management fee income, Group overheads incurred by Capital & Regional Property Management, Capital & Regional plc and other subsidiaries and the interest expense on the Group’s central borrowing facility.
Wholly-owned assets and Other UK Shopping Centres derive their revenue from the rental of investment properties. The Snozone and Group/Central segments derive their revenue from the operation of indoor ski slopes and the management of property funds or schemes respectively. The split of revenue between these classifications satisfies the requirement of IFRS 8 to report revenuesfrom different products and services. Depreciation and charges in respect of share-based payments represent the only significantnon-cash expenses.
The Group’s interests in the assets, liabilities and profit or loss of its associates and joint ventures are proportionately consolidatedand are also shown on a see-through basis as this is how they are reported to the Board of Directors. There are no differences between the measurements of the segments’ assets, liabilities and profit or loss as they are reported to the Board of Directors and their presentation under the Group’s accounting policies.
Adjusted ProfitAdjusted Profit is the total of Contribution from Wholly-owned assets and the Group’s joint ventures and associates, the profit from Snozone and property management fees less central costs (including interest, excluding non-cash charges in respect of share-basedpayments) after tax. Adjusted Profit excludes revaluation of properties, profit or loss on disposal of properties or investments, gains or losses on financial instruments and exceptional one-off items. Results from Discontinued Operations are included up until thepoint of disposal or reclassification as held for sale. Further detail on the use of Adjusted Profit and other Alternative PerformanceMeasures is provided within the Financial Review.
A reconciliation of Adjusted Profit to the statutory result is provided in Note 2a and, on a per share basis, in Note 9, where EPRAearnings figures are also provided.
2a Operating segments
UK Shopping Centres
Year to 30 December 2017 Notes
Wholly-owned assets
£m
Other UKShopping
Centres1
£mSnozone
£m
GroupCentral
£mTotal
£mRental income from external sources 2b 63.9 2.3 – – 66.2Property and void costs (12.3) (0.7) – – (13.0)Net rental income 51.6 1.6 – – 53.2Net interest expense (18.4) (0.9) – (0.3) (19.6)Snozone income/Management fees2 2b – – 10.4 2.2 12.6Management expenses – – (8.8) (6.8) (15.6)Investment income – – – 0.4 0.4Depreciation – – (0.1) (0.1) (0.2)Variable overhead (excluding non-cash items) – – – (1.6) (1.6)Tax charge – (0.1) – – (0.1)Adjusted Profit 33.2 0.6 1.5 (6.2) 29.1Revaluation of properties (3.8) (2.5) – – (6.3)Income from Euro B-Note3 – – – 0.3 0.3Gain on financial instruments 0.7 0.4 – – 1.1Refinancing costs – (0.5) – – (0.5)Share-based payments – – – (0.9) (0.9)Other items – – – (0.4) (0.4)Profit/(loss) 30.1 (2.0) 1.5 (7.2) 22.4Total assets 2b 984.1 30.9 4.4 12.0 1,031.4Total liabilities 2b (518.7) (23.5) (2.2) (5.6) (550.0)Net assets 465.4 7.4 2.2 6.4 481.4
1. Comprises Kingfisher Redditch. For further information see Note 14.
2. Asset management fees of £3.6 million charged from the Group’s Capital & Regional Property Management entity to Wholly-owned assets have been excluded from the table above.
3. £0.3 million of monies were received in the year through the holding of a share in the German Euro B-Note junior loan instrument which had previously been fully impaired. The monies were distributed following the sale of properties by the liquidator of the underlying German entities.
capreg.com Stock Code: CAL capreg.com
FINANCIALS
85
Capital & Regional AR2017 Financials.indd 85 10/04/2018 16:06:01

NOTES TO THE FINANCIAL STATEMENTSCONTINUED
2a Operating segments continued
UK Shopping Centres
Year to 30 December 2016 Notes
Wholly-owned assets
£m
Other UKShopping
Centres1
£mSnozone
£m
GroupCentral
£mTotal
£mRental income from external sources 2b 62.0 3.4 – – 65.4Property and void costs (11.6) (1.2) – – (12.8)Net rental income 50.4 2.2 – – 52.6Net interest expense (19.0) (0.9) – (0.4) (20.3)Snozone income/Management fees2 2b – – 10.2 2.4 12.6Management expenses – – (8.7) (7.8) (16.5)Investment income – – – 0.3 0.3Depreciation – – (0.1) – (0.1)Variable overhead (excluding non-cash items) – – – (1.8) (1.8)Tax (charge)/credit – (0.1) – 0.1 –Adjusted Profit 31.4 1.2 1.4 (7.2) 26.8Revaluation of properties (14.2) 1.2 – – (13.0)Deferred tax on revaluation of properties – (1.5) – – (1.5)Loss on disposal3 (5.9) (0.6) – – (6.5)Income from Euro B-Note4 – – – 3.9 3.9Loss on financial instruments (2.5) – – – (2.5)Refinancing costs5 (11.0) – – – (11.0)Share-based payments – – – (0.5) (0.5)Other items – – – (0.1) (0.1)(Loss)/profit (2.2) 0.3 1.4 (3.9) (4.4)Total assets 2b 885.9 32.1 4.0 42.1 964.1Total liabilities 2b (460.9) (18.2) (2.1) (5.3) (486.5)Net assets 425.0 13.96 1.9 36.86 477.6
1. Includes Buttermarket Ipswich and Kingfisher Redditch. For further information see Note 14.
2. Asset management fees of £3.6 million charged from the Group’s Capital & Regional Property Management entity to Wholly-owned assets have been excluded from the table above.
3. Includes £0.6 million impairment of Ipswich trading property recognised on reclassification as held for sale.
4. £3.9 million of monies were received in the year through the holding of a share in the German Euro B-Note junior loan instrument which had previously been fully impaired. The monies were distributed following the sale of properties by the liquidator of the underlying German entities.
5. Refinancing costs consist of those triggered by serving notice on the existing debt facility on five Mall assets on 28 December 2016 (see Note 9 for further details). They comprise £7.6 million of fixed rate loan redemption costs and the write-off of the £3.4 million of financing costs that were unamortised at 30 December 2016.
6. Net assets of the Buttermarket Ipswich joint venture have been included within Group following its reclassification as held for sale on 30 December 2016. The results for the year were reflected in the Other UK Shopping Centres column.
2b Reconciliations of reportable revenue, assets and liabilities
Revenue Notes
Year to 30 December
2017£m
Year to 30 December
2016£m
Rental income from external sources 2a 66.2 65.4Service charge income 14.1 14.0Management fees 2a 2.2 2.4Snozone income 2a 10.4 10.2Revenue for reportable segments 92.9 92.0Elimination of inter-segment revenue (1.4) (1.4)Rental income earned by associates and joint ventures 2a (2.3) (3.4)Revenue per consolidated income statement 3 89.2 87.2
All revenue in the current and prior years was attributable to activities within the UK.
Assets Notes2017
£m2016
£mTotal assets of reportable segments 2a 1,031.4 964.1Adjustment for associates and joint ventures (23.5) (18.2)Group assets 1,007.9 945.9
LiabilitiesTotal liabilities of reportable segments 2a (550.0) (486.5)Adjustment for associates and joint ventures 23.5 18.2Group liabilities (526.5) (468.3)
Net assets by countryUK 481.3 477.5Germany 0.1 0.1Group net assets 481.4 477.6
3 Revenue
Notes
Year to 30 December
2017£m
Year to 30 December
2016£m
Gross rental income 51.2 51.0Ancillary income 12.7 11.0
2a 63.9 62.0Service charge income 2b 14.1 14.0External management fees 0.8 1.0Snozone income 2a 10.4 10.2Revenue per consolidated income statement 2b 89.2 87.2
External management fees represent revenue earned by the Group’s wholly-owned Capital Regional Property Management Limited subsidiary.
Capital & Regional plc Annual Report and Accounts for the year ended 30 December 2017
Stock Code: CAL capreg.com Stock Code: CAL
86
Capital & Regional AR2017 Financials.indd 86 10/04/2018 16:06:01

NOTES TO THE FINANCIAL STATEMENTSCONTINUED
2a Operating segments continued
UK Shopping Centres
Year to 30 December 2016 Notes
Wholly-owned assets
£m
Other UKShopping
Centres1
£mSnozone
£m
GroupCentral
£mTotal
£mRental income from external sources 2b 62.0 3.4 – – 65.4Property and void costs (11.6) (1.2) – – (12.8)Net rental income 50.4 2.2 – – 52.6Net interest expense (19.0) (0.9) – (0.4) (20.3)Snozone income/Management fees2 2b – – 10.2 2.4 12.6Management expenses – – (8.7) (7.8) (16.5)Investment income – – – 0.3 0.3Depreciation – – (0.1) – (0.1)Variable overhead (excluding non-cash items) – – – (1.8) (1.8)Tax (charge)/credit – (0.1) – 0.1 –Adjusted Profit 31.4 1.2 1.4 (7.2) 26.8Revaluation of properties (14.2) 1.2 – – (13.0)Deferred tax on revaluation of properties – (1.5) – – (1.5)Loss on disposal3 (5.9) (0.6) – – (6.5)Income from Euro B-Note4 – – – 3.9 3.9Loss on financial instruments (2.5) – – – (2.5)Refinancing costs5 (11.0) – – – (11.0)Share-based payments – – – (0.5) (0.5)Other items – – – (0.1) (0.1)(Loss)/profit (2.2) 0.3 1.4 (3.9) (4.4)Total assets 2b 885.9 32.1 4.0 42.1 964.1Total liabilities 2b (460.9) (18.2) (2.1) (5.3) (486.5)Net assets 425.0 13.96 1.9 36.86 477.6
1. Includes Buttermarket Ipswich and Kingfisher Redditch. For further information see Note 14.
2. Asset management fees of £3.6 million charged from the Group’s Capital & Regional Property Management entity to Wholly-owned assets have been excluded from the table above.
3. Includes £0.6 million impairment of Ipswich trading property recognised on reclassification as held for sale.
4. £3.9 million of monies were received in the year through the holding of a share in the German Euro B-Note junior loan instrument which had previously been fully impaired. The monies were distributed following the sale of properties by the liquidator of the underlying German entities.
5. Refinancing costs consist of those triggered by serving notice on the existing debt facility on five Mall assets on 28 December 2016 (see Note 9 for further details). They comprise £7.6 million of fixed rate loan redemption costs and the write-off of the £3.4 million of financing costs that were unamortised at 30 December 2016.
6. Net assets of the Buttermarket Ipswich joint venture have been included within Group following its reclassification as held for sale on 30 December 2016. The results for the year were reflected in the Other UK Shopping Centres column.
2b Reconciliations of reportable revenue, assets and liabilities
Revenue Notes
Year to 30 December
2017£m
Year to 30 December
2016£m
Rental income from external sources 2a 66.2 65.4Service charge income 14.1 14.0Management fees 2a 2.2 2.4Snozone income 2a 10.4 10.2Revenue for reportable segments 92.9 92.0Elimination of inter-segment revenue (1.4) (1.4)Rental income earned by associates and joint ventures 2a (2.3) (3.4)Revenue per consolidated income statement 3 89.2 87.2
All revenue in the current and prior years was attributable to activities within the UK.
Assets Notes2017
£m2016
£mTotal assets of reportable segments 2a 1,031.4 964.1Adjustment for associates and joint ventures (23.5) (18.2)Group assets 1,007.9 945.9
LiabilitiesTotal liabilities of reportable segments 2a (550.0) (486.5)Adjustment for associates and joint ventures 23.5 18.2Group liabilities (526.5) (468.3)
Net assets by countryUK 481.3 477.5Germany 0.1 0.1Group net assets 481.4 477.6
3 Revenue
Notes
Year to 30 December
2017£m
Year to 30 December
2016£m
Gross rental income 51.2 51.0Ancillary income 12.7 11.0
2a 63.9 62.0Service charge income 2b 14.1 14.0External management fees 0.8 1.0Snozone income 2a 10.4 10.2Revenue per consolidated income statement 2b 89.2 87.2
External management fees represent revenue earned by the Group’s wholly-owned Capital Regional Property Management Limited subsidiary.
capreg.com Stock Code: CAL capreg.com
FINANCIALS
87
Capital & Regional AR2017 Financials.indd 87 10/04/2018 16:06:01

NOTES TO THE FINANCIAL STATEMENTSCONTINUED
4 Cost of salesYear to
30 December 2017
£m
Year to 30 December
2016£m
Property and void costs (11.9) (11.2)Service charge costs (12.7) (12.5)Snozone expenses (8.9) (8.8)Total cost of sales (33.5) (32.5)
5 Finance income and costsYear to
30 December 2017
£m
Year to 30 December
2016£m
Finance incomeInterest receivable 0.1 0.1Income from fixed asset investments 0.4 0.3Gain in fair value of financial instruments: Interestrateswaps 0.7 –Total finance income 1.2 0.4Finance costsAmortisation of deferred loan arrangement fees (1.0) (1.6)Interest payable on bank loans and overdrafts (13.9) (14.0)Other interest payable (0.5) (0.2)Finance lease costs (head lease) (3.4) (3.6)Loss in fair value of financial instruments: Interestrateswaps – (2.1) Interestratecaps – (0.5)Refinancing costs1 – (11.0)Total finance costs (18.8) (33.0)
1 Refinancing costs in 2016 consisted of those triggered by serving notice on the existing debt facility on five Mall assets on 28 December 2016 (see Note 17a for further details). They comprised £7.6 million of fixed rate loan redemption costs and the write-off of the £3.4 million of financing costs that were unamortised at 30 December 2016.
6 Profit/loss before taxThe profit/loss before tax has been arrived at after charging/(crediting) the following items:
Notes
Year to 30 December
2017£m
Year to 30 December
2016£m
Operating lease charge 1.9 1.9Other gains and losses (0.3) 1.8Depreciation of plant and equipment 11 0.2 0.1Staff costs 7 13.1 13.7Auditor’s remuneration for audit services (see below) 0.2 0.2
In the current year other gains and losses relate primarily to £0.3 million recovered through the holding of a share in the GermanEuro B-Note junior loan instrument which had previously been fully impaired. In the prior year other gains and losses related primarily to losses on the sale of The Mall, Camberley of £6.3 million, partially offset by £3.9 million recovered through the GermanEuro B-Note, a £0.4 million profit on the sale of a unit in Maidstone and a £0.2 million receipt related to a property disposed of in a prior year.
6 Profit/loss before tax continuedAuditor’s remunerationThe analysis of the Auditor’s remuneration is as follows:
Year to 30 December
2017£m
Year to 30 December
2016£m
Fees payable to the Company’s Auditor and its associates for the audit of the Company’s annual financial statements 83 80Fees payable to the Company’s Auditor and its associates for other services to the Group – the audit of the Company’s subsidiaries 74 60Total audit fees for the Company and its subsidiaries 157 140Audit related assurance services – Review of Interim Report 41 40Audit related assurance services – Agreed upon procedures review 2 2Total non-audit fees 43 42Total fees paid to Auditor and their associates 200 182
7 Staff costs
Notes
Year to 30 December
2017£m
Year to 30 December
2016£m
Salaries 9.5 10.1Discretionary bonuses 1.4 1.7Share-based payments 20 0.9 0.5
11.8 12.3Social security 1.2 1.3Other pension costs 0.1 0.1 13.1 13.7
Staff costs amounting to £0.4 million (2016: nil) have been capitalised as development costs during the year.
Staff numbersThe monthly average number of employees (including Executive Directors), being full-time equivalents, employed by the Group during the year was as follows:
Year to 30 December
2017Number
Year to 30 December
2016Number
CRPM/PLC 46 51Shopping centres 60 67Snozone 132 142Total staff numbers 238 260
The monthly average number of total employees (including Executive Directors) employed within the Group during the year was 355(CRPM – 49, Shopping centres – 81, Snozone – 225) compared to 367 in 2016 (CRPM – 52, Shopping centres – 86, Snozone – 229).
Capital & Regional plc Annual Report and Accounts for the year ended 30 December 2017
Stock Code: CAL capreg.com Stock Code: CAL
88
Capital & Regional AR2017 Financials.indd 88 10/04/2018 16:06:02

NOTES TO THE FINANCIAL STATEMENTSCONTINUED
4 Cost of salesYear to
30 December 2017
£m
Year to 30 December
2016£m
Property and void costs (11.9) (11.2)Service charge costs (12.7) (12.5)Snozone expenses (8.9) (8.8)Total cost of sales (33.5) (32.5)
5 Finance income and costsYear to
30 December 2017
£m
Year to 30 December
2016£m
Finance incomeInterest receivable 0.1 0.1Income from fixed asset investments 0.4 0.3Gain in fair value of financial instruments: Interestrateswaps 0.7 –Total finance income 1.2 0.4Finance costsAmortisation of deferred loan arrangement fees (1.0) (1.6)Interest payable on bank loans and overdrafts (13.9) (14.0)Other interest payable (0.5) (0.2)Finance lease costs (head lease) (3.4) (3.6)Loss in fair value of financial instruments: Interestrateswaps – (2.1) Interestratecaps – (0.5)Refinancing costs1 – (11.0)Total finance costs (18.8) (33.0)
1 Refinancing costs in 2016 consisted of those triggered by serving notice on the existing debt facility on five Mall assets on 28 December 2016 (see Note 17a for further details). They comprised £7.6 million of fixed rate loan redemption costs and the write-off of the £3.4 million of financing costs that were unamortised at 30 December 2016.
6 Profit/loss before taxThe profit/loss before tax has been arrived at after charging/(crediting) the following items:
Notes
Year to 30 December
2017£m
Year to 30 December
2016£m
Operating lease charge 1.9 1.9Other gains and losses (0.3) 1.8Depreciation of plant and equipment 11 0.2 0.1Staff costs 7 13.1 13.7Auditor’s remuneration for audit services (see below) 0.2 0.2
In the current year other gains and losses relate primarily to £0.3 million recovered through the holding of a share in the GermanEuro B-Note junior loan instrument which had previously been fully impaired. In the prior year other gains and losses related primarily to losses on the sale of The Mall, Camberley of £6.3 million, partially offset by £3.9 million recovered through the GermanEuro B-Note, a £0.4 million profit on the sale of a unit in Maidstone and a £0.2 million receipt related to a property disposed of in a prior year.
6 Profit/loss before tax continuedAuditor’s remunerationThe analysis of the Auditor’s remuneration is as follows:
Year to 30 December
2017£m
Year to 30 December
2016£m
Fees payable to the Company’s Auditor and its associates for the audit of the Company’s annual financial statements 83 80Fees payable to the Company’s Auditor and its associates for other services to the Group – the audit of the Company’s subsidiaries 74 60Total audit fees for the Company and its subsidiaries 157 140Audit related assurance services – Review of Interim Report 41 40Audit related assurance services – Agreed upon procedures review 2 2Total non-audit fees 43 42Total fees paid to Auditor and their associates 200 182
7 Staff costs
Notes
Year to 30 December
2017£m
Year to 30 December
2016£m
Salaries 9.5 10.1Discretionary bonuses 1.4 1.7Share-based payments 20 0.9 0.5
11.8 12.3Social security 1.2 1.3Other pension costs 0.1 0.1 13.1 13.7
Staff costs amounting to £0.4 million (2016: nil) have been capitalised as development costs during the year.
Staff numbersThe monthly average number of employees (including Executive Directors), being full-time equivalents, employed by the Group during the year was as follows:
Year to 30 December
2017Number
Year to 30 December
2016Number
CRPM/PLC 46 51Shopping centres 60 67Snozone 132 142Total staff numbers 238 260
The monthly average number of total employees (including Executive Directors) employed within the Group during the year was 355(CRPM – 49, Shopping centres – 81, Snozone – 225) compared to 367 in 2016 (CRPM – 52, Shopping centres – 86, Snozone – 229).
capreg.com Stock Code: CAL capreg.com
FINANCIALS
89
Capital & Regional AR2017 Financials.indd 89 10/04/2018 16:06:02

NOTES TO THE FINANCIAL STATEMENTSCONTINUED
8 Tax8a Tax credit
Year to 30 December
2017£m
Year to 30 December
2016£m
Current taxUK corporation tax – –Adjustments in respect of prior years – (0.1)Total current tax credit – (0.1)Deferred tax Origination and reversal of temporary timing differences – –Total deferred tax – –Total tax credit – (0.1)
£nil (2016: £nil) of the tax charge relates to items included in other comprehensive income.
8b Tax charge reconciliation
Notes
Year to 30 December
2017£m
Year to 30 December
2016£m
Profit/(loss) before tax on continuing operations 22.4 (4.5)Profit/(loss) multiplied by the UK corporation tax rate of 19.25% (2016: 20%) 4.3 (0.9)REIT exempt income and gains (4.0) (1.5)Non-allowable expenses and non-taxable items (0.4) (0.5)Excess tax losses 0.1 0.4Unrealised losses/(gains) on investment properties not taxable – 2.6Temporary timing and controlled foreign companies income – (0.1)Adjustments in respect of prior years – (0.1)Total tax credit 8a – (0.1)
8c Deferred taxThe UK corporation tax main rate was reduced to 19% with effect from 1 April 2017. A further reduction in the rate of corporationtax to 17% from 1 April 2020 was substantively enacted in Finance Act 2016. Consequently the UK corporation tax rate at which thedeferred tax is booked in the financial statements is 17% (2016: 17%).
The Group has recognised a deferred tax asset of £0.1 million (2016: £0.1 million). No deferred tax asset has been recognised inrespect of temporary differences arising from investments or investments in associates or in joint ventures in the current or prioryears as it is not certain that a deduction will be available when the asset crystallises.
The Group has £12.3 million (2016: £13.9 million) of unused revenue tax losses, all of which are in the UK. No deferred tax assethas been recognised in respect of these losses due to the unpredictability of future profit streams and other reasons which mayrestricttheutilisationofthelosses(2016:£nil).TheGrouphasunusedcapitallossesof£25.1million(2016:£30.5 million)thatareavailable for offset against future gains but similarly no deferred tax has been recognised in respect of these losses owing to the unpredictability of future capital gains and other reasons which may restrict the utilisation of the losses. The losses do not have an expiry date.
8 Tax continued8d REIT complianceThe Group converted to a group REIT on 31 December 2014. As a result, the Group no longer pays UK corporation tax on the profitsand gains from qualifying rental business in the UK provided it meets certain conditions. Non-qualifying profits and gains of theGroup continue to be subject to corporation tax as normal. In order to achieve and retain group REIT status, several entrance testshad to be met and certain ongoing criteria must be maintained. The main criteria are as follows:
• at the start of each accounting year, the value of the assets of the property rental business plus cash must be at least 75% of the total value of the Group’s assets;
• at least 75% of the Group’s total profits must arise from the property rental business; and• at least 90% of the Group’s UK property rental profits as calculated under tax rules must be distributed.
The Directors intend that the Group should continue as a group REIT for the foreseeable future, with the result that deferred tax is no longer recognised on temporary differences relating to the property rental business.
9 Earnings per shareThe European Public Real Estate Association (“EPRA”) has issued recommendations for the calculation of earnings per share information as shown in the following tables:
9a Earnings per share calculation
Year to 30 December 2017 Year to 30 December 2016
Notes Profit EPRA Adjusted
Profit Profit EPRAAdjusted
Profit
Profit (£m)Profit/(loss) for the year 22.4 22.4 22.4 (4.4) (4.4) (4.4)Revaluation loss on investment properties (net of tax) 9b – 6.3 6.3 – 14.5 14.5Loss on disposal of properties (net of tax) 9b – – – – 6.5 6.5Income from German B-Note 2a – (0.3) (0.3) – (3.9) (3.9)Changes in fair value of financial instruments 9b – (1.1) (1.1) – 2.5 2.5Refinancing costs 2a – 0.5 0.5 – 11.0 11.0Share-based payments 2a – – 0.9 – – 0.5Other items 2a – – 0.4 – – 0.1Profit (£m) 22.4 27.8 29.1 (4.4) 26.2 26.8Earnings per share (pence) 3.2 3.9 4.1 (0.6)p 3.7p 3.8pDiluted earnings per share (pence) 3.1 3.9 4.1 (0.6)p 3.7p 3.8p
None of the current or prior year earnings related to discontinued operations (2016: none).
Weighted average number of shares (m) Notes
Year to 30 December
2017
Year to 30 December
2016Ordinary shares in issue 709.2 701.0Own shares held 21 (0.2) (0.6)Basic 709.0 700.4Dilutive contingently issuable shares and share options 6.8 10.0Diluted 715.8 710.4
At the end of the year, the Group had 12,128,362 (2016: 11,929,797) share options and contingently issuable shares granted undershare-based payment schemes that could potentially dilute earnings per share in the future but which have not been included in thecalculation because they are not dilutive or the conditions for vesting have not been met.
Capital & Regional plc Annual Report and Accounts for the year ended 30 December 2017
Stock Code: CAL capreg.com Stock Code: CAL
90
Capital & Regional AR2017 Financials.indd 90 10/04/2018 16:06:02

NOTES TO THE FINANCIAL STATEMENTSCONTINUED
8 Tax8a Tax credit
Year to 30 December
2017£m
Year to 30 December
2016£m
Current taxUK corporation tax – –Adjustments in respect of prior years – (0.1)Total current tax credit – (0.1)Deferred tax Origination and reversal of temporary timing differences – –Total deferred tax – –Total tax credit – (0.1)
£nil (2016: £nil) of the tax charge relates to items included in other comprehensive income.
8b Tax charge reconciliation
Notes
Year to 30 December
2017£m
Year to 30 December
2016£m
Profit/(loss) before tax on continuing operations 22.4 (4.5)Profit/(loss) multiplied by the UK corporation tax rate of 19.25% (2016: 20%) 4.3 (0.9)REIT exempt income and gains (4.0) (1.5)Non-allowable expenses and non-taxable items (0.4) (0.5)Excess tax losses 0.1 0.4Unrealised losses/(gains) on investment properties not taxable – 2.6Temporary timing and controlled foreign companies income – (0.1)Adjustments in respect of prior years – (0.1)Total tax credit 8a – (0.1)
8c Deferred taxThe UK corporation tax main rate was reduced to 19% with effect from 1 April 2017. A further reduction in the rate of corporationtax to 17% from 1 April 2020 was substantively enacted in Finance Act 2016. Consequently the UK corporation tax rate at which thedeferred tax is booked in the financial statements is 17% (2016: 17%).
The Group has recognised a deferred tax asset of £0.1 million (2016: £0.1 million). No deferred tax asset has been recognised inrespect of temporary differences arising from investments or investments in associates or in joint ventures in the current or prioryears as it is not certain that a deduction will be available when the asset crystallises.
The Group has £12.3 million (2016: £13.9 million) of unused revenue tax losses, all of which are in the UK. No deferred tax assethas been recognised in respect of these losses due to the unpredictability of future profit streams and other reasons which mayrestricttheutilisationofthelosses(2016:£nil).TheGrouphasunusedcapitallossesof£25.1million(2016:£30.5 million)thatareavailable for offset against future gains but similarly no deferred tax has been recognised in respect of these losses owing to the unpredictability of future capital gains and other reasons which may restrict the utilisation of the losses. The losses do not have an expiry date.
8 Tax continued8d REIT complianceThe Group converted to a group REIT on 31 December 2014. As a result, the Group no longer pays UK corporation tax on the profitsand gains from qualifying rental business in the UK provided it meets certain conditions. Non-qualifying profits and gains of theGroup continue to be subject to corporation tax as normal. In order to achieve and retain group REIT status, several entrance testshad to be met and certain ongoing criteria must be maintained. The main criteria are as follows:
• at the start of each accounting year, the value of the assets of the property rental business plus cash must be at least 75% of the total value of the Group’s assets;
• at least 75% of the Group’s total profits must arise from the property rental business; and• at least 90% of the Group’s UK property rental profits as calculated under tax rules must be distributed.
The Directors intend that the Group should continue as a group REIT for the foreseeable future, with the result that deferred tax is no longer recognised on temporary differences relating to the property rental business.
9 Earnings per shareThe European Public Real Estate Association (“EPRA”) has issued recommendations for the calculation of earnings per share information as shown in the following tables:
9a Earnings per share calculation
Year to 30 December 2017 Year to 30 December 2016
Notes Profit EPRA Adjusted
Profit Profit EPRAAdjusted
Profit
Profit (£m)Profit/(loss) for the year 22.4 22.4 22.4 (4.4) (4.4) (4.4)Revaluation loss on investment properties (net of tax) 9b – 6.3 6.3 – 14.5 14.5Loss on disposal of properties (net of tax) 9b – – – – 6.5 6.5Income from German B-Note 2a – (0.3) (0.3) – (3.9) (3.9)Changes in fair value of financial instruments 9b – (1.1) (1.1) – 2.5 2.5Refinancing costs 2a – 0.5 0.5 – 11.0 11.0Share-based payments 2a – – 0.9 – – 0.5Other items 2a – – 0.4 – – 0.1Profit (£m) 22.4 27.8 29.1 (4.4) 26.2 26.8Earnings per share (pence) 3.2 3.9 4.1 (0.6)p 3.7p 3.8pDiluted earnings per share (pence) 3.1 3.9 4.1 (0.6)p 3.7p 3.8p
None of the current or prior year earnings related to discontinued operations (2016: none).
Weighted average number of shares (m) Notes
Year to 30 December
2017
Year to 30 December
2016Ordinary shares in issue 709.2 701.0Own shares held 21 (0.2) (0.6)Basic 709.0 700.4Dilutive contingently issuable shares and share options 6.8 10.0Diluted 715.8 710.4
At the end of the year, the Group had 12,128,362 (2016: 11,929,797) share options and contingently issuable shares granted undershare-based payment schemes that could potentially dilute earnings per share in the future but which have not been included in thecalculation because they are not dilutive or the conditions for vesting have not been met.
capreg.com Stock Code: CAL capreg.com
FINANCIALS
91
Capital & Regional AR2017 Financials.indd 91 10/04/2018 16:06:02

NOTES TO THE FINANCIAL STATEMENTSCONTINUED
9 Earnings per share continued9b Reconciliation of earnings figures included in earnings per share calculations
Year to 30 December 2017 Year to 30 December 2016
Notes
Revaluation movements
£m
Profit on disposal of investment properties
£m
Movement in fair value of financial
instruments £m
Revaluation movements
£m
Loss on disposal of investment properties
£m
Movement in fair value of financial
instruments £m
Wholly-owned (3.8) – 0.7 (14.2) (5.9) (2.5)Associates 14d (2.5) – 0.4 (2.3) – –Joint ventures 14e – – – 3.5 (0.6) –Tax effect – – – (1.5) – –Total 9a (6.3) – 1.1 (14.5) (6.5) (2.5)
9c Headline earnings per shareHeadline earnings per share has been calculated and presented as required by the Johannesburg Stock Exchange listing requirements.
Year to 30 December 2017 Year to 30 December 2016Basic Diluted Basic Diluted
Profit (£m)Profit/(loss) for the year 22.4 22.4 (4.4) (4.4)Revaluation loss on investment properties (including tax) 6.3 6.3 14.5 14.5Loss on disposal of properties (net of tax) – – 6.5 6.5Income from Euro B-Note (Note 6) (0.3) (0.3) (3.9) (3.9)Headline earnings 28.4 28.4 12.7 12.7
Weighted average number of shares (m)Ordinary shares in issue 709.2 709.2 701.0 701.0Own shares held (0.2) (0.2) (0.6) (0.6)Dilutive contingently issuable shares and share options – 6.8 – 10.0
709.0 715.8 700.4 710.4Headline Earnings per share (pence) – Basic/Diluted 4.0p 4.0p 1.8p 1.8p
10 Investment properties10a Wholly-owned properties
Freehold investment properties
£m
Leasehold investment properties
£m
Total property
assets £m
Cost or valuationAt30 December2015 292.7 577.3 870.0Acquired (The Marlowes, Hemel Hempstead) 56.6 – 56.6Disposals (The Mall, Camberley) – (93.9) (93.9)Capital expenditure (excluding capital contributions) 13.5 5.9 19.4Valuation deficit (4.9) (8.7) (13.6)At 30 December 2016 357.9 480.6 838.5Acquired (The Exchange, Ilford) 79.0 – 79.0Capital expenditure (excluding capital contributions) 4.3 12.3 16.6Valuation surplus1 (3.8) 0.3 (3.5)At 30 December 2017 437.4 493.2 930.6
1. £3.8 million per Note 2a includes letting fee amortisation adjustment of £0.3 million (2016: £0.6 million).
10 Investment properties continued10b Property assets summary
30 December 2017 30 December 2016100%
£mGroup share
£m 100%
£mGroup share
£m
Wholly-ownedInvestment properties at fair value 886.6 886.6 794.1 794.1Head leases treated as finance leases on investment properties 61.3 61.3 61.3 61.3Unamortised tenant incentives on investment properties (17.3) (17.3) (16.9) (16.9)IFRS Property Value 930.6 930.6 838.5 838.5AssociatesInvestment properties at fair value 142.9 28.6 154.1 30.8Unamortised tenant incentives on investment properties (4.5) (0.9) (4.1) (0.8)IFRS Property Value 138.4 27.7 150.0 30.0Total at property valuation 1,029.5 915.2 948.2 824.9Total IFRS Property Value 1,069.0 958.3 988.5 868.5
10c ValuationsExternalvaluationsat30 December2017werecarriedoutonallofthegrosspropertyassetsdetailedinthetableabove.TheGroup’s share of the total investment properties at fair value was £915.2 million of £1,029.5 million (2016: £824.9 million of £948.2million).
The valuations were carried out by independent qualified professional valuers from CBRE Limited and Knight Frank LLP (2016: CBRELimited, Cushman & Wakefield LLP and Knight Frank LLP) in accordance with RICS standards. These valuers are not connected with the Group and their fees are charged on a fixed basis that is not dependent on the outcome of the valuations.
The Group considers all of its investment properties to fall within “Level 3”, as defined in Note 1. The table below summarises the key unobservableinputsusedinthevaluationoftheGroup’swholly-ownedinvestmentpropertiesat30 December2017:
Market Value £m
Estimated rental value £ per sq ft Equivalent yield %Low Portfolio High Low Portfolio High
Wholly-owned assets 886.6 13.72 19.61 24.96 5.09 6.40 8.25
SensitivitiesThe following table illustrates the impact of changes in key unobservable inputs (in isolation) on the fair value of the Group’sproperties:
Impact on valuations of 5% change in estimated rental value
Impact on valuations of 25bps change in equivalent yield
Increase £m
Decrease £m
Increase £m
Decrease £m
Wholly-owned assets 38.5 (36.7) (37.5) 40.6
Capital & Regional plc Annual Report and Accounts for the year ended 30 December 2017
Stock Code: CAL capreg.com Stock Code: CAL
92
Capital & Regional AR2017 Financials.indd 92 10/04/2018 16:06:03

NOTES TO THE FINANCIAL STATEMENTSCONTINUED
9 Earnings per share continued9b Reconciliation of earnings figures included in earnings per share calculations
Year to 30 December 2017 Year to 30 December 2016
Notes
Revaluation movements
£m
Profit on disposal of investment properties
£m
Movement in fair value of financial
instruments £m
Revaluation movements
£m
Loss on disposal of investment properties
£m
Movement in fair value of financial
instruments £m
Wholly-owned (3.8) – 0.7 (14.2) (5.9) (2.5)Associates 14d (2.5) – 0.4 (2.3) – –Joint ventures 14e – – – 3.5 (0.6) –Tax effect – – – (1.5) – –Total 9a (6.3) – 1.1 (14.5) (6.5) (2.5)
9c Headline earnings per shareHeadline earnings per share has been calculated and presented as required by the Johannesburg Stock Exchange listing requirements.
Year to 30 December 2017 Year to 30 December 2016Basic Diluted Basic Diluted
Profit (£m)Profit/(loss) for the year 22.4 22.4 (4.4) (4.4)Revaluation loss on investment properties (including tax) 6.3 6.3 14.5 14.5Loss on disposal of properties (net of tax) – – 6.5 6.5Income from Euro B-Note (Note 6) (0.3) (0.3) (3.9) (3.9)Headline earnings 28.4 28.4 12.7 12.7
Weighted average number of shares (m)Ordinary shares in issue 709.2 709.2 701.0 701.0Own shares held (0.2) (0.2) (0.6) (0.6)Dilutive contingently issuable shares and share options – 6.8 – 10.0
709.0 715.8 700.4 710.4Headline Earnings per share (pence) – Basic/Diluted 4.0p 4.0p 1.8p 1.8p
10 Investment properties10a Wholly-owned properties
Freehold investment properties
£m
Leasehold investment properties
£m
Total property
assets £m
Cost or valuationAt30 December2015 292.7 577.3 870.0Acquired (The Marlowes, Hemel Hempstead) 56.6 – 56.6Disposals (The Mall, Camberley) – (93.9) (93.9)Capital expenditure (excluding capital contributions) 13.5 5.9 19.4Valuation deficit (4.9) (8.7) (13.6)At 30 December 2016 357.9 480.6 838.5Acquired (The Exchange, Ilford) 79.0 – 79.0Capital expenditure (excluding capital contributions) 4.3 12.3 16.6Valuation surplus1 (3.8) 0.3 (3.5)At 30 December 2017 437.4 493.2 930.6
1. £3.8 million per Note 2a includes letting fee amortisation adjustment of £0.3 million (2016: £0.6 million).
10 Investment properties continued10b Property assets summary
30 December 2017 30 December 2016100%
£mGroup share
£m 100%
£mGroup share
£m
Wholly-ownedInvestment properties at fair value 886.6 886.6 794.1 794.1Head leases treated as finance leases on investment properties 61.3 61.3 61.3 61.3Unamortised tenant incentives on investment properties (17.3) (17.3) (16.9) (16.9)IFRS Property Value 930.6 930.6 838.5 838.5AssociatesInvestment properties at fair value 142.9 28.6 154.1 30.8Unamortised tenant incentives on investment properties (4.5) (0.9) (4.1) (0.8)IFRS Property Value 138.4 27.7 150.0 30.0Total at property valuation 1,029.5 915.2 948.2 824.9Total IFRS Property Value 1,069.0 958.3 988.5 868.5
10c ValuationsExternalvaluationsat30 December2017werecarriedoutonallofthegrosspropertyassetsdetailedinthetableabove.TheGroup’s share of the total investment properties at fair value was £915.2 million of £1,029.5 million (2016: £824.9 million of £948.2million).
The valuations were carried out by independent qualified professional valuers from CBRE Limited and Knight Frank LLP (2016: CBRELimited, Cushman & Wakefield LLP and Knight Frank LLP) in accordance with RICS standards. These valuers are not connected with the Group and their fees are charged on a fixed basis that is not dependent on the outcome of the valuations.
The Group considers all of its investment properties to fall within “Level 3”, as defined in Note 1. The table below summarises the key unobservableinputsusedinthevaluationoftheGroup’swholly-ownedinvestmentpropertiesat30 December2017:
Market Value £m
Estimated rental value £ per sq ft Equivalent yield %Low Portfolio High Low Portfolio High
Wholly-owned assets 886.6 13.72 19.61 24.96 5.09 6.40 8.25
SensitivitiesThe following table illustrates the impact of changes in key unobservable inputs (in isolation) on the fair value of the Group’sproperties:
Impact on valuations of 5% change in estimated rental value
Impact on valuations of 25bps change in equivalent yield
Increase £m
Decrease £m
Increase £m
Decrease £m
Wholly-owned assets 38.5 (36.7) (37.5) 40.6
capreg.com Stock Code: CAL capreg.com
FINANCIALS
93
Capital & Regional AR2017 Financials.indd 93 10/04/2018 16:06:03

NOTES TO THE FINANCIAL STATEMENTSCONTINUED
11 Plant and equipmentYear to
30 December 2017
£m
Year to 30 December
2016£m
Cost or valuationAt the start of the year 3.7 3.3Additions 1.1 0.5Disposals – (0.1)At the end of the year 4.8 3.7Accumulated depreciationAt the start of the year (2.8) (2.7)Charge for the year (0.2) (0.1)At the end of the year (3.0) (2.8)Carrying amountAt the end of the year 1.8 0.9
12 SubsidiariesA list of the subsidiaries of the Group, including the name, country of incorporation, and proportion of ownership interest is given in Note F to the Company financial statements.
13 ReceivablesYear to
30 December 2017
£m
Year to 30 December
2016£m
Amounts falling due after one year:Financial assetsDeferred tax asset 0.1 0.1Interest rate swaps 0.1 –
0.2 0.1Non-financial assetsUnamortised tenant incentives 4.6 5.3Unamortised rent free periods 9.4 8.9
14.2 14.3Amounts falling due within one year:Financial assetsTrade receivables (net of allowances) 8.0 5.2Amounts owed by associates 0.2 0.1Other receivables 6.1 2.1Accrued income 1.0 0.5Non-derivative financial assets 15.3 7.9Financial assets carried at fair value through the profit or loss:Interest rate caps – 0.1
15.3 8.0Non-financial assetsPrepayments 3.0 2.7Unamortised tenant incentives 1.2 1.1Unamortised rent free periods 2.1 1.6
21.6 13.4
13 Receivables continuedIncluded in the non-derivative financial assets balance are trade receivables with a carrying amount of £1.7 million (2016: £1.9million) which are past due at the reporting date for which the Group has not provided, as there has not been a significant changein credit quality and the amounts are still considered recoverable. The Group holds collateral of £0.8 million (2016: £0.7 million) over trade receivables as security deposits held in rent accounts. The average age of trade receivables is 30 days (2016: 26 days).
30 December 2017
£m
30 December 2016
£m
Analysis of non-derivative current financial assetsNot past due 13.6 6.0Past due but not individually impaired: Lessthan1month 0.8 1.2 1to3months – 0.1 3to6months 0.6 0.3 Over6months 0.3 0.3 15.3 7.9
30 December 2017
£m
30 December 2016
£m
Allowances for doubtful receivablesAt the start of the year 0.7 0.6Additional allowances created 1.8 0.9Utilised during the year (1.5) (0.2)Unused amounts reversed (0.3) (0.6)At the end of the year 0.7 0.7
14 Investment in associates and joint ventures14a Share of results
Notes
Year to 30 December
2017£m
Year to 30 December
2016£m
Share of results of associates 2a, 14d (2.0) (1.5)Share of results of joint ventures 14e – 1.8
(2.0) 0.3
See Note F of the Company’s separate financial statements for further detail on our associate entities.
Capital & Regional plc Annual Report and Accounts for the year ended 30 December 2017
Stock Code: CAL capreg.com Stock Code: CAL
94
Capital & Regional AR2017 Financials.indd 94 10/04/2018 16:06:03

NOTES TO THE FINANCIAL STATEMENTSCONTINUED
11 Plant and equipmentYear to
30 December 2017
£m
Year to 30 December
2016£m
Cost or valuationAt the start of the year 3.7 3.3Additions 1.1 0.5Disposals – (0.1)At the end of the year 4.8 3.7Accumulated depreciationAt the start of the year (2.8) (2.7)Charge for the year (0.2) (0.1)At the end of the year (3.0) (2.8)Carrying amountAt the end of the year 1.8 0.9
12 SubsidiariesA list of the subsidiaries of the Group, including the name, country of incorporation, and proportion of ownership interest is given in Note F to the Company financial statements.
13 ReceivablesYear to
30 December 2017
£m
Year to 30 December
2016£m
Amounts falling due after one year:Financial assetsDeferred tax asset 0.1 0.1Interest rate swaps 0.1 –
0.2 0.1Non-financial assetsUnamortised tenant incentives 4.6 5.3Unamortised rent free periods 9.4 8.9
14.2 14.3Amounts falling due within one year:Financial assetsTrade receivables (net of allowances) 8.0 5.2Amounts owed by associates 0.2 0.1Other receivables 6.1 2.1Accrued income 1.0 0.5Non-derivative financial assets 15.3 7.9Financial assets carried at fair value through the profit or loss:Interest rate caps – 0.1
15.3 8.0Non-financial assetsPrepayments 3.0 2.7Unamortised tenant incentives 1.2 1.1Unamortised rent free periods 2.1 1.6
21.6 13.4
13 Receivables continuedIncluded in the non-derivative financial assets balance are trade receivables with a carrying amount of £1.7 million (2016: £1.9million) which are past due at the reporting date for which the Group has not provided, as there has not been a significant changein credit quality and the amounts are still considered recoverable. The Group holds collateral of £0.8 million (2016: £0.7 million) over trade receivables as security deposits held in rent accounts. The average age of trade receivables is 30 days (2016: 26 days).
30 December 2017
£m
30 December 2016
£m
Analysis of non-derivative current financial assetsNot past due 13.6 6.0Past due but not individually impaired: Lessthan1month 0.8 1.2 1to3months – 0.1 3to6months 0.6 0.3 Over6months 0.3 0.3 15.3 7.9
30 December 2017
£m
30 December 2016
£m
Allowances for doubtful receivablesAt the start of the year 0.7 0.6Additional allowances created 1.8 0.9Utilised during the year (1.5) (0.2)Unused amounts reversed (0.3) (0.6)At the end of the year 0.7 0.7
14 Investment in associates and joint ventures14a Share of results
Notes
Year to 30 December
2017£m
Year to 30 December
2016£m
Share of results of associates 2a, 14d (2.0) (1.5)Share of results of joint ventures 14e – 1.8
(2.0) 0.3
See Note F of the Company’s separate financial statements for further detail on our associate entities.
capreg.com Stock Code: CAL capreg.com
FINANCIALS
95
Capital & Regional AR2017 Financials.indd 95 10/04/2018 16:06:03

NOTES TO THE FINANCIAL STATEMENTSCONTINUED
14 Investment in associates and joint ventures continued14b Investment in associates
Notes
30 December 2017
£m
30 December 2016
£m
At the start of the year 13.9 15.9Share of results of associates 14d (2.0) (1.5)Dividends and capital distributions received (4.5) (0.5)At the end of the year 14d 7.4 13.9
The Group’s only significant associate during 2017 was the Kingfisher Limited Partnership in which the Group is in partnership withfunds under the management of Oaktree Capital Management LP. The Kingfisher Limited Partnership owns The Kingfisher Shopping Centre in Redditch. The Group has a 20% share and exercises significant influence through its representation on the General Partnerboard and through acting as the property and asset manager.
14c Investment in joint ventures
Notes
30 December 2017
£m
30 December 2016
£m
At the start of the year – 11.7Share of results of joint ventures 14e – 1.8Reclassification of Buttermarket Centre, Ipswich as held for sale – (13.5)At the end of the year 14e – –
The Group’s only significant joint venture during 2016 was the Buttermarket Centre, Ipswich. Buttermarket Ipswich Limited was reclassified as held for sale on 30 December 2016 as Management, and their joint venture partner, were committed to a plan to sell and considered a disposal to be highly probable within the following 12 months. On 17 February 2017 the sale completed to National Grid Pension Fund. The Group’s share of the initial proceeds was £9.8 million, with Management estimating the value ofdeferred contingent consideration to be a further £4.1 million, with the Group’s share of estimated disposal costs of £0.4 millionresulting in a net carrying value of £3.7 million, which remained the position at 30 December 2017. £0.3 million of consideration has been received since 30 December 2017 reducing the net carrying value accordingly.
14 Investment in associates and joint ventures continued14d Analysis of investment in associates
Year to 30 December
20171
Total£m
Year to 30 December
20161
Total£m
Income statement (100%)Revenue – gross rent 11.3 11.5Property and management expenses (2.7) (2.0)Void costs (1.1) (1.0)Net rent 7.5 8.5Net interest payable (6.6) (3.8)Contribution 0.9 4.7Revaluation of investment properties (12.4) (11.8)Fair value of interest rate swaps 1.9 (0.2)Loss before tax (9.6) (7.3)Tax (0.2) (0.7)Loss after tax (9.8) (8.0)Balance sheet (100%)Investment properties 138.4 150.0Other assets 16.1 10.4Current liabilities (6.3) (6.5)Non-current liabilities (111.3) (84.0)Net assets (100%) 36.9 69.9Income statement (Group share)Revenue – gross rent 2.3 2.3Property and management expenses (0.5) (0.4)Void costs (0.2) (0.2)Net rent 1.6 1.7Net interest payable (1.4) (0.8)Contribution 0.2 0.9Revaluation of investment properties (2.5) (2.3)Fair value of interest rate swaps 0.4 –Loss before tax (1.9) (1.4)Tax (0.1) (0.1)Loss after tax (2.0) (1.5)Balance sheet (Group share)Investment properties 27.7 30.0Other assets 3.3 2.1Current liabilities (1.3) (1.4)Non-current liabilities (22.3) (16.8)Net assets (Group share) 7.4 13.9
1 Comprises Kingfisher Redditch.
Capital & Regional plc Annual Report and Accounts for the year ended 30 December 2017
Stock Code: CAL capreg.com Stock Code: CAL
96
Capital & Regional AR2017 Financials.indd 96 10/04/2018 16:06:04

NOTES TO THE FINANCIAL STATEMENTSCONTINUED
14 Investment in associates and joint ventures continued14b Investment in associates
Notes
30 December 2017
£m
30 December 2016
£m
At the start of the year 13.9 15.9Share of results of associates 14d (2.0) (1.5)Dividends and capital distributions received (4.5) (0.5)At the end of the year 14d 7.4 13.9
The Group’s only significant associate during 2017 was the Kingfisher Limited Partnership in which the Group is in partnership withfunds under the management of Oaktree Capital Management LP. The Kingfisher Limited Partnership owns The Kingfisher Shopping Centre in Redditch. The Group has a 20% share and exercises significant influence through its representation on the General Partnerboard and through acting as the property and asset manager.
14c Investment in joint ventures
Notes
30 December 2017
£m
30 December 2016
£m
At the start of the year – 11.7Share of results of joint ventures 14e – 1.8Reclassification of Buttermarket Centre, Ipswich as held for sale – (13.5)At the end of the year 14e – –
The Group’s only significant joint venture during 2016 was the Buttermarket Centre, Ipswich. Buttermarket Ipswich Limited was reclassified as held for sale on 30 December 2016 as Management, and their joint venture partner, were committed to a plan to sell and considered a disposal to be highly probable within the following 12 months. On 17 February 2017 the sale completed to National Grid Pension Fund. The Group’s share of the initial proceeds was £9.8 million, with Management estimating the value ofdeferred contingent consideration to be a further £4.1 million, with the Group’s share of estimated disposal costs of £0.4 millionresulting in a net carrying value of £3.7 million, which remained the position at 30 December 2017. £0.3 million of consideration has been received since 30 December 2017 reducing the net carrying value accordingly.
14 Investment in associates and joint ventures continued14d Analysis of investment in associates
Year to 30 December
20171
Total£m
Year to 30 December
20161
Total£m
Income statement (100%)Revenue – gross rent 11.3 11.5Property and management expenses (2.7) (2.0)Void costs (1.1) (1.0)Net rent 7.5 8.5Net interest payable (6.6) (3.8)Contribution 0.9 4.7Revaluation of investment properties (12.4) (11.8)Fair value of interest rate swaps 1.9 (0.2)Loss before tax (9.6) (7.3)Tax (0.2) (0.7)Loss after tax (9.8) (8.0)Balance sheet (100%)Investment properties 138.4 150.0Other assets 16.1 10.4Current liabilities (6.3) (6.5)Non-current liabilities (111.3) (84.0)Net assets (100%) 36.9 69.9Income statement (Group share)Revenue – gross rent 2.3 2.3Property and management expenses (0.5) (0.4)Void costs (0.2) (0.2)Net rent 1.6 1.7Net interest payable (1.4) (0.8)Contribution 0.2 0.9Revaluation of investment properties (2.5) (2.3)Fair value of interest rate swaps 0.4 –Loss before tax (1.9) (1.4)Tax (0.1) (0.1)Loss after tax (2.0) (1.5)Balance sheet (Group share)Investment properties 27.7 30.0Other assets 3.3 2.1Current liabilities (1.3) (1.4)Non-current liabilities (22.3) (16.8)Net assets (Group share) 7.4 13.9
1 Comprises Kingfisher Redditch.
capreg.com Stock Code: CAL capreg.com
FINANCIALS
97
Capital & Regional AR2017 Financials.indd 97 10/04/2018 16:06:04

NOTES TO THE FINANCIAL STATEMENTSCONTINUED
14 Investment in associates and joint ventures continued14e Analysis of investment in joint ventures
Year to 30 December
2017Total
£m
Year to 30 December
20161
Total£m
Income statement (100%)Revenue – gross rent – 2.2Property and management expenses – (0.7)Void costs – (0.6)Net rent – 0.9Net interest payable – (0.3)Contribution – 0.6Revaluation of investment properties – 7.2Deferred tax on revaluation – (2.9)Impairment – (1.2)Profit before tax – 3.7Tax – –Profit after tax – 3.7Income statement (Group share)Revenue – gross rent – 1.1Property and management expenses – (0.3)Void costs – (0.3)Net rent – 0.5Net interest payable – (0.1)Contribution – 0.4Revaluation of investment properties – 3.5Deferred tax on revaluation – (1.5)Impairment – (0.6)Profit before tax – 1.8Tax – –Profit after tax – 1.8
1 Comprised Buttermarket Ipswich.
15 Cash and cash equivalents30 December
2017£m
30 December 2016
£mCash at bank and in hand 24.4 45.8Security deposits held in rent accounts 0.8 0.7Other restricted balances 5.0 2.6 30.2 49.1
Cash at bank and in hand include amounts subject to a charge against various borrowings and may therefore not be immediately available for general use by the Group. All of the above amounts at 30 December 2017 were held in Sterling other than £0.9 millionwhich was held in Euros (30 December 2016: £0.3 million).
16 Trade and other payables30 December
2017£m
30 December 2016
£m
Amounts falling due after one year:Financial liabilitiesAccruals 0.3 0.5Other creditors 2.2 1.8Non-derivative financial liabilities 2.5 2.3Financial liabilities carried as fair value through profit or lossInterest rate swaps 1.5 2.1
4.0 4.4Amounts falling due within one year:Financial liabilitiesTrade payables 2.3 0.8Accruals 21.1 23.2Other creditors 4.6 8.0Non-derivative financial liabilities 28.0 32.0
Non-financial liabilitiesDeferred income 10.4 8.3Other taxation and social security 0.6 1.0
39.0 41.3
The average age of trade payables is 36 days (2016: 14 days), no amounts incur interest (2016: £nil).
17 Bank loans17a Summary of borrowings The Group’s borrowings are arranged to ensure an appropriate maturity profile and to maintain short-term liquidity. There were nodefaults or other breaches of financial covenants that were not waived under any of the Group borrowings during the current yearor the preceding year.
Borrowings at amortised cost Notes
30 December 2017
£m
30 December 2016
£m
SecuredFixed and swapped bank loans 17d 428.4 260.2Variable rate bank loans 17d – 101.3Total borrowings before costs 428.4 361.5Unamortised issue costs (6.2) (0.7)Total borrowings after costs 422.2 360.8
Analysis of total borrowings after costsCurrent – 334.6Non-current 422.2 26.2Total borrowings after costs 422.2 360.8
The Group considers all of its borrowings to fall within “Level 2”, as defined in Note 1.
During the period £39.0 million of new debt was drawn in respect of the acquisition of The Exchange, Ilford, and £362.5 million in respect of the refinancing of the Mall assets completed on 4 January 2017. The maturity of the Group’s £30 million revolving creditfacility was extended in the year to 22 January 2022.
Capital & Regional plc Annual Report and Accounts for the year ended 30 December 2017
Stock Code: CAL capreg.com Stock Code: CAL
98
Capital & Regional AR2017 Financials.indd 98 10/04/2018 16:06:04

NOTES TO THE FINANCIAL STATEMENTSCONTINUED
14 Investment in associates and joint ventures continued14e Analysis of investment in joint ventures
Year to 30 December
2017Total
£m
Year to 30 December
20161
Total£m
Income statement (100%)Revenue – gross rent – 2.2Property and management expenses – (0.7)Void costs – (0.6)Net rent – 0.9Net interest payable – (0.3)Contribution – 0.6Revaluation of investment properties – 7.2Deferred tax on revaluation – (2.9)Impairment – (1.2)Profit before tax – 3.7Tax – –Profit after tax – 3.7Income statement (Group share)Revenue – gross rent – 1.1Property and management expenses – (0.3)Void costs – (0.3)Net rent – 0.5Net interest payable – (0.1)Contribution – 0.4Revaluation of investment properties – 3.5Deferred tax on revaluation – (1.5)Impairment – (0.6)Profit before tax – 1.8Tax – –Profit after tax – 1.8
1 Comprised Buttermarket Ipswich.
15 Cash and cash equivalents30 December
2017£m
30 December 2016
£mCash at bank and in hand 24.4 45.8Security deposits held in rent accounts 0.8 0.7Other restricted balances 5.0 2.6 30.2 49.1
Cash at bank and in hand include amounts subject to a charge against various borrowings and may therefore not be immediately available for general use by the Group. All of the above amounts at 30 December 2017 were held in Sterling other than £0.9 millionwhich was held in Euros (30 December 2016: £0.3 million).
16 Trade and other payables30 December
2017£m
30 December 2016
£m
Amounts falling due after one year:Financial liabilitiesAccruals 0.3 0.5Other creditors 2.2 1.8Non-derivative financial liabilities 2.5 2.3Financial liabilities carried as fair value through profit or lossInterest rate swaps 1.5 2.1
4.0 4.4Amounts falling due within one year:Financial liabilitiesTrade payables 2.3 0.8Accruals 21.1 23.2Other creditors 4.6 8.0Non-derivative financial liabilities 28.0 32.0
Non-financial liabilitiesDeferred income 10.4 8.3Other taxation and social security 0.6 1.0
39.0 41.3
The average age of trade payables is 36 days (2016: 14 days), no amounts incur interest (2016: £nil).
17 Bank loans17a Summary of borrowings The Group’s borrowings are arranged to ensure an appropriate maturity profile and to maintain short-term liquidity. There were nodefaults or other breaches of financial covenants that were not waived under any of the Group borrowings during the current yearor the preceding year.
Borrowings at amortised cost Notes
30 December 2017
£m
30 December 2016
£m
SecuredFixed and swapped bank loans 17d 428.4 260.2Variable rate bank loans 17d – 101.3Total borrowings before costs 428.4 361.5Unamortised issue costs (6.2) (0.7)Total borrowings after costs 422.2 360.8
Analysis of total borrowings after costsCurrent – 334.6Non-current 422.2 26.2Total borrowings after costs 422.2 360.8
The Group considers all of its borrowings to fall within “Level 2”, as defined in Note 1.
During the period £39.0 million of new debt was drawn in respect of the acquisition of The Exchange, Ilford, and £362.5 million in respect of the refinancing of the Mall assets completed on 4 January 2017. The maturity of the Group’s £30 million revolving creditfacility was extended in the year to 22 January 2022.
capreg.com Stock Code: CAL capreg.com
FINANCIALS
99
Capital & Regional AR2017 Financials.indd 99 10/04/2018 16:06:04

NOTES TO THE FINANCIAL STATEMENTSCONTINUED
17 Bank loans continued 17b Maturity of borrowings
Notes
30 December 2017
£m
30 December 2016
£m
Greater than five years 401.5 –From two to five years 26.9 26.9Due after more than one year 428.4 26.9Current – 334.6 17a 428.4 361.5
The debt facility on the Mall assets was classified as a current liability at the end of 2016 as notice to repay had been served on 28 December 2016, ahead of the debt being refinanced on 4 January 2017.
17c Undrawn committed facilities30 December
2017£m
30 December 2016
£mExpiring greater than five years 10.0 –Expiring between two and five years 30.0 30.0
The Articles of the Company include some restrictions on borrowing but this did not limit the amount available for drawdown on theabove facility during the current year or the preceding year.
17d Interest rate and currency profile of borrowings
Notes
30 December 2017
£m
30 December 2016
£m
Fixed and swapped rate borrowingsBetween 2% and 3% 39.0 –Between 3% and 4% 389.4 260.2
17a 428.4 260.2Variable rate borrowings 17a – 101.3 428.4 361.5
18 Financial instruments and risk management18a OverviewCapital risk managementThe capital structure of the Group consists of debt, which includes the borrowings disclosed in Note 17a; cash and cash equivalentsas disclosed in Note 15; and equity attributable to equity holders of the parent, comprising issued share capital, reserves andretained earnings as disclosed in the Statement of changes in equity. For the purpose of calculating gearing ratios, debt is defined as long and short-term borrowings (excluding derivatives) excluding unamortised issue costs. Equity includes all capital and reserves of the Group attributable to equity holders of the Company.
The Group is not subject to externally imposed capital requirements. The Board reviews the capital structure and cost of capitalon an annual basis and has set out a target range for net debt to property value of 40% to 50% in the medium term. The risks associated with each class of capital are also considered as part of the risk reviews presented to the Audit Committee and the Board.
18 Financial instruments and risk management continuedGearing ratios
Statutory Notes
30 December 2017
£m
30 December 2016
£mDebt before unamortised issue costs 17a 428.4 361.5Cash and cash equivalents 15 (24.4) (45.8)Group net debt 404.0 315.7Equity 481.6 477.6Net debt to equity ratio 84% 66%
See-through Notes
30 December 2017
£m
30 December 2016
£mDebt before unamortised issue costs 18e 451.0 378.3Cash and cash equivalents (26.3) (46.6)See-through net debt 424.7 331.7Equity 481.6 477.6Net debt to equity ratio 88% 69%
Properties at valuationWholly-owned 10b 886.6 794.1Associates (Group share) 10b 28.6 30.8Total Group Property at valuation 915.2 824.9Net debt to property value ratio 46% 40%
Categories of financial assets/(liabilities)
2017 2016
Notes
Carrying value
£m
Gain/(loss) to income
£m
Gain to equity
£m
Carrying value
£m
Gain/(loss) to income
£m
Gain to equity
£m
Financial assetsCurrent receivables 13 15.3 – – 7.9 – –Cash and cash equivalents 15 30.2 – – 49.1 – –Non-current receivables 13 0.1 – – 0.1 – –Loans and receivables 45.6 – – 57.1 – –Interest rate swaps 13 0.1 0.1 – – – –Interest rate caps 13 – – – 0.1 (0.4) –Assets at fair value held for trading 0.1 0.1 – 0.1 (0.4) –Financial liabilitiesCurrent payables 16 (28.0) – – (32.0) – –Current borrowings 17a – – – (334.6)1 (4.8) –Non-current payables 16 (2.5) – – (2.3) – –Non-current borrowings 17a (422.2) (1.0) – (26.2) (0.1) –Liabilities at amortised cost (452.7) (1.0) – (395.1) (4.9) –Interest rate swaps 16 (1.5) 0.6 – (2.1) (2.1) –Liabilities at fair value held for trading (1.5) 0.6 – – (2.1) –Total financial (liabilities)/assets (408.5) (0.3) – (340.0) (7.4) –
1. As detailed in note 17a the debt facility on the Mall assets was classified as a current liability at the end of 2016 as notice to repay had been served on 28 December 2016 ahead of the debt being refinanced on 4 January 2017.
Capital & Regional plc Annual Report and Accounts for the year ended 30 December 2017
Stock Code: CAL capreg.com Stock Code: CAL
100
Capital & Regional AR2017 Financials.indd 100 10/04/2018 16:06:05

NOTES TO THE FINANCIAL STATEMENTSCONTINUED
17 Bank loans continued 17b Maturity of borrowings
Notes
30 December 2017
£m
30 December 2016
£m
Greater than five years 401.5 –From two to five years 26.9 26.9Due after more than one year 428.4 26.9Current – 334.6 17a 428.4 361.5
The debt facility on the Mall assets was classified as a current liability at the end of 2016 as notice to repay had been served on 28 December 2016, ahead of the debt being refinanced on 4 January 2017.
17c Undrawn committed facilities30 December
2017£m
30 December 2016
£mExpiring greater than five years 10.0 –Expiring between two and five years 30.0 30.0
The Articles of the Company include some restrictions on borrowing but this did not limit the amount available for drawdown on theabove facility during the current year or the preceding year.
17d Interest rate and currency profile of borrowings
Notes
30 December 2017
£m
30 December 2016
£m
Fixed and swapped rate borrowingsBetween 2% and 3% 39.0 –Between 3% and 4% 389.4 260.2
17a 428.4 260.2Variable rate borrowings 17a – 101.3 428.4 361.5
18 Financial instruments and risk management18a OverviewCapital risk managementThe capital structure of the Group consists of debt, which includes the borrowings disclosed in Note 17a; cash and cash equivalentsas disclosed in Note 15; and equity attributable to equity holders of the parent, comprising issued share capital, reserves andretained earnings as disclosed in the Statement of changes in equity. For the purpose of calculating gearing ratios, debt is defined as long and short-term borrowings (excluding derivatives) excluding unamortised issue costs. Equity includes all capital and reserves of the Group attributable to equity holders of the Company.
The Group is not subject to externally imposed capital requirements. The Board reviews the capital structure and cost of capitalon an annual basis and has set out a target range for net debt to property value of 40% to 50% in the medium term. The risks associated with each class of capital are also considered as part of the risk reviews presented to the Audit Committee and the Board.
18 Financial instruments and risk management continuedGearing ratios
Statutory Notes
30 December 2017
£m
30 December 2016
£mDebt before unamortised issue costs 17a 428.4 361.5Cash and cash equivalents 15 (24.4) (45.8)Group net debt 404.0 315.7Equity 481.6 477.6Net debt to equity ratio 84% 66%
See-through Notes
30 December 2017
£m
30 December 2016
£mDebt before unamortised issue costs 18e 451.0 378.3Cash and cash equivalents (26.3) (46.6)See-through net debt 424.7 331.7Equity 481.6 477.6Net debt to equity ratio 88% 69%
Properties at valuationWholly-owned 10b 886.6 794.1Associates (Group share) 10b 28.6 30.8Total Group Property at valuation 915.2 824.9Net debt to property value ratio 46% 40%
Categories of financial assets/(liabilities)
2017 2016
Notes
Carrying value
£m
Gain/(loss) to income
£m
Gain to equity
£m
Carrying value
£m
Gain/(loss) to income
£m
Gain to equity
£m
Financial assetsCurrent receivables 13 15.3 – – 7.9 – –Cash and cash equivalents 15 30.2 – – 49.1 – –Non-current receivables 13 0.1 – – 0.1 – –Loans and receivables 45.6 – – 57.1 – –Interest rate swaps 13 0.1 0.1 – – – –Interest rate caps 13 – – – 0.1 (0.4) –Assets at fair value held for trading 0.1 0.1 – 0.1 (0.4) –Financial liabilitiesCurrent payables 16 (28.0) – – (32.0) – –Current borrowings 17a – – – (334.6)1 (4.8) –Non-current payables 16 (2.5) – – (2.3) – –Non-current borrowings 17a (422.2) (1.0) – (26.2) (0.1) –Liabilities at amortised cost (452.7) (1.0) – (395.1) (4.9) –Interest rate swaps 16 (1.5) 0.6 – (2.1) (2.1) –Liabilities at fair value held for trading (1.5) 0.6 – – (2.1) –Total financial (liabilities)/assets (408.5) (0.3) – (340.0) (7.4) –
1. As detailed in note 17a the debt facility on the Mall assets was classified as a current liability at the end of 2016 as notice to repay had been served on 28 December 2016 ahead of the debt being refinanced on 4 January 2017.
capreg.com Stock Code: CAL capreg.com
FINANCIALS
101
Capital & Regional AR2017 Financials.indd 101 10/04/2018 16:06:05

NOTES TO THE FINANCIAL STATEMENTSCONTINUED
18 Financial instruments and risk management continuedSignificant accounting policiesDetails of the significant accounting policies adopted in respect of each class of financial asset, financial liability and equityinstrument, including the criteria for recognition, the basis of measurement and the basis on which income and expenses are recognised, are disclosed in the significant accounting policies in Note 1.
Financial risk management objectivesExposure to credit, interest rate and currency risks arise in the normal course of the Group’s business. The Group seeks to minimisethe effect of these risks by using derivative financial instruments to manage exposure to fluctuations in interest rates and foreigncurrency exchange rates. Such instruments are not employed for speculative purposes. The use of any derivatives is approved by the Board, which provides guidelines on the acceptable levels of interest rate risk, credit risk, foreign exchange risk and liquidity risk, and the ranges of hedging required against these risks.
18b Interest rate riskThe Group manages its interest rate risk through a combination of fixed rate loans and interest rate derivatives, typically interestrate swaps or caps. The Group’s objective in managing its interest rate risk is to ensure that it always maintains sufficient headroomto cover interest payments from anticipated cash flows and the directors regularly review the ratio of fixed to floating rate debt to assist this process. The Group does not hedge account its interest rate derivatives and states them at fair value with changes in fair value included in the income statement.
The following table shows a summary of the Group’s interest rate cap and swap contracts and their maturity dates:
Loan facility Maturity dateNotional principal
Contract fixed rate
30 December 2017 fair value £m
asset/(liability)Interest rate swap Hemel Hempstead 6 February 2023 £18,650,000 1.33% (0.3)Interest rate swap Hemel Hempstead 6 February 2023 £8,237,000 1.30% (0.1)Interest rate swap The Mall, Luton 30 December 2023 £107,500,000 1.14% (0.6)Interest rate swap Four Mall assets 22 January 2024 £100,000,000 1.13% (0.5)Interest rate swap The Exchange, Ilford 8 March 2024 £39,000,000 1.00% 0.1
Sensitivity analysisThe following table shows the Group’s sensitivity to a 100bps increase or decrease in interest rates. To calculate the impact on the income statement for the year the interest rates on all external floating rate interest bearing loans and borrowings and interestearning cash, including loans and cash within associates and joint ventures, have been increased or decreased by 100bps. The income statement impact includes the estimated effect of a 100bps decrease or increase in interest rates on the market values ofinterest rate derivatives.
100bps increase in interest rates
100bps decrease in interest rates
Year to 30 December
2017£m
Year to 30 December
2016£m
Year to 30 December
2017£m
Year to 30 December
2016£m
Floating rate loans and cash – (loss)/gain (0.1) (1.1) 0.1 1.1Interest rate derivatives – gain/(loss) 15.8 9.3 (15.8) (9.3)Impact on the income statement – (loss)/gain 15.7 8.2 (15.7) (8.2)Impact on equity – (loss)/gain 15.7 8.2 (15.7) (8.2)
18c Credit riskThe Group’s principal financial assets are bank and cash balances, short-term deposits, trade and other receivables and investments. Credit risk, being the risk that a counterparty will default on its contractual obligations resulting in financial loss to the Group, is primarily attributable to loans and trade and other receivables, which are principally amounts due from tenants. Credit risk arisingfrom tenants is mitigated as the Group receives most rents in advance, monitors credit ratings for significant tenants and makesan allowance for doubtful receivables that represents the estimate of potential losses in respect of trade receivables. The Group’sallowance for doubtful receivables disclosed in Note 13 to the financial statements is considered to represent the Group’s bestestimate of the exposure to credit risk associated to trade receivables.
The credit risk on short-term deposits and derivative financial instruments is limited because the counterparties are banks with high credit ratings assigned by international credit rating agencies. The Group is not exposed to significant credit risk on its other financial assets.
18 Financial instruments and risk management continued18d Liquidity riskLiquidity risk reflects the risk that the Group will have insufficient resources to meet its financial liabilities as they fall due. The day-to-day operations of the Group are largely funded through the items included in the breakdown of Adjusted Profit included in Note2a. The majority of income within Adjusted Profit is received quarterly, since the inflows and outflows from net rental income andnet interest payable generally coincide with English quarter days, and property management fees are billed quarterly. As a result,the Group normally has sufficient funds to cover recurring administrative expenses which occur throughout the year. Liquidity risktherefore arises principally from the need to make payments for non-recurring items, such as tax payments and the close out of derivative financial instruments.
The Group’s objective in managing liquidity risk is to ensure that it has sufficient funds to meet all its potential liabilities as they fall due, both in normal market conditions and when considering negative projections against expected outcomes, so as to avoid the risk of incurring contractual penalties or damaging the Group’s reputation. The Group’s treasury department maintains a rolling18 month forecast of anticipated recurring and non-recurring cash flows under different scenarios. This is compared to expectedcash balances and amounts available for drawdown on the Group’s core revolving credit facility to ensure that any potential shortfalls in funding are identified and managed. The Group’s primary means of managing liquidity risk are its long-term debt facilitiesanditscorerevolvingcreditfacility,expiringinJanuary2022,whichhad£30.0millionfullyavailableat30 December2017as disclosed in Note 17c.
The following table shows the maturity analysis of non-derivative financial assets/(liabilities) at the balance sheet date and, where applicable, their effective interest rates1.
2017 Note
Effectiveinterest rate
%
Less than1 year
£m1–2 years
£m2–5 years
£m
More than5 years
£mTotal
£mFinancial assetsCurrent receivables 13 15.3 – – – 15.3Cash and cash equivalents 15 0.2% 30.2 – – – 30.2Non-current receivables 13 – – – 0.1 0.1
45.5 – – 0.1 45.6Financial liabilitiesBorrowings – bank loans 17a 3.3% – – (27.4) (394.8) (422.2)Borrowings – other loans 16 3.4% – – (2.2) – (2.2)Current payables 16 (28.0) – – – (28.0)Non-current payables 16 – (0.3) – – (0.3) (28.0) (0.3) (29.6) (394.8) (452.7)
2016 Note
Effectiveinterest rate
%
Less than1 year
£m1–2 years
£m2–5 years
£m
More than5 years
£mTotal
£m
Financial assetsCurrent receivables 13 7.9 – – – 7.9Cash and cash equivalents 15 0.3% 49.1 – – – 49.1Non-current receivables 13 – – – 0.1 0.1
57.0 – – 0.1 57.1Financial liabilitiesBorrowings – bank loans 17a 3.5% (334.6)1 – (26.2) – (360.8)Borrowings – other loans 16 2.3% – – (1.8) – (1.8)Current payables 16 (32.0) – – – (32.0)Non-current payables 16 – (0.5) – – (0.5) (366.6) (0.5) (28.0) – (395.1)
1. As detailed in note 17a the debt facility on the five Mall assets was classified as a current liability as notice to repay had been served on 28 December 2016 ahead of the debt being refinanced on 4 January 2017.
Capital & Regional plc Annual Report and Accounts for the year ended 30 December 2017
Stock Code: CAL capreg.com Stock Code: CAL
102
Capital & Regional AR2017 Financials.indd 102 10/04/2018 16:06:05

NOTES TO THE FINANCIAL STATEMENTSCONTINUED
18 Financial instruments and risk management continuedSignificant accounting policiesDetails of the significant accounting policies adopted in respect of each class of financial asset, financial liability and equityinstrument, including the criteria for recognition, the basis of measurement and the basis on which income and expenses are recognised, are disclosed in the significant accounting policies in Note 1.
Financial risk management objectivesExposure to credit, interest rate and currency risks arise in the normal course of the Group’s business. The Group seeks to minimisethe effect of these risks by using derivative financial instruments to manage exposure to fluctuations in interest rates and foreigncurrency exchange rates. Such instruments are not employed for speculative purposes. The use of any derivatives is approved by the Board, which provides guidelines on the acceptable levels of interest rate risk, credit risk, foreign exchange risk and liquidity risk, and the ranges of hedging required against these risks.
18b Interest rate riskThe Group manages its interest rate risk through a combination of fixed rate loans and interest rate derivatives, typically interestrate swaps or caps. The Group’s objective in managing its interest rate risk is to ensure that it always maintains sufficient headroomto cover interest payments from anticipated cash flows and the directors regularly review the ratio of fixed to floating rate debt to assist this process. The Group does not hedge account its interest rate derivatives and states them at fair value with changes in fair value included in the income statement.
The following table shows a summary of the Group’s interest rate cap and swap contracts and their maturity dates:
Loan facility Maturity dateNotional principal
Contract fixed rate
30 December 2017 fair value £m
asset/(liability)Interest rate swap Hemel Hempstead 6 February 2023 £18,650,000 1.33% (0.3)Interest rate swap Hemel Hempstead 6 February 2023 £8,237,000 1.30% (0.1)Interest rate swap The Mall, Luton 30 December 2023 £107,500,000 1.14% (0.6)Interest rate swap Four Mall assets 22 January 2024 £100,000,000 1.13% (0.5)Interest rate swap The Exchange, Ilford 8 March 2024 £39,000,000 1.00% 0.1
Sensitivity analysisThe following table shows the Group’s sensitivity to a 100bps increase or decrease in interest rates. To calculate the impact on the income statement for the year the interest rates on all external floating rate interest bearing loans and borrowings and interestearning cash, including loans and cash within associates and joint ventures, have been increased or decreased by 100bps. The income statement impact includes the estimated effect of a 100bps decrease or increase in interest rates on the market values ofinterest rate derivatives.
100bps increase in interest rates
100bps decrease in interest rates
Year to 30 December
2017£m
Year to 30 December
2016£m
Year to 30 December
2017£m
Year to 30 December
2016£m
Floating rate loans and cash – (loss)/gain (0.1) (1.1) 0.1 1.1Interest rate derivatives – gain/(loss) 15.8 9.3 (15.8) (9.3)Impact on the income statement – (loss)/gain 15.7 8.2 (15.7) (8.2)Impact on equity – (loss)/gain 15.7 8.2 (15.7) (8.2)
18c Credit riskThe Group’s principal financial assets are bank and cash balances, short-term deposits, trade and other receivables and investments. Credit risk, being the risk that a counterparty will default on its contractual obligations resulting in financial loss to the Group, is primarily attributable to loans and trade and other receivables, which are principally amounts due from tenants. Credit risk arisingfrom tenants is mitigated as the Group receives most rents in advance, monitors credit ratings for significant tenants and makesan allowance for doubtful receivables that represents the estimate of potential losses in respect of trade receivables. The Group’sallowance for doubtful receivables disclosed in Note 13 to the financial statements is considered to represent the Group’s bestestimate of the exposure to credit risk associated to trade receivables.
The credit risk on short-term deposits and derivative financial instruments is limited because the counterparties are banks with high credit ratings assigned by international credit rating agencies. The Group is not exposed to significant credit risk on its other financial assets.
18 Financial instruments and risk management continued18d Liquidity riskLiquidity risk reflects the risk that the Group will have insufficient resources to meet its financial liabilities as they fall due. The day-to-day operations of the Group are largely funded through the items included in the breakdown of Adjusted Profit included in Note2a. The majority of income within Adjusted Profit is received quarterly, since the inflows and outflows from net rental income andnet interest payable generally coincide with English quarter days, and property management fees are billed quarterly. As a result,the Group normally has sufficient funds to cover recurring administrative expenses which occur throughout the year. Liquidity risktherefore arises principally from the need to make payments for non-recurring items, such as tax payments and the close out of derivative financial instruments.
The Group’s objective in managing liquidity risk is to ensure that it has sufficient funds to meet all its potential liabilities as they fall due, both in normal market conditions and when considering negative projections against expected outcomes, so as to avoid the risk of incurring contractual penalties or damaging the Group’s reputation. The Group’s treasury department maintains a rolling18 month forecast of anticipated recurring and non-recurring cash flows under different scenarios. This is compared to expectedcash balances and amounts available for drawdown on the Group’s core revolving credit facility to ensure that any potential shortfalls in funding are identified and managed. The Group’s primary means of managing liquidity risk are its long-term debt facilitiesanditscorerevolvingcreditfacility,expiringinJanuary2022,whichhad£30.0millionfullyavailableat30 December2017as disclosed in Note 17c.
The following table shows the maturity analysis of non-derivative financial assets/(liabilities) at the balance sheet date and, where applicable, their effective interest rates1.
2017 Note
Effectiveinterest rate
%
Less than1 year
£m1–2 years
£m2–5 years
£m
More than5 years
£mTotal
£mFinancial assetsCurrent receivables 13 15.3 – – – 15.3Cash and cash equivalents 15 0.2% 30.2 – – – 30.2Non-current receivables 13 – – – 0.1 0.1
45.5 – – 0.1 45.6Financial liabilitiesBorrowings – bank loans 17a 3.3% – – (27.4) (394.8) (422.2)Borrowings – other loans 16 3.4% – – (2.2) – (2.2)Current payables 16 (28.0) – – – (28.0)Non-current payables 16 – (0.3) – – (0.3) (28.0) (0.3) (29.6) (394.8) (452.7)
2016 Note
Effectiveinterest rate
%
Less than1 year
£m1–2 years
£m2–5 years
£m
More than5 years
£mTotal
£m
Financial assetsCurrent receivables 13 7.9 – – – 7.9Cash and cash equivalents 15 0.3% 49.1 – – – 49.1Non-current receivables 13 – – – 0.1 0.1
57.0 – – 0.1 57.1Financial liabilitiesBorrowings – bank loans 17a 3.5% (334.6)1 – (26.2) – (360.8)Borrowings – other loans 16 2.3% – – (1.8) – (1.8)Current payables 16 (32.0) – – – (32.0)Non-current payables 16 – (0.5) – – (0.5) (366.6) (0.5) (28.0) – (395.1)
1. As detailed in note 17a the debt facility on the five Mall assets was classified as a current liability as notice to repay had been served on 28 December 2016 ahead of the debt being refinanced on 4 January 2017.
capreg.com Stock Code: CAL capreg.com
FINANCIALS
103
Capital & Regional AR2017 Financials.indd 103 10/04/2018 16:06:05

NOTES TO THE FINANCIAL STATEMENTSCONTINUED
18 Financial instruments and risk management continuedThe following tables detail the Group’s remaining contractual maturity for its non-derivative financial liabilities. The tables have been drawn up based on the undiscounted cash inflows/(outflows) of financial liabilities based on the earliest date on which the Groupcan be required to pay, including both interest and principal cash flows.
2017
Less than 1 year
£m1–2 years
£m2–3 years
£m3–4 years
£m4–5 years
£m
More than 5 years
£mTotal
£mBorrowings – fixed bank loans (14.0) (14.0) (14.0) (14.0) (40.1) (429.4) (525.5)Borrowings – other fixed loans – – (2.3) – – – (2.3)Non-interest bearing (28.0) (0.3) – – – – (28.3) (42.0) (14.3) (16.3) (14.0) (40.1) (429.4) (556.1)
2016
Less than 1 year
£m1–2 years
£m2–3 years
£m3–4 years
£m4–5 years
£m
More than 5 years
£mTotal
£m
Borrowings – fixed bank loans (234.3) (0.9) (0.9) (0.9) (26.9) – (263.9)Borrowings – other fixed loans – – – (1.8) – – (1.8)Borrowings – floating bank loans (101.3) – – – – – (101.3)Non-interest bearing (32.0) (0.5) – – – – (32.5) (367.6) (1.4) (0.9) (2.7) (26.9) – (399.5)
The following tables detail the Group’s remaining contractual maturity for its derivative financial assets/(liabilities), all of which are net settled, based on the undiscounted net cash inflows/(outflows). When the amount payable or receivable is not fixed, it has beendetermined by reference to the projected interest rates as illustrated by the yield curves existing at the reporting date.
2017
Less than 1 year
£m1–2 years
£m2–3 years
£m3–4 years
£m4–5 years
£m
More than 5 years
£mTotal
£mNet settledInterest rate caps – – – – – (1.4) (1.4) – – – – – (1.4) (1.4)
2016
Less than 1 year
£m1–2 years
£m2–3 years
£m3–4 years
£m4–5 years
£m
More than 5 years
£mTotal
£m
Net settledInterest rate caps 0.1 – – – – – 0.1Interest rate swaps – – – – – (2.1) (2.1) 0.1 – – – – (2.1) (2.0)
18 Financial instruments and risk management continued18e Fair values of financial instrumentsThe fair values of financial instruments together with their carrying amounts in the balance sheet are as follows:
Notes
Notional principal
£m
2017 Book value
£m
2017 Fair value
£m
2016 Book value
£m
2016 Fair value
£m
Financial liabilities not at fair value through income statementSterling denominated loans 18a (428.4) (430.0) (361.5) (363.9)Total on balance sheet borrowings (428.4) (430.0) (361.5) (363.9)Group share of associate borrowings (22.6) (22.6) (16.8) (16.8)Total see-through borrowings 18a (451.0) (452.6) (378.3) (380.7)Derivative assets/(liabilities) at fair value through income statementInterest rate caps 13 – – 0.1 0.1Interest rate swaps 438.4 (1.4) (1.4) (2.1) (2.1)Total on balance sheet derivatives (1.4) (1.4) (2.0) (2.0)Group share of Sterling interest rate caps in associates and joint ventures 17.1 0.1 0.1 – –Group share of Sterling interest rate swaps in associates and joint ventures – – (0.5) (0.5)Total see-through derivatives (1.3) (1.3) (2.5) (2.5)
The fair value of borrowings has been estimated on the basis of quoted market prices. Details of the Group’s cash and deposits are disclosed in Note 15 and their fair values are equal to their book values. All of the above financial instruments are measured,subsequent to initial recognition, at fair value. All instruments were considered to be Level 2, as defined in Note 1. There were no transfers between Levels in the year.
19 Share capitalNumber of shares issued
and fully paidNominal value of shares
issued and fully paid2017
Number2016
Number2017
£m2016
£m
Ordinary shares of 1p eachAt the start of the year 702,342,500 700,752,626 7.0 7.0Shares issued 15,933,260 1,589,874 0.2 –Total called-up share capital 718,275,760 702,342,500 7.2 7.0
The Company has one class of Ordinary shares which carry voting rights but no right to fixed income. The Company maintains a Secondary Listing on the Johannesburg Stock Exchange (JSE) in South Africa. At 30 December 2017 60,477,452 (2016: 58,253,524) ofthe Company’s shares were held on the JSE register.
The table below outlines the movements of shares in the year:
Price per share
(Pence) No. of sharesTotal
No. of sharesBrought forward at 31 December 2016 702,342,500May 2017 – Final 2016 Scrip Dividend 56.48 6,135,235 708,477,735August 2017 – to satisfy Long Term Incentive awards 0.01 6,300,000 714,777,735October 2017 – Interim 2017 Scrip Dividend 55.07 3,498,025 718,275,760Carried forward at 30 December 2017 718,275,760
Capital & Regional plc Annual Report and Accounts for the year ended 30 December 2017
Stock Code: CAL capreg.com Stock Code: CAL
104
Capital & Regional AR2017 Financials.indd 104 10/04/2018 16:06:06

NOTES TO THE FINANCIAL STATEMENTSCONTINUED
18 Financial instruments and risk management continuedThe following tables detail the Group’s remaining contractual maturity for its non-derivative financial liabilities. The tables have been drawn up based on the undiscounted cash inflows/(outflows) of financial liabilities based on the earliest date on which the Groupcan be required to pay, including both interest and principal cash flows.
2017
Less than 1 year
£m1–2 years
£m2–3 years
£m3–4 years
£m4–5 years
£m
More than 5 years
£mTotal
£mBorrowings – fixed bank loans (14.0) (14.0) (14.0) (14.0) (40.1) (429.4) (525.5)Borrowings – other fixed loans – – (2.3) – – – (2.3)Non-interest bearing (28.0) (0.3) – – – – (28.3) (42.0) (14.3) (16.3) (14.0) (40.1) (429.4) (556.1)
2016
Less than 1 year
£m1–2 years
£m2–3 years
£m3–4 years
£m4–5 years
£m
More than 5 years
£mTotal
£m
Borrowings – fixed bank loans (234.3) (0.9) (0.9) (0.9) (26.9) – (263.9)Borrowings – other fixed loans – – – (1.8) – – (1.8)Borrowings – floating bank loans (101.3) – – – – – (101.3)Non-interest bearing (32.0) (0.5) – – – – (32.5) (367.6) (1.4) (0.9) (2.7) (26.9) – (399.5)
The following tables detail the Group’s remaining contractual maturity for its derivative financial assets/(liabilities), all of which are net settled, based on the undiscounted net cash inflows/(outflows). When the amount payable or receivable is not fixed, it has beendetermined by reference to the projected interest rates as illustrated by the yield curves existing at the reporting date.
2017
Less than 1 year
£m1–2 years
£m2–3 years
£m3–4 years
£m4–5 years
£m
More than 5 years
£mTotal
£mNet settledInterest rate caps – – – – – (1.4) (1.4) – – – – – (1.4) (1.4)
2016
Less than 1 year
£m1–2 years
£m2–3 years
£m3–4 years
£m4–5 years
£m
More than 5 years
£mTotal
£m
Net settledInterest rate caps 0.1 – – – – – 0.1Interest rate swaps – – – – – (2.1) (2.1) 0.1 – – – – (2.1) (2.0)
18 Financial instruments and risk management continued18e Fair values of financial instrumentsThe fair values of financial instruments together with their carrying amounts in the balance sheet are as follows:
Notes
Notional principal
£m
2017 Book value
£m
2017 Fair value
£m
2016 Book value
£m
2016 Fair value
£m
Financial liabilities not at fair value through income statementSterling denominated loans 18a (428.4) (430.0) (361.5) (363.9)Total on balance sheet borrowings (428.4) (430.0) (361.5) (363.9)Group share of associate borrowings (22.6) (22.6) (16.8) (16.8)Total see-through borrowings 18a (451.0) (452.6) (378.3) (380.7)Derivative assets/(liabilities) at fair value through income statementInterest rate caps 13 – – 0.1 0.1Interest rate swaps 438.4 (1.4) (1.4) (2.1) (2.1)Total on balance sheet derivatives (1.4) (1.4) (2.0) (2.0)Group share of Sterling interest rate caps in associates and joint ventures 17.1 0.1 0.1 – –Group share of Sterling interest rate swaps in associates and joint ventures – – (0.5) (0.5)Total see-through derivatives (1.3) (1.3) (2.5) (2.5)
The fair value of borrowings has been estimated on the basis of quoted market prices. Details of the Group’s cash and deposits are disclosed in Note 15 and their fair values are equal to their book values. All of the above financial instruments are measured,subsequent to initial recognition, at fair value. All instruments were considered to be Level 2, as defined in Note 1. There were no transfers between Levels in the year.
19 Share capitalNumber of shares issued
and fully paidNominal value of shares
issued and fully paid2017
Number2016
Number2017
£m2016
£m
Ordinary shares of 1p eachAt the start of the year 702,342,500 700,752,626 7.0 7.0Shares issued 15,933,260 1,589,874 0.2 –Total called-up share capital 718,275,760 702,342,500 7.2 7.0
The Company has one class of Ordinary shares which carry voting rights but no right to fixed income. The Company maintains a Secondary Listing on the Johannesburg Stock Exchange (JSE) in South Africa. At 30 December 2017 60,477,452 (2016: 58,253,524) ofthe Company’s shares were held on the JSE register.
The table below outlines the movements of shares in the year:
Price per share
(Pence) No. of sharesTotal
No. of sharesBrought forward at 31 December 2016 702,342,500May 2017 – Final 2016 Scrip Dividend 56.48 6,135,235 708,477,735August 2017 – to satisfy Long Term Incentive awards 0.01 6,300,000 714,777,735October 2017 – Interim 2017 Scrip Dividend 55.07 3,498,025 718,275,760Carried forward at 30 December 2017 718,275,760
capreg.com Stock Code: CAL capreg.com
FINANCIALS
105
Capital & Regional AR2017 Financials.indd 105 10/04/2018 16:06:06

NOTES TO THE FINANCIAL STATEMENTSCONTINUED
20 Share-based paymentsThe Group’s share-based payments comprise the 2008 LTIP and the Executive Directors deferred bonus. Further details are disclosed in the Directors’ Remuneration Report.
In accordance with IFRS 2, the fair value of equity-settled share-based payments to employees is determined at the date of grant.For options with market based conditions these are calculated using either a Black–Scholes option pricing model or a Monte Carlosimulation. For the elements of options that include non-market based conditions an initial estimate is made of the likely qualifyingpercentage, this is subsequently updated at each reporting date.
Income statement charge
Year to 30 December
2017£m
Year to 30 December
2016£m
Equity-settled share-based payments – 2008 LTIP 0.9 0.5
The figures above exclude a National Insurance charge in the year of £0.2 million (2016: £0.2 million).
Movements during the yearNumber of
OptionsOutstanding at 30 December 2015 18,825,226Granted during the year 6,159,764Exercised during the year (376,165)Forfeited during the year (2,870,109)Outstandingat30 December2016 21,738,716Granted during the year 6,367,945Exercised during the year1 (6,759,688)Forfeited during the year (6,643,491)Outstandingat30 December2017 14,703,482Exercisable at the end of the year –
1. The weighted average share price of options exercised during the year was 54.8p.
Assumptions
2008 LTIPAugust
2014 March
2015 August
2016 April 2017
Share price at grant date 46.8p 57.8p 59.5p 59.5pExercise price 0.0p 0.0p 0.0p 0.0pExpected volatility 36% 34% 27% 19%Expected life including holding period (years) 4.50 4.50 5.00 5.00Average life remaining including holding period (years) 1.12 1.68 3.65 4.33Risk free rate 0.96% 0.96% 0.56% 0.53%Expected dividend yield 4.53% 5.00% 5.00% 5.70%Lapse rate 0% 0% 0% 0%Fair value of award at grant date per share 13p 23p 26p 25p
Expected volatility is based on the historical volatility of the Group’s share price over the three years to the date of grant. The 10 year UK Gilt rate at time of grant is used for estimating the risk free rate. Options are assumed to be exercised at the earliest possible date.
21 Own shares held Own shares
held£m
At the start of the year 0.4Disposed of (0.3)At the end of the year 0.1
TheownsharesreserverepresentsthecostofsharesintheCompanypurchasedinthemarket.At30 December2017,theCapital& Regional plc 2002 Employee Share Trust (the “ESOT”) held 182,699 (2016: 642,387) shares to assist the Group in meeting the outstanding share awards under the schemes described above. The right to receive dividends on these shares has been waived. Themarketvalueofthesesharesat30 December2017was£0.1million(2016:£0.4 million).
22 Reconciliation of net cash from operations
Notes
Year to 30 December
2017£m
Year to 30 December
2016£m
Profit/(loss) for the year 22.4 (4.4)Adjusted for: Income tax credit 8a – (0.1)Finance income (1.2) (0.4)Finance expense 18.8 33.0Loss on revaluation of wholly-owned properties 3.8 14.2Share of loss/(profit) in associates and joint ventures 14a 2.0 (0.3)Depreciation of other fixed assets 11 0.2 0.1Other gains and losses (0.3) 1.8Increase in receivables (7.3) (0.1)Increase/(decrease) in payables 3.7 (3.2)Non-cash movement relating to share-based payments 0.9 0.5Net cash from operations 43.0 41.1
23 Net assets per shareEPRA has issued recommended bases for the calculation of certain net assets per share information as shown in the following table:
Note
30 December 2017 30 December 2016
Net assetsper share (£)
Net assets£m
Number ofshares (m)
Net assetsper share (£)
Basic net assets 481.4 718.3 0.67 0.68Own shares held 21 (0.2)Dilutive contingently issuable shares and share options 6.8Fair value of fixed rate loans (net of tax) (1.6)EPRA triple net assets 479.8 724.9 0.66 0.67Exclude fair value of fixed rate loans (net of tax) 1.6Exclude fair value of see-through interest rate derivatives 18e 1.3Exclude deferred tax on unrealised gains and capital allowances (0.1)EPRA net assets 482.6 724.9 0.67 0.68
Capital & Regional plc Annual Report and Accounts for the year ended 30 December 2017
Stock Code: CAL capreg.com Stock Code: CAL
106
Capital & Regional AR2017 Financials.indd 106 10/04/2018 16:06:06

NOTES TO THE FINANCIAL STATEMENTSCONTINUED
20 Share-based paymentsThe Group’s share-based payments comprise the 2008 LTIP and the Executive Directors deferred bonus. Further details are disclosed in the Directors’ Remuneration Report.
In accordance with IFRS 2, the fair value of equity-settled share-based payments to employees is determined at the date of grant.For options with market based conditions these are calculated using either a Black–Scholes option pricing model or a Monte Carlosimulation. For the elements of options that include non-market based conditions an initial estimate is made of the likely qualifyingpercentage, this is subsequently updated at each reporting date.
Income statement charge
Year to 30 December
2017£m
Year to 30 December
2016£m
Equity-settled share-based payments – 2008 LTIP 0.9 0.5
The figures above exclude a National Insurance charge in the year of £0.2 million (2016: £0.2 million).
Movements during the yearNumber of
OptionsOutstanding at 30 December 2015 18,825,226Granted during the year 6,159,764Exercised during the year (376,165)Forfeited during the year (2,870,109)Outstandingat30 December2016 21,738,716Granted during the year 6,367,945Exercised during the year1 (6,759,688)Forfeited during the year (6,643,491)Outstandingat30 December2017 14,703,482Exercisable at the end of the year –
1. The weighted average share price of options exercised during the year was 54.8p.
Assumptions
2008 LTIPAugust
2014 March
2015 August
2016 April 2017
Share price at grant date 46.8p 57.8p 59.5p 59.5pExercise price 0.0p 0.0p 0.0p 0.0pExpected volatility 36% 34% 27% 19%Expected life including holding period (years) 4.50 4.50 5.00 5.00Average life remaining including holding period (years) 1.12 1.68 3.65 4.33Risk free rate 0.96% 0.96% 0.56% 0.53%Expected dividend yield 4.53% 5.00% 5.00% 5.70%Lapse rate 0% 0% 0% 0%Fair value of award at grant date per share 13p 23p 26p 25p
Expected volatility is based on the historical volatility of the Group’s share price over the three years to the date of grant. The 10 year UK Gilt rate at time of grant is used for estimating the risk free rate. Options are assumed to be exercised at the earliest possible date.
21 Own shares held Own shares
held£m
At the start of the year 0.4Disposed of (0.3)At the end of the year 0.1
TheownsharesreserverepresentsthecostofsharesintheCompanypurchasedinthemarket.At30 December2017,theCapital& Regional plc 2002 Employee Share Trust (the “ESOT”) held 182,699 (2016: 642,387) shares to assist the Group in meeting the outstanding share awards under the schemes described above. The right to receive dividends on these shares has been waived. Themarketvalueofthesesharesat30 December2017was£0.1million(2016:£0.4 million).
22 Reconciliation of net cash from operations
Notes
Year to 30 December
2017£m
Year to 30 December
2016£m
Profit/(loss) for the year 22.4 (4.4)Adjusted for: Income tax credit 8a – (0.1)Finance income (1.2) (0.4)Finance expense 18.8 33.0Loss on revaluation of wholly-owned properties 3.8 14.2Share of loss/(profit) in associates and joint ventures 14a 2.0 (0.3)Depreciation of other fixed assets 11 0.2 0.1Other gains and losses (0.3) 1.8Increase in receivables (7.3) (0.1)Increase/(decrease) in payables 3.7 (3.2)Non-cash movement relating to share-based payments 0.9 0.5Net cash from operations 43.0 41.1
23 Net assets per shareEPRA has issued recommended bases for the calculation of certain net assets per share information as shown in the following table:
Note
30 December 2017 30 December 2016
Net assetsper share (£)
Net assets£m
Number ofshares (m)
Net assetsper share (£)
Basic net assets 481.4 718.3 0.67 0.68Own shares held 21 (0.2)Dilutive contingently issuable shares and share options 6.8Fair value of fixed rate loans (net of tax) (1.6)EPRA triple net assets 479.8 724.9 0.66 0.67Exclude fair value of fixed rate loans (net of tax) 1.6Exclude fair value of see-through interest rate derivatives 18e 1.3Exclude deferred tax on unrealised gains and capital allowances (0.1)EPRA net assets 482.6 724.9 0.67 0.68
capreg.com Stock Code: CAL capreg.com
FINANCIALS
107
Capital & Regional AR2017 Financials.indd 107 10/04/2018 16:06:06

NOTES TO THE FINANCIAL STATEMENTSCONTINUED
24 Return on equity30 December
2017£m
30 December 2016
£mTotal comprehensive income attributable to equity shareholders 22.4 (4.4)Opening equity shareholders’ funds plus time weighted additions 480.1 503.4Return on equity 4.7% (0.9)%
25 Lease arrangementsThe Group as lessee – operating leasesAt the balance sheet date, the Group’s future minimum lease payments under non-cancellable operating leases related to land andbuildings were as follows:
2017£m
2016£m
Lease paymentsWithin one year (2.1) (1.9)Between one and five years (9.1) (7.9)After five years (9.7) (11.8)
(20.9) (21.6)
OperatingleasepaymentsaredenominatedinSterlingandhaveanaverageremainingleaselengthof9years(2016:10 years)andrentals are fixed for an average of 2 years (2016: 2 years). During the year there were no contingent rents (2016: £nil) and the Group incurred lease payments recognised as an expense of £1.9 million (2016: £1.9 million).
The Group as lessee – finance leasesAt the balance sheet date, the Group’s future minimum lease payments under finance leases were as follows:
2017£m
2016£m
Lease paymentsWithin one year 3.4 3.4Between one and five years 13.5 13.6After five years 361.7 365.1
378.6 382.1Future finance charges on finance leases (317.3) (320.7)Present value of finance lease liabilities 61.3 61.4
Finance lease liabilities are in respect of head leases on investment property. These leases provide for payment of contingent rent,usually a proportion of net rental income, in addition to the rents above.
The Group as lessor The Group leases out all of its investment properties under operating leases for average lease terms of 7 years (2016: 7 years) to expiry. The leasing arrangements are summarised in the portfolio information on page 120. The future aggregate minimum rentals receivable under non-cancellable operating leases are as follows:
100% figures
Unexpiredaverage
leaseterm
Years
Less than 1
year£m
2 – 5years
£m
6 – 10 years
£m
11 – 15 years
£m
16 – 20years
£m
More than 20
years£m
30 December2017Total
£m
30 December2016Total
£m
Wholly-owned 7.8 44.7 123.9 63.4 29.4 17.4 82.8 361.6 327.6Redditch 5.9 8.1 19.1 8.5 2.0 0.2 – 37.9 41.7Ipswich – – – – – – – – 31.0Total 52.8 143.0 71.9 31.4 17.6 82.8 399.5 400.3
26 Capital commitmentsAt30 December2017,theGroup’sshareofthecapitalcommitmentsofitsassociates,jointventuresandwholly-ownedpropertieswas £4.7 million (2016: £7.7 million) relating to capital expenditure projects.
27 Contingent liabilitiesGerman joint ventureUnder the terms of the German joint venture disposal, completed on 10 February 2015, the Group gave certain customary warranties as to their title to the relevant shares and certain warranties in relation to the German joint venture generally. In addition, Capital & Regional plc have provided an indemnity to the purchaser for potential German Real Estate Transfer Tax (RETT) liabilities if they arise out of actions undertaken by the Group post completion. All such actions covered by the indemnity are within the Group’scontrol. The maximum RETT liability based on the property valuation at the time of sale was approximately €20 million.
X-Leisure Under the terms of the X-Leisure disposal agreements, the Group gave certain customary warranties as to capacity, title to the disposed assets, solvency, accounting and financial matters, litigation, compliance with laws and regulatory consents and taxation.
The aggregate liability of the sellers in respect of breaches of certain warranties including those relating to title and capacityand authority shall not exceed an amount equal to the consideration received by that seller. Other than in the case of fraud, theaggregate liability of the Sellers and the Manager in respect of claims under the disposal agreements shall not exceed £30 million.Any claims in respect of the warranties must be brought within 21 months of completion, being 16 January 2013, or five years inrespect of the tax warranties. These warranties have expired post 30 December 2017 with no claim having been made.
The Junction FundUnder the terms of the Group’s disposal of its interest in The Junction Fund, Capital & Regional Units LLP and Capital & Regional(Junction GP) Limited gave certain customary warranties as to their title to the relevant units and shares and certain warranties in relation to the Junction Fund generally and the GP sellers gave warranties in relation to the Junction GP. Any claims in respect of the warranties must be brought within 12 months of the date of the agreement, being 19 October 2012, other than in respect of certainclaims relating to taxation, where the claims must be brought within either 24 months or six years from the date of agreement. The relevant warranties were given on a several basis and the maximum liability of Capital & Regional Units LLP in respect of the outstanding warranties is £3.5 million and the maximum liability of Capital & Regional (Junction GP) Limited in respect of theoutstanding warranties is £3.5 million. The obligations of Capital & Regional Units LLP under the agreement were guaranteed by Capital & Regional Holdings Limited.
Capital & Regional plc Annual Report and Accounts for the year ended 30 December 2017
Stock Code: CAL capreg.com Stock Code: CAL
108
Capital & Regional AR2017 Financials.indd 108 10/04/2018 16:06:07

NOTES TO THE FINANCIAL STATEMENTSCONTINUED
24 Return on equity30 December
2017£m
30 December 2016
£mTotal comprehensive income attributable to equity shareholders 22.4 (4.4)Opening equity shareholders’ funds plus time weighted additions 480.1 503.4Return on equity 4.7% (0.9)%
25 Lease arrangementsThe Group as lessee – operating leasesAt the balance sheet date, the Group’s future minimum lease payments under non-cancellable operating leases related to land andbuildings were as follows:
2017£m
2016£m
Lease paymentsWithin one year (2.1) (1.9)Between one and five years (9.1) (7.9)After five years (9.7) (11.8)
(20.9) (21.6)
OperatingleasepaymentsaredenominatedinSterlingandhaveanaverageremainingleaselengthof9years(2016:10 years)andrentals are fixed for an average of 2 years (2016: 2 years). During the year there were no contingent rents (2016: £nil) and the Group incurred lease payments recognised as an expense of £1.9 million (2016: £1.9 million).
The Group as lessee – finance leasesAt the balance sheet date, the Group’s future minimum lease payments under finance leases were as follows:
2017£m
2016£m
Lease paymentsWithin one year 3.4 3.4Between one and five years 13.5 13.6After five years 361.7 365.1
378.6 382.1Future finance charges on finance leases (317.3) (320.7)Present value of finance lease liabilities 61.3 61.4
Finance lease liabilities are in respect of head leases on investment property. These leases provide for payment of contingent rent,usually a proportion of net rental income, in addition to the rents above.
The Group as lessor The Group leases out all of its investment properties under operating leases for average lease terms of 7 years (2016: 7 years) to expiry. The leasing arrangements are summarised in the portfolio information on page 120. The future aggregate minimum rentals receivable under non-cancellable operating leases are as follows:
100% figures
Unexpiredaverage
leaseterm
Years
Less than 1
year£m
2 – 5years
£m
6 – 10 years
£m
11 – 15 years
£m
16 – 20years
£m
More than 20
years£m
30 December2017Total
£m
30 December2016Total
£m
Wholly-owned 7.8 44.7 123.9 63.4 29.4 17.4 82.8 361.6 327.6Redditch 5.9 8.1 19.1 8.5 2.0 0.2 – 37.9 41.7Ipswich – – – – – – – – 31.0Total 52.8 143.0 71.9 31.4 17.6 82.8 399.5 400.3
26 Capital commitmentsAt30 December2017,theGroup’sshareofthecapitalcommitmentsofitsassociates,jointventuresandwholly-ownedpropertieswas £4.7 million (2016: £7.7 million) relating to capital expenditure projects.
27 Contingent liabilitiesGerman joint ventureUnder the terms of the German joint venture disposal, completed on 10 February 2015, the Group gave certain customary warranties as to their title to the relevant shares and certain warranties in relation to the German joint venture generally. In addition, Capital & Regional plc have provided an indemnity to the purchaser for potential German Real Estate Transfer Tax (RETT) liabilities if they arise out of actions undertaken by the Group post completion. All such actions covered by the indemnity are within the Group’scontrol. The maximum RETT liability based on the property valuation at the time of sale was approximately €20 million.
X-Leisure Under the terms of the X-Leisure disposal agreements, the Group gave certain customary warranties as to capacity, title to the disposed assets, solvency, accounting and financial matters, litigation, compliance with laws and regulatory consents and taxation.
The aggregate liability of the sellers in respect of breaches of certain warranties including those relating to title and capacityand authority shall not exceed an amount equal to the consideration received by that seller. Other than in the case of fraud, theaggregate liability of the Sellers and the Manager in respect of claims under the disposal agreements shall not exceed £30 million.Any claims in respect of the warranties must be brought within 21 months of completion, being 16 January 2013, or five years inrespect of the tax warranties. These warranties have expired post 30 December 2017 with no claim having been made.
The Junction FundUnder the terms of the Group’s disposal of its interest in The Junction Fund, Capital & Regional Units LLP and Capital & Regional(Junction GP) Limited gave certain customary warranties as to their title to the relevant units and shares and certain warranties in relation to the Junction Fund generally and the GP sellers gave warranties in relation to the Junction GP. Any claims in respect of the warranties must be brought within 12 months of the date of the agreement, being 19 October 2012, other than in respect of certainclaims relating to taxation, where the claims must be brought within either 24 months or six years from the date of agreement. The relevant warranties were given on a several basis and the maximum liability of Capital & Regional Units LLP in respect of the outstanding warranties is £3.5 million and the maximum liability of Capital & Regional (Junction GP) Limited in respect of theoutstanding warranties is £3.5 million. The obligations of Capital & Regional Units LLP under the agreement were guaranteed by Capital & Regional Holdings Limited.
capreg.com Stock Code: CAL capreg.com
FINANCIALS
109
Capital & Regional AR2017 Financials.indd 109 10/04/2018 16:06:07

NOTES TO THE FINANCIAL STATEMENTSCONTINUED
28 Related party transactionsTransactions between the Company and its subsidiaries, which are related parties, have been eliminated on consolidation and arenot disclosed in this note. Transactions between the Group and its associates and joint ventures, all of which occurred at normalmarket rates, are disclosed below.
Fee income and rent income
Net amounts receivables from
Year to 30 December
2017£m
Year to 30 December
2016£m
As at30 December
2017£m
As at30 December
2016£m
AssociatesKingfisher Limited Partnership (Redditch) 0.7 0.7 0.2 0.1Joint venturesButtermarket Ipswich Limited – 0.2 n/a 0.1
Amounts receivable from associates and joint ventures are unsecured and do not incur interest and they are payable on demand and settled in cash. Management fees are received by Capital & Regional Property Management Limited (CRPM) and are payable on demand. They are unsecured, do not incur interest and are settled in cash.
Property Management incentive arrangementsCRPM will earn an additional equity return from Kingfisher Limited Partnership if distributions result in a geared return in excessof a 15% IRR. The Group will bear 20.00% of the cost by virtue of its investment in the Partnership. No performance fee has beenrecognised during the year (2016: none) as the criteria have currently not been met.
Transactions with key management personnelIn accordance with IAS 24, key personnel are considered to be the Executive Directors and Non-Executive Directors and members of the Executive Committee as they have the authority and responsibility for planning, directing and controlling the activities of the Group. Their remuneration in the income statement is as follows:
Year to 30 December
2017£m
Year to 30 December
2016£m
Short-term employment benefits 1.8 2.5Post-employment benefits 0.1 0.2Share-based payments 0.6 0.3 2.5 3.0
In both years the highest paid Director was the Chief Executive whose remuneration is disclosed in the Directors’ Remuneration Report on page 54.
29 DividendsThe dividends shown below are gross of any take-up of Scrip offer.
Year to 30 December
2017£m
Year to 30 December
2016£m
Finaldividendpersharepaidforyearended30 December2015of1.62p – 11.3Interimdividendpersharepaidforyearended30 December2016of1.62p – 11.4Finaldividendpersharepaidforyearended30 December2016of1.77p 12.4 –Interimdividendpersharepaidforyearended30 December2017of1.73p 12.4 –Amounts recognised as distributions to equity holders in the year 24.8 22.7Proposedfinaldividendpershareforyearended30 December2017of1.91p1 13.7 –
1 In line with the requirements of IAS 10 – “Events after the Reporting Period”, this dividend has not been included as a liability in these financial statements.
COMPANY BALANCE SHEETAS AT 30 DECEMBER 2017
Registered number: 01399411Prepared in accordance with FRS 101
Notes2017
£m2016
£m
Non-current assetsInvestments C 457.0 330.0
Current assetsReceivables – amounts falling due within one year D 18.7 125.5Cash and deposits 1.4 –Total current assets 20.1 125.5
Current liabilitiesTrade and other payables E (15.6) (15.3)Total current liabilities (15.6) (15.3)Net current assets 4.5 110.2Net assets 461.5 440.2
EquityShare capital 7.2 7.0Share premium 163.3 158.2Merger reserve 60.3 60.3Capital redemption reserve 4.4 4.4Retained earnings 226.3 210.3Shareholders’ funds 461.5 440.2
The profit for the year attributable to equity shareholders was £40.8 million (2016: £30.2 million).
These financial statements were approved by the Board of Directors, authorised for issue and signed on their behalf on 5 April 2018by:
Charles Staveley Group Finance Director
Capital & Regional plc Annual Report and Accounts for the year ended 30 December 2017
Stock Code: CAL capreg.com Stock Code: CAL
110
Capital & Regional AR2017 Financials.indd 110 10/04/2018 16:06:07

NOTES TO THE FINANCIAL STATEMENTSCONTINUED
28 Related party transactionsTransactions between the Company and its subsidiaries, which are related parties, have been eliminated on consolidation and arenot disclosed in this note. Transactions between the Group and its associates and joint ventures, all of which occurred at normalmarket rates, are disclosed below.
Fee income and rent income
Net amounts receivables from
Year to 30 December
2017£m
Year to 30 December
2016£m
As at30 December
2017£m
As at30 December
2016£m
AssociatesKingfisher Limited Partnership (Redditch) 0.7 0.7 0.2 0.1Joint venturesButtermarket Ipswich Limited – 0.2 n/a 0.1
Amounts receivable from associates and joint ventures are unsecured and do not incur interest and they are payable on demand and settled in cash. Management fees are received by Capital & Regional Property Management Limited (CRPM) and are payable on demand. They are unsecured, do not incur interest and are settled in cash.
Property Management incentive arrangementsCRPM will earn an additional equity return from Kingfisher Limited Partnership if distributions result in a geared return in excessof a 15% IRR. The Group will bear 20.00% of the cost by virtue of its investment in the Partnership. No performance fee has beenrecognised during the year (2016: none) as the criteria have currently not been met.
Transactions with key management personnelIn accordance with IAS 24, key personnel are considered to be the Executive Directors and Non-Executive Directors and members of the Executive Committee as they have the authority and responsibility for planning, directing and controlling the activities of the Group. Their remuneration in the income statement is as follows:
Year to 30 December
2017£m
Year to 30 December
2016£m
Short-term employment benefits 1.8 2.5Post-employment benefits 0.1 0.2Share-based payments 0.6 0.3 2.5 3.0
In both years the highest paid Director was the Chief Executive whose remuneration is disclosed in the Directors’ Remuneration Report on page 54.
29 DividendsThe dividends shown below are gross of any take-up of Scrip offer.
Year to 30 December
2017£m
Year to 30 December
2016£m
Finaldividendpersharepaidforyearended30 December2015of1.62p – 11.3Interimdividendpersharepaidforyearended30 December2016of1.62p – 11.4Finaldividendpersharepaidforyearended30 December2016of1.77p 12.4 –Interimdividendpersharepaidforyearended30 December2017of1.73p 12.4 –Amounts recognised as distributions to equity holders in the year 24.8 22.7Proposedfinaldividendpershareforyearended30 December2017of1.91p1 13.7 –
1 In line with the requirements of IAS 10 – “Events after the Reporting Period”, this dividend has not been included as a liability in these financial statements.
COMPANY BALANCE SHEETAS AT 30 DECEMBER 2017
Registered number: 01399411Prepared in accordance with FRS 101
Notes2017
£m2016
£m
Non-current assetsInvestments C 457.0 330.0
Current assetsReceivables – amounts falling due within one year D 18.7 125.5Cash and deposits 1.4 –Total current assets 20.1 125.5
Current liabilitiesTrade and other payables E (15.6) (15.3)Total current liabilities (15.6) (15.3)Net current assets 4.5 110.2Net assets 461.5 440.2
EquityShare capital 7.2 7.0Share premium 163.3 158.2Merger reserve 60.3 60.3Capital redemption reserve 4.4 4.4Retained earnings 226.3 210.3Shareholders’ funds 461.5 440.2
The profit for the year attributable to equity shareholders was £40.8 million (2016: £30.2 million).
These financial statements were approved by the Board of Directors, authorised for issue and signed on their behalf on 5 April 2018by:
Charles Staveley Group Finance Director
capreg.com Stock Code: CAL capreg.com
FINANCIALS
111
Capital & Regional AR2017 Financials.indd 111 10/04/2018 16:06:07
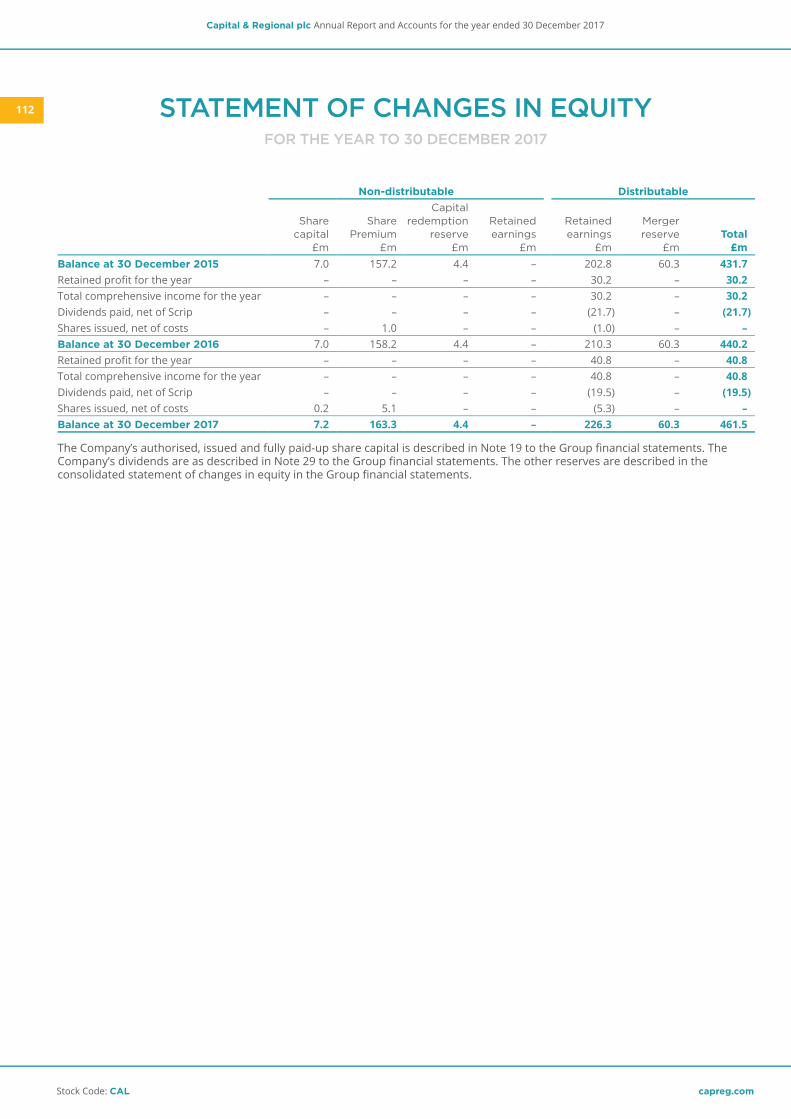
NOTES TO THE COMPANY’S SEPARATE FINANCIAL STATEMENTS
FOR THE YEAR ENDED 30 DECEMBER 2017
STATEMENT OF CHANGES IN EQUITYFOR THE YEAR TO 30 DECEMBER 2017
Non-distributable Distributable
Sharecapital
£m
SharePremium
£m
Capitalredemption
reserve£m
Retainedearnings
£m
Retainedearnings
£m
Mergerreserve
£mTotal
£mBalance at 30 December 2015 7.0 157.2 4.4 – 202.8 60.3 431.7Retained profit for the year – – – – 30.2 – 30.2Total comprehensive income for the year – – – – 30.2 – 30.2Dividends paid, net of Scrip – – – – (21.7) – (21.7)Shares issued, net of costs – 1.0 – – (1.0) – –Balance at 30 December 2016 7.0 158.2 4.4 – 210.3 60.3 440.2Retained profit for the year – – – – 40.8 – 40.8Total comprehensive income for the year – – – – 40.8 – 40.8Dividends paid, net of Scrip – – – – (19.5) – (19.5)Shares issued, net of costs 0.2 5.1 – – (5.3) – –Balance at 30 December 2017 7.2 163.3 4.4 – 226.3 60.3 461.5
The Company’s authorised, issued and fully paid-up share capital is described in Note 19 to the Group financial statements. TheCompany’s dividends are as described in Note 29 to the Group financial statements. The other reserves are described in the consolidated statement of changes in equity in the Group financial statements.
A Accounting policiesThe Company’s separate financial statements for the year ended 30 December 2017 are prepared in accordance with Financial Reporting Standard 101 Reduced Disclosure Framework (FRS 101) and in accordance with applicable accounting standards. The main accounting policies have been applied consistently in the current year and the preceding year.
As permitted by FRS 101, the Company has taken advantage of the disclosure exemptions available under that standard in relationto business combinations, share-based payments, non-current assets held for sale, financial instruments, capital management, presentation of comparative information in respect of certain assets, presentation of a cash-flow statement, standards not yet effective, impairment of assets and related party transactions.
The Company’s financial statements are presented in Pounds Sterling, generally rounded to the nearest million.
Investments, amounts owed by subsidiaries and amounts owed by associates and joint ventures are stated at cost less provision for impairment. Where there is an indication that an investment is impaired, an impairment review is carried out by comparing thecarrying value of the investment against its recoverable amount, which is the higher of its estimated value in use and fair value. This review involves accounting judgements about the future cash flows from the underlying associates and joint ventures and, in thecase of CRPM, estimated asset management fee income less estimated fixed and variable expenses.
Transactions in foreign currencies are translated into sterling at exchange rates approximating to the exchange rate ruling at thedate of the transaction. Monetary assets and liabilities denominated in foreign currencies at the balance sheet date are translated to sterling at the exchange rate ruling at that date and differences arising on translation are recognised in the income statement.
The Company’s related party transactions are described in Note 28 to the Group financial statements. Except for the Directors, theCompany had no direct employees during the year (2016: none). Information on the Directors’ emoluments, share options, long-term incentive schemes and pension contributions is shown in the Directors’ Remuneration Report. Further disclosures regarding the nature of the share-based payment schemes operated by the Group are included in Note 20 to the Group’s financial statements.
B Profit for the yearAs permitted by section 408 of the Companies Act 2006, the profit and loss account of the Company is not presented as part of thesefinancial statements.
The fees payable to the Company’s Auditor for the audit of the Company and Group financial statements are disclosed in Note 6 tothe Group financial statements.
C Fixed asset investments
Subsidiaries£m
Other investments
£mTotal
£mAt the start of the year 329.0 1.0 330.0Investment 235.2 – 235.2Impairment of investments (108.2) – (108.2)At the end of the year 456.0 1.0 457.0
Investments are subject to an impairment review using discount rates between the range of 7.4% and 9.5%. The investment in the year reflects a reorganisation of the Group completed in parallel with and following the completion of the refinancing of the five Mall assets that completed on 4 January 2017.
Note F shows the subsidiaries, associates and joint ventures held by the Group and the Company.
D Receivables
Amounts falling due within one year2017
£m2016
£mAmounts owed by subsidiaries 18.5 125.2Other receivables 0.2 0.3 18.7 125.5
Capital & Regional plc Annual Report and Accounts for the year ended 30 December 2017
Stock Code: CAL capreg.com Stock Code: CAL
112
Capital & Regional AR2017 Financials.indd 112 10/04/2018 16:06:07

NOTES TO THE COMPANY’S SEPARATE FINANCIAL STATEMENTS
FOR THE YEAR ENDED 30 DECEMBER 2017
STATEMENT OF CHANGES IN EQUITYFOR THE YEAR TO 30 DECEMBER 2017
Non-distributable Distributable
Sharecapital
£m
SharePremium
£m
Capitalredemption
reserve£m
Retainedearnings
£m
Retainedearnings
£m
Mergerreserve
£mTotal
£mBalance at 30 December 2015 7.0 157.2 4.4 – 202.8 60.3 431.7Retained profit for the year – – – – 30.2 – 30.2Total comprehensive income for the year – – – – 30.2 – 30.2Dividends paid, net of Scrip – – – – (21.7) – (21.7)Shares issued, net of costs – 1.0 – – (1.0) – –Balance at 30 December 2016 7.0 158.2 4.4 – 210.3 60.3 440.2Retained profit for the year – – – – 40.8 – 40.8Total comprehensive income for the year – – – – 40.8 – 40.8Dividends paid, net of Scrip – – – – (19.5) – (19.5)Shares issued, net of costs 0.2 5.1 – – (5.3) – –Balance at 30 December 2017 7.2 163.3 4.4 – 226.3 60.3 461.5
The Company’s authorised, issued and fully paid-up share capital is described in Note 19 to the Group financial statements. TheCompany’s dividends are as described in Note 29 to the Group financial statements. The other reserves are described in the consolidated statement of changes in equity in the Group financial statements.
A Accounting policiesThe Company’s separate financial statements for the year ended 30 December 2017 are prepared in accordance with Financial Reporting Standard 101 Reduced Disclosure Framework (FRS 101) and in accordance with applicable accounting standards. The main accounting policies have been applied consistently in the current year and the preceding year.
As permitted by FRS 101, the Company has taken advantage of the disclosure exemptions available under that standard in relationto business combinations, share-based payments, non-current assets held for sale, financial instruments, capital management, presentation of comparative information in respect of certain assets, presentation of a cash-flow statement, standards not yet effective, impairment of assets and related party transactions.
The Company’s financial statements are presented in Pounds Sterling, generally rounded to the nearest million.
Investments, amounts owed by subsidiaries and amounts owed by associates and joint ventures are stated at cost less provision for impairment. Where there is an indication that an investment is impaired, an impairment review is carried out by comparing thecarrying value of the investment against its recoverable amount, which is the higher of its estimated value in use and fair value. This review involves accounting judgements about the future cash flows from the underlying associates and joint ventures and, in thecase of CRPM, estimated asset management fee income less estimated fixed and variable expenses.
Transactions in foreign currencies are translated into sterling at exchange rates approximating to the exchange rate ruling at thedate of the transaction. Monetary assets and liabilities denominated in foreign currencies at the balance sheet date are translated to sterling at the exchange rate ruling at that date and differences arising on translation are recognised in the income statement.
The Company’s related party transactions are described in Note 28 to the Group financial statements. Except for the Directors, theCompany had no direct employees during the year (2016: none). Information on the Directors’ emoluments, share options, long-term incentive schemes and pension contributions is shown in the Directors’ Remuneration Report. Further disclosures regarding the nature of the share-based payment schemes operated by the Group are included in Note 20 to the Group’s financial statements.
B Profit for the yearAs permitted by section 408 of the Companies Act 2006, the profit and loss account of the Company is not presented as part of thesefinancial statements.
The fees payable to the Company’s Auditor for the audit of the Company and Group financial statements are disclosed in Note 6 tothe Group financial statements.
C Fixed asset investments
Subsidiaries£m
Other investments
£mTotal
£mAt the start of the year 329.0 1.0 330.0Investment 235.2 – 235.2Impairment of investments (108.2) – (108.2)At the end of the year 456.0 1.0 457.0
Investments are subject to an impairment review using discount rates between the range of 7.4% and 9.5%. The investment in the year reflects a reorganisation of the Group completed in parallel with and following the completion of the refinancing of the five Mall assets that completed on 4 January 2017.
Note F shows the subsidiaries, associates and joint ventures held by the Group and the Company.
D Receivables
Amounts falling due within one year2017
£m2016
£mAmounts owed by subsidiaries 18.5 125.2Other receivables 0.2 0.3 18.7 125.5
capreg.com Stock Code: CAL capreg.com
FINANCIALS
113
Capital & Regional AR2017 Financials.indd 113 10/04/2018 16:06:08

E Trade and other payables
Amounts falling due within one year2017
£m2016
£m
Amounts owed to subsidiaries 12.7 12.1Accruals and deferred income 2.9 3.2 15.6 15.3
F Subsidiaries at 30 December 2017
Nature ofbusiness
Country ofincorporation
Share ofvotingrights
SubsidiariesAshley Centre One Limited Dormant Great Britain 100%Ashley Centre Two Limited Dormant Great Britain 100%Ashley Epsom Limited 2 Dormant Jersey 100%Capital & Regional (Europe Holding 5) Limited 3 Property investment Jersey 100%Capital & Regional (Jersey) Limited 3 Property investment Jersey 100%Capital & Regional (Mall GP) Limited Property investment Great Britain 100%Capital & Regional (Projects) Limited Property investment Great Britain 100%Capital & Regional (Shopping Centres) Limited 3 Property investment Jersey 100%Capital & Regional Abertawe Limited 1 Dormant Great Britain 100%Capital & Regional Earnings Limited Property investment Great Britain 100%Capital & Regional Estates Limited 1,4 Dormant Great Britain 100%Capital & Regional Holdings Limited Property investment Great Britain 100%Capital & Regional Ilford Limited 3 Property investment Jersey 100%C&R Ilford Limited Partnership Property investment Great Britain 100%C&R Ilford Nominee 1 Limited Dormant Great Britain 100%C&R Ilford Nominee 2 Limited Dormant Great Britain 100%C&R Ilford (General Partner) Limited Property investment Great Britain 100%Capital & Regional Income Limited1,4 Property investment Great Britain 100%Capital & Regional Property Management Limited Property management Great Britain 100%Green-Sinfield Limited Dormant Great Britain 100%Lancaster Court (Hove) Limited Dormant Great Britain 100%Lower Grosvenor Place London One Limited Dormant Great Britain 100%Mall Developments Limited 1 Dormant Great Britain 100%Mall Messages Limited 1 Dormant Great Britain 100%
1. In liquidation/being dissolved.
2. Registered office at 1 The Esplanade, St Helier, Jersey, JE2 3QA.
3. Registered office at 47 The Esplanade, St Helier, Jersey, JE1 0BD.
4. Registered office at Griffins, Tavistock House South, Tavistock Square, London, WC1H 9LG.
F Subsidiaries continued
Nature ofbusiness
Country ofincorporation
Share ofvotingrights
Subsidiaries (continued)Mall Nominee One Limited Dormant Great Britain 100%Mall Nominee Two Limited Dormant Great Britain 100%Mall Nominee Three Limited Dormant Great Britain 100%Mall Nominee Four Limited Dormant Great Britain 100%Mall Shopping Limited 1 Dormant Great Britain 100%Mallspace Limited 1 Dormant Great Britain 100%Mall Ventures Limited Dormant Great Britain 100%Marlowes Hemel Limited 3 Property investment Jersey 100%MB Roding (Guernsey) Limited Dormant Guernsey 100%R Green Properties (Holdings) 1 Dormant Great Britain 100%Selborne One Limited Dormant Great Britain 100%Selborne Two Limited Dormant Great Britain 100%Selborne Walthamstow Limited 2 Dormant Jersey 100%Snozone Holdings Limited Operator of indoor ski slopes Great Britain 100%Snozone Leisure Limited Operator of indoor ski slopes Great Britain 100%Snozone Limited Operator of indoor ski slopes Great Britain 100%The Mall (General Partner) Limited Property investment Great Britain 100%The Mall (Luton) (General Partner) Limited Property investment Great Britain 100%The Mall Company Limited 1 Dormant Great Britain 100%The Mall Facilities Management Limited 1 Dormant Great Britain 100%The Mall Limited Partnership Property investment Great Britain 100%The Mall People Management Limited 1 Dormant Great Britain 100%The Mall REIT Limited Dormant Great Britain 100%The Mall Shopping Centres Limited Dormant Great Britain 100%The Mall Unit Trust 3 Property investment Jersey 100%The Mall Walthamstow One Limited Dormant Great Britain 100%The Mall Walthamstow Two Limited Dormant Great Britain 100%Wood Green London Limited 2 Dormant Jersey 100%Wood Green One Limited Dormant Great Britain 100%Wood Green Two Limited Dormant Great Britain 100%
Principal associate entitiesEuro B-Note Holding Limited 3 Finance Jersey 39.90%Kingfisher Limited Partnership Property investment Great Britain 20%Kingfisher Topco S.a.r.l 5 Property investment Luxembourg 20%
1. In liquidation/being dissolved.
2. Registered office at 1 The Esplanade, St Helier, Jersey, JE2 3QA.
3. Registered office at 47 The Esplanade, St Helier, Jersey, JE1 0BD.
4. Registered office at Griffins, Tavistock House South, Tavistock Square, London, WC1H 9LG.
5. Registered office at 26A Boulevard Royal, L–2449, Luxembourg.
The registered office of all subsidiaries, unless otherwise noted, is 22 Chapter Street, London, SW1P 4NP although was 52 GrosvenorGardens, London, SW1W 0AU as of 30 December 2017 and until 5 February 2018.
The shares of voting rights are equivalent to the percentages of ordinary shares or units held directly or indirectly by the Group.
NOTES TO THE COMPANY’S SEPARATE FINANCIAL STATEMENTS
CONTINUED
Capital & Regional plc Annual Report and Accounts for the year ended 30 December 2017
Stock Code: CAL capreg.com Stock Code: CAL
114
Capital & Regional AR2017 Financials.indd 114 10/04/2018 16:06:08

E Trade and other payables
Amounts falling due within one year2017
£m2016
£m
Amounts owed to subsidiaries 12.7 12.1Accruals and deferred income 2.9 3.2 15.6 15.3
F Subsidiaries at 30 December 2017
Nature ofbusiness
Country ofincorporation
Share ofvotingrights
SubsidiariesAshley Centre One Limited Dormant Great Britain 100%Ashley Centre Two Limited Dormant Great Britain 100%Ashley Epsom Limited 2 Dormant Jersey 100%Capital & Regional (Europe Holding 5) Limited 3 Property investment Jersey 100%Capital & Regional (Jersey) Limited 3 Property investment Jersey 100%Capital & Regional (Mall GP) Limited Property investment Great Britain 100%Capital & Regional (Projects) Limited Property investment Great Britain 100%Capital & Regional (Shopping Centres) Limited 3 Property investment Jersey 100%Capital & Regional Abertawe Limited 1 Dormant Great Britain 100%Capital & Regional Earnings Limited Property investment Great Britain 100%Capital & Regional Estates Limited 1,4 Dormant Great Britain 100%Capital & Regional Holdings Limited Property investment Great Britain 100%Capital & Regional Ilford Limited 3 Property investment Jersey 100%C&R Ilford Limited Partnership Property investment Great Britain 100%C&R Ilford Nominee 1 Limited Dormant Great Britain 100%C&R Ilford Nominee 2 Limited Dormant Great Britain 100%C&R Ilford (General Partner) Limited Property investment Great Britain 100%Capital & Regional Income Limited1,4 Property investment Great Britain 100%Capital & Regional Property Management Limited Property management Great Britain 100%Green-Sinfield Limited Dormant Great Britain 100%Lancaster Court (Hove) Limited Dormant Great Britain 100%Lower Grosvenor Place London One Limited Dormant Great Britain 100%Mall Developments Limited 1 Dormant Great Britain 100%Mall Messages Limited 1 Dormant Great Britain 100%
1. In liquidation/being dissolved.
2. Registered office at 1 The Esplanade, St Helier, Jersey, JE2 3QA.
3. Registered office at 47 The Esplanade, St Helier, Jersey, JE1 0BD.
4. Registered office at Griffins, Tavistock House South, Tavistock Square, London, WC1H 9LG.
F Subsidiaries continued
Nature ofbusiness
Country ofincorporation
Share ofvotingrights
Subsidiaries (continued)Mall Nominee One Limited Dormant Great Britain 100%Mall Nominee Two Limited Dormant Great Britain 100%Mall Nominee Three Limited Dormant Great Britain 100%Mall Nominee Four Limited Dormant Great Britain 100%Mall Shopping Limited 1 Dormant Great Britain 100%Mallspace Limited 1 Dormant Great Britain 100%Mall Ventures Limited Dormant Great Britain 100%Marlowes Hemel Limited 3 Property investment Jersey 100%MB Roding (Guernsey) Limited Dormant Guernsey 100%R Green Properties (Holdings) 1 Dormant Great Britain 100%Selborne One Limited Dormant Great Britain 100%Selborne Two Limited Dormant Great Britain 100%Selborne Walthamstow Limited 2 Dormant Jersey 100%Snozone Holdings Limited Operator of indoor ski slopes Great Britain 100%Snozone Leisure Limited Operator of indoor ski slopes Great Britain 100%Snozone Limited Operator of indoor ski slopes Great Britain 100%The Mall (General Partner) Limited Property investment Great Britain 100%The Mall (Luton) (General Partner) Limited Property investment Great Britain 100%The Mall Company Limited 1 Dormant Great Britain 100%The Mall Facilities Management Limited 1 Dormant Great Britain 100%The Mall Limited Partnership Property investment Great Britain 100%The Mall People Management Limited 1 Dormant Great Britain 100%The Mall REIT Limited Dormant Great Britain 100%The Mall Shopping Centres Limited Dormant Great Britain 100%The Mall Unit Trust 3 Property investment Jersey 100%The Mall Walthamstow One Limited Dormant Great Britain 100%The Mall Walthamstow Two Limited Dormant Great Britain 100%Wood Green London Limited 2 Dormant Jersey 100%Wood Green One Limited Dormant Great Britain 100%Wood Green Two Limited Dormant Great Britain 100%
Principal associate entitiesEuro B-Note Holding Limited 3 Finance Jersey 39.90%Kingfisher Limited Partnership Property investment Great Britain 20%Kingfisher Topco S.a.r.l 5 Property investment Luxembourg 20%
1. In liquidation/being dissolved.
2. Registered office at 1 The Esplanade, St Helier, Jersey, JE2 3QA.
3. Registered office at 47 The Esplanade, St Helier, Jersey, JE1 0BD.
4. Registered office at Griffins, Tavistock House South, Tavistock Square, London, WC1H 9LG.
5. Registered office at 26A Boulevard Royal, L–2449, Luxembourg.
The registered office of all subsidiaries, unless otherwise noted, is 22 Chapter Street, London, SW1P 4NP although was 52 GrosvenorGardens, London, SW1W 0AU as of 30 December 2017 and until 5 February 2018.
The shares of voting rights are equivalent to the percentages of ordinary shares or units held directly or indirectly by the Group.
NOTES TO THE COMPANY’S SEPARATE FINANCIAL STATEMENTS
CONTINUED
capreg.com Stock Code: CAL capreg.com
FINANCIALS
115
Capital & Regional AR2017 Financials.indd 115 10/04/2018 16:06:08

GLOSSARY OF TERMS
Adjusted Profit is the total of Contribution from wholly-owned assets and the Group’s joint ventures and associates, the profit from Snozone and property management fees less central costs (including interest excluding non-cash charges in respect of share-based payments) after tax. Adjusted Profit excludes revaluation of properties, profit or loss on disposal of properties or investments, gains or losses on financial instruments and exceptional one-off items. Results from Discontinued Operations are included up until the point of disposal or reclassification as held for sale.
C&R is Capital & Regional plc, also referred to as the Group or the Company.
C&R Trade index is an internal retail tracker using data from approximately 300 retail units across C&R’s shopping centre portfolio.
CRPM is Capital & Regional Property Management Limited, a subsidiary of Capital & Regional plc, which earns management and performance fees from the Mall assets and certain associates and joint ventures of the Group.
Contracted rent is passing rent and the first rent reserved under a lease or unconditional agreement for lease but which is not yet payable by a tenant.
Contribution is net rent less net interest, including unhedged foreign exchange movements.
Capital return is the change in market value during the year for properties held at the balance sheet date, after taking account of capital expenditure calculated on a time weighted basis.
Debt is borrowings, excluding unamortised issue costs.
EPRA earnings per share (EPS) is the profit/(loss) after tax excluding gains on asset disposals and revaluations, movements in the fair value of financial instruments, intangible asset movements and the capital allowance effects of IAS 12 “Income Taxes” where applicable, less tax arising on these items, divided by the weighted average number of shares in issue during the year excluding own shares held.
EPRA net assets per share include the dilutive effect of share-based payments but ignore the fair value of derivatives, any deferred tax provisions on unrealised gains and capital allowances, any adjustment to the fair value of borrowings net of tax and any surplus on the fair value of trading properties.
EPRA triple net assets per share include the dilutive effect of share-based payments and adjust all items to market value, including trading properties and fixed rate debt.
Estimated rental value (ERV) is the Group’s external valuers’ opinion as to the open market rent which, on the date of valuation, could reasonably be expected to be obtained on a new letting or rent review of a unit or property.
ERV growth is the total growth in ERV on properties owned throughout the year including growth due to development.
Gearing is the Group’s debt as a percentage of net assets. See through gearing includes the Group’s share of non-recourse debt in associates and joint ventures.
Interest cover is the ratio of Adjusted Profit (before interest, tax, depreciation and amortisation) to the interest charge (excluding notional amortisation of finance costs and interest on head leases).
Like-for-like figures, unless otherwise stated, exclude the impact of property purchases and sales on year to year comparatives.
Loan to value (LTV) is the ratio of debt excluding fair value adjustments for debt and derivatives, to the Market value of properties.
Market value is an opinion of the best price at which the sale of an interest in a property would complete unconditionally for cash consideration on the date of valuation as determined by the Group’s external or internal valuers. In accordance with usual practice, the valuers report valuations net, after the deduction of the prospective purchaser’s costs, including stamp duty, agent and legal fees.
Net assets per share (NAV) are shareholders’ funds divided by the number of shares held by shareholders at the year end, excluding own shares held.
Net initial yield (NIY) is the annualised current rent, net of revenue costs, topped-up for contractual uplifts, expressed as a percentage of the capital valuation, after adding notional purchaser’s costs.
Net debt to property value is debt less cash and cash equivalents divided by the property value.
Net interest is the Group’s share, on a see-through basis, of the interest payable less interest receivable of the Group and its associates and joint ventures.
Net rent is the Group’s share, on a see-through basis, of the rental income, less property and management costs (excluding performance fees) of the Group and its associates and joint ventures.
Nominal equivalent yield is a weighted average of the net initial yield and reversionary yield and represents the return a property will produce based upon the timing of the income received, assuming rent is received annually in arrears on gross values including the prospective purchaser’s costs.
Occupancy cost ratio is the proportion of a retailer’s sales compared with the total cost of occupation being: rent, business rates, service charge and insurance. Retailer sales are based on estimates by third party consultants which are periodically updated and indexed using relevant data from the C&R Trade Index.
Occupancy rate is the ERV of occupied properties expressed as a percentage of the total ERV of the portfolio, excluding development voids.
Passing rent is gross rent currently payable by tenants including car park profit but excluding income from non-trading administrations and any assumed uplift from outstanding rent reviews.
Rent to sales ratio is Contracted rent excluding car park income, ancillary income and anchor stores expressed as a percentage of net sales.
REIT – Real Estate Investment Trust.
Return on equity is the total return, including revaluation gains and losses, divided by opening equity plus time weighted additions to and reductions in share capital, excluding share options exercised.
Reversionary percentage is the percentage by which the ERV exceeds the passing rent.
Reversionary yield is the anticipated yield to which the net initial yield will rise once the rent reaches the ERV.
Temporary lettings are those lettings for one year or less.
Total property return incorporates net rental income and capital return expressed as a percentage of the capital value employed (opening market value plus capital expenditure) calculated on a time weighted basis.
Total return is the Group’s total recognised income or expense for the year as set out in the consolidated statement of comprehensive income expressed as a percentage of opening equity shareholders’ funds.
Total shareholder return (TSR) is a performance measure of the Group’s share price over time. It is calculated as the share price movement from the beginning of the year to the end of the year plus dividends paid, divided by share price at the beginning of the year.
Variable overhead includes discretionary bonuses and the costs of awards to Directors and employees made under the 2008 LTIP and other share schemes which are spread over the performance period.
Capital & Regional plc Annual Report and Accounts for the year ended 30 December 2017
Stock Code: CAL capreg.com Stock Code: CAL
116
Capital & Regional AR2017 Financials.indd 116 10/04/2018 16:06:08

GLOSSARY OF TERMS
Gearing is the Group’s debt as a percentage of net assets. See through gearing includes the Group’s share of non-recourse debt in associates and joint ventures.
Interest cover is the ratio of Adjusted Profit (before interest, tax, depreciation and amortisation) to the interest charge (excluding notional amortisation of finance costs and interest on head leases).
Like-for-like figures, unless otherwise stated, exclude the impact of property purchases and sales on year to year comparatives.
Loan to value (LTV) is the ratio of debt excluding fair value adjustments for debt and derivatives, to the Market value of properties.
Market value is an opinion of the best price at which the sale of an interest in a property would complete unconditionally for cash consideration on the date of valuation as determined by the Group’s external or internal valuers. In accordance with usual practice, the valuers report valuations net, after the deduction of the prospective purchaser’s costs, including stamp duty, agent and legal fees.
Net assets per share (NAV) are shareholders’ funds divided by the number of shares held by shareholders at the year end, excluding own shares held.
Net initial yield (NIY) is the annualised current rent, net of revenue costs, topped-up for contractual uplifts, expressed as a percentage of the capital valuation, after adding notional purchaser’s costs.
Net debt to property value is debt less cash and cash equivalents divided by the property value.
Net interest is the Group’s share, on a see-through basis, of the interest payable less interest receivable of the Group and its associates and joint ventures.
Net rent is the Group’s share, on a see-through basis, of the rental income, less property and management costs (excluding performance fees) of the Group and its associates and joint ventures.
Nominal equivalent yield is a weighted average of the net initial yield and reversionary yield and represents the return a property will produce based upon the timing of the income received, assuming rent is received annually in arrears on gross values including the prospective purchaser’s costs.
Occupancy cost ratio is the proportion of a retailer’s sales compared with the total cost of occupation being: rent, business rates, service charge and insurance. Retailer sales are based on estimates by third party consultants which are periodically updated and indexed using relevant data from the C&R Trade Index.
Occupancy rate is the ERV of occupied properties expressed as a percentage of the total ERV of the portfolio, excluding development voids.
Passing rent is gross rent currently payable by tenants including car park profit but excluding income from non-trading administrations and any assumed uplift from outstanding rent reviews.
Rent to sales ratio is Contracted rent excluding car park income, ancillary income and anchor stores expressed as a percentage of net sales.
REIT – Real Estate Investment Trust.
Return on equity is the total return, including revaluation gains and losses, divided by opening equity plus time weighted additions to and reductions in share capital, excluding share options exercised.
Reversionary percentage is the percentage by which the ERV exceeds the passing rent.
Reversionary yield is the anticipated yield to which the net initial yield will rise once the rent reaches the ERV.
Temporary lettings are those lettings for one year or less.
Total property return incorporates net rental income and capital return expressed as a percentage of the capital value employed (opening market value plus capital expenditure) calculated on a time weighted basis.
Total return is the Group’s total recognised income or expense for the year as set out in the consolidated statement of comprehensive income expressed as a percentage of opening equity shareholders’ funds.
Total shareholder return (TSR) is a performance measure of the Group’s share price over time. It is calculated as the share price movement from the beginning of the year to the end of the year plus dividends paid, divided by share price at the beginning of the year.
Variable overhead includes discretionary bonuses and the costs of awards to Directors and employees made under the 2008 LTIP and other share schemes which are spread over the performance period.
capreg.com Stock Code: CAL capreg.com
FINANCIALS
117
Capital & Regional AR2017 Financials.indd 117 10/04/2018 16:06:08

FIVE YEAR REVIEW (UNAUDITED)
2017
£m2016
£m2015
£m2014
£m20131
£mBalance sheetProperty assets 930.6 838.5 870.0 790.8 –Other non-current assets 18.1 17.1 18.1 21.3 23.5Intangible assets – – – – –Investment in joint ventures – – 11.7 – 32.3Investment in associates 7.4 13.9 15.9 13.6 112.1Cash at bank 30.2 49.1 49.9 42.6 11.1Assets classified as held for sale – 13.9 – 39.5 8.5Other net current (liabilities)/assets (17.4) (362.9)1 (20.0) (26.5) 2.2Bank loans greater than one year (422.2) (26.2) (374.9) (396.8) –Other non-current liabilities (65.3) (65.8) (67.5) (65.5) (1.0)Net assets 481.4 477.6 503.2 419.0 188.7Financed byCalled-up share capital 7.2 7.0 7.0 7.0 9.9Share premium account 163.3 158.2 157.2 157.2 –Other reserves 64.6 64.3 64.1 65.3 66.3Retained earnings 246.3 248.1 274.9 189.5 112.5Capital employed 481.4 477.6 503.2 419.0 188.7Return on equity Return on equity 4.7% (0.9)% 23.5% 28.1% 5.1%Increase/(decrease) in NAV per share + dividend 3.7% (0.8)% 23.2% 12.1% 5.8%Total shareholder return 12.7% (12.3)% 29.8% 24.7% 53.9%Year end share price 59p 55p 66p 53p 44pTotal returnTotal comprehensive income/(expense) 22.4 (4.4) 98.4 74.1 9.2Net assets per share Basicnetassetspershare 67p 68p 72p 60p 54p EPRAtriplenetassetspershare 66p 67p 70p 59p 54p EPRAnetassetspershare 67p 68p 71p 59p 56pGearing 89% 76% 76% 96% –Income statement2
Group revenue 89.2 87.2 80.7 46.6 17.6Gross profit 55.7 54.7 51.6 28.4 9.6Profit on ordinary activities before financing 40.0 28.1 116.8 77.0 7.4Net interest payable (17.6) (32.6)3 (19.2) (9.8) (0.1)Profit/(loss) before tax 22.4 (4.5) 97.6 67.2 7.3Tax credit – 0.1 – 2.5 0.2Profit/(loss) after tax 22.4 (4.4) 97.6 69.7 7.5Adjusted Profit 29.1 26.8 24.0 21.8 13.4Adjusted Earnings per Share 4.1p 3.8p 3.4p 4.2p 3.8pInterest cover 3.2 3.1 3.0 2.7 2.8Earnings per share Basic4 3.2p (1)p 14p 15p 3p Diluted4 3.1p (1)p 14p 15p 3p EPRA4 3.9p 4p 3p 3p 2pDividends per share 3.64p 3.39p 3.12p 0.95p 0.65p
1. The debt facility on The Mall was classified as a current liability at 30 December 2016 as notice to repay had been served on 28 December 2016 ahead of the debt being refinanced on 4 January 2017.
2. 2013 results have been restated from those originally presented in those respective years to separate discontinued operations.
3. Includes £11.0 million of costs in respect of the debt refinancing of the Mall assets (see note 17a for further details).
4. Continuing and discontinued operations.
Capital & Regional plc Annual Report and Accounts for the year ended 30 December 2017
Stock Code: CAL capreg.com Stock Code: CAL
118
Capital & Regional AR2017 Financials.indd 118 10/04/2018 16:06:08

FIVE YEAR REVIEW (UNAUDITED) COVENANT INFORMATION (UNAUDITED)WHOLLY-OWNED ASSETS
2017
£m2016
£m2015
£m2014
£m20131
£mBalance sheetProperty assets 930.6 838.5 870.0 790.8 –Other non-current assets 18.1 17.1 18.1 21.3 23.5Intangible assets – – – – –Investment in joint ventures – – 11.7 – 32.3Investment in associates 7.4 13.9 15.9 13.6 112.1Cash at bank 30.2 49.1 49.9 42.6 11.1Assets classified as held for sale – 13.9 – 39.5 8.5Other net current (liabilities)/assets (17.4) (362.9)1 (20.0) (26.5) 2.2Bank loans greater than one year (422.2) (26.2) (374.9) (396.8) –Other non-current liabilities (65.3) (65.8) (67.5) (65.5) (1.0)Net assets 481.4 477.6 503.2 419.0 188.7Financed byCalled-up share capital 7.2 7.0 7.0 7.0 9.9Share premium account 163.3 158.2 157.2 157.2 –Other reserves 64.6 64.3 64.1 65.3 66.3Retained earnings 246.3 248.1 274.9 189.5 112.5Capital employed 481.4 477.6 503.2 419.0 188.7Return on equity Return on equity 4.7% (0.9)% 23.5% 28.1% 5.1%Increase/(decrease) in NAV per share + dividend 3.7% (0.8)% 23.2% 12.1% 5.8%Total shareholder return 12.7% (12.3)% 29.8% 24.7% 53.9%Year end share price 59p 55p 66p 53p 44pTotal returnTotal comprehensive income/(expense) 22.4 (4.4) 98.4 74.1 9.2Net assets per share Basicnetassetspershare 67p 68p 72p 60p 54p EPRAtriplenetassetspershare 66p 67p 70p 59p 54p EPRAnetassetspershare 67p 68p 71p 59p 56pGearing 89% 76% 76% 96% –Income statement2
Group revenue 89.2 87.2 80.7 46.6 17.6Gross profit 55.7 54.7 51.6 28.4 9.6Profit on ordinary activities before financing 40.0 28.1 116.8 77.0 7.4Net interest payable (17.6) (32.6)3 (19.2) (9.8) (0.1)Profit/(loss) before tax 22.4 (4.5) 97.6 67.2 7.3Tax credit – 0.1 – 2.5 0.2Profit/(loss) after tax 22.4 (4.4) 97.6 69.7 7.5Adjusted Profit 29.1 26.8 24.0 21.8 13.4Adjusted Earnings per Share 4.1p 3.8p 3.4p 4.2p 3.8pInterest cover 3.2 3.1 3.0 2.7 2.8Earnings per share Basic4 3.2p (1)p 14p 15p 3p Diluted4 3.1p (1)p 14p 15p 3p EPRA4 3.9p 4p 3p 3p 2pDividends per share 3.64p 3.39p 3.12p 0.95p 0.65p
1. The debt facility on The Mall was classified as a current liability at 30 December 2016 as notice to repay had been served on 28 December 2016 ahead of the debt being refinanced on 4 January 2017.
2. 2013 results have been restated from those originally presented in those respective years to separate discontinued operations.
3. Includes £11.0 million of costs in respect of the debt refinancing of the Mall assets (see note 17a for further details).
4. Continuing and discontinued operations.
Borrowings£m Covenant1
30 December2017 Future changes
Core revolving credit facility (100%)Net Assets – No less than £350m £481.6mGearing No greater than 1.5:1 0.87:1Historic interest cover No less than 200% 374%
4 Mall assets (100%)Loan to value2 255.0 No greater than 70% 48%Historic interest cover No less than 175% 291%A projected interest cover test also applies at a covenant level of no less than 150%
Luton (100%)Loan to value2 107.5 No greater than 70% 55% Covenant 65% from January 2022Debt yield No less than 8% 10.2%Historic interest cover No less than 250% 350%A projected interest cover test also applies at a covenant level of no less than 200%
Hemel Hempstead (100%)Loan to value2 26.9 No greater than 60% 50%Debt to net rent No greater than 10:1 7.1:1 Covenant 9:1 from April 2019Historic interest cover No less than 200% 435%A projected interest cover test also applies at a covenant level of no less than 200%
Ilford (100%)Loan to value2 39.0 No greater than 70% 47%Historic interest cover No less than 225% 515%A projected interest cover test also applies at a covenant level of no less than 225%
1. Covenants quoted are the default covenant levels. The facilities typically also have cash trap mechanisms.
2. Calculated as specified in loan agreement based on 30 December 2017 valuation. Actual bank covenant based on bank valuation updated annually.
capreg.com Stock Code: CAL capreg.com
FINANCIALS
119
Capital & Regional AR2017 Financials.indd 119 10/04/2018 16:06:09
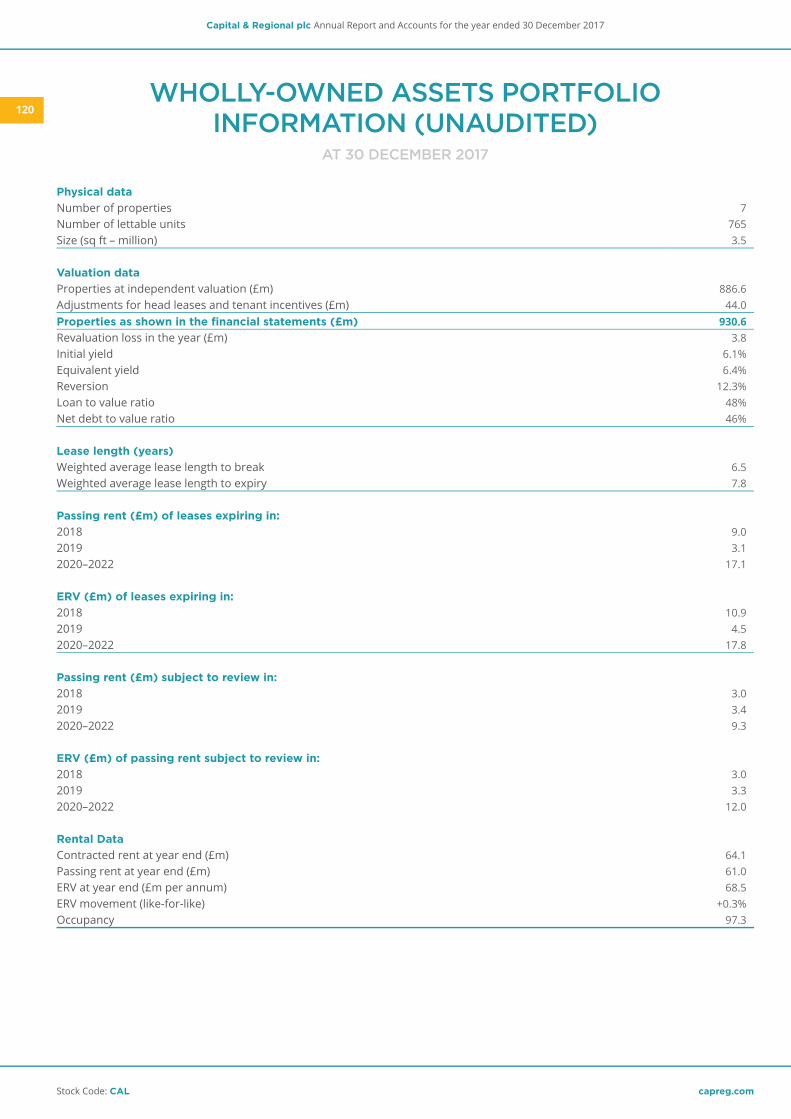
WHOLLY-OWNED ASSETS PORTFOLIO INFORMATION (UNAUDITED)
AT 30 DECEMBER 2017
Physical dataNumber of properties 7Number of lettable units 765Size (sq ft – million) 3.5
Valuation dataProperties at independent valuation (£m) 886.6Adjustments for head leases and tenant incentives (£m) 44.0Properties as shown in the financial statements (£m) 930.6Revaluation loss in the year (£m) 3.8Initial yield 6.1%Equivalent yield 6.4%Reversion 12.3%Loan to value ratio 48%Net debt to value ratio 46%
Lease length (years)Weighted average lease length to break 6.5Weighted average lease length to expiry 7.8
Passing rent (£m) of leases expiring in:2018 9.02019 3.12020–2022 17.1
ERV (£m) of leases expiring in:2018 10.92019 4.52020–2022 17.8
Passing rent (£m) subject to review in:2018 3.02019 3.42020–2022 9.3
ERV (£m) of passing rent subject to review in:2018 3.02019 3.32020–2022 12.0
Rental DataContracted rent at year end (£m) 64.1Passing rent at year end (£m) 61.0ERV at year end (£m per annum) 68.5ERV movement (like-for-like) +0.3%Occupancy 97.3
Capital & Regional plc Annual Report and Accounts for the year ended 30 December 2017
Stock Code: CAL capreg.com Stock Code: CAL
120
Capital & Regional AR2017 Financials.indd 120 10/04/2018 16:06:09

EPRA PERFORMANCE MEASURES (UNAUDITED)AS AT 30 DECEMBER 2017
Physical dataNumber of properties 7Number of lettable units 765Size (sq ft – million) 3.5
Valuation dataProperties at independent valuation (£m) 886.6Adjustments for head leases and tenant incentives (£m) 44.0Properties as shown in the financial statements (£m) 930.6Revaluation loss in the year (£m) 3.8Initial yield 6.1%Equivalent yield 6.4%Reversion 12.3%Loan to value ratio 48%Net debt to value ratio 46%
Lease length (years)Weighted average lease length to break 6.5Weighted average lease length to expiry 7.8
Passing rent (£m) of leases expiring in:2018 9.02019 3.12020–2022 17.1
ERV (£m) of leases expiring in:2018 10.92019 4.52020–2022 17.8
Passing rent (£m) subject to review in:2018 3.02019 3.42020–2022 9.3
ERV (£m) of passing rent subject to review in:2018 3.02019 3.32020–2022 12.0
Rental DataContracted rent at year end (£m) 64.1Passing rent at year end (£m) 61.0ERV at year end (£m per annum) 68.5ERV movement (like-for-like) +0.3%Occupancy 97.3
Notes 2017 2016EPRA earnings (£m) 9a 27.8 26.2EPRA earnings per share (diluted) 9a 3.9p 3.7p
EPRA net assets (£m) 23 482.6 481.5EPRA net assets per share 23 67p 68p
EPRA triple net assets (£m) 23 479.8 475.2EPRA triple net assets per share 23 66p 67p
EPRA vacancy rate (UK portfolio only) 2.8% 3.7%
EPRA net initial yield and EPRA topped-up net initial yield2017
£m20161
£mInvestment property – wholly-owned 886.6 794.1Investment property – share of joint ventures and associates 28.6 30.8Less developments – –Completed property portfolio 915.2 824.9Allowance for capital costs 8.0 15.0Allowance for estimated purchasers’ costs 60.2 56.3Grossed up completed property portfolio valuation 983.4 896.2Annualised cash passing rental income 67.0 58.8Property outgoings (13.1) (11.4)Annualised net rents 53.9 47.4Add: notional rent expiration of rent free periods or other lease incentives 3.6 4.4Topped up annualised rent 57.5 51.8EPRA net initial yield 5.5% 5.3%EPRA topped-up net initial yield 5.8% 5.8%
1. Excludes Buttermarket Centre, Ipswich.
EPRA Cost ratios 2017
£m2016
£mCost of sales (adjusted for IFRS head lease differential) 33.9 33.0Administrative costs 10.2 10.9Service charge income (14.1) (14.0)Management fees (0.8) (1.0)Snozone (indoor ski operation) costs (8.9) (8.8)Share of joint venture & associate expenses 0.7 1.2Less inclusive lease costs recovered through rent (2.1) (1.9)EPRA costs (including direct vacancy costs) 18.9 19.4Direct vacancy costs (3.1) (2.9)EPRA costs (excluding direct vacancy costs) 15.8 16.5Gross rental income 63.9 62.0Less ground rent costs (3.0) (3.1)Share of joint venture & associate gross rental income less ground rent costs 2.3 3.4Less inclusive lease costs recovered through rent (2.1) (1.9)Gross rental income 61.1 60.4EPRA cost ratio (including direct vacancy costs) 30.9% 32.2%EPRA cost ratio (excluding vacancy costs) 25.9% 27.4%
capreg.com Stock Code: CAL capreg.com
FINANCIALS
121
Capital & Regional AR2017 Financials.indd 121 10/04/2018 16:06:09

Auditor Principal valuersDeloitte LLP CBRE LimitedStatutory Auditor Kingsley House2 New Street Square 1a Wimpole StreetLondon EC4A 3BZ London W1G 0RE
Investment bankers/brokersJP Morgan Cazenove Knight Frank LLP25 Bank Street 55 Baker StreetCanary Wharf London W1U 8ANLondon E14 5JP
Numis Securities LimitedThe London Stock Exchange Building10 Paternoster SquareLondon EC4M 7LT
Java Capital Trustees and Sponsors Proprietary Limited (JSE sponsor) Principal legal advisers6A Sandown Valley Crescent CMS Cameron McKenna Nabarro Olswang LLPSandown Cannon PlaceSandton 2196 78 Cannon StreetSouth Africa London EC4N 6AF
Principal lending bankersRoyal Bank of Scotland plc250 BishopsgateLondon EC2M 4AA
Registered office Registered number22 Chapter Street 01399411London SW1P 4NPTelephone: +44 (0)20 7932 8000capreg.com
SHAREHOLDER INFORMATIONRegistrarsEquiniti Limited (LSE)Aspect HouseSpencer RoadLancingWest SussexBN99 6DATelephone: 0371 384 2438*International dialling: +44 (0)121 415 7047
Link Market Services South Africa Proprietary Limited (South African Transfer Secretaries)PO Box 4844Johannesburg, 2000South AfricaHelpline Number:011 713 0800 (SA callers)+27 11 713 0800 (if calling from outside South Africa)[email protected]
* Lines open 08:30 – 17:30, Monday to Friday, excluding bank holidays in England and Wales.
ADVISERS AND CORPORATE INFORMATION
Capital & Regional plc Annual Report and Accounts for the year ended 30 December 2017
Stock Code: CAL capreg.com
122
Capital & Regional AR2017 Financials.indd 122 10/04/2018 16:06:09

25707.04 9 April 2018 10:09 AM proof 625707.04 9 April 2018 10:09 AM proof 6 25707.04 9 April 2018 10:09 AM proof 625707.04 9 April 2018 10:09 AM proof 6 25707.04 9 April 2018 10:09 AM proof 6
CAPITAL & REGIONAL PLC
22 Chapter StreetLondon SW1P 4NP
Tel: +44 (0)20 7932 8000CAPREG.COM
Cap
ital & R
egio
nal plc Annual Report and Accounts for the year ended 30 D
ecember 2017
Capital & Regional AR2017.indd 1 10/04/2018 16:03:02