Embed Size (px)
Citation preview

North-South 400 kV Interconnection Development Environmental Impact Statement Volume 3C
9-1
9 AIR – NOISE AND VIBRATION
9.1 INTRODUCTION
1 This chapter evaluates the noise and vibration impacts arising from the proposed 400 kV
overhead transmission line and associated development as set out in Chapter 6, Volume 3B of
this Environmental Impact Statement (EIS). That chapter describes the nature and extent of the
proposed development, including elements of the overhead line (OHL) design and the towers.
It provides a factual description, on a section by section basis, of the entire line route including
that portion within the Cavan Monaghan Study Area (CMSA). The proposed line route is
described in that chapter using townlands and tower numbers as a reference. The principal
construction works proposed as part of the proposed development are set out in Chapter 7,
Volume 3B of the EIS.
2 The information contained within this chapter is concerned with noise and vibration in the CMSA
as defined in Chapter 5, Volume 3B of the EIS. This evaluation deals with ‘audible’ noise and
vibration.
3 This study area for the evaluation considers an area in excess of 100m either side of the
proposed alignment. The evaluation will focuses on the construction, operation and
decommissioning aspects of the proposed development.
4 This evaluation was prepared in accordance with the Environmental Protection Agency’s (EPA)
Guidelines on the Information to be contained in Environmental Impact Statements (March
2002) and Advice Notes on Current Practice in the preparation of EIS (September 2003).
5 This chapter should be read in conjunction with Chapter 7, Volume 3B of the EIS and Chapter
13 in this volume of the EIS.
9.2 METHODOLOGY
6 This section of the EIS has been prepared in accordance with relevant EU and Irish Legislation
and guidance, including the requirements of Annex IV of the Environmental Impact Assessment
(EIA) Directive and in accordance with Schedule 6 of the Planning and Development
Regulations 2001 (as amended) and conforms to the relevant requirements as specified
therein. The scope of the evaluation is based on a review of legislation, guidance documents,
other EISs, feedback from public consultation, consultation with prescribed bodies, consultation
with An Bord Pleanála (the Board) and on a consideration of the likelihood for significant
impacts arising, having regard to the nature of the receiving environment and the nature and
extent of the proposed development.

North-South 400 kV Interconnection Development Environmental Impact Statement Volume 3C
9-2
7 The scoping opinion received from the Board (refer to Appendix 1.3, Volume 3B Appendices
of the EIS) identified the following issues as being relevant to this chapter of the EIS:
Description and assessment of the noise environment at construction and operational
phases, clearly measurable against the existing ambient noise environment.
8 A number of factors can influence the potential for noise impact from any proposed
development such as the duration of the works, noise characteristics and perception. The
impact and its effects is a subjective consideration. In order to minimise the impact on sensitive
receptors, the potential for noise and vibration impact has been evaluated, and a range of
mitigating measures, which will ensure that acceptable noise limits are met, have been
provided.
9 Extensive background noise measurements were recorded in 2013 at 24 locations along the
proposed line route, during daytime and night time. The locations of the noise monitoring
surveys on the line route are shown in Figures 9.1 - 9.4, Volume 3C Figures of the EIS. The
locations chosen are receptor locations near to the towers and OHLs along the proposed line
route to represent the quiet rural area. The results from the 2013 background noise survey are
provided in Tables 9.2 and 9.3.
10 All measurements were recorded in suitably calm conditions using appropriately calibrated Type
1 instrumentation which is in line with current appropriate standards and methodology (i.e. the
British Standard BS4142 Method of Rating Industrial Noise Affecting Mixed Residential and
Industrial Areas (1997)). The sound level meter and the acoustic calibrator were at the time of
measurement calibrated to the appropriate standards. No significant drift was noted during the
field calibration process
11 Potential for noise and vibration impact in both the construction and operational phases of the
proposed development have been evaluated and specific noise and vibration mitigation
measures have been presented (see Section 9.6).
12 Various standards and guideline documents covering the impact of external noise sources and
the introduction of industrial and construction noise have been used in this evaluation. The
standards and guidelines appropriate for this appraisal are the: World Health Organisation’s
(WHO) Guidelines for Community Noise (1999), BS5228 Code of Practice for Noise and
Vibration Control on Construction and Open Sites – Part 1: Noise (2009), and BS4142 Method
of Rating Industrial Noise Affecting Mixed Residential and Industrial Areas (1997).

North-South 400 kV Interconnection Development Environmental Impact Statement Volume 3C
9-3
9.3 CHARACTERISTICS OF THE PROPOSED DEVELOPMENT
13 The characteristics of the proposed development as relating to the potential for noise and
vibration impacts to sensitive receptors will occur in the construction and operational phases of
the proposed development. These potential impacts are considered in detail below (see
Section 9.5). A description of the proposed development and how it will be constructed is
presented in Chapters 6 and 7, Volume 3B of the EIS.
9.4 EXISTING ENVIRONMENT
14 The proposed development is located in a predominantly rural area. Tables 9.2 and 9.3 will
serve to quantify the typical noise levels encountered in the ambient environment. The values
in Tables 9.2 and 9.3 can be used to compare the predicted and measured noise levels
presented in this chapter. Ambient noise levels at the properties located close to the majority of
the route are characterised by rural environmental noise (i.e. wind in trees, agricultural activities
and livestock) and transportation noise on the local supply roads. However, there are sections
of the proposed route, near to busier roads, where transportation noise becomes the
predominant noise source.
9.4.1 Baseline Noise Survey
15 The measurement locations along the proposed line route represent individual properties or
clusters of residential properties along the route. The dB LA90 noise levels presented in Tables
9.2 and 9.3 represent the existing ‘background’ noise levels within the area. The levels
presented in terms of ‘dB LA90’ are defined as the background noise level at a location
according to BS4142 (Method of Rating Industrial Noise Affecting Mixed Residential and
Industrial Areas, British Standards Institute (1997)). A typical guide to environmental noise
levels is presented in Table 9.1.
16 The baseline noise evaluation surveys were carried out along the proposed line route in order to
establish expected noise levels for the operational phase. Baseline noise surveys were also
carried out under the existing 400 kV OHL at Bogganstown County Meath. The locations of the
noise monitoring surveys on the line route are shown in Figures 9.1- 9.4, Volume 3C Figures
of the EIS.
17 Attended noise measurements were recorded during day time and night time at each noise
monitoring location. The measurements taken were deemed to be representative of typical
noise levels in the vicinity of the noise monitoring locations. The equipment used during this
survey was a Bruel and Kjaer, 2250, Type 1 sound level meter.

North-South 400 kV Interconnection Development Environmental Impact Statement Volume 3C
9-4
Table 9.1: Guidance Note for Noise in Relation to Scheduled Activities, 2nd Edition,
EPA 2006
Typical Noise Levels in our Environment
Sound levels in decibels dB (A) Description of Activity
0 Absolute silence
25 Very quiet room
35 Rural night time setting with no wind
55 Day time, busy roadway 0.5km away
70 Busy Restaurant
85 Very busy pub, voice has to be raised to be heard
100 Disco or rock concert
120 Uncomfortably loud, conversation impossible
140 Noise causes pain in ears
18 All measurements were carried out in accordance with the International Organization for
Standardization’s (ISO) ISO 1996: Acoustics - Description and Measurement of Environmental
Noise. Measurements were made placing the microphone at a height of 1.5m above ground
level, were free field and were measured >2m from reflecting surfaces.
19 Before and after surveys, the measurement apparatus was checked and calibrated using a
calibrator to an accuracy of +/- 0.3dB. Weather conditions during all surveys conducted for the
purposes of this evaluation were in line with the conditions described within ISO 1996,
Acoustics Description and Measurements of Environmental Noise and the Environmental
Protection Agency 2003, Environmental Noise Guidance Document, as follows.
An average wind speed of less than 5m/ sec; and
No precipitation was present during the survey periods.
20 The measurement results were logged onto survey record sheets immediately following each
measurement and also stored in the instrument’s internal memory for subsequent analysis.
Notes were also taken in relation to the primary contributors to audible noise at each monitoring
location.
21 The environmental noise paramerters measured are definded below:
LAeq is the A-weighted equivalent continuous steady sound level during the
measurement period and effectively represents an average ambient noise value;
LAmax is the maximum A-weighted sound level measured during the measurement
period;

North-South 400 kV Interconnection Development Environmental Impact Statement Volume 3C
9-5
LAmin is the minimum A-weighted sound level measured during the measurement
period;
LA10 is the A-weighted sound level that is exceeded for 10% of the measurement
period and is used to quantify road traffic noise;
LA50 is the A-weighted sound level that is exceeded for 50% of the measurement
period and in this assessment is used to quantify noise from OHL; and
LA90 is the A-weighted sound level that is exceeded for 90% of the measurement
period and is used to quantify background noise level.
22 A-weighting is the process by which noise levels are corrected to account for the non-linearity of
human hearing. All noise levels quoted are relative to a sound pressure of 2x10⁻⁵ Pa.
23 No tangible vibration was observed at any of the noise survey locations evaluated as part of the
proposed development.
9.4.2 Noise Survey Results
24 The 2013 background noise levels recorded for both daytime and night time at each of the 24
locations are presented in Tables 9.2 and 9.3, with noise monitoring locations shown in Figures
9.1 - 9.4, Volume 3C Figures of the EIS. Background noise monitoring was carried out in 2013
at 24 of the 27 original noise monitoring locations. Locations 25, 26 and 27 from the 2009
planning application (Reference PL02.VA0006, subsequently withdrawn) were to cater for a
substation which is not part of this application for planning approval. The results from the 2009
surveys are presented in Appendix 9.1, Volume 3C Appendices of the EIS.
Table 9.2: 2013 Baseline Noise Levels Daytime
Baseline Noise Survey Results Daytime
Location Date Duration LAeq LAmax LAmin LA10 LA90
N1 13/08/2013 12:36 15:00 42.2 65.1 26.9 38.5 30.3
N2 09/09/2013 10:54 15:00 35.6 64.5 24.5 36.6 27.5
N3 13/08/2013 12:57 15:00 50.1 71.6 27.7 52.0 31.9
N4 09/09/2013 11:16 15:00 72.3 92.0 38.5 72.9 42.4
N5 09/09/2013 11:33 15:00 56.1 79.0 36.2 58.0 43.0
N6 09/09/2013 11:52 15:00 49.9 76.7 33.6 45.0 36.6
N7 09/09/2013 12:16 15:00 48.9 73.1 27.5 49.9 32.0

North-South 400 kV Interconnection Development Environmental Impact Statement Volume 3C
9-6
Baseline Noise Survey Results Daytime
Location Date Duration LAeq LAmax LAmin LA10 LA90
N8 13/08/2013 13:20 15:00 55.9 77.7 24.3 51.7 26.8
N9 09/09/2013 12:38 15:00 67.2 87.5 28.7 67.4 32.4
N10 13/08/2013 13:47 15:00 41.4 70.0 28.7 44.0 33.2
N11 09/09/2013 13:04 15:00 60.1 81.5 28.2 59.3 33.7
N12 13/08/2013 14:11 15:00 67.1 92.0 27.1 61.1 30.4
N13 09/09/2013 13:26 15:00 64.4 88.8 28.8 57.1 33.7
N14 13/08/2013 14:37 15:00 59.0 84.0 31.7 47.4 34.1
N15 09/09/2013 13:50 15:00 57.5 83.7 25.2 49.8 30.0
N16 09/09/2013 14:15 15:00 58.0 71.7 38.9 61.7 46.2
N17 13/08/2013 15:00 15:00 63.4 85.0 26.9 59.3 31.7
N18 13/08/2013 15:26 15:00 51.0 73.9 23.4 42.4 25.3
N19 09/09/2013 14:50 15:00 41.8 58.5 35.0 43.6 37.5
N20 09/09/2013 15:09 15:00 67.6 87.9 35.0 67.2 39.5
N21 13/08/2013 15:52 15:00 50.7 75.5 24.0 38.1 29.1
N22 09/09/2013 15:35 15:00 70.0 96.5 33.0 69.6 42.1
N23 13/08/2013 16:17 15:00 50.7 75.5 24.0 38.1 29.1
N24 09/09/2013 16:01 15:00 44.2 70.1 30.4 42.2 32.2
Table 9.3: 2013 Baseline Noise Levels Night Time
Baseline Noise Survey Results Night Time
Location Date Duration LAeq LAmax LAmin LA10 LA90
N1 13/08/2013 23:09 10:00 36.9 57.5 22.0 33.8 24.3
N2 09/09/2013 23:05 10:00 28.3 52.2 23.5 29.7 25.2
N3 13/08/2013 23:34 10:00 57.0 85.2 19.2 35.8 22.7
N4 09/09/2013 23:26 10:00 66.2 88.5 24.8 62.4 33.9
N5 09/09/2013 23:44 10:00 45.2 60.4 25.2 49.0 32.1
N6 10/09/2013 00:03 10:00 36.4 51.5 26.3 39.1 30.7
N7 10/09/2013 00:26 10:00 51.1 81.1 20.1 29.0 22.7
N8 13/08/2013 23:55 10:00 55.5 80.5 18.1 33.0 19.6

North-South 400 kV Interconnection Development Environmental Impact Statement Volume 3C
9-7
Baseline Noise Survey Results Night Time
Location Date Duration LAeq LAmax LAmin LA10 LA90
N9 10/09/2013 00:50 10:00 59.4 82.3 23.0 45.4 25.0
N10 14/08/2013 00:15 10:00 21.1 41.8 17.3 22.1 17.9
N11 10/09/2013 01:17 10:00 52.8 75.4 19.8 45.1 21.9
N12 14/08/2013 00:35 10:00 60.7 87.1 33.1 52.2 35.0
N13 10/09/2013 01:38 10:00 61.2 86.2 20.4 44.9 22.8
N14 14/08/2013 00:58 10:00 52.8 80.5 31.3 41.2 32.0
N15 10/09/2013 02:02 10:00 26.6 52.1 21.0 27.1 22.5
N16 10/09/2013 02:22 10:00 26.2 46.6 20.6 27.6 22.2
N17 14/08/2013 01:23 10:00 38.0 50.0 32.8 40.3 35.2
N18 14/08/2013 01:47 10:00 45.9 73.6 19.2 33.9 21.4
N19 10/09/2013 02:52 10:00 55.5 84.0 23.4 35.3 26.3
N20 10/09/2013 03:14 10:00 58.2 85.2 24.1 43.9 26.7
N21 14/08/2013 02:10 10:00 24.3 44.2 16.1 26.6 16.6
N22 10/09/2013 03:41 10:00 27.4 49.0 19.1 30.3 21.0
N23 14/08/2013 02:30 10:00 33.5 68.1 16.0 23.8 16.5
N24 10/09/2013 04:09 10:00 38.7 61.8 24.7 41.3 28.4
25 Noise Monitoring Location N1: This location is situated in the townland of Lemgare, near the
Armagh Border. Distant road traffic noise, occasional passing traffic and cattle in the adjacent
field were the main noise sources. A barking dog was audible throughout the night time survey.
26 Noise Monitoring Location N2: This location is situated in the townland of Lisdrumgormly.
Infrequent passing traffic, distant traffic noise and birdsong were the main noise sources at N2.
A con saw was in use at a distant house during the daytime survey.
27 Noise Monitoring Location N3: This location is situated in the townland of Tassan. A tractor
working in the adjacent field (during daytime), occasional passing traffic and birdsong were the
main noise sources at this location.
28 Noise Monitoring Location N4: This location is situated in the townland of Cashel with the
main road (N2) nearby. Busy road traffic in the nearby N2 was the main noise source at this
location. A tractor working in a nearby field was also audible during the daytime survey.

North-South 400 kV Interconnection Development Environmental Impact Statement Volume 3C
9-8
29 Noise Monitoring Location N5: This location is situated on the boundary of the townlands of
Annagh and Cashel. Road traffic noise was dominant at this location. Aircraft overhead were
also audible during the daytime survey.
30 Noise Monitoring Location N6: This location is on the boundary of the townlands of Annagh
and Carrickanure. Distant road traffic noise and occasional passing local traffic were the main
noise sources at this location. Cattle in the adjacent field were also audible.
31 Noise Monitoring Location N7: This location is situated on the boundary of the townlands of
Lennan and Drumaroosk. Passing local traffic and agricultural machinery at work in the fields
(during daytime) were the main noise sources at this location.
32 Noise Monitoring Location N8: This location is situated in the townland of Cornanure
(Monaghan By). Cattle in the fields, passing traffic and foliage noise were the main noise
sources at N8.
33 Noise Monitoring Location N9: This location is situated in the townland of Terrygreeghan.
Distant agricultural plant at work in fields during daytime and passing local road traffic were the
main noise sources at this location.
34 Noise Monitoring Location N10: This location is situated in the townland of Drumguillew
Lower. A tractor working on an adjoining hillside during daytime, passing traffic and distant
traffic noise were the main noise sources at this location.
35 Noise Monitoring Location N11: This location is situated on the boundary of the townlands of
Greagh and Brackly. Passing traffic on the R180 was the main noise source at this location.
Local road traffic and cattle in the fields were also audible.
36 Noise Monitoring Location N12: This location is situated in the townland of Brackly. Passing
local traffic and distant road traffic noise were the main noise sources at N12. At night, a distant
ventilation fan was audible in one of the adjacent farms, this was not audible during the day.
37 Noise Monitoring Location N13: This location is situated on the boundary of the townlands of
Drumillard and Tooa. Passing local traffic and traffic on the nearby R181 were the main noise
sources at this location.
38 Noise Monitoring Location N14: This location is situated on the boundary of the townlands of
Tullyglass and Cornasassonagh. Passing traffic, birdsong and foliage noise were the main
noise sources at this location.

North-South 400 kV Interconnection Development Environmental Impact Statement Volume 3C
9-9
39 Noise Monitoring Location N15: This location is situated in the townland of Ummearfree.
Horses in the adjacent field, passing traffic and foliage noise were the main noise sources at
this location.
40 Noise Monitoring Location N16: This location is situated in the townland of Sreenty. A tractor,
hedge cutting in a nearby field and infrequent passing traffic were the main noise sources at this
location. There was no hedge cutting during the night time survey.
41 Noise Monitoring Location N17: This location is situated in the townland of Corvally on the
Carrickmacross to Shercock Road (R178). Passing local traffic, agricultural traffic and foliage
noise were the main noise sources at this location.
42 Noise Monitoring Location N18: This location is situated on the boundary of the townlands of
Raferagh and Cornnalaragh. Passing road traffic, birdsong and foliage noise were the main
noise sources at N18.
43 Noise Monitoring Location N19: This location is situated in the townland of Scalkill. Distant
road traffic, cattle in the adjacent field and foliage noise were the main noise sources at this
location.
44 Noise Monitoring Location N20: This location is situated in the townland of Lisagoan on the
main Kingscourt to Shercock Road (R162). Passing traffic on the R162, birdsong and foliage
noise were the main noise sources at this location.
45 Noise Monitoring Location N21: This location is situated in the townland of Corlea (Clankee
By). Passing local traffic, agricultural traffic during the day and cattle in the fields were the main
noise sources at this location.
46 Noise Monitoring Location N22: This location is situated on the boundary of the townlands of
Dingin and Corrycholman, on the main Kingscourt to Bailieborough Road (R165). Passing
traffic on the R165 and a stereo in use in the driveway of a nearby house during the steam
cleaning of a car, were the main daytime noise sources at this location. At night, passing traffic
and foliage noise were audible.
47 Noise Monitoring Location N23: This location is situated in the townland of Cordoagh (ED
Enniskeen) at a local crossroads known as the location of the ’Fair of Muff‘. Distant road traffic
noise, cattle, foliage noise and a barking dog were the main noise sources at location N23.

North-South 400 kV Interconnection Development Environmental Impact Statement Volume 3C
9-10
48 Noise Monitoring Location N24: This location is situated in the townland of Clonturkan.
Cattle in the adjacent field along with foliage noise and infrequent passing traffic were the main
noise sources at this location.
49 There is some variation in background noise levels compared to June 2009 levels (shown in
Appendix 9.1, Volume 3C Appendices of the EIS) as these were recorded in June 2009 and
more recent noise levels were recorded in August and September 2013. The background noise
levels recorded most recently in 2013 are considered to be similar marginally but lower than
those measured previously. However, these recent measurements show no significant
changes in the dominant noise sources in the existing noise environment. Background noise
levels are influenced by constant traffic flows, agricultural activity, other significant noise
sources in the area, and weather conditions.
9.5 POTENTIAL IMPACTS
50 During the preparation of this EIS, an extensive evaluation of the likely significant effects of all
aspects of the proposed development has been undertaken.
51 The noise and vibration characteristics of the proposed development will be divided between
the construction and the operational phases of the development. The majority of impacts will
occur during the construction phase of the development.
52 The construction phase will involve excavation, piling (if required) and general construction
activities and is discussed further below. The construction details for the proposed
development are set out in Chapter 7, Volume 3B of the EIS. The operational phase will not
have any vibration impacts and will only have the potential for minimal noise impact, as
described later in this chapter.
9.5.1 Do Nothing
53 In the ‘Do Nothing’ Scenario, the proposed development will not proceed. In this scenario the
baseline noise and vibration climate, save for the potential for general development outside of
the scope of this proposed development, will remain unchanged.
9.5.2 Construction Phase
54 The construction phase of the proposed development has the potential to temporarily increase
noise levels at noise sensitive locations surrounding the proposed alignment i.e. at the
construction phase of the towers. The nearest noise sensitive locations are located at least
50m from proposed tower locations.

North-South 400 kV Interconnection Development Environmental Impact Statement Volume 3C
9-11
55 Noise sensitive locations as referred to in this evaluation are comprised of houses, schools,
hospitals, places of worship, heritage buildings, special habitats, amenity areas in common use
and designated quiet areas. There are none of these sensitive receptors located within 50m of
a proposed tower location.
56 Impact from the construction phase will depend on the number and types of equipment used
during the construction of the proposed development. Construction noise sources will result in
a temporary impact on the noise climate in the area. The temporary and transient nature of the
construction phase on this type of development should not give rise to excessive construction
noise levels. The list of machinery as detailed in Table 9.4 will form the plant which will be in
operation during the construction phase.
Table 9.4: Construction Phase Plant Noise Levels
CONSTRUCTION PHASE
BS5228 Calculations Estimated Construction Noise Levels at Varying Distances
LAeq,1hour
Machinery 50m 75m 100m
Wheeled loader 65 60 57
Winch 56 51 48
Line tensioner 56 51 48
Road lorry pulling up 49 44 41
Tracked excavator 65 60 57
Vibratory hammer 61 56 53
Tracked crane moving 66 61 58
Support crane moving 57 52 49
Lorry unloading 63 58 55
Diesel generator 54 49 46
Continuous flight auger 56 51 48
Combined Level LAeq,1hour 71dB 67dB 64dB
57 Predicted noise levels have been estimated using the methodology described in BS: 5228:
Noise and control on construction and open sites, (1997). Predictions are based on typical
equipment used during various construction phases of the proposed development. Predictions
are based on a LAeq 1hour value with all machinery listed in Table 9.4 operating for a continuous
period of 1 hour.
58 This may be considered a worst case scenario as this machinery will not operate
simultaneously. Additionally, calculations are based on minimum distances between site
activities and the nearest noise sensitive locations, with no allowance for screening of
hedgerows, trees or buildings in between.
North-South 400 kV Interconnection Development Environmental Impact Statement Volume 3C
9-12
59 In Ireland, there are no statutory guidelines relating to noise limits for construction activities.
These are generally controlled by local authorities and commonly refer to limiting working hours
to prevent a noise nuisance. The National Roads Authority (NRA) Guidelines for the Treatment
of Noise and Vibration in National Road Schemes (2004) outlines recommended noise levels
for construction noise during the construction of national road schemes.
60 Although these NRA’s guidelines refer to road projects, they have been developed in line with
typical construction noise limits on construction projects used previously in Ireland. The limits
outlined represent a reasonable compromise between the practical limitations during a
construction project and the need to ensure an acceptable ambient noise level for local
residents. As a result, these limits have become the most acceptable standard for construction
noise limits for EIS assessments in Ireland to date. The NRA does note, however, that where
pre-existing noise levels are particularly low, more stringent levels may be more appropriate.
Table 9.5 details these recommended limits.
61 The predicted values are a worst case evaluation, and as such the impact is likely to be
moderate, with regard to the nearest noise sensitive locations. The evaluation is considered
worst case as the temporary nature of the construction period and the variety of machinery
used should ensure that no construction activity is operational for long periods. Similarly, all the
plant listed in Table 9.4, will not be in use at the same stage of construction, as it is a phased
process. Hence, the noise impact to be expected at the nearest noise sensitive receptor would
be significantly less than the worst case scenario described in Table 9.4. This construction
phase will therefore result in a moderate temporary, transient noise impact.
62 There is a possibility that a small amount of localised rock breaking may be required if rock is
encountered close to the surface during tower construction. In the unlikely event, that the need
for rock breaking arises the process will be carried out so as to achieve adherence to the
guideline noise limits as presented in Table 9.5. If required, temporary noise barriers as
outlined in Section 9.6 will be used to achieve these guideline noise level values.

North-South 400 kV Interconnection Development Environmental Impact Statement Volume 3C
9-13
Table 9.5: Typical Maximum Permissible Noise Levels at the Façade of Dwellings
during Construction Activities
Day & Times LAeq (1hr) dB LAmaxdB
Monday – Friday (07:00 to 19:00 hrs) 70 80
Monday – Friday (19:00 to 22:00 hrs) 601 651
Saturday (08:00 to 16:30 hrs) 65 75
Sundays and Bank Holidays (08:00 to 16:30 hrs) 601 651
1 Construction activities at these times, other than that required in respect of emergency works, will normally require the explicit permission of the relevant local authority. Source: NRA Guidelines for the Treatment of Noise and Vibration in National Road Schemes 2004.
9.5.2.1 Construction Phase Traffic Noise Impact
63 The likely Heavy Goods Vehicles (HGV) noise impact due to the expected traffic flows has been
calculated using the Haul Road Method detailed in BS5228 Noise and Control on Construction
and Open Sites, (1997). Considering a standard tower construction site, as detailed in Chapter
7, Volume 3B of the EIS, a maximum frequency of 9 vehicle trips per hour (Q) and a minimum
distance of at least 5m (v) from the haul road to any nearby property, and a speed of 30km/h
(V) the calculated noise impact is as follows:
Level = Average SWL - 33 + 10 log Q - 10 log V - 10 log d
+ 98 – 33 + 10 log 9 – 10 log 30 – 10 log 5
= 52.8dB LAeq, 1h
64 This is not predicted to cause any significant noise impact to the nearest sensitive receptor at a
distance of 5m.
65 Considering an angle tower construction site, as detailed in Chapter 7, Volume 3B of the EIS, a
maximum frequency of 12 vehicle trips per hour (Q) and a minimum distance of at least 5m (v)
from the haul road to any nearby property, and a speed of 30km/h (V) the calculated noise
impact is as follows:
Level = Average SWL - 33 + 10 log Q - 10 log V - 10 log d
+ 98 – 33 + 10 log 12 – 10 log 30 – 10 log 5
= 54.0dB LAeq, 1h
66 This is not predicted to cause any significant noise impact to the nearest sensitive receptor at a
distance of 5m. A distance of 5m has been assumed in these calculations and is presented as
a practical assumption for distance from receptor to haul road.
North-South 400 kV Interconnection Development Environmental Impact Statement Volume 3C
9-14
9.5.2.2 Supply Vehicle Movements
67 An increase of 3dB (A) on existing traffic noise is required before it may be noticed by the public
(example ref: UK Department for Transport Guidance on the Methodology for Multi-Modal
Studies (DETR 2000), paragraph 4.3.5). With reference to the UK Department of Transport
Welsh Office Calculation of Road Traffic Noise (CRTN 1988) and if all other factors remain
equal, this would represent an increase in traffic flow of 100%.
68 The UK Highways Agency Design Manual for Roads and Bridges document (DMRB 2008)
suggests that a 1dB increase in traffic might be perceptible, although it acknowledges that other
factors in visual perception and magnitude of traffic levels before increases are relevant. Again
with reference to CRTN, a 1dB increase in noise level is approximately equivalent to a traffic
number increase of 25%. It is unlikely that the introduction of a small number of additional
vehicles on the local supply roads will be sufficient to present a 25% increase in traffic flows.
As such this element of the proposed development is not expected to cause significant noise
impact. In instances of tree felling for example where supply traffic would use local roads, this
would be very short term and transient and would not be expected to cause any significant
noise impact. Any such activity will be carried out in adherence to the requirements of the
Construction Environment Management Plan (CEMP).
9.5.2.3 Construction Material Storage Yard Impacts
69 The construction material storage yard element of the proposed development will be a
temporary ESB yard located south-east of Carrickmacross, County Monaghan. The site is
located immediately adjacent to the southern side of the N2 National Primary Road. This
ensures appropriate accessibility to all parts of the proposed transmission line.
70 The construction material storage yard has a history of temporary use for construction activities,
being a former construction yard facility associated with the construction of the N2 National
Primary Road. It will provide for the secure storage of all materials associated with the
construction of the proposed development, as well as staff car parking, temporary site offices
and welfare facilities.
71 Noise impacts related to the proposed construction material storage yard are divided into
construction phase impacts and operational phase impacts. These have been assessed as per
the OHL construction phase impacts using the same guidance documents and methodologies
as outlined in Section 9.5.2.
72 Baseline noise surveys were carried out at the two closest residential dwellings to the proposed
compound location as per the guideline requirements. NSL1 is located approximately 215m
north-west of the proposed site entrance on the L4700 local road. NSL2 is located

North-Sout
a
l
s
T
73 T
r
a
74 W
p
th 400 kV Interc
approximate
locations are
shown in Tab
Table 9.6:
Location
NSL1
NSL2
F
The noise cl
road and by
audible.
With regard
predicted no
connection Deve
ly 210m sou
e depicted on
ble 9.6.
Baseline
Date/Tim
20/01/14 13
20/01/14 14
20/01/14 14
20/01/14 14
Figure 9.1:
imate at NSL
traffic on the
to impact fr
oise levels h
elopment
uth-east of th
n Figure 9.1
e Noise Mon
me Du
3:56
4:12
4:30
4:46
Construc
L1 and NSL2
e N2 Nationa
rom the con
have been c
9-15
he proposed
. The result
nitoring Res
uration LA
15:00 64
15:00 64
15:00 63
15:00 66
ction Compo
2 was domin
al Primary ro
nstruction of
calculated us
site entranc
s of the nois
sults at Con
Aeq LAmax
4.6 84.1
4.5 84.6
3.9 87.5
6.3 85.4
ound Noise
nated by pas
oad. Birdson
the constru
sing the met
Envi
ce on the L47
se monitoring
struction C
LAmin LA
33.9 65
28.9 64
34.7 62
42.3 67
Monitoring
sing road tra
ng and aircra
ction materi
thodology de
ronmental Impa
700 local roa
g at these loc
ompound
A10 LA90
5.8 42.8
4.2 40.7
2.6 43.1
7.7 46.3
g Locations
affic on the L
aft overhead
al storage y
escribed in
act Statement Volume 3C
ad. These
cations are
L4700 local
were also
yard noise,
the British

North-South 400 kV Interconnection Development Environmental Impact Statement Volume 3C
9-16
Standard (BS) BS: 5228: Noise and control on construction and open sites, (1997). Predictions
are based on typical equipment used during various construction stages of the proposed
development. Predictions are based on a LAeq 1hour value with all machinery listed in Table 9.7
operating for a continuous period of 1 hour.
Table 9.7: Predicted Noise Levels from Construction of the Construction Material
Storage Yard
BS5228 Calculations Construction Noise Levels at Varying Distances LAeq 1
hour
Plant
44m 52m 117m 329m
Golf Course NSL2 NSL1 Nuremore Hotel
Dump Truck (2) 63 48 39 41
Roller/ Grader(2) 60 45 36 38
Tracked Excavator (2) 61 46 37 39
Combined Level LAeq 1hour 66 51 43 44
75 The construction phase noise impacts related to the construction material storage yard will be
short lived over a number of weeks and are not expected to cause significant impact when
assessed against the existing noise levels in the area, as shown in Table 9.5.
76 The predicted noise impacts for the use of the construction material storage yard during OHL
construction are evaluated by the same methodology and presented in Table 9.8. It is
assumed in this evaluation that a 2m high solid wooden fence with no gaps will be constructed
on three sides of the construction material storage yard. This solid 2m barrier will be affixed to
the inside of the proposed 2.6m palisade fence and does not need to be a standalone structure.
This fence does not need to run alongside the N2. This fence serves to mitigate the noise from
the use of the compound, to NSL1 and NSL2, as well as to the golf course across the L4700
Local Road.
Table 9.8: Predicted Noise Levels from Use of the Construction Material Storage
Yard
BS5228 Calculations Construction Noise Levels at Varying Distances LAeq 1 hour
Plant
44m 52m 117m 329m
Golf Course NSL2 NSL1 Nuremore Hotel
Telescopic handler 43 42 33 22
Road Lorry 42 41 32 21
Combined Level LAeq 1hour 45 45 36 25

North-South 400 kV Interconnection Development Environmental Impact Statement Volume 3C
9-17
77 The predicted noise levels from the operation of the proposed construction material storage
yard are within the guidance noise limits and are not expected to cause a significant noise
impact to the nearest sensitive receptors.
78 The predicted road traffic increases associated with the proposed construction material storage
yard have been evaluated using the UK Department of Transport Welsh Office Calculation of
Road Traffic Noise - (CRTN 1988) guidance document. The predicted noise impact arising
from road traffic associated with the construction material storage yard is predicted to elevate
noise levels at NSL1 by 1.3dB and at NSL2 by 2.4dB respectively for the duration of the OHL
construction. This will not cause any significant noise impact.
9.5.2.4 Construction Phase Vibration Impacts
79 There is potential for ground vibration due to the construction phase works, this will mainly be
derived from excavation and from piling works (in the unlikely event this is required) at some
tower locations. Vibration may be defined as regularly repeated movement of a physical object
about a fixed point. The magnitude of vibration is expressed in terms of Peak Particle Velocity
(PPV) expressed in millimetres per second (mm/s).
80 Common practice in Ireland has been to use guidance from internationally recognised
standards. Vibration standards come in two varieties, those dealing with human comfort and
those dealing with cosmetic or structural damage to buildings. In both instances, the magnitude
of vibration is expressed in terms of PPV in mm/s.
81 In order to ensure that there is no potential for vibration damage during construction, the NRA
recommends that vibration from road construction activities be limited to the values set out in
Table 9.9. These values have been derived through consideration of the various international
standards, compliance with this guidance should ensure that there is little to no risk of even
cosmetic damage to buildings.
82 These limits will be adhered to at all times during the construction phase of the proposed
development. There is no vibration impact predicted for the operational phase of the proposed
development.
Table 9.9: Allowable Vibration during Road Construction in Order to Minimise the
Risk of Building Damage
Allowable vibration velocity (Peak Particle Velocity) at the closest part of any sensitive property to the source of vibration, at a frequency of:
Less than 10Hz 10 to 50Hz 50 to 100Hz and above
8mm/s 12.5mm/s 20mm/s

North-South 400 kV Interconnection Development Environmental Impact Statement Volume 3C
9-18
9.5.3 Operational Phase
83 There will be no significant operational phase vibration impacts associated with the proposed
development. There will be occasional requirement in the operational phase for tree cutting /
lopping to protect the OHL. This will be carried out during day time hours only. This will be
localised, short term and temporary and is unlikely to cause any significant noise impact.
Following construction the transmission line will be subject to an annual survey by helicopter
patrol. Helicopter inspections will be announced in advance in local newspaper and the Famers
Journal. This is not expected to cause any significant noise impact due to the short term and
transient nature of the annual survey.
84 Operational phase noise from the proposed development is characterised by the following types
of noise:
Corona Discharge Noise;
Continuous Operational Noise;
Aeolian Noise; and
Gap Sparking.
85 These aspects are each evaluated in detail in the sections below.
9.5.3.1 Corona Discharge Noise
86 Corona noise is the predominant noise audible from OHLs and can occur on transmission lines
carrying higher voltages. Most modern transmission lines and substations are designed to
reduce the magnitude of the electric field surrounding the line conductors below the air
breakdown value. Corona discharge typically occurs where a sharp point or edge is present,
either on the conductor or the tower coupling. Occasionally a small sharp point can be found on
a line or on nearby hardware that will result in a corona discharge.
87 Such discharges are often more active during the increased humidity conditions provided by fog
or light rain. Water drops impinging or collecting on the conductors produce a large number of
corona discharges, each of them creating a burst of noise. In dry conditions, the conductors
usually operate below the corona inception level, and much less corona sources are present.
88 Corona noise comprises two sound components; one is irregular (random noise) sound and the
other is the pure sound (corona hum noise) of buzzing. The random sound has a wide
frequency band because the impulsive sounds caused by corona discharge overlap randomly.

North-South 400 kV Interconnection Development Environmental Impact Statement Volume 3C
9-19
89 The corona hum noise results from the excitation of ion groups, which are generated from
corona discharge, caused by the electric field surrounding the conductors. The predominant
frequency of the corona hum noise is double the commercial frequency (100Hz is the frequency
of the corona hum noise in this instance).
90 The level of operational noise from OHLs will vary depending upon the environmental
conditions, the locality and a number of other factors including the distance to ground and
voltage. The noise derived from this discharge is typically a short burst of random ‘crackling’.
91 Due to these factors, an exact level of noise impact cannot be definitively predicted, however
Figure 9.2 depicts the noise in wet conditions at distances from 0m to 100m from the line. It
may be the case, that under certain circumstances, the background level may be exceeded by
more than +10 dB. However due to the unpredictability of corona noise derived from OHLs and
very short limited duration of such discharges (typically peak levels of a duration of less than 1
second), the overall impact when considered over an hour (reference BS4142 daytime
reference time period) can be deemed minimal.
92 The Electric Power Research Institute’s (EPRI) AC Transmission Line Reference Book – 200
kV and Above (Third Edition, 2005) provides a method for predicting the noise level at varying
distances from the line under varying climatic conditions. The document provides the noise
level during rainfall in terms of dB LA50 which represents the A-weighted sound pressure level
(in decibels, dB) obtained using ‘Fast’ time-weighting that is exceeded for 50% of the given time
interval.
93 A noise prediction calculation has been carried out with reference to the proposed line for
inclusion within this evaluation. The results of this calculation are presented in Figure 9.2
which illustrate the noise level at varying distances from the existing 400 kV OHL. The noise
levels presented have been calculated using the Bonneville Power Administration Method
(BPA) and represent the noise level during normal rainfall.
94 Figure 9.2 and Table 9.10 show the predicted L50 dB (A) level (A-weighted sound level that is
exceeded for 50% of the measurement period) and L10 dB A level (A-weighted sound level that
is exceeded for 10% of the measurement period). These levels are predicted using the Electric
Power Research Institute (EPRI) calculation methodology. These noise indicators represent
the predicted corona noise levels as a function of lateral distance from the centre of the
proposed line route during wet weather conditions.
95 Corona is rarely a problem at distances beyond 50m from a transmission line. The level of
audible corona at any time is dependent on the prevailing weather conditions. The dielectric
strength of air is lower in wet weather than in dry weather. Thus the voltage stress at a

North-South 400 kV Interconnection Development Environmental Impact Statement Volume 3C
9-20
conductor surface does not have to reach such high levels in wet weather for corona noise to
become audible.
96 Corona noise attains higher levels and may become audible in wet weather, when large
numbers of corona sources form as water droplets on the conductors. However, on such
occasions the background noise level of rainfall and wind tend to mask the noise from the line.
People tend to find noise from a high voltage line to be more noticeable during periods of light
rain, snow or fog, when they are more likely to be outdoors or to have windows open, and when
the background noise is generally lower. In fair weather, corona sources are sufficiently few in
number that this noise is unlikely to cause complaint due to the very short term nature of the
source (less than 1 second).
Figure 9.2: 400 kV Single Circuit Line Noise Levels in Wet Conditions
97 A useful guideline referring specifically to power lines is from the New York Public Service
Commission (NYPSC) following a public enquiry in 1978. This specified an L50 rain level limit of
52dB (A) at the edge of a right of way. This L50 noise level was based on an indoor maximum
permitted noise level of 35dB (A). This was in the bedroom of a house at the edge of a right of
way. It was assumed that the noise attenuation of a partly closed window was 17dB (A). An
examination of the background noise measurements and the predicted corona noise levels are
unlikely to cause annoyance. The predicted corona noise emitted from the proposed 400 kV
transmission line (measured at 50m from the line) is given in Table 9.10.
0
5
10
15
20
25
30
35
40
45
50
55
60
65
-100 -50 0 50 100
Dist (m)
No
ise
(dB
)
L50 Rain EPRI (dbA)
L10 Rain EPRI (dbA)

North-South 400 kV Interconnection Development Environmental Impact Statement Volume 3C
9-21
Table 9.10: Summary of Noise Values
Circuit Type
L50 Rain EPRI
(dBA) L10 Rain EPRI
(dBA)
Fair Weather Range
(dBA)
400 kV Double Circuit 48.0 55.4 21.9 41.4
400 kV Single Circuit 46.7 52.7 20.9 40.2
Transposition Towers 46.7 52.7 20.9 40.2
98 As illustrated in Table 9.10, the L50 value during rain for both the double and single circuit line,
reaches a maximum of 48dB (A) L50 at 50m from the centre of the proposed line route. This is
4dB (A) below the 52dB (A) L50 NYPSC guideline limit for OHL noise in rainy conditions. The
maximum fair weather value of 41.4dB (A) is significantly lower than the 52dB (A) guideline limit
value. Based on this comparison the proposed 400 kV transmission line will not cause noise
annoyance to nearby residents as there are no residential receptors located within 50m of any
proposed tower locations.
9.5.3.2 Continuous Operational Noise
99 Due to the voltages associated with 400 kV OHLs, continuous operational noise may be audible
but not dominant over the ambient noise levels. A noise survey at an existing 400 kV OHL has
been conducted at Bogganstown, County Meath near the existing Woodland Substation. This
line runs to the west of Woodland Substation on a route south of the village of Summerhill,
County Meath. A noise survey was also undertaken at the existing 400 kV substation at
Woodland, County Meath. In these surveys, the substation / tower noise was audible but not
dominant over the ambient noise levels.
100 The measurement results are presented in terms of ‘dB LAeq,’ which is representative of an
average of the energy associated with the noise at a location over a given time interval. The
levels in terms of ‘dB LA90’ are also presented and represent the level exceeded for 90% of the
given time interval. The results are presented in Tables 9.11 and 9.12.
Table 9.11: Baseline Assessment directly under Existing 400 kV Line at Bogganstown
Locations Date Time Duration LAeq LAMin LAMax LA10 LA50 LA90
Under 400 kV Line at
Bogganstown
07-Nov-13
14:46:46 5:00.0 47.6 38.1 99.4 50.6 44.3 39.8
Under 400 kV Line at
Bogganstown
07-Nov-13
15:05:44 5:00.0 45.0 37.9 96.1 47.1 43.6 40.6
Under 400 kV Line at
Bogganstown
07-Nov-13
15:21:50 5:00.0 42.9 36.4 89.5 45.7 41.2 38.5
Average 45.1 37.5 95.0 47.8 43.0 39.6
North-South 400 kV Interconnection Development Environmental Impact Statement Volume 3C
9-22
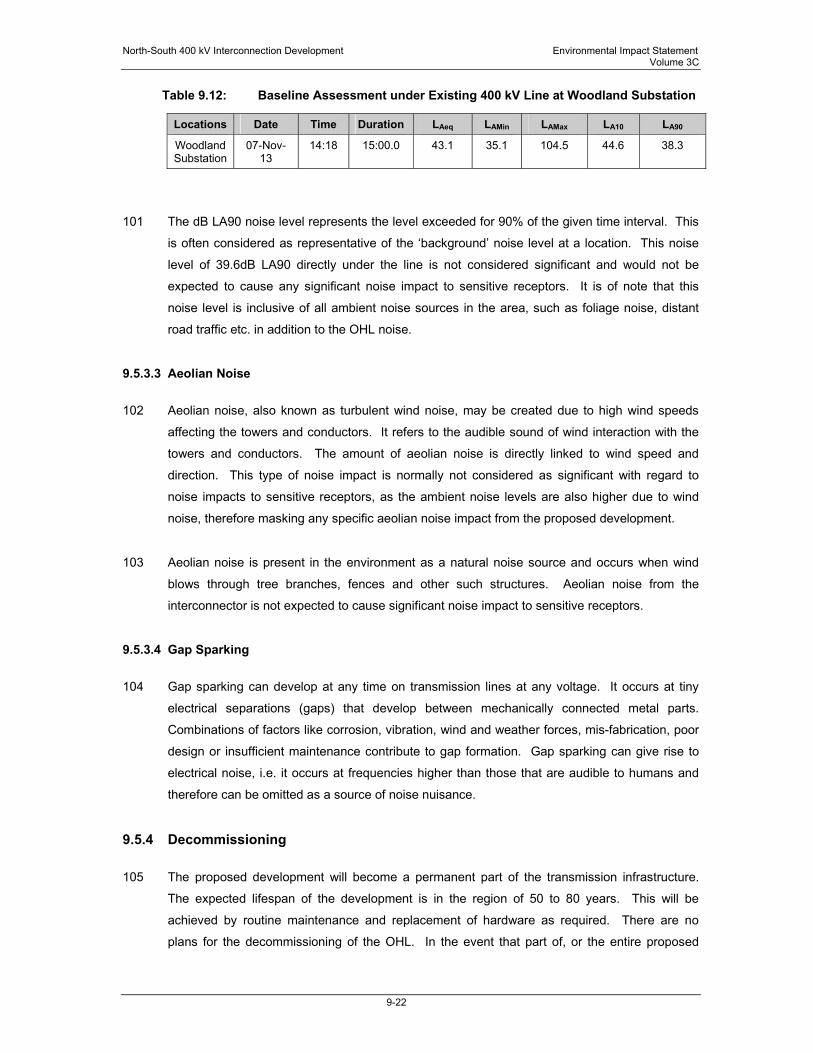
Table 9.12: Baseline Assessment under Existing 400 kV Line at Woodland Substation
Locations Date Time Duration LAeq LAMin LAMax LA10 LA90
Woodland Substation
07-Nov-13
14:18 15:00.0 43.1 35.1 104.5 44.6 38.3
101 The dB LA90 noise level represents the level exceeded for 90% of the given time interval. This
is often considered as representative of the ‘background’ noise level at a location. This noise
level of 39.6dB LA90 directly under the line is not considered significant and would not be
expected to cause any significant noise impact to sensitive receptors. It is of note that this
noise level is inclusive of all ambient noise sources in the area, such as foliage noise, distant
road traffic etc. in addition to the OHL noise.
9.5.3.3 Aeolian Noise
102 Aeolian noise, also known as turbulent wind noise, may be created due to high wind speeds
affecting the towers and conductors. It refers to the audible sound of wind interaction with the
towers and conductors. The amount of aeolian noise is directly linked to wind speed and
direction. This type of noise impact is normally not considered as significant with regard to
noise impacts to sensitive receptors, as the ambient noise levels are also higher due to wind
noise, therefore masking any specific aeolian noise impact from the proposed development.
103 Aeolian noise is present in the environment as a natural noise source and occurs when wind
blows through tree branches, fences and other such structures. Aeolian noise from the
interconnector is not expected to cause significant noise impact to sensitive receptors.
9.5.3.4 Gap Sparking
104 Gap sparking can develop at any time on transmission lines at any voltage. It occurs at tiny
electrical separations (gaps) that develop between mechanically connected metal parts.
Combinations of factors like corrosion, vibration, wind and weather forces, mis-fabrication, poor
design or insufficient maintenance contribute to gap formation. Gap sparking can give rise to
electrical noise, i.e. it occurs at frequencies higher than those that are audible to humans and
therefore can be omitted as a source of noise nuisance.
9.5.4 Decommissioning
105 The proposed development will become a permanent part of the transmission infrastructure.
The expected lifespan of the development is in the region of 50 to 80 years. This will be
achieved by routine maintenance and replacement of hardware as required. There are no
plans for the decommissioning of the OHL. In the event that part of, or the entire proposed
North-South 400 kV Interconnection Development Environmental Impact Statement Volume 3C
9-23
infrastructure is to be decommissioned, all towers, equipment and material to be
decommissioned will be removed off site and the land reinstated. Impacts would be expected
to be less than during the construction phase and would be of short term duration.
9.6 MITIGATION MEASURES
9.6.1 Construction Phase Mitigation
106 With regard to construction activities, the contractor appointed will be required to ensure that all
plant items used during the construction phase will comply with standards outlined in European
Communities (Construction Plant and Equipment) (Permissible Noise Levels) Regulations
(1990). The mitigation measures are outlined in BS5228: Noise Control on Construction and
Open Sites (2009), which offers detailed guidance on the control of noise from construction
activities. All such controls will be governed by the Construction Environmental Management
Plan (CEMP) (an outline of which is available in Appendix 7.1, Volume 3B Appendices of the
EIS).
107 It is proposed that various practices be adopted during construction, in conjunction with those
presented in Chapter 7, Volume 3B of the EIS including:
Night time working will typically not occur, but there is the unlikely possibility that there
may be a necessity to continue to operate generator, pumps or other equivalent
machinery at a number of locations, where the digging of foundations and erection of
towers may cause activity to remain in one location for a longer period of time.
On these infrequent occasions, screening and enclosures can be utilised. For
maximum effectiveness, a screen should be positioned as close as possible to either
the noise source or receiver. The screen should be constructed of material with a mass
of > 7kg/m2 and should have no gaps or joints in the barrier material. This can be used
to limit noise impact to 45dB (A) Leq (BS 5228 acceptable night time level) at any noise
sensitive receptors, if required by agreement with the local authority.
Appoint a site representative responsible for matters relating to noise and establish
channels of communication between the contractor / developer, local authority and
resident i.e. for notification of requirement of night works, should this be required.
A 2m tall continuous fence without gaps will be affixed to three sides of the boundary
fence to the proposed construction material storage yard. The fence will be constructed
of material with a mass of > 7kg/m2 and have no gaps or joints in the barrier material.
This fence is not required on the boundary between the construction material storage
yard and the N2 National Primary Road.

North-Sout
108 F
e
9.6.1.1 C
109 A
c
th 400 kV Interc
Furthermore
employed, th
Sele
Erec
com
poss
mate
mate
As a
shor
sour
Posi
cons
Constructio
Any construc
carried out in
connection Deve
, it is envis
hese may inc
ection of plan
ction of tem
pressors. F
sible to eithe
erial with a
erial. An exa
Figure 9.3:
a rough guide
rter barrier sh
rce is visible
tioning of no
straints.
on Phase Vib
ction works t
n accordance
elopment
saged that
clude:
nt with low inh
mporary bar
For maximum
er the noise
mass of > 7
ample is show
: Examp
e, the length
hould be ben
from the rec
oisy plant as
bration Mitig
that have the
e with the lim
9-24
a variety of
herent poten
rriers around
m effectivene
source or re
7kg/m2 and
wn in Figure
ple of a Sect
of a barrier
nt around th
eiving locatio
s far away f
gation
e potential to
mit values as
f practicable
ntial for gene
d items su
ess, a barrier
eceiver. The
should have
e 9.3.
tion of Temp
should be fi
e noise sou
on.
from sensitiv
o cause vibr
set out in Ta
Envi
e noise con
ration of nois
uch as gen
r should be
e barrier sho
e no gaps o
porary Nois
ve times gre
rce, to ensu
ve receptors
ration at sen
able 9.5.
ronmental Impa
trol measur
se and / or v
erators or
positioned a
ould be cons
or joints in t
e Barrier
eater than its
re no part of
s, as permitt
nsitive recept
act Statement Volume 3C
es will be
ibration.
high duty
as close as
structed of
the barrier
s height. A
f the noise
ted by site
tors will be

North-South 400 kV Interconnection Development Environmental Impact Statement Volume 3C
9-25
9.6.2 Operational Phase Noise Mitigation
110 As outlined in the previous sections, it is not expected that noise arising from the proposed
development will cause significant noise impact. Corona noise will only be audible under
certain weather conditions and in close proximity to the line. Corona noise is caused
predominantly by items of transmission line hardware, other than conductors, e.g. clamps and
can be effectively mitigated by replacement of individual items of hardware. Aeolian noise very
rarely occurs on 400 kV lines and is not expected to arise on the proposed development.
Recommended mitigation measures for Aeolian and Corona noise include the fitting of air flow
spoilers on conductors and the fitting of composite insulators.
111 The OHL will be subject to an annual survey by helicopter patrol. The steady rise in noise level
as the helicopter is approaching any given point (while following the line route) should minimise
any surprise element to the onset of the helicopter noise. This is not expected to cause any
significant noise impact, due to the short term and transient nature of the annual survey and the
advance notice given to landowners.
9.7 RESIDUAL IMPACTS
112 Adherence to the mitigation measures will ensure there are no residual noise and vibration
impacts associated with the proposed development.
9.8 INTERRELATIONSHIPS BETWEEN ENVIRONMENTAL FACTORS
113 During both the operational and the construction phase, the noise and vibration impacts will be
predominantly associated with the road traffic impacts. This chapter should be read in
conjunction with Chapters 2 and 13 of this volume of the EIS, for a full understanding of the
main interrelationships between these environmental topics.
114 The main impacts arise from the following interrelationships:
Chapter 2 - Human Beings – Population and Economic - There is the potential for noise
impact to population in the form of impact to sensitive receptors such as private
dwellings etc. in the construction phase and the operational phase. In the operational
phase corona noise has the potential to cause noise impact during inclement weather
conditions. These impacts are addressed in the EIS and are not deemed to be
significant.
Chapter 13 - Material Assets – Traffic - In terms of traffic, during both the operational
and the construction phase, the noise and vibration impacts will be predominantly

North-South 400 kV Interconnection Development Environmental Impact Statement Volume 3C
9-26
associated with the road traffic impacts. No significant noise and vibration impacts are
predicted.
9.9 CONCLUSIONS
115 An evaluation of the potential for noise and vibration impact to sensitive receptors from the
proposed development has been carried out. It is predicted that the proposed development as
designed, inclusive of the mitigation measures described in this evaluation, will not have a
significant noise and vibration impact on sensitive receptors.