Embed Size (px)
Citation preview

Central Hampshire and New Forest Strategic Housing Market Assessment Final Report
November 2007
99
7 HOUSE PRICES, HOUSEHOLD INCOMES AND AFFORDABILITY
7.01 This section analyses the evidence on house prices, household income and affordability within the Central Hampshire Housing Market Area and New Forest.
7.02 House prices, affordability and housing need in the Central Hampshire Market Area and New Forest are a product of the demand and supply analysis presented in Sections 4, 5 and 6. The conceptual framework provided in Section 3 of this report demonstrates that in order to understand housing need it is important to examine the way in which the whole housing system operates.
Key Points
• Overall, the average house price in New Forest (£273,000) is higher than the average for the Central Hampshire Housing Market Area (£266,000), the South East (£244,000) and England (£208,000) (Q2 and Q3 house price data for 2006)
• House prices in the New Forest West and Central area are significantly higher than in parts of New Forest within the PUSH area
• In all areas, the price of flats and maisonettes has increased more rapidly (+210%) than overall house prices over the period 1995-2006
• In all areas, housing sales declined sharply in 2005, but recovered during 2006
• Average RSL rents tend to be at a similar level in the Central Hampshire Market Area (£77) as in New Forest (£77), however private sector rents are higher in New Forest with 51% of households unable to afford to rent
• In all areas the ratio between lower quartile house prices and lower quartile earnings has been increasing since 2002 - housing has become less affordable
• The lower quartile house price in New Forest is 11 times the lower quartile earnings. Likewise the ratio between house prices and earnings has been increasing at the national and regional level
• Both the Central Hampshire Market Area and New Forest are less affordable than the South East as a whole. New Forest has relatively low wages and higher house prices when compared with the Central Hampshire Housing Market Area, the South East and England
• Analysis of CACI (household) income distribution data indicates that overall around 98,000 households in the Central Hampshire Market Area would be unable to afford to purchase property at entry-level (lower quartile) market prices on the basis of their current income (though it is important to note that most of these households are already adequately housed)
• In New Forest the absolute number is lower (53,000), but this represents 69% of all households – this means that on the basis of their incomes, 69% of households in New Forest would be unable to afford to buy if they were looking at first time entry to the housing market. This is a higher proportion than in the Central Hampshire Housing Market Area, 60%. On the same basis 74% of households in Winchester are currently unable to afford to purchase

Central Hampshire and New Forest Strategic Housing Market Assessment Final Report
November 2007
100
House Prices
7.03 The latest data on house prices are summarized in Figures 7.1 and 7.2. The data used is a weighted average of Q2 (April-June) and Q3 (July-September) for each study district within the Central Hampshire Housing Market Area and for New Forest, the South East and England. This gives a more representative picture of house prices than is possible from one quarter’s data. Q2 and Q3 are used because they are traditionally the quarters when there is most activity in the housing market.
7.04 Of all the districts included in this study, the highest overall average prices are found in Winchester (£308,000). Winchester, along with East Hampshire (£291,000) and New Forest (£273,000), has average prices above that of the Central Hampshire Market Area (£266,000) as a whole.
7.05 By comparison, the Test Valley (£263,000) has average overall prices below that of the Central Hampshire Market Area, but above those for the South East (£244,000) as a whole. Basingstoke & Deane has the lowest average house prices of all the Study Districts, £233,000, a figure which is lower than the Central Hampshire Market Area and the South East, but above those at the national level, £208,000.
7.06 Prices are relatively low in the Central Hampshire Market Area reflecting the fact that all of Basingstoke & Deane is incorporated within it, whilst significant parts of Winchester and East Hampshire, the more expensive districts, fall outside of the market area. The character and age of properties in Basingstoke and the large volume of completions in recent years in Basingstoke & Deane (see Section 6) have helped to keep prices comparatively lower than the surrounding districts.
7.07 The pattern of house prices by type follows the same pattern in almost all of the benchmark areas, with detached houses the most expensive, followed by semi-detached houses, then terraced houses and then flats (only England differs from this pattern, and is probably influenced by the high proportion of flats in London, the most expensive housing market in the country).
7.08 In terms of flats, East Hampshire has the second lowest prices, only £5,000 higher than in Basingstoke & Deane, which has the cheapest flats/maisonettes. In contrast East Hampshire is the second most expensive District in the market area and has prices £60,000 higher than in Basingstoke & Deane.

Central Hampshire and New Forest Strategic Housing Market Assessment Final Report
November 2007
101
Figure 7.1 – Current House Prices by Type, October-December 2006
Figure 7.2 – Current House Prices by Type October-December 2006
Detached Semi-Detached Terraced Flat/Maisonette Overall
Central Hampshire Market Area £400,000 £233,000 £193,000 £155,000 £266,000
Basingstoke & Deane £363,000 £221,000 £174,000 £144,000 £233,000
East Hampshire £423,000 £238,000 £196,000 £150,000 £291,000 Test Valley £393,000 £214,000 £181,000 £163,000 £263,000 Winchester £459,000 £272,000 £240,000 £179,000 £308,000 New Forest £365,000 £224,000 £194,000 £174,000 £273,000 South East £397,000 £227,000 £190,000 £160,000 £244,000 England £317,000 £188,000 £167,000 £188,000 £208,000
Source: Land Registry
7.09 Figure 7.3 shows the very high average house prices of the local authority areas within the study area and shows that Winchester is one of the most expensive areas in the South East in terms of house prices. The house price profile tends to be higher in the central and eastern part of the study area as one moves towards London with East Hampshire also having overall prices above the regional level.
7.10 The effect of London is apparent within Figure 7.3, with the highest house prices in the region located in the areas encircling the capital. The spread of relatively high house price locations extends out into Winchester and East Hampshire, and to the north west of London into Wycombe and South Oxfordshire Districts.

Central Hampshire and New Forest Strategic Housing Market Assessment Final Report
November 2007
102
Figure 7.3 – Overall Average House Prices in the South East, by District (Source: Land Registry)
7.11 Figure 7.4 shows the change in district level house prices between 2001 and 2006. It shows that the three most expensive districts within the market area (Winchester, East Hampshire and New Forest) have all experienced higher house price increases than the other districts. As wages are unlikely to have kept up with increases in house prices it is likely that these districts have experienced the greatest decline in affordability.

Central Hampshire and New Forest Strategic Housing Market Assessment Final Report
November 2007
103
Figure 7.4 – Change in Average House Prices at Local Authority Level, 2001-2006
7.12 The lowest spatial level at which house price data is available is postcode-sector level. This
enables analysis and mapping of data to be undertaken at a very local level, as illustrated in Figure 7.5. The data used is a weighted average of Q2 2006 (April-June) and Q3 2006 (July-September) for each postcode sector within Central Hampshire and New Forest. This gives a more representative sample than is possible from one quarter’s data. Q2 and Q3 are traditionally the quarters when there is most activity within the housing market.
7.13 The least expensive postcodes in the Central Hampshire Housing Market Area are those located in Basingstoke & Deane. There are also pockets of low price postcodes centred in and around the major urban settlements in the market area. Basingstoke, Bordon and Andover all have pockets with an overall average price of £94,000 to £177,000. This may be partly explained by the concentration of smaller dwelling types that are generally found in urban areas compared to the generally larger dwelling types in rural areas, but will also reflect market assessment of the perceived attractiveness and quality of life in different locations.
7.14 Figure 7.5 reflects the fact that people are willing to pay a premium to live in rural areas. This is clearly illustrated in New Forest District where the New Forest West and Central area, which incorporates the heart of the New Forest National Park itself, has expensive postcode sectors throughout. Average house prices are lower in the eastern part of New Forest District, comprising the settlements of Totton, Hythe and Fawley, which are regarded as part of the PUSH area.

Central Hampshire and New Forest Strategic Housing Market Assessment Final Report
November 2007
104
Figure 7.5: Overall Average House Prices in 2006 at Post Sector Level

Central Hampshire and New Forest Strategic Housing Market Assessment Final Report
November 2007
105
7.15 Figures 7.6 and 7.7 illustrate the extent to which average overall house prices have increased between 1995 and 2006 compared to the South East and England. In terms of absolute increases those authorities with the highest prices have experienced the largest absolute increases in house prices. Winchester (£201,000), East Hampshire (£190,000) and New Forest (£188,000) have seen the largest absolute increases with Basingstoke & Deane (£148,000) the lowest.
7.16 In terms of percentage increases the pattern is somewhat different. Whilst house prices are generally higher in the Central Hampshire Housing Market Area and New Forest than the rest of the South East and England, the percentage rate of house price increases over the period 1995-2006 has been lower with the exception of New Forest. Only New Forest (219%) has experienced increases above the regional average of 200% and the national average of 199%. Affordability is likely to be particularly extreme as a consequence in New Forest District.
7.17 Winchester, which has the highest overall prices has also experienced the largest absolute increase, experienced a percentage increase of 187%. It is also worth noting that the Test Valley, which has the second lowest overall prices of any of the study districts, has experienced the second highest percentage increase. This pattern of house price increases, whereby the highest proportional house price increases occur in the lowest priced areas, reflects a general pattern that lower priced areas catch up with high priced areas in the later stages of a housing market boom.
Figure 7.6 – Average Overall House Price, 1995-2006
.

Central Hampshire and New Forest Strategic Housing Market Assessment Final Report
November 2007
106
Figure 7.7 – Average Overall House Price, 1995 – 2006
1995 2006 Absolute Increase % Increase
Central Hampshire Market Area £94,000 £266,000 £172,000 183%
Basingstoke & Deane £85,000 £233,000 £148,000 174% East Hampshire £101,000 £291,000 £190,000 188% Test Valley £89,000 £263,000 £174,000 196% Winchester £107,000 £308,000 £201,000 188% New Forest £86,000 £273,000 £187,000 217% South East £81,000 £244,000 £163,000 201% England £70,000 £208,000 £138,000 197%
Source: Land Registry 7.18 Whilst the analysis above provides a synopsis of overall trends in prices, it does not reflect
differences in the distribution of price increases across different types of housing (eg, detached, semi-detached, terraced, flats), or indeed the mix of types of housing within each area. Figures 7.8 and 7.9 present the growth of average flat/maisonette house prices for the same period as above (1995 to 2006).
Figure 7.8 – Average Flat/Maisonette House Prices, 1995-2006
.

Central Hampshire and New Forest Strategic Housing Market Assessment Final Report
November 2007
107
Figure 7.9 – Average Flat/Maisonette House Prices, 1995-2006
1995 2006 Absolute Increase % IncreaseCentral Hampshire Market Area £47,000 £155,000 £108,000 230%
Basingstoke & Deane £44,000 £144,000 £100,000 227% East Hampshire £47,000 £150,000 £103,000 219% Test Valley £50,000 £163,000 £113,000 226% Winchester £52,000 £179,000 £127,000 244% New Forest £50,000 £174,000 £124,000 248% South East £47,000 £160,000 £113,000 240% England £60,000 £188,000 £128,000 213%
Source: Land Registry
7.19 It is possible to present analysis of price changes of all the different housing types across all study areas. However, focus is given to the flats because prices have increased at a higher rate than any other type and prices overall for the period 1995-2006. This is in contrast to other housing types whose prices have more closely followed overall price changes.
7.20 In the Central Hampshire Market Area flat/maisonette prices have increased by 230% since 1995, compared with an increase in overall prices of 184%. In Winchester percentage price increases for flats/maisonettes are almost 60% higher than the percentage increase of overall prices over the same period. This trend is likely to indicate the impact of the development and sale of significant volumes of new flats in recent years (with sales of new flats having a significant price premium on the sale of the second hand stock).
7.21 Figure 7.10 shows the trend in the number of sales of dwellings since 1995. In the period from 1995 to 1999, the level of sales increased dramatically in all areas, as significant house price increases maintained a high level of interest in the property market. Sales waned in 2000, peaking again in 2002 at a time of significant house price inflation, low interest rates, and generally high level of interest in the housing market. By 2005, confidence in the housing market had waned considerably, and sales clearly suffered as a result, falling by at least 25% in all areas.
7.22 Since 2005, the level of sales has rebounded in the Central Hampshire Housing Market Area and New Forest, despite interest rate rises. The strongest rebound was experienced by New Forest where sales increased by 31% from 2005-2006. At the regional and national level, sales have also shown robust signs of recovery over the last year.

Central Hampshire and New Forest Strategic Housing Market Assessment Final Report
November 2007
108
Figure 7.10 – Trend of Total Sales, 1995-2006
.
7.23 Figure 7.11 shows the sales of dwellings during the period 1995-2006 expressed as a
percentage of total housing stock. The table shows that in each year dwelling stock turnover in each of the study areas was lower than in the South East as a whole.
7.24 In 2006, turnover in Central Hampshire and New Forest was 3.4% and 3.5% respectively. This is significantly lower than the 5% experienced in the South East, but above the national level of 3.2%. Average turnover for the 11 year period is very similar in each study area, ranging between 3 - 3.2%. This is below the regional average of 4.5%, but above the national average of 2.9%.
Figure 7.11 – Total Sales as a Percentage of Housing Stock, 1995-2006
1995 1996 1997 1998 1999 2000 2001 2002 2003 2004 2005 2006 Ave Central Hampshire Market Area
2.3% 2.6% 3.2% 3.1% 3.6% 3.0% 3.5% 3.6% 2.9% 3.6% 2.9% 3.4% 3.1%
New Forest 2.5% 2.6% 3.6% 3.2% 3.9% 3.1% 3.8% 3.7% 3.0% 3.3% 2.6% 3.5% 3.2% Basingstoke & Deane 2.3% 2.8% 3.3% 3.0% 3.7% 3.1% 3.8% 3.7% 2.9% 3.8% 3.0% 3.5% 3.2%
East Hampshire 2.6% 2.7% 2.8% 3.1% 3.6% 3.2% 3.5% 3.5% 3.0% 3.5% 2.9% 3.4% 3.1%
Test Valley 2.2% 2.9% 3.7% 3.5% 3.9% 2.9% 3.3% 3.8% 2.9% 3.4% 2.7% 3.3% 3.2% Winchester 2.1% 2.0% 3.4% 3.3% 3.3% 2.7% 3.3% 3.4% 3.0% 3.6% 2.8% 3.5% 3.0% South East 3.2% 4.0% 4.7% 4.4% 5.0% 4.4% 5.1% 5.4% 4.3% 5.1% 4.0% 5.0% 4.5% England 2.0% 2.4% 2.6% 2.8% 3.0% 2.8% 3.2% 3.5% 3.0% 3.4% 2.7% 3.2% 2.9%
Source: Land Registry / Census / DTZ

Central Hampshire and New Forest Strategic Housing Market Assessment Final Report
November 2007
109
Rents
7.25 Average RSL rents in the Central Hampshire Market Area are higher than the averages for the South East and England, at £77 per week. CLG data shows that the highest RSL rents in any single district are £81 per week in Basingstoke & Deane. Conversely, the lowest RSL rents are in Test Valley at £66 per week.
7.26 RSL rents have increased by 45% in the South East since 1997. Increases in New Forest have been 12% lower, whereas, in Basingstoke & Deane and East Hampshire RSL rents have increased by 7% and 11% higher than at the regional level.
Figure 7.12 – Average Weekly RSL Rents, 1997-2006
1997 1998 1999 2000 2001 2002 2003 2004 2005 2006Central Hampshire Market Area 52 56 58 59 61 64 66 68 73 77
Basingstoke & Deane 53 55 59 61 63 65 67 70 75 81 East Hampshire 51 56 58 60 62 65 68 71 76 79 Test Valley 50 56 57 50 52 56 58 59 60 66 Winchester 55 57 60 62 63 66 67 69 75 79 New Forest 58 59 61 63 64 66 68 70 74 77 South East 52 55 58 60 61 64 65 67 71 75 England 47 50 52 53 54 56 57 58 61 64
Source: CLG
7.27 Increases in rents from 2002 onwards are probably a reflection of the Government’s rent restructuring policy, whereby all social rents are based on a formula that uses property size, value and local earnings to calculate rent levels. This system has been implemented to iron out differentials in rents between social landlords and to keep social rents at affordable levels, including caps on rent increases.
7.28 A comparison between Figures 7.12 and 7.13 shows that private rents are around twice as high as RSL rents in each of the study areas.
7.29 Figure 7.13 shows a “rent threshold” for each study area. This is derived by using the lowest available rental cost (annualised) of two-bedroom properties in each of the study areas and multiplying by four. This is making the assumption that households can only reasonably afford to spend 25%1 of their gross income on rent costs. The result is an annual income level that is needed by a household in order to afford to rent in that area.
7.30 Winchester, Basingstoke & Deane and the Test Valley are the most affordable districts in which to rent property on this measure. However in Winchester a third of all households would be unable to afford to rent privately based on their current incomes. However, as with analysis on the affordability of owner occupation on the basis of incomes, it is important to note that the majority of existing households are adequately housed, though this provides us with a proxy measure for the affordability of renting to new households which can be used to assess housing need (see Section 8).
7.31 In general the pattern of rental affordability reflects the pattern of purchase affordability, with the areas that are least affordable in terms of purchase also being the least affordable 1 Strategic Housing Market Assessments, Practice Guidance, CLG, March 2007. In practice some households spend more that 25% of their annual income on rent (or a mortgage) and therefore more are able to afford to access market housing than implied by their incomes. This is taken into account in the housing need assessment and analysis of the incomes of intermediate households in Section 8.

Central Hampshire and New Forest Strategic Housing Market Assessment Final Report
November 2007
110
in terms of market renting. The exception to this is Winchester District, which is the second least affordable district in terms of purchase affordability (see Figure 7.14), but is the most affordable in terms of market renting. One explanation for this pattern might be that Winchester has attracted high levels of Buy-to-Let investment because of perceived opportunities for capital growth, but that the supply has meant that rental values have become more affordable. Winchester already had the largest proportion of private renting compared to the other authorities (and the South East and England) in 2001 – the sector having grown between 1991 and 2001.
Figure 7.13 – Private Rental Costs 2 (Whole Districts)
Entry level rental cost for 2 bed property
(weekly)
Entry level rental cost (annual)
Annual household income required to rent (assuming
households spend up to 25% of gross income)
Central Hampshire Market Area £149 £7,800 £31,000
Basingstoke & Deane £159 £8,000 £33,000 East Hampshire £150 £7,800 £31,000 Test Valley £132 £6,900 £27,000 Winchester £144 £7,500 £30,000 New Forest £148 £7,700 £30,000
Source: Dataspring/CACI
Affordability
7.32 The housing affordability indicator used by CLG under its PSA5 Target (SR 2004) ‘Housing Demand and Supply’ is the “long term trend in the ratio of lower quartile house prices to lower quartile (individual) earnings” which reflects entry-level affordability ratios. The Government has indicated in its response to the recommendations of the Barker Review of Housing Supply in the UK that this continues to be its headline measure of housing market affordability.
7.33 Figures 7.14 and 7.15 show how affordability ratios for the Central Hampshire Housing Market Area, New Forest and benchmark areas have changed over time. Currently, New Forest District is the least affordable of the study districts, with a LQ house price to LQ earnings ratio of almost 11:1. The next least affordable areas are Winchester (10.5:1) and East Hampshire (10:1).3
7.34 The Central Hampshire Market Area overall has the same level of affordability as the South East as a whole (9:1). But this is achieved by virtue of Basingstoke & Deane, which has a ratio of 8:1, with all the other areas having a ratio higher than the regional average. For England as a whole the ratio of LQ house prices to LQ earnings is now 7:1.
7.35 In the period 2002 to 20064, affordability has clearly worsened in all areas. For example, the ratio between LQ house prices and LQ earnings in New Forest has increased from 8:1 in 2002 to 11:1 in 2006. Over the past year affordability pressures have eased somewhat in some districts (most notably in Winchester), which has been due to a reduction in LQ house prices. Test Valley and New Forest have experienced further declines in affordability however.
3 In comparison average mortgage multipliers (the ratio of salary to purchase price) tends to be between 3 to 4 times average salary. 4 This is the longest time series for which Earnings data is currently available through the Annual Survey of Hours and Earnings

Central Hampshire and New Forest Strategic Housing Market Assessment Final Report
November 2007
111
Figure 7.14 - Lower Quartile House Prices to Lower Quartile Earnings Ratios (Whole Districts)
Figure 7.15- Lower Quartile House Prices to Lower Quartile Earnings Ratios (Whole Districts)
2002 2003 2004 2005 2006 Central Hampshire Market Area (Whole Districts) 7.6 8.3 9.0 9.5 9.1
Basingstoke & Deane 6.4 7.2 7.6 8.3 8.0 East Hampshire 8.3 9.3 10.3 10.7 9.8 Test Valley 7.9 8.2 9.3 8.8 9.4 Winchester 8.9 9.7 10.2 11.1 10.5 New Forest 8.1 9.4 10.6 10.0 11.0 South East 6.9 7.5 8.1 8.6 8.6 England 4.7 5.2 6.3 6.8 7.1
Source: CLG
7.36 Affordability is a serious issue in many housing markets, but it is particularly pronounced in high growth areas such as the South East. Companies in areas with high affordability ratios may struggle to recruit workers due to the high house prices. One particular concern is the extent to which key workers are able to afford to live within an area.

Central Hampshire and New Forest Strategic Housing Market Assessment Final Report
November 2007
112
7.37 A study by the Joseph Rowntree Foundation, ‘Can Work, Can’t Buy’5, contains analysis of the extent to which key workers are able to purchase a home. The (individual) income of key workers is expressed as the proportion of the income required to purchase a home. This is based on the following information:
• The salaries of four key workers (a nurse, police officer, social worker and teacher) have been used. In each case a point on the salary scale has been selected to correspond with a key worker that has been in post for some three to four years, and may be sufficiently settled to consider a house purchase. The basic salaries have been supplemented as appropriate with London and South East weightings, allowances or other equivalent supplements for these localities where they apply. Figures are for October 2002
• House prices are based on lower quartile prices for 2 bedroom dwellings6. The local house price data used is Halifax plc. Data for the period 1996-98 updated by regional indexes to Q4 2002 levels
Figure 7.16 - Key Worker Affordability (Individual Incomes) (Whole Districts)
Entry Level House
Price Income Required to
purchase Key Worker Income as % of Income Required
Central Hampshire Market Area £133,800 £42,400 51%
Basingstoke & Deane £132,100 £41,800 52%
East Hampshire £136,200 £43,100 51% Test Valley £121,300 £38,400 57% Winchester £146,600 £46,400 47% New Forest £124,400 £39,400 55% South East £124,100 £39,300 56% England £91,200 £28,900 75%
Source: JRF, ‘Can’t Work - Can’t Buy’
7.38 As shown in Figure 7.16, average key worker earnings are less than the income required to purchase a home in all of the benchmark areas examined. In the Central Hampshire Housing Market Area, an average key worker salary is only 51% of the income needed to purchase a home. Key workers in Winchester live in the least affordable area compared with their colleagues elsewhere in the Central Hampshire Housing Market area and in New Forest, the average key worker salary equates to just 47% of the income required to purchase a home. However, it is also important to bear in mind that many key workers will not be looking to buy homes on their own and on that basis lower quartile house prices are likely to be affordable.
Household Incomes and Affordability
7.39 The previous analysis is based on the relationship between personal (individual) incomes and house prices. An alternative method of measuring affordability is the relationship
5 ‘Can Work – Can’t Buy, Local Measures of the ability of working households to become home owners’ (Steve Wilcox), Published by the Joseph Rowntree Foundation May 2003. This data was not updated in the latest version of the Joseph Rowntree Foundation report published in 2006. 6 The study used data on the number of rooms rather than bedrooms - where a kitchen is counted as a room together with other living rooms and bedrooms. Using DTZ’s rule of thumb, a 4/5 room dwelling broadly equates to a 2 bedroom dwelling

Central Hampshire and New Forest Strategic Housing Market Assessment Final Report
November 2007
113
between household incomes and house prices, since this takes account of the relationship between personal and household incomes.
7.40 The Joseph Rowntree Foundation (JRF) study ‘The Geography of Affordable and Unaffordable Housing’7 provides a useful measure of affordability, relating the average price of 2/3 bedroom dwelling to the average household income of those aged 20-39 (those most likely to be purchasing a first home). This is different to the ratios presented above due to the difference in methodology and definition of affordability ratios. In many ways this method of affordability is preferable to the official CLG measure, since it allows the affordability ratios to be compared with standard mortgage income multipliers.
7.41 The results show once again that New Forest is less affordable than the Central Hampshire Housing Market Area and the individual districts within it. These results are also similar to the CLG measure above, in that Basingstoke & Deane is relatively more affordable than the rest of the Central Hampshire Housing Market Area, New Forest and the South East.
Figure 7.17: Affordability Ratios Based Upon Household Incomes (Whole Districts)
Source: JRF
7.42 Whilst the results from the JRF study are illuminating, the main shortcoming of the report is that it uses regional results for the relationship between personal and household incomes to compute household incomes at a local level. A more robust method would be to use household incomes based on data collected at a local level. The most sophisticated dataset of this kind is the data available from CACI, giving reliable estimates of household incomes down to ward level.
7.43 Using CACI data it has been possible to compute the mean households income and income distribution within the Central Hampshire Housing Market Area and New Forest. Figure 7.18 shows the mean average income for the Central Hampshire Housing Market Area, its component districts, New Forest and the South East. The highest mean household income of any district is Basingstoke & Deane (£40,589). Both Basingstoke & Deane and East Hampshire (£40,005) have a higher average income than the Central Hampshire Market Area as a whole (£39,832).
7.44 New Forest (£34,492) is the only district with income below the regional level of £37,599. There is a clear disparity between incomes in this District and the Central Hampshire Housing Market Area.
7 ‘The Geography of Affordable and Unaffordable Housing’ (Steve Wilcox), published by the Joseph Rowntree Foundation. This report was published in 2006 and contains results relating to 2005. This is the update to the original reports – ‘Affordability and the Intermediate Housing Market’ and ‘Can Work – Can’t Buy, Local Measures of the Ability of Working Households to Become Home Owners’ (Steve Wilcox), published by the Joseph Rowntree Foundation in 2005 and 2003 respectively.
House Price to Income Ratio, 2005 Central Hampshire Market Area 4.74 Basingstoke & Deane 4.31 East Hampshire 4.94 Test Valley 5.26 Winchester 4.92 New Forest 5.57 South East 4.76 England 4.43

Central Hampshire and New Forest Strategic Housing Market Assessment Final Report
November 2007
114
Figure 7.18: Mean Household Income (Whole Districts)
7.45 As well as providing data on mean household incomes, CACI data shows the distribution of household incomes in £5,000 pay brackets (CACI provides income data for all households and not just those households that are economically active or in work). Figure 7.19 presents the proportion of households falling into each pay bracket for the Central Hampshire Housing Market Area, its component districts, New Forest and the South East. As shown in Figure 7.19, there is little difference between the areas in terms of income distribution and structure. The only evident difference in the analysis is the higher proportion of households in New Forest in the brackets between 0-£30k and a lower proportion in the £35k-£100k+ brackets compared with the rest of the geographies covered. This distribution helps to explain the relatively low mean household income in the district illustrated in figure 7.18 and in part is likely to reflect lower economic activity rates within the District.

Central Hampshire and New Forest Strategic Housing Market Assessment Final Report
November 2007
115
Figure 7.19: Household Income Distribution (Whole Districts)
. .
7.46 An alternative way of plotting the data in Figure 7.19 is to show the cumulative
distribution of household income, as presented in Figures 7.20 and 7.21. In addition, these charts show the threshold of income necessary to access owner-occupation (the income needed to purchase at the Lower Quartile house price).8
7.47 The charts show that the income threshold required to purchase houses at the lower quartile level in the Central Hampshire Market Area is just over £42,000. As shown by the chart, 60% of households in this area have an income below this threshold, and are therefore unable to afford to purchase a dwelling at current price.
7.48 Winchester, again, is shown to be the least affordable area, with 74% of households being unable to afford to buy at the Lower Quartile price. The relatively low incomes in New Forest combined with house prices above the regional average mean that 69% of its households are below the income threshold required to purchase. By comparison, relatively high household incomes and low house prices in Basingstoke & Deane mean that a comparatively lower proportion of households (51%) are unable to access owner-occupation.
8 Assuming that purchasers can afford a 20% deposit, and 3.05 times mortgage multiplier (Council of Mortgage Lenders, 2006), using 2006 data for Lower Quartile house prices (CLG, 2006). This measure produces similar results to 3.5 times income, the multiplier suggested in the CLG guidance (though the CLG measure suggests that properties are slightly less affordable and more households priced out).

Central Hampshire and New Forest Strategic Housing Market Assessment Final Report
November 2007
116
Figure 7.20: Cumulative Household Income Distribution and Purchase Income Thresholds (Whole Districts)
Figure 7.21: Cumulative Household Income Distribution and Purchase Income Thresholds (Whole Districts)

Central Hampshire and New Forest Strategic Housing Market Assessment Final Report
November 2007
117
7.49 Figure 7.22 relates these proportions to the absolute number of households in each of the areas. In the Central Hampshire Market Area just over 98,000 households would be unable to purchase at Lower Quartile prices on the basis of their current incomes. It is worth noting at the district level that although Basingstoke & Deane has the lowest proportion of its households unable to purchase, this would translate into a higher absolute number of households (33,000) than East Hampshire (27,000) and the Test Valley (29,000).
Figure 7.22: Number and Proportion of Households Unable to Purchase on Basis of Current Incomes (Whole Districts)
Lower Quartile House Price
(2006)
Household income needed
to purchase
% of households unable to purchase
Number of households unable to purchase
Central Hampshire Market Area £162,000 £42,000 60% 98,000
Basingstoke & Deane £148,000 £39,000 51% 33,000
East Hampshire £170,000 £45,000 60% 27,000 Test Valley £153,000 £40,000 62% 29,000 Winchester £192,000 £50,000 74% 34,000 New Forest £165,000 £43,000 69% 53,000 South East £148,000 £39,000 56% 1,841,000
Source: CACI, CML, CLG
7.50 It is important to note that many of the 98,000 households in Figure 7.22 will be home owners as many are likely to be older households who purchased their homes either when they were on higher incomes or when house prices were more affordable. However, as the above analysis shows a large number of residents would be unable to purchase a home now and provides a proxy for the affordability of housing to new households.
7.51 It is also worth considering that the incomes of newly forming households are generally lower than the population as a whole and so the proportion of new households unable to purchase is likely to be at least as high as the figures presented in Figure 7.22. Recent research by the Analytical Services Directorate in the CLG found that in England, 30% of new households were home owners, around 20% required social rented accommodation and around 50% required private rented accommodation (of which some were able to afford home ownership and a proportion would be able to access low cost home ownership with some assistance). This pattern is taken into account in the housing need assessment in Section 8.

Central Hampshire & New Forest Strategic Housing Market Assessment Final Report
November 2007
118
8 HOUSING NEED ASSESSMENT
8.01 This section analyses the evidence on housing need within Central Hampshire and New Forest. The conceptual framework in Section 3 of this report demonstrates that in order to understand housing need it is important to examine the way in which the whole housing system operates. In the context of house prices and affordability within Central Hampshire and the New Forest it is inevitable that a proportion of households find themselves unable to access housing in the open market. Estimating the number of households in housing need is therefore a key element in understanding the housing market. Local authorities also require an assessment of housing need to underpin their planning and housing policies in relation to the provision of affordable housing. Housing need in each authority area has been assessed through a housing need assessment, in line with the CLG’s SHMA guidance.
Key Points
• Almost 15,000 households have current housing applications registered with a local authority within the four Central Hampshire authorities, a further 4,800 in the New Forest, of which around 9,700 in Central Hampshire and 3,320 in the New Forest fall within the definition of housing need set out in the CLG guidance and their needs are unlikely to be met within the market1
• Further need for affordable housing will arise in the future as new households form and some existing households fall into need. Around 2,050 households will fall into need each year in Central Hampshire, a further 470 in New Forest, based on household projections, the incomes of new households and the net number of households joining waiting lists each year
• The annual supply of affordable housing across the authorities through re-lets is equivalent to around 6% of total stock in the social rented sector. Along with new supply, this provides 2,440 dwellings in Central Hampshire and 530 in New Forest which can be offset against the level of housing need
• The level of housing need exceeds what will be delivered by way of new affordable housing each year. In Central Hampshire the minimum estimate of housing need suggests that there is a need for around 1,450 affordable (social rented) homes each year, on top of what is planned, with a further 600 required in New Forest
• Around 3,000 households in Central Hampshire and a further 500 in New Forest have expressed an interest in intermediate housing options. The majority of households would prefer two bedrooms, with around one third preferring a 3 bedroom home.
• There is limited overlap between those interested in intermediate housing and those on local authority housing registers (10% of households interested in intermediate housing are registered on waiting lists). However a number of households interested in intermediate housing do not have sufficient incomes to access intermediate options and are not on waiting lists in the 5 authorities, indicating a level of hidden need.
• In terms of social rented homes, the majority of households registered require a one bedroom home. However, the requirement of those in need differs. The pattern of re-lets in the social rented stock in each authority shows that 1 and 2 bedroom properties are re-let most frequently – highlighting pressures on larger stock in some authorities.
1 The figures for the number of households in need exclude applicant households who are not resident within the local authority (or without a strong local connection) to avoid double counting of households across the 5 authorities.

Central Hampshire & New Forest Strategic Housing Market Assessment Final Report
November 2007
119
Introduction
8.02 The objective of the CLG guidance is to undertake housing need assessments using secondary data. The inputs in these assessments are based on a variety of data sources which, in most cases, represent actual numbers and the real circumstances of individual households who have approached local authorities for assistance regarding their housing situation. DTZ has also used CACI modelled income data and Hampshire County Council households projections to estimate the level of newly arising need.
8.03 The figures arising from this housing need assessment are not directly comparable to those produced using the more traditional household survey approach and so the figures in this section should not be used to demonstrate a decline or increase in housing need over time by comparing them to previous surveys. There are at least 2 key differences in the methodology:
• Current need: housing need surveys record the situations and aspirations of a sample of households and these are then grossed up to provide estimates of the level of housing need among the population as a whole. The approach used here analyses the circumstances of only those on local housing waiting lists and does not look for current need elsewhere e.g. among households who have not registered their need for housing with the local authority. Our approach therefore underestimates the actual level of housing need – particularly in more rural areas where households who may be in need may not register because they consider there to be limited prospect of being housed. However, if households have not registered their need for housing then they will not be allocated a house by the authority or RSL.
• Newly arising need: our approach uses household projections (Hampshire County Council) as a basis for determining housing need. This approach effectively constrains the estimate of newly arising need since the household projections take account of future dwelling provision. Housing need surveys tend to give an unconstrained estimate of newly arising need by using the results of household surveys to estimate household formation.
8.04 Furthermore, each local authority across the country has a different system for managing applications for housing and for the allocation of homes to households in need. The approach to assessing housing need therefore needs to be tailored to the particular processes and systems in operation in each authority. We set out in this section any particular approaches or assumptions applied to the data in order to achieve this.
8.05 The methodology for the housing needs assessment in the CLG guidance is largely based on the Basic Needs Assessment table developed for the ‘Local Housing Needs Assessment; A Guide to Good Practice’ (DETR 2000) as outlined in Figure 8.1.
Figure 8.1 Outline of Housing Need Assessment Model
Stage 1: Current Need Plus
Stage 2: Newly Arising Need Minus
Stage 3: Supply of Affordable Homes Equals
NET SHORTFALL (OR SURPLUS) OF AFFORDABLE HOMES

Central Hampshire & New Forest Strategic Housing Market Assessment Final Report
November 2007
120
8.06 The remainder of this section sets out the key inputs in relation to each of the stages of the housing needs assessment model set out in Figure 8.1 and presents the housing need estimates for each local authority and the market area of Central Hampshire2.
8.07 Key assumptions applied to the data for each authority are highlighted in this section. Summary calculations of the estimates for each authority are provided in Appendix D.
Stage 1: Current Need
8.08 Stage 1 of the assessment considers the number of existing households who are currently in housing need. Current need comprises three main groups of households who have registered their need with a local authority (or RSL in some cases):
• Current occupiers of affordable housing in need i.e. existing tenants in need and on the transfer list
• Households from other tenures in need and on the waiting list for housing
• Households without self-contained accommodation i.e. homeless households and households living with family/friends or multi-adult households sharing facilities
8.09 Figure 8.2 sets out the numbers of households with current housing applications in each authority. These figures represent the total number of applicants and include those who may not be resident within the authority and those who may not have an identifiable element of housing need.
Figure 8.2: Households with Current Housing Applications (31/03/07)
Basingstoke & Deane
East Hampshire
Test Valley
Winchester Central Hampshire
(whole districts)
New Forest
Transfer Applicants 1,110 600 580 730 3,020 390 Waiting List Applicants 4,180 2,760 2,940 1,810 11,690 4,180
Homeless Households in Temporary Accommodation
130 * 80 60 270 260
Total 5,430 3,360 3,600 2,590 14,970 4,830 As % of All Households in Authority Area
8% 7% 8% 6% 7% 7%
Source: Local Authority Housing Management Systems (Note: Figures may not sum due to rounding) *Included in Number of Waiting List Applicants
8.10 As highlighted in Figure 8.2, around 15,000 households have current housing applications registered with a local authority within the five authorities, with a further 4,800 in the New Forest.
8.11 It is also worth noting that there is a wider population of households who receive housing assistance because they are unable to meet their own needs within the market. The number of households receiving housing benefit in each of the authority areas3 is as follows:
2 Given the different housing management systems in operation in each authority some caution must be applied in comparing the results between authorities

Central Hampshire & New Forest Strategic Housing Market Assessment Final Report
November 2007
121
• 6,800 households in Basingstoke and Deane (10.8% of the household population)
• 3,800 households in East Hampshire (8.4% of the household population)
• 4,400 households in Test Valley (9.7% of the household population)
• 4,400 households in Winchester (9.9% of the household population)
• 6,800 households in New Forest (9.2% of the household population)
8.12 We have not assessed whether these households are currently in need as part of this housing need assessment unless they are registered on one of the authority’s waiting lists. However, it is worth noting that Winchester’s housing register does not appear to be reflective of the scale of households receiving housing assistance to the same extent as the other authorities. There are relatively fewer households on Winchester’s waiting list when compared to the other authorities although the authority has one of the highest proportions of its population on housing benefit.4
8.13 In order to produce a robust and fair assessment of housing need using information from waiting lists it is necessary to exclude those applicants who may have applied for ‘aspirational’ reasons (they would like to be housed or re-housed) but are not in need as such. It is also necessary to exclude, as far as possible, households who are not resident within the authority area, to avoid double counting of any applicants who may be registered in more than one of the authorities. Although in practice, the provision of affordable housing must take account of the need to house workers who may currently be commuting long distances to work in the authority from adjacent authorities.
8.14 Of the 15,000 households in Central Hampshire with current housing applications around 65% (9,700 households) fall within the definition of housing need as set out in the CLG guidance (represented in Figure 5.1 in the CLG guidance). The figure in the New Forest is 3,320 households - 62% of all applicants have been identified as in housing need.
8.15 These households have one or more of the following element of housing need:
• They are living in overcrowded conditions
• They are lacking or sharing facilities
• They are homeless or living in insecure tenure
• They have medical or social needs (e.g. suffering harassment or violence that means they need to move)
8.16 Because of the different systems in operation in each authority the identification of households in need on the waiting lists varies. Figure 8.3 sets out the approach applied in each case to identify those households in need and to eliminate households who may have applied for aspirational reasons.
3 DWP Housing Benefit Statistics 2006 4 This may change when the authority moves to a Choice Based Letting system and it would be a valuable exercise to review the need assessment once this is up and running. Experience from other authorities suggests that the number of applicants may increase significantly

Central Hampshire & New Forest Strategic Housing Market Assessment Final Report
November 2007
122
Figure 8.3: Systems for Identifying Those in Housing Need
Identifying Applicants in Need Basingstoke & Deane
Systems able to identify applicants with different elements of need e.g. over crowding etc. Those without an element of need have been excluded from the minimum estimate
East Hampshire System unable to identify households falling into specific need categories. However points awarded to applicants reflect the level of need. Therefore a threshold of 17 points was used to identify those in need. Households with 17 points or more are highly likely to be lacking bedrooms and therefore in need. Households with less than 17 points were excluded from the minimum estimate. Points are awarded for length of stay on the waiting list (3 points per year). Therefore a proportion of those identified as in need could theoretically have no need but have been waiting for 5 years or more. A manual review of the waiting list however suggests this applies in very few cases. Furthermore, many older applicants who are registered for sheltered housing will have very few points (5 or 10 points) unless they have a medical priority.
Test Valley Systems able to identify applicants with different elements of need e.g. over crowding etc. Those without an element of need have been excluded from the minimum estimate. It is worth noting that, from the point of view of the housing need assessment, Test Valley’s system was ideal to work with. Other authorities considering upgrading their systems might consider whether this would also suit their circumstances.
Winchester Systems able to identify applicants with different elements of need e.g. over crowding etc. Those without an element of need have been excluded from the minimum estimate.
New Forest System unable to identify households falling into specific need categories. However bandings awarded to applicants reflect the level of need (High Priority, Priority and No Priority). Applicants in the No Priority band were excluded from the minimum estimate because they do not have an element of priority need.
8.17 It was also important to eliminate any potential double counting of applicants who may
have more than one element of housing need. This was not necessary in the case of New Forest and East Hampshire since applicants were identified by the numbers of points rather than category of need. In Basingstoke and Deane, Test Valley and Winchester, applicants were identified by their main need category to avoid double counting. That is not to say that many of the applicants would also be entitled to receive points or priority for other recognised indicators of need.
8.18 Figure 8.4 provides a summary of the minimum level of current housing need as defined by the CLG guidance, within each of the authorities in 2007. These figures exclude those that could not be identified as in housing need and those resident outside the authority area. It is these households who form the basis of our ‘minimum estimates’ of current housing need. This minimum figure establishes the number of households known to be in some form housing need at the time of writing.

Central Hampshire & New Forest Strategic Housing Market Assessment Final Report
November 2007
123
Figure 8.4: Current Need
Minimum Number of
Households in Current Need
Per Annum (assuming current
need met over 5 years)
% of All Applicants
Identified as in Need
% of All Households in Housing
Need Basingstoke & Deane
3,610 720 66% 7%
East Hampshire 1,650 330 57% 4% Test Valley 2,290 460 64% 5% Winchester 2,150 430 80% 5% Central Hampshire (whole authorities)
9,700 1,940 65% 5%
New Forest 3,320 660 69% 4% Source: LA Housing Management Systems
8.19 DTZ expect that very few of the households on the authority waiting lists and in housing
need would be able to meet their own needs within the market, although comprehensive data on the incomes of households on the waiting lists is unavailable. This assumption is supported by data from CORE letting reports for each authority in 2005/06. CORE reports provide information on the characteristics of those who are housed by authorities and RSLs, including the income of these households. This data suggests that the majority of households that are housed by the local authorities and RSLs in each of the authority areas are on income related benefits and either do or may qualify for housing benefit. Average incomes range from £200-260 per week (£10,400-13,500 per annum) with around 50% having incomes below £200 per week (less than £10,400 per annum) – below the level required to rent in the market or access most intermediate products.
8.20 We have also produced an ‘upper’ estimate of housing need which seeks to illustrate the likely scale of current housing need assuming that all of the 14,970 households registered for re-housing in Central Hampshire and 4,830 in New Forest are in some form of housing need (figures presented in Figure 8.2). This ‘upper’ definition of housing need assumes that the households on the local authority waiting lists are likely to be in housing need, even though we have not been able to allocate them to one of the categories of housing need as set out in our minimum estimate.
Stage 2: Newly Arising Need
8.21 Stage 2 of the housing need assessment considers the number of new and existing households who are likely to fall into housing need in the future. This stage of the assessment is based upon:
• New household formation and the proportion of newly forming households unable to buy or rent in the market
• Existing households falling into need
8.22 Section 4 presented the latest household projections prepared by Hampshire County Council, which estimate household growth across each authority to 2026. The housing needs assessment considers this projected level of household growth over the 5 year period of the assessment between 2007 – 2012, adjusted to give an annualised level of household growth for each authority (see Figure 8.5).

Central Hampshire & New Forest Strategic Housing Market Assessment Final Report
November 2007
124
Figure 8.5: Annualised Households Growth Projections 2007-2012
Household growth 2007-2012 (Annual Average) 2007/08 2008/09 2009/10 2011/12 2012/13 Average
2007-2012Basingstoke & Deane 1,310 1,310 1,310 1,310 640 1,170 East Hampshire 420 420 420 420 240 380 Test Valley 480 480 480 480 480 480 Winchester 440 440 440 440 920 540 New Forest 340 340 340 340 190 310
Source: Hampshire County Council Household Projections (Anglia University Chelmer Population Model)
8.23 It should be noted that these household projections represent a net level of household growth. It is important to note therefore that DTZ’s assessment of housing need uses these net household projections and therefore differs markedly from housing needs assessment methodologies that use household projections based on survey results.
8.24 Having identified the estimated level of household growth over the period of the assessment, the assessment then estimates the number of those new households unable to afford to buy or rent in the market place (examined in detail in Section 7 and summarised in Figure 8.6).
Figure 8.6: Proportion of New Households Unable to Rent Market Housing
Proportion Unable to Rent or Buy
A All Households
B New Households
C Mid Point
Basingstoke & Deane 41% 77% 59% East Hampshire 42% 75% 58% Test Valley 34% 69% 52% Winchester 33% 74% 54% Central Hampshire 42% 75% 59% New Forest 51% 81% 66%
Source: Section 7: CACI; Dataspring; Survey of English Housing 2004/05
8.25 The guidance recommends that the approach taken here is based on a comparison of minimum incomes required to access market housing against the distribution of incomes for newly forming households, however, this is not available at the local authority level. Section 7 used CACI income data for households as a whole to generate estimates of the proportion of households in each authority unable to buy or rent in the market (see Figure 8.6 column A). However, the Survey of English Housing (2004/05) demonstrates that, on average, the income of new households is 60% of the income of all households. Figure 8.7 illustrates the difference between the incomes of new and all households at the national level.

Central Hampshire & New Forest Strategic Housing Market Assessment Final Report
November 2007
125
Figure 8.7: Comparison of Income Distribution of New Household and All Households
8.26 It is possible to estimate the proportion of new households unable to access market housing
if it is assumed that the difference between all household incomes and new household incomes at the national level is replicated in each of the authorities i.e. that incomes of new households are 60% of the incomes of all households (see Figure 8.6 column B). However, in practice, many new households are able to access the private rented sector without public assistance by stretching themselves further financially than other households or perhaps even receiving assistance from friends and family. Therefore, we have assumed that, in practice, the proportion of new households able to access the market is better than affordability measures suggest and have taken a ‘mid point’ between the affordability of all households and new households (Figure 8.6 column C). The proportion of households unable to access market housing to buy or rent (mid point) in Figure 8.6 has been applied to estimate the proportion of newly forming households unable to access market housing and therefore likely to require affordable housing.
8.27 Depending on what is assumed about the incomes of new households produces a different level of newly arising need. It is important to note that this assessment of the ability of new households to afford market housing does not take into account access to equity (e.g. inheritance or family support) or indeed the level of household debt, which would affect affordability. Unlike the calculation of current need, earlier in this section, newly arising need is therefore an estimate and largely dependent on the relationship between future house prices and incomes and assumptions about affordability.
8.28 It is also likely that a number of existing households will fall into need each year as their circumstances change. The second component of the estimate of newly arising need is the number of existing households falling into need. The CLG guidance considers that this should be estimated by the net average number of households joining housing registers each year, i.e. the gross number of new applicants adjusted to reflect those applicants who have been housed, moved away or cancelled their applications.

Central Hampshire & New Forest Strategic Housing Market Assessment Final Report
November 2007
126
8.29 In terms of the minimum estimates produced as part of this assessment, DTZ has assumed that not everyone applying for housing in the future will actually be in housing need. Therefore, the annual average number of households joining the list has been reduced by the overall proportion of households expected to be in need. It is assumed that new applicants will reflect the characteristics of those already on the waiting and transfer lists in terms of the proportions that are in housing need (as defined under our minimum estimate in Figure 8.4).
8.30 Figure 8.8 provides a summary of the estimate of newly arising households in need each year for the five authorities.
Figure 8.8: Summary of Newly Arising Need Per Annum (Stage 2)
Net Household Formation per annum
Proportion unable to
access market housing
Number of new
households requiring affordable
housing
Existing households falling into
need*
Total minimum
newly arising need per annum*
Basingstoke & Deane
1,310 59% 770 150 920
East Hampshire 380 58% 220 120 340 Test Valley 480 52% 250 150 400 Winchester 540 54% 290 100 390 Central Hampshire
2,710 59% 1,600 520 2,050
New Forest 340 66% 220 250 470 Source: Hampshire County Council Households Projections; Dataspring; CACI; LA Housing Management
Systems; HSSA Returns for last 3 years. *Appendix D provides figures for the Upper Estimate, which assumes that all households joining the waiting lists each year are in housing need
Stage 3: Supply of Affordable Homes
8.31 Stage 3 in the assessment establishes the level of supply available to offset identified need and takes into account:
• The number of homes that will become available when existing tenants are re-housed
• The annual supply of social rented re-lets
• Any surplus social rented units e.g. long term vacant property
• Any units that will be taken out of management e.g. demolitions, disposals
• Anticipated supply of new social rented homes
8.32 The rate at which transfer applicants are re-housed varies across each of the local authority areas depending on turnover rates, individual allocation policies and the priority afforded to different categories of applicants and needs groups.
8.33 To maintain a consistent approach to the assessment in each of the local authority areas, the assumption set out in the CLG guidance has been adopted. This assumes that those existing tenants (transfer applicants) in housing need identified in Stage 1 of the assessment will be re-housed and will therefore create a vacancy for another household in need (thus having a nil effect on the overall housing need figures). The number of existing tenants registered on transfer lists and in housing need and therefore the number of units available when these tenants are re-housed is set out in Figure 8.9.

Central Hampshire & New Forest Strategic Housing Market Assessment Final Report
November 2007
127
Figure 8.9: Number of Homes Available for Re-let When Transfer Tenants Housed
Total Number of Homes Number Available Each Year as Transfer Tenants Re-
Housed Basingstoke & Deane 630 130 East Hampshire 340 70 Test Valley 310 60 Winchester 600 120 Central Hampshire 1,880 380 New Forest 320 60
Source: LA Housing Management Systems
8.34 Figure 8.10 sets out the annual supply of affordable housing across the authorities and in most cases is equivalent to around 6% of stock in the social rented sector. This figure is offset against the annual levels of housing need identified in Stages 1 and 2. It is interesting to note that the turnover of social rented homes (6% of the stock each year) is double the turnover of owner occupied homes in each of the authorities (see Section 7).
8.35 The annual supply of social re-lets is based on past trends and excludes lettings to transfer tenants, mutual exchanges, successions and assignations. This provides a net annual supply figure for social rented stock. It was not possible to identify exact numbers of transfers, mutual exchanges for RSL stock in Winchester and Test Valley so a net figure has been derived by adjusting the gross number of re-lets.5
Figure 8.10: Supply of Affordable Housing Through Re-Lets
Social Re-lets (excluding
transfers etc)
Social Rented Stock
Supply as % of social rented
stock
Intermediate Housing (sales average for 3
years) Basingstoke & Deane6 740 11,700 6% 90 East Hampshire7 260 5,730 5% 30 Test Valley 420 7,120 6% 70 Winchester 350 7,240 5% 40 Central Hampshire 1,770 31,790 6% 210 New Forest8 400 8,550 5% 40
Source: HSSA 2005/06 (for stock); LA Housing Management Systems (for LA re-lets), Housing Corporation (for RSL re-lets and Intermediate Sales)
8.36 Figure 8.10 also sets out the number of intermediate homes becoming available each year, excluding those shared ownership units where the purchaser has stair-cased to 100% equity.
8.37 The void rate (vacancies) within the local authority and RSL stock in each authority is presented in Figure 8.11. The CLG guidance states that a certain level of voids is normal
5 For Winchester, we assumed that RSL net re-lets reflected the net re-lets in the local authority’s stock i.e. that net re-lets (excluding transfers, mutual exchanges etc) are 54% of the gross re-let figure. For Test Valley, we assumed that RSL net re-lets were 70% of the gross figure which is an assumption based on DTZ’s experience with other authorities though it is likely to over estimate the actual supply of re-lets 6 Basingstoke & Deane Borough Council provided re-let figures for the RSLs within the Borough. These differ from the Housing Corporation’s figures but are understood to be more accurate because RSLs often count temporary lettings as re-lets. Although it has not been possible to verify, this may mean that re-let data for the RSL stock in other authorities (Test Valley and Winchester) is an over-estimate which would have the effect of increasing the level of need in the other authorities. 7 As above 8 As above

Central Hampshire & New Forest Strategic Housing Market Assessment Final Report
November 2007
128
and allows for transfers and works on properties. If the rate is in excess of 3% these should be counted as surplus stock – this is not the case in any of the authorities considered in this assessment.
Figure 8.11 Social Rented Stock, Void Properties and Void rates
No. of LA Units
No. of RSL Units
Total Social
Rented Stock
Void LA
Stock
Void RSL Stock
Total social rented voids
LA Void rate
RSL Void Rate
Combined Void Rate
Basingstoke & Deane - 11,580 11,700* - 60 60 - 0.5% 0.5% East Hampshire - 5,730 5,730 - 50 100 - 0.9% 1.5% Test Valley - 6,490 7,120* - 50 120* - 0.7% 1.7% Winchester 5,160 2,080 7,240 110 50 160 2.0% 2.4% 2.2% Central Hampshire 5,160 25,880 32,290 110 210 540 2.0% 0.8% 1.7% New Forest 5,050 3,180 8,550* 100 40 140 2.0% 1.3% 1.6%
Source: HSSA Returns 05/06 *Includes ‘other’ public sector stock on HSSA return
8.38 The CLG guidance requires SHMAs to take into account the anticipated supply of new
rented and intermediate homes over the time period of the assessment, in this instance 5 years. Each of the local authorities have estimated future supply taking into account RSL development programmes, future allocations and past outturn. However, the supply of intermediate homes has been excluded from the available supply because we have excluded (as far as possible) households who may be able to afford intermediate housing from the calculation of current and newly arising need.
8.39 Figure 8.12 highlights the estimated future supply of social rented homes compared to proposed housing allocations in the Draft South East Plan. It indicates that the estimates of future supply of affordable homes provided for the housing need assessment equate to around 25-30% of total housing proposed by the Draft South East Plan.

Central Hampshire & New Forest Strategic Housing Market Assessment Final Report
November 2007
129
Figure 8.12: Estimated Annual Supply of New Affordable Housing
Estimated Annual Supply of Social Rented Homes 2007-2012
Proposed Housing Targets (Source Draft RSS 2006-2026)
Estimated Supply 2007-2012
Estimated Annual Average
Annual Average 2006-2026
% of Social Rented
Basingstoke & Deane 1,000 200 825* 25% East Hampshire 350 70 260 27% Test Valley 500** 100** 440 23% Winchester 350*** 70*** 520 20% Central Hampshire 2,350 470 2,050 23% New Forest 330 65 210 31%
Source: Local Authorities for estimate of affordable supply; Draft South East RSS *Growth point status would imply 960 per annum to 2016
**Both Test Valley and Winchester area dependent on delivery of affordable homes at Andover MDA and West Waterlooville MDA in the latter years of the period
***Winchester figures include delivery at West Waterlooville from 2009. This site will accommodate households from Havant and East Hampshire as well under a new choice based lettings system so we have
assumed that one third of social rented units will be available to house Winchester households on the waiting list (particularly given the position of the site in the South Hampshire (eastern pole) housing market area)
8.40 It is questionable as to whether anticipated future supply should be included in the
assessment to offset identified need, particularly where authorities are dependent on one or two major strategic development sites and in the case of Winchester, one major source of supply is likely to serve a different housing market area, associated with Havant and the south of East Hampshire. We have therefore presented housing need figures with and without anticipated new supply to illustrate the impact on housing need if new supply is not forthcoming. Figure 8.13 provides a summary of the available supply to offset need – the output for Stage 3 of the housing need assessment.
Figure 8.13: Available Supply to Offset Need (Stage 3)
Supply Available When Transfer
Tenants in Need Re-Housed Per Annum
Net Re-Lets Per Annum (average for last 3 years)
Anticipated New Supply of Social
Rented Homes Per Annum
Total Available
Supply Per Annum
Basingstoke & Deane 130 740 200 1,060 East Hampshire 70 260 70 400 Test Valley 60 420 100 580 Winchester 120 350 70 510* Central Hampshire 380 1,770 440 2,440 New Forest 60 400 60 530
Source: LA Housing Management Systems; Housing Corporation *Winchester figure takes account of an additional 30 dwellings to be taken out of management

Central Hampshire & New Forest Strategic Housing Market Assessment Final Report
November 2007
130
The Level of Housing Need
8.41 The level of housing need when current and newly arising are added together and offset with the available supply of social rented homes is set out in Figure 8.14. DTZ consider that it is useful to produce a range for the level of housing need given that any assessment of housing need is an estimate and based on a number of assumptions. Figure 8.14 summarises the level of need for affordable (primarily social rented housing) assuming anticipated supply over the next 5 years is delivered. It also sets out the level of need if this supply was not forthcoming. It is important to note that Figure 8.14 represents a minimum position since efforts have been taken to ensure that the households included in this estimate are either currently in housing need or likely to require it in the future on the basis of their income.
8.42 Figure 8.14 shows that in all of the authorities, the level of housing need exceeds what will be delivered by way of new affordable housing (for social rent) each year. In Central Hampshire as a whole the minimum estimate of housing need suggests that there is a need for around 1,440 additional affordable (social rented) homes each year, on top of what is planned to be delivered from 2007-2012, with a further 560 required in New Forest.
Figure 8.14: Minimum Estimate of Housing Need (Social Rented Homes) by Authority, Per Annum
Minimum estimate Without New Supply With New Supply
Basingstoke & Deane 780 580 East Hampshire 350 280 Test Valley 380 280 Winchester 380 310 Central Hampshire 1,890 1,450 New Forest 660 600
Note: see Appendix D for summary calculations for each authority
8.43 The minimum estimates in Figure 8.14 will underestimate the level of housing need within each authority because we have excluded from the calculation of current need any households that could not be identified as having an element of housing need. In reality, some of these households may need to move for other reasons but be unable to afford to meet their needs within the market. Furthermore, there are likely to be a number of households who are in housing need and unable to meet their needs within the market but who do not register with the local authority e.g. because they think there is little prospect of being housed. However, against this there may be households in need on the local authority waiting lists who manage to resolve their own situations without the need for assistance. It is possible to illustrate the existence of housing need, beyond those households registered with each local authority by considering the circumstances of households who have expressed an interest in intermediate housing options.
8.44 Figure 8.15 demonstrates that a significant number of households who are interested in intermediate housing within each of the authorities do not have sufficient income to access the private rented sector (and therefore most intermediate options) but are not registered on any of the local authority waiting lists. These households may need to access social rented accommodation but are not included in our estimates of housing need.

Central Hampshire & New Forest Strategic Housing Market Assessment Final Report
November 2007
131
Figure 8.15: Households Interested in Intermediate Housing but Likely to Need Social Rented Accommodation
East Hampshire
Basingstoke & Deane
Test Valley
Winchester New Forest
Total on Zone Agent’s list interested in intermediate housing (excludes cancellations)
610 1,050 1,110 760 640
Households on list with insufficient income for market rent but not on an authority's housing waiting list*
250 500 440 340 320
Source: Swaythling (Zone Agent) *Assuming households spend 33% of their gross income on rental costs (25-33% recommended in Guidance)
8.45 Figure 8.16 provides an upper estimate, which includes all households who have applied
for housing in the five authorities, not just those applicants with identified need. Figure 8.16 illustrates that the need for affordable housing could be as high as over 2,000 dwellings in Central Hampshire and 1,000 dwellings in New Forest (even with new supply over the next 5 years). Figure 8.15 provides evidence that the true upper estimate might actually be higher than the figures presented in Figure 8.16 since there are a number of households without sufficient incomes to access market housing who are not registered with the local authorities. However, conversely, the circumstances of some households on waiting lists will change over time and they may then be able to meet their own needs. In addition, if new supply is not forthcoming households may decide not to apply given the limited prospect of being housed and this would moderate the numbers of the waiting lists.
8.46 It is also relevant to note that the upper estimates largely reflect the total number of applicants on local authority waiting lists. Consultation with housing need managers in some authorities suggested that the move to Choice Based Letting schemes (in operation in New Forest and Test Valley) often led to an increase in applications and total numbers of households on waiting lists. To some extent this needs to be considered when comparing the upper estimates of housing need in each authority.
Figure 8.16: Upper Estimate of Housing Need by Authority, Per Annum
Upper Estimate Without New Supply (Per Annum)
With New Supply (Per Annum)
Basingstoke & Deane 1,130 930 East Hampshire 730 660 Test Valley 670 570 Winchester 440 370 Central Hampshire 2,970 2,530 New Forest 1,060 1,000
8.47 The estimates of housing need, particularly the level of newly arising need, are dependent on affordability within the market. We have estimated the proportion of new households who may be unable to afford to rent within the market on the basis of the distribution of incomes for all households and the lower incomes of new households. This is an assumption and it is also a component of the assessment that is likely to change as house prices and incomes change over time. It is therefore useful to consider what the impact would be on the level of housing need if affordability changed in each of the authorities.

Central Hampshire & New Forest Strategic Housing Market Assessment Final Report
November 2007
132
8.48 Figure 8.17 shows how the minimum estimate of housing need is affected by changes in the affordability of market housing for new households. Figure 8.17 illustrates that a 10% improvement in affordability (of market rented accommodation) within Central Hampshire could reduce the level of housing need by around 280 households. Similarly, a 10% decline in affordability could increase the level of need by the same quantum.
Figure 8.17: Minimum Estimate of Housing Need With Different Affordability Scenarios, By Authority, Per Annum
Minimum estimate (Per Annum)
Affordability Changes (Proportion Unable to Afford Market Rent
With New Supply 10% Improvement 10% Decline
Basingstoke & Deane 580 450 710 East Hampshire 280 240 310 Test Valley 280 230 330 Winchester 310 260 370 Central Hampshire 1,450 1,180 1,720 New Forest 600 570 630
Tenure, Type and Size of Affordable Homes
8.49 The guidance also requires the housing need assessment to provide an estimate of the demand for intermediate affordable housing. There are at least 2,000 affordable (social rented) homes per annum required to meet need in the five authorities even when new supply is considered. These households have been identified as being in housing need (e.g. living in overcrowded conditions etc) and eligible for social rented accommodation and are estimated to be unable to meet their needs within the market – either to rent or to buy.
8.50 Whilst a small proportion of these households may be able and willing to access intermediate housing options, limited data is available on their incomes and based on what is known about the purchasers of intermediate housing this is likely to be very limited.9 Therefore, we assume that the vast majority of these households will require social rented accommodation.
8.51 Furthermore, analysis of Swaythling Housing Society’s (the Zone Agent for Hampshire) list of households interested in intermediate housing suggests that there is only a very limited overlap between Swaythling’s list and local authority housing registers. Figure 8.18 shows that around 10% of households interested in intermediate housing are also registered on local authority waiting lists. The absolute numbers are relatively small – with only Basingstoke and Test Valley having more than 100 households registered on both – accounting for 2% of Basingstoke’s housing register and 3% of Test Valley’s housing register.
8.52 Figure 8.18 shows that there are, however, relatively significant numbers of households who have expressed an interest in intermediate housing options – with around 3,000 households in Central Hampshire and a further 500 in New Forest. Although this does not take into account the willingness of households to access intermediate products even though they may have expressed an interest, Figure 8.19 also shows that relatively significant numbers of households have recently bought or rented or are in the process of
9 CLG Analytical Services Directorate (2006) Who are Low Cost Home Ownership Purchasers and what is the demand for LCHO?

Central Hampshire & New Forest Strategic Housing Market Assessment Final Report
November 2007
133
buying or renting intermediate homes, which demonstrates a level of demand for these options.
Figure 8.17: Households Registered for Intermediate Housing By Local Authority
Households Interested in Intermediate Housing
Location of Choice
Currently Interested
Of which Completed/ In Process of Buying/ Actively Looking
Interested but not in process of
buying
Registered on LA Waiting
List
% Registered on Waiting
List Basingstoke & Deane
1,050 160 890 110 10%
East Hampshire 610 90 520 50 7% Test Valley 1110 210 900 120 11% Winchester 760 150 610 80 10% Central Hampshire
3,530 610 2,920 350 10%
New Forest 640 120 520 90 14% Source: Swaythling Housing Society
8.53 Figure 8.18 sets out the current tenure of households listed as interested in intermediate housing options. The vast majority of households are either living in private rented accommodation or with family and friends (which is generally considered as part of the private rented sector). Around 10% are social rented tenants (17% in the New Forest) and a further 8-9% are owner occupiers.
8.54 These figures suggest that, although limited compared to other tenures, there is some interest amongst social rented tenants to access intermediate housing options. Whilst intermediate products may have a limited role in meeting the needs of those households in need on authority waiting lists they may help to move other households out of social rented accommodation and free up a dwelling that can be re-let to someone in need.
Figure 8.18: Current Tenure of Households on Intermediate Housing List
Private Rented
Friends/ Family
Social Rented
Owner Occupation
Shared Ownership
Other
Basingstoke & Deane 36% 39% 11% 7% 2% 5% East Hampshire 41% 33% 10% 10% 3% 5% Test Valley 43% 34% 11% 8% 1% 2% Winchester 42% 35% 8% 7% 1% 7% Central Hampshire 40% 36% 10% 8% 2% 4% New Forest 39% 29% 17% 9% 3% 3%
Source: Swaythling Housing Society
• Analysis of the household incomes of those interested in intermediate housing reveals that not all of those interested in these options would be able to afford them (see Figure 8.19). A small proportion would also be able to by in the open market based on their income and lower quartile house prices

Central Hampshire & New Forest Strategic Housing Market Assessment Final Report
November 2007
134
Figure 8.19: Household Income of Households Interested in Intermediate Options
East Hampshire
Basingstoke & Deane
Test Valley Winchester New Forest
Could afford to buy in open market in District*
7% 14% 9% 3% 8%
Could afford to buy in open market in Central Hampshire area**
3% - - 6% -
Could afford to rent in open market in District***
45% 32% 46% 40% 35%
Unable to afford market rent
46% 55% 45% 51% 57%
Total (%) 100% 100% 100% 100% 100% Total on List (excludes cancellations)
610 1050 1110 760 640
Source: Swaythling (Zone Agent) *Open market prices to buy or rent based on Section 7 purchase/rental income thresholds
**Income required to purchase in Central Hampshire is £42,000 ***Assuming households spend 33% of their gross income on rental costs (25-33% recommended in
Guidance)
8.55 This evidence raises an number of points and implications for policy:
• To what extent should affordable housing policies meet the aspirations of those who are able to afford home ownership (but may perhaps prefer a better location or a home that better meets their requirements)?10
• Given the overlap between households who could afford open market rents or intermediate options, how should local authorities balance their efforts between the provision of intermediate housing and the development of a high quality private rented sector?
• Given the number of households interested in intermediate options but on low incomes how far can products be developed to meet their needs and aspirations (bearing in mind ‘cheaper’ intermediate products will impact on the viability of housing developments)?
8.56 The majority of households registered as interested in intermediate options would prefer a two bedroom property with around one third preferring a 3 bedroom property. Despite the majority of households on the register being either single people or couples relatively small proportions would prefer a 1 bedroom property. This does not mean that they are able to afford the size of dwelling that they prefer but it illustrates that given the choice most households would opt for more space than they might be judged to need.
10 Local authorities have a role in promoting a choice of housing within their areas (PPS3); Government also sets a limit of incomes up to £60,000 as eligible for intermediate housing so all households on Swaythling’s list would be eligible on this basis

Central Hampshire & New Forest Strategic Housing Market Assessment Final Report
November 2007
135
Figure 8.20: Size of Home Preferred by Households on Intermediate Housing List
Size of Home Preferred 1 bedroom 2 bedroom 3 bedroom 4 bedroom
Basingstoke & Deane 11% 61% 26% 2% East Hampshire 11% 56% 31% 1% Test Valley 14% 58% 27% 1% Winchester 18% 62% 19% 1% Central Hampshire 14% 60% 26% 1% New Forest 13% 59% 27% 1%
Source: Swaythling Housing Society
The Type and Size of Affordable (Social Rented) Housing
8.57 Whilst PPS3 does not encourage local planning authorities to specify the type and size of market dwellings, it does expect them to set out the requirements for affordable housing. This is because there are fundamentally different drivers operating in the affordable housing sector. In the social rented sector the type and size of dwellings available to particular households are determined through the allocation policies of local authorities11, in contrast to the open market (and intermediate market) where household income rather than household size determines the type and size of dwelling that households can afford to occupy.
8.58 In considering the likely requirements of those households in housing need and those likely to fall into housing need in the future, it is useful to consider the profile of households identified through the housing needs assessment. Although the housing needs assessment methodology is not designed to give a definitive view on the types and sizes of property needed to meet housing need, analysis of housing register data can provide useful indicators of the relative pressures on different property types and sizes and therefore the broad requirement for different dwellings.
8.59 However, it is important to note that the preferences expressed by applicants are often influenced by local policy and circumstances, in particular:
• Size criteria set out in local allocations policy which can restrict the size and type of property for which households can apply. For example, it is often the case that single and two person households may only apply for bed sit and 1 bedroom flatted accommodation while given a ‘free choice’ they may prefer 2 bedroom accommodation
• Priorities and point systems set out in allocation policies will determine which category of applicants are most likely to access the available stock and often applicants will tailor their expressed choices to maximise their chances of being re-housed. For example, a household with one child may prefer 3 bedroom property but know that the allocation policy prioritises households who would fully occupy the available 3 bed accommodation before smaller households would be considered. Therefore although the allocation policy may not overtly restrict applicant choice, it will indirectly impact on household preferences
11 Choice Based Lettings Systems (in operation in New Forest and Test Valley) mean that the authorities/ RSL themselves do not allocate housing in the same way. Applicants have a choice, which is reflected in their bids for different properties that become available. However, in the context of a shortage of affordable housing overall households are only likely to be able to meet their basic needs

Central Hampshire & New Forest Strategic Housing Market Assessment Final Report
November 2007
136
• The supply of particular property sizes and types will affect applicants’ choices according to their own circumstances and their ability to wait
Requirement for Size of Properties of Households on Waiting Lists
8.60 Figures 8.21 and 8.22 show the size of dwellings needed by those on the authority waiting and transfer lists. In all cases, the majority of households registered need a one bedroom property. However, the size requirement of those in need is likely to differ from the requirements of households as a whole. It has not yet been possible to analyse the size requirements of households in need on a comparable basis across the five authorities, however, the difference can be illustrated by East Hampshire data.
8.61 When all applicant households in East Hampshire are considered the need for one bedroom properties is around 67%. However, amongst households identified as in need the proportion needing one bedroom properties is 55%, with 37% needing two bedrooms and a further 8% needing 3 bedrooms. Amongst those with the most acute need (who have 50+ points on the waiting list) the majority need 2 bedroom or larger properties. There appears to be the need for larger properties to meet housing need than implied by the profile of households on the whole waiting list.
Figure 8.21: Size Requirement of All Households on Waiting Lists
1 bed 2 bed 3 bed 4 + bed TOTAL Basingstoke and Deane 3,430 970 880 140 5,430 East Hampshire 1,820 620 250 40 2,730 Test Valley 2,090 870 570 60 3,590 Winchester 1,700 540 330 20 2,590 Central Hampshire 9,040 3,000 2,030 270 14,330 New Forest 2,780 1,470 700 120 5,070
Source: LA Housing Management Systems
Figure 8.22: Size Requirement (%) of All Households on Waiting Lists
1 bed 2 bed 3 bed 4 + bed Basingstoke and Deane 63% 18% 16% 3% East Hampshire 67% 23% 9% 1% Test Valley 58% 24% 16% 2% Winchester 66% 21% 13% 1% Central Hampshire 63% 21% 14% 2% New Forest 55% 29% 14% 2%
Source: LA Housing Management Systems

Central Hampshire & New Forest Strategic Housing Market Assessment Final Report
November 2007
137
Pattern of Re-lets by Size of Property
8.62 It is important to consider the pattern of re-lets within the stock of social rented homes in each authority in order to assess the prospect of meeting the need for different sized affordable homes.
Figure 8.23: Size of Re-Lets (averaged over last 3 years)
1 bed 2 bed 3 bed 4 + bed TOTAL Basingstoke and Deane 300 290 160 60 820 East Hampshire12 130 90 30 1 260 Test Valley 190 140 100 40 460 Winchester 290 190 70 10 550 Central Hampshire 910 710 360 110 2,090 New Forest 310 190 100 30 630
Source: LA Housing Management Systems & Housing Corporation (for RSL Re-lets) Note: With the exception of East Hampshire we have used Housing Corporation data for the RSL re-lets
Figure 8.24: Size of Re-Lets % (averaged over last 3 years)
1 bed 2 bed 3 bed 4 + bed TOTAL Basingstoke and Deane 37% 35% 20% 8% 100% East Hampshire 52% 35% 13% 1% 100% Test Valley 41% 29% 21% 9% 100% Winchester 52% 35% 12% 1% 100% Central Hampshire 44% 34% 17% 5% 100% New Forest 50% 30% 16% 4% 100%
Source: LA Housing Management Systems & Housing Corporation (for RSL Re-lets except East Hampshire)
8.63 Figures 8.23 and 8.24 set out the pattern of re-lets for the local authority and RSL stock in each authority, averaged for the last three years, and shows that 1 and 2 bedroom properties become available for re-let most frequently in all authorities. This may mean that there are relatively significant pressures on larger social rented properties than implied by the size requirement of those on the waiting lists.
8.64 Figure 8.25 presents analysis of the relative pressure on different property sizes based on a comparison of the number households registered to the number of allocations by property size. In all authorities the greatest pressure appears to be on one bedroom properties with up to 11 households for every property re-let in Basingstoke and Test Valley and 14 in East Hampshire. To some extent this reflects the entitlement of different households to different sized properties in local authority allocation policies, with the pressure on one bedroom properties coming from couples as well as single person households. It is also likely that the pressure on different sized properties would shift if only the requirements of those in housing need were considered.
8.65 However, this type of analysis is useful since it can give the authorities and RSLs an indication of the sizes of properties they might prioritise through new development. For example, although relatively fewer 3 bedroom dwellings are required in absolute terms, in both Basingstoke, East Hampshire and Winchester, the analysis in Figure 8.25 suggests that there may be a case for prioritising their provision over 2 bedroom dwellings. There may also be a case for reviewing allocation policies to relieve the pressure on the smallest stock (by allowing households entitled to 1 bedroom to access 2 bedroom properties).
12 Data provided by the authority for RSL re-lets rather than the Housing Corporation

Central Hampshire & New Forest Strategic Housing Market Assessment Final Report
November 2007
138
However whilst this may help to even out the pressure on different sized dwellings it may not reduce the overall level of need.
Figure 8.25: Pressure on Different Sized Social Rented Dwellings – Ratio of Applicants to Re-Lets by Size of Dwelling
1 bed 2 bed 3 bed 4 + bed Basingstoke and Deane 11 3 5 2
East Hampshire 14 7 8 40* Test Valley 11 6 6 2 Winchester 6 3 5 3
Central Hampshire 10 4 6 3 New Forest 9 8 7 5
Source: LA Housing Management Systems & Housing Corporation (for RSL Re-lets) *Reflects the fact that only 1 4-bedroom property has been re-let each year

Central Hampshire & New Forest Strategic Housing Market Assessment Final Report
November 2007
139
9 FUTURE HOUSING PROVISION IN CENTRAL HAMPSHIRE & NEW FOREST
9.01 This section draws together a range of evidence to inform the mix of dwellings in the future. The evidence considered in this section is as follows:
• The profile of current and future households (drawing on Section 4 and further evidence on future households) and what this implies for the mix of dwellings
• The nature of the existing stock of dwellings (drawing on Section 6) and whether there are any particular imbalances in different areas
• The type and size of completions and the impact this may have on the stock
• The drivers in the development industry and how these affect the mix of dwellings that developers deliver
• Occupancy and overcrowding (drawing on Section 6) and whether the current stock of dwellings is meeting the needs and demands of residents
Key Points
• Growth in one-person households is expected in all authorities but does not imply the need for the majority of market dwellings to be small homes. The demand for market homes will reflect a complex set of factors relating to household income and life stage rather than simply household size
• There is a relatively wide choice of types and sizes of dwellings within the housing market area although in the last three years there has been a high proportion of two bedroom dwellings completed in most authorities, particularly in Basingstoke and Deane and Winchester. Recent completions in Central Hampshire have included increasing proportions of flats, in common with the South East region as a whole
• However, a continued trend in provision of a high volume of flats could potentially add inflexibility to the stock over time and the future of the Buy-to-Let market is uncertain. BTL has emerged in a period of rising property prices, low interest rates and poorly performing alternative investments. Were this context to change, new investment within BTL and therefore demand for flats could be turned off, with consequences for delivery
• Nevertheless, larger dwellings continue to account for a significant proportion of the overall dwelling stock. In Central Hampshire in 2001, 75% of dwellings consisted of 5 rooms (2/3 bedrooms) or above and the same applied to 73% of dwellings in the New Forest
• There are relatively high levels of under occupancy evident in Central Hampshire and the New Forest in the owner occupied and private rented sectors. There is an element of overcrowding in the social rented sector however, with 11% of houses over occupied.
• It is also important to remember the role that new development plays in the housing market. In the same way that first time buyers are essential to the functioning of the market by allowing other households to trade up, new housing provides the space for other households to move into so that those below them on the housing ladder can move up. On average property in the second hand market in the South East is nearly 30% cheaper than equivalent newly built property1. This means that new build property primarily appeals to those trading up who can afford to pay more and, as they are trading up, will often want more space.
1 Chapter 4, Barker Review (December 2003) Interim Report: Analysis

Central Hampshire & New Forest Strategic Housing Market Assessment Final Report
November 2007
140
9.02 One of the key policies in the new PPS3 is concerned with achieving a mix of housing to support mixed communities. PPS3 describes the characteristics of a mixed community as a ‘variety of housing, particularly in terms of tenure and price and a mix of different households such as families with children, single person households and older people.’ PPS3 requires local planning authorities to plan for a mix of households on the basis of different types of households that are likely to require housing over the plan period, having regard to demographic profiles and the requirements of specific groups.
9.03 Specifically, local planning authorities should set out in their local development documents the proportion of households requiring market and affordable housing (considered in Sections 7 and 8), the profile of different household types to inform the provision of market housing and the size and type of affordable housing required. Developers are expected to bring forward proposals for market housing which reflect demand and the profile of households requiring market housing, in order to support mixed communities.
9.04 This raises a number of questions. How can local planning authorities plan for a mix of households without seeking to control the type and size of market housing? When should a local planning authority turn down an application on the basis of the dwelling mix? These questions are in many respects no different to those that planners have faced in the past. Planning falls into the difficult territory between influence and control where planners are expected to influence outcomes without seeking to control the market.
9.05 For the avoidance of doubt, DTZ do not recommend that local authorities seek to control the size and type of dwellings provided by the private sector. However, there is clearly a role for local planning authorities in influencing the mix of dwellings and, at the very least, understanding where there are gaps in the choice of dwellings available to local residents. DTZ recommend that the principles of an approach to this issue are as follows:
• Recognise that planning for a mix of housing is not a precise science and therefore setting targets for particular types and sizes of market dwellings is likely to present difficulties in practice
• The objective should be to identify and address bias and broad imbalances in the housing market and the existing stock of dwellings through new development
• A range of evidence needs to be considered in addition to projections of future household types, and appropriate weight needs to be given to these factors depending on the circumstances of the site and the characteristics of the existing neighbourhood
9.06 The local planning authorities within Central Hampshire and New Forest can use the evidence in this report alongside considerations about specific sites and neighbourhoods in planning for a mix of housing in their areas and in determining development applications.
The Profile of Current and Future Households
9.07 Section 4 of this report provides detailed evidence and analysis of demographics in each of the housing markets within Central Hampshire and New Forest and the individual local authorities. Figure 9.1 provides a detailed breakdown of the households within each of the authority areas within the Central Hampshire and the New Forest. The table demonstrates that, at present, couple households with or without children account for the most significant household groups in all of the authority areas and the Central Hampshire market area.

Central Hampshire & New Forest Strategic Housing Market Assessment Final Report
November 2007
141
Figure 9.1: Household Composition 2001 (Source: Census 2001)
Size
Central Hampshire
Market Area
New Forest West & Central
New Forest
Basingstoke and Deane
East Hampshire
Test Valley Winchester
South East England
Total Households 2001 154,500 44,500 72,000 61,700 43,600 44,100 43,100 3,287,500 20,451,400One person - pensioner 1 19,800 9,000 12,400 6,600 5,700 5,700 6,700 473,200 2,939,500One person - other 1 20,500 4,300 7,500 9,000 5,100 5,100 5,400 464,300 3,210,800Pensioner Couples 2 14,100 7,600 10,500 4,800 4,500 4,200 4,600 320,100 1,826,500Couple Households Without Children
2 33,200 8,600 14,100 13,300 9,500 9,900 9,000 634,900 3,633,300
Couple Households - With dependent children
3+ 36,500 7,800 14,600 15,100 10,800 10,900 9,600 725,100 4,252,400
Couple Households - All Children Non Dependent
2 10,000 2,500 4,500 4,300 2,800 3,000 2,500 201,400 1,284,500
Lone Parent Households - with dependent children
2+ 7,400 1,600 3,100 3,200 2,000 2,100 1,600 171,500 1,312,000
Lone Parent Households - all children non dependent
1 4,000 1,100 1,900 1,700 1,100 1,100 1,000 88,500 622,900
Other households - with dependent children
2+ 2,600 600 1,000 1,100 700 700 600 62,600 458,400
Other households - all student
2+ 300 0 0 0 0 0 300 11,700 79,100
Other households - all pensioner
2+ 600 300 400 200 200 200 200 14,200 82,400
Other households - other 2+ 5,500 1,200 1,900 2,200 1,300 1,300 1,600 120,100 749,700
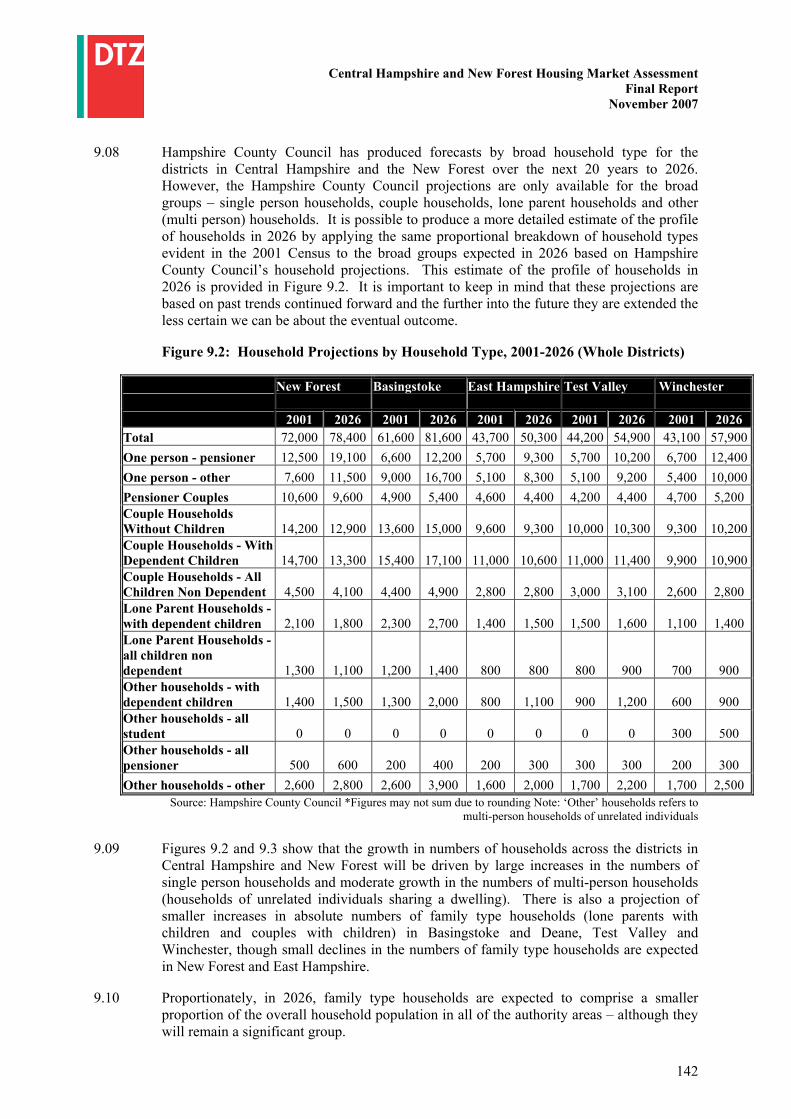
Central Hampshire and New Forest Housing Market Assessment Final Report
November 2007
142
9.08 Hampshire County Council has produced forecasts by broad household type for the districts in Central Hampshire and the New Forest over the next 20 years to 2026. However, the Hampshire County Council projections are only available for the broad groups – single person households, couple households, lone parent households and other (multi person) households. It is possible to produce a more detailed estimate of the profile of households in 2026 by applying the same proportional breakdown of household types evident in the 2001 Census to the broad groups expected in 2026 based on Hampshire County Council’s household projections. This estimate of the profile of households in 2026 is provided in Figure 9.2. It is important to keep in mind that these projections are based on past trends continued forward and the further into the future they are extended the less certain we can be about the eventual outcome.
Figure 9.2: Household Projections by Household Type, 2001-2026 (Whole Districts)
New Forest
Basingstoke
East Hampshire
Test Valley
Winchester
2001 2026 2001 2026 2001 2026 2001 2026 2001 2026 Total 72,000 78,400 61,600 81,600 43,700 50,300 44,200 54,900 43,100 57,900One person - pensioner 12,500 19,100 6,600 12,200 5,700 9,300 5,700 10,200 6,700 12,400One person - other 7,600 11,500 9,000 16,700 5,100 8,300 5,100 9,200 5,400 10,000Pensioner Couples 10,600 9,600 4,900 5,400 4,600 4,400 4,200 4,400 4,700 5,200 Couple Households Without Children 14,200 12,900 13,600 15,000 9,600 9,300 10,000 10,300 9,300 10,200Couple Households - With Dependent Children 14,700 13,300 15,400 17,100 11,000 10,600 11,000 11,400 9,900 10,900Couple Households - All Children Non Dependent 4,500 4,100 4,400 4,900 2,800 2,800 3,000 3,100 2,600 2,800 Lone Parent Households - with dependent children 2,100 1,800 2,300 2,700 1,400 1,500 1,500 1,600 1,100 1,400 Lone Parent Households - all children non dependent 1,300 1,100 1,200 1,400 800 800 800 900 700 900 Other households - with dependent children 1,400 1,500 1,300 2,000 800 1,100 900 1,200 600 900 Other households - all student 0 0 0 0 0 0 0 0 300 500 Other households - all pensioner 500 600 200 400 200 300 300 300 200 300 Other households - other 2,600 2,800 2,600 3,900 1,600 2,000 1,700 2,200 1,700 2,500
Source: Hampshire County Council *Figures may not sum due to rounding Note: ‘Other’ households refers to multi-person households of unrelated individuals
9.09 Figures 9.2 and 9.3 show that the growth in numbers of households across the districts in
Central Hampshire and New Forest will be driven by large increases in the numbers of single person households and moderate growth in the numbers of multi-person households (households of unrelated individuals sharing a dwelling). There is also a projection of smaller increases in absolute numbers of family type households (lone parents with children and couples with children) in Basingstoke and Deane, Test Valley and Winchester, though small declines in the numbers of family type households are expected in New Forest and East Hampshire.
9.10 Proportionately, in 2026, family type households are expected to comprise a smaller proportion of the overall household population in all of the authority areas – although they will remain a significant group.

Central Hampshire and New Forest Housing Market Assessment Final Report
November 2007
143
Figure 9.3: Household Projections by Household Types By Local Authority (%) (Whole Districts)
New Forest
Basingstoke
East Hampshire
Test Valley
Winchester
2001 2026 2001 2026 2001 2026 2001 2026 2001 2026 Total 72,000 78,400 61,600 81,600 43,700 50,300 44,200 54,900 43,100 57,900One person - pensioner 17% 24% 11% 15% 13% 18% 13% 19% 16% 21% One person - other 11% 15% 15% 20% 12% 17% 12% 17% 13% 17% Pensioner Couples 15% 12% 8% 7% 11% 9% 10% 8% 11% 9% Couple Households Without Children 20% 16% 22% 18% 22% 18% 23% 19% 22% 18% Couple Households - With dependent children 20% 17% 25% 21% 25% 21% 25% 21% 23% 19% Couple Households - All Children Non Dependent 6% 5% 7% 6% 6% 6% 7% 6% 6% 5% Lone Parent Households - with dependent children 3% 2% 4% 3% 3% 3% 3% 3% 3% 2% Lone Parent Households - all children non dependent 2% 1% 2% 2% 2% 2% 2% 2% 2% 2% Other households - with dependent children 2% 2% 2% 2% 2% 2% 2% 2% 1% 2% Other households - all student 0% 0% 0% 0% 0% 0% 0% 0% 1% 1% Other households - all pensioner 1% 1% 0% 0% 0% 1% 1% 1% 0% 1% Other households - other 4% 4% 4% 5% 4% 4% 4% 4% 4% 4%
Source: Hampshire County Council *Figures may not sum due to rounding
9.11 To summarise, the districts in Central Hampshire will experience strong growth in household numbers between 2001 and 2026; much of this growth will be driven by increases in smaller and non-traditional household units; but couple households (including families) will still be the largest household group in 2026, representing at least half of all household types in all the districts of Central Hampshire and New Forest.
9.12 However, while the growth in single person households will be significant, DTZ suspect that these projections may overstate the level of growth of single person households. If affordability problems remain as severe as they have over the last few years, one might expect to see more households comprising unrelated individuals (multi-person households) rather than single person households. This trend is very evident in areas with severe affordability problems, such as inner London.
9.13 It is also worth bearing in mind that a significant proportion of the single person households will be elderly. Around half of the growth in single person households is accounted for by elderly households and is the result of an ageing population. This is true for all of the authority areas and is consistent with trends at the national and regional level. However, there are additional dynamics in operation, particularly in the New Forest, where increases in the numbers of older households in the past have exceeded the growth in other authorities due to in-migration of these households and hence future projections expect some continuation of this trend.
9.14 There can be no formal definition of when people are deemed old. In terms of individual circumstances and public policy, significant changes arise when people retire from work, become incapacitated in some way, and linked to this lose the ability to live independently.

Central Hampshire and New Forest Housing Market Assessment Final Report
November 2007
144
Entitlement to benefits kicks in at particular ages, but in reality there are different stages of old age.
9.15 Consider the difference in personal circumstances of those who may be of the same age but: • remain in good health and have a high level of independence • experience acute health problems and whose health may suddenly decline • have chronic health problems and poor quality of life • are able to draw on their savings to fund later life • are reliant on public funding to support them
9.16 What is certain is that the number of older people in Central Hampshire’s and New Forest’s population is increasing and that the numbers surviving to old age (75+) is also increasing. In future housing – and planning policy to a lesser extent – needs to address the needs and demands of older people.
9.17 Older households have high levels of owner occupation and so there will be increasing numbers of older home owners in the future. Some research suggests that older people tend to own lower value homes (with obvious implications for their choices and their ability to draw on housing assets).2
9.18 The overwhelming majority of older households will prefer to remain in their present home but this may, in some cases, be because of the lack of attractive alternatives. Sometimes the only alternatives available to older people are sheltered housing or care homes.3 At present, many do not consider moving home.
9.19 Many older people will wish to retain their independence in their existing home by arranging adaptations for example. Some may emigrate, though this is limited at present. Those who do decide to move home tend to do so in earlier old age (e.g. following retirement) or in later old age when they need extra care and independent living is a struggle.
9.20 However, whether they move early or late in old age, moving will involve much more than the choice of a house. The issues involved extend beyond physical design and include social relationships, access to shopping and services and awareness of future needs. Some older people may move because their house is in disrepair or is unmanageable.
9.21 Moving home is major ‘life’ decision, entailing important financial and personal decisions. On the financial side key issues include consideration of whether to use the value in the property to support an existing lifestyle, provide for care costs, or to assist the next generation to study or to enter the housing market. On the personal side, moving home raises issues about proximity to family and friends, formal and informal caring networks etc. Attitudes to these issues are in part culturally determined so people from differing backgrounds may be inclined to place different priorities on different aspects of their decisions.
9.22 Most of those in the 45-65 age group are likely to be adequately housed in the immediate term in the sub-region. However, growth in the 75+ age group presents policy challenges. Policy makers will need to consider the housing, health and care needs of elderly people in the round, recognising that the majority of elderly people are owner occupiers. Decision makers need to consider the implications for policy of increasing reliance on equity release 2 Appleton, N (2002) Planning for the Majority: The Needs and Aspirations of Older People in General Housing Joseph Rowntree Foundation 3 ibid

Central Hampshire and New Forest Housing Market Assessment Final Report
November 2007
145
to pay for care, planning for efficient delivery of services, and considering the requirements of older people in the design of new neighbourhoods.
9.23 These issues are almost certain to grow over time as people live longer and as pension provision becomes less certain. Governments are increasingly likely to look to encourage people to use housing equity to pay for their various needs.
The Relationship Between Household Size and Dwelling Size
9.24 The relationship between household size and type and dwelling size and type is not straightforward. The conventional logic that household size and dwelling size have a direct correlation is misleading. Research by Professor David King at Anglia University4 for example, highlights that dwellings with more than seven rooms are commonly bought and occupied by single or two-person households, and that these households comprise many of those living in such properties. Section 6 also demonstrates that across Central Hampshire and New Forest most households ‘under occupy’ their dwellings. According to this research, policy orientated towards building smaller properties for smaller households fails to understand the aspirations and needs of households today and in the future.
9.25 The complexity of the relationship between household size and dwelling size is illustrated in Figures 9.4, 9.5 and 9.6. These show the relationship of household size and dwelling size in the South East of England. It is possible to undertake the same analysis using household type instead of household size (see Figures 9.7 to 9.9).
9.26 Figure 9.4 shows that while 1 and 2 bed dwellings are lived in almost exclusively by small households, significant numbers of larger properties accommodate one or two person households. Thus two person households account for a greater proportion of dwellings with 6 or more bedrooms (14%) than six person households (13%). Two person households also occupy the largest proportion of four bed houses (39%).
Figure 9.4: Household Size by Size of Property in the South East (2004)
4 Dave King (2005) Room to Move? Household Formation, Tenure and Housing Consumption

Central Hampshire and New Forest Housing Market Assessment Final Report
November 2007
146
Figure 9.5: Size of Household by Size of Property in South East England 2004
One Bed Two Bed Three Bed
Four Bed
Five Bed Six or more beds
One Person 74 36 18 10 5 9 Two Person 24 47 39 39 33 14 Three Person 1 11 17 14 13 6 Four Person 1 6 20 24 26 27 Five Person 0 1 4 8 14 31 Six+ Persons 0 0 2 4 8 13 Total 100% 100% 100% 100% 100% 100%
Source: Survey of English Housing/ODPM
Figure 9.6: Size of Property by Size of Household in South East England 2004
One Bed
Two Bed Three Bed
Four Bed
Five Bed
Six or more beds
All
One Person 32 31 29 7 1 0 100% Two Person 7 28 43 18 3 0 100% Three Person 1 19 56 19 4 1 100% Four Person 1 9 55 27 7 2 100% Five Person 0 4 39 35 14 8 100% Six+ Persons 0 2 38 36 17 7 100%
Source: Survey of English Housing/ODPM
9.27 Within the wider South East, Figure 9.7 shows very significant numbers of couples without children living in 4/5/6 bed dwellings.5 Figure 9.7 shows that many single person households live in three bed properties. The implications are that it is very hard to translate projections of particular household types into forecasts of what the market demand will be for particular types of property.
5 Comparable data is not available at a Local Authority Level although it is possible to cross tabulate the number of people in the household with the number of rooms (not bedrooms).

Central Hampshire and New Forest Housing Market Assessment Final Report
November 2007
147
Figure 9.7: Household Type by Size of Property in the South East
Figure 9.8: Household Type by Size of Property in South East England 2004
One Bed
Two Bed Three Bed
Four Bed
Five Bed
Six + beds
All
Couple, no dependent children
23 41 43 45 38 21 40
Couple with dependent child(ren)
2 11 26 34 42 64 22
Lone parent with dependent child(ren)
0 7 6 3 3 0 5
Other multi-person household
0 6 6 8 11 7 6
One male 35 14 8 3 1 0 11 One female 39 22 11 8 4 9 16 Total 100% 100% 100% 100% 100% 100% 100%
Source: Survey of English Housing/ODPM
Figure 9.9: Size of Property by Type of Household in South East England 2004
One Bed
Two Bed
Three Bed
Four Bed
Five Bed
Six + beds
All
Couple, no dependent children 7 24 46 19 4 1 100%Couple with dependent child(ren) 1 11 51 27 8 3 100%Lone parent with dependent child(ren)
1 32 54 10 3 0 100%
Other multi-person household 1 23 43 25 8 1 100%One male 36 30 29 4 1 0 100%One female 29 33 28 8 1 1 100%
Source: Survey of English Housing/ODPM

Central Hampshire and New Forest Housing Market Assessment Final Report
November 2007
148
9.28 Clearly the relationship between household size, type and property size reflects a complex mix of socio-economic variables. The relatively high proportion of couples without children occupying larger properties may reflect the existence of many ‘empty nesters’ – those who have had children who have now left the family home, but have not downsized. Equally it may reflect the growing number of dual income households with no children, who have substantial purchasing power.
9.29 Bearing in mind the lack of a linear relationship between household size and type and dwelling size, which means all projections must be treated with caution, DTZ has produced indicative estimates of the types of dwellings that might be required, based on projected household growth within Central Hampshire and New Forest. These are set out in Figure 9.11 and 9.12. The basis for these estimates is explained below.
9.30 The previous charts and tables based on data from the Survey of English Housing show how different types of households are currently housed (Figure 9.10 provides a summary). Applying these proportions to the forecast change in the numbers of different households in Central Hampshire and New Forest produces Figure 9.11 and 9.13 respectively. This shows the size of property that new households are likely to occupy, by type of household, if growth in these types of households is achieved as expected.
Figure 9.10: How Households are Currently Housed in the South East
From Survey of English Housing, ODPM Number of Bedrooms 1 2 3 4 5 6+ Couple 5% 19% 47% 22% 5% 1% Lone parent 1% 32% 54% 10% 3% 0% One Person 32% 31% 29% 7% 1% 0% Other Households 1% 23% 43% 25% 8% 1%
9.31 The caveat with this analysis is that it assumes that the size of dwelling that certain types of households currently live in will continue in the future. In reality, many households will aspire to more and evidence suggests that as incomes rise they will aspire to and consume more space.6 This is further illustrated by the preferences expressed by households registered on Swaythling Housing Society’s intermediate housing register. Relatively small proportions of households have expressed a preference of 1 bedroom homes despite the fact that larger proportions are single person or couple households – who might be expected to occupy the smallest properties (see Section 8).
9.32 Figures 9.11 and 9.12 show the increase in households by the size of dwelling they may demand over the next 20 years based on household growth in Central Hampshire, which is projected to be driven by single person households. Dwelling requirements are unlikely to correspond neatly to the size of the household. If current living arrangements continue, over 46% of the dwellings required for new households over the next 20 years will be for 3, 4 and 5 bedrooms or more. Around 29% will be for 2 bed dwellings and 25% will be for one bed properties.
6 CLG (2007) Strategic Housing Market Assessments – Practice Guidance

Central Hampshire and New Forest Housing Market Assessment Final Report
November 2007
149
Figure 9.11: Indicative Dwelling Sizes Required by Future Households, Central Hampshire Market Area (Whole Districts)
Number of Bedrooms
Household Type
Growth in Households
2006-26 One Two Three Four Five Six+ Couple 5,650 280 1,100 2,690 1,240 280 60 Lone Parent 510 10 160 280 50 20 0 One Person 31,630 10,190 9,940 9,100 2,060 230 110 Other 4,190 40 960 1,790 1,040 320 40 Total 41,970 10,490 12,170 13,850 4,200 840 420
Source: Developed from Hampshire County Council Household Projections & Survey of English Housing & DTZ Note: Figures may not sum due to rounding
Figure 9.12: Indicative Dwellings Required by Future Households (%), Central Hampshire Market Area (Whole Districts)
Number of Bedrooms
Household Type
Growth in Households
2006-26 One Two Three Four Five Six+ Couple 5,650 5% 19% 47% 22% 5% 1% Lone Parent 510 1% 32% 54% 10% 3% 0% One Person 31,630 32% 31% 29% 7% 1% 0% Other 4,160 1% 23% 43% 25% 8% 1% Total 41,970 25% 29% 33% 10% 2% 1%
Source: Developed from Hampshire County Council Household Projections & Survey of English Housing & DTZ Note: Figures may not sum due to rounding
9.33 By comparison, the projections in Figures 9.13 and 9.14 below suggest that dwelling
requirements in the New Forest will be driven principally by smaller dwellings. In contrast to Central Hampshire, it is projected that there will be a decline in the requirement for larger accommodation (4,5 and 6+ bedroom properties). It is likely that this pattern, to some extent, reflects relatively poor affordability within the New Forest, which means that households can afford to purchase less space.
Figure 9.13: Indicative Dwelling Sizes Required by Future Households, New Forest
Number of Bedrooms
Household Type
Growth in Households
2006-26 One Two Three Four Five Six+ Couple -3,630 -180 -700 -1,730 -800 -180 -40 Lone Parent -610 10 -200 -340 -60 -20 0 One Person 8,000 2,560 2,480 2,320 560 80 0 Other 290 0 70 130 70 20 0 Total 3,980 2,390 1,650 380 -230 -100 -40 Source: Developed from Hampshire County Council Household Projections & Survey of English Housing &
DTZ Note: Figures may not sum due to rounding

Central Hampshire and New Forest Housing Market Assessment Final Report
November 2007
150
Figure 9.14: Indicative Dwellings Required by Future Households (%), New Forest
Number of Bedrooms
Household Type
Growth in Households
2006-26 One Two Three Four Five Six+ Couple -3,630 5% 19% 47% 22% 5% 1% Lone Parent -630 1% 32% 54% 10% 3% 0% One Person 8,000 32% 31% 29% 7% 1% 0% Other 290 1% 23% 43% 25% 8% 0% Total 3,980 60% 42% 9% -7% -3% -1% Source: Developed from Hampshire County Council Household Projections & Survey of English Housing &
DTZ Note: Figures may not sum due to rounding
9.34 In terms of policy implications for Central Hampshire, DTZ would counsel considerable caution in interpreting the anticipated growth in single person households (projected in Figures 9.2 and 9.3) as implying a requirement for the bulk of new private sector housing provision to take the form of small homes:
• As evidenced by the analysis above, there can be no presumption that growth in small households implies that these households can only afford to purchase small dwellings. This may be true of new market entrants, but some of the growth in single households will be the result of the ageing population which are likely to under-occupy larger properties for a long period of time
• In any event it may be that any increase in demand for smaller properties is better met by adaptation within the existing stock – smaller properties are also often traded more frequently
9.35 The policy implications for New Forest may be different. Household projections for the New Forest and the size of homes that households currently occupy suggest that there may be demand for relatively significant proportions of smaller dwellings. However, this indicative analysis does not take into account that a significant proportion of the growth in single person households in the New Forest will be elderly households – many of which will occupy larger homes than the norm for other single households. Thus, Figure 9.14 may overstate the requirement for small dwellings.

Central Hampshire and New Forest Housing Market Assessment Final Report
November 2007
151
The Nature of the Existing Stock of Dwellings
9.36 The second factor in considering the mix of dwellings within Central Hampshire is the stock of existing dwellings within each of the authorities. Dwellings that have already been built will house 80-90% of the population of households in 2026 including the majority of new households. New completions will add up to 1% to the stock of dwellings each year and whilst this is significant over long periods of time it is important to consider future housing demand within the context of the existing stock.
Figure 9.15: Percentage of Dwellings by Number of Rooms (Census 2001)
1 room 2 rooms 3-4 rooms 5-6 rooms 7+ rooms
Central Hampshire Market Area 1% 2% 23% 44% 31% New Forest West & Central 0% 2% 25% 45% 28% New Forest 0% 2% 25% 48% 25% Basingstoke & Deane 1% 2% 22% 47% 29% East Hampshire 1% 2% 23% 41% 34% Test Valley 0% 1% 21% 46% 31% Winchester 1% 2% 23% 40% 35% South East 1% 2% 27% 45% 25% England 1% 3% 29% 48% 20%
9.37 Figure 9.15 provides percentages for the size of dwellings in terms of numbers of rooms for each of the local authorities in order to draw out some of the differences between areas within each of the housing markets.
9.38 Section 6 of this report considers the stock of dwellings within Central Hampshire in detail. According to Section 6, all the study areas have slightly lower proportions of 1-4 room dwellings (1-2 bedroom properties) than the England or South East averages of 33% and 30% respectively. In terms of 5-6 room dwellings (2-3 bed properties), the study areas better reflect the South East average of 45% than the higher England figure. The exceptions are the New Forest and Basingstoke & Deane authority areas, which have slightly higher figures.
9.39 In terms of the largest 7+ room properties (4 bedrooms or more), all the study areas have a higher proportion of large houses than either England or the South East. Within this, the New Forest authority area (25%) and the New Forest West and Central Market Area (28%) have relatively low proportions. In contrast, Winchester (35%) and East Hampshire (34%) have much higher proportions.
The Type and Size of Recent Completions
9.40 The third factor in considering the mix of dwellings is what is being delivered at present. What would this mean for the overall stock of dwellings if this pattern of completions continued into the future? To what extent should local planning authorities intervene in order to influence a change in the mix of completions?
9.41 Figures 9.16 to 9.20 below demonstrate the size of completions over the last decade to 2005/06 in each of the districts within Central Hampshire and the New Forest. In Basingstoke and Deane the recent trend has seen increasing proportions of 1 and 2 bedroom dwellings being completed with a decline in the proportions of 4+ bedroom

Central Hampshire and New Forest Housing Market Assessment Final Report
November 2007
152
dwellings. It should be noted though that the last 5 years has seen a greater proportion of 5+ bedroom dwellings being completed compared to the late 1990s.
Figure 9.16: Size of Completions in Basingstoke, 1996-2006
Source: Hampshire County Council
9.42 Compared to the other districts in Central Hampshire, Test Valley and East Hampshire have witnessed larger proportions of completions comprising 4+ and 5+ dwellings in the last 3 years.

Central Hampshire and New Forest Housing Market Assessment Final Report
November 2007
153
Figure 9.17: Size of Completions in Test Valley, 1996-2006
Figure 9.18: Size of Completions in East Hampshire, 1996-2006

Central Hampshire and New Forest Housing Market Assessment Final Report
November 2007
154
9.43 In Winchester, there has been steady growth over the last 10 years in the completions of 1-bedroom and 2-bedroom dwellings, matched by a decline in 3 and 4 bedroom dwellings.
Figure 9.19: Size of Completions in Winchester, 1996-2006
9.44 The size of completions in the New Forest has fluctuated over the last decade, but in general there has been a trend of decline in 4 bedroom dwellings and overall a greater proportion of 1 and 2 bedroom dwellings in the last 5 years compared to the late 1990s.
Figure 9.20: Size of Completions in New Forest, 1996-2006

Central Hampshire and New Forest Housing Market Assessment Final Report
November 2007
155
9.45 DTZ has obtained housing completion data from the NHBC on the type and size of dwellings completed within the districts comprising Central Hampshire since 20017. This data allows us to distinguish between the pattern of completions for the open market (private sector) and for the public sector (RSLs). Figure 9.21 shows that completions of market housing over the last 6 years have been dominated by a high proportion of houses across the districts of Central Hampshire and New Forest. However, since 2003, flats have accounted for at least a third of completions.
Figure 9.21: Type of Completions in Central Hampshire & New Forest, 2001-2006 (Private sector) (Whole Districts)
Source: National Housing Building Council. Note: data for all five authorities has been combined. Although
there are some slight differences between the authorities e.g. New Forest delivered a higher proportion of 3 bedroom homes in 2005/06, the pattern is broadly the same across the Districts.
9.46 When compared to the pattern of completions at the regional level it is apparent that
Central Hampshire is currently broadly in line with the South East: following a recent decline in the completion of houses in favour of flatted developments. In Central Hampshire however, 2006 saw resurgence in the proportion of completions of houses, accounting for 65% of total completions in that year compared to 35% flats. (See Figure 9.22).
7 National Housing Building Council data on completions covers 80% of all completions. Coverage may vary at the local authority level so we have limited this analysis to Central Hampshire as a whole.

Central Hampshire and New Forest Housing Market Assessment Final Report
November 2007
156
Figure 9.22: Type of Completions by Private Enterprise, South East
Source: DCLG & NHBC & DTZ
9.47 Over the last 6 years there has been continued growth in new dwellings completed for private sale in Central Hampshire of 1 and 2 bedroom units (see Figure 9.23).
Figure 9.23: Size of Completions, Number of Bedrooms, 2001-2006, Central Hampshire & New Forest (Private sector) (Whole Districts)
Source: National Housing Building Council. Note: data for all five authorities has been combined. Although
there are some slight differences between the authorities e.g. New Forest delivered a higher proportion of 3 bedroom homes in 2005/06, the pattern is broadly the same across the Districts.

Central Hampshire and New Forest Housing Market Assessment Final Report
November 2007
157
9.48 It is worth considering some of the drivers behind this pattern of development. To some extent the pattern of recent completions is likely to have been driven by declining affordability, which means that households (as a whole) can afford less space. Declining affordability has also meant that households have delayed purchasing properties, which, in turn, has created additional demand for private rented dwellings and, in turn, facilitated the growth of the Buy-to-Let market. The emphasis in planning policies on delivering development within town centres on brownfield and at higher densities has supported and reinforced this pattern.
9.49 A further factor that has led to the growing emphasis on provision of flats and smaller units is competition for land. Potential purchasers of land bid up the price of land by assuming ever more dense levels of development, knowing that in general some local authorities are not averse to approving high-density developments.
Buy To Let and The Private Rented Sector
9.50 It is worth considering in more detail the Buy-to-Let market, the impact that this has had on recent completions and implications for the future, particularly within the town centres of Central Hampshire and New Forest – particularly within the town centres of the main settlements - Basingstoke, Winchester and Andover.
9.51 The Buy-to-Let investment market is highly suited to the development of flats. BTL investors are quite different in their purchasing behaviour to owner occupiers. In brief BTL investors are:
• willing to buy off-plan, but often expecting a discount off market value
• often interested in buying multiple units
• generally seeking low maintenance
• wanting to buy in places likely to deliver capital growth and a strong rental stream
9.52 These criteria lead BTL investors to favour investment in flats rather than houses, especially within town centre markets. The development model for flats requires more development finance (developers have to build all the flats at once) so there is an incentive for developers to finance the scheme by discounted, off plan sales. Town centres are also seen to be good rental markets where graduates, young professionals and corporate lets currently provide a strong market.
9.53 The influence of the buy to let investment market on the type and size mix of new completions is a source of concern given that the long term implications are uncertain. The BTL phenomenon has enabled the growth of the private rented market and at present rents remain robust (in part this may be supported by recent Eastern European in-migration). Private renters express different preferences to buyers since renting is almost always viewed as a temporary housing solution.
9.54 Discussions with developers operating within the South East and estate agents suggest that over 75% of flat development within town centres is purchased by investors for private renting and, to a more limited extent, corporate lettings and serviced apartments.
9.55 A JRF study made the following statement on this issue: Most of these [Buy-to-Let] landlords have only been investing over a period of time that has been characterised by low interest rates, growing capital values and rising rent levels, poorly performing stocks and shares and pension schemes, and an increasing demand for private rented accommodation… It is therefore unclear how buy-to-let landlords may respond to different

Central Hampshire and New Forest Housing Market Assessment Final Report
November 2007
158
economic conditions, such as a rise in interest rates, nor how the more recent entrants are faring due to the tighter margins that are currently available as a result of the rises in property prices.8
9.56 Perhaps the key conclusion is that the BTL is an important part of current market demand for new properties, but it is a potentially unstable, unpredictable and poorly understood market. BTL investors have fundamentally different drivers to other sectors. If new investment in BTL were to dry up demand for many town centre and other developments might fall significantly, threatening targets for the delivery of new housing within Central Hampshire and in particular within its major towns.
9.57 Finally, given the evidence set out in Figure 9.21 and 9.22 it is a useful exercise to consider the scenario of continued growth in the completion of flats in the future and what this would mean for the authorities within Central Hampshire.
• If higher proportions of flats continue to be built in the future this is likely to reduce the bias in the existing stock towards detached housing (there are relatively low proportions of flats in the stock of dwellings in the market area). However, the overall effect of completions is likely to be moderated to some extent by households extending and converting their homes, which gradually adds to the stock of larger dwellings over time, even though completions of new larger dwellings may have declined.
• However, building flats will gradually introduce greater inflexibility into the dwelling stock in certain locations (flats are less conducive to extension and conversion than small houses)
The Drivers in the Development Industry
9.58 It is also useful to understand the type and size of dwellings that developers might propose on sites and what is driving these decisions. DTZ understand that this is likely to relate to the following:
• The type and size of dwelling they have succeeded in selling in either the local area or in other similar locations (and therefore for which there is a known market)
• The scale of demand or pressure on particular dwellings in the existing stock – through discussion with local estate agents
• Related to the above, the return on capital invested i.e. the mix of dwellings that will provide a quick sale once completed
• The value of the land once contributions for affordable housing and other obligations have been factored in
9.59 The latter two points deserve further explanation. First, developers are likely to propose a mix of dwellings that will provide the most rapid return on the capital they have invested in the development. DTZ understand that, on large sites (particularly urban extensions and major development areas) this is likely to encourage the provision of a broad mix of dwelling type and sizes in order to appeal to different segments of the market and maximize sales. Developers will also be attracted to developing products that appeal to investors (e.g. small apartments) as this could provide another source of buyers – many of whom are often willing to buy multiple units off plan. 8 University of York (2006) Private Landlords and buy-to-let, by David Rhodes and Mark Bevan

Central Hampshire and New Forest Housing Market Assessment Final Report
November 2007
159
9.60 Secondly, decisions about what is delivered in the market sector will relate to the proportion and type of affordable housing that is required or negotiated by the Central Hampshire authorities. Affordable housing and other contributions will impact upon the land value and so developers will seek to maximise the residual value of the land from the mix of market dwellings on site.
9.61 It is important to note that in most cases the mix of dwellings proposed by developers will not be driven by an analysis of population and households in the local area. As evidence presented earlier in this section demonstrates, focusing on the demographic characteristics of households is unhelpful if those households cannot afford to purchase a new home on the open market or, conversely, they are able to afford more living space than their household size might indicate.
Occupancy and Over Crowding
9.62 The fifth factor to consider is overcrowding. Occupancy levels can provide an indication of the interaction between households and dwelling sizes and whether the needs and demands of households within Central Hampshire and New Forest are being met. If there is evidence of significant overcrowding then this may point to the need for increased provision of larger dwellings. However, it is important to note that it is largely income that determines how much space households are able to occupy and therefore provision of larger dwellings per se would not necessarily ensure the needs of particular households are met.
9.63 The data in Figure 9.24 below shows that over 80% of dwellings in all the study areas are under-occupied i.e. households are occupying more space than needed based on the occupancy standard. All the areas have very similar figures and all above the regional and national averages.
Figure 9.24: Occupancy and Overcrowding
Source: Census, 2001
9.64 Occupancy and overcrowding is considered in Section 6 of this report. Recent national and regional studies have identified the growing level of overcrowding in the social housing sector. Central Hampshire has a lower level of overcrowding than the South East as a

Central Hampshire and New Forest Housing Market Assessment Final Report
November 2007
160
whole (4% and 6% respectively). Similarly in the New Forest over crowding is 4%, somewhat lower than the South East (6%) and England (7%).
9.65 Occupancy is measured by the bedroom standard where a value of –1 implies that there is one room too few for the household that occupies the dwelling and that by this measure the dwelling is over crowded.
9.66 An examination of the occupancy ratings for each tenure type in the Central Hampshire market area (presented in Figure 9.25) reveals that owner-occupied houses have very low occupancy ratings – 90% have at least one room more than they are judged to need under this measure. Only 2% of these properties can be described as over-occupied. A smaller proportion of private rented houses can be described as under-occupied (68%) and 10% have at least one room fewer than needed. However, social rented houses show the highest levels of overcrowding, with only 51% considered under-occupied. While 11% of houses are over-occupied. A significant proportion of those identified as in housing need in Section 8 are households living in over crowded conditions.
9.67 The Survey of English Housing undertaken at various points since 2001 indicates that, at the level of the South East region at least, there has been a slight increase in the overall level of overcrowding. This is likely to be partly explained by the recent and continued in-migration of East European workers to the region. Anecdotal evidence suggests that many are prepared to share intensively in the private rented sector often in order to save money.
Figure 9.25 Occupancy by Tenure – Central Hampshire Market Area
+2 or more +1 0 -1 or less 79,200 22,000 9,700 2,100 Owned 70% 20% 9% 2% 7,500 4,800 4,000 1,800 Private Rented 41% 27% 22% 10% 5,500 7,700 9,800 2,700 Social Rented 21% 30% 38% 11%
Source: Census, 2001

Central Hampshire & New Forest Strategic Housing Market Assessment Final Report
November 2007
161
10 SPECIFIC GROUPS WITHIN THE HOUSING MARKET
10.01 This section examines the housing implications of specific groups within the housing market. Certain groups may have specific housing requirements that differ from households as a whole, and these need to be examined and taken into consideration when formulating policy.
10.02 We have considered first those groups that have a relatively high incidence within the population as a whole, within the five authority areas. These are:
• Older people
• Disabled people
• Rural communities
10.03 This section also considers other specific groups that are relatively small in number or concentrated in specific areas but they merit consideration since they may have very different requirements to the population as a whole, or may also have a significant impact on the rest of the housing market or in specific locations. These are:
• Students
• Black and Minority Ethnic households and migrant workers
10.04 The requirements of households within specific groups can be broadly divided into two categories:
• Households who require specially adapted housing e.g. elderly people, disabled people and to some extent students.
• Households who are limited by their ability to access the housing market or require accommodation that is beyond their means, e.g. BME households on low incomes, migrant workers and households in rural communities on low incomes.
Older people
10.05 Research has shown that by 2051, people over 65 are likely to represent over 25% of the population in England. Figure 10.1 demonstrates that in East Hampshire, Winchester and New Forest in particular, the proportion of the population over the age of 65 is higher than the average for the South East and England as a whole. In absolute terms, New Forest has over double the number of over 65s compared to the other authorities and the authority is home to 3% of the South East’s population aged over 65 years but is home to only 2% of the South East’s population in total. In all of the authorities, around half of those aged over 65 are in advanced old age (75+). Section 4 also demonstrated that it is this group of the population (aged 75+) that has grown most rapidly over the last decade.
10.06 The growing population of older people is also evident by the numbers of older people on the local authority housing waiting lists (some of whom are owner occupiers) and increasing numbers of private development schemes in some of the authorities for the elderly market.

Central Hampshire & New Forest Strategic Housing Market Assessment Final Report
November 2007
162
Figure 10.1 Proportion of people over the age of 65 as a percentage of population
Number (aged 65+) % (aged 65+) Basingstoke & Deane 20,500 13% East Hampshire 18,500 17% Test Valley 17,800 15% Winchester 19,200 17% New Forest 40,200 23% South East 1,353,200 16% England 8,058,100 16%
Source: ONS Mid-Year Population estimates (2005)
10.07 The ageing population is a national phenomenon and so the trends evident in Central Hampshire and the New Forest are not dissimilar to trends across the country. However, some of the locations within individual authorities are popular places to retire to and there is evidence of net in-migration of older people to all of the authorities except Basingstoke and Deane, particularly amongst single elderly households.
10.08 Although this analysis focuses on people in the population over the age of 65 it is important to note that there can be no formal definition of when people are deemed old. In terms of individual circumstances and public policy, significant changes arise when people retire from work, become incapacitated in some way, and linked to this lose the ability to live independently. Entitlement to benefits ‘kicks in’ at particular ages, but in reality there are different stages of old age. Consider the difference in personal circumstances of those who may be of the same age but:
• Remain in good health and have a high level of independence
• Are able to draw on their savings to fund later life
• Experience acute health problems and whose health may suddenly decline
• Have chronic health problems and poor quality of life
10.09 In terms of their impact within the housing market, much depends on whether older people decide to move and if so, where they move to and what they move in to. Many people will wish to retain their independence in their existing home by arranging adaptations. Some may emigrate, though this is limited at present. Those who decide to move home tend to do so in earlier old age.
10.10 However, the Survey of English Housing (2005/06) demonstrates that those in the 65-74 age group and those aged 75 or older are the least likely of all age groups to move home. In England as a whole these age groups accounted for 2% of all household moves each. 51% of moves were 16-24 year olds, 23% were 25-34 year olds, 9% were 35-44 year olds and 4% were 45-64 year olds. Older households are less likely to move house than younger ones.
10.11 Figures 10.2 to 10.5 demonstrate that the majority of older people in the 65-85 age group live within owner occupied accommodation. Levels of owner occupation are at or above that for the population as a whole in each authority area. However, levels of social renting are slightly above the level in the population as a whole with limited levels of private renting.

Central Hampshire & New Forest Strategic Housing Market Assessment Final Report
November 2007
163
10.12 In the 85+ age group, very advanced old age, levels of owner occupation are around 10% lower in each authority. This may reflect the fact that older people are often forced to move home in advanced old age in order to secure appropriate care – reflected in higher levels of private renting and social renting, the sectors in which much of the provision of sheltered and extra care accommodation is found. Lower levels of owner occupation are also likely to reflect the fact that social rented accommodation was a much more significant tenure (and one of choice) for the older generation and some may have stayed in their family home (a social rented dwelling) all of their lives.
Figure 10.2: Numbers of Older People (Aged 65-85) in Different Tenures
Number (65-85 age group) Owner occupied Private rented Social rented Total
Basingstoke & Deane
11,910 980 3,690 16,570
East Hampshire 12,030 850 1,700 14,580 Test Valley 10,500 1,000 2,550 14,050 Winchester 11,250 1,050 3,080 15,380 New Forest 27,850 1,780 2,830 32,460 South East 865,680 64,080 176,460 1,106,220
Source: Census 2001
Figure 10.3: Proportion of Older People (Aged 65-85) in Different Tenures
Number (65-85 age group) Owner occupied Private rented Social rented Total
Basingstoke & Deane
72% 6% 22% 100%
East Hampshire 83% 6% 12% 100% Test Valley 75% 7% 18% 100% Winchester 73% 7% 20% 100% New Forest 86% 5% 9% 100% South East 78% 6% 16% 100%
Source: Census 2001
Figure 10.4: Numbers of Older People (Aged 85+) in Different Tenures
Number in 85+ age group Owner occupied Private rented Social rented Total
Basingstoke & Deane
1,010 200 540 1,750
East Hampshire 1,290 150 330 1,760 Test Valley 990 220 460 1,680 Winchester 1,240 300 550 2,090 New Forest 3,200 410 490 4,110 South East 95,340 14,450 29,840 139,630
Source: Census 2001

Central Hampshire & New Forest Strategic Housing Market Assessment Final Report
November 2007
164
Figure 10.5: Proportion of Older People (Aged 85+) in Different Tenures
Owner occupied Private rented Social rented Total Basingstoke & Deane
58% 11% 31% 100%
East Hampshire 73% 8% 19% 100% Test Valley 59% 13% 28% 100% Winchester 59% 14% 26% 100% New Forest 78% 10% 12% 100% South East 68% 10% 21% 100%
Source: Census 2001
10.13 There are a number of implications arising from the ageing population in each of the authority areas:
• The housing requirements of older people are often wider than their basic need for accommodation. Demand or need for housing amongst older people is often strongly influenced by health issues (and disability is strongly linked to age). There is likely to be a growing need for wider care, integrated with housing provision, which has implications for the cost to those households and the public sector. There are questions around who will provide care alongside housing - the public sector or private developers? There are also issues for mixed communities related to the location and nature of specialised provision for older people
• The vast majority of older households will be owner occupiers which raises implications about how far they will wish to (or be forced to) draw upon their housing equity as an asset to fund their wider care needs. Disposable incomes are also lower amongst older households, even those in owner occupation, with implications for care and repair needs. Previous research and surveys suggest that by far the highest average basic repair costs are found in dwellings occupied by lone older households (often in excess of £1,000)
• Older people are often unaware of the full range and potential housing and support options available to them and owner occupiers may be particularly disadvantaged, as they are less aware of the availability of services i.e. those provided by the public sector, including the availability of social housing and support services. Some research has suggested that older people often receive the ‘wrong advice’ from non-independent or emotionally attached people, e.g. family members and others. Older people can also be reluctant to complain about issues, which may prevent them from improving their circumstances
• Increased numbers of older households will also impact upon the rest of the housing market. Older households are less likely to move house, even though they may appear to have far more space than they ‘need’. The implication is that, in the future, many of the larger homes in the housing stock in each authority area may be occupied by older people who choose not to downsize, which may create pressure on (and rising demand for) larger homes amongst more mobile households, including younger families. However, there are also notable benefits with the tendency for older households to remain in their homes in terms of community stability and cohesion. These issues are discussed further on in this section

Central Hampshire & New Forest Strategic Housing Market Assessment Final Report
November 2007
165
10.14 These issues apply across all the authority areas because of the UK’s ageing population, although to differing extents because of the varying housing market dynamics across Central Hampshire. There is the added dimension of in-migration of older households, particularly to the New Forest. The propensity for older households to retire to the New Forest is likely to reinforce social and economic polarisation over time as areas become less mixed, with implications for housing pressures, rising prices and declining economic activity rates.
10.15 Discussions with housing officers in the New Forest and in other rural parts of the South East also suggest that new schemes designed specifically for older people have not proved popular with local people but have been taken up by older households moving into the area. Such schemes have often not achieved the objective sought by local authorities of encouraging elderly households, including those in the social rented sector, to down size. Though anecdotal, this suggests that the primary appeal of these areas is the location – with in-migrants willing to accept a smaller property as the trade off for a better location but local households largely unwilling to move home.
10.16 PPS3 recognises the need to provide accommodation for the older people as part of achieving a good mix of housing. But there is limited advice on what this accommodation should look like which makes the effective development of planning and housing policies more difficult. The Housing and Older People Development Group (HOPDEV) Conference (2006) identified three key criteria – choice, community and quality – that they concluded are the essential ingredients for successful housing options for the older people:
• Older people need choice and a framework for ‘active ageing’ to maximise independence and well being.
• Independence at home should be maintained as long as possible with supporting services so that the community (including older people) can enjoy greater stability.
• As needs change and vulnerability increases, elderly people need to live in a safe, warm and quality home that is right for them – either private accommodation or a community home
10.17 The housing options for older people within Central Hampshire and New Forest now and in the future can be divided into those within the mainstream housing stock and those within specialist accommodation. It is also useful to distinguish between owner occupiers and those in social rented accommodation since the options available to them and the impact of their choices on other households will be different.
10.18 Moving home is a major ‘life’ decision, entailing important financial and personal decisions. On the financial side key issues include consideration of whether to use the value in the property to support an existing lifestyle, provide for care costs, or to assist the next generation to study or to enter the housing market. On the personal side, moving home raises issues about proximity to family and friends, formal and informal caring networks etc. Attitudes to these issues are in part culturally determined so people from differing backgrounds may be inclined to place different priorities on different aspects of their decisions.
10.19 Most older people currently live in mainstream housing. Some will remain in the home they have lived in for some time, some will choose to move house when they retire which may mean long distance migration and not necessarily with the purpose of down sizing.

Central Hampshire & New Forest Strategic Housing Market Assessment Final Report
November 2007
166
Others will move locally and perhaps down size in order to release equity from their property and/or to move into a more manageable property.
10.20 There are a range of options within the mainstream housing market for older people, each presenting different issues:
• Research confirms that the majority of older people wish to remain in their homes as long as possible. There are a number of issues raised by this preference:
o Growing maintenance and adaptations required by older people living in their own homes in both the owner occupied and social rented sectors
o Wider support and service requirements of older people which have implications for how older people will access such services or whether there will be a growing expectation that their wider needs will be delivered to them (eg, home care at the one extreme or demand for improved local services at the other)
o There are likely to be growing impacts on the wider housing market if older households are reluctant to move – the housing market overall may become less fluid, particularly in locations with the highest proportions of older households. This is likely to push up demand (and prices) for certain types and location of dwellings which will impact on the accessibility of the housing market for those less able to compete. It is likely to have more serious implications for the social rented sector where older households occupy large social rented dwellings, which need to be freed for other priority households on local housing registers
o However, there are also significant positive implications associated with older households remaining in their own homes. Research suggests that this can help to develop and maintain community stability and cohesion.1 It is also positive in terms of mixed communities to have a range of households of different ages living within a neighbourhood2
• Those older households that do move home are most likely to do so on retirement or when they develop extra care needs. Although most household moves are local, those moving on retirement may migrate longer distances and there is a well established pattern of retirement migration to parts of Central Hampshire. There are a number of issues associated with these moves:
o Retirement migration tends to be concentrated in particular locations because of the attractiveness of those places for their character, the services on offer and the social networks they provide, particularly in parts of the New Forest
o On the one hand, this allows service providers to secure efficiencies and offers the opportunity to provide for the wider needs of older households within particular locations
o On the other hand, this pattern works against mixed communities by pushing out younger households who may not be able to compete in the market and it is unlikely to do much to improve economic development since most in-migrants
1 Joseph Rowntree Foundation & Chartered Institute of Housing (2006) More than Tenure Mix: Developer and Purchaser Attitudes to New Housing Estates 2 Joseph Rowntree Foundation, English Partnerships & Housing Corporation (2006) In the Mix: A Review of Mixed Income, Mixed Tenure and Mixed Communities

Central Hampshire & New Forest Strategic Housing Market Assessment Final Report
November 2007
167
are retired (although there is a growing trend to work in some form beyond retirement age) with impacts on the local economy and therefore the availability of jobs for other (younger) households: although the counter balance is that there may be growing demands for certain services from the retired population and the knock on demand for labour to serve the ‘grey economy’
o There is also an impact on those communities that older households choose to leave – the loss of the older generation from some areas – with older households often providing stability and social capital to a neighbourhood. This was highlighted as an issue in some parts of Basingstoke and Deane where there is a perception that the turnover of the housing stock in more rural areas has increased over time with implications for the loss of people who had been involved in community activities
• Some older households may choose to down size, moving either locally or to a different location, though this is not a significant trend at present. There are a wide range of issues raised by this choice:
o Down sizing households in the owner occupied sector may be able to release equity from their homes either to fund their wider needs and activities or even to provide financial support for other younger family members, including helping them onto the housing ladder – with issues around the division of housing wealth and opportunities between younger households – some of whom have considerable family support and others who have none
o Downsizing also releases a larger home onto the market or into the letting pool in the social rented sector – providing the opportunity for other households to trade up or access the space that they might need
o The implication of increased down sizing amongst older households in an ageing society is that there ought to be increased demand for smaller homes that are more manageable and/or cheaper to down size into. There is little evidence that this is happening on any scale yet. Anecdotal evidence suggests that those that do move will still demand (including in the social rented sector) additional space. There is little desire or incentive for older households to move into small flats. Furthermore, some research predicts that the ‘baby boom’ generation (currently the 45-64 age group) will demand more spacious homes and shun sheltered housing in favour of ‘mainstream’ properties. For many older people, their activities and social patterns require as much space as earlier in their lives
o Given that the majority of older households that do downsize will wish to remain in their local community, there is an issue around whether there are suitable alternative options locally so that people can move within their local neighbourhood as their life stage and needs change without the need to move away
10.21 At present, the majority of elderly people do not live in specialised housing and do not necessarily desire to, most wishing to remain in their current homes or within the mainstream housing market if possible. However, there is growing demand for specialist housing provision for older people – evident from the increasing numbers of specialised schemes for elderly people being brought forward by the private sector in most of the authority areas – though perhaps not at the scale and rate that might be expected given the scale and rate of the ageing population.

Central Hampshire & New Forest Strategic Housing Market Assessment Final Report
November 2007
168
10.22 More recently, there has been downward pressure on the provision of institutional care with emphasis on keeping older people in their own homes, although from a housing market flexibility perspective it may be more desirable for older people to move, freeing up accommodation for other households.
10.23 There is a range of specialised accommodation available to older households, each presenting different issues for the households who live there, policy makers and the wider community.
• There was significant emphasis on the provision of sheltered housing in the 1970s and 1980s which was regarded as providing safe and secure care for elderly people so that they would not have to move to retirement homes for wider care, which was seen as an expensive option.
o The advantages cited for sheltered accommodation for older households are the benefits in terms of security, maintenance and the ability of older people to maintain their independence whilst being able to access a level of support (eg, warden or other neighbours) if required
o However, sheltered accommodation can be costly, particularly in terms of the service charges and is beyond the means of some older households, particularly the most popular developments, even though they may be owner occupiers. Evidence from the housing registers of each of the local authorities suggests that there are significant numbers of elderly households registered for accommodation with the local authority. Many of these are owner occupiers and as a result are afforded limited priority for re-housing
o Sheltered housing is not necessarily a long term solution for all older households. Most sheltered housing schemes provide only limited support for elderly people – the intention being to support independence but not to provide extra care, which would invariably require a move to a residential or nursing home
o There is a growing issue around the implications for wider communities associated with provision of sheltered housing. Within private sheltered housing schemes developers have been reluctant to provide affordable housing and the service charges may also make this challenging to manage for local authorities and RSLs and tenants. Sheltered housing schemes are also often accused of taking older households out of the wider community and preventing them from remaining active within their neighbourhood – though this is likely to vary hugely since much depends on location and access to local facilities
• Residential care homes provide extra care for older people who require it. It is health rather than age that determines whether older people need extra care though research suggests that, other than retirement moves, which are taken earlier, most people, wait until their care needs are such that they are forced to move, often in advanced old age. The demand for homes that provide extra care (up to nursing care) for older people is likely to increase over time in all of the authorities. This raises a number of challenges:
o Who will meet the cost of rising care needs? There is an expectation that owner occupiers will fund their own care through the sale of their homes although increasing numbers are likely to take financial decisions earlier in their lives eg,

Central Hampshire & New Forest Strategic Housing Market Assessment Final Report
November 2007
169
equity release which may impact on their ability to do this. The public purse will need to support those without the financial means, at a growing cost
o There is the added implication that within Central Hampshire the current need for extra care is likely to be in locations where it is more expensive to provide it; development costs may be higher and it is likely to become increasingly difficult to source labour in the care sector because of house prices and affordability problems (though migrant labour including from the EU has supported this sector and may do so even more in the future)
10.24 Retirement communities are a relatively new option for accommodation in the UK. As a result, little is known what it is actually like to live in such communities and whether they adequately cater for the needs of the older age groups. The conclusion of recent research into retirement villages concluded that the viability of providing accommodation and care for a mix of ‘fit’ and ‘frail’ residents in retirement villages needs to be examined further before the model becomes more widely used. The research also highlighted that people want to live differently in their old age, which needs to be recognised in policy and by developers of retirement accommodation.3
Black and Minority Ethnic Households
10.25 Central Hampshire does not have a high proportion of ethnic minorities - the five authorities have a white population of more than 95%. BME households tend to be concentrated in the inner areas of larger towns and cities. As would be expected therefore, Basingstoke has a slightly higher proportion of BME people than the other authority areas, predominately people of Asian (Indian) origin who make up just over 1% of the population (around 1,200 people).
Figure 10.6: BME Population within each authority area (Whole Districts)
%White %Mixed %Asian %Black %Chinese %Other Basingstoke & Deane 96.6 1.0 1.2 0.6 0.4 0.3 Winchester 97.8 0.7 0.7 0.3 0.3 0.3 New Forest 98.9 0.5 0.2 0.1 0.2 0.1 East Hampshire 98.4 0.7 0.4 0.2 0.2 0.2 Test Valley 97.9 0.7 0.8 0.2 0.3 0.1
Source: Census 2001 (data available at ward level but numbers too small to present)
10.26 In order to inform the Borough Housing Strategy (2007-2011) Basingstoke and Deane Borough Council carried out a small scale survey of ethnic minority housing needs to understand whether the needs of these households differ from the community as a whole.4 The survey identified a number of issues:
• Most respondents lived in larger households than the population as a whole – the average household size of the respondents being three people. One quarter of households comprised two or more generation
3 ‘Housing and care for older people: life in an English purpose-built retirement village’ Bernard M., Bernadette B., Sim J., Biggs S. 4 Around 60 responses were received, from a sample size of 250. The responses were not representative of the population of ethnic minorities as a whole but the research remains valuable in highlighting some of the different issues that BME households face.

Central Hampshire & New Forest Strategic Housing Market Assessment Final Report
November 2007
170
• Around half of respondents lived in owner occupied accommodation with a further 39% in the private rented sector and 8% in the social rented sector (5% did not specify). The Census also confirms that there are lower levels of owner occupation amongst ethnic minority households and higher levels of private renting. The Survey suggested that there was relatively significant interest in shared ownership – particularly from those in the private rented sector, who wished to have the opportunity to build up equity and greater security of tenure
• Respondents therefore identified the key barriers to accessing their preferred housing as their ‘lack of confidence to talk about their housing needs’ and a range of income and cost related barriers which prevented access to housing. Respondents also identified the need for improved information for ethnic minorities on housing options and suggested also that the Council works with private landlords to improve access to the private rented sector for those on Housing Benefit
10.27 DTZ would suggest that, apart from perhaps the barriers associated with communicating information and options to ethnic minority households, the key issues faced by these households are not dissimilar to households as a whole. The barriers to their preferred housing and the issues they appear to face are more related to income, house prices and affordability rather than the fact that they belong to a certain ethnic group or hold a particular national or religious identity. Whilst levels of owner occupation amongst households are above 70% in each authority area this varies considerably between ethnic groups:
• Only one third to a half of Black Caribbean and Black African households are owner occupiers across the five authorities (detailed figures are provided in Appendix F). The private and social rented sector are more significant tenures to these households than to the population as a whole (reflecting generally lower incomes) with implications for the limited choices available to these households.
• Indian households generally have levels of owner occupation above that of the population as a whole and very limited numbers of households live in the social rented sector, though evidence at the national level suggests many of these households occupy their homes relatively intensively, sometimes with more than one generation under one roof.
• In contrast, Pakistani and Bangladeshi households in the five authorities have low levels of owner occupation (around one third) though it is difficult to make generalisations given the low numbers within the population of the Districts outside of Basingstoke.
10.28 A further implication that merits consideration is that ethnic minority households are often larger than the average for households as a whole – with implications for the provision of new market homes and affordable homes. Although small in number, these larger households will often need and demand large dwellings.
10.29 Minority groups may have localised but significant impacts on the housing market where they cluster in particular locations. In Basingstoke there are a number of clusters of ethnic minority households, predominately within the town centre.
10.30 The other key dimension that will influence the pace of housing growth and potentially the type of housing in demand, including the scale of need, is the pattern of migration.
Central Hampshire & New Forest Strategic Housing Market Assessment Final Report
November 2007
171
Migration at the regional and sub-regional level is particularly influenced primarily by changing patterns of employment, house price differentials between areas, and the lifestyle offer of different areas, particularly those within the same broad regional labour catchment area. But migration is inherently difficult to predict. Patterns of movement can change quite significantly at different stages of the economic and housing market cycles.
10.31 Moreover, international migration can be particularly hard to predict. Since the expansion of the European Union in 2004 the number of EU citizens migrating to the UK has increased five-fold. In 2003 the inflow of EU citizens was around 14,000. In 2004 this rose to around 74,000 – 80% of this increase is attributed to migrants from the 10 accession states.5 6 The latest Government figures state that around 447,000 migrants from these states registered for work in the UK between May 2004 and the end of June 2006, of which 265,000 were Polish migrants7. A recent survey by the Centre for Research on Nationalism, Ethnicity and Multiculturalism indicates that these figures may understate the true level of migration.8
10.32 International migration is now the main driver of population growth within the UK as a whole. Prior to 2004, more UK residents left the UK for Europe than entered the UK from Europe – the main destination of UK migrants to Europe was Spain.
10.33 The Audit Commission’s Report ‘Crossing Borders’ identifies the key reasons for relatively significant levels of international migration to the UK. The UK is a prime location for study and UK institutions are now dependent on international migration. International migration figures include those who come to the UK to study.
10.34 However the recent increase in migration between countries within the expanded EU is not counted within the Government’s population figures. The free labour market within the EU means that it is now difficult to keep track of movements. The available statistics on in-migration since 2004 are also not net – they record the number of arrivals but not those who leave.
10.35 Hampshire County Council are undertaking work to understand better the level and nature of migration from the recent EU accession countries.
10.36 In Hampshire and the Isle of Wight there is a labour force of around 1 million workers of which 34,000 are registered from outside of the UK and therefore account for 3.4% of the workforce (compared to 5.8% nationally) although the Audit Commission suggested that this was an underestimate and the figure was likely to be around 60,000. The proportion of migrant workers within the labour force also varies between places with Basingstoke’s workforce estimated to have 4% migrant workers. One IT company in Basingstoke employs 20% of its workforce from overseas and one of the key reasons for this is because of their willingness to ‘live cheaply’ and the unwillingness of UK workers to relocate to Hampshire because of the cost (and their expectations about the type of house for example that they would be able to afford).
5 ONS 2004 6 The 2004 accession states were Cyprus, Czech Republic, Estonia, Hungary, Latvia, Lithuania, Malta, Poland, Slovakia and Slovenia. 7 Home Office (2006) Accession Monitoring Report – Note that this records the cumulative number of people who have register to work. It does not represent net migration. 8 The survey of 500 Poles in the UK found that 64% had signed the workers register

Central Hampshire & New Forest Strategic Housing Market Assessment Final Report
November 2007
172
10.37 Current figures (2007) for the number of non-UK nationals with National Insurance registrations9 in each of the authority areas are as follows:
• Basingstoke & Deane: 1,620 people (the majority are from the EU Accession countries and other European countries but also significant numbers of people from Indian (150 people) and Nepal (90 people)
• East Hampshire: 600 people (the majority from the EU Accession countries and other European countries but also significant representation the Philippines (50 people)
• Test Valley: 610 people (the majority from the EU Accession countries and other European countries
• Winchester: 580 people (the majority from the EU Accession countries and other European countries)
• New Forest: 810 people (the majority from the EU Accession countries and other European countries, particularly France (40 people) and also from the Philippines (40 people)
10.38 The Hampshire economy is creating jobs (and people are retiring) at a faster rate than people leave university and enter the labour market, which means that there is a need for economic in-migration. This is not likely to be a short term issue as the Hampshire economy has been experiencing ‘full employment’ for a number of years and if economic and employment growth proceeds as expected there will continue to be a gap to fill in the labour force. This essentially means that it is inevitable that EU migrant workers have entered the labour market in Central Hampshire and the New Forest and are likely to continue to do so in the future. The Audit Commission suggests that the key drivers of this migration are the number and type of hard to fill jobs and the availability of cheap housing. These workers are also prepared to travel long distances for work – whilst they may work within Winchester or the rural areas of Central Hampshire and New Forest, they are likely to live within Portsmouth, Southampton and Basingstoke unless their job provides tied accommodation.
10.39 Workers from the EU accession countries have been prepared to move faster than any other migrant workers in the past and the geographical spread of these workers was not as expected – with relatively large numbers ending up in rural locations.
10.40 The main sectors of the economy for migrant workers to enter have been agriculture, construction and hospitality and hence the locations with significant employment in these sectors (particularly New Forest and Test Valley which have higher proportions employed in these sectors than the South East as a whole, evidenced in Section 5) may have experienced disproportionate in-migration – if not to live in the area but to fill local jobs.
10.41 In Hampshire, the majority of migrant workers are male and aged between 25-35 and many are also supporting a family in their home country. Most are also ‘overqualified’ for the job that they are employed in within the UK.
10.42 The Hampshire Economic Partnership suggests that economic migration had been very positive and estimates that it contributes £500 million per day to the UK economy 9 Department for Work and Pensions – National Insurance Registrations Data – People are registered in the authority of their latest known address

Central Hampshire & New Forest Strategic Housing Market Assessment Final Report
November 2007
173
(although some of the wealth generated goes overseas). Both the Audit Commission and Hampshire Economic Partnership conclude there is significant value in the attraction of young migrants and they are necessary for the future prosperity of Hampshire.
10.43 There are also believed to be a significant number of migrant workers within rural Hampshire, many of whom travel to rural parts of Winchester by bus from Southampton. There is a need for migrant workers within rural Hampshire because of lack of local labour. They are often bought in by a contractor and may then become permanent after a few months. Workers often then recommend others so that employers can avoid agency costs.
10.44 There are a number of issues associated with recent migration into Central Hampshire. There are some concerns about the exploitation of migrant workers both in local labour and housing markets. Competition for jobs with local workers is not considered an issue because of practically full employment levels in most of the authority areas. However, the Hampshire Economic Partnership suggests that there is likely to be some competition for jobs at the lower end of the labour market.
10.45 Competition for housing, particularly in the private rented sector may be more of an issue and there is a concern that migrant workers may displace poorer households from the private rented sector. There are also concerns about the turnover of residents within some of the HMOs in the area, with consequent impacts on local neighbourhoods and also the impact of the rapid increase in migrant workers on the impact on local services and schools. The Audit Commission suggests that the impact on healthcare is limited since most of the migrant workers are young and fit and unlikely to place demands on care services.
10.46 There is a key role for local authorities in dealing with these issues and ‘heading off tensions’ by ensuring that local employers and landlords are complying with the law and other services may need to be modified to ensure that recent migrants are both aware of available services and can access them. The Audit Commission raised the question as to whether private sector housing teams were adequately resourced since much of the impact would be on HMOs, the private rented sector and even caravan sites.
10.47 Stakeholders suggest that initiatives towards recent migrants needed to build on the experience with the BME community and existing voluntary sector interventions – mirroring a community development approach to reflect the need for community cohesion. The CAB said that this meant bilingual advice workers, outreach workers and the need to work with Job Centres. The CAB also cited that they had been involved in 240 cases involving migrant workers within Southampton, Rushmoor, New Forest, Basingstoke and Winchester which suggests that there are significant local issues though often the issues raised are to do with employment rights rather than housing.
Disabled People
10.48 Disabled people are also a significant group within the population of the five authorities and some may have specific housing requirements that differ to the population as a whole, including the need for specific adaptations to dwellings in some cases. There are various indicators of the level of disability within the population, though none specifically state the extent to which people this affects people’s housing requirements.
10.49 The definition of disability included in the Disability Discrimination Act is ‘a physical or mental impairment which has a substantial and long-term adverse effect on his/her ability to carry out normal day-to-day activities.’

Central Hampshire & New Forest Strategic Housing Market Assessment Final Report
November 2007
174
10.50 New Forest and Basingstoke have the highest numbers of people receiving disability living allowance (in 2006), consistent with the larger population in the two authority areas.
Figure 10.7: Number of People Receiving Disability Living Allowance
Number Receiving Disability Living
Allowance (November 2006)
Total Population (2005 Mid Year
Estimate)
Receiving Disability Living Allowance in 2006 as % of Total Population (2005)
Basingstoke & Deane
4,360 156,900 2.8%
Winchester 2,560 111,300 2.3% New Forest 5,500 171,700 3.2% East Hampshire 2,900 111,300 2.6% Test Valley 3,180 112,300 2.8%
Source: Department for Work & Pensions
10.51 In the 2001 Census, New Forest recorded the highest number of people with a limiting long term illness (28,000 people) and not in good health (10,000). New Forest has a higher proportion of its total population with a long term limiting illness (17%) than the South East as a whole (15%) although on a par with England (17%). However, limiting life long illness is strongly linked to age and over 15,000 people with a limiting life long illness in the New Forest are over 65 years old (41% of all over 65s in the population). Levels are therefore likely to increase over time in all authorities as the population ages, but more so in New Forest which also experiences in migration of older households.
Figure 10.8: Number of People with a Long Term Limiting Illness
People with LLI Of Which, not in good health
Total Not in Good Health
Total People
Basingstoke and Deane
19,108 6,962 8,789 151,272
East Hampshire 13,967 4,825 6,022 106,324 Test Valley 14,505 5,101 6,352 108,193 Winchester 13,846 4,631 5,721 101,417 New Forest 28,225 10,205 12,190 166,487 South East 1,157,619 437,305 537,681 7,809,823 England 8,369,174 3,583,348 4,249,859 48,248,150
Source: Census 2001 Figure 10.9: Percentage of People with a Long Term Limiting Illness
People with LLI Of Which, not in good health
Total Not in Good Health
Total Population
Basingstoke and Deane
13% 5% 6% 151,272
East Hampshire 13% 5% 6% 106,324 Test Valley 13% 5% 6% 108,193 Winchester 14% 5% 6% 101,417 New Forest 17% 6% 7% 166,487 South East 15% 6% 7% 7,809,823 England 17% 7% 9% 48,248,150
Source: Census 2001

Central Hampshire & New Forest Strategic Housing Market Assessment Final Report
November 2007
175
Figure 10.10: Number and Percentage of People with a Long Term Limiting Illness Aged 65 and Over
Aged 65+ with LLI % of those Aged 65+ with LLI Total 65+ Basingstoke and Deane
7,913 43% 18,322
East Hampshire 6,624 41% 16,343 Test Valley 6,631 42% 15,733 Winchester 7,061 40% 17,468 New Forest 15,168 41% 36,570 South East 547,727 44% 1,245,853 England 3,660,493 49% 7,456,706
Source: Census 2001
10.52 Research by the Disabled Persons Accommodation Agency (DPAA) claims that there is currently a lack of information on the specific housing requirements of disabled people. However, the research highlights a number of common housing ‘barriers’ that disabled people may face:
• Market barriers – the private housing market does not adequately provide for disabled people, significantly reducing the options available. Comparatively lower incomes also restrict disabled people from accessing the market to the same extent as the population as a whole and are also likely to restrict their ability to ensure that their additional needs in relation to their homes are met.
• Financial barriers – disabled people are less likely than the population as a whole to be in full time employment where they can access higher incomes
• Practical and attitudinal barriers – research showed that people seeking special accommodation preferred to do so themselves and did not register their housing need with a local authority. They were not always aware of the options available to them. 2/3 of survey respondents were unlikely to be accepted onto special needs waiting lists despite having a physical disability, because they were not permanent wheelchair users. Furthermore, 36% of wheelchair users live in houses (not bungalows) and the majority do not want to move but would rather have adaptations carried out to the property
10.53 Previous Housing Need Surveys within the authorities concluded that there was a need to:
• Continue to promote adaptations in order to improve the ratio of suitably adapted properties for disabled people
• Create a register of adapted property and disabled people needing adapted accommodation in order to facilitate better matching (Choice Based Lettings systems appear better able to do this)

Central Hampshire & New Forest Strategic Housing Market Assessment Final Report
November 2007
176
• Consider adopting Lifetime Homes standards10 for new housing
10.54 In addition, the Survey of English Housing (2004/05 and 2005/06) estimates that nationally there are around 500,000 disabled people using wheelchairs who require specially adapted accommodation (around 1% of the population of England or 2% of households). The figures are higher in the social rented sector where 230,000 disabled people are using wheelchairs and require specially adapted properties – equivalent to around 6% of social rented households. However, around 25% of these households are living in properties that are unsuitable for their needs. This suggests there is a case for securing a proportion of specifically adapted social rented properties through new development in order to boost the availability of these properties and meet the needs of the social rented population going forward.
10.55 Since most of the previous surveys were carried out, the Government has introduced Part M to the Building Regulations, requiring new buildings to be accessible and usable by disabled people, although this by no means facilitates full independent living for all people with disabilities. There are additional plans to incorporate the Lifetime Homes standards for accessibility into Building Regulations in the future. The Disabled Facilities Grant is also available for carrying out adaptations to the home of a disabled person and is allocated to those who can least afford the cost of adapting their property.
10.56 The housing registers of the five authorities reveal limited information about the scale of housing need or the specific requirements of households with disabilities or extra support needs although a significant proportion of those included in the housing need assessment have a medical need to move or are living in properties that are unsuitable eg, in terms of accessibility or facilities.
10.57 In addition to ‘bricks and mortar’ support provided by the authorities and RSLs for households in need, Hampshire County Council runs the Supporting People Programme within the County, directly funded by Central Government. Supporting People provides housing-related care and support to enable vulnerable people to live independently and avoid the use of institutional care (eg, hospitals, care homes and, in extreme cases, prison). Hampshire County as a whole receives £31.1 million in funding for Supporting People in 2006/07 and the same amount in 2007/08, which represents a reduction in funding of around 15% (£5 million) since 2003/04.11
10.58 The majority of the Hampshire Supporting People budget (79%) is spent on accommodation based services – funding around 13,420 units. Within this type of support, 31% is spent on accommodation based support for people with learning difficulties – partly reflecting the higher costs associated with supporting these people to live independently. A further 10% is spent on accommodation based support for older people.
10 A Lifetime Home is the incorporation of 16 design features that together create a flexible blueprint for accessible and adaptable housing in any setting. The Lifetime Homes concept increases choice, independence and longevity of tenure, vital to individual and community well being 11 Audit Commission Supporting People Inspection Report – Hampshire (February 2007)

Central Hampshire & New Forest Strategic Housing Market Assessment Final Report
November 2007
177
Rural Communities within Central Hampshire and New Forest
10.59 Each of the authorities have a significant rural area and large numbers of villages which present a number of issues and challenges in terms of planning for future housing provision and addressing housing demands and needs. Figure 10.11 shows that there are between 70 and 108 rural villages (settlements with a population of less than 3,000 people) in each of the five authority areas.
10.60 Test Valley has the highest number of small settlements, a reflection of having only one significant sized town – Andover (population of around 38,000) and a smaller market town – Romsey with a population of around 17,000.
10.61 Around 40% of the population of Winchester District live in settlements with populations less than 3,000 with only one major town - Winchester City (population 41,000), and below this, only five settlements with a population over 3,000 (Bishops Waltham, Denmead, Alresford, Kingsworthy and Colden Common). Thus the settlement structure in Winchester is fairly polarised – residents either live within Winchester City or one of the larger villages or they live in a settlement of less than 3,000 people.
10.62 New Forest has a relatively small proportion of its population living in settlements of less than 3,000 which reflects the fact that about 60% of the population live in the five medium sized settlements (of around 15,000-30,000 people) within the District. 68,800 people live in the Totton and the Waterside, which is functionally part of the South Hampshire (Southampton) housing market area. New Forest District has a further 6 settlements with a population of 3,000 to 5,500 people.
10.63 Although East Hampshire has relatively fewer settlements of less than 3,000 people than the other Districts, they account for almost 40% of the population of the District and, taken together, are home to over 40,000 people. Furthermore, East Hampshire has no large towns although it has 3 settlements – Petersfield, Whitehill/Bordon and Alton with populations of around 13-16,000 people each. This can be explained by the proximity of the south of the District to Havant and Portsmouth and the north of the District to Basingstoke and the Blackwater Valley – both significant centres of employment and services.
10.64 Similarly, Basingstoke and Deane has a relatively small proportion of its population living in settlements of less than 3,000. The majority of the population in the Borough (over 60%) live within Basingstoke town, although with almost 100 small settlements, there remain issues for future planning and housing activities.
Figure 10.11: Rural Settlements in Central Hampshire and New Forest
Number of Settlements with < 3,000 People
Number of People Living in Settlements
< 3,000
Share of population Living in Settlements
< 3,000 (%) Basingstoke & Deane 94 23,700 16 Winchester 88 41,300 39 New Forest 86 51,600 30 East Hampshire 70 43,000 39 Test Valley 108 48,200 44
Source: Defra Rural Geographies from HARAH website

Central Hampshire & New Forest Strategic Housing Market Assessment Final Report
November 2007
178
10.65 This is particularly important given that the draft Regional Housing Strategy comments on the link between small villages and market towns and the possibility of funding going into settlements of between 3,000 -10,000 population in the longer term.
10.66 The housing issues facing those living within rural areas within Central Hampshire and New Forest are similar to those faced in rural areas across the South of England although the severity of the problems will vary between different places:
• There is an increasing trend towards people buying second homes within rural areas. The highest incidence of second homes is, unsurprisingly, found in New Forest District, accounting for around 2% of the dwelling stock in 2001 (four times the national average) and DTZ would speculate that these proportions have increased over the last 5 years and may continue to do so in the future, particularly with the establishment of the South Downs National Park
• For the majority of wards across Central Hampshire and New Forest, the proportion of dwellings, which are second homes, was less than 2% in 2001. However, there were concentrations of second homes in the following areas (wards):
o Milford (New Forest) – 9% of dwellings were second homes in 2001
o Lymington Town (New Forest) – 6% of dwellings were second homes in 2001
o Boldre & Sway (New Forest) – 5% of dwellings were second homes in 2001
o Brockenhurst and Forest South East – 4% of dwellings were second homes in 2001
o Rooksdown (Basingstoke & Deane) and Bourne Valley (New Forest) –3% of dwellings were second homes in 2001
• Interestingly, the second homes in these areas account for a disproportionate amount of the terraced stock (rather than detached, semi detached or flatted accommodation). In Brockenhurst and Forest South East (New Forest), 12% of terraced houses were second homes in 2001 (compared to just 4% of the stock of dwellings as a whole). 8% of terraced homes in Lymington were second homes (compared to 6% of the stock of dwellings as a whole). Although Dibden and Hythe East (New Forest) has 2% of its stock as second homes overall, 7% of the terraced stock are second homes, which is perhaps a reflection of the attractiveness of this type of housing and the localities in which it is found or maybe linked to marina developments
• Purpose built apartments/maisonettes are also an important source of second homes in these locations – including in Boldre and Sway (78% of apartments in 2001 were second homes), Milford (22% of Milford’s apartments in 2001 were second homes) and Lymington (10% of Lymington’s apartments in 2001 were second homes)
• There is also in-migration to rural areas, particularly New Forest but also Winchester District, East Hampshire and Test Valley, from people retiring and migrating, often from higher-priced areas including London and the rest of the South East.

Central Hampshire & New Forest Strategic Housing Market Assessment Final Report
November 2007
179
• Furthermore, a significant number of people commute from rural areas to well paid jobs elsewhere (whilst local incomes remain relatively low, reflecting the type of work available in rural areas)
• Rural areas also typically have high levels of owner-occupation and low levels of social rented stock – reflecting the trends above and also the tendency for social rented homes in rural areas to be sold through Right to Buy. The Commission for Rural Communities found that in 2004, social housing only represented 7-8% of all new completions in rural areas (a lower proportion than seen in urban areas in the same period)
10.67 It has been estimated by the Commission for Rural Communities that a higher proportion of rural residents (57%) than urban residents (37%) in England have to commit over half their income buying a house. Although incomes in the countryside around urban areas are higher, they are not sufficiently high to counteract the higher house prices so housing around the urban areas is less affordable than within them. There is also a net annual movement of people from urban to rural Britain. The Commission estimated that nationally, up to 22,000 new affordable homes would be needed per year in rural areas.
10.68 People living in rural areas do not necessarily have specific needs. Rather the decision to live in a rural area is often part of a lifestyle choice, as rural areas are perceived to offer a better quality of life. The key criteria people value in living in a rural area are low levels of crime, good neighbours, access to nature/the countryside, shopping facilities and public transport.12 Having access to nature/the countryside is a strong aspiration amongst retired and elderly people. This raises two fundamental questions – to what extent should the authorities prioritise the issues of housing need found within rural areas and to what extent should people living in rural areas expect to have their needs met there?
10.69 There is no easy answer to these policy dilemmas, for the following reasons:
• Land based industries require local workers and typically provide low paid jobs eg, farming, forestry and increasingly, jobs in hospitality and tourism. It does not make sense from a sustainability point of view to have people commuting long distances to work, although there is added implication that jobs are increasingly likely to be filled by those who are willing to do this, including migrants workers from the EU, who may be willing to travel longer distances to work (or work through agencies that provide transport)
• Many villages and rural areas have strong community networks and, even though people may not work locally, there is an argument for providing affordable housing to maintain existing social support networks and informal arrangements for care etc
• It would not be a good outcome if in the future, villages and rural areas were only occupied by wealthy households, and able to choose where they live whilst people on lower incomes are forced into towns and cities. There is an argument therefore for supporting a mix of households within rural areas through the provision of social rented and intermediate housing. Though it must be recognised that the pattern of younger people moving away from rural areas to access a wider labour market, higher paid jobs and, potentially, provide them with the resources to return home in later life, has been a feature of rural life for many years
12 State of the Countryside Report (2006)

Central Hampshire & New Forest Strategic Housing Market Assessment Final Report
November 2007
180
• Households that are accommodated in affordable homes in rural areas are not necessarily those same local people (or the children of existing residents) with local ties identified by surveys. The development pipeline from planning to completion of new homes is lengthy and not set up for quickly meeting a need that has arisen, although local needs are often a key part of winning the argument for provision of affordable housing in rural areas – sometimes against initial local opposition
• The policy levers available to the authorities to deal with issues identified in rural areas are relatively limited (and by and large already known). For example, authorities have the ability to allocate sites for affordable housing in villages and use exception site policies to deliver affordable housing in rural areas. But it is often more expensive to deliver affordable housing (expensive sites, small sites, limited infrastructure) and this challenge is sometimes exacerbated by planning policies and the Housing Corporation emphasising delivery in key settlements.
• The characteristics of rural areas will determine what can be done by way of policy intervention. For example, whether the economics of development will support a particular affordable housing quota or whether local house prices would make intermediate housing viable for those in need of affordable housing.
• There have also been some successful housing schemes built in Hampshire’s rural villages. However, some have taken a long time to come about because of the difficulty in finding sites, lengthy negotiation processes, obtaining planning permission and funding. To combat this, the Hampshire Alliance for Rural Affordable Housing (HARAH) was created and is concerned with the long-term sustainability of villages:
o To make the provision of rural affordable housing more efficient o To consistently provide high quality housing o Increase the availability of funding to provide more affordable homes in shorter
timescales o To invest in the long-term with local communities
10.70 There is little doubt that, where housing can be provided sustainably within rural villages
in Central Hampshire and New Forest, these developments should do as much as possible to deliver affordable housing. This would ensure that need for housing locally can be addressed to some extent (though DTZ would suggest that there is a danger in stressing too far that local needs that arise should or could be met) and so that rural communities also retain a mix of households over time, since processes in the market would work against this.
Students
10.71 At present, the only University in the study area is the University of Winchester. There are 5,600 students at the university. Figure 10.12 shows how students at the University are currently accommodated and this is compared to Universities in Southampton and all UK institutions. There are two additional institutions within Winchester – Winchester School of Art (in the City) and Sparsholt College (outside of the City) which has 1,400 full time students and a further 6,000 part time. The School of Art is affiliated to Southampton University.
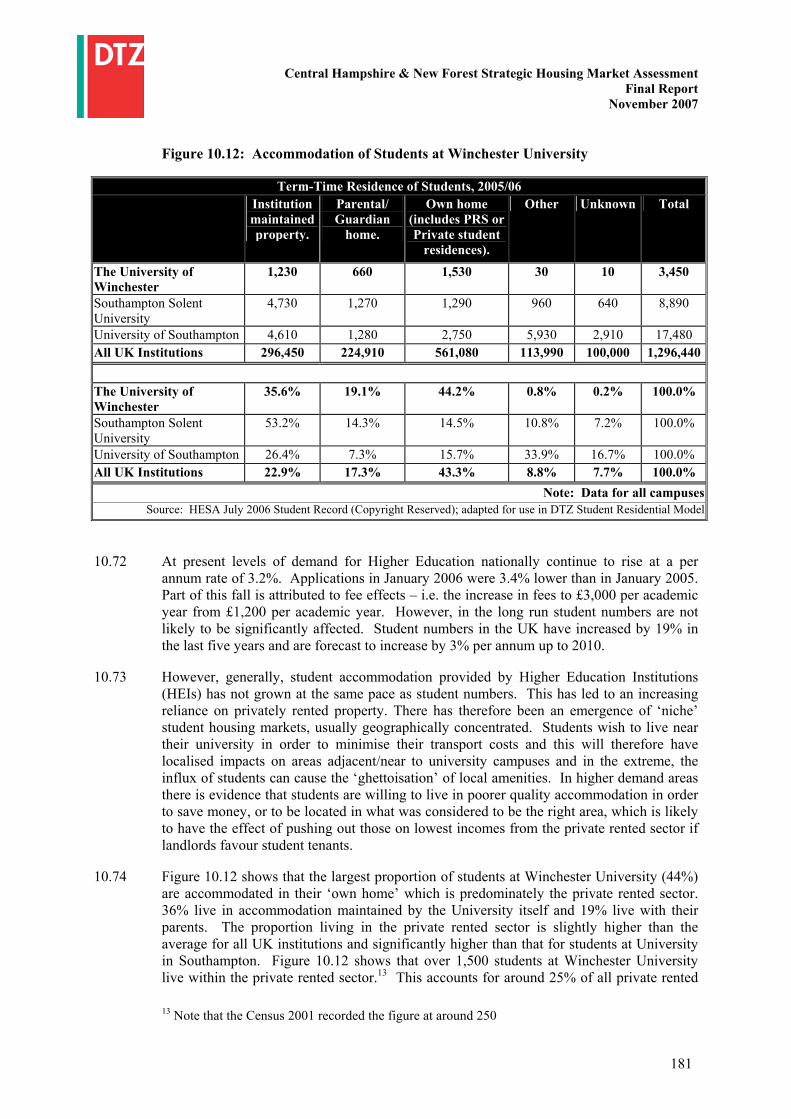
Central Hampshire & New Forest Strategic Housing Market Assessment Final Report
November 2007
181
Figure 10.12: Accommodation of Students at Winchester University
Term-Time Residence of Students, 2005/06 Institution maintained property.
Parental/ Guardian
home.
Own home (includes PRS or Private student
residences).
Other Unknown Total
The University of Winchester
1,230 660 1,530 30 10 3,450
Southampton Solent University
4,730 1,270 1,290 960 640 8,890
University of Southampton 4,610 1,280 2,750 5,930 2,910 17,480 All UK Institutions 296,450 224,910 561,080 113,990 100,000 1,296,440
The University of Winchester
35.6% 19.1% 44.2% 0.8% 0.2% 100.0%
Southampton Solent University
53.2% 14.3% 14.5% 10.8% 7.2% 100.0%
University of Southampton 26.4% 7.3% 15.7% 33.9% 16.7% 100.0% All UK Institutions 22.9% 17.3% 43.3% 8.8% 7.7% 100.0%
Note: Data for all campusesSource: HESA July 2006 Student Record (Copyright Reserved); adapted for use in DTZ Student Residential Model
10.72 At present levels of demand for Higher Education nationally continue to rise at a per annum rate of 3.2%. Applications in January 2006 were 3.4% lower than in January 2005. Part of this fall is attributed to fee effects – i.e. the increase in fees to £3,000 per academic year from £1,200 per academic year. However, in the long run student numbers are not likely to be significantly affected. Student numbers in the UK have increased by 19% in the last five years and are forecast to increase by 3% per annum up to 2010.
10.73 However, generally, student accommodation provided by Higher Education Institutions (HEIs) has not grown at the same pace as student numbers. This has led to an increasing reliance on privately rented property. There has therefore been an emergence of ‘niche’ student housing markets, usually geographically concentrated. Students wish to live near their university in order to minimise their transport costs and this will therefore have localised impacts on areas adjacent/near to university campuses and in the extreme, the influx of students can cause the ‘ghettoisation’ of local amenities. In higher demand areas there is evidence that students are willing to live in poorer quality accommodation in order to save money, or to be located in what was considered to be the right area, which is likely to have the effect of pushing out those on lowest incomes from the private rented sector if landlords favour student tenants.
10.74 Figure 10.12 shows that the largest proportion of students at Winchester University (44%) are accommodated in their ‘own home’ which is predominately the private rented sector. 36% live in accommodation maintained by the University itself and 19% live with their parents. The proportion living in the private rented sector is slightly higher than the average for all UK institutions and significantly higher than that for students at University in Southampton. Figure 10.12 shows that over 1,500 students at Winchester University live within the private rented sector.13 This accounts for around 25% of all private rented 13 Note that the Census 2001 recorded the figure at around 250

Central Hampshire & New Forest Strategic Housing Market Assessment Final Report
November 2007
182
dwellings within Winchester District based on the number of private rented dwellings recorded in 2001 (this supply has no doubt increased in recent years which will mean that students account for a smaller share than suggested here). However, if we assume that they all live within Winchester City urban area, this means that students could account for 50% of Winchester’s private rented dwellings14.
10.75 As confirmed by discussions with stakeholders in Winchester, the presence of the University has a localised impact on the housing market in parts of the city through the concentration of students in the private rented sector and this could increase over time as the University expands its students numbers (or conversely if it loses any of its own accommodation). The University of Winchester expects to grow full time student numbers by around 3-400 by 2010/11. However, the University plans to provide an extra 375 University hall of residence beds in time for the 2009/10 academic year and will increase the number of beds in University managed private houses by around 100 over the same period which suggests there may be no net effect on the private rented sector in the City.
10.76 It is worth noting however that in 2004 the government also introduced HMO (House in Multiple Occupation) licensing to raise the standards of multiple tenancy accommodation. The impact on the private rented sector (and for student accommodation) of this recent change is not yet known but it is likely to have impacted upon the supply and quality of private rented accommodation.
14 The number of private rented dwellings within Winchester City (comprising 7 wards) in 2001 was around 2,500. Although this is likely to have increased since, it suggests that students occupy a significant proportion of private rented homes

Central Hampshire & New Forest Strategic Housing Market Assessment Final Report
November 2007
183
11 POLICY IMPLICATIONS AND RECOMMENDATIONS
Introduction
11.01 This section summarises key points from this Strategic Housing Market Assessment and draws out conclusions and recommendations for policy. The section is structured as follows:
• Requirements of the SHMA process
• Summary of key points from Sections 1-10
• The Geographies
• Affordable Housing
• Mix of Housing
• Delivery
11.02 The requirements of the Strategic Housing Market Assessment and how they have been met are summarised in Figure 11.1.
Figure 11.1: Requirements of the SHMA
Requirement of SHMA Guidance
How these are met in this document
Definition of housing market areas
Provided in Section 2 and concludes that the Central Hampshire market is not a particularly cohesive housing market and New Forest District has links to the east and west of the District.
Setting out objectives and context
Provided in Section 1 and 11 of this SHMA
Providing the evidence base for the drivers of demand within the housing market including demographics, economics and current dwellings
Provided in Sections 3 (conceptual framework), Section 4 (demographic drivers), Section 5 (economic drivers), Section 6 (supply)
Setting out the overall level of demand for market housing from current and future households
Provisional allocations are set out in the draft SE RSS. Section 9 provides evidence on future household types and the implications for dwelling requirements
Undertaking an assessment of housing need using secondary data
Set out in Section 8. Calculations for individual authorities provided in Appendix D
Setting out the overall level of housing need from current and future households
Section 8 and calculations for individual authorities in Appendix D
Setting out the level of need or demand for intermediate housing
Estimates provided in Section 8 and analysis on affordability set out in Section 7
Setting out the type and size of affordable housing required
Section 8 provides data on the pressures on different sized dwellings and the wider considerations
Evidence of specific groups within the housing market
Section 10 provides analysis on the issues facing older people, disabled people, rural communities, BMEs, migrant workers and students
11.03 A summary of the evidence presented in previous sections of this report is provided in
Figure 11.2.
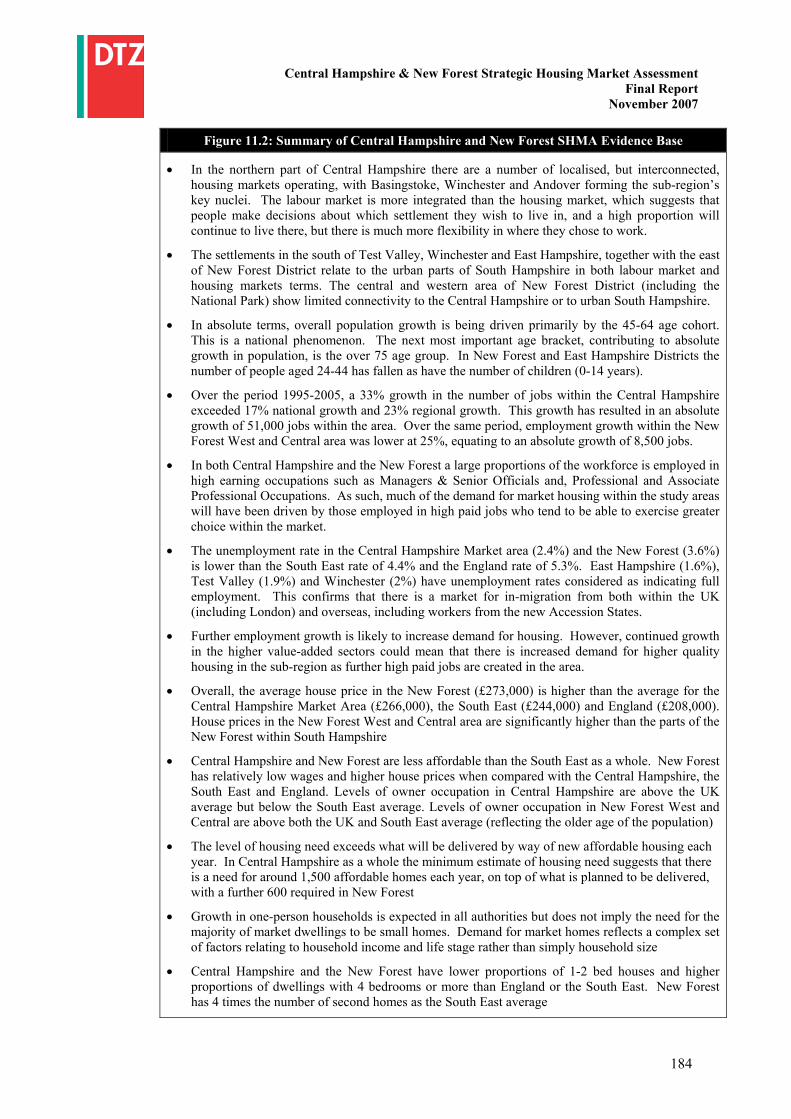
Central Hampshire & New Forest Strategic Housing Market Assessment Final Report
November 2007
184
Figure 11.2: Summary of Central Hampshire and New Forest SHMA Evidence Base
• In the northern part of Central Hampshire there are a number of localised, but interconnected, housing markets operating, with Basingstoke, Winchester and Andover forming the sub-region’s key nuclei. The labour market is more integrated than the housing market, which suggests that people make decisions about which settlement they wish to live in, and a high proportion will continue to live there, but there is much more flexibility in where they chose to work.
• The settlements in the south of Test Valley, Winchester and East Hampshire, together with the east of New Forest District relate to the urban parts of South Hampshire in both labour market and housing markets terms. The central and western area of New Forest District (including the National Park) show limited connectivity to the Central Hampshire or to urban South Hampshire.
• In absolute terms, overall population growth is being driven primarily by the 45-64 age cohort. This is a national phenomenon. The next most important age bracket, contributing to absolute growth in population, is the over 75 age group. In New Forest and East Hampshire Districts the number of people aged 24-44 has fallen as have the number of children (0-14 years).
• Over the period 1995-2005, a 33% growth in the number of jobs within the Central Hampshire exceeded 17% national growth and 23% regional growth. This growth has resulted in an absolute growth of 51,000 jobs within the area. Over the same period, employment growth within the New Forest West and Central area was lower at 25%, equating to an absolute growth of 8,500 jobs.
• In both Central Hampshire and the New Forest a large proportions of the workforce is employed in high earning occupations such as Managers & Senior Officials and, Professional and Associate Professional Occupations. As such, much of the demand for market housing within the study areas will have been driven by those employed in high paid jobs who tend to be able to exercise greater choice within the market.
• The unemployment rate in the Central Hampshire Market area (2.4%) and the New Forest (3.6%) is lower than the South East rate of 4.4% and the England rate of 5.3%. East Hampshire (1.6%), Test Valley (1.9%) and Winchester (2%) have unemployment rates considered as indicating full employment. This confirms that there is a market for in-migration from both within the UK (including London) and overseas, including workers from the new Accession States.
• Further employment growth is likely to increase demand for housing. However, continued growth in the higher value-added sectors could mean that there is increased demand for higher quality housing in the sub-region as further high paid jobs are created in the area.
• Overall, the average house price in the New Forest (£273,000) is higher than the average for the Central Hampshire Market Area (£266,000), the South East (£244,000) and England (£208,000). House prices in the New Forest West and Central area are significantly higher than the parts of the New Forest within South Hampshire
• Central Hampshire and New Forest are less affordable than the South East as a whole. New Forest has relatively low wages and higher house prices when compared with the Central Hampshire, the South East and England. Levels of owner occupation in Central Hampshire are above the UK average but below the South East average. Levels of owner occupation in New Forest West and Central are above both the UK and South East average (reflecting the older age of the population)
• The level of housing need exceeds what will be delivered by way of new affordable housing each year. In Central Hampshire as a whole the minimum estimate of housing need suggests that there is a need for around 1,500 affordable homes each year, on top of what is planned to be delivered, with a further 600 required in New Forest
• Growth in one-person households is expected in all authorities but does not imply the need for the majority of market dwellings to be small homes. Demand for market homes reflects a complex set of factors relating to household income and life stage rather than simply household size
• Central Hampshire and the New Forest have lower proportions of 1-2 bed houses and higher proportions of dwellings with 4 bedrooms or more than England or the South East. New Forest has 4 times the number of second homes as the South East average

Central Hampshire & New Forest Strategic Housing Market Assessment Final Report
November 2007
185
Geographies
11.04 Section 2 of this report, and confirmed through discussions with stakeholders, highlighted that the Central Hampshire area is not a cohesive housing market, although there are relatively stronger links in terms of the labour market. Furthermore, there are significant adjacent housing markets with an influence on parts of the area:
• The Blackwater Valley on Basingstoke and East Hampshire – both of which have links to key settlements including Aldershot
• Basingstoke is also linked to the West Central Berkshire market area which includes Reading, West Berkshire (Newbury and Thatcham) which are both linked through household and travel to work movements to Basingstoke town and to the north of Basingstoke and Deane Borough. Both Reading and Basingstoke have been designated as Growth Points with the aim to deliver additional housing over the next 10 years, as part of the Government’s objective to increase housing supply
• To the South of the Central Hampshire area there is the PUSH sub-region, also identified as a Growth Point. The PUSH area includes two main sub-regional housing markets centred around Southampton (Western Pole) and Portsmouth (Eastern Pole). The influence of these markets extends into New Forest, Test Valley, Winchester and East Hampshire Districts
• The western settlements in New Forest District also have links to the adjacent housing and labour market associated with Christchurch and Bournemouth
11.05 There are a number of common issues across the five authorities under consideration in this SHMA and many are issues common to other authorities in the South East facing similar pressures. However, given the nature of the area, the existence of adjacent housing market areas with significant growth plans and, with the exception of Basingstoke town in the north of Central Hampshire, the rural settlement structure, it is necessary to consider the different geographical implications to the conclusions of this SHMA.
11.06 Figure 11.3 provides an overview of the different geographical levels within the area and the considerations that need to be taken into account within policy. Although not represented in Figure 11.3 it is also relevant to note that New Forest National Park (New Forest District) and the proposed South Downs National Park could cover significant parts of the land area of some of the authorities (Winchester and East Hampshire).

Central Hampshire & New Forest Strategic Housing Market Assessment Final Report
November 2007
186
Figure 11.3: Geographical Considerations for Policy
Geography
Indicative Areas Key issues & Considerations
Housing markets
Central Hampshire market area (Basingstoke, parts of Winchester District, East Hampshire and Test Valley)
New Forest West & Central (excluding the Waterside area which relates to South Hampshire)
Common issues include: • Full employment, in-migration and development
pressures • Growing older population • Affordability problems and housing need • Significant number of rural villages and high
proportion of population living in rural areas Need to take into consideration adjacent and over lapping housing markets and sub-regions: • PUSH area for Winchester, Test Valley, New Forest
and East Hants • Blackwater Valley for Basingstoke and East Hants • West Central Berkshire market area for Basingstoke. • Bournemouth and Christchurch markets for West of
New Forest Main towns & cities
Basingstoke (population 90,000), Winchester (population 45,000) and Andover (41,000)
Each of the main towns has its own self contained housing market (where around 80% of household moves are within each town and around 80% of people live and work in the urban area – see Appendix A). The influence of these towns also extends into a wider catchment area. These settlements have a significant role in accommodating overall housing development and therefore addressing housing need within the area
Medium sized settlements (10-30,000 people)
Tadley, Petersfield, Whitehill/Bordon, Alton, Romsey, Lymington, Fawley/Blackfield/ Holbury, Hythe, Ringwood, New Milton, Totton (in South Hampshire market area
Medium sized towns also have an important role, particularly in East Hampshire and New Forest where the settlement structure is not dominated by one major town. These settlements are also likely to have a role in accommodating overall housing development and indications in the draft RHS are that funding for rural affordable housing will be targeted at market towns and settlements above 3,000 in population
Small towns/ large villages (3-10,000)
E.g. Bishops Waltham, Denmead, Kingsworthy, Fordingbridge, Alresford, Liss, Liphook, Oakley, Whitchurch, North Baddesley, Kingsclere, Overton, Bramley, Whitely.
These settlements are largely functionally part of wider housing/ labour market associated with the larger urban areas. These settlements are important in Winchester (which has no substantial towns below the City) and likely to be considered for sustainable development and to offer wider choice in the market. Indications in the draft RHS are that funding for rural affordable housing will be targeted at market towns and settlements above 3,000 in population
Villages & rural areas (less than 3,000)
Between 70- 100 small settlements in each of authority areas
Functionally part of a wider housing/ labour market but some have land based industry (including activities associated with the New Forest National Park) and need for housing locally. Most are likely to be limited by the availability of sites, funding for affordable housing and often significant opposition to development in villages and rural areas

Central Hampshire & New Forest Strategic Housing Market Assessment Final Report
November 2007
187
11.07 Although Central Hampshire is not a cohesive housing market area and indeed the New Forest is not part of a functional Central Hampshire market, there are a number of common conclusions for the five authorities around the following themes. The following themes are relevant at almost all of the above geographical levels and also relate to the key requirements of PPS3 and Government’s housing policy:
• The need for affordable housing
• Influencing the housing mix (type and size of market and affordable homes)
• Ensuring the delivery of housing provision
11.08 There are also a common set of principles that DTZ suggest should inform the development of policy across the sub-region and within the individual authorities:
• The need to be flexible to changes in the housing market, changes in the nature of demand and need and, in some authorities, the need to meet challenging delivery targets
• The need to make the most of scarce resources, particularly in relation to affordable housing in both areas that are seeking to increase delivery and grow and in areas with constrained housing supply
• The need to consider site specific circumstances, including patterns of tenure, type and size of dwelling stock and local characteristics
Affordable Housing
11.09 The assessment of housing need in Section 8 demonstrates that in all five authorities there is a need to maximise the delivery of affordable housing. In all of the authorities, the level of affordable housing needed each year in order to address the backlog on local authority waiting lists and meet need that is likely to arise over the next five years is far in excess of what is likely to be delivered by way of new affordable housing and what has been delivered in recent years. This raises two questions:
• How far can the authorities maximise the provision of affordable housing through new development?
• How can the authorities make the best use of affordable housing as a scarce resource (in terms of both the use of the existing stock and new supply)?
11.10 How far each authority can secure new affordable housing through new development will vary according to the following factors, which are likely to vary between the geographical levels outlined above:
• Development economics and the health of the housing market: DTZ’s assessment of viability of typical sites within Basingstoke, Winchester and East Hampshire suggest that development economics are relatively robust across the three authority areas. Similar studies undertaken by The Three Dragons Consultancy in New Forest and Adams Integra in Test Valley come to the same conclusion. Discussions with some developers during the development of the SHMA confirmed that, on greenfield sites in the Central Hampshire area, the delivery of 40% affordable housing was generally achievable at the present time.

Central Hampshire & New Forest Strategic Housing Market Assessment Final Report
November 2007
188
• Availability of grant: Investment in affordable housing is increasing but there is an expectation that resources will have to be stretched further in the future. Housing Corporation grant will only be available where affordable housing provided is additional to what could have been secured without grant. There is therefore uncertainty for the Central Hampshire authorities as to the availability of grant so the starting point for the authorities and local developers is likely to be the assumption that grant is not available. There are also indications in the draft Regional Housing Strategy that grant for affordable housing will be focused on development in settlements with populations of more than 3,000 – with the expectation that affordable housing for rural areas will be provided in settlements with populations of 3-10,000.
• The level of housing growth proposed: There is considerable variation between the five authorities in terms of the scale of new housing development proposed in the future. Although housing targets are likely to be increased, if not immediately then following a review of plans, the level of development proposed in New Forest District and East Hampshire is lower than previous targets and in Winchester and Test Valley targets are similar to the past. This means that these authorities have considerable leverage over new development, particularly whilst demand and prices are as robust as they have been in recent years. However, the level of housing development in some areas place a limit on the absolute amount of affordable housing that can be secured. In contrast, in Basingstoke and Deane the level of development planned is significant. This raises issues about the robustness of the market over time to support delivery and suggests the need for greater flexibility than in areas like the New Forest, which are operating under constraint. However, this does present a significant opportunity to secure additional affordable housing and to influence the nature of a significant proportion of the future housing stock.
• The site specific and neighbourhood context: The tenure pattern and nature of the existing housing stock varies within and between the authority areas. For example, in some areas it is likely to be appropriate to increase the stock of social rented accommodation, particularly in rural towns and villages, where the stock has been depleted. However, it may not be appropriate in all circumstances to maximise the level of social rented provision in new developments. In large scale developments DTZ would suggest that no more than 25% of homes are developed for social renting or in developments where there are existing concentrations of renting (social or private) where it would make sense to diversify tenure.
11.11 Figure 11.3 sets out the current and, where relevant, emerging policies of the five authorities in relation to affordable housing and provides a summary of the evidence relevant to these from the previous sections.
11.12 It is also relevant to consider that a 40% affordable housing quota has been proposed and is likely to be adopted across the PUSH sub-region. To the north of Central Hampshire Reading and West Berkshire are pursuing policies of around 40% affordable housing (with Reading seeking higher levels where possible), which is relevant to considerations in Basingstoke and Deane in particular.
11.13 It is also important to note that a quota of 40% affordable housing does not mean that 40% of all new housing will be affordable since the quota may not be applied or achievable on all sites. It is therefore important in the case of the five authorities to consider the site size thresholds at which the policy will be applied and Figure 11.3 outlines that this has been an issue in a number of the authorities.

Central Hampshire & New Forest Strategic Housing Market Assessment Final Report
November 2007
189
Local Authority
Current / Emerging Policy Implications of SHMA Evidence for Current/ Proposed Policy
Basingstoke & Deane
40% across the Borough Threshold of 15 dwellings in the towns Threshold of 7 dwellings in settlements less than 3,000 (emerging policy proposes to reduce this to 5 dwellings) Within the quota, 25% social rented, 15% intermediate (including IM rent)
Significant level of need for social rented accommodation, evidenced by the housing need assessment High level of interest in intermediate options in the Borough (and significant potential market for these products) Plans to deliver significant levels of new housing overall (maintaining current completion levels for the next 10 years) Relatively high proportions of social renting in parts of the Borough The Borough Council have had some difficulty negotiating this level and mix of social rented and intermediate housing on recent developments
East Hampshire
35% across the District Threshold of 15 dwellings (or 0.5 hectares) across the District or 5 dwellings (0.15 hectares) in settlements less than 3,000
2nd highest average house prices in the Central Hampshire area Significant level of need for social rented accommodation, evidenced by the housing need assessment Limited new housing development planned which will limit total amount of affordable housing that could be secured Reliance on medium sized and smaller towns/ villages to deliver (and where development economics is generally more robust) Low levels of social renting Authorities to South of District (PUSH area) aiming for 40% affordable housing Threshold has affected delivery and propose to adopt a sliding scale to capture smaller sites.

Central Hampshire & New Forest Strategic Housing Market Assessment Final Report
November 2007
190
Local Authority
Current / Emerging Policy Implications of SHMA Evidence for Current/ Proposed Policy
Test Valley
40% across the District Threshold of 15 units or 5 dwellings in settlements less than 3,000 Current thresholds are being reviewed as part of the Core Strategy Within the quota, 25% social rented, 5% shared ownership, 10% discounted market value (but in perpetuity) designed so local people can access the MDA
Significant level of need for social rented accommodation, evidenced by the housing need assessment High level of interest expressed in intermediate options in the Borough (and significant potential market for these products) Outside Andover (and the Major Development Area) and Romsey development is likely to be small in scale which will limit the amount of affordable housing that can be delivered in rural areas Relatively high proportions of social renting in parts of Andover Threshold limits the delivery of affordable housing
Winchester
40% in Winchester City, West of Waterlooville and the reserve MDAs 30% in larger settlements (greater than 3,000) 30% in small settlements 35%+ in local reserve sites although none have been released yet Threshold of 15 dwellings in City and larger settlements Threshold of 5 dwellings in small settlements
Highest average house prices in Central Hampshire – development economics generally robust Significant level of need for social rented accommodation, evidenced by the housing need assessment Largely reliant on development in Winchester City – development outside will be in a few relatively smaller settlements (Denmead, Bishops Waltham, Kingsworthy, Alresford) below which there are only settlements of 3,000 or less (but where almost half the population live). West Waterlooville MDA relates most closely to South Hampshire market area Relatively high proportions of social renting in parts of Winchester Have been delivering quota but the threshold has limited delivery

Central Hampshire & New Forest Strategic Housing Market Assessment Final Report
November 2007
191
Local Authority
Current / Emerging Policy Implications of SHMA Evidence for Current/ Proposed Policy
New Forest
Currently 35% Threshold of 15 dwellings or no thresholds on sites less than 3,000 Preferred option 40% in Totton and Waterside 50% everywhere else No threshold proposed but in urban areas will accept a tariff on developments of 4 dwellings or less and similarly in rural areas on developments of 2 dwellings or less Within the quota, expect 35% social rented, 15% intermediate but will flex according to viability. 18 month adjustment period proposed in policy
High average house prices – development economics generally robust Significant level of need for social rented accommodation, evidenced by the housing need assessment Limited new housing development proposed and outside of Waterside area (which relates to South Hampshire market) development will be reliant on market towns and smaller settlements. Development highly constrained, particularly in the National Park Area although the area has a significant population and is likely to require development to meet local needs eg associated with land based employment in the Park Low levels of social renting (half of social rented stock sold through Right to Buy)

Central Hampshire & New Forest Strategic Housing Market Assessment Final Report
November 2007
192
Conclusions and Recommendations for Affordable Housing
Affordable Housing Quotas
11.14 The key conclusion in relation to affordable housing is that the authorities need to maximise the delivery of affordable housing. DTZ recommend that the authorities aim to secure 40% affordable housing from new development, across the area. For some authorities this would mean increasing the affordable housing quota set out in current plans (Figure 11.3 provides a summary of the justification for this). It would be appropriate, and is likely to be possible, to achieve a higher level (up to 50%) in settlements of less than 3,000 people and in rural areas where development economics are often robust.1 Given the scale of development likely in these locations the authorities may be less reliant on new housing to deliver their overall numbers and therefore have relatively more leverage over the nature of development.
11.15 Given the level of need in relation to the amount of affordable housing that is available and is likely to be delivered in the future, the authorities are likely to want to prioritise in terms of the type of affordable housing secured and this is likely to mean securing social rented accommodation first. The vast majority of households who have been identified as in housing need in Section 8 of this report require social rented accommodation because they are unable to meet their own needs within the market.
11.16 There is some merit in the authorities adopting a consistent framework on affordable housing quotas, particularly in supporting negotiations with developers and in providing clarity to developers operating across the area. Development economics do, however, vary between the local authorities and within their areas depending on land values, the type and location of sites and site specific factors. DTZ suggest that the authorities use the balance between social rented and intermediate housing within the affordable housing quota to provide flexibility in negotiations with developers and over the plan period when the market changes. Policies included in new local development documents are likely to be set for at least the next 5 years and it is highly likely that in this period there will be a downturn in the housing market so it is important that policies on affordable housing have the flexibility to cope with changing development economics and that they do not just reflect what is achievable in a robust market.
11.17 Within the quota of affordable housing, DTZ suggest that not more than 25% of all new housing is delivered as social rented accommodation on large developments (where new communities are effectively being created) or in neighbourhoods with existing concentrations of social and private renting. There is no evidence or research to suggest that 25% is the optimum level – indeed there are very successful communities such as Bournville where social renting is much higher. However, there are a number of reasons why we suggest 25% social renting:
• Social rented accommodation tends to be fully occupied. Social rented accommodation is effectively rationed and so a family with two young children of the same age will typically be allocated a 2 bedroom house or flat. This is in stark contrast to how most owner occupiers live – often ‘under occupying’ their properties. So although social rented dwellings may account for 25% of homes on a new development it is likely that the people household within them will be living at higher people
1 Exception sites in rural areas capable of delivering 100% affordable housing is also a tool that should be used, where achievable

Central Hampshire & New Forest Strategic Housing Market Assessment Final Report
November 2007
193
densities.2 Evidence suggests that children will need to use the space within the neighbourhood, outside of their homes, to play and find space. Therefore, consideration needs to be given to the different amounts of space that households within the same development will have to occupy. This will also impact on wider neighbourhood considerations e.g. the need for green space and play space for children.
• Social rented dwellings tend to house households who have lower economic activity rates and significantly lower incomes and earnings than other households (evidenced in Section 5). Often one of the justifications for encouraging the development of mixed income communities is to reduce the ‘area effect’ of deprivation. It is therefore considered important to limit concentrations of lower income and less economically active households in order to ensure that communities are connected to the local economy and that local services are supported and remain viable.
• Social and private renting is generally associated with a higher turnover of residents, which can make for less stable and cohesive communities. However, high turnover is more to do with the life stage or circumstances of the households who are housed in rented accommodation rather than the tenure itself. It is therefore something for the authorities to consider in relation to specific developments. If high turnover of residents and community stability is perceived to be a problem then it would be worth considering the level of social rented accommodation appropriate to the site and the type of new homes provided (eg whether larger homes would allow greater stability of households and reduce turnover) and equally whether the type of development proposed is more likely to attract private renting.
11.18 The level of social rented accommodation secured as part of the affordable housing quota may appropriately be higher in areas where the level of social renting is low – for instance in some of the market towns and in the smaller settlements and rural areas. Typically, social rented stock in rural areas has been eroded by the Right to Buy and rural areas have experienced proportionately lower levels of development of social rented housing in recent years.3
11.19 Equally, on small scale developments where the development is integrated into a wider neighbourhood the tenure of the development needs to be seen in this overall context rather than on its own terms. The level of social rented accommodation delivered on these sites could therefore be higher than 25%.
Basis of Affordable Housing Quotas
11.20 There is also a need to consider the basis of the affordable housing quotas in order to maximise the amount of affordable housing secured through new development. There are a number of options available to the authorities. The local authorities could consider setting affordable housing targets in terms of either (or a combination) of the following:
• Number of affordable units. This has the benefit of being widely understood by authorities and developers but focusing solely on this sometimes means that the aim becomes maximising the number of units rather than securing the best mix of dwellings to meet priority needs (discussed further in this section). The Housing Corporation’s Programme has long emphasised maximising value for money measured
2 Joseph Rowntree Foundation (2006) More than Tenure Mix – Developer and Purchaser Attitudes to New Housing Estates 3 Report of the Affordable Rural Housing Commission (2006)

Central Hampshire & New Forest Strategic Housing Market Assessment Final Report
November 2007
194
by the number of units delivered for a given sum of public sector funding. Grant per unit has therefore been a key consideration in funding. Not surprisingly a focus on grant per unit encourages RSLs to bring forward smaller developments that they might otherwise do, because they require lower levels of grant funding, and are more likely to secure grant funding. 4
• The number of habitable rooms or bedrooms provided. This would have the benefit of focusing on the number of people housed through the affordable housing provision which might be a better outcome in terms of meeting housing need, even though the overall number of affordable dwellings provided might not be maximised. The Housing Corporation has now recognised the potential way in which a performance target based on grant per unit may result in a bias in the programme to fund small units. It has therefore started to monitor the grant per person awarded. However, if this is to have an impact it will be important for grant per person to be an important part in the decision to award grant to schemes. It is, however, harder to think in terms of habitable rooms or bedrooms which might make negotiations or policies more complex and confusing for authorities and developers
• The floorspace provision of affordable housing. As outlined above this might have the benefit of focusing the debate on the amount of affordable ‘space’ provided rather than the number of units. In an extreme case, whilst affordable homes may make up 40% of the homes on a site if they are all delivered as 1 and 2 bed flats they are likely to take up much less than 40% of the floorspace of the overall development. Whilst we are not advocating that they should, given the points made about occupancy levels in social rented homes and the likely impact on scheme viability, this could become a useful consideration alongside the number of units and bedrooms provided.
11.21 In practice it is likely that the level of affordable housing negotiated on individual sites will take into account more than one of the above considerations. However, it is likely that emerging affordable housing policies will set out a clear affordable housing quota based on the number of units so it would be worth considering whether the authorities also need to explain in their policies that this quota will be considered, and possibly varied, alongside the type and size of dwellings provided (in terms of bedrooms, habitable rooms and floorspace).
Affordable Housing Thresholds
11.22 Figure 11.3 outlines that, for most of the authorities, securing the quota of affordable housing set out in plans has by and large been achieved, but the key constraint in the delivery of additional affordable housing is that many development sites have fallen below affordable housing thresholds and have therefore not provided affordable housing. This means that, overall, the proportion of affordable housing secured through new development has been less than optimal. In 2005/06 the percentage of affordable housing delivered as a proportion of all new housing in each authority was:
• 25% in Basingstoke and Deane. 924 new homes were delivered, of which 233 were affordable homes. This excludes Open Market Home Buy (an additional 43 homes) which does not provide a net addition to the affordable housing stock
4 See also DTZ’s Report to the South East Regional Assembly and SEEDA (February 2007) ‘Housing Type and Size in the South East’ which provides further detail and recommendations on measuring affordable housing delivery and securing a better mix of affordable homes

Central Hampshire & New Forest Strategic Housing Market Assessment Final Report
November 2007
195
• 19% in East Hampshire. 362 new homes were delivered, of which 69 were affordable (Open Market Home Buy accounted for a further 56 affordable homes)
• 31% in New Forest. 403 new homes were delivered, of which 125 were affordable
• 28% in Test Valley. 374 new homes were delivered, of which 103 were affordable
• 23% in Winchester. 490 new homes were delivered, of which 113 were affordable
11.23 Although 2005/06 only provides a snap shot of delivery, and there are also likely to be other issues bundled up in these figures, the fact that small sites make up a significant proportion of new housing development means that the opportunity to secure affordable housing is sometimes missed.
11.24 The main advantage of affordable housing thresholds for local authorities is that it focuses limited resources – it would be costly to process and negotiate on every small development and to some extent the administrative costs of this might outweigh the benefits of any contributions secured through small sites. It is also sometimes assumed that small scale developments may be less likely to be able to support the delivery of affordable housing because there are limited opportunities to secure economies of scale. Although on the other hand, small sites may not be burdened by the requirement to support strategic infrastructure requirements and very small developments are typically delivered by small developers who may not have significant overhead to cover. However, as for the local authorities, the costs to the developer of getting involved in negotiations over affordable housing on small sites may be too costly for a small development. This may mean that the effort involved in securing affordable housing from small sites is likely to be disproportionate to their size.
11.25 The disadvantage of affordable housing thresholds is that a ‘threshold effect’ develops. Stakeholders cited the tendency of developers to propose a ‘planner’s dozen’ - 14 dwellings on development sites - to avoid affordable housing contributions. This is clearly undesirable for both affordable housing delivery and housing delivery overall.
11.26 Ideally, the authorities could adopt a principle of securing affordable housing on all sites, regardless of the size of the development. Theoretically, affordable housing contributions could also be sought from development of commercial sites, where development economics permit, since these are associated with the provision of employment, which, if additional, is likely to generate further demand and need for housing.
11.27 However, how far the authorities are able to remove affordable housing thresholds depends on whether the benefits to them (and to the delivery of affordable housing) of being involved in negotiations on small sites outweighs the cost.
11.28 There are a number of alternative options to the full scale removal of thresholds, which could help to reduce the ‘threshold effect’. One means of achieving this would be to develop a sliding scale of affordable housing quotas according to site size. East Hampshire District Council are proposing to introduce this approach. This would have the benefit of reducing the threshold effect. Although viability on small sites is not always less robust which means that some opportunities to secure affordable housing may be missed and such an approach may still entail negotiations between the authorities and developers. An alternative option would be to employ a threshold but to set a standard charge as a contribution to affordable housing on sites that fall below the threshold (as being considered by New Forest District on developments of 4 or less in urban areas or 2 or less in rural areas). This would have the benefit to the authority and developer of avoiding

Central Hampshire & New Forest Strategic Housing Market Assessment Final Report
November 2007
196
negotiations on smaller sites (although both parties would still entail costs if the development is deemed unable to meet the charge and negotiations were required). Alternatively, if the charge was non-negotiable this would mean that some developments would not come forward. The authority would need to judge whether this was an acceptable cost against the benefit of reducing the resources tied up in negotiations on small sites.
11.29 Finally, the authorities need to consider the type and size of sites that they allocate or identify for development in the future. Whilst the effect of thresholds may be difficult to avoid on windfall sites, it should be possible to ensure that future allocations are of sufficient size to ensure that they deliver affordable housing. Indeed, it would be a good objective to ensure that there are a sufficient number of larger sites allocated for development to deliver affordable housing targets without the need to rely on the smallest sites. This is likely to be more challenging in authorities that will be reliant on development in market towns and villages (e.g. East Hampshire and New Forest) where development sites may be smaller in scale. However, if this can be achieved it may reduce the ‘effort’ required to secure affordable housing by making the task more manageable through focusing resources on fewer sites and reducing the number of site specific negotiations. 5
Location of Affordable Housing
11.30 A further consideration in the provision of new affordable housing through new development is location.
11.31 In an ideal world, it would be possible to meet housing need and demand where it arises. A situation where households had free choice on where they wanted to live ought to deliver better social outcomes for them and their communities. But in the context of a shortfall of housing (market and affordable), constrained supply as a result of limited resources and environmental and infrastructure limitations, the location of new development is always likely to be a compromise. This is part of the justification for thinking in terms of housing market areas rather than administrative boundaries. Housing market areas broadly represent the area that households are prepared to move within to access housing. By implication, housing provided within a market area should serve the demands and needs of households within that area.
11.32 However, evidence demonstrates that mobility and choices in relation to housing are more limited amongst social rented tenants6 and those on lower incomes so this needs to be borne in mind in the location of new affordable homes.
11.33 The housing registers of the five authorities provide some indication of the preferences that applicant households have in terms of where they want to live. In all of the authorities there is housing need in all of parishes or localities7 as indicated by the preferences expressed by applicant households. However, the highest preferences are for the main settlements and in Winchester and Basingstoke the city and town themselves. However, the ‘preferences’ or ‘choices’ that applicants have indicated in their applications can be
5 DTZ is undertaking an assessment of viability for Basingstoke & Deane, East Hampshire and Winchester which is considering these factors 6 Survey of English Housing (2005/06) demonstrates that, nationally, 72% of social rented tenants move less than 5 miles when moving home, compared to 54% of owner occupiers and 50% of private renters. Only 15% of social rented tenants move more than 10 miles compared to 29% of owner occupiers and 28% of private renters. 7 Locational preferences of households on Winchester’s and Basingstoke’s waiting and transfer lists are in zones rather than parishes

Central Hampshire & New Forest Strategic Housing Market Assessment Final Report
November 2007
197
misleading because they are likely to reflect the households’ assessment of the likelihood of being housed which in turn reflects the availability of re-lets and stock of existing social rented accommodation. This means that housing need in rural parishes is likely to be under-represented by the preferences expressed by applicant households on housing registers.
11.34 However, since almost all new affordable housing is provided through the development of new market housing in practice, where new affordable housing is provided is likely to be affected by a wider set of considerations including the availability and sustainability of sites and whether affordable housing can be delivered viably. In the rural areas of the five authorities these constraints are likely to be even more extreme and so the question for consideration in the development of rural affordable housing is likely to be ‘what can be achieved?’ rather than ‘what is needed?’.
11.35 What is needed by way of affordable housing in rural areas is likely to be more than could be realistically delivered. Furthermore, anecdotal evidence from some recent rural developments in Central Hampshire suggests that, although highly successful, the lead in times for the development of affordable housing in rural areas can be very long (5-10 years). It is therefore unrealistic to aim to identify a specific need (e.g. a particular household) and then meet it in a particular location – that very need may have changed by the time the homes are built – although housing need in the rural area is likely to remain.
Maximise Resources from Existing and Future Affordable Housing Stock
11.36 Given the scale of need for social rented accommodation identified in Section 8 of this report and, even under a higher house building scenario with more investment in affordable housing, the level of need is unlikely to be addressed. In any one year more households will be housed or re-housed within the existing stock of social rented homes rather than in new social rented homes. In the five authorities new social rented accommodation accounts for around 25% of the available supply in any one year.
11.37 It is worth asking the question therefore - can households in social rented homes be encouraged and supported to move out of social renting in the longer term and in a sustainable way to increase the availability of social rented housing through re-lets? This is likely to be particularly relevant in New Forest and East Hampshire where the stock of affordable homes is limited and development of new housing in the future will be constrained. There are a number of ways that this objective could be achieved.
11.38 Ideally, social rents would be means tested so that if circumstances change and income and earnings increases, the household would be expected to pay more, up to the full market value of the rent – which would also put them in a good position to assess and make proper choices about alternative options in the open market. The gap between RSL rents and private sector rents in all five authorities is significant (weekly rents in the private rented sector are practically double the weekly rents of RSL) and this is likely to discourage households who have a social rented tenancy from giving it up even when they might be able to afford market housing. Tenancies could be reviewed on a regular basis so that if the circumstances of households change and they are able to afford to access housing in the market they would be expected to find alternative accommodation and free up the home for a household in higher priority need. Realistically, this is not within the power of the five authorities since existing tenants have rights to the properties that they occupy. It may be an approach that could be gradually implemented as new tenancies are awarded, though it would take time for this to have an impact on the level of re-lets and it would require the

Central Hampshire & New Forest Strategic Housing Market Assessment Final Report
November 2007
198
authorities (and RSLs) to get a better understanding of the incomes of those in social rented accommodation and on waiting lists.
11.39 The five authorities might be able to do more through the targeted provision of specific types of new affordable homes to encourage certain households to move in to better suited accommodation, and free up a social rented property for another household in need.
• Many of those that under-occupy social rented housing are elderly tenants, who are both reluctant to leave their home of many years, and are concerned about the stress involved in moving. However, authorities could free up a larger dwellings by offering smaller units to older people living in large dwellings. Experience suggests that authorities would need to offer a very attractive product – say a new two bedroom flat in a good location and help with moving and associated expenses – if they are to be successful in persuading people to leave their home of many years.
• Evidence from Swaythling’s list of households interested in intermediate housing options suggests that around 10% of those interested are registered on local authority waiting lists in the five authorities (the % is higher in Test Valley and New Forest). This suggests that there is scope for some social rented tenants and some of those on waiting lists (though unlikely to be in priority need) to access intermediate housing options. There is limited information available on the incomes of those households living in social rented accommodation within the authority areas to properly assess the extent to which households might be able to access intermediate options. However, targeting suitable intermediate options towards those in social rented accommodation and/or on waiting lists and able to afford to pay more than a social rent would be an efficient use of affordable housing resources and would promote greater mobility within tenures.
Intermediate Affordable Housing
11.40 Section 7 and 8 demonstrate that there are a number of different ways of measuring the ‘intermediate’ housing market. Section 7 demonstrates that there is a significant sized theoretical market in Central Hampshire based on the incomes of households in each of the authority areas. Section 8 demonstrates that there are over 3,000 households in Central Hampshire and New Forest who have actively expressed an interested in intermediate housing options, with particular interest in Basingstoke and Test Valley.
11.41 It is important to remember that those households that may be able to access intermediate housing will have considerably more choice than those requiring social rented housing, for example they may be able to access suitable accommodation in the private rented sector (indeed the largest proportion of households interested in intermediate housing on Swaythling’s list are private rented sector tenants). Moreover, although these households may be able to access intermediate housing products this does not mean that they will. Some may prefer to delay purchasing a house with the expectation that they will be able to buy in the open market in the future. Others may prefer the flexibility offered by renting privately.
11.42 However, there are a number of reasons for including intermediate housing affordable housing policies. Flexibility in how the achievement of the affordable housing quota can be met will be helpful in negotiations and is likely to be appropriate in the light of people’s housing aspirations and the desire to build mixed income communities. Key considerations are as follows.

Central Hampshire & New Forest Strategic Housing Market Assessment Final Report
November 2007
199
• In recent years there has been growing recognition of the undesirability of creating large concentrations of social rented dwellings, and the desirability of creating mixed income communities at the neighbourhood level. On larger developments or developments in areas which already have a high level of social rented housing (in Basingstoke, Winchester and Andover) it may be deemed desirable in terms of building balanced communities to encourage an element of shared ownership or other forms of intermediate housing.
• Home ownership is the tenure of choice of virtually all households in England regardless of tenure. Government policy has reflected this in the past through encouragement of the Right to Buy, and the current government has developed new intermediate housing products such as Home Buy to meet people’s aspiration for home ownership. Provision of intermediate housing could also go some way to meeting the needs of some households on local authority waiting lists. Around 10% of those who expressed an interest in intermediate housing with Swaythling are on waiting lists in one of the five authorities – the figure is highest in New Forest. It therefore makes sense in terms of an overall housing strategy to plan for a certain level of intermediate housing provision.
• Funds may be allocated for low cost home ownership through separate processes to those allocated for social rented housing – although the draft RHS prioritises funding for social rented accommodation there is an additional pot for intermediate housing. Policies that acknowledge the scope for intermediate housing keep open the possibility of drawing in additional resources for affordable housing that would not be otherwise available and also provides flexibility in negotiation with developers.
• Lastly, recognition needs to be given to the introduction by a number of house builders of new products targeted at first time buyers, at prices below those of typical entry level homes. Typically these are very small units that make efficient use of space by clever design. These products include both flats and houses, many of them developed as part of the design competition for a £60,000 home run by English Partnerships. The market demand for such products needs to be fully tested, but it is possible that such products may be more attractive than shared ownership or other intermediate housing products to first time buyers. However, such products, if offered for open market sale, would not meet the definition of affordable housing as set out in PPS3.
11.43 All of the above indicates that the provision of shared ownership and other intermediate housing products should form part of five authorities affordable housing policies. It is hard to say how significant an element it should play since the affordability of intermediate products varies with market conditions and interest rates; funding opportunities come and go; and there remains a generally poor understanding of intermediate housing products among consumers – which is not helped by the variety of initiatives and different products launched, each with different eligibility criteria and characteristics.
11.44 However, there appears to be significant interest building up in the five authorities and given evidence on house prices and incomes in the five authorities there is a significant potential market. Whilst this is a useful indication of the scale of the market, it would also be useful to inform the level of intermediate housing by the rate of take up of different types of products locally. DTZ suggest that intermediate housing makes up around 15% of new housing provision (or that is makes up the balance of affordable housing provision depending on the level of social rented accommodation secured). The proportion of intermediate housing might be higher on developments that deliver less social rented

Central Hampshire & New Forest Strategic Housing Market Assessment Final Report
November 2007
200
accommodation for reasons of site viability or local circumstances and could be informed by take up rates.
Size of Affordable Housing
11.45 The size of new affordable homes secured through new development needs to be based on an understanding of housing need and affordable housing strategy that goes beyond a simple assessment of the size requirements of households on local authority housing waiting and transfer lists. There are a number of pieces of evidence that need to inform affordable housing size requirements.
11.46 DTZ suggest that, as far as possible, the five authorities avoid enshrining a prescriptive size mix within local development documents. Rather, they set out a process or set of criteria, in a Local Development Document, for informing the appropriate mix on sites or at a particular point in time. This could be linked to aspirations in the Local Housing Strategy or regular monitoring included in Annual Monitoring Reports – both of which can be updated more regularly than LDF documents. The reasoning behind this is set out below.
• Housing lists suggest the main need is for small dwellings. But this reflects all those applying, not those who are likely to be housed. The apparent bias towards smaller dwellings also reflects allocation policies – the rationing of affordable housing resources means couples are only entitled to one bedroom and families are entitled to much less space than they would have available in the owner occupied sector (with young children often required to share bedrooms and significant numbers of families living in flats)8 9
• Consideration of those in need (rather than all applicants on the housing lists) suggests a significant proportion require larger properties, often because they are young families with children and/or are not considered suitable for flats because of the lack of a garden or play space for children – so there is a need to drill down to the profile of households who are likely to be housed in the future
• Smaller properties become available for re-let most frequently. In part this reflects the fact that the smallest properties are inflexible to changing household circumstances and so as single people form couples or have children there is a need to move. Larger properties are available less frequently, reflecting the fact that households have reached the ‘top of the ladder’ and are therefore less likely to move. Larger houses (rather than flats) are also more likely to have been sold through Right to Buy
• The pressure on different sized dwellings in the social rented stock judged by the ratio of applicant households to available properties varies and in some authorities e.g. Winchester there is significant pressure on larger (3 bed) dwellings. There is therefore a case for securing a mix of different sizes of affordable homes but also attaching a level of priority to the delivery of different sizes at different points in time e.g. need mainly 2 bedroom properties but have a short term priority for a number of 3 bedroom properties
• There is also a case for avoiding over delivery of 1 bedroom properties (even though the numbers on the housing list suggest there is a large need for these). These are the
8 As evidenced by the applicants on the waiting lists within the five authorities 9 It is also worth considering that if allocation policies entitled households to similar amounts of space as owner occupiers, the main requirement would be for 2 and 3 bedroom properties

Central Hampshire & New Forest Strategic Housing Market Assessment Final Report
November 2007
201
least flexible dwellings (reflected in the high turnover of smaller properties). In many cases the additional cost of an extra bedroom is marginal so, for example, delivering 2 bedroom rather than 1 bedroom flats need not necessarily impact on the numbers of affordable homes delivered. Evidence from Swaythling’s list of households interested in intermediate housing also shows clearly that, if given a choice, households would prefer more space. Furthermore, the private sector is building very few 1 bedroom dwellings for the market sector, apart from in the most pressurised areas in terms of affordability. Building in extra space in the social rented stock would have benefits in terms of limiting further polarisation developing between sectors.10 If this can be achieved at limited additional cost it could have additional benefits in terms of the flexibility of the stock and stability of communities
• Where possible, it would also make sense to secure the type and size of new affordable homes that best fit in to a wider lettings strategy. Some authorities have been able to create a chain of lettings and house a number of households through the targeted provision of certain types of dwellings e.g. by delivering one large home authorities may be able to house a number of smaller households or by providing attractive alternatives for older people authorities may be able to re-let a number of larger properties to families in priority need
11.47 A policy in the authorities LDFs might be based broadly on the criteria in Figure 11.4. This policy would not set out fixed quotas for different sizes of affordable homes but would set out a series of criteria which could be considered to inform the mix of affordable dwellings and this might change over time.
10 See DTZ’s research for the South East Regional Assembly and SEEDA (2007) on Housing Type and Size in the South East

Central Hampshire & New Forest Strategic Housing Market Assessment Final Report
November 2007
202
Figure 11.4: Criteria for Determining the Type and Size of Affordable Housing
Current Position Criteria Considerations Basingstoke & Deane East Hampshire Test Valley Winchester New Forest a) Size requirement of household in need (where possible)
Need to identify the requirements of households who fall into need criteria and unable to meet needs in market Note that allocation policies influence what is ‘needed’ by a particular household.
63% require 1 bedroom 18% require 2 bedrooms 16% require 3 bedrooms 3% require 4 bedrooms
55% require 1 bedroom 37% require 2 bedrooms 8% require 3 bedrooms 1% require 4 bedrooms Of those in highest priority of need (50+ points): 33% require 1 bedroom 52% require 2 bedrooms 16% require 3 bedrooms
58% require 1 bedroom 24% require 2 bedrooms 16% require 3 bedrooms 2% require 4 bedrooms
NB – figures are for all households on waiting list not just those with identified need 66% require 1 bedroom 21% require 2 bedrooms 13% require 3 bedrooms 1% require 4 bedrooms
55% require 1 bedroom 29% require 2 bedrooms 14% require 3 bedrooms 2% require 4 bedrooms
b) Proportion of re-lets by size (also worth considering the pattern of recent completions)
Identify proportion of different sized re-lets (ideally average over last 3 years)
37% 1 beds 35% 2 beds 20% 3 beds 8% 4 beds
42% 1 beds 34% 2 beds 19% 3 beds 5% 4 beds
41% 1 beds 29% 2 beds 21% 3 beds 9% 4 beds
52% 1 beds 35% 2 beds 12% 3 beds 1% 4 beds
50% 1 beds 30% 2 beds 16% 3 beds 4% 4 beds
c) Pressure on different size homes implied by comparison of (a) with (b) (See Section 8 for further commentary)
Indicates pressure within the stock but indicative because size requirement reflects allocation policies and entitlement in the context of an overall shortage
Greatest pressure on 1 beds followed by 3 beds then 2, then 4.
Greatest pressure on 1 beds, followed by 2, then 3 then 4 If those in highest priority are considered, greatest pressure is on 2 beds, then 3 beds, then 1 bed
Greatest pressure on 1 beds, equal pressure on 2 and 3 beds, then 4 beds
Greatest pressure on 1 beds, then 3 beds, then broadly equal pressure on 2 and 4 beds
Slightly higher pressure on 1 beds but relatively even (and high) pressure across 1, 2 and 3 beds

Central Hampshire & New Forest Strategic Housing Market Assessment Final Report
November 2007
203
Current Position Criteria Considerations Basingstoke & Deane East Hampshire Test Valley Winchester New Forest Wider lettings plan/ strategy
Whether provision of a certain type of dwelling, linked to a lettings strategy, could address need (though not necessarily implied by needs identified above)
A strategy towards housing older people (which could free up some larger properties)
A strategy towards housing older people (which could free up some larger properties) Significant losses to the stock from RTB – disproportionate impact on houses
A strategy towards housing older people (which could free up some larger properties)
A strategy towards housing older people (which could free up some larger properties) Losses to the stock from RTB – disproportionate impact on 2/3 bed houses
A strategy towards housing older people (which could free up some larger properties) Significant losses to the stock from RTB – disproportionate impact on 2/3 bed houses
Site specific considerations
Mix of market housing on same site, suitability of site for flats/ houses, viability considerations
Mix of intermediate dwellings
Aspirations of households on Swaythling’s intermediate housing list and take up of different size intermediate homes
1,050 households with current interest of which 61% - 2 bed property 26% - 3 bed property 11% - 1 bed property 2% - 4 bed property BME housing survey undertaken by the Borough Council also suggests there is interest in intermediate options amongst the BME community
610 households with current interest of which: 56% - 2 bed 31% - 3 beds 11% 1 bed 1% 4 beds
1,110 households with current interest, of which: 58% - 2 beds 27% - 3 beds 14% - 1 bed 1% - 4 beds
760 households with current interest, of which: 62% - 2 beds 19% - 3 beds 18% - 1 bed 1% - 4 beds
640 households with current interest, of which: 59% - 2 beds 27% - 3 beds 13% - 1 bed 1% - 4 beds

Central Hampshire & New Forest Strategic Housing Market Assessment Final Report
November 2007
204
11.48 Analysis in Section 8 indicates the need for a range of different sized homes given the size of dwellings required by households in need and the pattern of re-lets across authorities. There is significant pressure on 1 bedroom properties in all authorities but this must be viewed in the context of a shortage of affordable housing overall and allocation policies which limit households to accessing the minimum amount of space to which they are entitled. Therefore there are a large number of households who are only entitled to 1 bedroom and effectively competing for the same properties.
11.49 However, there is also pressure on larger (3 bed) homes in some authorities, including Winchester and Basingstoke. It is beyond the scope of this study but the authorities may wish to consider how targeted provision of certain sizes or types of affordable dwellings could help to create a chain of lettings and thus maximise the number of households re-housed through the provision of new affordable dwellings. In authorities where pressure on 1 bed properties is most significant (Basingstoke, East Hampshire, Test Valley) there may be a case for reviewing the allocations policy to consider whether it makes sense as part of a wider lettings strategy to allow some households to access 2 bed properties instead (though DTZ recognise that in the context of a shortage of affordable housing it may be difficult in practice to make the case for this).11
11.50 In summary, the size of affordable housing sought should be informed by a range of considerations and part of a strategy to make the best use of scarce affordable housing resources. There may also be alternative options available to increase the supply of larger properties if this is deemed desirable in some authorities or in particular areas.
11.51 If building larger affordable homes is to be done on any scale, within existing Housing Corporation resources, it is likely to mean that the total output of affordable housing will fall, assuming the same quotas and thresholds, since larger dwellings are more expensive to build than small dwellings, and therefore require a higher level of subsidy.
11.52 Alternative approaches to addressing the issues include:
• Action to reduce under-occupation by social housing tenants, particularly elderly households occupying dwellings larger than they are judged to need according to the bedroom standard, though the amount of space that households in need are entitled to is far from generous. Authorities could develop strategies to encourage those under-occupying their home to move to a new affordable home. The cost to the public purse of such approaches is likely to be less than building new large unit. Though experience suggests that authorities would need to offer a very attractive product – for example a new two bedroom flat in a good location and help with moving and associated expenses – if they are to be successful in persuading people to leave their home of many years
• Explore the scope for extending existing dwellings to help create dwellings for larger families. However, this is not helped by the fact that a large proportion of the social housing stock comprises flats, and hence cannot be extended. Even many houses do not lend themselves to extension. Moreover many larger dwellings – those suitable for conversion – are occupied by long standing tenants who under-occupy the dwelling. Thus the issue comes back to whether there are strategies to encourage existing tenants to move to a different dwelling, so that the authority can undertake the work to extend the dwelling and then re-let to a family who needs that size of dwelling
11 Basingstoke & Deane have a flexible lettings policy that allows single or couple households to access 2 bedroom properties in some circumstances, to allow for expansion.

Central Hampshire & New Forest Strategic Housing Market Assessment Final Report
November 2007
205
• In authorities with limited land suited to building of new houses, the only way to secure larger units of affordable housing may be to purchase existing houses. This may become a more cost effective way of providing new affordable housing when the housing market slips into the downswing
11.53 Notwithstanding the scope to encourage better utilisation of the existing stock of social housing to address the issue of both under-occupation and overcrowding there may well be perceived to be a need to increase the output of larger affordable homes within some authorities. A number of changes would need to be made to policy and practice in some authorities.
• There is a need for local housing authorities to clearly articulate the need for larger dwellings in their local housing strategies and to communicate this to Planning departments (evidenced by the size of dwellings required by those in priority need and the pattern of re-lets)
• This strategy would also need to be articulated to RSLs and to the Housing Corporation, so that all parties are clear about the size and type of affordable homes that the authority needs to meet its housing objectives
• There may be a need for flexibility in negotiating Section 106 agreements if authorities wish to secure larger houses rather than lots of flats. Larger homes will be more expensive for a developer to provide (depending on the scale of Housing Corporation grant), and an authority may therefore need to compromise on other aspects, including in some case the overall quota of social rented housing
11.54 However even with such flexibility within the planning policy, authorities may find it very difficult to secure provision of larger houses for social rent, if the types of sites coming forward for development are predominantly suited to flats. In these cases authorities may wish to negotiate commuted payments in lieu of on-site provision of affordable housing or off site provision where appropriate.
11.55 In order to change the output of the affordable housing sector over time e.g. to reduce the output of flats and increase the output of houses, this needs to be taken into account in the identification of land for new housing development. As discussed later in this section, authorities should consider identifying a mix of sites, some suited to development of flats, others better suited to provision of houses. For authorities operating in very constrained circumstances, greater use could be made of out of Borough development and cross-border allocation policies. The development of larger homes would also have implications for the amount of land required and densities of development.
Mix of Housing
11.56 One of the key policies in the new PPS3 is concerned with achieving a mix of housing to support mixed communities. However, local authorities have limited policy levers available to them in order to influence the delivery of mixed communities (assuming such a community could be defined).
11.57 Discussions with stakeholders during the SHMA process have revealed that the meaning of a mixed community is difficult to define. What most stakeholders can agree on is what a mixed community is not. It is not a neighbourhood that is dominated by one particular tenure or income group. DTZ take the view that it is clearly important to avoid creating concentrations of disadvantage. It is also desirable to avoid neighbourhoods where

Central Hampshire & New Forest Strategic Housing Market Assessment Final Report
November 2007
206
everyone is of the same income and socio-economic group, though in practice this is what many homeowners would prefer and is characteristic of many neighbourhoods. It is also important to recognise that neighbourhoods have different characteristics and that this is important to providing a variety of choice in the housing market. Such variety should be valued as part of creating diverse and liveable towns and villages and widening housing choice is also an explicit objective within PPS3.
11.58 Housing and planning policy can influence the mix of different income households. Planning levers can influence the mix of different income households on a site by seeking a certain proportion of affordable housing and, to some extent, by influencing the overall size and type of housing provided on site. Local authorities can also control the type of households that rent from a social landlord and live in new housing through their allocation policies and through the type of intermediate housing provided.
11.59 However, mixed incomes are only a proxy for a mixed community. This view is supported by recent research by English Partnerships, the Joseph Rowntree Foundation and Housing Corporation, which suggests that the real meaning of a mixed community is one where people of different incomes, ages, ethnicities etc interact with one another.12 This can only really be achieved if different people live side by side and are able to interact through shared facilities or services. There are clear benefits to this in terms of reducing the ‘area effect’ of disadvantage as well as encouraging mixing and integration for its own sake.
11.60 Delivering genuinely mixed communities (beyond mixed incomes) would require coordinated intervention using a wider set of policy levers beyond the type and size of dwellings provided. These include delivering a range of employment opportunities and delivering public services and community infrastructure that appeal to and meet the needs of a range of different households. DTZ would suggest that policy levers over these areas are weaker and likely to have less immediate impacts, so there is significant pressure to do as much as possible to influence outcomes through planning and housing policies.
11.61 However, the conclusions and recommendations in this section are limited to what can be done to plan for the requirements of future households in a way that attempts to reduce the tendency for concentrations of particular tenures and income groups to form, and addresses any major imbalances in the stock of dwellings across Central Hampshire and New Forest.
11.62 Section 9 draws together a range of evidence to consider the mix of households and dwellings within the housing markets and individual local authorities. The evidence demonstrates that:
• Growth in one person households is expected in all authorities but does not imply the need for the majority of market dwellings to be small units. The demand for market homes reflects a complex set of factors relating to household income and life stage rather than simply household size and evidence suggests new homes are often bought by those ‘trading up’ who often want more space
• There is a relatively wide choice of types and sizes of dwellings. However, there is relatively a high proportion of larger dwellings in all authority areas particularly the rural areas when compared to the South East as a whole
12 Joseph Rowntree Foundation, English Partnerships & Housing Corporation (2006) In the Mix: A Review of Mixed Income, Mixed Tenure and Mixed Communities

Central Hampshire & New Forest Strategic Housing Market Assessment Final Report
November 2007
207
• Recent completions in Basingstoke and Winchester authorities and in Andover have included a large proportion of flats and over a relatively long time period compared to the South East. These have been concentrated in the urban centres although flatted development has been delivered elsewhere as well (even the New Forest has seen increased numbers of flats)
• Consultation with developers and some local agents suggest that a significant proportion, if not the majority, of flats within town centres are rented out to private tenants. Although the development of the private rented sector is generally regarded as positive in providing flexibility and choice, this has implications for the turnover of residents within these new developments since turnover within the private rented sector can be higher than in other tenures
• Furthermore, continued provision of flats in these areas would have implications for the stock over time and may place pressures on adjacent areas, which have higher proportions of larger dwellings. Although the prices of flats in Winchester and Basingstoke appeared to dip in 2006 (see Section 7) so this trend may not continue indefinitely
• There are also relatively high levels of overcrowding in the social rented sectors within the authorities, particularly in Basingstoke and Deane
• There is evidence of pressure on all sizes of affordable dwellings in the authorities, including on the larger 3 bed dwellings in some areas, partly because of lower turnover of larger homes.
• Data on the type and size of completions by RSLs since 2001 demonstrate that the vast majority of new dwellings developed are flats and around 70-80% are two bedrooms or less. Thus the pattern of new completions is likely to limit what the authorities can do about the pressure on larger dwellings within the social rented stock
11.63 The information contained in this SHMA provides the authorities with the evidence to influence the nature of new development in a broad way. However, different approaches are likely to be required within and between different authority areas. Areas with very robust demand or where limited development is proposed are likely to be able to exert more leverage over the type and size of market development (assuming the appropriate mix could be determined). Determining the appropriate mix of homes in the future is a highly imprecise science. It is therefore only possible (and appropriate) for the authorities to address serious imbalances in the dwelling stock through influencing the provision of new development.
• In the rural areas of all of the authorities, particularly in the rural areas of East Hampshire, Winchester, Test Valley and the New Forest West and Central area it would be appropriate to encourage a proportion of smaller market dwellings as part of a mix to build in a wider choice of homes into the existing stock (which currently has a high proportion of large dwellings)
• Basingstoke and Deane are committed to delivering challenging levels of housing development over the next 10-20 years which implies the need to be more flexible over the mix of market housing, since the more constraints placed on developers the harder they are likely to find it to deliver. However, on large sites (which applies to the MDAs in the other authorities) a broad mix is likely to be appropriate in order to appeal to a range of segments in the market

Central Hampshire & New Forest Strategic Housing Market Assessment Final Report
November 2007
208
11.64 There are a numbers of ways that the authorities can influence the nature of new development, without needing to be too prescriptive about the mix of market housing:
• The authorities have relatively strong levers to influence the pattern of completions in the open market through the type and size of sites allocated for new development. One means of encouraging a greater range of different types and sizes of homes to be developed is to consider allocating a variety of different types and sizes of housing land (in a similar way to that required in employment land allocations). This would also help to ensure that, were the market to change, there is the opportunity to deliver a different type of development. There would be a strong case for authorities to work together to ensure that a range of different sites are available to facilitate the delivery of a range of different dwellings across the housing market area, and to provide the opportunity to deliver different types of dwellings at different times as market circumstances change. In all of the authorities, a sufficient supply of developable land and choice of sites would also ensure that the authorities have more leverage over the nature of development in the future. This may be more significant in Basingstoke, where the authority is committed to delivering significant levels of development and there are question marks around the robustness of the market over time. Having a number of sites available at any one time would ensure that the authority is not dependent on any one site or any one developer to deliver its targets
• The authorities also have relatively strong influence over the design and density of new development and issues around the appropriate nature of development in terms of local character. National policy has generally encouraged higher densities, which has meant that, where competition for land is intense, developers have bid up the price of land by assuming that they will be permitted to deliver at higher densities in order to recoup the cost of the land. This in turn has favoured the development of lots of small units at higher densities on sites. This implies that authorities should give relatively high priority to developing policies or principles on design, particularly on significant sites or areas expected to accommodate the majority of new development – this may also go some way to managing developers expectations about the densities that could be achieved. In the interim, CABE’s Building for Life guide provides a good basis on which to assess new developments and the expectations that the authorities have from developers
• However, it is important to keep in mind that local authorities cannot influence what happens to a development once it is built, in terms of future occupants and in terms of extensions and conversions that households make to their homes. These dynamics will change the type and size of the dwelling stock over time as well as the characteristics of the neighbourhood. In neighbourhoods where there is ongoing concern about the concentration of particular tenures, authorities might focus their efforts on ‘zones of change’. This would involve identifying areas where there are concentrations of particular tenures or types and sizes of properties, which are perceived to contribute to concentrations of disadvantage and to seek to alter the balance of the dwelling stock over time through new development. These areas are likely to be best tackled through coordinated regeneration activities, including through changes to the housing stock, supported by new development. Area Action Plans within new Local Development Frameworks provide a mechanism for progressing such activities
11.65 Section 10 provided information on the number of people who fall into specific groups within the housing market and may require either specialised accommodation or additional support in accessing housing.

Central Hampshire & New Forest Strategic Housing Market Assessment Final Report
November 2007
209
• The population in all of the authority areas is ageing and the growth in households in the future is expected to be driven to some extent by the ageing population and this is most extreme in the New Forest. The evidence suggests that older households require choice and quality options within the housing market, including options within mainstream housing (where most prefer to live) to take account of a variety of ages and circumstances
• The design of neighbourhoods will be important, particularly with regard to access, mobility, services and activities on offer. This issue is common to all authorities and would merit further investigation by the authorities, perhaps working jointly, in order to investigate different types of provision (market and affordable) and locations that will be attractive to older households in the future. The significant older population in the New Forest presents a challenge for the authority and is the result of in-migration as well as an ageing population. Whilst none of the authorities can control the type of in-migration they receive there would be some merit in working together to ensure that the housing stock and neighbourhoods do not work against certain types of in-migration (e.g. families and young people) and favour others (e.g. older people, the economically inactive) or vice versa
• Each of the authorities also has a significant number of disabled people within the population – some of whom require specific adaptations to their accommodation in order to live independently. The most efficient way to achieve this is likely to be through the provision of grants to individual households and their dwellings since changes to stock of housing through new development take a long time to come into effect
• Most other specific groups within the housing market (including BMEs, recent migrants and people on low incomes living in rural areas) appear to face issues in terms of their access to the market, particularly owner occupation rather than their need for specialised accommodation. The conclusions in relation to these groups are therefore related to affordability and the need for delivery of affordable housing. However, there are specific issues that need to be considered by the authorities. BME groups and recent migrants may not be aware of the choices available to them (reluctance to talk about their housing needs was an issue raised by a number of people in Basingstoke and Deane’s BME survey). There was also apparently high interest in intermediate tenures amongst BME respondents. Both of these points indicate the need to ensure that choices are communicated to specific groups
• For some BME households, most recent migrants and students as well as households needing more flexible accommodation, the private rented sector is an important tenure and it is also increasingly important in parts of Central Hampshire (Winchester and Basingstoke in particular). DTZ suggest that the authorities, particularly Winchester, Basingstoke and Test Valley (which are home to towns with significant private rented sectors) consider how their interventions could best support a quality private rented sector. There are a range of things to consider:
o The overlap and competition at the lower cost end of the private rented sector, often housing people on housing benefit, recent migrants and students (all authorities)

Central Hampshire & New Forest Strategic Housing Market Assessment Final Report
November 2007
210
o Interventions at the lower cost end of the private rented sector, including HMO licensing and working with landlords to ensure that dwellings meet certain standards (all authorities)
o Working with local universities (Winchester) to ascertain growth plans and the possible impact on the private rented sector and particular neighbourhoods
o The overlap between households in the private rented sector and those that might access intermediate housing options in all authority areas – in some areas, whether the growth of a higher quality and affordable private rented sector might be a better option than intermediate housing (all authorities)
o The high end private rented sector, housing highly mobile workers who may prefer renting (or are renting accommodation for short periods of time or during the working week but live elsewhere), including corporate lets (Winchester and Basingstoke in particular)
o Working with developers and investors/ landlords to understand how new developments will be occupied and the implications this might have for some neighbourhoods (all authorities)
Delivery
11.66 A fundamental requirement in achieving the level of affordable housing and a different mix of development is the delivery of new housing overall. Although the five authorities share some similar challenges in relation to their housing markets, the five authorities have very different development contexts. Figure 11.5 sets out the proposed housing numbers in the South East Plan and, following the Panel Report, the Inspector’s recommended housing numbers which would represent an increase for most of the authorities.
Figure 11.5: Proposed Housing Targets for Central Hampshire and New Forest Authorities
District Total 2006-2026
Annual Average (District)
Annual Average (Part
in Central Hampshire)
Annual Average (Part
in South Hampshire)
EIP Panel Recommendation
Basingstoke & Deane Borough
16,500 825* 825* - 895 (+9%)
East Hampshire District
5,200 260 200 60 385 (+48%)
New Forest District
4,140 210 180 80 210 (no change)
Test Valley Borough
8,910 440 240 200 480 (+7%)
Winchester District
10,440 520 180 340 610 (+17%
Total 45,190 2,260 1,450 680 2,580 (+14%) Source: Draft South East Plan (Regional Spatial Strategy) 2006-2026 *Growth Point Status proposed
delivery of 960 per annum to 2016; Draft South East Plan Panel Report August 2007

Central Hampshire & New Forest Strategic Housing Market Assessment Final Report
November 2007
211
11.67 Basingstoke is a key focus of future housing growth with a target of 825 completions per year between 2006 and 2026 in the Draft South East Plan but with Growth Point status the plan is to deliver around 960 per annum to 2016. The Borough was identified as one of 29 Growth Points in October 2006 and has received £340k initial funding to support studies and into infrastructure needs, associated with delivering 9,650 homes to 2016. This means effectively re-phasing its proposed development so that around 960 homes are delivered each year over the next 10 years, rather than 825 as proposed in the draft RSS, although the overall level of housing to 2026 has not been changed.
11.68 The South Hampshire (PUSH) area has also been awarded Growth Point Status and has been allocated an initial £3.6million to support work to ensure that the planned level of housing provision across the sub-region (around 80,000 new homes by 2026) can be delivered sustainably. The southern parts of Winchester, East Hampshire and Test Valley Districts are included in the PUSH sub-region, along with the Totton and Waterside area of New Forest District. For each of these authorities, with the exception of Winchester, the majority of housing will be provided in the rest of the District rather than the part in the PUSH sub-region. For Winchester, the development of West of Waterlooville in the far south east corner of the District will contribute a significant proportion of future housing development but is unlikely to address housing demand and needs in the part of the authority area in Central Hampshire, including Winchester City.
11.69 The level of housing growth proposed in Basingstoke is already high and the general consensus amongst stakeholders is that the level of development achieved will be dependent on the market to some extent. If targets are increased further this situation would not necessarily change. There is a case under the current targets (which would become stronger in the event of these being increased) to consider the arrangements in place for delivery and specifically whether enough resources are in place to deal with new applications, including negotiations of affordable housing contributions.
11.70 New housing development within Basingstoke will also need to appeal to a range of segments of the market in order to maximise delivery – particularly on larger sites. Basingstoke may also wish to consider its relationship with Reading, given the links between the town and Borough with the West Central Berkshire market, particularly given that Reading has also been awarded growth point status. Both areas will be striving to deliver challenging housing numbers and to some extent may be competing in terms of development opportunities given the proximity of the urban areas and the evidence of household migration and travel to work between the two. In contrast to Reading which has a fairly tightly defined Borough boundary around the town, Basingstoke may have more diverse development opportunities which would allow it to deliver different products e.g. larger houses as well as flats that may be attractive to potential in-migrants who might consider both locations.
11.71 In the other authorities, the housing targets proposed are broadly similar to previous Structure Plan targets, although the Panel Report proposes a significant proportional increase in East Hampshire (specifically 125 dwelling per annum for Bordon) and also in Winchester and Test Valley. Given the robust demand identified in earlier sections of this report these numbers are unlikely to present a challenge in terms of delivery providing there are sufficient sites identified. Although there are likely to be increasing delivery challenges over time, with the designation of New Forest National Park and the proposed South Downs National Park.

Central Hampshire & New Forest Strategic Housing Market Assessment Final Report
November 2007
212
11.72 In all authorities there is a need to consider the location of available sites and the housing markets that new developments might serve, given the relationship with the South Hampshire housing markets as well as the Central Hampshire market area or the market associated with more self contained settlements. For example, development in the South East corner of Winchester District at West Waterlooville is unlikely to serve the demands and needs of the market associated with Winchester City and the Central Hampshire market area. Similarly, development in Totton and Waterside in New Forest District is unlikely to meet the needs and demands of households in Ringwood or Lymington in the west and central area of New Forest District. There is a need therefore to consider the location of development opportunities in relation to the housing markets in operation across the authorities.
11.73 In all of the authorities land supply is important to delivery although the scale of land supply will vary. DTZ suggest that the five authorities aim to allocate, or identify as far as possible, a sufficient supply of land for the plan period, in line with PPS3. This would deliver a number of benefits:
• It would provide the authorities with greater leverage over the timing and nature of development by ensuring that they are not dependent on one site or any one developer to deliver their housing targets or mix of housing and target levels of affordable housing
• It would provide flexibility for the market to switch to building something else if demand changes by bringing forward development in a different location on a different type of site – it is highly likely that the market will change during the plan period (if it has not done so already)
• It would provide scope to ensure that the sites allocated are capable of delivering affordable housing i.e. there are enough sites of sufficient size and less reliance on negotiations on very small sites to deliver affordable housing (given the difficulties associated with this as discussed earlier in the section)
11.74 Adherence to the new policies on land supply within PPS3 would achieve the benefits above, providing the sites allocated or identified are available and viable for development. A sufficient pipeline of land would allow authorities to bring forward land identified for a later date if required to meet their targets in the event of encountering difficulties with another site.