Embed Size (px)
Citation preview

Lidwala Consulting Engineers (SA) (Pty) Ltd
Majuba Continuous Ashing EIA: Draft Scoping Report November 2012 Chapter 6: Description of Baseline Environment EIA Ref Number: 14/12/16/3/3/3/53 NEAS Reference: DEA/EIA/0001417/2012
6-31
Ibis
Blue Crane VU - - - - 25
Secretarybird NT 50 - - incidental -
Blue Korhaan NT 50 50 100 - 75
White Stork Bonn - - 33.3 - 25 CR = Critically Endangered; EN = Endangered; V = Vulnerable; NT = Near-threatened; Bonn = Protected
Internationally under the Bonn Convention on Migratory Species.
Further detail can be obtained from the Avifauna Specialist Report in Appendix J.
6.3.9 Surface Water
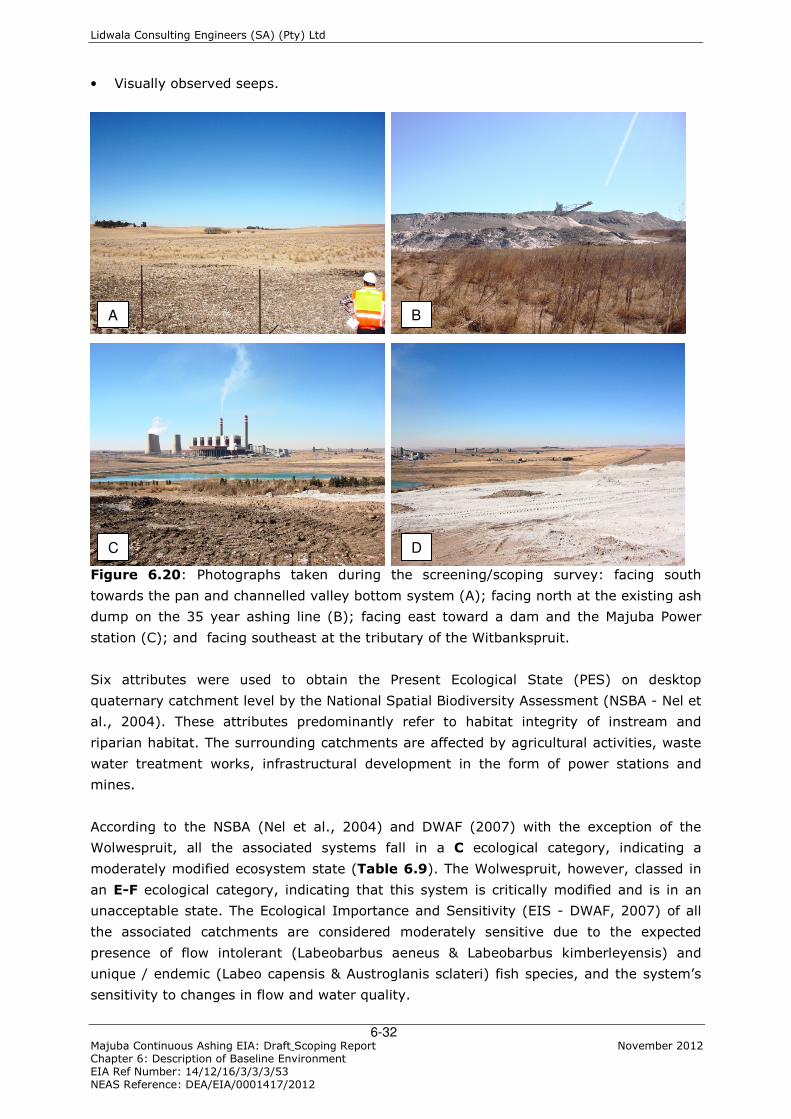
The study area encompasses a 12 km radius around the current infrastructure, and falls
over five quaternary catchments in the Upper Vaal Water Management Area (WMA) with
the Majuba Power Station located in C11J (Figure 6.21). The study area in relation to the
National Freshwater Ecosystem Priority Areas (NFEPA) and the Mpumalanga Biodiversity
Conservation Plan are provided in Figure 6.22 and Figure 6.23. Portions of the study
area are located in a Freshwater Ecosystem Priority Area (FEPA) and these systems were
identified as being in a good condition (NFEPA – Nel et al., 2011) and therefore need to be
maintained in order to contribute to the biodiversity of the area (Figure 6.22). The
remainder of the study area is located in an Upstream Management Area. Anthropogenic
activities taking place in these areas need to be monitored in order to prevent the
degradation of FEPAs and Fish Support Areas located downstream (Figure 6.22).
According to the MBCP (Ferrrar & Lötter, 2007) the study area is located in an “Ecosystem
Maintenance” sub-catchment (Figure 6.23).
The characterisation of the rivers located within the study area (12 km radius) showed
that with the exception of the Skulpspruit (order two river) all of the remaining associated
systems are order one rivers/streams (Figure 6.12). The Witbankspruit (running along
the eastern boundary of the Majuba Power Station), Skulpspruit and the Markgraafspruit
are all perennial with the remainder of the systems being classed as non-perennial
(Figure 6.21; Table 6.9). Numerous smaller streams are shown in the 1:50 000 river
coverage (Figure 6.21). Non perennial rivers located in drier climates hold different
characteristics to those located in wetter climates and function differently to their
perennial counterparts (Rossouw et al., 2005). They therefore require focused attention
with regards to ecosystem management.
The tributary of the Witbankspruit as indicated in Figure 6.21 will be affected by the
proposed continuation of ashing. The aquatic ecosystems in the immediate vicinity
include:
• A pan to the south of the existing ashing activity (Figure 6.20 A);
• The tributary of the Witbankspruit which is a valley bottom system to the east of the
current ash disposal facility footprint (running south to north) (Figure 6.20 C and D);
• A tributary of the Witbankspruit to the west of the existing ash dump;
• Various zero order tributaries of the aforementioned system; and
Lidwala Consulting Engineers (SA) (Pty) Ltd
Majuba Continuous Ashing EIA: Draft Scoping Report November 2012 Chapter 6: Description of Baseline Environment EIA Ref Number: 14/12/16/3/3/3/53 NEAS Reference: DEA/EIA/0001417/2012
6-32
• Visually observed seeps.
Figure 6.20: Photographs taken during the screening/scoping survey: facing south
towards the pan and channelled valley bottom system (A); facing north at the existing ash
dump on the 35 year ashing line (B); facing east toward a dam and the Majuba Power
station (C); and facing southeast at the tributary of the Witbankspruit.
Six attributes were used to obtain the Present Ecological State (PES) on desktop
quaternary catchment level by the National Spatial Biodiversity Assessment (NSBA - Nel et
al., 2004). These attributes predominantly refer to habitat integrity of instream and
riparian habitat. The surrounding catchments are affected by agricultural activities, waste
water treatment works, infrastructural development in the form of power stations and
mines.
According to the NSBA (Nel et al., 2004) and DWAF (2007) with the exception of the
Wolwespruit, all the associated systems fall in a C ecological category, indicating a
moderately modified ecosystem state (Table 6.9). The Wolwespruit, however, classed in
an E-F ecological category, indicating that this system is critically modified and is in an
unacceptable state. The Ecological Importance and Sensitivity (EIS - DWAF, 2007) of all
the associated catchments are considered moderately sensitive due to the expected
presence of flow intolerant (Labeobarbus aeneus & Labeobarbus kimberleyensis) and
unique / endemic (Labeo capensis & Austroglanis sclateri) fish species, and the system’s
sensitivity to changes in flow and water quality.
A B
C D
Lidwala Consulting Engineers (SA) (Pty) Ltd
Majuba Continuous Ashing EIA: Draft Scoping Report November 2012 Chapter 6: Description of Baseline Environment EIA Ref Number: 14/12/16/3/3/3/53 NEAS Reference: DEA/EIA/0001417/2012
6-33
The systems in the immediate area have "Highveld 3" river signatures, which Nel et al.
(2004) assigns a status of critically endangered (Table 6.9). The ascribed river status
indicates a limited amount of intact river systems carrying the same heterogeneity
signatures nationally. This implies a severe loss in aquatic ecological functioning and
aquatic diversity in similar river signatures on a national scale (Nel et al., 2004).
Figure 6.21: Map indicating the 12 km radius study area and DWA monitoring points
associated with the proposed continuation of Majuba ashing activitieses (Nel et al., 2004;
Chief Directorate – Surveys and Mapping, 2629 and 2729; SANBI, 2010).

Lidwala Consulting Engineers (SA) (Pty) Ltd
Majuba Continuous Ashing EIA: Draft Scoping Report November 2012 Chapter 6: Description of Baseline Environment EIA Ref Number: 14/12/16/3/3/3/53 NEAS Reference: DEA/EIA/0001417/2012
6-34
Figure 6.22: Map indicating the study area in relation to the NFEPAs (Nel et al., 2004;
SANBI, 2010; Nel et al., 2011).
Figure 6.23: Map indicating the study area in relation to the MBCP (Nel et al., 2004;
Ferrrar & Lötter, 2007).

Lidwala Consulting Engineers (SA) (Pty) Ltd
Majuba Continuous Ashing EIA: Draft Scoping Report November 2012 Chapter 6: Description of Baseline Environment EIA Ref Number: 14/12/16/3/3/3/53 NEAS Reference: DEA/EIA/0001417/2012
6-35
Table 6.9: Characterisation of the system associated with the study area.
River name Perde-
water
Tributary
of
Perdewater
Skulp-
spruit
Tributary
of
Skultspruit
Witbank-
spruit
Wolve-
spruit
Markgraaf-
spruit
River Order 1 1 2 1 1 1 1
Hydrological
Class -
Non-
perennial Perennial
Non-
perennial Perennial
Non-
perennial Perennial
River
Signature Highveld3
Conservation
status Critically Endangered
PES (Nel et
al., 2004) C C C C C E-F C
Aquatic
Ecoregion Highveld
Water
Management
Area
Upper Vaal
Quaternary
catchment C11E C11E C11E C11E C11J C11L C13B
PES (DWAF,
2007) C C C C C E-F* C
EIS (DWAF,
2007) Moderate
PES: Present Ecological State; EIS: Ecological Importance and Sensitivity; DWAF, 2000
• Catchment Drivers of Ecological Change
The study area falls within the Upper Vaal Water Management Area (WMA) which includes
the Vaal, Klip, Wilge, Liebenbergsvlei and Mooi Rivers. It covers a catchment area of
55 565 km2 and includes the Vaal Dam, Grootdraai Dam and Sterkfontein Dam (DWAF,
2004). The Upper Vaal WMA is the most populous WMA in South Africa, with more than
80 % of the population residing in the area downstream of the Vaal Dam, and
approximately 97 % living in an urban environment. Land use in the WMA is dominated by
cultivated dry land agriculture with the main crops being maize and wheat. About 75 % of
the irrigation is upstream of major storage dams and is supplied from rivers or farm dams
DWAF, 2004).
The majority of the water requirements of the WMA are for the urban, industrial and
mining sectors (77 %), with 11 % for irrigation, 8 % for power generation and the
remaining 4 % for rural water supplies. The Upper Vaal WMA is subdivided into three sub-
areas, with the study area located in the “upstream of the Vaal Dam” sub-area.
Geographically, over 73 % of the total requirements for water are in the sub-area
“downstream of the Vaal Dam” and nearly 20 % in the sub-area upstream of the Vaal
Dam. Most of the irrigation in the WMA is in the sub-area downstream of the Vaal Dam
(DWAF, 2004). The available water and total requirements for the year 2000, including
transfers between WMAs is shown in Table 6.10.