Embed Size (px)
Citation preview

86
6.1 PREFORMULATION STUDIES
Characterization of drug
A) Appearance
LFX was found to be pale yellow crystalline, odourless powder; OFX as white to
pale yellow powder and NFX as pale yellow crystalline, odourless powder as reported
in literature.
B) Solubility
LFX was found to be freely soluble in water and in ethyl alcohol. It was also
soluble in 2-propanol and acetone; OFX was found to be freely soluble in acetic acid,
slightly soluble in water, methanol, ethanol and acetone; NFX was found to be
slightly soluble in water and alcohol.
C) Thermal analysis
i) Melting point
Melting point of LFX, OFX and NFX was found to be in the range of 214-215oC,
252-254ºC and 220-221oC respectively as reported in the literature, thus indicating
purity of the drug samples.
ii) Differential scanning calorimetry (DSC)
The DSC thermogram of LFX, OFX and NFX showed a sharp endothermic peak
at 214.5°C, 251.5°C and 220.5°C respectively corresponding to their melting points,
as shown in Fig. 6.1, 6.2 and 6.3 respectively.

87
Fig. 6.1 DSC of LFX sample
Fig. 6.2 DSC of OFXsample

88
Fig. 6.3 DSC of NFX sample
D) Spectral analysis
i) Infrared spectroscopy
The IR spectrum of the pure LFX, OFX and NFX sample recorded by FTIR
spectrometer is shown in Fig.6.4 to 6.6 which were compared with standard
functional group frequencies of LFX, OFX and NFX as shown in Table 6.1 to 6.3.

89
Fig. 6.4 IR spectra of LFX sample
Table 6.1 IR spectral data of LFX
Sr.No. Group assignment Wave number (cm-1
)
1 COOH (O-H stretching) 3271
2 -CH3
2935
3 C=O (C=O stretching) 1724
4 H3C-N (C-N stretching) 1292
5 F (C-F stretching) 1089
6 Benzene ring 1495
40060080010001200140016001800200024002800320036004000
1/cm
0
15
30
45
60
75
90
%T
30
66
.61
30
47
.32
29
62
.46
26
23
.01
23
64
.57
17
24
.24
17
04
.96
16
20
.09
15
66
.09
15
27
.52
14
85
.09
14
50
.37
14
19
.51
14
00
.22
13
61
.65
13
11
.50
12
53
.64
11
95
.78
11
68
.78
11
34
.07
11
18
.64
10
87
.78
10
60
.78
97
2.0
6
93
3.4
8
87
5.6
2
80
6.1
9
75
6.0
4
70
9.7
6
48
6.0
3
40
5.0
2
D2

90
Fig. 6.5 IR spectra of OFX sample
Table 6.2 IR spectral data of OFX
Sr.No. Group assignment Wave number (cm-1
)
1 N-H stretch 3124
2 C=O Stretch 1716
3 CH Plane deformation 1245
4 CH out of deformation 813
5 C –F stretch 1028
6 Benzene ring 1495

91
Fig. 6.6 IR spectra of NFX sample
Table 6.3 IR spectral data of NFX
Sr.
No.
Group assignment Wave number (cm-1
)
1 C=O stretch of carboxylic group 1624.73
2 C-N stretch of tertiary group 1269.9
3 C-H stretch of aliphatic group 2369.12
4 N-H stretch of secondary group 2932.23
5 C out of plane 786.90
6 C-F stretching 1091.63
7 C=C stretching 1452.72
40060080010001200140016001800200024002800320036004000
1/cm
-15
0
15
30
45
60
75
90
%T
34
38
.84
34
21
.48
33
61
.69
29
68
.24
29
20
.03
28
87
.24
28
44
.81
28
39
.02 2
77
3.4
5
26
78
.94
25
51
.65
23
58
.78
18
41
.89
17
93
.68
17
30
.03
16
18
.17
15
85
.38
15
54
.52
15
37
.16
15
00
.52
14
88
.94
14
54
.23
13
86
.72
13
44
.29
12
72
.93
12
40
.14
11
82
.28
11
30
.21
10
91
.63
10
31
.85
96
2.4
1
93
1.5
5
90
2.6
2
82
3.5
5
78
4.9
77
69
.54
73
8.6
9
70
0.1
1
66
1.5
4
62
2.9
65
92
.11
56
7.0
35
47
.75
52
0.7
4
44
9.3
84
20
.45
S 13

92
ii) UV Spectroscopy
The solutions of LFX, OFX and NFX sample were scanned from 200-400 nm, a
wavelength maxima was found to be 288 nm, 293nm and 271nm resp. in simulated
tear fluid (Fig. 6.7 to 6.9)
Fig. 6.7 Spectra of LFX in simulated tear fluid
Fig. 6.8 Spectra of OFX in simulated tear fluid

93
Fig. 6.9 Spectra of NFX in simulated tear fluid
Compatibility studies
Preformulation studies were carried out to study the compatibility of pure drug
LFX, OFX and NFX with the polymers like PXM, sodium alginate, gellan gum, CP
974P, chitosan and HPMC K4M/HEC etc. prior to the preparation of ophthalmic IS
hydrogel. The individual IR spectra of the polymers (Fig. 6.10 to 6.17), as well as the
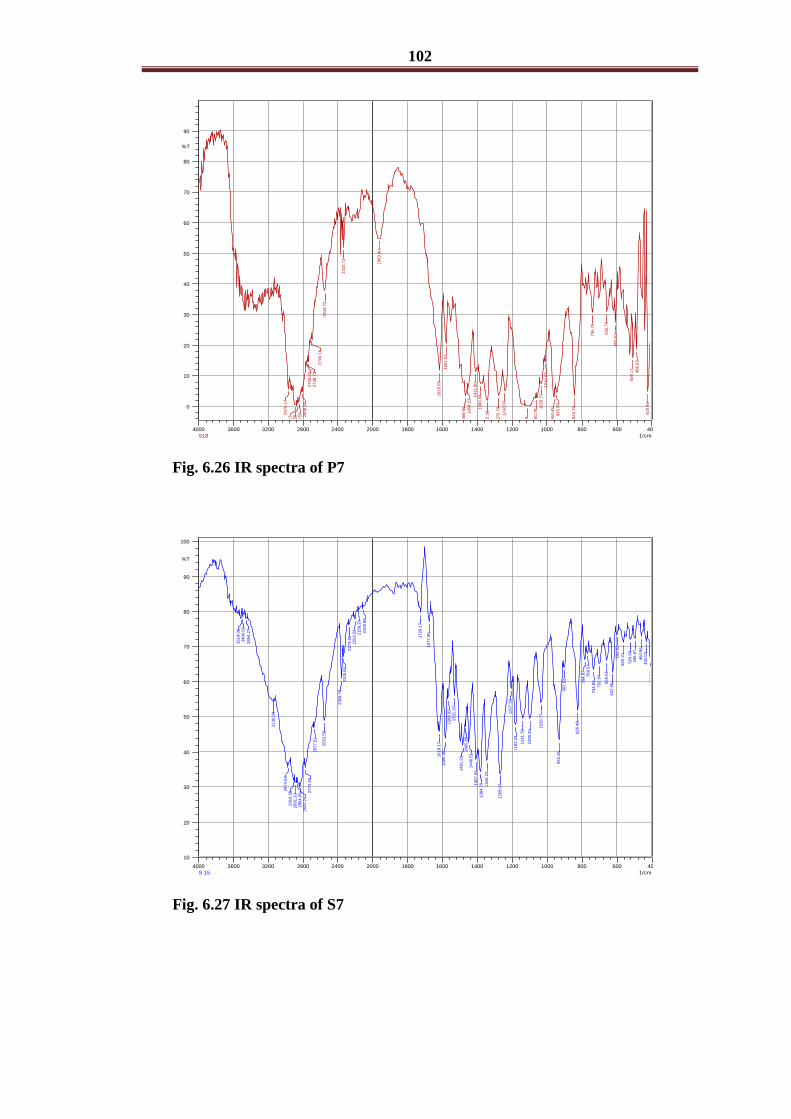
combination spectra of drug and polymer are shown (Fig. 6.18 to 6.29). The results
indicate no interaction between drug and polymers when compared with infrared
spectrum of pure drug (Fig.6.4 to 6.6). It is confirmed by absence of additional peaks
and all principal absorption peaks are retained in the combination spectra. Hence all
excipients were found to be compatible with the drug. DSC of physical mixtures of
optimized thermosensitive formulations of each drug showed a characteristic
endothermic peak of drug (Fig. 6.30 to 6.32).

94
Fig. 6.10 IR spectra PXM 188
Fig. 6.11 IR spectra of PXM 407
40060080010001200140016001800200024002800320036004000
1/cm
0
15
30
45
60
75
90
%T
35
62
.28
35
41
.06
35
21
.78
34
96
.70
34
81
.27
34
42
.70
34
21
.48
33
98
.34
29
20
.03
28
73
.74
23
58
.78
17
33
.89
17
14
.60
16
97
.24
16
47
.10
16
29
.74
16
22
.02
15
56
.45
15
39
.09
14
56
.16
14
15
.65
13
92
.51
13
73
.22
13
52
.01
12
98
.00
12
51
.72
10
95
.49
10
22
.20
94
8.9
1
84
6.6
9
66
9.2
5 65
1.8
9
57
8.6
0
54
9.6
7
46
8.6
74
53
.24
42
2.3
8
S 7

95
Fig. 6.12 IR spectra of chitosan
Fig. 6.13 IR spectra of HPMC K4M
40060080010001200140016001800200024002800320036004000
1/cm
0
15
30
45
60
75
90
%T
35
00
.56
34
77
.42
34
42
.70
34
19
.56
23
58
.78
17
12
.67
16
97
.24
16
66
.38
16
49
.02 1
63
3.5
91
62
0.0
9 15
56
.45
15
39
.09 1
51
9.8
0
14
69
.66
14
56
.16
14
17
.58
13
92
.51 1
33
8.5
1
13
17
.29
10
22
.20
94
5.0
5
90
0.7
0
71
9.4
0
66
9.2
56
53
.82 62
1.0
45
95
.96
58
8.2
5 55
5.4
6
43
9.7
4
42
0.4
5
S 11
40060080010001200140016001800200024002800320036004000
1/cm
0
15
30
45
60
75
90
%T
35
62
.28
35
39
.13
35
21
.78
35
00
.56
34
79
.34
34
40
.77
34
21
.48
29
21
.96
23
58
.78
16
64
.45
16
47
.10 16
33
.59
16
20
.09
15
39
.09
14
56
.16 1
41
7.5
81
39
2.5
1
13
73
.22
13
38
.51
13
15
.36
10
22
.20
94
6.9
8
85
2.4
8
66
9.2
56
49
.97
61
9.1
15
97
.89
56
8.9
65
49
.67
45
1.3
14
41
.67
42
2.3
8
S 9

96
Fig. 6.14 IR spectra of gellan gum
Fig. 6.15 IR spectra of CP 974P
40060080010001200140016001800200024002800320036004000
1/cm
60
65
70
75
80
85
90
95
100
%T
36
68
.36
36
02
.78 2
76
9.5
9
27
19
.44
25
22
.72
24
80
.29
24
34
.00
23
99
.28
23
52
.99
23
06
.71
22
52
.70
21
98
.70
21
40
.84
20
44
.40
19
86
.54
18
86
.25
18
66
.97
16
77
.95
16
16
.24
14
85
.09
14
54
.23
13
92
.51
13
57
.79
12
99
.93
10
87
.78
10
56
.92
10
29
.92
95
6.6
3
93
7.3
4
84
0.9
1
78
6.9
0
72
5.1
8
70
2.0
4
64
8.0
4
60
5.6
1
S17

97
Fig. 6.16 IR spectra of HEC
Fig. 6.17 IR spectra of sodium alginate
40060080010001200140016001800200024002800320036004000
1/cm
-10
0
10
20
30
40
50
60
70
80
90
%T
29
27
.74
28
79
.52
23
58
.78
23
39
.49
17
16
.53
16
45
.17
16
29
.74
14
65
.80
14
52
.30
14
29
.15
13
80
.94
13
61
.65
13
40
.43
13
15
.36
10
20
.27
93
9.2
7
89
2.9
8
83
3.1
9
66
7.3
26
51
.89
61
7.1
85
94
.03
57
4.7
5
46
6.7
44
45
.53
42
6.2
44
03
.09
DS 9
40060080010001200140016001800200024002800320036004000
1/cm
-10
0
10
20
30
40
50
60
70
80
90
%T
37
39
.72
35
81
.56
35
60
.35
35
42
.99
35
19
.85
34
98
.63
34
75
.49
34
42
.70
34
25
.34
33
98
.34
23
58
.78
23
35
.64
18
65
.04
18
26
.46
17
93
.68
17
93
.68
17
66
.67
17
39
.67
16
43
.24
16
29
.74
16
20
.09
15
71
.88
15
58
.38
15
39
.09 1
51
4.0
21
49
0.8
71
45
4.2
31
41
7.5
8
13
94
.44 1
36
7.4
41
33
8.5
11
31
5.3
6
10
22
.20
94
6.9
8
90
4.5
5
67
1.1
86
49
.97
61
9.1
15
95
.96
58
4.3
95
76
.68
54
9.6
7
47
0.6
04
49
.38
42
4.3
1
S 10
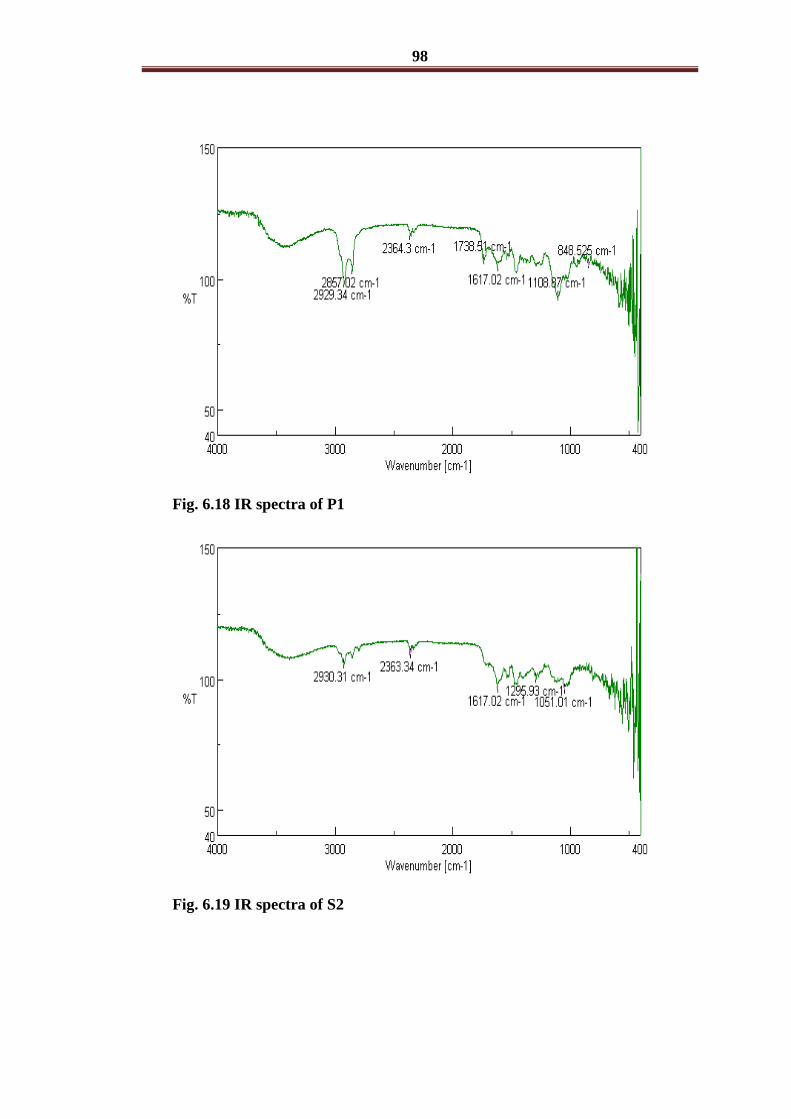
98
Fig. 6.18 IR spectra of P1
Fig. 6.19 IR spectra of S2

99
Fig. 6.20 IR spectra of G3
Fig. 6.21 IR spectra of C3

100
Fig. 6.22 IR spectra of P4
Fig. 6.23 IR spectra of S4

101
Fig. 6.24 IR spectra of G5
Fig. 6.25 IR spectra of C4
102
Fig. 6.26 IR spectra of P7
Fig. 6.27 IR spectra of S7
40060080010001200140016001800200024002800320036004000
1/cm
0
10
20
30
40
50
60
70
80
90
%T
29
70
.17
28
89
.17
28
69
.88
28
50
.59
28
08
.16
27
58
.02
27
38
.73
27
00
.16
25
49
.72
23
33
.71
19
63
.40
16
20
.09
15
81
.52
14
69
.66
14
54
.23
14
11
.80
13
80
.94
13
42
.36
12
76
.79
12
42
.07
11
14
.78
10
60
.78 1
03
3.7
71
01
0.6
3
96
0.4
8
94
5.0
5
84
4.7
6
73
6.7
6
65
5.7
5
60
5.6
1
50
9.1
7
48
6.0
3
42
0.4
5
S18
40060080010001200140016001800200024002800320036004000
1/cm
10
20
30
40
50
60
70
80
90
100
%T
35
14
.06
34
90
.92
34
54
.27
31
36
.04
29
74
.03
29
10
.38
28
91
.10
28
64
.09
28
33
.24
27
73
.45
26
77
.01
25
53
.58
23
58
.78
23
35
.64
22
73
.92
22
02
.56
21
58
.20
21
09
.98
17
26
.17
16
77
.95
16
18
.17
15
85
.38
15
68
.02
15
31
.37
14
81
.23
14
65
.80
14
46
.51
14
07
.94
13
84
.79 13
46
.22
12
69
.07
12
07
.36
11
82
.28
11
41
.78
10
99
.35
10
33
.77
93
3.4
8
90
2.6
2
82
5.4
8
78
4.9
77
69
.54
73
4.8
3
70
2.0
4
65
9.6
1
62
2.9
6
59
9.8
2
56
5.1
0
52
4.6
04
95
.67
46
0.9
64
32
.03
40
8.8
8
S 15

103
Fig. 6.28 IR spectra of G7
Fig. 6.29 IR spectra of C7

104
Fig. 6.30 DSC of P1
Fig. 6.31 DSC of P4
Temp Cel350.0300.0250.0200.0150.0100.050.0
DS
C m
W30.00
20.00
10.00
0.00
-10.00
-20.00
-30.00
DD
SC
mW
/min
52.8Cel
184.8Cel
217.5Cel
Temp Cel250.0200.0150.0100.050.0
DS
C m
W
4.00
2.00
0.00
-2.00
-4.00
-6.00
-8.00
-10.00
DD
SC
mW
/min
50.6Cel
129.4Cel

105
Fig. 6.32 DSC of P7
6.2 SELECTION OF VEHICLE
The solubility of FQ viz. LFX, OFX and NFX were tested in various buffers at
the dosage level desired 0.5, 0.3, 0.3%w/v respectively. It was found to be in the order
as given below:
Solubility of LFX ranked as acetate > distilled water > citrophosphate >
phosphate. Solubility of OFX ranked as acetate > STF > citrophosphate > distilled
water > phosphate buffer and solubility of NFX ranked as acetate > STF >
citrophosphate > phosphate buffer > distilled water.
Temp Cel250.0200.0150.0100.050.0
DS
C m
W
20.00
10.00
0.00
-10.00
-20.00
-30.00
DD
SC
mW
/min
55.9Cel
155.3Cel
221.6Cel

106
6.3 STANDARD CALIBRATION CURVE
Table 6.4 shows the absorbance of LFX, OFX and NFX standard solutions in
simulated tear fluid. Fig. 6.33, 6.34 and 6.35 shows a representative standard
calibration curve with slope, regression coefficient and intercept. The curve was
found to be linear at λmax of 288 nm, 293nm and 271nm resp. in simulated tear fluid.
The calculation of the drug content, in vitro drug release and stability studies are
based on this calibration curve.
Table: 6.4 Preparation of calibration curve data of in STF
LFX OFX NFX
Concentratio
n (µg/ml)
Absorbanc
e
Concentratio
n (µg/ml)
Absorbanc
e
Concentratio
n (µg/ml)
Absorbanc
e
0 0 0 0 0 0
2 0.150 2 0.222 2 0.232
4 0.299 4 0.362 4 0.425
6 0.419 6 0.531 6 0.641
8 0.544 8 0.694 8 0.867
10 0.709 10 0.857 10 1.027
12 0.828 12 1.013
14 1.028

107
Fig. 6.33 Std. calibration curve of LFX at 288nm
Fig. 6.34 Std. calibration curve of OFX at 293nm
y = 0.071x+0.045
R² = 0.9989
0
0.2
0.4
0.6
0.8
1
1.2
0 2 4 6 8 10 12 14 16
Ab
sorb
an
ce
Conc.(μg/ml)
y = 0.086x
R² = 0.997
0
0.2
0.4
0.6
0.8
1
1.2
0 2 4 6 8 10 12
Ab
sorb
an
ce
Conc.(μg/ml)

108
Fig. 6.35 Std. calibration curve of NFX at 271nm
y = 0.105x
R² = 0.997
0
0.2
0.4
0.6
0.8
1
1.2
0 2 4 6 8 10 12
Ab
sorb
an
ce
Conc.(μg/ml)

109
6.4 PHYSICOCHEMICAL CHARACTERIZATION
6.4.1 Placebo Formulations
6.4.1.1 Phase transition based on temperature
Table 6.5 Formulations of PXM 407 and PXM 188 combinations
Sr.
No.
PXM
407
PXM
188
Chitosan
HPMC
K4M
Gelling
capacity
Gelation
temp.
Clarit
y
(%w/v) (oC)
1 15 4 - - + 55.0±0.58 +++
2 16 4 - - + 48.3±0.40 +++
3 17 4 - - ++ 42.0±0.50 +++
4 18 4 - - ++ 38.24±0.36 +++
5 18 4 - 0.2 +++ 34.0±0.25 +++
6 18 4 - 0.4 +++ 33.50±0.58 +++
7 18 4 0.25 0.2 +++ 33.0±0.5 +++
8 18 4 0.5 0.2 +++ 33.1±0.62 +++
Mean ± SD, n = 3
Note: 1) (+) Phase transition within 60 sec, collapse of gel structure within 1-2
hr, (++); Phase transition within 60 sec, collapse of gel structure within 3-4 hr, (+++)
Phase transition within 60 sec and gel structure stable for more than 6 hr.
2) (-) turbid, (+) slightly turbid, (++) clear solution, (+++) clear and transparent.

110
6.4.1.2 Phase transition based on ion
6.4.1.2.1 Sodium alginate and HPMC K4M or HEC
Table 6.6 Sodium alginate and HPMC K4M or HEC
Sr. No. Sodium alginate
HPMC K4M
HEC
Gelling capacity Clarity
(%w/v)
1 1 - - + ++
2 1.5 - - ++ ++
3 2 - - ++ -
4 1.5 0.2 - +++ ++
5 1.5 0.4 - +++ ++
6 1.5 - 1 +++ ++
7 1.5 - 1.5 +++ ++
8 1.5 - 2 +++ ++
6.4.1.2.2 Gellan gum
Table 6.7 Gellan gum ISGS
Sr. No. Gellan gum
(% w/v)
Gelling capacity Clarity
1 0.1 ++ +++
2 0.2 ++ +++
3 0.3 +++ +++
4 0.4 +++ +++
5 0.5 +++ +++

111
6.4.1.3 Phase transition based on pH
Table 6.8 Formulations of CP 974P and HPMC K4M
Sr.
No.
CP
974P
HPMC
K4M
Citrophosphate
buffer pH 6
Gelling
capacity
Clarity Ph
(%w/w)
1 0.1 1 q.s. +++ ++ 4.5
2 0.2 1 +++ ++ 4.5
3 0.3 1 +++ ++ 4.5
4 0.4 1 +++ ++ 4.5
5 0.5 1 +++ ++ 4.5

112
6.4.2 ISG medicated formulations
Table 6.9 Physicochemical characterization of medicated ISG formulations
Sr.
No.
Formulation
code
Clarity Gelling
capacity
pH Mucoadhesive
force (dyne/cm2)
Gelation
temp. (oC)
1 P1 +++ +++ 5.5 5444.4±6.92 34.0±0.75
2 P2 +++ +++ 5.5 6125±3.32 33.50±0.12
3 P3 +++ +++ 6 4144.44±7.75 34.0±0.53
4 P4 +++ +++ 6 5444.44±7.03 33.0±0.41
5 P5 +++ +++ 6 6125±3.33 35.1±0.46
6 P6 +++ +++ 5.5 4144.44±7.75 34.0±0.48
7 P7 +++ +++ 5.5 5444.44±7.03 33.0±0.5
8 P8 +++ +++ 5.5 6125±3.33 33.1±0.66
9 S1 ++ +++ 6 3402.76±1.951 -
10 S2 ++ +++ 6 3763.89±4.64 -
11 S3 ++ +++ 6 4324.4±1.16 -
12 S4 ++ +++ 6 3402.76±1.951 -
13 S5 ++ +++ 6 3763.89±4.64 -
14 S6 ++ +++ 6 4324.4±1.16 -
15 S7 ++ +++ 6 5525±7.28 -
16 S8 ++ +++ 6 6125±9.89 -
17 G1 +++ +++ 6.8 3402.76±7.34 -
18 G2 +++ +++ 6.9 4402.76±7.170 -
19 G3 +++ +++ 7.0 5202.76±1.38 -
20 G4 +++ +++ 6.8 3402.76±7.34 -
21 G5 +++ +++ 6.9 4402.76±7.170 -
22 G6 +++ +++ 7.0 5202.76±1.38 -
23 G7 +++ +++ 6.9 3402.76±7.34 -
24 G8 +++ +++ 6.9 4402.76±7.170 -
25 C1 ++ +++ 4.5 4402.76±0.961 -
26 C2 ++ +++ 4.5 5083.33±1.80 -
27 C3 ++ +++ 4.5 6644.4±7.884 -

113
Sr.
No.
Formulation
code
Clarity Gelling
capacity
pH Mucoadhesive
force (dyne/cm2)
Gelation
temp. (oC)
28 C4 ++ +++ 4.5 4402.76±0.961 -
29 C5 ++ +++ 4.5 5083.33±1.80 -
30 C6 ++ +++ 4.5 6644.4±7.884 -
31 C7 ++ +++ 4.5 4402.76±0.961 -
32 C8 ++ +++ 4.5 5083.33±1.80 -
33 C9 ++ +++ 4.5 6644.4±7.884 -
Mean ± SD, n = 3
6.4.2.1 Appearance and clarity
All formulations containing PXMs and chitosan with non-ionic polymer, HPMC
K4M were found to be very clear without any precipitation. All formulations
containing CP 974P were found to clear. With increase in concentration of CP 974P,
clarity was found to be decreased. Formulations containing gellan gum were found to
be very clear, whereas formulations containing sodium alginate were found to be
satisfactory. As the concentration of sodium alginate was increased above 1.5% w/v,
turbidity also increased (Table 6.5 to 6.8).
6.4.2.2 pH
The pH of all thermosensitive IS gel was found to be in the range of 6-7. For ion
sensitive IS gel containing sodium alginate, pH was in the range of 5-6, similarly
gellan gum IS gel showed pH in the range of 6-7. The pH of all CP 974P based IS gel
was found to be in the range of 4.5-5. These pH values were considered to be
acceptable since the ophthalmic pH ranges between 4.5-7.0. Hence no discomfort or
excessive tear flux might occur on instillation (Table 6.9).

114
6.4.2.3 Gelation temperature
The liquid–gel conversion temperatures are considered to be ideal for eye in the
range of 25-34oC. If it is lower than 25
oC, a gel forms at room temperature and if
higher than 34oC, does not form gel when instilled in the eye. This results in the
drainage of the solution from the eyes. PXM solutions undergo thermoreversible
gelation, depending on the type, concentration and other ingredients. Gelation
temperature of PXM 407 can be adjusted within the range of 33-34°C by modifying
cross-linking agents, by mixing the different combinations of PXM (PXM 188).
Below the transition temperature, PXM solutions allow a comfortable and precise
carrier by the patient to the cul-de-sac, where thermogelation occurs. The results
obtained for gelation temperature study (Table 6.5) for different PXM 407
concentrations (15-18%w/v) along with PXM 188 (4.0%w/v) confirms that it is
dependent on polymer concentration; as the PXM 407 concentration increases
gelation temperature decreases. Formulation containing PXM 407 at concentration
15%w/v and 16% w/v did not form gel at physiological conditions in simulated tear
fluid (temperature 34oC and pH 7.4). Concentration 17%w/v and 18%w/v shows
gelation temperature of 42.0±0.50 and 38.24±0.36. Further addition of mucoadhesive
polymer, HPMC K4M (0.2-0.4%w/v) reduces the liquid to gel conversion
temperature of the ISGS. The gelation temperature reducing effect of mucoadhesive
polymers could be explained by their ability to bind to polyoxyethylene chains present
in the PXM molecules. This will promote dehydration, causing an increase in
entanglement of adjacent molecules and extensively increasing intermolecular
hydrogen bonding which will lead to gelation at lower temperature. Further addition
of chitosan (0.25%w/v) a mucoadhesive and penetration enhancer lowered the
gelation temperature to 33.0±0.5. Increase in chitosan concentration to 0.5%w/v

115
causes gelation at 33.1±0.62. Finally Combination of 18%w/v PXM 407 and 4%w/v
PXM 188 with 0.2%w/v HPMC K4M and 0.25%w/v chitosan was used for further
study.
6.4.2.4 Gelling capacity
Combination of 18%w/v PXM 407 and 4%w/v PXM 188 was found to be gel
forming quickly within 60 sec. and gel structure stable for more than 3hr. When
HPMC K4M (0.2-0.4%w/v) and chitosan (0.25%w/v) was incorporated in PXM
combination, the gel formulation was quick and gel structure retained for longer time
ie more than 6 hr (Table 6.5). This suggests increase in gel strength with addition of
dual mucoadhesive polymer. Chitosan is more mucoadhesive. The formulation of
sodium alginate at concentration 1-2%w/v was found to be liquid at non-physiological
conditions. When it was added to simulated tear fluid, in presence of Ca++
ions, it was
transformed to gel. This might be attributed to interaction of Ca++
ions with the G
entity of sodium alginate resulting into 3 dimensional gel structures. Alginates are
good gel forming but as the concentration of sodium alginate increases from 1.0 to
2.0%, turbidity increases (Table 6.6). So sodium alginate in concentration of 1.5%w/v
was further combined with non ionic mucoadhesive polymers HPMC K4M and HEC,
at different concentrations. The resultant formulations retained gelling ability and
after addition to ionic environment formed stable gel structure. All the formulations
containing different concentrations of gellan gum (0.1%-0.5%) showed the gelling
ability in the presence of simulated tear fluid. It is attributed to formation of a three
dimensional network by its complex formation with Ca++
ions and hydrogen bonding
with water (Table 6.7). Gellan gum forms a clear gel on contact with cations in the
tear fluid and once gelled, the formulation resists the natural drainage process from
the precorneal area. CP 974P showed concentration dependent gelation in simulated
116
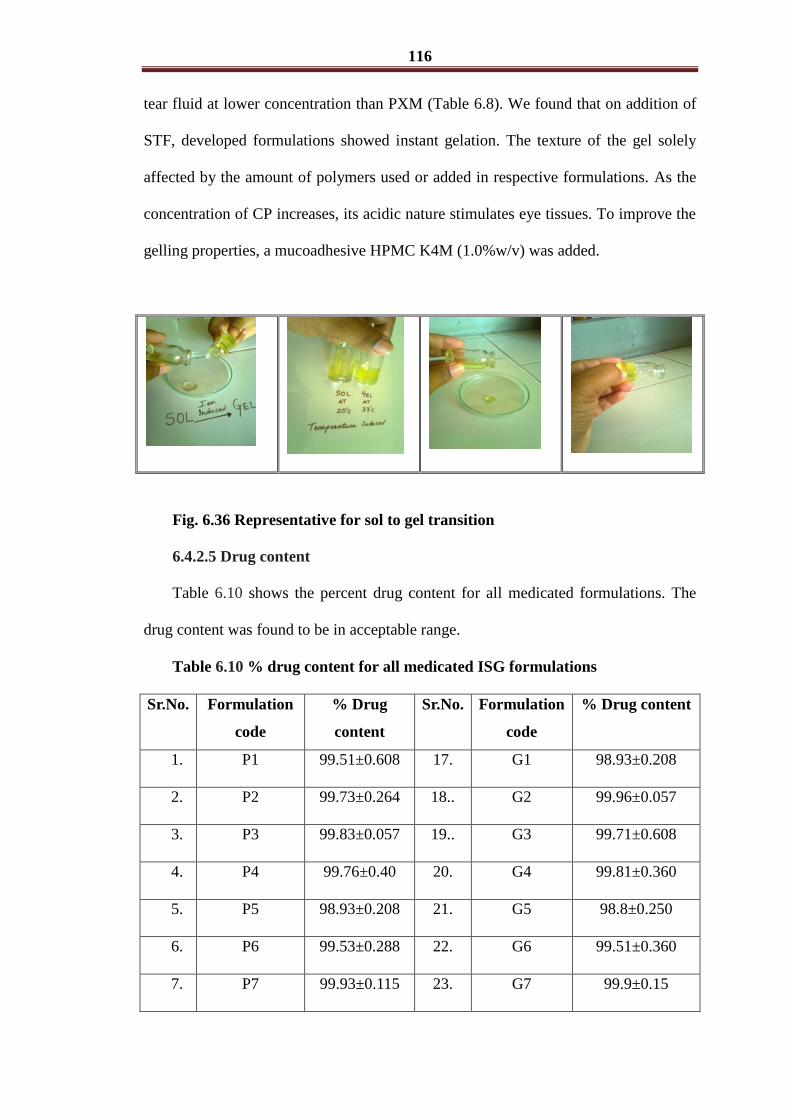
tear fluid at lower concentration than PXM (Table 6.8). We found that on addition of
STF, developed formulations showed instant gelation. The texture of the gel solely
affected by the amount of polymers used or added in respective formulations. As the
concentration of CP increases, its acidic nature stimulates eye tissues. To improve the
gelling properties, a mucoadhesive HPMC K4M (1.0%w/v) was added.
Fig. 6.36 Representative for sol to gel transition
6.4.2.5 Drug content
Table 6.10 shows the percent drug content for all medicated formulations. The
drug content was found to be in acceptable range.
Table 6.10 % drug content for all medicated ISG formulations
Sr.No. Formulation
code
% Drug
content
Sr.No. Formulation
code
% Drug content
1. P1 99.51±0.608 17. G1 98.93±0.208
2. P2 99.73±0.264 18.. G2 99.96±0.057
3. P3 99.83±0.057 19.. G3 99.71±0.608
4. P4 99.76±0.40 20. G4 99.81±0.360
5. P5 98.93±0.208 21. G5 98.8±0.250
6. P6 99.53±0.288 22. G6 99.51±0.360
7. P7 99.93±0.115 23. G7 99.9±0.15

117
8. P8 99.26±0.513 24. G8 98.60±0.258
9. S1 98.93±0.208 25. C1 99.85±0.70
10. S2 99.61±0.057 26. C2 99.51±0.360
11. S3 99.78±0.355 27. C3 99.65±0.217
12. S4 99.39±0.265 28. C4 99.9±0.18
13. S5 98.93±0.208 29. C5 99.96±0.40
14. S6 99.10±0.057 30. C6 99.45±0.70
15. S7 98.93±0.208 31. C7 99.71±0.360
16. S8 99.81±0.057 32. C8 99.65±0.217
33. C9 99.85±0.70
Mean ± SD, n = 3
6.4.2.6 Mucoadhesion test (Bioadhesion potential)
Ocular mucoadhesion relies on the interaction of a polymer and the mucin coat
that is present on conjunctival and corneal surface of the eye. This mucus is secreted
by goblet cells of conjunctiva. Chemically, mucin consists of a protein or polypeptide
core with carbohydrate side chains branching off the core. The polymer with many
hydrophilic functional groups (eg: -CO, -OH, -NH2 and SO4) can establish
electrostatic interactions and lipophilic interactions and hydrogen bonding with the
underlying surface. Among non-covalent forces, hydrogen bonding appears to be the
most important. PXM 407 gives colorless and transparent gels but weak mechanical
strength and rapid erosion. It is concluded that as the polymer concentration increases
mucoadhesion increased. This might be due to increased entanglement of polymer
chains with mucin at increased concentration of polymer. The addition of
mucoadhesive polymer, HPMC K4M has increased mucoadhesive force. The

118
reinforcement of the mucoadhesive forces of PXM solutions by the used
mucoadhesive polymer could be explained by the fact that, secondary bond forming
groups (e.g. hydroxyl, ether oxygen and amine) are the principle source of
mucoadhesion. HPMC K4M and HEC have an ample of -OH and R-O-R groups
along their chain length. CP is known to be excellent mucoadhesive polymers. Hence,
satisfactory bioadhesion was observed in case of all ophthalmic gel formulations. The
bioadhesion is determined by the availability of carboxyl groups. The % of carboxyl
group present in CP 974P is high. These groups simultaneously bind to the sugar
residue in oligosaccharide chains present in the mucus membrane, resulting in a
strong bond between the polymer and mucus membrane. With increase in the density
of hydrogen bonding groups interaction increase with the glycoproteins of the mucin.
Also CP may adopt conformation that has more favorable macromolecular
accessibility of its functional groups for hydrogen bonding. Thus increase in the
mucoadhesive force will lead to increase in retention time and thus bioavailability.
Sodium alginate, an anionic mucoadhesive have shown less bioadhesion as compared
to CP. Gellan gum also form good clear gel without addition of mucoadhesive. Once
gelled, the formulation resists the natural drainage process from the precorneal area.

119
6.4.2.7 In vitro drug release studies
The release profile of a drug gives valuable insight into its in vivo performance.
All the developed ISGS were subjected to in vitro release studies (Table 6.11 to 6.14.
and Fig. 6.37 to 6.40).
Fig. 6.37 In vitro release profile of all temperature sensitive IS gel
Mean ± SD, n = 3
0
10
20
30
40
50
60
70
80
90
100
0 2 4 6 8
Cu
mu
lati
ve
% d
rug r
elea
sed
Time (hr)
P1
P2
P3
P4
P5
P6
P7
P8
120
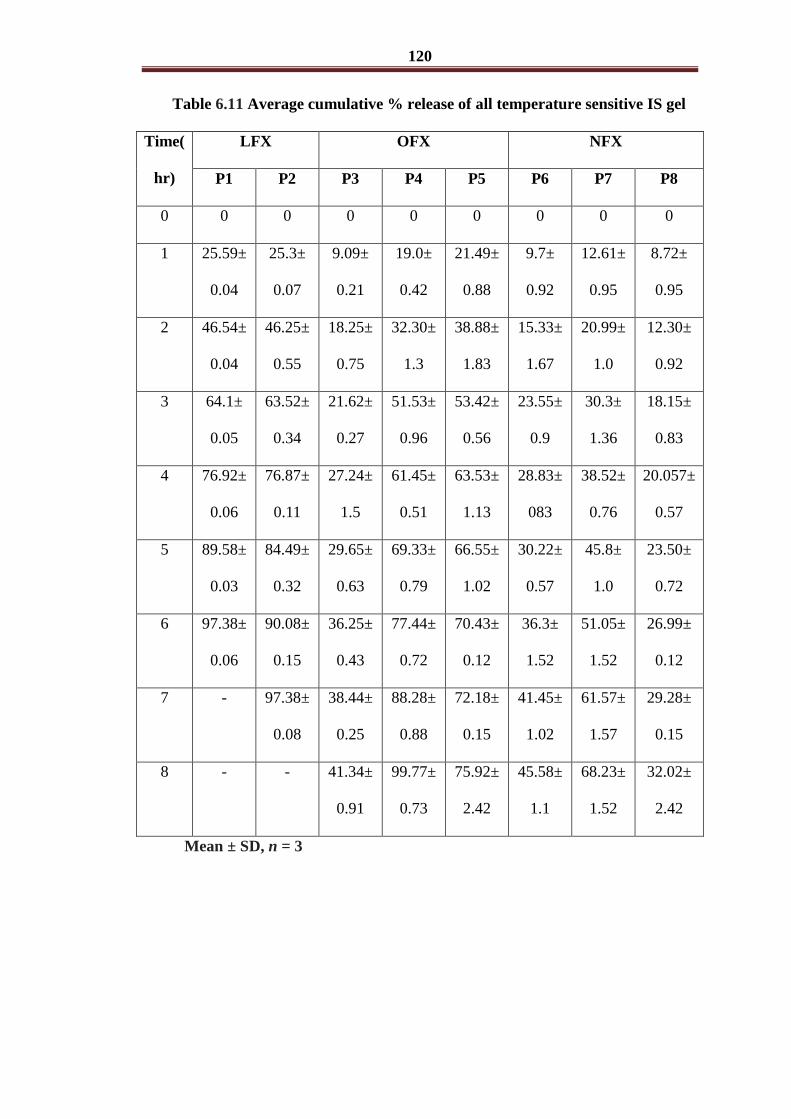
Table 6.11 Average cumulative % release of all temperature sensitive IS gel
Time(
hr)
LFX OFX NFX
P1 P2 P3 P4 P5 P6 P7 P8
0 0 0 0 0 0 0 0 0
1 25.59±
0.04
25.3±
0.07
9.09±
0.21
19.0±
0.42
21.49±
0.88
9.7±
0.92
12.61±
0.95
8.72±
0.95
2 46.54±
0.04
46.25±
0.55
18.25±
0.75
32.30±
1.3
38.88±
1.83
15.33±
1.67
20.99±
1.0
12.30±
0.92
3 64.1±
0.05
63.52±
0.34
21.62±
0.27
51.53±
0.96
53.42±
0.56
23.55±
0.9
30.3±
1.36
18.15±
0.83
4 76.92±
0.06
76.87±
0.11
27.24±
1.5
61.45±
0.51
63.53±
1.13
28.83±
083
38.52±
0.76
20.057±
0.57
5 89.58±
0.03
84.49±
0.32
29.65±
0.63
69.33±
0.79
66.55±
1.02
30.22±
0.57
45.8±
1.0
23.50±
0.72
6 97.38±
0.06
90.08±
0.15
36.25±
0.43
77.44±
0.72
70.43±
0.12
36.3±
1.52
51.05±
1.52
26.99±
0.12
7 - 97.38±
0.08
38.44±
0.25
88.28±
0.88
72.18±
0.15
41.45±
1.02
61.57±
1.57
29.28±
0.15
8 - - 41.34±
0.91
99.77±
0.73
75.92±
2.42
45.58±
1.1
68.23±
1.52
32.02±
2.42
Mean ± SD, n = 3

121
Fig. 6.38 In vitro release profile of ion sensitive IS gel (Sodium Alginate)
Mean ± SD, n = 3
0
10
20
30
40
50
60
70
80
90
100
0 2 4 6 8
Cu
mu
lati
ve
% d
rug r
elea
sed
Time (hr)
S1
S2
S3
S4
S5
S6
S7
S8

122
Table 6.12 Average cumulative % release of all ion sensitive
IS gel (Sodium Alginate)
Time
(hr)
LFX OFX NFX
S1 S2 S3 S4 S5 S6 S7 S8
0 0 0 0 0 0 0 0 0
1 58.55±
0.45
24.96±
0.51
38.77±
0.44
25.06±
0.78
24.7±
0.57
36.39±
1.39
16.08±
0.23
14.52±
0.69
2 89.59±
0.4
52.68±
0.74
58.92±
0.62
52.57±
1.16
34.99±
0.91
63.27±
1.22
26.7±
0.73
18.95±
0.44
3 93.02±
0.05
54.45±
0.4
81.04±
0.63
54.29±
0.58
47.29±
0.88
74.04±
0.34
35.26±
0.5
24.78±
0.23
4 - 60.19±
0.15
85.53±
0.81
60.01±
0.17
51.2±
1.25
81.7±
0.79
42.22±
0.9
29.78±
0.37
5 - 66.9±
0.43
89.14±
0.46
66.0±
0.8
55.07±
0.66
89.16±
1.39
45.34±
1.0
33.12±
0.77
6 - 71.4±
0.67
90.56±
0.98
71.21±
0.31
60.68±
0.86
94.58±
0.69
47.56±
0.63
36.79±
0.76
7 - 85.77±
0.12
- 76.13±
0.67
69.91±
0.4
95.75±
0.43
57.57±
0.54
38.3±
0.63
8 - 90.36±
0.44
- 85.48±
0.7
71.23±
0.92
99.92±
0.9
62.81±
0.88
40.3±
0.5
Mean ± SD, n = 3

123
Fig. 6.39 In vitro release profile of all ion sensitive IS gel (Gellan gum)
Mean ± SD, n = 3
0
10
20
30
40
50
60
70
80
90
100
0 1 2 3 4 5 6 7
Cu
mu
lati
ve
% d
rug r
elea
sed
Time (hr)
G1
G2
G3
G4
G5
G6
G7
G8

124
Table 6.13 Average cumulative % release of all ion sensitive IS gel (Gellan
gum)
Time(
hr)
LFX OFX NFX
G1 G2 G3 G4 G5 G6 G7 G8
0 0 0 0 0 0 0 0 0
1 55.93±
1.1
29.39±
0.76
25.39±
1.74
36.2±
0.47
62.18±
1.81
47.4±
2.18
42.89±
0.707
41.21±
1.41
2 64.62±
1.03
50.13±
0.65
32.81±
1.13
46.53±
0.58
80.92±
2.89
60.78±
1.7
62.68±
1.41
57.78±
1.42
3 73.41±
1.06
58.81±
2.72
38.87±
1.11
58.94±
0.8
95.52±
0.61
78.2±
0.32
74.2±
2.21
71.62±
1.41
4 88.65±
2.58
70.4±
0.71
50.74±
0.97
75.12±
1.5
- 90.24±
0.31
84.46±
1.41
82.74±
1.42
5 100.8±
1.49
84.14±
1.13
58.08±
0.28
86.3±
0.47
- - 85.26±
2.12
96.18±
1.4
6 - 93.92±
0.48
65.67±
0.68
95.52±
0.61
- - 90.24±
0.31
97.34±
0.7
7 - - 75.2±
0.32
- - - 100±
0.45
99.71±
0.79
Mean ± SD, n = 3

125
Fig. 6.40 In vitro release profile of all pH sensitive IS gel
Mean ± SD, n = 3
0
10
20
30
40
50
60
70
80
90
100
0 2 4 6 8
Cu
mu
lati
ve
% d
rug r
elea
sed
Time (hr)
C1
C2
C3
C4
C5
C6
C7
C8
C9

126
Table 6.14 Average cumulative % release of all pH sensitive IS gel
Time
(hr)
LFX OFX NFX
C1 C2 C3 C4 C5 C6 C7 C8 C9
0 0 0 0 0 0 0 0 0 0
1 49.5±
0.88
38.8±
0.93
25.0±
0.75
25.0±
0.75
22.2±
0.41
12.7±
0.57
12.7±
0.42
14.5±
0.46
14.5±
1.29
2 75.5±
0.86
61.26±
1.54
43.6±
0.61
43.6±
0.61
38.2±
0.87
33.6±
0.48
28.8±
0.25
28.1±
0.25
21.4±
1.03
3 91.7±
1.0
81.32±
1.02
60.8±
0.45
60.8±
0.45
61.7±
0.44
52.7±
0.45
39.6±
0.21
42.0±
0.39
34.9±
1.28
4 96.9±
0.66
87.04±
0.67
68.2±
0.28
68.2±
0.28
62.5±
0.13
60.2±
0.34
42.7±
0.47
43.5±
0.83
42.2±
0.83
5 - 96.09±
1.33
70.66
±0.35
70.66
±0.35
65.8±
1.89
62.1±
0.49
60.6±
0.6
56.2±
0.3
61.1±
0.21
6 - 100.86
±1.24
78.5
±0.7
71.2
±0.7
70.84
±1.18
64.37
±1.03
75.36
±0.42
67.91
±0.29
66.03
±0.85
7 - - 88.58
±0.4
88.58
±0.4
75.88
±0.29
65.74
±0.33
89.54
±0.47
81.5
±0.58
80.93
±0.82
8 - - 97.92
±0.6
96.88
±0.1
78.0±
0.43
71.84
±0.58
90.45
±0.53
85.51
±0.47
84.56
±0.67
Mean ± SD, n = 3

127
The in vitro drug release profile of all ISGS is affected by the intrinsic properties
(solubility and permeability) of the FQ drugs viz. LFX, OFX (BCS Class I); and
NFX. Also use of mucoadhesive polymers and permeation enhancer has shown
impact on drug release profile. LFX is more water soluble than OFX and OFX is more
soluble than norfloxacin. Solubility of respective drug has shown effect on release
profile. Release of LFX is rapid as compared to OFX and NFX. Formulation P1, P3
and P6 shows cumulative percent drug release of 46.54±0.04, 18.25±0.75 and
15.33±1.67 respectively after 2 hr. Addition of chitosan (0.25%w/v) as a penetration
enhancer increases release of OFX and NFX from their formulation. Formulation P4
and P7 shows cumulative percent drug release of 99.77±0.73 and 68.23±1.52
respectively after 8 hr. Chitosan plays dual role of penetration enhancer as well as
mucoadhesive. Mucoadhesive properties of chitosan (0.5%w/v) further sustained the
drug release. A similar release profile was observed from alginate based ion sensitive
ISGS. Formulation S1 and S4 with 1.0% HEC shows cumulative percent drug release
of 89.59±0.4 and 52.57±1.16, while S7 with 0.2% HPMC K4M shows cumulative
percent drug release of 26.7±0.73 after 2 hr. Gellan based ion sensitive ISGS of FQ
drugs shows rapid release than other developed systems. Release was sustained as
polymer concentration increased. Polymer concentration dependant release was
observed from pH sensitive ISG system. As concentration of CP 974 P was increased
from 0.1 to 0.3% drug release becomes more sustained.
Following the results obtained for bioadhesion force, gelling capacity and in vitro
drug release profile of all the formulations, selected formulations were further
subjected to rheological behavior and transcorneal permeation profile.
128
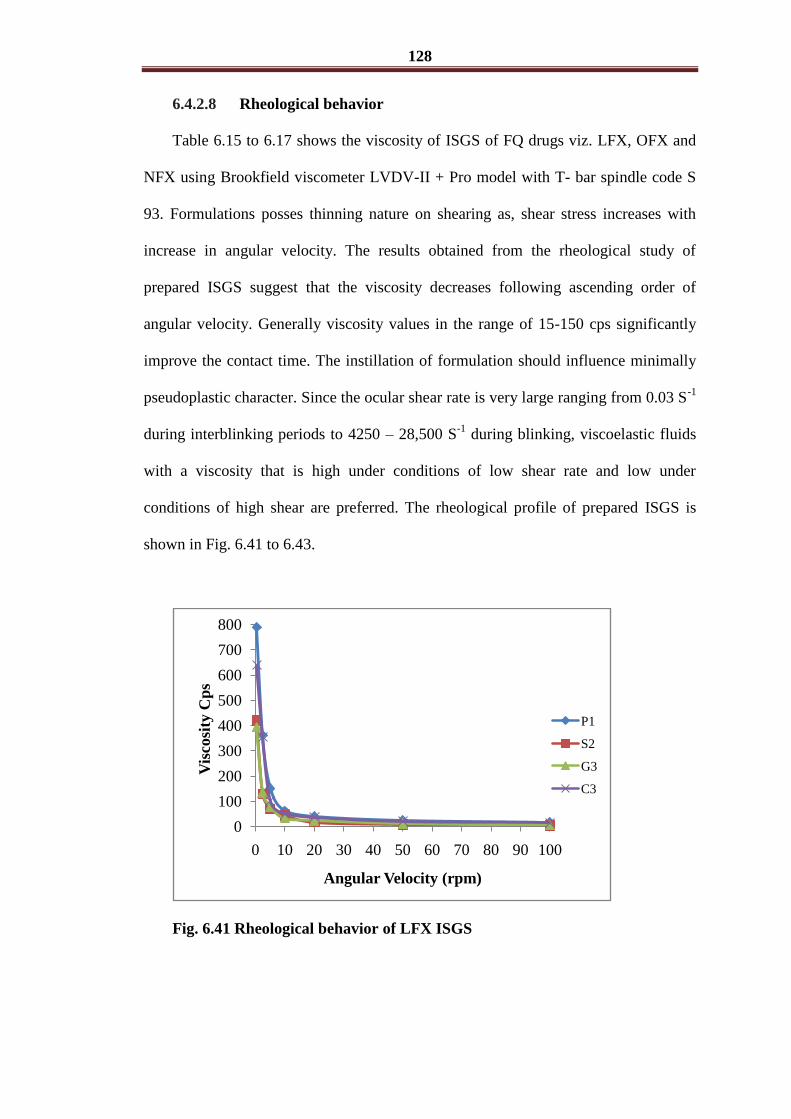
6.4.2.8 Rheological behavior
Table 6.15 to 6.17 shows the viscosity of ISGS of FQ drugs viz. LFX, OFX and
NFX using Brookfield viscometer LVDV-II + Pro model with T- bar spindle code S
93. Formulations posses thinning nature on shearing as, shear stress increases with
increase in angular velocity. The results obtained from the rheological study of
prepared ISGS suggest that the viscosity decreases following ascending order of
angular velocity. Generally viscosity values in the range of 15-150 cps significantly
improve the contact time. The instillation of formulation should influence minimally
pseudoplastic character. Since the ocular shear rate is very large ranging from 0.03 S-1
during interblinking periods to 4250 – 28,500 S-1
during blinking, viscoelastic fluids
with a viscosity that is high under conditions of low shear rate and low under
conditions of high shear are preferred. The rheological profile of prepared ISGS is
shown in Fig. 6.41 to 6.43.
Fig. 6.41 Rheological behavior of LFX ISGS
0
100
200
300
400
500
600
700
800
0 10 20 30 40 50 60 70 80 90 100
Vis
cosi
ty C
ps
Angular Velocity (rpm)
P1
S2
G3
C3

129
Table 6.15 Rheological profile of LFX ISGS
Angular
Velocity (rpm)
Viscosity (cps)
P1 S2 G3 C3
0.5 790 220 395 239
2.5 162 132 135 144
5 95.3 69.569 78.4 73.478
10 51.9 43.78 43.5 50
20 30.1 16.945 23.4 18
50 14.2 7.896 12.35 9
100 7.23 4.567 5.3 5.12
Fig. 6.42 Rheological behavior of OFX ISGS
0
100
200
300
400
500
600
700
800
0 10 20 30 40 50 60 70 80 90 100
Vis
cosi
ty C
ps
Angular Velocity (rpm)
P4
S4
G5
C4

130
Table 6.16 Rheological profile of OFX ISGS
Angular
Velocity (rpm)
Viscosity (cps)
P4 S4 G5 C4
0.5 800 220 356 210
2.5 219 101 123.17 104
5 96 68.7 70 36.1
10 55.6 42 35.89 21.3
20 29.2 13.5 21.5 12.2
50 15.3 6.7 12 5.5
100 6.99 4.298 4.798 4.9
Fig. 6.43 Rheological behavior of NFX ISGS

131
Table 6.17 Rheological study of NFX ISGS
Angular
Velocity (rpm)
Viscosity (cps)
P7 S7 G7 C7
0.5 810 457 322 210
2.5 212 123 112.67 104
5 95.3 88.9 63.4 36.1
10 51.9 42.5 32.45 21.3
20 30.1 21.5 19 12.2
50 14.2 11.9 9.7 5.5
100 7.23 6.2 4.578 4.9
6.4.2.9 Transcorneal permeation studies
Fig. 6.44 Transcorneal permeation of LFX ISGS Mean ± SD, n = 3
Table 6.18 Average cumulative % drug permeated from LFX ISGS
0
20
40
60
80
100
0 2 4 6 8
Cu
mu
lati
ve
% d
rug p
erm
eate
d
Time (hr)
P1
S2
G3
C3
Eye
drop

132
Time(hr) P1 S2 G3 C3 Marketed eye
drop
0 0 0 0 0 0
1 45.99±0.633 48.38±0.95 28.67±1.5 8.21±0.36 61.82±0.36
2 50.79±0.57 55.97±0.7 47.92±1.15 40.92±0.74 69.12±1.0
3 61.13±0.51 65.3±1.34 56.97±1.73 49.32±0.85 74.21±0.7
4 72.71±1.16 83.6±0.89 67.83±1.0 57.92±0.8 86.08±1.5
5 80.79±0.55 90.98±1.29 75.86±1.0 67.76±0.69 95.04±1.0
6 94.46±0.52 95.22±0.8 89.94±1.0 75.0 ±0.67 -
7 97.26±1.35 98.28±0.52 96.96±1.0 89.23±0.34 -
8 99.18±0.6 - - - -
Mean ± SD, n = 3
Fig. 6.45 Transcorneal permeation of OFX ISGS
Mean ± SD, n = 3
0
20
40
60
80
100
0 2 4 6 8
Cu
mu
lati
ve
% d
rug p
erm
eate
d
Time (hr)
P4
S4
G5
C4
Eye
drop
133
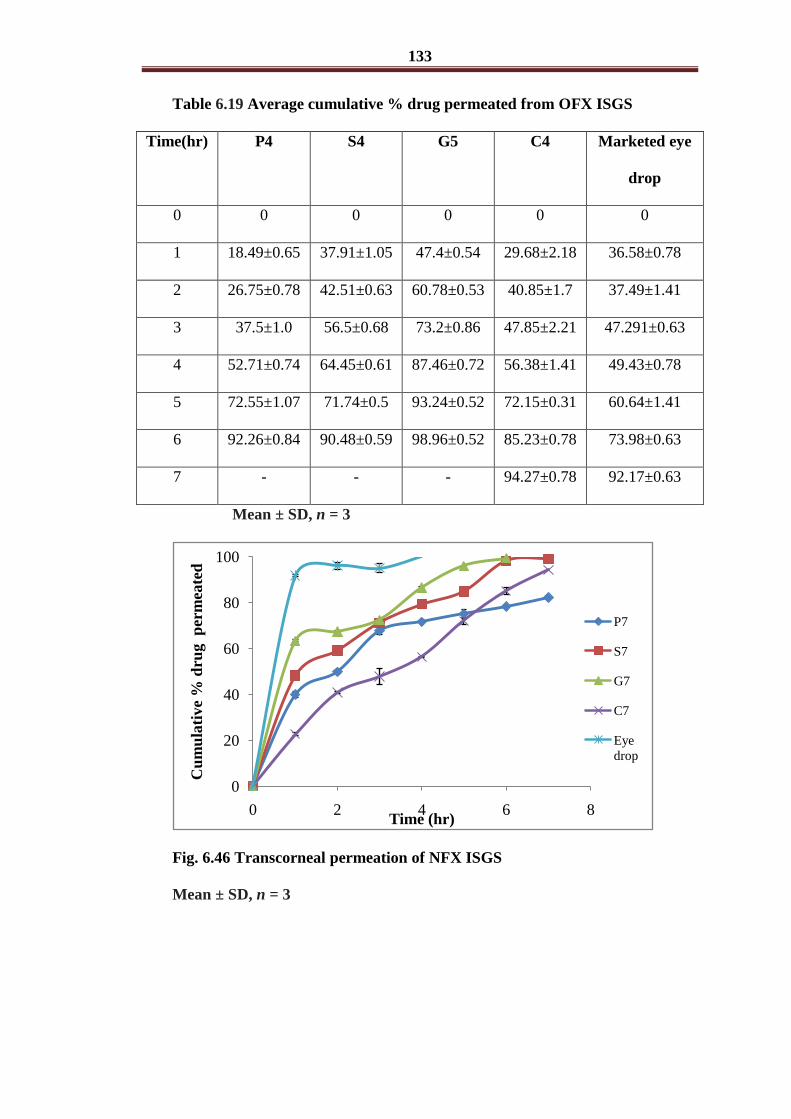
Table 6.19 Average cumulative % drug permeated from OFX ISGS
Time(hr) P4 S4 G5 C4 Marketed eye
drop
0 0 0 0 0 0
1 18.49±0.65 37.91±1.05 47.4±0.54 29.68±2.18 36.58±0.78
2 26.75±0.78 42.51±0.63 60.78±0.53 40.85±1.7 37.49±1.41
3 37.5±1.0 56.5±0.68 73.2±0.86 47.85±2.21 47.291±0.63
4 52.71±0.74 64.45±0.61 87.46±0.72 56.38±1.41 49.43±0.78
5 72.55±1.07 71.74±0.5 93.24±0.52 72.15±0.31 60.64±1.41
6 92.26±0.84 90.48±0.59 98.96±0.52 85.23±0.78 73.98±0.63
7 - - - 94.27±0.78 92.17±0.63
Mean ± SD, n = 3
Fig. 6.46 Transcorneal permeation of NFX ISGS
Mean ± SD, n = 3
0
20
40
60
80
100
0 2 4 6 8
Cu
mu
lati
ve
% d
rug p
erm
eate
d
Time (hr)
P7
S7
G7
C7
Eye
drop

134
Table 6.20 Average cumulative % drug permeated from NFX ISGSs
Time
(hr)
P7 S7 G7 C7 Marketed eye
drop
0 0 0 0 0 0
1 39.96±0.7 48.29±1.26 63.49±0.57 22.68±0.57 91.829±1.41
2 49.9±1.41 59.15±1.83 67.5±0.49 40.85±0.7 96.18±0.5
3 67.75±0.7 71.26±0.85 72.57±0.5 47.85±0.6 97.08±1.53
4 71.6±1.41 79.36±1.01 86.53±0.24 56.38±3.29 100.15±1.83
5 75.16±0.24 84.92±1.29 96±0.55 72.15±0.31 -
6 78.25±1.93 98.33±0.52 99.37±0.4 85.23±1.53 -
7 82.21±0.24 99.1±1.53 - 94.27±1.53 -
Mean ± SD, n = 3

135
Table 6.21 Model fitting for release study of the formulations
Code
Zero order Higuchi matrix Korsmeyer peppas
R2
K R2
K R2 K N
P1 0.9169 19.892 0.9969 41.879 0.9681 2.103 0.5302
S2 0.9767 17.283 0.9842 39.032 0.9567 0.2982 0.6199
G3 0.9479 14.70 0.9885 37.569 0.9432 2.097 0.7210
C3 0.8891 17.027 0.9857 40.333 0.9923 10.459 0.5967
P4 0.9119 21.196 0.9914 44.61 0.9635 16.49 0.5198
S4 0.9315 35.778 0.9922 57.55 0.8418 16.47 0.6189
G5 0.9065 10.704 0.9912 31.334 0.9825 12.073 0.5810
C4 0.8891 17.027 0.9857 40.333 0.9923 10.459 0.5967
P7 0.9801 49.766 0.9993 65.446 0.9127 9.672 0.6026
S7 0.9662 34.486 0.9988 54.652 0.9322 15.783 0.5034
G7 0.9119 21.196 0.9914 44.61 0.9635 16.49 0.5198
C7 0.9664 16.197 0.9924 36.924 0.9577 12.346 0.6523
The transcorneal permeation study of all ISGS is affected by the intrinsic
properties of the FQ drugs viz. LFX, OFX and NFX. Also use of mucoadhesive
polymers and permeation enhancer has shown impact on drug permeation study
(Fig.6.44 to 6.46). Higuchi matrix diffusion mechanism was observed from all ISG
formulation. The release of drug from the formed matrix is influenced by diffusion
and/or erosion. The overall diffusion-controlled release kinetics was found. The best
fit kinetic model was Higuchi matrix model. When compared using student t test
ANOVA followed by Dunnet’s test was done to study transcorneal permeation after 2

136
hr. LFX and NFX IS gel formulations showed sustained release as compared to
marketed eye drop. For OFX containing IS gel formulation, only P4 showed sustained
release (Fig. 6.47 to 6.49).
Fig. 6.47 Comparison of transcorneal permeation of LFX IS gel and
marketed eye drop
Fig. 6.48 Comparison of transcorneal permeation of OFX IS gel and
marketed eye drop
0
10
20
30
40
50
60
70
P4 S4 G5 C4 Eye drop
Cu
mu
lati
ve
% d
rug p
erm
eate
d
***
137
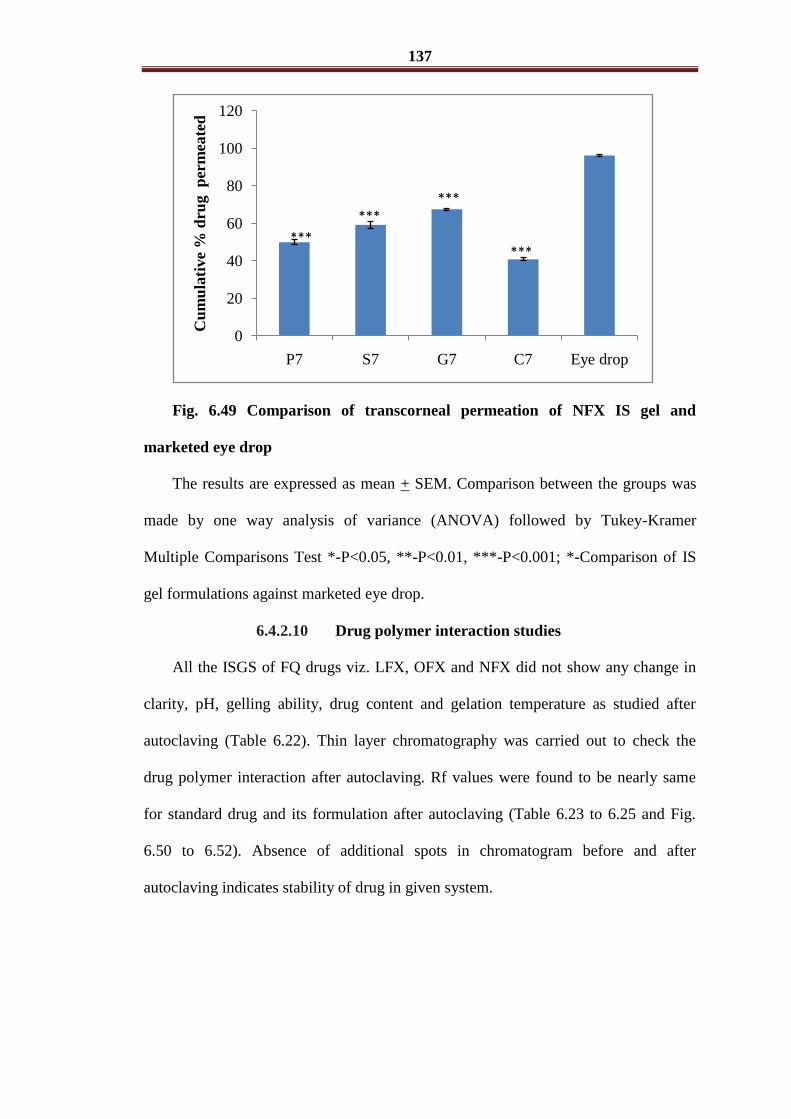
Fig. 6.49 Comparison of transcorneal permeation of NFX IS gel and
marketed eye drop
The results are expressed as mean + SEM. Comparison between the groups was
made by one way analysis of variance (ANOVA) followed by Tukey-Kramer
Multiple Comparisons Test *-P<0.05, **-P<0.01, ***-P<0.001; *-Comparison of IS
gel formulations against marketed eye drop.
6.4.2.10 Drug polymer interaction studies
All the ISGS of FQ drugs viz. LFX, OFX and NFX did not show any change in
clarity, pH, gelling ability, drug content and gelation temperature as studied after
autoclaving (Table 6.22). Thin layer chromatography was carried out to check the
drug polymer interaction after autoclaving. Rf values were found to be nearly same
for standard drug and its formulation after autoclaving (Table 6.23 to 6.25 and Fig.
6.50 to 6.52). Absence of additional spots in chromatogram before and after
autoclaving indicates stability of drug in given system.
0
20
40
60
80
100
120
P7 S7 G7 C7 Eye drop
Cu
mu
lati
ve
% d
rug p
erm
eate
d
***
******
***

138
Table 6.22 Drug polymer interaction studies
Sr.
No.
Formulation
code
Clarity Gelling
capacity
pH Drug
contents
Gelation
temp.
(oC)
1 P1 +++ +++ 5.5 99.9±0.1 34.0±0.2
2 P4 +++ +++ 6 98.80±0.258 33.0±0.35
3 P7 +++ +++ 5.5 99.78±0.70 33.0±0.35
4 S2 ++ +++ 6 99.71±0.360 -
5 S4 ++ +++ 6 99.75±0.217 -
6 S7 ++ +++ 6 99.9±0.1 -
7 G3 +++ +++ 7.0 99.86±0.40 -
8 G5 +++ +++ 6.9 99.85±0.70 -
9 G7 +++ +++ 6.9 99.71±0.360 -
10 C3 ++ +++ 4.5 99.9±0.1 -
11 C4 ++ +++ 4.5 98.60±0.258 -
12 C7 ++ +++ 4.5 99.65±0.70 -
Mean ± SD, n = 3
Note: 1) (+) Phase transition within 60 sec, collapse of gel structure within 1-2
hr, (++); Phase transition within 60 sec, collapse of gel structure within 3-4 hr, (+++)
Phase transition within 60 sec and gel structure stable for more than 6 hr.
2) (-) turbid, (+) slightly turbid, (++) clear solution, (+++) clear and
transparent.
139
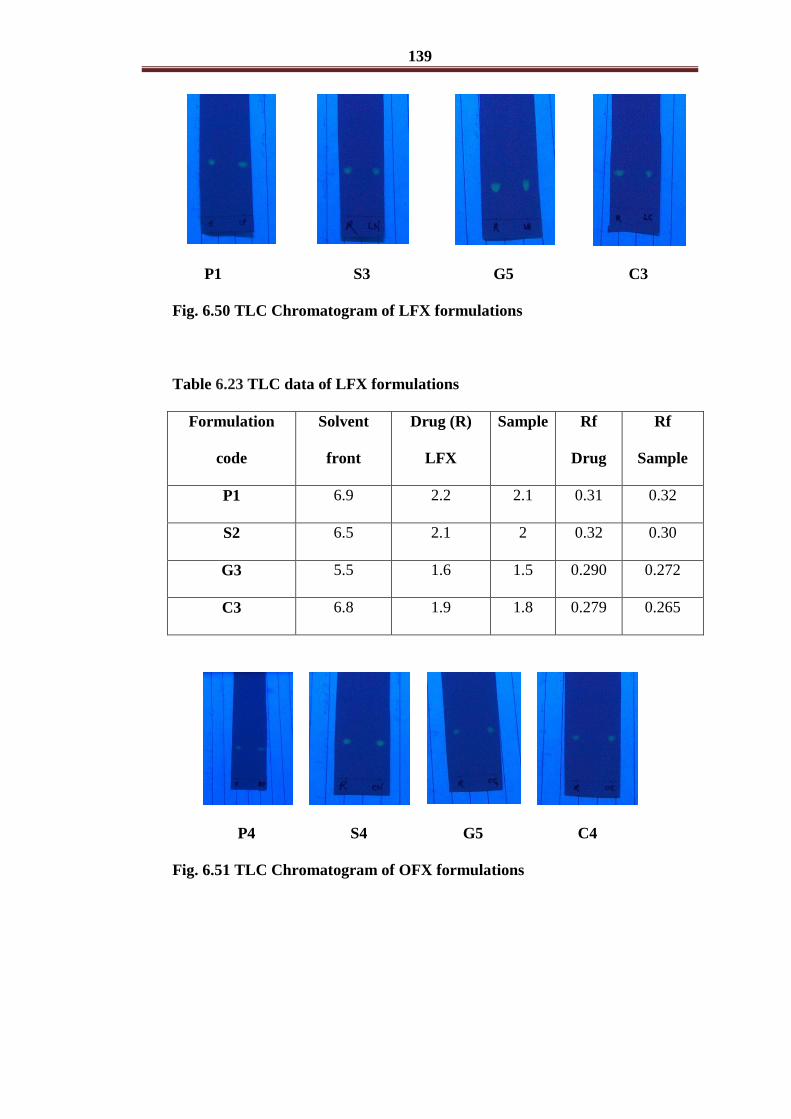
P1 S3 G5 C3
Fig. 6.50 TLC Chromatogram of LFX formulations
Table 6.23 TLC data of LFX formulations
Formulation
code
Solvent
front
Drug (R)
LFX
Sample Rf
Drug
Rf
Sample
P1 6.9 2.2 2.1 0.31 0.32
S2 6.5 2.1 2 0.32 0.30
G3 5.5 1.6 1.5 0.290 0.272
C3 6.8 1.9 1.8 0.279 0.265
P4 S4 G5 C4
Fig. 6.51 TLC Chromatogram of OFX formulations

140
Table 6.24 TLC data of OFX formulations
Formulation
code
Solvent
front
Drug (R)
OFX
Sample Rf Drug Rf
Sample
P4 7.0 1.8 1.9 0.26 0.27
S4 6.8 1.67 1.7 0.25 0.25
G5 6.5 1.8 2.0 0.28 0.30
C4 7.0 1.8 1.9 0.27 0.28
P7 S7 G7 C7
Fig. 6.52 TLC Chromatogram of NFX formulations
Table 6.25 TLC data of NFX formulations
Formulation
code
Solvent
front
Drug (R)
NFX
Sample Rf Drug Rf
Sample
P7 6.8 1.9 1.8 0.279 0.264
S7 6.5 1.5 2.0 0.23 0.307
G7 6.4 1.5 1.3 0.23 0.20
C7 6.9 1.6 1.5 0.231 0.217
141
All the selected formulations are good in viscosity. The systems are shear
thinning. Also transcorneal permeation study data suggests overall diffusion
controlled release kinetics. Amongst the four formulations developed, based on three
systems, for FQ drugs viz. LFX, OFX and NFX for further study two systems were
considered viz. gellan based ion sensitive ISG system and PXM based
thermosensitive ISG system. These two systems were found to be very well in clarity.
Also they give good film on the eye surface as observed on separated goat cornea.

142
6.4.2.11 Antimicrobial efficacy studies
The result of antimicrobial study shown that there were no changes in the
antimicrobial activity of FQ drugs viz. LFX, OFX and NFX due to formulation
ingredients and working conditions as compared to reference formulation (marketed
eye drop formulation), Table 6.26 and Fig.6.53.
Table 6.26 Antimicrobial efficacy of ophthalmic ISG formulations
Formulation Code
Pseudomonas A Staphylococcus A
% Efficacy % Efficacy
Standard LFX 100 100
P1 97.14 92.10
G3 98.23 93.34
Standard OFX 100 100
P4 94.28 96.84
G5 94.22 96.03
Standard NFX 100 100
P7 97.14 92.10
G7 98.00 94.00

143
Standard LFX P1 G3
Standard OFX P4 G5
Standard NFX P7 G7
Fig. 6.53 Antimicrobial efficacy of ophthalmic formulations

144
6.4.2.12 Isotonicity
Fig. 6.54 shows that ISGS of FQ drugs viz. LFX, OFX and NFX exhibited no
change in the shape of blood cells (bulging and shrinkage) which reveals the isotonic
nature of the formulation and compared with that of marketed LFX eye drop.
Normal RBC Marketed eye
drop
P1
P4
P7 G3 G5 G7
Fig. 6.54 Isotonicity of formulations
6.4.2.13 Precorneal clearance study using gamma
scintigraphy
In vivo precorneal clearance of radionuclide was studied using single photon emission
computing tomography (SPECT LAB). It was chosen as it emits low energy gamma
rays which do not lead to serious health hazards. Six IS gel formulations as well as
marketed eye drops were assessed in terms of their ocular retention time. Both,
thermosensitive and gellan

145
based ion sensitive optimized formulations containing LFX, OFX and NFX were
assessed on a group of four rabbits with a minimum washout period of 3 days.
Recording was started immediately after instillation at a rate of 15 seconds per image
for 10 min. and more using SIEMENS ECAM gamma camera (SPECT LAB Pune,
INDIA). Region of interest (ROI) was choose (Fig.6.58 and 6.59) and time activity
curve was plotted and rate of drainage from eye was calculated (Fig.6.55 to 6.57) upto
10 min. A single whole body static image also was taken after 120 min. of instillation
(Fig.6.60).
Fig. 6.55 Time activity curve of LFX formulations (P1and G3) and marketed
eye drop solution (mean±SD; n=2)
0
20
40
60
80
100
0 1 2 3 4 5 6 7 8 9 10
Cou
nts
/S
ec
Time (min)
P1
G3
Eye
drop

146
Fig. 6.56 Time activity curve of OFX formulations (P4 and G5) and
marketed eye drop solution (mean±SD; n=2)
Fig. 6.57 Time activity curve of NFX formulations (P7and G7) and marketed
eye drop solution (mean±SD; n=2)
0
20
40
60
80
100
0 1 2 3 4 5 6 7 8 9 10
Cou
nts
/Sec
Time (min)
P4
G5
Eye
drop
0
20
40
60
80
100
0 1 2 3 4 5 6 7 8 9 10
Cou
nts
/S
ec
Time (min)
P7
G7
Eye
drop

147
Fig.6.58 Representative ocular contact of an IS gel with sequential pictures

148
Fig.6.59 Representative ocular contact of an IS gel with sequential pictures
and time activity curve

149
Fig.6.60 Representative static complete body image (A) marketed eye drop
(B) developed ISG system
For scintigraphic studies, during prelabeling efficiency, labeling parameters like
SnCl2 concentration and pH were optimized (Table 5.12). The acquired gamma
camera images showed that both developed ISGS form good clear gel over the
corneal surface immediately after instillation. Marketed eye drop solutions were drain
very rapidly from the corneal region whereas; all ISGS were cleared at slow rate with
improved contact for longer duration.

150
IS gel forming abilities of the developed systems significantly controls precorneal
drainage. Thus, increased residence time in eye would help to increase ocular
bioavailability. The period of drug absorption is short because the activity gradient
decreases rapidly owing to precorneal solution drainage and conjunctival systemic
absorption. A minimum of 5-10 min of ocular contact time was determined to be
necessary for significantly reducing systemic drug absorption [38].
Superficial cornea1 opacity has been observed with gellan based systems on the
rabbit eye after gamma scintigraphy study. Thermosensitive system does not show
any opacity on the eyes of rabbits. A similar corneal change has been noticed with
carbomer, contained in Pilopine HS ophthalmic gel [151]. Looking towards the data
supported, further study was conducted on optimized thermosensitive ISG medicated
formulation.
6.4.2.14 Ocular irritation studies
Optimized thermosensitive ISG medicated formulation containing LFX, OFX and
NFX was found to be well tolerated and non-irritant at used combinations of PXM
showing mucomimetic properties as well as optical clarity. Excellent ocular tolerance
was noticed for all the three formulations. No signs of redness, watering of the eye
and swelling were observed throughout the study (Fig. 6.61 to 6.63).

151
1hr 24 hr 48 hr 72hr
Right eye untreated
P1
Fig. 6.61 Ocular irritation test of optimized IS LFX formulation in rabbit eye
1 hr 24 hr 48 hr 72 hr
Right eye untreated
P4
Fig. 6.62 Ocular irritation test of optimized IS OFX formulation in rabbit eye
1 hr 24 hr 48 hr 72 hr
Right eye untreated
P7
Fig. 6.63 Ocular irritation test of optimized IS NFX f ormulation in rabbit eye
6.4.2.15 Ocular pharmacokinetic study
Ocular pharmacokinetic study
The optimized thermosensitive ISGS and eye drops were subjected to in vivo
studies to determine drug levels in aq. humor. The calibration curve profile of LFX,
OFX and NFX is depicted in Fig. 6.64, 6.66 and 6.68 resp. Fig.6.65, 6.67 and 6.69
shows HPLC chromatograms of Levofloxacin hemihydrates,

152
OFX and NFX in rabbit aq. humor, retention time was found to 2.48 min, 3.11 min
and 2.66 min resp. Table 6.27 shows the aq. concentration of the drug at each
sampling interval for eye drops of each drug and P1, P4 and P7 formulations. The plot
of the concentration in aq. humor vs. time is shown in Fig. 6.70.
Fig. 6.64 Calibration curve of LFX by HPLC
Fig. 6.65 Chromatogram of LFX (P1) IS gel in aq. humor by HPLC
-41.000
-10.600
19.800
50.200
80.600
111.000
0.00 1.00 2.00 3.00 4.00 5.00 6.00 7.00 8.00 9.00 10.00
[mAU]
[min]
2.4
8
Ite
m 2

153
Fig. 6.66 Calibration curve of OFX by HPLC
Fig. 6.67 Chromatogram of OFX (P4) IS gel in aq. humor by HPLC
-3.000
0.200
3.400
6.600
9.800
13.000
0.00 1.00 2.00 3.00 4.00 5.00 6.00 7.00 8.00 9.00 10.00
[mAU]
[min]
3.1
1
Ite
m 6

154
Fig. 6.68 Calibration curve of NFX by HPLC
Fig. 6.69 Chromatogram of NFX (P7) IS gel in aq. humor by HPLC
-7.000
2.200
11.400
20.600
29.800
39.000
0.00 1.00 2.00 3.00 4.00 5.00 6.00 7.00 8.00 9.00 10.00
[mAU]
[min]
2.6
6

155
Table 6.27 Aq. humor concentration vs time
Sr.
No.
Time
(Hr)
Concentration (µg/ml)
P1 Marketed
LFX eye
drops
P4 Marketed
OFX eye
drops
P7 Marketed
NFX eye
drops
1 0 0 0 0 0 0 0
2 0.5 2 2 1.8 1.5 1 0.9
3 1 4 2.5 3.3 2.2 1.4 1.1
4 2 3.8 2 3.1 1.8 1.2 0.9
5 3 3.5 1.5 3 1.2 0.9 0.5
6 4 3 0.8 2.5 0.6 0.7 0.3
7 5 2 0.5 2.2 0.3 0.6 0.1
8 6 1.8 0.3 2 0.1 0.5 0.07
Fig. 6.70 Plot of aq. humor concentration vs time

156
Data Analysis:
Pharmacokinetic parameters were determined by non-compartmental
analysis.
The maximum aq. humor concentration (Cmax) and time (Tmax) of it
occurrence were directly computed from the plasma concentration vs. time
plot.
The elimination rate constant (Kel) was determined from the terminal
phase of the log aq. humor concentration vs. time study and was calculated as
Kel = 2.303 x slope.
The elimination half-life was calculated using the formula 0.693/Kel.
The area under the curve (AUC) was calculated from the aq. humor
concentration vs. time study by trapezoidal method.
Table: 6.28 Pharmacokinetic parameters of optimized IS gel and maketed
eye drops
Formulation
Code
Tmax
(hr)
Cmax
(μg/ml)
t1/2
(hr)
AUC
(µg/ml/hr)
Kel (hr-1
)
P1 1 4.0 3.709 17.2 0.1868
Marketed LFX eye drops 1 2.5 1.46 7.82 0.4743
P4 1 3.3 3.820 14.62 0.1814
Marketed OFX
eye drops
1 2.2 0.959 6.35 0.7226
P7 1 1.4 3.166 5.2 0.2188
Marketed NFX
eye drops
1 1.1 1.0933 3.1 0.6383

157
Fig. 6.71 Comparison of area under curve (µg/ml/hr) in aq. of optimized IS
gel formulations and marketed eye drop
The pharmacokinetic parameters are shown in Table 6.28. The Cmax of marketed
eye drop formulation of LFX, OFX and NFX was found be 2.5, 2.2 and 1.1 μg/ml
respectively. The corresponding Tmax was 1.0 hr. The Cmax of P1, P4 and P7
formulations were 4.0, 3.3 and 1.4 μg/ml respectively and the corresponding Tmax was
1.0 hr for all the three formulations. Drainage is very rapid and generally limits ocular
contact at the site of absorption to about 3-10 minutes. However, the lag time (the
time for drug to transverse the cornea and appear in the aq. humor) is sufficiently long
to extend time to maximal concentration in the aq. to between 20 and 60 minutes for
most drugs. The MIC90 of LFX, OFX and NFX is in the range of ≤0.25-2µg/ml, for
most of the susceptible microorganisms [152]. As shown in Fig. 6.70, the MIC90 of
drug in aq. humor was obtained by ISG formulation and was maintained upto study
duration of 6 hr. In the marketed eye drops solution, there is rapid increase in drug
concentration and then drop down after some time. Cmax of ISGS viz. P1, P4 and P7
0 5 10 15 20
P1
LFX Marketed eye drops
P4
OFX Marketed eye drops
P7
NFX Marketed eye drops
Area (µg/ml/h)

158
was found to be 1.6, 1.5 and 1.3 times higher than marketed eye drops solution
respectively at the similar Tmax of 1 hr. Fig. 6.71 shows comparison of area under
curve in aq. of optimized thermosensitive IS gel formulations and marketed eye drop.
The AUC0-360min of LFX is more than OFX and NFX. The results indicate the
significant permeation of LFX than OFX and NFX. Also the IS gel formulation
showed more AUC0-360min than their respected marketed eye drop formulations. The
more AUC0-360min of IS gel formulations is because of increased contact time in the
eye. The developed IS gel formulations improved contact time, there by improved
bioavailability of drug as proved by drug aq. humor concentrations.
6.4.2.16 Stability Studies
Stability of the prepared formulation from the period of manufacturing to its
usage is very important. Selected sterilized formulations viz. P1, P4 and P7 were
stored at 5±3oC and 30±2
oC/65% RH ±5% RH for duration of 90 days. The
formulations were evaluated at periodic intervals for assay, clarity, pH, liquid–gel
conversion and transcorneal permeation study (Table 6.29). No significant change
was observed. The optimized systems of LFX, OFX and NFX are ISG based on
thermogelation, gels at 33-34oC. The formulation should be stored at cool conditions
or below 25oC. At these storage conditions (cool place) the developed systems
remains in the form of clear solution. As degradation is less than 5 percent,
approximate shelf life of 24 months can be allotted to the optimized formulations
[126].The rate constant of decay was determined by plotting the log of % drug
remaining vs time for P1, P4 and P7 respectively (Fig. 6.72 to 6.74) using Arrhenius
plot according to first order kinetics. The degradation rate constants were calculated
from slopes of the straight line.

159
Table: 6.29 Drug content and permeation data during stability studies
For
mul
atio
n
Storage
conds.
Parameters evaluated
15 days 30 days 60 days 90 days
Drug
Conte
nt
%CD
R
(6Hr)
Drug
Conten
t
%CD
R
(6Hr)
Drug
Conten
t
%CD
R
(6Hr)
Drug
Conten
t
%CD
R
(6Hr)
P1 5±3oC 99.9±
0.20
96.46±
0.52
99.6±
0.55
95.40±
0.32
99.5±
0.7
94.79±
0.72
99.0±
0.68
94.50±
0.72
30°C,
65%RH
±5% RH
99.90±
0.60
95.00±
0.74
99.5±
0.55
94.40±
0.60
99.0±
0.68
94.00±
0.38
98.0±
0.36
93.00±
0.58
P4 5±3oC 99.50±
0.40
94.26±
0.44
99.0±
0.40
93.06±
0.84
98.19±
0.10
92.76±
0.34
97.19±
0.10
92.26±
0.39
30°C,
65%RH
±5% RH
99.00±
0.90
93.00±
0.88
98.50±
0.10
93.00±
0.84
97.00±
0.30
92.89±
1.04
96.00±
0.50
90.66±
0.30
P7 5±3oC 99.93±
0.15
80.55±
1.03
99.03±
0.11
79.25±
1.33
98.93±
0.15
79.05±
0.93
97.73±
0.35
78.25±
0.83
30°C,
65%RH
±5% RH
99.53±
0.15
77.95±
1.03
98.03±
0.12
77.25±
1.0
97.73±
0.18
76.65±
0.90
97.00±
0.15
75.85±
0.53
Table: 6.30 Degradation rate constant (K) data during stability studies
Temperature
Degradation rate constant (K)
P1 P4 P7
5±3oC 1.5 ×10
-4 3.0 ×10
-4 2.6 ×10
-4
30°C and
65%RH±5% RH
2.3 ×10 -4
5.3 ×10 -4
4.6×10 -4

160
Fig. 6.72 Log of % drug remaining for P1 vs time
Fig. 6.73 Log of % drug remaining for P4 vs time
1.99
1.992
1.994
1.996
1.998
2
0 20 40 60 80 100
Log o
f %
dru
g r
emain
ing
Time (days)
5 degree C
30 degree C
1.975
1.98
1.985
1.99
1.995
2
2.005
0 20 40 60 80 100
Log o
f %
dru
g r
emain
ing
Time (days)
5 degree C
30 degree C

161
Fig. 6.74 Log of % drug remaining for P7 vs time
1.984
1.986
1.988
1.99
1.992
1.994
1.996
1.998
2
2.002
0 20 40 60 80 100
Lo
g o
f %
dru
g r
ema
inin
g
Time (days)
5 degree C
30 degree C