Embed Size (px)
Citation preview

i
PREFORMULATION STUDIES OF CYPERUS
ESCULENTUS STARCH USED AS DISINTEGRANT AND
AS BINDER IN THE PRODUCTION OF PARACETAMOL
TABLETS
By
OKWUCHUKWU-MADUKA, HAPPINESS CHINWEOLU
PG/M. PHARM/09/51272
Department of Pharmaceutics
Faculty of Pharmaceutical Sciences
UNIVERSITY OF NIGERIA, NSUKKA
MARCH, 2014

ii
CERTIFICATION
Okwuchukwu-Maduka, Happiness Chinweolu, a postgraduate student in the
Department of Pharmaceutics with Registration number PG/M.
PHARM/09/51272, has satisfactorily completed the Master of Pharmacy in
Physical Pharmaceutics. The work embodied in this dissertation is original and
has not been submitted in part or full for any other diploma or degree in this or
other university.
__________________ ____________
Professor. K. C. Ofokansi Date
H.O.D/ Supervisor
_________________ _____________
Professor. V. C. Okore Date
Supervisor
_________________ ________________
External Examiner Date

iii
DEDICATION
This work is dedicated to the loving memory of my late dad, Mr. Sunday
Nwaduruoha Madubuike who supported me greatly in the course of this research
though never lived to see the end of it. May his gentle soul rest peacefully in the
bossom of the Lord.
iv
ACKNOWLEDGEMENT
I am grateful to the Almighty God for His mercies that brought me this far. To
Him are all glory, praise, honor and thanks.
I am exceedingly grateful to my supervisors, Professor Vincent C. Okore and
Professor K. C. Ofokansi who God used to make this dream a reality. They gave
the maximum co-operation and full attention needed in the course of this work,
despite their tight schedules. I thank them for their patience, understanding,
brilliant ideas and guidance at various stages of this work.
My sincere thanks also go to the management and staff of the Department of
Pharmaceutics and Department of Pharmaceutical Chemistry, Nnamdi Azikiwe
University, Awka for their assistance and co-operation.
My immeasurable gratitude goes to my mum, Mrs. Umunneoma Madubuike for
her wonderful support in the course of this research. I also thank my siblings,
Ihuu, Okey, Emy and Ejy, who were sources of encouragement to me
throughout the period of this research. I also thank my in-law, Mr Izuu
Onyebuchi for being there in the face of various odds. My prayer for them is
that my God will reward them and take them to greater heights. They have been
great.
I am indebted to my never tiring husband, Dr. Okwuchukwu Maduka, who is
always there through thin and thick. He is really God’s precious gift to me. I
could not have married a better husband. I appreciate his overwhelming support,
advice, prayers and good wishes towards a successful completion of this study. I
pray that God will reward him beyond measures. I also thank my children,
Gosife, Gozie and Amara, for their patience throughout this period.

v
To everyone who contributed in one way or the other to making this work a
success, I can never thank them enough. May the good Lord reward all of them
immensely.
vi
ABSTRACT
Starch is a naturally occurring polymer found in parts of the plants such as leaves, stems, tubers, and fruits. It is a commonly used excipient in pharmaceutical formulations because of its availability, affordability and inertness. Cyperus esculentus (tiger nut) is widely cultivated in the country especially in the northern part of Nigeria. Until recently, the use of tiger nut had been limited to food products and few pharmaceutical applications. This research is aimed at characterizing the starch isolated from Cyperus esculentus tubers, ascertaining its use as a binder and disintegrant in paracetamol tablet formulations, and to compare it with corn starch BP. Cyperus esculentus tubers, paracetamol powder, corn starch, gelatin, talc, magnesium stearate, and sodium benzoate were used for the study. Starch was isolated from Cyperus esculentus tubers. Physicochemical tests such as determination of densities, viscosity, pH, ash value, loss on drying, paste clarity, freeze thaw stability, browning and charring temperatures were done on the starch. Wet granulation method of tablet formulation was used to prepare paracetamol granules. The granules produced were characterized and then compressed into tablets. The formulated tablets were evaluated for various tablet properties such as hardness, thickness, friability, weight variation, disintegration time, dissolution rate as quality control measures. The physicochemical properties of starch from Cyperus esculentus were found to conform to BP standards for pharmaceutical grade starch. Results obtained from micromeritic studies such as angle of repose of 58.74 o, compressibility index of 16.0 % and Hausner’s quotient of 1.19 revealed that Cyperus esculentus is a poorly flowing powder. Paracetamol granules produced had good flowability as shown by angle of repose being < 50 o, Hausner’s quotient of <1.19 except for two batches that were 1.21 and 1.22. The values of compressibility indices ranged from 6.64 to 20.85 with most of the values falling below 16.0%. Evaluation of tablets showed that all batches passed the uniformity of weight test. The hardness of tablets was significantly affected by the binder concentration used in the formulation. The disintegration times were significantly affected by the concentration, method of incorporation and the type of disintegrant used. Friability values (< 1.0) obtained were within acceptable limits. The dissolution results showed that all batches of tablets released 80 % of the drug in the simulated gastric fluid (SGF) without enzymes, within 30 min. Drug release in the simulated intestinal fluid (SIF) without enzymes was less than 80% in 30 min. It can be concluded that Cyperus esculentus starch has acceptable powder properties, and provides excellent disintegrant (as shown by disintegration time of < 15 minutes) and binding properties in paracetamol tablet, without compromising drug release characteristics.
vii
TABLE OF CONTENTS
Title Page ---------------------------------------------------------------------------------- i
Dedication ---------------------------------------------------------------------------------ii
Certification ------------------------------------------------------------------------------iii
Acknowledgement -----------------------------------------------------------------------iv
Abstract-------------------------------------------------------------------------------------v
Table of Contents ------------------------------------------------------------------------vi
List of Tables -------------------------------------------------------------------------- xiv
List of Figures ---------------------------------------------------------------------------xv
CHAPTER 1: INTRODUCTION
1.1 Background -----------------------------------------------------------------------1
1.2 Starch ------------------------------------------------------------------------------1
1.2.1 Sources of Starch ------------------------------------------------------------------2
1.2.2 Extraction and Purification of Starch -------------------------------------------3
1.2.3 Pharmaceutical Uses of Starch ---------------------------------------------------3
1.3 Cyperus esculentus ----------------------------------------------------------------5
1.3.1 Cyperus esculentus starch---------------------------------------------------------7
1.4 Tablet Dosage Forms -------------------------------------------------------------7
1.4.1 Types of Tablets -------------------------------------------------------------------8
viii
1.4.2 Tabletting Methods -------------------------------------------------------------9
1.4.2.1 Wet Methods ---------------------------------------------------------------------9
1.4.2.2 Dry Methods --------------------------------------------------------------------11
1.4.3 Advantages of Compressed Tablets ------------------------------------------11
1.4.4 Components of Tablets-------------------------------------------------------- 12
1.5 Excipients------------------------------------------------------------------------12
1.5.1 Bulking Agents/ Diluents------------------------------------------------------12
1.5.2 Binders--------------------------------------------------------------------------13
1.5.2.1 Classification of Binders Based on Origin --------------------------------15
1.5.2.2 Classification of Binders Based on Method of Application-------------15
1.5.2.3 Advantages of Natural Binders --------------------------------------------15
1.5.2.4 Disadvantages of Natural Binders -----------------------------------------16
1.5.2.5 Factors That Affect the Efficiency of Binding Agents -----------------16
1.5.3 Disintegrants-------------------------------------------------------------------17
1.5.3.1 Examples of Common Disintegrants-------------------------------------18
1.5.3.2 Mechanism of Action of Disintegrants----------------------------------22
1.5.3.3 Characteristics of an Ideal Disintegrant----------------------------------24
1.5.3.4 Factors That Affect Disintegrant Efficiency-----------------------------24
1.5.3.5 Methods of Incorporation of Disintegrants--------------------------------26
1.5.4 Lubricants---------------------------------------------------------------------27
1.5.5 Glidants-------------------------------------------------------------------------28

ix
1.5.6 Flavours and Sweetners--------------------------------------------------------28
1.5.7 Colourants ------------------------------------------------------------------------29
1.6 Preformulation Studies ---------------------------------------------------------30
1.6.1 Preformulation Parameters to be Considered in Tablet
Formulations ---------------------------------------------------------------------31
1.6.2 Factors to be Considered Before a Formal Preformulation
Programme ------------------------------------------------------------------------34
1.7 Objectives of the Study ----------------------------------------------------------34
CHAPTER 2: EXPERIMENTAL
2.1 Materials ---------------------------------------------------------------------------35
2.2 Methods-----------------------------------------------------------------------------36
2.2.1 Isolation of Starch from Tubers of Cyperus esculentus ---------------------36
2.2.2 Characterization of Cyperus esculentus Starch -----------------------------36
2.2.3 Preparation of Simulated Gastric Fluid (SGF) -----------------------------38
2.2.4 Preparation of Simulated Intestinal Fluid (SIF) -----------------------------38
2.2.5 Preparation of Sodium Chloride Peptone Buffer ----------------------------38
2.2.6 Preparation of Soya Bean Casein Digest Agar Medium ------------------38
2.2.7 Preparation of Saboraud Dextrose Agar (SDA) ----------------------------39
2.2.8 Preparation of Lactose Broth Medium ---------------------------------------39

x
2.2.9 Evaluation of Physicochemical Properties of Cyperus
esculentus Starch---------------------------------------------------------------39
2.2.9.1 Determination of Density -----------------------------------------------------39
2.2.9.2 Determination of Viscosity --------------------------------------------------40
2.2.9.3 Swelling Studies ---------------------------------------------------------------40
2.2.9.4 Micromeritics ------------------------------------------------------------------43
2.2.9.5 Loss on Drying ----------------------------------------------------------------44
2.2.9.6 Freeze Thaw Stability --------------------------------------------------------44
2.2.9.7 Paste Clarity -------------------------------------------------------------------45
2.2.9.8 Browning and Charring Temperatures -------------------------------------45
2.2.9.9 Gelatinization Temperature --------------------------------------------------45
2.2.9.10 Ash Value ---------------------------------------------------------------------46
2.2.9.11 Hydrogen Ion Concentration (pH) ----------------------------------------46
2.2.9.12 Foam Capacity ---------------------------------------------------------------46
2.2.9.13 Emulsion Capacity ----------------------------------------------------------47
2.2.9.14 Moisture Content -----------------------------------------------------------47
2.2.9.15 Morphology and Surface Area ---------------------------------------------47
2.2.10 Phytochemical Studies -------------------------------------------------------47
2.2.11 Elemental Analysis of Cyperus esculentus Starch -----------------------49
2.2.12 Thermal Analysis -------------------------------------------------------------49

xi
2.2.13 Amylose/Amylopectin Ratio of Cyperus esculentus Starch---------49
2.2.14 Microbiological Assay ---------------------------------------------------51
2.2.15 Dextrose Equivalence of Cyperus esculentus Starch ---------------51
2.2.16 Physical Compatibility Studies -----------------------------------------52
2.2.17 Formulation of Paracetamol --------------------------------------------52
2.2.17.1 Granulation Procedures---------------------------------------------------52
2.2.17.2 Micromeritic Properties of Paracetamol Granules---------------------55
2.2.17.3 Blending With Lubricant and Glidant ----------------------------------57
2.2.17.4 Compression of Paracetamol Granules into Tablets ------------------58
2.2.18 Evaluation of Paracetamol Tablet Properties -------------------------58
2.2.18.1 Appearance ---------------------------------------------------------------58
2.2.18.2 Dimensions ---------------------------------------------------------------58
2.2.18.3 Weight Variation ---------------------------------------------------------58
2.2.18.4 Resistance to Abrasion ---------------------------------------------------58
2.2.18.5 Crushing Strength & Tensile Strength --------------------------------59
2.2.18.6 In vitro Disintegration Time --------------------------------------------59
2.2.18.7 In vitro Dissolution / Drug Release Profile --------------------------60
2.2.18.8 Calibration Curve of Paracetamol --------------------------------------61
2.2.18.9 Density of Tablets---------------------------------------------------------61
2.2.18.10 Crushing Strength, Friability, Disintegration Time Ratio-----------62
2.3 Statistical Analysis-------------------------------------------------------62
xii
CHAPTER 3: RESULTS AND DISCUSSION
3.1 Identification of Cyperus esculentus Starch --------------------------------63
3.2 Percentage Yield of Starch-----------------------------------------------------64
3.3 Some Physicochemical Properties -------------------------------------------65
3.4 Freeze Thaw Stability -------------------------------------------------------- 69
3.5 Clarity ----------------------------------------------------------------------------69
3.6 Phytochemicals Present --------------------------------------------------------71
3.7 Elemental Composition -------------------------------------------------------71
3.8 Thermal Properties -------------------------------------------------------------72
3.9 Microbial Load -----------------------------------------------------------------73
3.10 Dextrose Equivalence----------------------------------------------------------73
3.11 Effect of Temperature on Solubility -----------------------------------------74
3.12 Effect of Temperature on Swelling Power----------------------------------75
3.13 Effect of pH on Extent of Swelling ---------------------------------------76
3.14 Effect of Electrolytes on Extent of Swelling -------------------------------78
3.14.1 Monovalent Electrolyte -------------------------------------------------------78
3.14.2 Divalent Electrolyte -----------------------------------------------------------79
3.15 Characteristics of Granules Produced ---------------------------------------80
3.16 Appearance of Produced Tablets ---------------------------------------------85
xiii
3.17 Drug- excipient Compatibility----------------------------------------------85
3.18 Properties of Tablets----------------------------------------------------------88
3.18.1 Weight Uniformity-----------------------------------------------------------88
3.18.2 Crushing Strength, Friability, in vitro Disintegration Time
(Cs/Fr/DT) ratios-------------------------------------------------------------90
3.18.3 Drug Content -----------------------------------------------------------------92
3.18.4 Drug Release Data-----------------------------------------------------------97
3.18.5 Tensile Strength --------------------------------------------------------------98
3.18.6 Density, Packing Fraction and Porosity ----------------------------------99
CONCLUSION, SUMMARY AND RECOMMENDATIONS
4.1 Conclusion ----------------------------------------------------------------------101
4.2 Summary and Recommendations--------------------------------------------102
Glossary
References
Appendices

xiv
LIST OF TABLES
Table 1 Table Showing Drug-Excipient Admixtures----------------------------53
Table 2 Formula for Paracetamol Tablets Using starch as Disintegrant-----53
Table 3 Formula for Paracetamol Tablets Using Starch as Binder------------56
Table 4 Results of Identification Tests of Cyperus esculentus and
Corn Starch-----------------------------------------------------------------63
Table 5 Some Physicochemical Properties of Cyperus esculentus and
Corn Starch -----------------------------------------------------------------65
Table 6 Percentage of Water Separated After Six Freeze Thaw Cycles------69
Table 7 Percentage of Light Transmitted Through Different
Concentration of Cyperus esculentus Starch Paste--------------------69
Table 8 Phytochemicals Present in Cyperus esculentus Starch----------------71
Table 9 Elemental Composition of Cyperus esculentus and Corn Starch---71
Table 10 Characteristics of Granules Produced ----------------------------------82
Table 11 Table Showing Tablet Mean Weight, Standard Deviation and
Percentage Deviation of the Tablets Produced ------------------------88
Table 12 Crushing Strength, Friability and Disintegration Time
Ratio of the Tablets -------------------------------------------------------90
Table 13 Table Showing Area Under Dissolution Curve at Different
Time intervals and Dissolution Efficiency-----------------------------97
Table 14 Hardness, Thickness, Diameter and Tensile Strength of Tablets----98
Table 15 Densities, Packing Fraction and Porosity of Tablets -----------------99

xv
LIST OF FIGURES
Fig 1 Photomicrograph of Cyperus esculentus Starch Grains ----------------68
Fig 2 DSC Thermograms of Cyperus esculentus Starch--------------------------72
Fig 3 Effects of Temperature on Solubility of Cyperus
esculentus and Corn Starch in Water-----------------------------------------74
Fig 4 Effect of Temperature on Swelling Power of
Cyperus esculentus and Corn Starch in Water ------------------------------75
Fig 5 Effect of pH on Extent of Swelling of Cyperus esculentus
Starch------------------------------------------------------------------------------77
Fig 6 Effect of Monovalent Electrolyte on Extent of Swelling of
Cyperus esculentus starch------------------------------------------------------78
Fig 7 Effect of Divalent Electrolyte on Extent of Swelling of
Cyperus esculentus Starch------------------------------------------------------79
Fig 8 Percentage Size Distribution of Paracetamol Granules
With Disintegrant Incorporated Intra Granularly---------------------------83
Fig 9 Percentage Size Distribution of Paracetamol Granules
With Disintegrants Incorporated Extra Granularly ------------------------83
Fig 10 Percentage Size Distribution of Paracetamol Granules
With Disintegrants Incorporated Intra-Extra Granularly------------------84
Fig 11 Percentage Size Distribution of Paracetamol Granules
With Starch Incorporated as Binder------------------------------------------84
Fig 12 DSC Thermogram of Pure Paracetamol-------------------------------------86
Fig 13 DSC Thermogram of Paracetamol with 5% Cyperus
esculentus Starch---------------------------------------------------------------86
Fig 14 DSC Thermogram of Paracetamol Tablet with 7.5%
Cyperus esculentus Starch as Binder ----------------------------------------87
Fig 15 Drug Release Profile of Paracetamol Tablets in SGF with
Disintegrants Incorporated Intra-Extra Granularly-------------------------92

xvi
Fig 16 Drug Release Profile of Paracetamol Tablets in SGF with
Disintegrants Incorporated Intra Granularly-------------------------------92
Fig 17 Drug Release Profile of Paracetamol Tablets in SGF with
Disintegrants Incorporated Extra Granularly------------------------------93
Fig 18 Drug Release Profile of Paracetamol Tablets in SGF with
Starch as Binder---------------------------------------------------------------93
Fig 19 Drug Release Profile of Paracetamol Tablets in SIF with
Disintegrants Incorporated Intra- Extra Granularly -------------------94
Fig 20 Drug Release Profile of Paracetamol Tablets in SIF with
Disintegrants Incorporated Intra Granularly ---------------------------94
Fig 21 Drug Release Profile of Paracetamol Tablets in SIF with
Disintegrants Incorporated Extra Granularly --------------------------95
Fig 22 Drug Release Profile of Paracetamol Tablets in SIF with
Starch as Binder-------------------------------------------------------------95
xvii
CHAPTER ONE
INTRODUCTION
1.1 BACKGROUND
Excipients are pharmacologically inactive substances included in formulations
to serve as a carrier for the active ingredients (1). Excipients can also be seen as
compounds or materials which do not possess any health benefit but help in the
manufacturing or processing of pharmaceutical formulation (2). They are
additives used to convert active pharmaceutical ingredients into suitable dosage
forms. Classes of excipients used in tablet formulations include disintegrants,
binders, diluents/fillers, lubricants, and glidants.
Excipients can be of either natural or synthetic origin. Those of natural origin
are of particular interest to formulation scientists because of their reliability and
sustainability. Plant products are therefore attractive alternatives to synthetic
products because of biocompatibility, low toxicity, environmental friendliness
and low price, compared to synthetic products. Excipients from natural sources
are also generally non-polluting renewable sources for the sustainable supply of
cheaper pharmaceutical products (3, 4)
In recent years, natural substances, such as starch have evoked tremendous
interest due to their diverse pharmaceutical application as diluents, binders,
disintegrants and lubricants in tablets. There is, therefore, need to continually
source these excipients from plants. This will not only ensure that they are
obtained at lower cost, but will ultimately reduce the cost of manufacture when
such products are used. They will also provide alternatives to currently available
excipients.
1.2 STARCH
Starch is a polysaccharide of glucose. This biopolymeric material is a naturally
abundant carbohydrate found chiefly in seeds, leaves, roots, fruits, tubers and

xviii
stem piths of plants.(6). It is a natural polymer that is most easily and readily
available. It is a white amorphous tasteless powder. Starch contains amylose
and amylopectin. Both polysaccharides are based on anhydroglucose units
linked by D-(1, 4) glucosidic bonds. The proportion varies somewhat in
different starches but the ratio of amylose to amylopectin is usually about 1:4
(5).
Amylose (B-amylose) consists of a linear chain of 250 to 300 residues of 1, 4
linked, α-glucose arranged in the form of a helix. Amylopectin is also a polymer
of α-glucose residues but the macromolecule is built up of branched chains of
the glucose units linked in both the 1,4 and 1,6 positions. Starches can be
obtained from corn, potatoes, wheat, cassava, tiger nuts, rice, yam, ginger and
other sources. They vary widely in appearance according to their biological
origin. Therefore, a thorough investigation of the physicochemical properties is
warranted before they are used. Adebayo and Itiola evaluated the properties of
starch obtained from Colocasia esculenta and Artocapus cummunis ( 7 ).
Starch has a wide range of uses in our daily life. These include its use as food
ingredients and pharmaceutical excipients. Starch is used in a variety of
industries including food, textiles, plastics, adhesives, paper, and cosmetics (6).
1.2.1 SOURCES OF STARCH
Sources of starch include the following:
(a) Root tubers: cassava, yam, and sweet potato.
(b) Stem tubers: tiger nut, ginger, and carrot.
(c) Cereals: rice, corn, millet, wheat, guinea corn, and sorghum.
(d) Tree crops: mango, breadfruit, guava, and jackfruit.
(e) Legumes: groundnut, soybeans, and cowpeas.

xix
(g) Herbs/Shrubs: banana, plantain, and amaranthus.
1.2.2 EXTRACTION AND PURIFICATIONS OF STARCH
Starch from any part of the plant needs to be extracted and purified to minimize
contamination. Various laboratory methods have been used to isolate starches
from their sources. The methodologies differ with respect to the media/solvent
to be used for extraction. These involve steeping, defatting, deproteinisation,
recovery of starch by centrifugation among others.
1.2.3 PHARMACEUTICAL USES OF STARCH
Starch is one of the most frequently used excipients in pharmaceutical
formulations. It is one of the safest excipients and it is included in the GRAS
(Generally Regarded as Safe) list of the World Health Organization (2).
Starches from various sources have been widely used for various purposes in
pharmaceutical formulations (2). In the pharmaceutical industry, starches may
be employed as binders, disintegrants, diluents (filler), lubricant, and glidants
(6, 8).
They are biodegradable and have a long tradition of use as excipients in drug
formulation. It is also used as coating and dusting media for various types of
tablet coating, such as sugar and enteric coating (8). Starches are also used for
the production of micro-particles for delivery of proteins (9). Starch micro-
particles have been used for the delivery of vaccines administered orally and
intramuscularly (10).
Starch is the oldest and most commonly used disintegrant (2, 11). A disintegrant
is an excipient added to a tablet formulation to cause the tablet to break apart or
disintegrate after administration (12). At 5 – 15 % concentration, starches are
applicable as disintegrants in a number of tablet formulations (1, 13). Starch has
been chemically modified. Starch derivatives, such as sodium starch glycollate,
possess excellent disintegrating property. Pregelatinised starch is also employed

xx
in tablet formulation as a disintegrant in 5% concentration (1). Acid
modification of starch enhances its disintegrant action (11).
Starches have been used as excellent binders either as mucilage or in dry
powdered form (14). The most common binder used in tablet granulation is
starch paste (2). The gelling property of starch is responsible for the binding
property. Mainly 2-10 % w/v solution of starch is used as tablet binder (2).
Amylose portion of starch is responsible for its gelling as well as binding
property (2). In tablet formulations, freshly prepared starch paste is used at a concentration of 5–10 %, depending on the starch type as a binder for wet
granulation. The required binder ratio should be determined by optimization
studies, using parameters such as tablet friability and hardness, disintegration
time, and drug dissolution rate (15).
The use of Dioscorea rotundata starch as a binder and disintegrant in tablet
formulation has been investigated (16). Itiola also investigated the
compressional properties of this particular starch. (17). The effect of pigeon pea
and plantain starches in the compressional, mechanical and disintegration
properties of paracetamol tablets have been investigated. (13).
The role of ginger starch as binder in acetaminophen tablet was studied by
Ibezim et al. (14). Pregelatinized starch is also used as a binder (17, 18).
Starch is used as a diluent in pharmaceutical preparations. Diluents are used to
increase the bulk of the dosage form. This is done in a situation where the
active constituent to be incorporated in the formulation is of less quantity
(1). As a diluent, starch is used for the preparation of standardized triturates of
colorants, potent drugs, and herbal extracts, facilitating subsequent mixing or
blending processes in manufacturing operations (15). Starch is also used in dry-
filled capsule formulations for volume adjustment of the fill matrix, and to
improve powder flow, especially when using dried starches (15). Starch in
concentrations of 3–10 % w/w can be used as anti-adherent and lubricant in

xxi
tablet and capsule filling (15).Starch can be used as nanoparticles. Starch based
nanoparticles have been used for the transdermal delivery of the drugs such as
flufenamic acid, testosterone and caffeine (2). Encapsulation and release
properties of these nanoparticles were studied, showing high encapsulation
efficiency for three tested drugs; flufenamic acid, testosterone and caffeine (2).
The skin permeation data for the three drugs suggest that starch nanoparticles
have potential for transdermal drug delivery applications.
Starch is also used in topical preparations. It is widely used in dusting powders
for its absorbency. It is also used as a protective covering in ointment
formulations applied to the skin. Starch mucilage can be applied to the skin as
an emollient. It is used as a base for enemas, and has been used in the treatment
of iodine poisoning (19). Therapeutically, rice starch-based solutions have been
used in the prevention of dehydration due to acute diarrheal diseases (20).
1.3 Cyperus esculentus (TIGER NUT)
The plant falls into the following taxonomical classification:
Division : Magnoliophyta
Class : Liliopsida
Order : Cyperalis
Family : Cyperaceae
Genus : Cyperus
Species : esculentus
The plant is a perennial rhizome that originated from South Europe. Tiger nut is
really not a nut but a small tuber. It was first discovered some 4000 years ago in
ancient Egypt, and is cultivated in China, Spain, and West Africa (21). Tubers
grow to heights of 24 to 55 cm tall. The stems are three sided and triangular in

xxii
cross-section while the leaves are yellow to green in colour with a distinct ridge.
The tuber is between 0.3 - 1.9 cm in diameter and the colour varies between
yellow, brown and black (22). Tiger nut tubers are edible with a slightly sweet,
nutty flavour. They are commonly seen in the northern part of Nigeria.
The local names are Aya (Hausa), Akiawusa (Igbo), and Tiger nut (English),
Chufa (Spanish). It has many descriptions such as Zulu nut, yellow nut grass,
ground almond, edible rush nut, earth chest nut, and edible ganglinate. There are
yellow and black species of Cyperus esculentus. Tiger nut is a perennial herb of
both the tropics and temperate regions of the world. It can be found growing
naturally as weed but can also be commercially cultivated. It produces rhizomes
and small spherical tubers or nuts (23). The stems are three-sided and triangular
in cross-section while the leaves are yellow to green in colour with a distinct
ridge. The tubers of this plant have high starch content and the starch is
comparable to cassava and rice starch in terms of their morphology (6). Starch
obtained from tiger nut may serve as a good source of excipient in the
pharmaceutical industry.
The nut is very rich in energy content and minerals. Typically, 100 g of tiger nut
contains 386 kcal, 7 % protein, 26 % fat, 31 % starch and 21 % glucose. They
contain 26 % fiber of which 14 % is non-soluble and 12 % is soluble (24).
The starch of Cyperus esculentus can potentially be extracted and purified for
industrial uses. For instance, it has been suggested as a potential oil crop for the
production of cholesterol (25). Until recently, utilization of tiger nuts has been
limited to food products and few pharmaceutical applications such as the use as
binder and diluents. Tiger nut was found to assist in reducing the risk of colon
cancer, heart attacks, and vascular thrombosis (26). It helps in preventing cancer
due to high content of soluble glucose. In Ayuverdic medicine, tiger nuts are
used in the treatment of flatulence, diarrhoea, dysentery, debility and
indigestion (27).The oil is rich in vitamin E which is an antioxidant that slows

xxiii
down ageing of body cells. It favours the elasticity of the skin and helps to
reduce skin wrinkles (28). It is therefore very useful in the cosmetic industry. It
is also believed that they help to activate blood circulation (29), relieve
indigestion especially when accompanied with halitosis, benefits nutritionists
and those seeking to reduce cholesterol or lose weight.
1.3.1 Cyperus esculentus STARCH
Research on extraction and physicochemical properties of tiger nut starch
revealed several characteristics, including uniform granular shape, which is
round and elliptical (6). Thermal and mechanical properties are similar to
common starches. Cyperus esculentus starch is a brilliant white, crystalline,
odourless, hygroscopic powder with bland taste and smooth texture (6, 23). The
starch has a uniform granular size, shape and morphology (6). The granule size
has been classified as large (> 25 μm ), medium ( 10-25 μm ), small ( 5-10 μm )
and very small ( < 5 μm ) (6). The starch size is similar to that of rice and
cassava (30). Radely indicated that the starch from Cyperus esculentus could be
used for many starch-based foods, cosmetic products, and fabric stiffening (31).
There is a predominance of divalent ions when compared with corn which has
more of monovalent ions.
1.4 TABLET DOSAGE FORM
In December 1843, a patent was granted to an Englishman, William
Brockendon for a machine that compressed powders to form compacts. This
very simple device consisted essentially of a hole (or die) bored through a piece
of metal within which the powders were compressed between two cylindrical
punches. One was inserted into the base of the die at a fixed depth; the other
was inserted at the top of the die and struck with a hammer. The invention was
first used to produce compacts of potassium bicarbonate and caught the
imagination of a number of pharmaceutical companies. Later, Welcome, in
xxiv
Britain, was the first company to use the term tablet to describe this compressed
dosage form which today accounts for some 70 % of all ethical pharmaceutical
preparations produced (32).
Tablets may be defined as solid pharmaceutical dosage forms containing drug
substances with or without suitable diluents and prepared by either compression
or molding method (33). The British Pharmacopoeia defined tablets as being
circular in shape with either flat or convex faces and prepared by compressing
medicaments or mixtures of medicaments, usually with added substances.
1.4.1. TYPES OF TABLETS
(i) Normal Release Tablets: These are tablets that are swallowed usually
with water. They are meant to disintegrate in the gastrointestinal tract
before effective absorption of the drug can take place. They are generally
referred to as uncoated tablets.
(ii) Lozenges or Troches: These are, by design, intended to dissolve slowly
in the mouth. They are to be held in the mouth while they dissolve
gradually so that the drug is in contact with the mouth and throat for a
prolonged period. This type of tablet can be used for the local effects of
antiseptics, astringents and local anaesthetic. Lozenges do not contain
disintegrants (34).
(iii) Sublingual or Buccal Tablets: They are tablets whose contents are
expected to be released in the oral cavity. They are usually small and flat-
shaped. They are administered by placing them between the cheek and
gum in the mouth. The active ingredient is released and absorbed from
the buccal cavity. An example of drug administered by this route is
glyceryl nitrate used for the treatment of angina pectoris.
xxv
(iv) Chewable Tablets: These are designed to be broken down rapidly in the
buccal cavity by the action of the teeth. Mannitol is a typical diluent in
chewable tablets. It has negative heat of solution, and produces a cooling
sensation in the mouth (35).
(v) Effervescent Tablets: These tablets are formulated to dissolve instantly
with the release of carbon IV oxide (CO2) on coming in contact with
water.
They have become increasingly used because of their rapid release of
medicament and reduced chances of gastric irritations. They contain
acetic acid or tartaric acid and bicarbonates and are formulated using
fusion method.
(vi) Coated Tablets: They are tablets that are either coated with sugars to
mask obnoxious taste or with polymers to protect them from
environmental factors such as light, mechanical damage, and product
identification. They enhance or produce modified release of the
incorporated drug.
(vii) Implants and Inserts: These are tablets or pellets implanted in the body
by incision. Hormones used in birth control are often produced as
implants which serve as depot from which the hormone is released slowly
over a prolonged period. They are usually implanted in the thigh. Inserts
include vaginal tablets that are usually compressed into a pear shape and
contain excipients which cause rapid release of drugs.
Tablets of Miscellaneous Use
They include dental corks and reagent tablets. Other types of tablets
include prolonged release tablets, solution tablets and dispersible tablets.
1.4.2 TABLETTING METHODS
xxvi
1.4.2.1 WET METHODS
These involve the use of binders and solvents in the formulation of tablets (33).
The wet methods include:
Wet granulation: This is the commonest and most popular method of tablet
production. It is essentially a process of particle size enlargement involving
several steps and the use of binders and solvents. The steps include weighing
and mixing, wet massing and screening, drying, dry-screening, lubrication and
compression. The solvents usually used are pure water, ethanol, or isopropanol,
either alone or in combination.
Spheronization: This is a rapid and flexible process where pharmaceutical
products are made into small spheres or spheroids (36). It is a form of wet
granulation. Spheronized products are relatively dense, of uniform shape and
size and have defined surface characteristics.The flow characteristics of spheres
make them suitable for transportation by most systems found in pharmaceutical
industry. Spheres provide the lowest surface area to volume ratio.
Consequently, pharmaceutical compounds can be coated with a minimum
coating material.
Spray drying: Spray drying is a process in which drug entities in solution or
suspension are sprayed with or without excipients into a hot stream of air so as
to generate dry or highly spherical particles (37, 38). This process continues
through series of stages whereby the viscosity of the droplets constantly
increases until the entire application medium is evaporated or solid particles are
obtained. Spray drying is a unique granulation technique that directly converts
liquids into dry granule. The advantages are the speed of forming granules and
drying can be a continuous process. Spray drying is suitable for heat and
moisture sensitive products. Granules prepared by spray drying technique are

xxvii
spherical, porous, and uniform in size with fewer sharp edges than those
produced by conventional granulation methods.
Fluidized granulation: This is the operation by which fine solids are
transformed into a fluid like state through contact with a gas (39). At certain gas
velocity, the fluid will support the particles giving them free mobility without
entrapment. Fluid bed granulation is a process by which granules are produced
in single equipment by spraying a binder solution onto a fluidized powder bed.
The material processed by fluid bed granulation are fine, free flowing and
homogeneous. The system involves the heating of air and then directing it
through the material to be processed (39). There are some documented
advantages of fluidized granulation. These include production of fines, free
flowing and homogenous granules, reduction of dust formation during
processing, and improvement of workers’ safety. However, it is labour intensive
and time consuming. There is difficulty in assurance of its reproducibility (39)
1.4.2.2 DRY METHODS
These are a methods used for drugs which do not compress well after wet
granulation or those which are sensitive to moisture (35).
Pre-compression/Dry granulation: In pre-compression, large tablets, known
as slugs are produced with a heavy duty machine. Alternatively, they are
squeezed between two rollers to produce a sheet of compressed material (roller
compaction). Lubricated portion of drug/excipient blend to be tabletted is
compressed to obtain slugs which are broken into granules using a mill fitted
with appropriate sieve. Aspirin and other drugs that are moisture-sensitive are
manufactured using this method.
Direct compression: In direct compression, the powder blend is compressed
directly without pre-treatment. The successful application of direct compression

xxviii
method is dependent on availability of suitable machinery and materials. This
method involves pre-mixing, lubrication and compression. Potassium chloride
and sodium chloride are good additions for direct compression.
1.4.3 ADVANTAGES OF COMPRESSED TABLETS
1. They enable accurate dosage of medicament to be simply administered
2. They are easy to transport in bulk and carried by the patients.
3. The tablet is a uniform final product with regards to weight. The product
is usually more stable than those prepared by a method involving the use
of water.
4. The release rate of the drug from the tablet can be designed to meet
desired pharmacological requirement.
5. Tablets can be mass produced simply and quickly and the resultant
manufacturing cost is therefore very much low when compared with other
dosage forms.
1.4.4 COMPONENTS OF TABLETS
Compressed tablets contain active ingredients with or without excipients. The
majority of tablets are not composed solely of the drug. Excipients are usually
added to achieve desired objectives. Active pharmaceutical ingredients include
substances or combination of substances present in a finished pharmaceutical
product, intended to furnish pharmacological activity or to, otherwise, have
direct effect in the diagnosis, cure, mitigation, treatment or prevention of
disease, or to have direct effect on restoring, correcting or modifying
physiological functions in human beings (40). It is the component of a tablet
that has pharmacological activity. A tablet may have one or more active

xxix
ingredients. It is also possible to have zero active ingredients as in placebo or
research tablets.
Excipients on the other hand are inactive ingredients used to make up a
medication (41).These are substance formulated alongside the active ingredient,
and they serve specific purposes in the formulation. Excipients used in
pharmaceutical preparations include bulking agents/diluents, binders,
disintegrants, lubricants, flavours, sweeteners, and colourants.
1.5 TABLET EXCIPIENTS
1.5.1 BULKING AGENTS/DILUENTS
Diluents, also known as fillers are used to increase the bulk volume of a tablet
or capsule (41). This is done in a situation where the active constituent to be
incorporated in the formulation is of less quantity (1). In tablet formulation, it is
not feasible to make tablets weighing less than 70 mg. Fillers are added in very
low strength in drugs that are available in micrograms.
By combining a diluent with the active pharmaceutical ingredients, the final
product is given adequate weight and size to assist in production and handling
(41).The amount of diluents that appear in the formulation is normally
determined by the strength of the drug and the nature and concentration of the
other ingredients in the formula.
Bulking agents used in tabletting should be stable over a long period of storage.
Diluents should be inert so as not to cause pharmacological activity of their own
(41). They should be compactable and of similar particle size as the active
ingredient. Diluents should also be non-hygroscopic so that the formulation
does not absorb significant amounts of moisture from its surroundings. Bulking
agents commonly used in tablet formulations include, lactose, corn starch,

xxx
mannitol and microcrystalline cellulose. Sucrose and mannitol are used as
diluents for chewable tablets.
1.5.2 BINDERS
Binders are agents employed to impart cohesiveness to the granules (11, 42).
They ensure that the tablets remain intact after compression and also improve
the flow qualities of granules. Binders impart plasticity and thus increase the
inter-particulate bonding strength within the tablet. Binders provide mechanical
strength to the tablets. They can be in powder form and liquid form (1). They
are mostly polymer materials that possess both cohesive and adhesive properties
(14).
Binders function by holding excipients and drug particles together so that after
mixing and/or granulation of the resultant mass, a hard granule or compact is
obtained on compression. They promote plastic deformation of particles and
increase the area of contact for inter-particulate bonding (42). This leads to the
formation of more solid bonds in the tablets. Binders form matrix with fillers
and drugs embedded in it. On drying, solid binders form glue which holds the
particle together. The wet binder is the most important ingredient in the wet
granulation process. Most binders are hydrophilic and soluble in water.
Binders are added as dry powders or in the form of solution or dispersion in a
suitable solvent usually water or ethanol (14, 17). Uniform distribution and the
amount of a binder employed in solution are critical. The choice of a particular
binding agent depends on the binding force required to form the granule and its
compatibility with other ingredients especially the active drug (14).Examples of
binder include starch, gelatin, hydroxypropylmethylcellulose,
sodiumcarboxymethylcellulose and polyvinylpyrrolidone.

xxxi
The development of new excipients for potential use as binding agents in tablet
formulation continues to be of interest. This is because different binding agents
can be useful in achieving various tablet mechanical strength and drug release
properties for different pharmaceutical purpose (43). Natural binders such as
starches, gums and mucilages, possess binding capacity as well as some other
properties such as disintegration, filling or sustained release. Dane et al(2006)
evaluated the effects of pigeon pea and plantain starches on the compressional,
mechanical and disintegration properties of paracetamol tablets (44). These
natural polymers were much safer and economical than polymers such as
polyvinylpyrrolidone. Freshly prepared starch paste at a concentration of 5-20%
is routinely employed as binder (45).
Starches from rice, potato, maize, wheat, tapioca and gums such as Ferula
gummosa, boiss, gum olibanum, beilschmiedia seed gum, okra gum, angle
marmelod gum, gum pectin ,show good potency as binding agents. Odeku and
Itiola (2002) characterized the use of khaya gum as binder in paracetamol tablet
formulation (46). Adebayo and Itiola (2002) also studied the effects of cocoyam
starch binders on fluidity and compressibility of paracetamol granules and the
mechanical properties of their tablets (47). Pregelatinized starch also functions
as a binder (17).
1.5.2.1 CLASSIFICATION OF BINDERS BASED ON THEIR
SOURCE/ORIGIN
(i) Natural polymers: These include starch, pre gelatinized starch, gelatin,
acacia, tragacanth and other gums.
(ii) Synthetic polymers: Polyvinylchloride (PVC),
hydroxypropylmethylcellulose (HPMC), methylcellulose, ethylcellulose,
polyethylene glycol, isopropyl alcohol.
xxxii
(iii) Sugars: glucose, sucrose, sorbitol
1.5.2.2 CLASSIFICATION OF BINDERS BASED ON METHOD OF
APPLICATION
(i) Solution binders: These are soluble in solvents such as water and
ethanol. They are used in wet granulation process. Examples include
gelatin, cellulose derivatives, polyvinylpyrollidone, starch, sucrose and
polyethylene glycol.
(ii) Dry Binders: These are added to the powder blend, either after a wet
granulation step or as part of a direct powder compression formula.
Examples include cellulose, methylcellulose, polyvinylpyrollidone and
polyethylene glycol.
1.5.2.3 ADVANTAGES OF NATURAL BINDER
1. Natural polysaccharides are widely used in the pharmaceutical and food
industry as excipients or additives due to their low toxicity,
biodegradability, availability and low cost.
2. They can be used to modify the release of drug, thereby influencing the
absorption and subsequent bioavailability of the incorporated drug.
3. They act as vehicles to transport the incorporated drug to the site of
absorption. This helps to ensure the stability of the incorporated drug,
precision and accuracy of the dosage form.
4. They improve organoleptic properties of the drug where necessary in
order to enhance patient adherence (48).
5. They optimize the performance of dosage forms during manufacture as
well as when ingested (49).
xxxiii
1.5.2.4 DISADVANTAGES OF NATURAL BINDERS
1. Polymer binders can lead to processing difficulty such as rapid over
granulation. Over time, they occasionally lead to tablet hardening and a
decrease in dissolution performance (40).
2. When polymer binder are chosen, the addition of strong disintegrants
such as super disintegrants is typically required. These are considerably
expensive and have a negative effect on product stability as well as film
1.5.2.5 FACTORS THAT AFFECT THE EFFICIENCY OF BINDING
AGENTS
(i) Type of binder: The type of binder used in a formulation affects the
efficiency of the binder because different substances have their different
natural and adherence forces.
(ii). Use level concentration: It has been shown that the more the
concentration of binder, the stronger the tablet produced. This is because
more binder confers great stability on the tablet. Therefore the water
absorption reduction will be more pronounced (52). Insufficient binder
tends to produce poor adhesion, capping and soft tablets. Excessive
binder yields a slowly disintegrating and hard tablet. Also the presence of
excessive binder in a formulation makes granulation and tabletting
extremely difficult.
1.5.3 DISINTEGRANTS
Disintegrants are excipients added to tablet formulations to cause the tablets to
break apart after administration (12). Disintegration is viewed as the first stage
in the dissolution process, although dissolution does occur simultaneously with
xxxiv
disintegration. (17). Disintegrants break the dosage form into smaller particles
when it comes in contact with the liquid. These smaller fragments have greater
surface area which increase the dissolution of the drug (1). A good disintegrant
must be effective at low concentration to avoid or reduce its influence on tablet
properties such as hardness, friability, or compressibility (12) Adebayo et al
(2010) carried out a comparative disintegrant activities of breadfruit starch and
official corn starch (53). The drug must be released from the tablet matrix as
quickly as possible to enhance its rapid dissolution (12).
Various mechanisms of disintegrations have been proposed. Isa et al. (2009)
proposed combination of swelling, wicking, and deformation as the mechanisms
of disintegrant actions (11). In many cases water uptake alone will cause
disintegration, by rupturing the intra-particle cohesive forces that hold the tablet
together, resulting in subsequent disintegration (17). If swelling occurs
simultaneously with water uptake, the channels for penetration are widened by
physical rupture and the penetration rate of water into the dosage form increases
(17).
In powder and tablet technology, disintegrants are incorporated to counter the
effects of binder and compression force. The stronger the binding agent, and the
compression force, the stronger will be the effect of the disintegrant in order to
guarantee the release of the active pharmaceutical ingredient in the
gastrointestinal tract. Disintegrants in tablet formulations can be incorporated
intra-granularly, extra-granularly or by the combination of the two techniques.
Adebayo and Itiola (1998) also evaluated the use of breadfruit starches as exo-
disintegrants in paracetamol tablet formulation (54).
The conditions best suited for rapid tablet disintegration are sufficient number
of disintegrant agglomerates, low compressive pressure and the presence of

xxxv
water. The concentration of disintegrant used is also very crucial. If it is below
the optimum concentration, then there will be insufficient channels for capillary
action. But if it is above the optimum concentration, then it will be difficult to
compress the tablet.
1.5.3.1 EXAMPLES OF COMMON DISINTEGRANT
(a) Starch
Starch is the oldest and first most commonly used disintegrant (11).
Examples of starch used as disintegrants are corn starch, potato starch,
sodium starch glycollate, cross-linked sodiumcarboxymethylcellulose.
Acid modification of starch enhances its disintegrant action (11). Starch
is used as disintegrant in the concentration range of 5 to 20% of the tablet
weight.
Starch was the first disintegrating agent widely used in tablet
manufacturing (55). Before 1906 potato starch and corn starch were used
as disintegrants in tablet formulation. Iwuagwu and Onyekweli (2002)
carried out a preliminary investigation into the use of Pleurotus tuber-
regium powder as a tablet disintegrant (56). They prepared tablets with
less than ten percent of the disintegrants and discovered that tablets with
pleurotus starch disintegrated faster than that of maize starch. The ability
of the pleurotus powder to swell by over three times its volume in the
presence of water may explain its disintegrant properties. However,
native starches have certain limitations and have been replaced by certain
modified starches with specialized characteristics.
The mechanism of action of starch as disintegrant is wicking and
restoration of deformed starch particles on contact with aqueous fluid. In
doing so, there is a release of certain amount of stress which is

xxxvi
responsible for disruption of hydrogen bonding formed during
compression (15).
(b) Pregelatinized Starch
Pregelatinized starch is produced by the hydrolyzing and rupturing of the
starch grains. It is a directly compressible disintegrant and its optimum
concentration is 5-10 % (15, 55 and 57).
(c) Modified Starch
To have a high swelling rate and fast disintegration, starch is modified by
carboxymethylation followed by cross-linking. Modified starch is
therefore also known as cross-linked starch (57). An example of modified
starch is sodium starch glycollate. Other carboxymethyl starches are also
marketed as Explotab and Primojel®.
The mechanism of action of modified starches as disintegrant involves
rapid and extensive swelling with minimal gelling. Their optimum
concentrations are 4-6 %. If the concentrations go beyond this range, then
it produces viscous and gelatinous mass which increases the
disintegration time by resisting the breakup of tablet. They are highly
efficient at low concentrations because of their great swelling capacity
(57).
(d) Cellulose and its derivatives
Sodium carboxymethylcellulose (NaCMC and Carmellose sodium have
highly hydrophilic structure and are soluble in water. But when they are
modified by internal cross linking, the result is cross-linked cellulose, i.e.
cross-carmellose sodium. This is nearly water insoluble due to internal
xxxvii
cross linking. It rapidly swells to 4-8 times its original volume when it
comes in contact with water (57).
(e) Microcrystalline cellulose (MCC)
MCC exhibits very good disintegrating properties because it is insoluble
and act by wicking action. The moisture breaks the hydrogen bonding
between adjacent bundles of MCC. It also serves as an excellent binder
and has a tendency to develop static charges in the presence of excessive
moisture content. Therefore, sometimes, it causes separation in
granulation. This can be partially overcome by drying the cellulose to
remove the moisture (57).
(f) Alginates
Alginates are hydrophilic colloidal substances which have high sorption
capacity. Chemically, they are salts of alginic acid. Alginic acid is
insoluble in water and slightly acidic in reaction. Hence, it should be used
with only acidic or neutral materials.
Unlike starch and MCC, alginates do not retard flow and can be
successfully used with ascorbic acid, multivitamin formulations and acid
salts of organic bases (57).
(g) Ion-exchange resin
Ion exchange resin (e.g. AmberliteIPR-88®) has higher water uptake
capacity than other disintegrating agents such as starch and sodium CMC.
It has the tendency to adsorb certain drugs (57).

xxxviii
(h) Miscellaneous
The miscellaneous category includes disintegrants such as surfactants,
gas producing disintegrants and hydrous aluminium silicate. Gas
producing disintegrating agents are used in soluble tablets, dispersible
tablets and effervescent tablets.PolyplasdoneXL® and
Polyplasdone®XL10 act by wicking, swelling and possibly some
deformation recovery. PolyplasdoneXL® does not reduce tablet hardness,
but provides rapid disintegration and improved dissolution.
PolyplasdoneXL® as disintegrating agent has small particle size
distributions that impart a smooth mouth feel and rapid dissolution.
(i) Superdisintegrants
Superdisintegrants are the substances which facilitate faster disintegration
with smaller quantity than the conventional disintegrants (58). They are
effective in low concentrations and have greater disintegrating efficiency.
They are more effective intra granularly (57). Superdisintegrants provide
quick disintegration due to the combined effects of swelling and water
absorption (58). The swelling of the superdisintegrant causes the wetted
surface of the carrier to increase, thus promoting the wettability and
dispersibility of the system. This ultimately enhances disintegration and
dissolution (58). Superdisintegrants are, however, hygroscopic. They are
not used with moisture sensitive drugs (57).
1.5.3.2 MECHANISMS OF ACTION OF TABLET DISINTEGRANT
Presently, there is yet no proper theory to explain the mechanism of
disintegration action. But it is obvious that no single mechanism can
sufficiently explain disintegration action. Several factors, such as wetting

xxxix
ability, which depends on contact angle, hydrophilicity and appropriate
porosity, are involved. However, the mechanisms are classified into six
groups as follows:
(i) Swelling: This is the most accepted mechanism of disintegration action.
Most disintegrants can swell, and there are several works demonstrating
that swelling efficiency promotes rapid water uptake into the tablet.
The conventional disintegrants, such as pregelatinised starch, have small
degrees of swelling enough to cause the tablets to disintegrate when
incorporated in adequate quantities to form a hydrophilic network.(59) In
swelling mechanism, particles swell and break up the matrix from within.
Swelling sets up localized stress which spreads throughout the matrix.
Examples of such disintegrants are alginates, pregelatinised starch, and
polyvinylpyrollidone.
(ii) Deformation: An excipient in a tablet during formulation is deformed
under the pressure of compression that forms the tablet. Starch grains, for
instance, are generally thought to be ‘elastic’ in nature, meaning that
grains that are deformed under pressure will return to their original shape
when that pressure is removed.
With the compression force involved in tabletting, these grains are
believed to be ‘energy rich’ and the energy is released upon exposure to
water. Lowenthal illustrated maize starch grain deformation using the
light microscope (60). The result obviously showed that the deformed
granules returned to their original shapes when exposed to moisture.
During the process, a strain is created inside the tablet which eventually
caused shattering of the tablet. In deformation, particles swell to pre-
compression size and break up the matrix.

xl
(iii) Disintegrating particle-particle repulsion theory: According to this
theory, as water is drawn into the pores, particles repel each other because
of the resulting electrical force (61, 62). This explains why non-swellable
materials can promote disintegration and are sometimes superior to
swellable materials, in terms of disintegrant efficiency. Researchers have
shown that the repulsion is secondary to wicking (61).
(iv) Capillary action and porosity (wicking): Disintegrants are hydrophilic
agents with low free surface energy. Water penetration into the tablet
pores exerts forces between the particles compressed within the tablet
causing expansion. This expansion is due to the fact that the water
replaces air adsorbed on the particles, which weakens the intermolecular
bonds and breaks the tablets into fine particles (61). Disintegrants
(with low cohesion and compressibility) enhance these forces and allow
the water to penetrate quickly. This rapid penetration of the water rapidly
expands the tablet and ruptures the inter-particulate bonds causing the
tablets to break apart. For these types of disintegrants, maintenance of
porous structure and low interfacial tension towards aqueous fluid is
necessary. This helps in disintegration by creating a hydrophilic network
around the drug particles.
(v) Release of gas: Carbon dioxide is released within tablets on wetting due
to the interaction between bicarbonates or carbonates with citric acid or
tartaric acid (61). The tablets disintegrate due to generation of
pressure within the tablets. This effervescent mixture is used when
the pharmacist needs to formulate very rapidly dissolving tablets or fast
disintegrating tablets. As these disintegrants are highly sensitive to small
changes in humidity level and temperature, strict control of environment
is required during manufacturing of the tablets. The effervescent blend is

xli
either added immediately prior to compression or can be added in two
separate fractions of formulation.
(vi) Enzymatic reaction: Enzymes present in the body also act as
disintegrants (62). The enzymes destroy the binding action of binders and
help in disintegration (63). Due to swelling, pressure is exerted in the
outer direction that causes the tablet to burst or the accelerated absorption
of water leads to an enormous increase in the volume of granules to
promote disintegration (62).
(vii) Heat of wetting: When disintegrants with exothermic properties get
wetted, localized stress is generated due to capillary air expansion
which helps in disintegration of tablets (64). This mechanism, however, is
limited to only a few types of disintegrants and cannot describe the action
of most modern disintegrants (64, 65).
1.5.3.3 CHARACTERISTICS OF AN IDEAL DISINTEGRANT
1. Poor solubility
2. Poor gel formation
3. Good hydration capacity
4. Good moulding and flow properties
5. No tendency to form complex with the drugs.
1.5.3.4 FACTORS THAT AFFECT DISINTEGRANT EFFICIENCY
(1) Type of dinsintegrant: This is because different disintegrants have
different physicochemical properties which are responsible for their
behaviours and, in turn, their functions when used.

xlii
(2) Concentration of disintegrant: The more the concentration of the
disintegrant, the lower the disintegration time of the formulation.
(3) Effect of fillers: The solubility and compression characteristics of fillers
affect both the rate and mechanism of disintegration of the tablet. If
soluble fillers are used, they may cause increase in viscosity of the
penetrating fluid which tends to reduce effectiveness of strongly swelling
disintegrating agents. As they are water soluble, the tablets are likely to
dissolve rather than disintegrate. Insoluble diluents produce rapid
disintegration with adequate amount of disintegrants. Chebili and
Cartilier (66) proved that tablets made with spray dried lactose (water
soluble filler) disintegrated more slowly due to the amorphous character
of the lactose and has no solid planes on which the disintegrating forces
can be exerted, as compared with the tablets made with crystalline lactose
monohydrate.
(4) Effect of binder: As the binding capacity of the binder increases, the
disintegrating time of tablet increases and this counteracts rapid
disintegration. The concentration of the binder can also affect the
disintegration time of tablets (67).
(5) Effect of lubricants: Most lubricants are hydrophobic. They are used in
smaller quantities than other ingredients in the tablet formulation (67).
When the mixture is formed, lubricant particles may adhere to the surface
of the other particles. This hydrophobic coating inhibits wetting and
consequently tablet disintegration. Lubricants have a strong negative
effect on water uptake when the tablet contains no disintegrant or a high
concentration of slightly swelling disintegrant. On the contrary, the
disintegration time is hardly affected if some strongly swelling
disintegrants are present in the tablet (67). One exception however is

xliii
sodium starch glycolate whose effect remains unaffected in the presence
of hydrophobic lubricants.
(6) Effect of surfactants: Surfactants are only effective within certain
concentration ranges. Surfactants are recommended to decrease the
hydrophobicity of the drugs because hydrophobic active ingredients in
the tablet prolongs the disintegration time. The disintegration time of
granules of water-soluble drugs is not improved by the addition of a
nonionic surfactant during granulation. The desired effect of a surfactant
appears when granules are made of slightly soluble drugs. The speed of
water penetration is increased by the addition of a surfactant.
Sodium lauryl sulphate increases absorption of water by starch but has a
variable effect on water penetration in tablets (68).
Other Factors affecting disintegration include;
1. Disintegrating medium used.
2. Temperature.
3. Operator experience.
4. Nature of the drug ( particle size or molecular weight).
1.5.3.5 METHODS OF INCORPORATION OF DISINTEGRANTS
There are three basic methods of incorporating disintegrants into tablet
formulations. These are:
(a) Intra-granular,
(b) Extra-granular
(c) Intra-granular – extra-granular.

xliv
In intra-granular incorporation, the disintegrant is mixed with other excipients
before the incorporation of the binder solution. Extra-granular incorporation
involves incorporating the disintegrant into the granules prior to the addition of
lubricants. Intra-granular-extra granular incorporation involves mixing half or a
portion of the disintegrant with the other excipients before the addition of the
binder solution and adding the remainder to the granules before compression.
Intragranular-extragranular incorporation appears to be the best method. The
extra-granularly added portion causes immediate disruption of the tablet into the
previously compressed granules while the portion added intra-granularly causes
further erosion of the granules to the original powder particles.(34)
1.5.4 LUBRICANTS
Lubricants are agents added in small quantities to tablet or capsule formulations
to improve certain processing characteristics (41). Lubricants prevent
ingredients from clumping together and sticking to the tablet punches or capsule
filling machine (41). They are used to reduce the friction between the tablets
and die cavity when the tablet is being ejected from the die (1). Lack of
lubricant can lead to problems such as capping, scratches on the sides of the
tablet, fragmentation of the tablet andothers.
There are four lubrication mechanisms. They include hydrodynamic lubrication,
elastohydrodynamic lubrication, mixed lubrication, and boundary lubrication
(69). In the pharmaceutical industry, boundary lubrication is the most common
mechanism functioning in unit operations (69). There are two major types of
lubricants used in pharmaceutical processes. They are the hydrophobic and the
hydrophilic lubricants (41). Most hydrophobic lubricants have both anti-
adherent and glidant properties. Consequently, they are used more frequently in
the pharmaceutical industry than the hydrophilic lubricants (41).

xlv
For a lubricant to function properly, the time of addition, the concentration in
which it is to be added and the combination are the important parameters
(1).The time of mixing is important as over mixing may lead to reduction in
tablet dissolution and prolongation of disintegration (1).
1.5.5 GLIDANTS
Glidants are inert excipients that are added to tablet formulations to reduce the
interparticulate friction and improve the flow properties of granules from the
hopper into the feed mechanism and ultimately into the die cavity(70).They aid
in particle rearrangement within the die during the early stages of compression
(71).
Glidants are required at the surface of feed particles. They should be in fine
state of division and appropriately incorporated in the mixture (71). If their
concentrations are taken beyond a certain limit, a drag action may come into
operation. This brings down the rate of flow (71). There are hydrophilic and
hydrophobic glidants (70).
Hydrophobic glidants include talc, silicon dioxide, calcium phosphate and
metallic stearates while the hydrophilic glidants are exemplified by corn starch
BP, yam starch, pregelatinized starch, and cassava starch (70). Other examples
of lubricants include stearic acid, magnesium stearate , glyceryl behenate,
glyceryl palmito stearate, polyethylene glycol, polyoxyethylene stearate, lauryl
sulphate salt (1).
1.5.6 FLAVOURS AND SWEETENERS
Flavours are incorporated into the formulation to give a pleasant taste to the
formulation (1).Flavouring agents and sweeteners are incorporated in tablet
formulation to enhance patient acceptance and achieve palatability. Flavouring
agents are mostly restricted to the formulations which are intended to be
released in the mouth or chewable tablets (1). They are usually added along

xlvi
with the granules (3). Flavours may be natural (fruit extract) or artificial (1).
Flavours such as mint, cheery, and anise can be used to modify the taste of
bitter products (41). Peach, apricot, and liquorice are used in salty products.
Sweeteners are agents employed in liquid formulations designed for oral
administration specifically to increase the palatability of the therapeutic agent
(72). They are compounds that interact with taste buds to evoke a characteristic
response (73). Sweeteners have the ability to impart sweet taste by masking the
taste of the material in which they are added (73).
Sweet taste perception is believed to involve multiple receptor types and
transduction mechanisms (73). Competitive inhibition of the sweetener’s
receptors is one proposed mechanism. Other mechanisms include interference
with channels and second messenger in the taste buds (73). Non-specific
interaction with the taste buds is also believed to be one of the mechanisms
through which sweeteners act on the taste buds (73). Sweeteners should have
low calorific value and possess the ability to mask taste at low concentrations.
The ideal sweetener should be free from harmful side effects and be suitable for
long term use. They should remain stable at a wide range of temperatures and
pH. Ideal sweeteners should have a quick onset of action. They should be non-
hygroscopic, water soluble and possess high dissolution rates.
Sweeteners are broadly divided into two, the natural and artificial (synthetic)
sweeteners. The natural sweeteners include xylose, ribose, glucose, mannitol,
mannose, galactose, sucrose, sorbitol, xylitol, glycerin, and fructose (72, 73).
The artificial sweeteners are exemplified by sodium cyclamate, aspartame,
sodium saacharin, and ammonium glycyrrhizinate (72,73). Vanilla is used to
reduce the sweetening effects of products (41). Other flavouring agents include
peppermint oil and orange oil.
1.5.7 COLOURANTS

xlvii
Colourants are additives that are used in tablet formulation for aesthetic
appearance or as identification guide. They are added to improve the appearance
of a formulation (41) and to increase the patient compliance or for identification
of the formulation (1). Usually colourants are added in the form of insoluble
powder or as liquid in the granulation step (1). Colour consistency is important
as it allows easy identification of a medication. Some commonly used
colourants are erythrosine and tartrazine.
1.6 PREFORMULATION STUDIES
Preformulation is a branch of pharmaceutical science that utilizes
biopharmaceutical principles in the determination of physicochemical properties
of a pharmaceutical substance. The goal of preformulation studies is to choose
the correct form of the substance, evaluate its physical properties and generate a
thorough understanding of the material’s stability under various conditions,
leading to the optimal drug delivery system. The preformulation study focuses
on the physicochemical parameters that could affect the development of an
efficacious dosage form. These properties may ultimately provide a rationale for
formulation design. It will also help in minimizing problems in later stages of
drug development, reducing drug development costs and decreasing product’s
time to the market. It gives the information needed to define the nature of the
drug substance and provide framework for the drug combination with
pharmaceutical excipients in the dosage form. The overall objective of
preformulation testing is to generate information useful in developing the
desired stable and bioavailable dosage forms.
The use of preformulation parameters maximizes the chances of formulating an
acceptable, safe, efficacious and stable product. Preformulation encompasses
the following tests:
(i) Bulk Characterization

xlviii
Crystallinity, polymorphism and hygroscopicity of powders (flow,
compaction, density, particle size and surface area)
Microscopy (morphology, particle characteristics).
Molecular spectroscopy (FT-IR).
(ii) Solubility Analysis
Solubility.
pH solubility profile.
Common ion effect.
Thermal effect on solubility.
Solubilization.
Dissolution.
(iii) Stability Analysis
Stability to heat, light, acid, base, oxidizer.
Solution stability, solid-state stability.
Excipient compatibility.
1.6.1 PREFORMULATION PARAMETERS TO BE CONSIDERED IN
TABLET FORMULATION
The commonly investigated preformulation parameters include ,but not limited
to, angle of repose, bulk density, tapped density, Carr’s compressibility,
Hausner’s ratio, particle size and shape (morphology), true density and melting
point.
1. Angle of Repose: This is the maximum angle to the horizontal at which
substances such as powders remain stable without sliding. At the angle of
repose, the material on the slope face is on the verge of sliding. The angle
of repose can range from 00 to 900. Angle of repose is related to the
density, surface area and shape of the particles and the coefficient of

xlix
friction of the material. However, a 2011 study shows that the angle of
repose is also gravity-dependent (74).
2. Bulk Density: This takes into account the macroscopic inter-particle
spaces. It is defined as powder mass divided by its bulk volume without
any tapping. Powder bulk density depends primarily on particle size
distribution, particle shape and the tendency of particles to adhere to each
other. Some particles may pack loosely leading to fluffy and light powder
while others may contain smaller particles that sift between larger
particles to fill the void leading to dense and heavy powder. Bulk density
is often used to calculate the size for blender granulator.
3. Tapped density: This is measured after the powder is subjected to
mechanical tapping. It is the density of material itself exclusive of void or
interparticulate pores larger than molecular or atomic dimension in the
crystal lattice. On the other hand, the true density can be predicted from
the crystal lattice and is often determined experimentally using a
pycnometer.
4. Carr’s Compressibility index: This is derived from the values of bulk
density and tapped density. A free flowing powder should have a low
compressibility index because, the inter particulate forces are not as
significant as in a poorly flowing powder, which implies that the value of
the bulk density is close to that of the tapped density. As a general rule of
thumb, compressibility index higher than 30 % indicates poor powder
flow.
5. Hausner’s quotient: This is derived from the values of bulk density and
tapped density.
…………………………………..(1)

l
6. Particle size and shape: These have far reaching impact on the
bioavailability, processibility, physical stability and chemical stability of
solid dosage form. For instance, for a low dose, direct compression
formulation, where the drug content uniformity is of particular concern,
the particle size of the substance has to be small enough to meet the US
Pharmacopoeial requirement for content uniformity. Zhang and John
(75) have shown that low dose blend containing a larger particle size
(18.5 μm) failed to meet USP requirement, whereas the blend containing
smaller particle size (6.5 μm) passed the test. The morphology of a solid
may also affect the properties. Many pharmaceutical active ingredients
crystallize in needle shaped crystals that are difficult to filter and exhibit
poor flow properties. Milling of long needle-like crystals can enhance
flow properties. On the other hand, the flow of small particles (less than
10 μm) through an orifice is restricted because the cohesive forces
between the particles are of the same magnitude as the gravitational force.
This tends to create large tablet weight variations during compression.
7 Particle surface area: The rate at which a solid dissolves is proportional
to its surface area exposed to the dissolution medium. Therefore, particle
size reduction which leads to increased surface area has long been used to
enhance the dissolution and bioavailability of a poorly soluble drug. In
addition, the flow properties and compatibility of pharmaceutical
powders may also be impacted by surface area of the solid. The primary
factors impacting compactibility are low compact bonds formed, and the
surface area over which the binders are active.
8. pH: The effect of pH on drug stability is important in the development of
both oral and parental dosage forms. Many drugs are stable within the pH
range of 4 to 8. Acidic and alkaline pH influence the rate of
decomposition of most drugs. As little as one pH unit change can cause a
change of ten fold in rate constant.

li
9. Melting point: This helps to determine the processing condition of the
substance under test. It is the temperature at which a solid substance turns
to the liquid phase. It can be measured by three techniques:
(i) Capillary melting
(ii) Hot stage microscopy
(iii) Differential scanning calorimetry or thermal
analysis. 10. Chemical stability profile: These studies include both solution and solid
state experiments under conditions typical for handling, formulation,
storage and administration of a drug candidate, as well as stability in the
presence of other excipients. For instance, the method of sterilization of a
potential product will be largely dependent on the temperature stability of
the drug. A drug having decreased stability at elevated temperatures
cannot be sterilized by autoclaving but must be sterilized by other means
such as filtration.
Chemical stability profiles are determined through:
- Solid state stability
- Elevated temperature studies
- Stability under high humidity conditions
- Photolytic stability
- Stability to oxidation
- Compatibility studies (stability in the presence of other excipients)
- Solution phase stability
1.6.2 FACTORS TO BE CONSIDERED BEFORE A FORMAL
PREFORMULATION PROGRAMME
1. The amount of test substance available.
2. The physicochemical properties of the substance already known.

lii
3. Therapeutic category and anticipated dose of compound, in the case of a
drug substance.
4. The nature of information a formulation should have or would like to
have.
1.7 OBJECTIVES OF THE STUDY
1. To extract the starch contained in Cyperus esculentus nut, and determine
its physicochemical properties.
2. To evaluate the use of Cyperus esculentus starch as a binder in
paracetamol tablet formulation.
3. To evaluate its use as a disintegrant in paracetamol tablet formulation.
4. To compare both the binding and disintegrant properties of starch from
Cyperus esculentus with that of maize starch.
5. To establish the usefulness or otherwise of Cyperus esculentus starch as a
tablet excipient.
CHAPTER TWO
EXPERIMENTAL
2.1 MATERIALS
N – Hexane (BDH, England) was used to extract oil from milled tigernuts.
Sodium metabisulphite (Jay Dinesh chemicals, India) was used in the steeping
process to avoid oxidation and subsequent colour change of the starch being
extracted. Distilled water was used as the extracting solvent for the starch as
well as for the preparation of buffer solutions. Liquid paraffin (J .C Enterprise,
Mumbai, India) was used as a non-dissolving solvent in the determination of
particle density. Paracetamol powder (RPS, France) was employed as the drug
and active ingredient in the formulation. Sodium benzoate (BDH, England) was
used as a preservative in the paracetamol tablet formulation while magnesium
stearate (Hopkin and Williams, U.K) was the lubricant. Iodine (ISE Chemicals,

liii
Japan) solution was used to test for the presence of starch in the extracted
substance. Corn starch (BDH, England) was used as the control.
Cyperus esculentus tubers (purchased from Nsukka Central Market) was
employed as the test substance. Talc (BDH, England) was used as a glidant.
Sodium chloride (Focus Technology co. Ltd, China) and concentrated
hydrochloric acid(Riedel- dehaen, E C Label C.O.O, Germany) were used in the
preparation of simulated gastric juice. Monosodium dihydrogen phosphate
dehydrates (Sigma-Aldrich, UK), sodium hydroxide (Merck, Germany) and
disodium monohydrogen phosphate anhydrous (Sigma- Aldrich, UK) were used
to prepare simulated intestinal fluid. Peptone, monopotassium phosphate
(Sigma- Aldrich, UK), sodium chloride and disodium phosphate (Sigma-
Aldrich, UK) were utilized for the preparation of peptone buffer solution.
Casein peptone (Sigma- Aldrich, UK), soya bean peptone (Sigma- Aldrich,
UK), sodium chloride and agar (Marine Chemicals, India) were used to prepare
soya bean casein digest agar medium. Peptone, agar and glucose (Balaji
Nutraceuticals, India) were used to prepare Saboraud Dextrose Agar medium
whereas a pre-mixed powder of lactose, pancreatic digest of gelatin and beef
extract (BD Diagonostic, UK) was used to prepare lactose broth medium.
Amylose fraction of starch used as standard (Obtained from soil science
laboratory, University of Nigeria, Nsukka)
2.2 METHODS
2.2.1 Isolation of starch from tubers of Cyperus esculentus
A quantity of Cyperus esculentus tubers (6.92 kg) was sorted to remove stones
and other unwanted particles. They were washed, dehauled by peeling with
knife and milled without water in an attrition mill. The crushed fibers were
passed through a Soxhlet extractor, using n-hexane as the defatting solvent at a
temperature of 67.0± 3.00C.

liv
Starch was extracted from the pulp of Cyperus esculentus tubers by the
modified method of Umerie et al (76). The defatted pulp was steeped in 4 l of
sodium metabisulphite (Na2S2O5) solution (0.08 %) at 300C for 48hours, but the
steep water was changed at 24 hours. The pulp was re-suspended in 5 l of
Na2S2O5 solutions, stirred and allowed to stand for 10 h. The starch milk
obtained was stirred again and passed through a muslin cloth and the suspension
was allowed to stand for 24 h. The supernatant was decanted off and the starch
sediment collected was re-suspended in 1.2 l of distilled water and allowed to
settle for 8 h. The water was again decanted off and the starch cake was re-
suspended in 1l of distilled water for further purification. After about 8 h, the
water was decanted off. The wet starch cake was dried in air overnight and
subsequently in a hot air Oven (Mernel Oven, England) at a temperature of
450C for 5 h.
2.2.2 CHARACTERIZATION OF CYPERUS ESCULENTUS STARCH
i. Jelly formation: A smooth mixture of the starch slurry was prepared by
adding 2 ml of distilled water to 1 g of the starch. The mixture was stirred
into 5 ml boiling water and was allowed to boil gently for 2 min and then
cooled (77).
ii) Iodine Test:
(a) Starch mucilage from the jelly formed was made and one drop of iodine
test solution was added and the color change observed.
(b) A quantity of the starch mucilage equivalent to 0.2 % w/v was made by
adding 15 ml of water to 0.03 g of starch at a temperature above 850C for
30 min on a water bath. It was allowed to cool and then two drops of
0.1N iodine solution were dropped into the starch mucilage and the
colour change was observed.

lv
(iii) Texture: A quantity of two grams of the starch was weighed using an
analytical balance (Ohaus Adventurer, England) placed between two
fingers and pressed to determine the texture.
(iv) Dissolvability of starch: A quantity of starch (0.1 g) was added to 100
ml of water at room temperature. Also, another one hundred milligram
portion of starch was weighed and put in 100 ml of 95 % alcohol. The
two mixtures were observed to know the extent of dissolution of the
starch in the mixtures
(v) Acidity test: A quantity of starch (10.0 g) was weighed and added to 100
ml of ethanol which was previously neutralized using phenolphthalein
solution as indicator. The mixture was shaken for 1 h, filtered and 50 ml
of the filtrate titrated with 0.1 N NaOH solution, the quantity of NaOH
used was recorded(78).
The titration was done in triplicate and the mean value calculated . The volume
of 0.1N NaOH that neutralized the starch solution is the acidity.
The same procedures were carried out on corn starch BP
2.2.3 PREPARATION OF SIMULATED GASTRIC FLUID (SGF)
The SGF without pepsin was prepared by dissolving 2.0 g of sodium chloride
(NaCl) in 7 ml of concentrated hydrochloric acid (HCl) and adding enough
distilled water to bring the final volume to 1000 ml. The pH was adjusted to 1.2
using a pH meter (pHep US).
2.2.4 PREPARATION OF SIMULATED INTESTINAL FLUID (SIF)
The SIF without pancreatin was prepared by adding 3.1 g of monosodium
dihydrogen phosphate dehydrate in 10.0 g of disodium monohydrogen
phosphate anhydrous and adding sufficient distilled water to bring the final

lvi
volume to 1000 ml. The pH was adjusted to 7.4 using a pH meter by adding
sodium hydroxide solution in drops.
2.2.5 PREPARATION OF PEPTONE BUFFER
A quantity of peptone (1.0 g) and 3.689 g of monopotassium phosphate were
mixed geometrically in a beaker. Then, 4.30 g of sodium chloride was added to
the mixture followed by 18.23 g of disodium phosphate. After mixing
thoroughly, sufficient distilled water was added to bring the final volume to
1000 ml. The solution was autoclaved for 15 min at 121oC. The pH of the
buffer solution was adjusted to 7.0.
2.2.6 PREPARATION OF SOYA BEAN CASEIN DIGEST AGAR
MEDIUM
Five grams each of sodium chloride and soya bean peptone were mixed in a
beaker containing 100 ml of distilled water. Fifteen grams of casein peptone
was added to the mixture followed by the addition of eighteen gram of agar.
Distilled water was added to bring the final volume to 1000 ml. The medium
was autoclaved for 15 minutes at 121oC. The pH was adjusted to 7.1.
2.2.7 PREPARATION OF SABORAUD DEXTROSE AGAR MEDIUM.
Ten grams of peptone (derived from meat and casein) was mixed geometrically
with fifteen grams of agar after which forty grams of glucose was added and
mixed thoroughly. Distilled water was added to bring the final volume to 1000
ml. The preparation was autoclaved at 121oC for 15 min. The pH was
determined.
2.2.8 PREPARATION OF LACTOSE BROTH MEDIUM.

lvii
A pre-mixed powder of lactose 5.0 g, pancreatic digest of gelatin, 5.0 g and beef
extract was put in a beaker and the volume made up to 1 l with distilled water.
2.2.9 EVALUATION OF PHYSICOCHEMICAL PROPERTIES OF
CYPERUS ESCULENTUS STARCH
2.2.9.1 DETERMINATION OF DENSITY
(i) Bulk Density
Thirty grams of Cyperus esculentus starch was measured into a calibrated
measuring cylinder (100 ml) and the bulk volume determined. The bulk
density was calculated as the ratio of the mass of the starch to the volume
of the starch in the cylinder.
(ii) Tapped density
Thirty grams of starch was weighed into a 100 ml calibrated measuring
cylinder and tapped 500 times (The height of cylinder to the base being
about 5 cm). The volume occupied was recorded as the tapped
(consolidated) volume. The tapped density is the ratio of mass of starch to
the volume occupied.
iii) True density
This was done using 50 ml pycnometer. The empty pycnometer was
weighed and its weight recorded as W1. Thereafter, 10 ml of liquid
paraffin was measured into the pycnometer which was weighed to obtain
W2. Then, 2.0 g of starch sample was introduced into the pycnometer
containing 10.0 ml of liquid paraffin and the weight was taken to be W3.
The true density was computed by the relation;

lviii
------------------------ (2)
Where W1= Weight of empty pycnometer
W2= weight of liquid paraffin + pycnometer
W3=weight of pycnometer + starch suspension in liquid paraffin.
The tests were done on corn starch BP
2.2.9.2 DETERMINATION OF VISCOSITY
Two percent of aqueous starch suspension was made and heated in a water bath
at about 85 0C to form a paste. The viscometer (Haake rotovisco) spindle was
set at a rotational speed of 30 revolutions per minute for 60 seconds after which
the viscosity reading was taken from the meter.
2.2.9.3 SWELLING STUDIES
(i) Wettability and Hydration capacity
One thousand milligrams of Cyperus esculentus starch powder was weighed in
an electronic balance into a calibrated 10 ml capacity centrifuge cell. It was
dispersed in 4 ml of water with the aid of a glass rod. The volume was
immediately made up to 10 ml mark with distilled water. The mixture was
shaken for 5 min and immediately centrifuged for 15 min at 100 revolutions per
min (rpm). The volume of the solid sediment and that of water layer were
observed from the cell and recorded. The wettability of the starch was
determined by the following equation;
----------------------------------- (3)

lix
where Wc = Wettability
Sf= final volume of sediment
St= Initial volume of sediment
Secondly, the process was repeated but this time, the dispersion liquid was
allowed to stand for 2 h after which it was centrifuged for 15 min at 1000 rpm.
The dispersion was separated and the volume of solid sediment and water layer
were observed and recorded. The hydration capacity was also determined as the
difference in the initial and final volumes of water separated expressed as a
percentage
(ii) Swelling power
Two hundred milligrams of Cyperus esculentus starch was weighed and put into
a beaker. It was dispersed in water at 85 0C by stirring for 30 min with
intermittent shaking at 5 min intervals. After 30 min period, the mixture was
centrifuged at a speed of 2000 rpm for 15 min. The supernatant was collected
and evaporated at 105 0C for 2 h and weighed afterwards. The solubility was
calculated. Also the swelling power was calculated according to the formula
and -------------------------------- (4)
------------------------- (5)
where Ws = weight of starch sediment (g)
W (Wi) = weight of sample (g)
A= Weight of dried filtrate
Sp= Swelling power

lx
The experiment was repeated with water at temperatures of 55 0C, 65 0C, 75 0C
and 95 0C and was also carried out on corn starch BP.
(iii) Rate of Swelling
The swelling characteristics were investigated in water, pH 7.0, simulated
gastric fluid (SGF) without pepsin, pH 1.2, and simulated intestinal fluid (SIF)
without pancreatin, pH 7.4. The Cyperus esculentus (5.6 g) starch was placed in
10 ml measuring cylinder up to 2 cm level in each case and tapped 20 times.
The level L, at zero time was taken. Water, SGF or SIF as the case maybe was
added to the mass to 10 ml level. The rise in volume of the starch at ten minute
intervals was recorded over a period 1 h and later left to stand at room
temperature for 24 h and the new volume was recorded. The test was done in
triplicate and the average taken. The rate of swelling was expressed ml/ sec and
recorded.
(iv) Effects of Electrolytes on Rate of Swelling
Five millilitres of different concentrations of sodium chloride (NaCl) and
magnesium chloride (MgCl2 ) (2.0 , 0.1 , 0.5 and 1.0 N) respectively was
carefully added to the starch contained in a 10 ml measuring cylinder and the
electrolyte was allowed to get absorbed by the starch. The change in the volume
of starch was recorded at 10 minute intervals for 1 h. It was later allowed to
stand for 24 h after which the changes in volume of starch were noted and the
rate of swelling calculated.
2.2.9.4 MICROMERITICS
(i) Determination of Flow Rate
Thirty grams of the Cyperus esculentus starch was weighed into a mounted
funnel having orifice diameter of 1 cm with the shutter closed and supported
with a retort clamp. The funnel was clamped at 7 cm (height of fall) from the
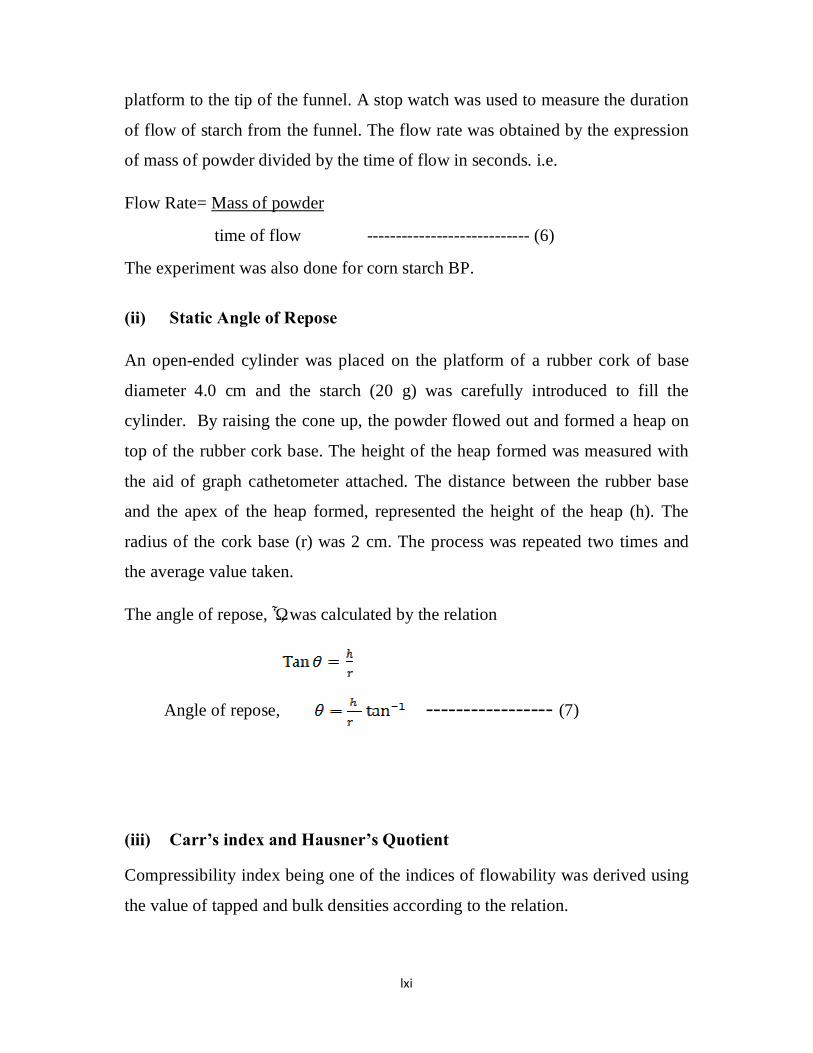
lxi
platform to the tip of the funnel. A stop watch was used to measure the duration
of flow of starch from the funnel. The flow rate was obtained by the expression
of mass of powder divided by the time of flow in seconds. i.e.
Flow Rate= Mass of powder
time of flow ---------------------------- (6)
The experiment was also done for corn starch BP.
(ii) Static Angle of Repose
An open-ended cylinder was placed on the platform of a rubber cork of base
diameter 4.0 cm and the starch (20 g) was carefully introduced to fill the
cylinder. By raising the cone up, the powder flowed out and formed a heap on
top of the rubber cork base. The height of the heap formed was measured with
the aid of graph cathetometer attached. The distance between the rubber base
and the apex of the heap formed, represented the height of the heap (h). The
radius of the cork base (r) was 2 cm. The process was repeated two times and
the average value taken.
The angle of repose, ɵ, was calculated by the relation
Angle of repose, ----------------- (7)
(iii) Carr’s index and Hausner’s Quotient Compressibility index being one of the indices of flowability was derived using
the value of tapped and bulk densities according to the relation.
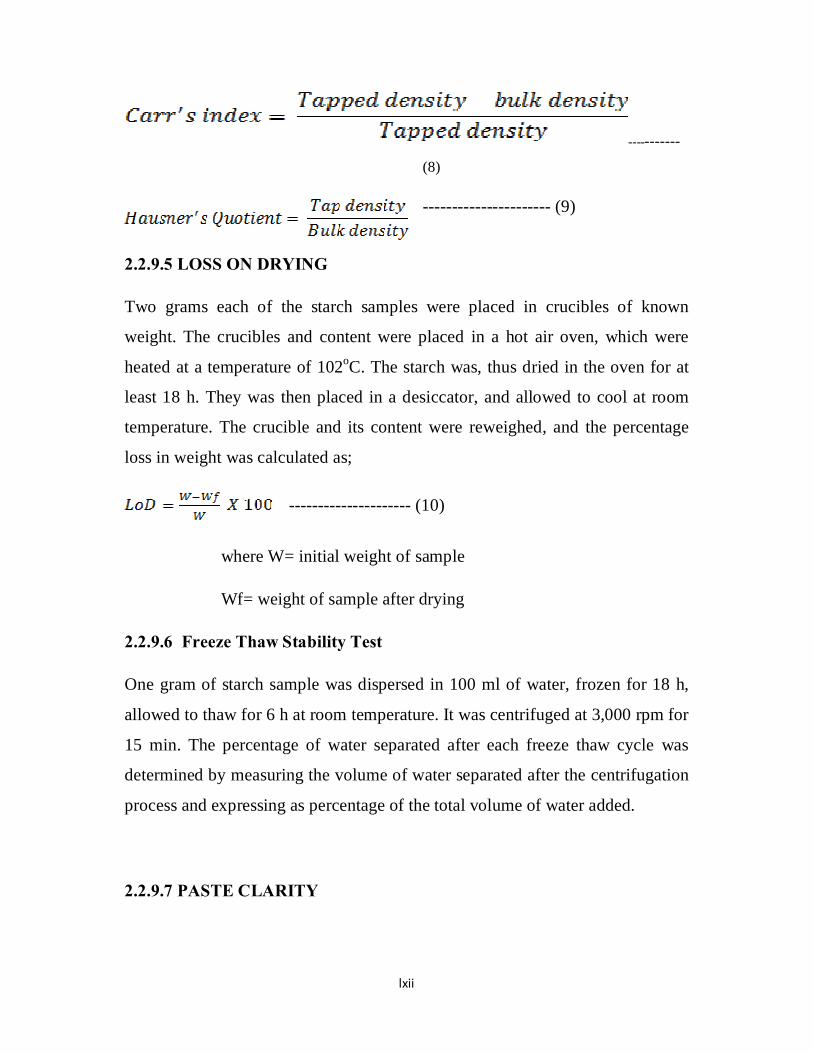
lxii
-----------
(8)
---------------------- (9) -
2.2.9.5 LOSS ON DRYING
Two grams each of the starch samples were placed in crucibles of known
weight. The crucibles and content were placed in a hot air oven, which were
heated at a temperature of 102oC. The starch was, thus dried in the oven for at
least 18 h. They was then placed in a desiccator, and allowed to cool at room
temperature. The crucible and its content were reweighed, and the percentage
loss in weight was calculated as;
--------------------- (10)
where W= initial weight of sample
Wf= weight of sample after drying
2.2.9.6 Freeze Thaw Stability Test
One gram of starch sample was dispersed in 100 ml of water, frozen for 18 h,
allowed to thaw for 6 h at room temperature. It was centrifuged at 3,000 rpm for
15 min. The percentage of water separated after each freeze thaw cycle was
determined by measuring the volume of water separated after the centrifugation
process and expressing as percentage of the total volume of water added.
2.2.9.7 PASTE CLARITY

lxiii
One gram of Cyperus esculentus starch was dispersed in 25 ml of distilled water
to get 4 % concentration from which concentrations of 0.5, 1.0, 1.5, 2.0 and 2.5
% were made. The amount of light transmitted was determined using a
spectrophotometer (Jeanway 6305. UK) at a wavelength of 283 nm. The
transmittance readings were recorded for each of the starch concentrations
2.2.9.8 BROWNING AND CHARRING TEMPERATURES
One gram of Cyperus esculentus starch powder was weighed out and some
quantities put into a capillary tube that was sealed at one end. It was heated at a
rate of 60 0C per minute for 5 min in a melting point apparatus (SuPII, Biocide)
to a temperature of 300 o C. The temperature at which the starch turned to
brown colour was noted as the browning temperature and the temperature at
which it was charred was recorded as the charring temperature. The test was
done in triplicate and the result taken as the average of the 3 readings in each
case. It was also done for corn starch BP.
2.2.9.9 GELATINIZATION TEMPERATURE
A quantity of Cyperus esculentus starch (1.2g) was weighed and dispersed in 5
ml of distilled water inside a test tube. The test tube was placed in a water bath
set at 50 o C which was then increased gradually by 4 o C per minute. The slurry
was observed visually at each temperature.
The point at which there was a transformation from starch slurry to starch
mucilage was observed and the gelatinization temperature estimated. The test
was done in triplicate and the mean value taken. Corn starch BP was similarly
analyzed.
lxiv
2.2.9.10 ASH VALUE
Twenty five gram of starch sample was ignited in the presence of oxygen in a
crucible using hot plate (Jenway 1000) at a temperature of 200 0C until it was
charred (at 4 min). The charred starch was transferred to a furnace (Vecstar
furnace, Crust field, UK model F3) and burned at 600 0C for 8 h. It was allowed
to cool, and the residue was weighed .The test was done in triplicate and the
ash value (As) was calculated as the percentage of starch sample lost using the
formula; (79).
------------------------- (11)
Where Wo is the initial weight of starch sample
W is the weight of starch sample after cooling
The test was also carried out on corn starch BP.
2.2.9.11 HYDROGEN ION CONCENTRATION (pH)
Two grams of Cyperus esculentus starch powder was accurately weighed in an
electronic balance, dispersed in 100 ml of distilled water with glass rod for 5
min and allowed to stand for 10 min. The pH of the supernatant liquid was
determined three times using a pH meter (E.Kent, England). The average pH
was taken.
2.2.9.12 FOAM CAPACITY
Two gram quantity of the starch contained in a 100 ml measuring cylinder was
homogenized in 100 ml of distilled water using a vortex mixer for 5 min. It was
allowed to stand for 30 s after which the volume was recorded. The foam
capacity was expressed as the percentage increase in volume. Mean of three
replicated test is reported. This test was carried out on corn starch BP.

lxv
2.2.9.13 EMULSION CAPACITY
Two gram quantity of the starch was dispersed in 25 ml of distilled water using
a vortex mixer (Scientific Industries Vortex Geni 2) for 30 s. After complete
dispersion, 25 ml of vegetable oil (groundnut oil) was added gradually and the
mixing continued for another 30 s. The suspension was centrifuged at 1,600 rpm
for 5 min. The volume of oil separated from the sample was determined. The
emulsion capacity is the amount of oil emulsified and held per gram of the
sample. The test was done in triplicate and the average reading taken. The
experiment was similarly conducted on corn starch BP.
2.2.9.14 MOISTURE CONTENT
Five grams of Cyperus esculentus starch was accurately weighed in an
analytical balance and was evenly spread on a clean watch glass of 86 cm
diameter which was previously weighed. The set up was placed in an oven and
maintained at 60 0C. Occasionally, the set up was brought out and reweighed
after cooling in desiccators until constant weight was achieved. The experiment
was repeated using corn starch BP.
2.2.9.15 MORPHOLOGY AND SURFACE AREA
The shape, mean diameter and size distribution of Cyperus esculentus starch
granules was measured using a light microscope (Olympus model UPFL, UK).
One gram of Cyperus esculentus starch was dispersed in 5 ml of water. The
suspension was stirred at room temperature for 30 s after which it was viewed
under the light microscope to check the area of the slide covered by the starch
granule.
lxvi
2.2.10 PHYTOCHEMICAL STUDIES
Five hundred milligrams of the starch sample was dispersed in 10 ml of water to
form starch slurry and the following tests were carried out.
(a) Test for alkaloids: 1 ml of Dragendorff’s (potassium bismuth iodide
solution) reagent was added to 1 ml of starch slurry and observed for
orange red precipitate
b) Test for carbohydrates: 1 ml of α-naphthol solution was added to a 2 ml
portion of the starch slurry and few drops of concentrated sulphuric acid (
H2SO4 ) was slowly added down the side of the sloping test tube. The
tube was observed for purple or reddish violet colour at the junction of
the two liquids
c) Test for flavonoids: A 0.1 ml quantity of Amyl alcohol, sodium acetate
and ferric chloride solutions were added to 1 ml portion of the starch
slurry and observed for a yellow color solution which disappears on
addition of an acid.
e) Test for saponins: 20 ml of distilled water was added to 1 ml portion of
starch slurry, and shaken for 15 min lengthwise and then observed for the
formation of a layer of foam.
f) Test for tannins: 0.5 ml of ferric chloride solution was added to I ml
portion of the starch slurry and observed for the formation of dark blue or
greenish black coloured product.
g) Test for phenolic compounds: 0.5 ml of strong potassium dichromate
solution was added to 1 ml of the starch slurry. It was observed for a
yellow colour precipitate.

lxvii
h) Test for proteins and amino acids: 1 ml of 40 %sodium hydroxide
solution ( NaOH ), and 2 drops of 1 % copper sulphate solution (CuS04 )
were added to 1 ml portion of the starch slurry which produced a blue
colour. 1 ml of the starch slurry was added to the mixture and then
observed for the formation of pink or purple violet colour.
2.2.11 ELEMENTAL ANALYSIS OF THE STARCHES
One gram of each of the starches was heated in a furnace to ash by the dry
combustion method. The ashed starch sample was digested in 10 ml of 50 %
HCl and made up to 100 ml with distilled water. The digested sample was
analysed in atomic absorption spectrometer (GBC Scientific equipment, Savant
AA, Australia) equipped with lamps of various metals. Corn starch BP was also
analyzed using the same procedure.
2.2.12 THERMAL ANALYSIS
Thermal characteristics of starch sample were studied by using differential
scanning calorimeter (PerkinElmer,USA) equipped with a thermal analysis
station. Each of the starch samples (3.5 mg), dry weight was loaded into an
aluminum pan and 0.00245 ml of distilled water was added with the help of
Hammitton micro syringe to achieve a starch-water suspension containing 70 %
water. These pans were hermetically sealed, equilibrated at room temperature
for 1 h and heated at 20 to 120 oC at a heating rate of 10 oC/min. The melting
enthalpy and the temperature axis were calibrated with indium. Each test was
carried out with an empty pan as a reference and the onset temperature of
gelatinization (To), the peak temperature (Tp), the gelatinization temperature at
conclusion (Tc), and melting enthalpy (DH) were recorded.

lxviii
The range of gelatinization temperature (R) was computed as (Tc-To) and the
peak height index (PHI) was calculated as the ratio DH/Tp-To
2.2.13 AMYLOSE /AMYLOPECTIN RATIO IN Cyperus esculentus
STARCH
For amylose content, 10 mg of Cyperus esculentus starch sample was weighed
into 100 ml beaker and 10 ml of 0.5 N potassium hydroxide solution was added.
The mixture was stirred with a glass rod until fully dispersed. The dispersed
sample was transferred into a 50 ml volumetric flask and diluted to the mark
with distilled water. Five millitres of the mixture was pipetted in a 50 ml
volumetric task, 5 ml of 0.1 N hydrochloric acid ( HCl ) and 0.5 ml of 0.1 N
iodine were added and the mixture diluted to 50 ml with distilled water. The
absorbance the resulting solution was taken at the wavelength of 625 nm. The
result was compared with a prepared standard amylase sample.
For total starch, 0.5 g of the Cyperus esculentus starch was weighed and heated
at at temperature of 67 o C ± 2 o C in 50 ml of distilled water for 30 min. One
millilitre of the sample suspension was pipetted into a beaker and 9 ml of
Anthrone reagent was added after which the absorbance was measured at 620
nm. The absorbance was compared with that of a standard Cyperus esculentus
starch sample.
Amylopectin: This was determined by taking the difference in the absorbance
values of amylose and total starch.
Similar test was done for corn starch BP.
2.2.14 MICROBIOLOGICAL ASSAY:
(a) Microbial Limit Test:
Preparation of medium

lxix
For bacteria: 15 ml of liquefied casein soya bean digest agar medium at a
temperature of 40 0C was poured into a Petri dish of about 10 ml capacity (80).
For fungi: 15 ml of liquefied saboraud dextrose agar (SDA) medium at a
temperature of 40 0C was poured (81). The total aerobic count in the substance
was examined by plate count method.
One gram of Cyperus esculentus starch was dispersed in 10 ml of pre-sterilized
sodium chloride peptone buffer solution and the pH was adjusted to 7.0 (step 1)
Five test tubes were taken and 9 ml of sodium chloride peptone buffer solution
was transferred into each of the test tubes and sterilized by autoclaving at 121 0C for 15 min (step 2). The sample (from step 1) was diluted serially from 10-1
to10-5 with distilled water. Using test tubes (from step 2), casein soya bean
digest agar and saboraud dextrose agar (SDA) were spreaded with 100 μL of the
serial solutions 10-1, 10-2, 10-3, 10-4 to 10-5 respectively. Casein soya bean digest
agar plates were incubated at 35 0C for 2 days and SDA plates were incubated at
25 0C for 5 days.On the fifth day, the plates were examined for microbial
contamination. The number of colony forming units was counted using a colony
counter. Control plates were also prepared. The tests were done in triplicate and
the average values taken.
(b) Coliform test:
One gram of Cyperus esculentus starch sample was added to lactose broth
medium, made up to 10 ml and incubated for 24 h at 30 0C. The tube was
shaken slightly and a portion of the fluid was taken using an inoculating loop. It
was streaked on McConkey agar medium and incubated for 24 h at 30 0C. The
plate was then examined for brick red colouration.
2.2.15 DEXTROSE EQUIVALENCE OF Cyperus esculentus Starch

lxx
One hundred milligrams of starch sample was weighed into a boiling tube and
allowed to boil for 3 h in the presence of 5 ml of 2.5 N HCl to achieve complete
hydrolysis. The hydrolysate was cooled to room temperature and neutralized
with solid sodium carbonate (Na2CO3 ) until the effervescence ceased. It was
made up to 100 ml volume with distilled water and centrifuged at 2000 rpm for
15 min. The supernatant was collected and 0.5 and 1 ml aliquot of it
respectively were taken for analysis using ultraviolet spectrophotometer at
wavelength of 340 nm. The dextrose content was analyzed by comparing with a
standard solution of glucose. A calibration curve was obtained with the standard
glucose by dissolving 8 mg of glucose in 200 ml of distilled water (0.004
mg/ml) and withdrawing 5 ml aliquot of the stock solution for analysis.
2.2.16 PHYSICAL COMPATIBILITY STUDIES
Drug-excipient compatibility test was undertaken to determine the interaction of
paracetamol with various excipients. Three batches of drug-excipient mixtures
were tested as A, B and C according to the formula in Table 1. The A, B and C
admixtures were stored for 4 weeks at 40 oC/ 75 %RH and at 50 0C/ 75 %RH.
They were checked every week for any change in physical appearance.
2.2.17 FORMULATION OF PARACETAMOL TABLETS
2.2.17. 1 Granulation Procedures
(A) Endo disintegrants
Fifty grams of paracetamol, 0.5 g, 1.0g, 2.5 g, and 5.0 g of Cyperus starch
(Tiger nut starch) as the case may be, was weighed in a porcelain mortar. The
powders were wet massed with binder solution formed by mixing 4.0 g of corn
starch, 0.8 g of gelatin and 0.05 g of sodium benzoate made in a paste by
heating at 100 o C with about 10 ml of water for 2 min to form an adhesive mass

lxxi
The wet-massed powder blend was screened through a sieve of 1.7 mm mesh
screen. The screened wet granules were spread as a thin layer on a tray and
dried in an oven (tray drier) at a controlled temperature between 48 and 52o C
for 30 min. The dried granules were screened through sieve 1.0 mm mesh and
bottled.
(B) Exo disintegrant
Fifty grams of paracetamol was weighed in a porcelain mortar. The powders
was wet massed with binder solution formed by mixing 4.0 g of corn starch, 0.8
g of gelatin and 0.05 g of sodium benzoate made in a paste with about 10 ml of
water to form an adhesive mass.The wet-massed powder blend was screened
through a sieve of 1.7 mm mesh screen. The screened wet granules were spread
as a thin layer on a tray and dried in an oven (tray drier) at a controlled
temperature between 48 and 52o C for 30 min. dried granules were screened
through sieve 1.0 mm mesh and bottled.
Table 1 Drug excipient-admixtures
Materials A B C
Paracetamol (g) 50.00 50.00 50.00
Corn starch (g) 4.00 — —
Cyperus esculentus (g) — — 4.00
Gelatin (g) 0.80 0.80 0.80
Sodium benzoate (g) 0.05 0.05 0.05
Talc (g) 0.80 0.80 0.80
Magnesium stearate (g) 1.20 1.20 1.20
Table 2. Formula for Paracetamol tablets using Cyperus esculentus starch as a disintegrant.
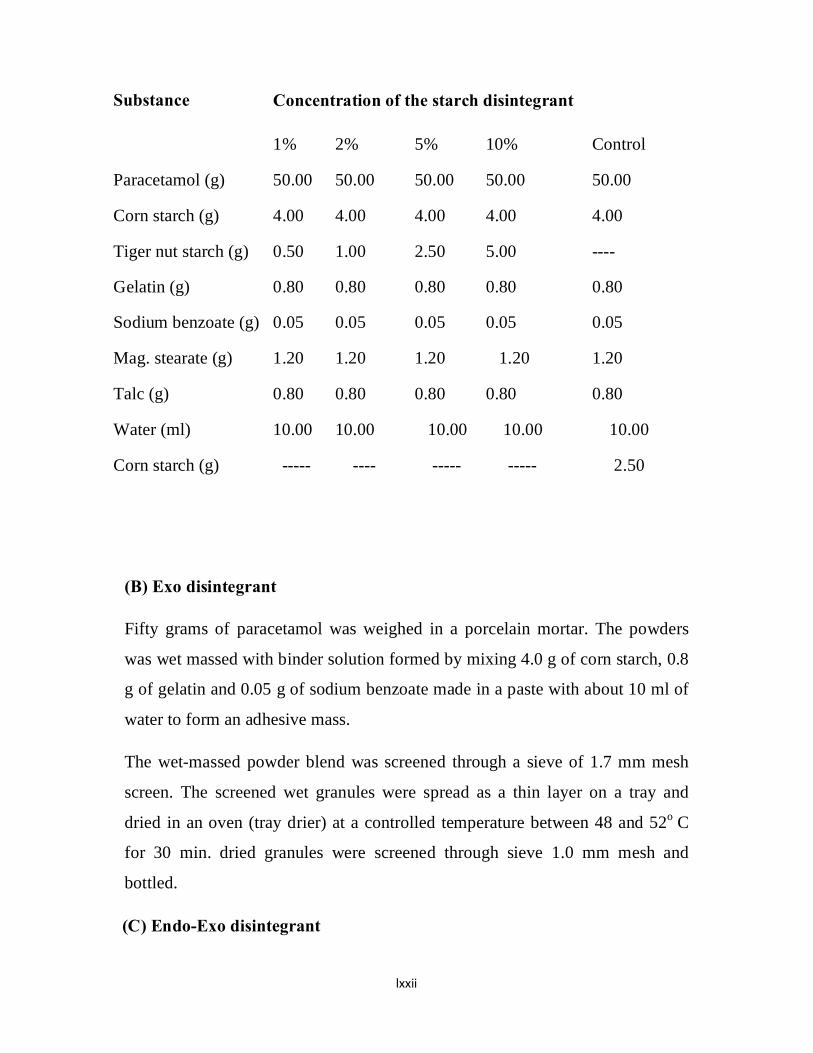
lxxii
Substance Concentration of the starch disintegrant
1% 2% 5% 10% Control
Paracetamol (g) 50.00 50.00 50.00 50.00 50.00
Corn starch (g) 4.00 4.00 4.00 4.00 4.00
Tiger nut starch (g) 0.50 1.00 2.50 5.00 ----
Gelatin (g) 0.80 0.80 0.80 0.80 0.80
Sodium benzoate (g) 0.05 0.05 0.05 0.05 0.05
Mag. stearate (g) 1.20 1.20 1.20 1.20 1.20
Talc (g) 0.80 0.80 0.80 0.80 0.80
Water (ml) 10.00 10.00 10.00 10.00 10.00
Corn starch (g) ----- ---- ----- ----- 2.50
(B) Exo disintegrant
Fifty grams of paracetamol was weighed in a porcelain mortar. The powders
was wet massed with binder solution formed by mixing 4.0 g of corn starch, 0.8
g of gelatin and 0.05 g of sodium benzoate made in a paste with about 10 ml of
water to form an adhesive mass.
The wet-massed powder blend was screened through a sieve of 1.7 mm mesh
screen. The screened wet granules were spread as a thin layer on a tray and
dried in an oven (tray drier) at a controlled temperature between 48 and 52o C
for 30 min. dried granules were screened through sieve 1.0 mm mesh and
bottled.
(C) Endo-Exo disintegrant

lxxiii
Fifty grams of paracetamol, 0.25, 0.5, 1.25, or 2.5 g of Cyperus esculentus
starch in each case were weighed and mixed by geometric dilution in a
porcelain mortar. The mixed powders were wet massed with binder solution
formed by mixing 4.0 g of corn starch, 0.8 g of gelatin and 0.05 g of sodium
benzoate made as a paste with about 10 ml of water to form an adhesive mass.
The wet-massed powder blend was screened through a sieve of 1.7 mm mesh
screen. The screened wet granules were spread in a thin layer on tray and dried
in an oven (tray drier) at a controlled temperature between 48 and 520 C for 30
min. The dried granules were screened through sieve 1.0 mm mesh and bottled.
Control samples were prepared using 5 % corn starch as exo, endo and exo-
endo disintegrants.
(D) Starch Used as Binders
Fifty gram of paracetamol powder, 4.0 g of corn starch were weighed and
mixed by geometric dilution in a porcelain mortar. The mixed power were wet-
massed with binder solutions (2.5, 5.0, 7.5 or 10.0 % tiger nut starch as the case
may be) mixed with 0.05 g of sodium benzoate to form an adhesive mass. The
wet massed powder blend was screened through a sieve of 1.7 mm mesh screen.
The screened wet granules were spread as a thin layer on tray and dried in an
oven (tray drier) at a controlled temperature between 48 and 52 0C. The dried
granules were screened through sieve 1.0 mm mesh to separate them into coarse
and fine granules. Control samples were prepared using 5 % corn starch as
binder.
2.2.17.2 MICROMERITIC PROPERTIES OF PARACETAMOL
GRANULES
The following properties of the granules were evaluated; granule flow rate,
tapped and bulk densities of granules, Hausner’s quotient and compressibility

lxxiv
index, angle of repose and loss on drying (LOD). The methods used were
similar to those used for the starch sample.
Granule size distribution: The granules were analyzed for size distribution using
sieve analysis method (82). The granules were all passed through sieves of sizes
1.0 mm and 0.7 mm. The different weights were taken and percentage size
distribution calculated.
Determination of moisture content of granules: This was determined using a
moisture analyzer (Satorious, Germany). 1g of paracetamol granules was
weighed and spread out on the pan. The samples were dried at 105 o C for 10
min. The weight difference due to loss of moisture was computed and expressed
as the percentage moisture content (83).
Determination of percentage fines of granule batches: The percentage fines was
determined by the sieve method. The fine granules were passed through sieve of
aperture 0.7 um. The weights of the fines were taken and the percentage
calculated with respected to the weight of the whole granule batch.
Table 3.Formulation of Paracetamol using starch as binder.
Substance Concentration of the starch binder
2.5% 5% 7.5% 10% Control
Paracetamol (g) 50.00 50.00 50.00 50.00 50.00
Corn starch (g) 4.00 4.00 4.00 4.00 4.00
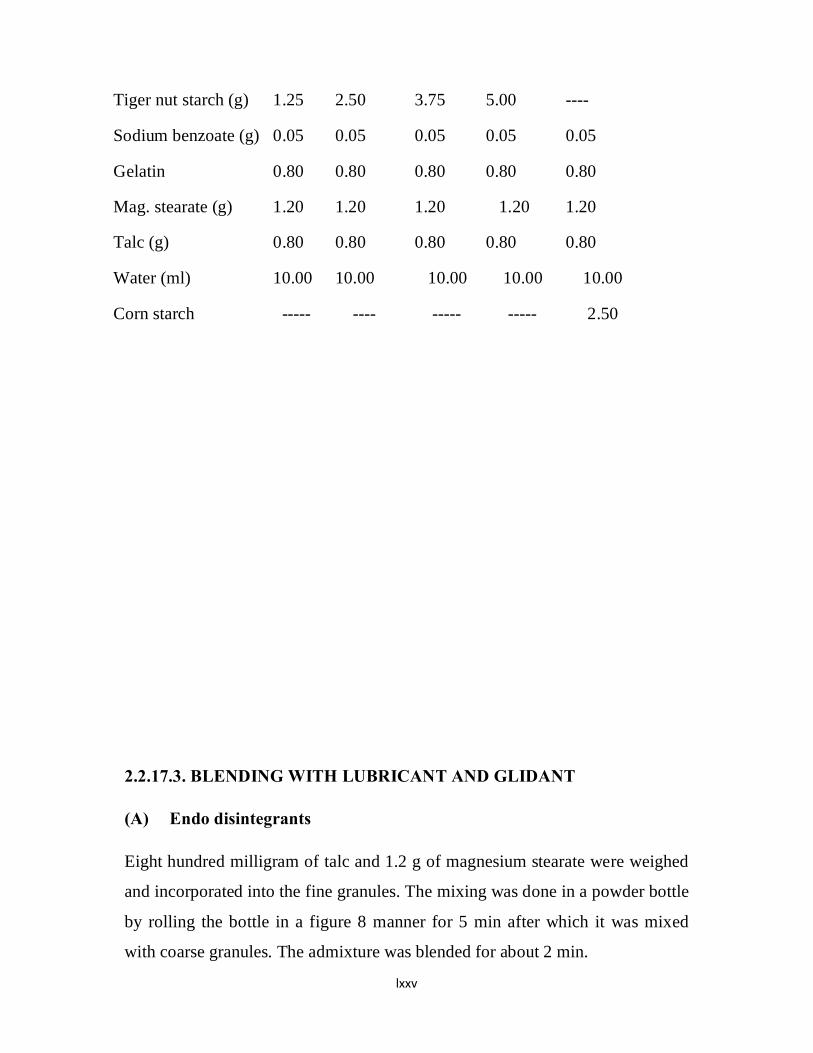
lxxv
Tiger nut starch (g) 1.25 2.50 3.75 5.00 ----
Sodium benzoate (g) 0.05 0.05 0.05 0.05 0.05
Gelatin 0.80 0.80 0.80 0.80 0.80
Mag. stearate (g) 1.20 1.20 1.20 1.20 1.20
Talc (g) 0.80 0.80 0.80 0.80 0.80
Water (ml) 10.00 10.00 10.00 10.00 10.00
Corn starch ----- ---- ----- ----- 2.50
2.2.17.3. BLENDING WITH LUBRICANT AND GLIDANT
(A) Endo disintegrants
Eight hundred milligram of talc and 1.2 g of magnesium stearate were weighed
and incorporated into the fine granules. The mixing was done in a powder bottle
by rolling the bottle in a figure 8 manner for 5 min after which it was mixed
with coarse granules. The admixture was blended for about 2 min.
lxxvi
(B) Exo disintegrants
Eight hundred milligram of talc and 1.2 g of magnesium stearate, 0.5, 1.0, 2.5,
or 5.0 g of Cyperus esculentus starch as the case may be were weighed and
incorporated into the fine granules contained in a powder bottle.
The mixing was done by rolling the bottle in a figure 8 manner for 5 min after
which it was mixed with coarse granules. The ad mixture was blended for about
2 min.
(C) Endo-exo disintegrants
Eight hundred milligram of talc and 1.2 g of magnesium stearate, 0.25, 0.50,
1.25, or 2.50 g of Cyperus esculentus starch as the case may be were weighed
and incorporated into the fine granules. The mixing was done in a powder bottle
by rolling the bottle in a figure 8 manner for 5 min after which it was mixed
with the coarse granules. The admixture was blended for about 2 min.
(D) Starch used as binders: Eight hundred milligram of talc and 1.2 g of
magnesium stearate were weighed and incorporated into the fine granules. The
mixing was done in a powder bottle by rolling the bottle in a figure 8 manner
for 5 min after which it was mixed with coarse granules. The admixture was
blended for about 2 min.
2.2.17.4 COMPRESSION OF PARACETAMOL GRANULES INTO
TABLETS
Compression of granules into tablet was done in a single punch tabletting
machine (Manesty F3, UK) fitted with 9.00 mm punch and dies. The tablets
were compressed automatically and the targeted tablet weights were between
266.75 and 289.25 mg. 200 tablets ± 9 tablets were produced for each batch.

lxxvii
2.2.18 EVALUATION OF PARACETAMOL TABLET PROPERTIES
2.2.18.1 APPEARANCE:
The appearance of paracetamol tablets produced was evaluated visually.
2.2.18.2 DIMENSIONS:
The diameter and thickness were measured using a Venier calipers.
2.2.18.3 WEIGHT VARIATION
Twenty tablets from each batch of the tablet formulation were picked at random
and weighed three times individually using an electronic weighing balance
(OHAUS Adventurer, England). The tablets were also weighed individually and
their weights recorded. The mean weight, standard deviation and coefficient of
weight variation were calculated.
2.2.18.4 RESISTANCE TO ABRASION
Twenty tablets were randomly selected from each batch of the tablets, de-dusted
carefully and lightly until any surface powder was removed. The twenty tablets
were weighed accurately with the mettler balance and the initial weight, Wo was
recorded. They were placed inside the Erweka Friabilator and rotated for 4
minutes at a speed of 25 rpm. The tablets were removed from the Friabilator,
de-dusted and reweighed. The final weight, W was recorded. The friability F,
for each batch was calculated. The test was done in triplicate and the mean
percent friability calculated using the following formula.
Friability --------------------------- (12)
2.2.18.5 CRUSHING STRENGTH AND TENSILE STRENGTH

lxxviii
The crushing strength was determined using Monsanto hardness tester. The
diametrical hardness was tested for. A tablet was held between the fixed and
moving jaw of the hardness tester. The load gradually increased until the tablet
just fractured. The value of the load at this point gives a measure of the tablet
hardness. The hardness of six tablets from each batch, picked at random was
determined from which the average was obtained. The tensile strength was also
derived from these hardness values. The tensile strength of paracetamol tablet
batches produced was calculated according to the formula (84)
------------------------- (13) Where T = tensile strength (Nm-2)
F = Force required to cause fracture (N)
D = tablet diameter (m)
t = tablet thickness (m)
Note: 1kgF = 10N
2.2.18.6 IN VITRO DISINTEGRATION TIME
The disintegration times of the tablets produced were determined in a 700 ml of
distilled water at 37 0C ± 5 0C using Manesty disintegration test unit (). Six
tablets from each batch, picked at random were placed into each tube of the
disintegration time tester. The discs were placed on the tablets in each tube. The
units were switched on simultaneously with a stop watch. The times taken for
the tablets to break down into fragments and completely pass through the wire
mesh or to leave behind a palpable fluffy mass were recorded as the
disintegration time. Determinations for each batch were made in quadruplicate
and the mean values taken.
2.2.18.7 IN VITRO DISSOLUTION RATE/ DRUG RELEASE PROFILE

lxxix
The in vitro dissolution rate studies were performed in a dissolution test
apparatus () operated at 50 rpm. The dissolution medium was 900 ml of SGF or
SIF pH, 1.2 and 7.4 respectively at 37 0C ± 0.5 0C. At 10 min intervals, 10 ml
sample was withdrawn and immediately replaced with 10 ml sample of fresh
medium maintained at the same temperature. The withdrawn samples were
diluted appropriately and the amount of drug analyzed spectrophotometrically at
243 nm for SGF and 272 nm for SIF. Cumulative percentage drug release was
determined as a function of time and drug release at ten minutes interval.
Dissolution efficiency (DE) was calculated from the area under the dissolution
curve at time, t (measured using Trapezoidal rule) and expressed as a percentage
of the area of the trapezium described by 100% dissolution in the same time
(85).
AUCT = ---------------- (14)
Where AUCT = Area under the dissolution curve at time t
a = time t, 10 minutes before the time under consideration
b = time t, 10 minutes after the time under consideration
h = concentration of the dissolution medium
Dissolution Efficiency DEx = ------(15)
Where AUCO = Area under curve over the entire course of release.
2.2.18.8 CALIBRATION CURVE OF PARACETAMOL

lxxx
A stock solution of 0.147 mg/ml of paracetamol was prepared by dissolving 250
mg of the drug in 1700 mls of 0.1 N NaOH. Various dilutions of the stock were
made to obtain 0.00147, 0.00294, 0.00441, 0.00585, 0.00735, and 0.00882
mg/ml with 0.1 N NaOH. The absorbance of the various dilutions was taken at
wavelength of 243 nm using a UV-VIS spectrophotometer. A plot of
absorbance (A) against concentration (mg/ml) of the drug was made from which
the calibration curve was determined from the slope of the graph.
2.2.18.9 DENSITY OF TABLETS
The average weights, diameter and heights of four tablets picked at random
were taken. The bulk density of the tablets were determined by applying the
equation
--------------------------- (16)
Where h = thickness of tablets (cm3)
w = weight of tablets (g)
d = diameter of tablets (cm)
Bd = Bulk density of tablets
Tablet particle density
The particle density was determined by fluid displacement method. A 25 ml
capacity Pycnometer (density bottle) was filled with liquid paraffin at room
temperature. The weight of the filled Pycnometer was taken. Also, the weight of
empty Pycnometer was taken. The weight of the Pycnometer, with the liquid
paraffin and Paracetamol tablets dropped inside was taken in each case.
The particle density was determined by applying the equation of
Ohwourworhua et al (86).
------------ (17)

lxxxi
Where; ϱ1 = tablet particle density in g/cm3
W = tablet weight in g
SG = Liquid paraffin specific gravity = 0.802
a = pycnometer + liquid paraffin weight in g
b = pycnometer + liquid paraffin + tablet weight in g
The packing fraction of the tablets were calculated by the equation (87).
-----(18)
The porosity of tablets was determined by applying the equation (88).
= ------------------------- (19)
2.2.18.10 CRUSHING STRENGTH, FRIABILITY, DISINTEGRATION
TIME RATIO
This was calculated by finding the ratio of crushing strength to the friability and
also relating it to the corresponding disintegration time ratio (89).
2.3 STATISTICAL ANALYSIS
The whole data were collated and analyzed using SPSS Version 21. All the
values are expressed as mean ± SD. Statistically significant differences means
were assessed by Student’s T-test (P<0.001) and ANOVA.
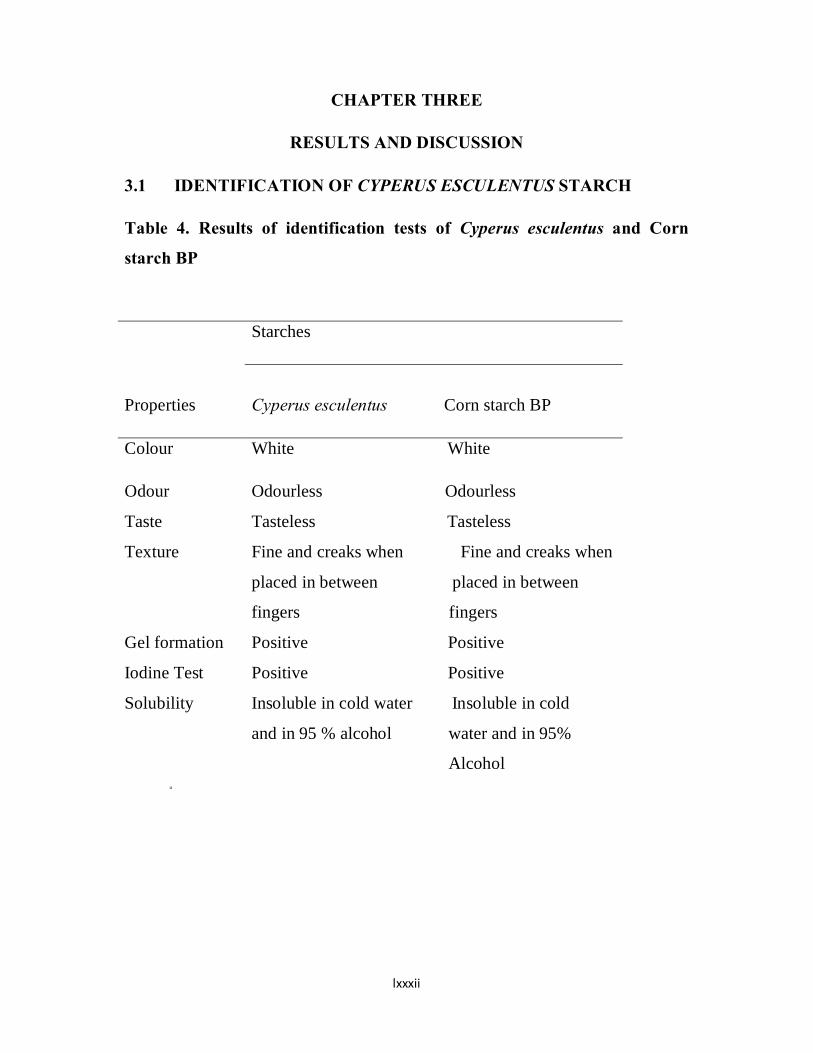
lxxxii
CHAPTER THREE
RESULTS AND DISCUSSION
3.1 IDENTIFICATION OF CYPERUS ESCULENTUS STARCH
Table 4. Results of identification tests of Cyperus esculentus and Corn
starch BP
Starches
Properties
Cyperus esculentus Corn starch BP
Colour White White
Odour Odourless Odourless
Taste Tasteless Tasteless
Texture Fine and creaks when Fine and creaks when
Gel formation
placed in between placed in between
fingers fingers
Positive Positive
Iodine Test Positive Positive
Solubility Insoluble in cold water Insoluble in cold
and in 95 % alcohol water and in 95%
Alcohol u
lxxxiii
Table 4 shows some of the properties of Cyperus esculentus starch and corn
starch BP that help in their identification. The results reveal that Cyperus
esculentus starch conforms well to BP standard for pharmaceutical grade starch.
It has strong affinity for moisture as a result of abundance of OH (hydroxyl)
groups in the molecule. Cyperus esculentus starch is insoluble in water owing to
the strong intramolecular hydrogen bonds holding the starch polymer together.
The white coloured Cyperus esculentus starch turned blue black in the presence
of iodine. This blue black colouration of Cyperus esculentus starch with 0.1N
iodine solution is due to the fact that the iodine complexes with coiling
Cyperus esculentus starch molecule to form helical conformations called
clarathes, thereby producing the colour ranging from deep blue to light red
depending on the length of the coiled chain(90).
3.2 PERCENTAGE YIELD OF STARCH
The starch extracted was weighed and the percentage yield calculated as
follows;
Weight of starch =0.93 Kg
Weight of Cyperus esculentus tubers =6.92kg
Percentage yield, = 13.4 %
The percentage yield obtained from extracting starch from Cyperus esculentus
tubers was 13.4 %. The yield was good. The availability, high yield, simplicity
of extraction and low cost of Cyperus esculentus tubers indicate that it can be
a potential source of pharmaceutical raw material.

lxxxiv
3.3 SOME PHYSICOCHEMICAL PROPERTIES OF CYPERUS
ESCULENTUS STARCH
Table 5: Physicochemical properties of Cyperus esculentus and Corn starch BP
Properties
Cyperus Corn esculentus starch
Acidity
1.93 1.76
Bulk density (gcm-3 ) 0.59 0.59 Tapped density (gcm-3 ) 0.72 0.76 True density (gcm-3 ) 1.011 1.42 Flow rate ( gs-1 ) 0.298 0.403 Angle of repose ( 0 ) 58.74 36.08 Compressibility index (%) 16.00 22.37 Hausner’s quotient (%) 1.19 1.29 Porosity (%) 16.00 16.50 Dynamic Viscosity of 2 % w/v
mucilage at 25 OC (mPa.S ) 13.00 12.60
Wettability (%) 1.25 1.31 Hydration capacity 10.3 1.71 Amylose: Amylopectin ratio 1 : 7 1: 4 Browning temperature (OC) 240 226 Charring temperature ( OC) 257 262 Ash value (Dry basis) (%) 4.8 4.2 pH 5.2 6.5 Foam capacity (%) 5.67 5.0 Emulsion capacity (ml/g) 2.3 5.2 Gelatinization temperature ( OC) 64 – 67 68-70 % of Simple sugar 8 6.8

lxxxv
Particle size (μm) 8.5 – 11 8.6-13 Moisture content (%) 2.72 11.42 Loss on drying (%) 4.10 2.35
The physicochemical parameters of starch were presented in table 5. Cyperus
esculentus starch possesses excellent physicochemical properties as shown in
Table 5. Acidity value of Cyperus esculentus starch was 1.93 ml. The BP
specification for acidity value is that not more than 2 ml of NaOH should
neutralize a pharmaceutical grade starch (77). Both Cyperus esculentus and corn
starch passed the test. The value of hydration capacity of 10.3 % is relatively
high. The implication of this is that Cyperus esculentus starch can absorb water
10.3times its own weight (91). This makes it a good candidate for use as a
disintegrant.The percentage of amylopectin is relatively high. Studies have
shown that amylose fraction of a starch sample is responsible for disintegration.
While the amylopectin expands, the amylose gives osmotic pressure (92). This
also makes it suitable for use both as binder and as disintegrant.
Although starch rarely contains volatiles other than water, loss on drying (LOD)
is a good technique to determine the volatile components present in the sample.
The 4.1 % LOD for Cyperus esculentus starch is within the limits set by the
USP and is attributed to the presence of moisture. Ash value of 4.8% also
shows that it has fewer impurities. This low value is good because of its health
implications. A pH of 5.2 is within USP range (93) of 4.5 – 7. This implies that
when Cyperus esculentus starch is used in formulation, it will not likely react
with pH sensitive active ingredients and other excipients in the formulation.
The particle size range of 8 – 11 μm is also within range. It has been shown that
the spherical shape of starch increases the porosity of tablets thus promoting
capillary action (94). This in turns enhances disintegration of the tablets and
ultimately bioavailability. The moisture content of 2.7% is adequate and within
specified limit as recommended by British Pharmacopoeia, 2011 (95). This

lxxxvi
ensures that the osmotic pressure present in the starch is such that it prohibits
growth. Thus Cyperus esculentus starch can be stored indefinitely if kept dry.
The value of gelatinization temperature is also low. This is of economic
importance because it will be adequate for food or products requiring moderate
temperature process. The browning and charring temperatures are high. This is
in agreement with the works of Builders, Emeje and Kunle (96). However, the
values of foam and emulsion capacities (5.67 % and 2.3 ml/g) are low.
Therefore, it cannot be used as an emulsifier (97).This agrees with the work of
Omojola and Akinwunmi (98).The results of micrometric studies show that
Cyperus esculentus starch is a poorly flowing powder and has low density (99).
Most starches start gelling at a temperature of 60 o C. The findings for Cyperus
esculentus starch agrees with that of Attama, Nnamani, Mbonu and Adikwu
(100).
Cyperus esculentus starch granules exhibits elliptical to spherical shape with a
relatively smooth surface as shown in Fig 1. Size distribution of a potential
excipient has been shown to affect various formulation characteristics such as
flowability, compactibility, water binding capacity, and drug release (1).
Although no precise categorization of granule size is documented in the
literature, starch granules have been arbitrarily classified as large (>25μm),
medium (10-25μm), small (5-10μm), and very small (≤5μm) (1). Cyperus
esculentus starch predominantly consists of small-to-medium-sized granules
(percent volume basis) with a mean particle size of 9.5 μm.
Result of freeze thaw stability test is shown in Table 6. It can be seen that
Cyperus esculentus starch paste released large amount of water. This may be
attributed to the low amylose content as well as possible aggregation and
amylose crystallization occurring during the first storage hours at different
storage conditions (6). This suggests that Cyperus esculentus starch gel will be
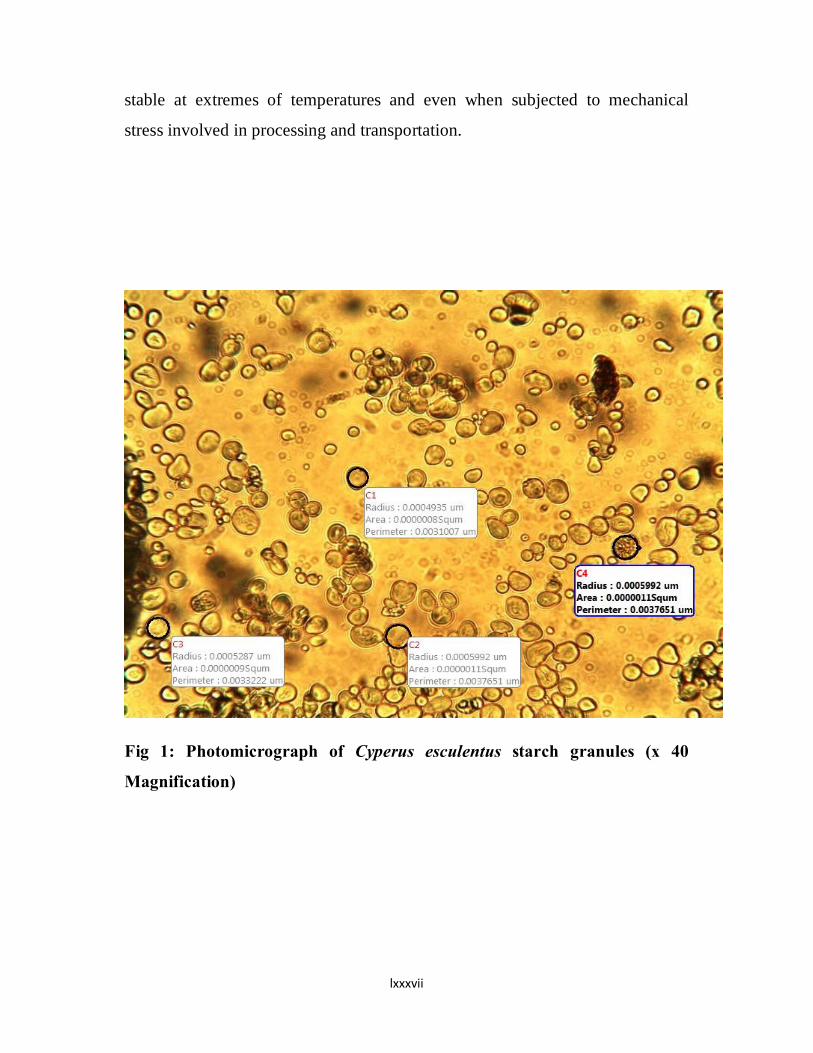
lxxxvii
stable at extremes of temperatures and even when subjected to mechanical
stress involved in processing and transportation.
Fig 1: Photomicrograph of Cyperus esculentus starch granules (x 40
Magnification)

lxxxviii
3.4 FREEZE THAW STABILITY
Table 6: Percentage of water separated after six freeze thaw cycles
No of Cycles
% water separated
1
82.20
2 85.50
3 88.89
4 88.89
5 88.89
6 88.90
3.5 CLARITY
Table 7: Percentage of light transmitted through different concentrations of
Cyperus esculentus starch paste.
Concentration (%) Transmittance (%)
0.50 4.00

lxxxix
1.00 2.00
1.50 2.00
2.00 1.00
2.50 1.00
The paste clarity results are shown in Table 7. The transmittance values are low.
This may affect the aesthetic appearance of the final product when this starch is
used.
Table 8 revealed that phytochemicals are absent in Cyperus esculentus starch.
Therefore, the possibility of interaction with any phytochemical and an active
ingredient when used is not there. This may be the reason why Cyperus
esculentus starch like any other starch is regarded as generally safe and non
toxic.
Table 9 shows some of the metallic elements present in Cyperus esculentus and
corn starch BP. Native starches are known to contain varying amounts of
monovalent and divalent cations inherited from the parent material. Incinerating
the starch sample and analyzing the residue (known as ash) can be used to
estimate the metal ions present in the sample (1). Cyperus esculentus starch
samples show a predominance of divalent cations as compared with maize
starch, which has been shown to primarily contain monovalent cations such as
sodium and potassium (101).The B.P gives limit test for a number of possible
contaminants in pharmaceutical raw materials which may be introduced into the
finished product during processing. Such tests include those for lead, arsenic,
calcium, iron, aluminum, potassium, halogens and a host of others.
Although the pharmacopoeial requirements are not categorical on the exact
tolerable level of any possible contaminant, it should be presumed that unusual
impurities are not tolerated. Atomic absorption spectrophotometric results of

xc
Cyperus esculentus starch as shown in Table 9 revealed that heavy metals such
as lead (Pb) and mercury (Hg) were absent. The presence of heavy metals in
formulated products is highly undesirable as they form stable covalent or co-
ordinate complexes with body proteins which may act as catalysts (due to their
variable valency states) to induce auto-oxidative reactions. The pharmacopoeia
has therefore placed stringent limits on the amount of lead and other heavy
metals that may be present in pharmaceutical products.
3.6 PHYTOCHEMICAL CONSTITUENTS
Table 8: Phytochemical constituents in Cyperus esculentus starch
Alkaloids Absent Carbohydrate Present Reducing sugars Absent Flavonoids Absent Saponins Absent Tannins Absent Phenolic compound Absent Protein Absent
3.7 ELEMENTAL COMPOSITION
Table 9: Elemental composition of I g weight of Cyperus esculentus and corn
starch BP.
Starch Elements
Value (ppm) Cyperus Corn starch esculentus BP
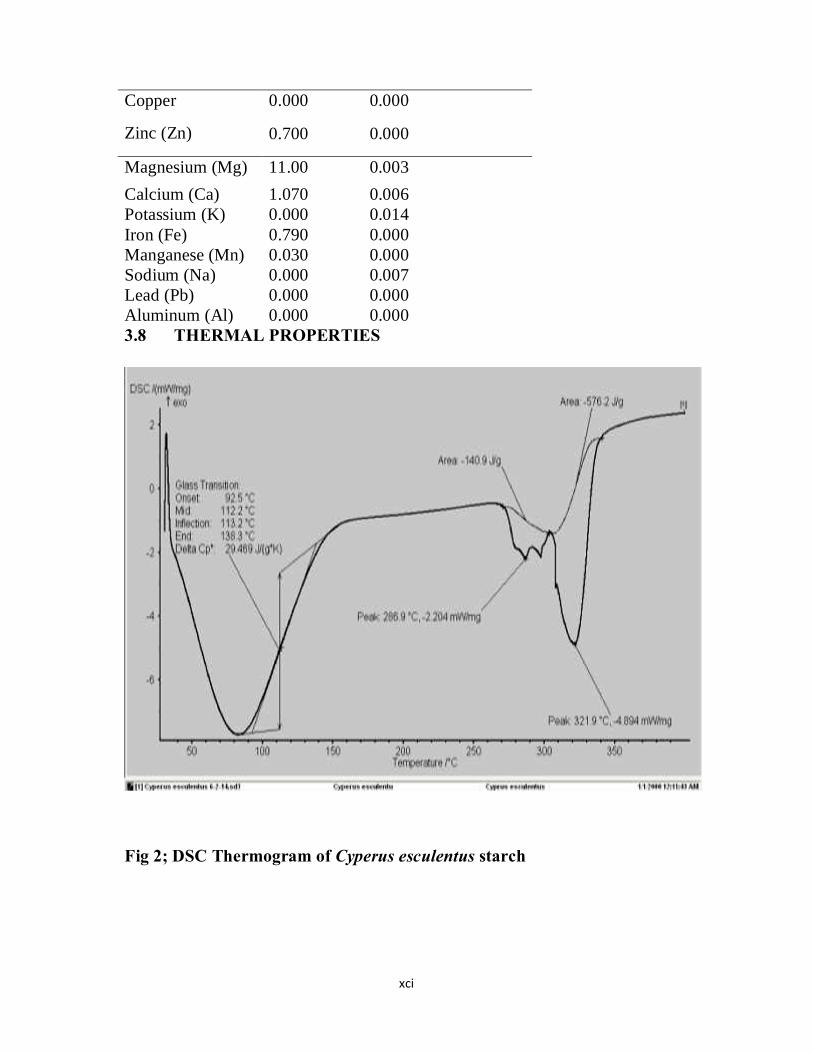
xci
Copper
Zinc (Zn)
0.000 0.000
0.700 0.000
Magnesium (Mg) 11.00 0.003 Calcium (Ca) 1.070 0.006 Potassium (K) 0.000 0.014 Iron (Fe) 0.790 0.000 Manganese (Mn) 0.030 0.000 Sodium (Na) 0.000 0.007 Lead (Pb) 0.000 0.000 Aluminum (Al) 0.000 0.000 3.8 THERMAL PROPERTIES
Fig 2; DSC Thermogram of Cyperus esculentus starch

xcii
From fig 2, it can be seen that the onset temperature of glass transition was 92.5 0C. The peak temperature was 286.9 0C. The glass transition temperature at
conclusion was 138.3 0C. The melting enthalpy (∆H gel) was 140.9 J/g. This
value of ∆H gel reflects melting of amylopectin crystallites (102). It is the
energy required to break hydrogen bonds of amylopectin. The range of glass
transition temperature (R) is 185 – 276.6 o C. This suggests the presence of
crystallites of varying stability within the crystalline domain of the granule
(103). The peak height index (PHI) which is a measure of uniformity in glass
transition is 0.720 J/g/0C
3.9 MICROBIAL LOAD
The total amount of bacteria in the Cyperus esculentus was found to be
7.75CFU/g. That of fungi was 5.31 CFU/g. There was absence of lactose
fermenters (coliforms). The total microbial load is an important parameter
which determines the suitability of a substance for use as excipient in
pharmaceutical formulation. According to many pharmacopoeias, for synthetic
and semi-synthetic substances, the total aerobic count should not be more than
100 colony forming unit (CFU) per gram and the total fungal count including
yeast and mould should not exceed 50CFu/g. If the excipient is of natural
origin, the total aerobic count should not be more than 1000CFu/g and the total
fungi should not exceed 1000CFu/g. If these microbes were not controlled, they
could lead to a change in viscosity and pH of the product. This occurs because
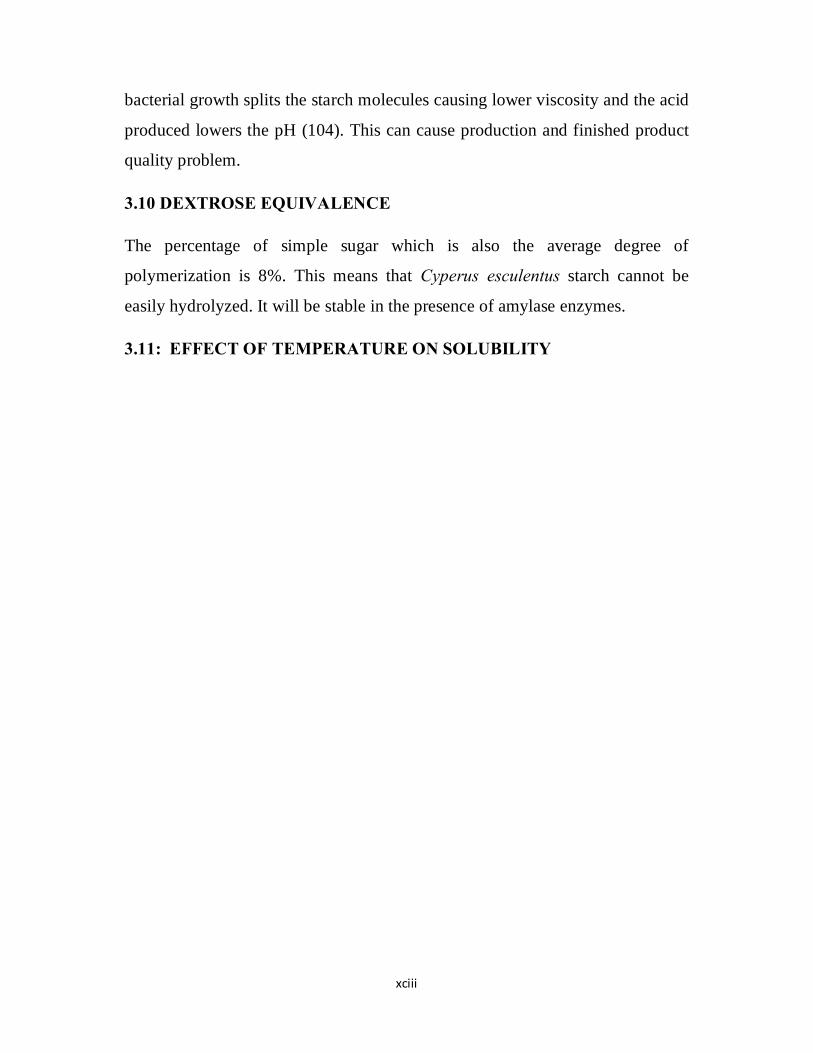
xciii
bacterial growth splits the starch molecules causing lower viscosity and the acid
produced lowers the pH (104). This can cause production and finished product
quality problem.
3.10 DEXTROSE EQUIVALENCE
The percentage of simple sugar which is also the average degree of
polymerization is 8%. This means that Cyperus esculentus starch cannot be
easily hydrolyzed. It will be stable in the presence of amylase enzymes.
3.11: EFFECT OF TEMPERATURE ON SOLUBILITY

xciv
Fig 3: Effect of temperature on solubility of Cyperus esculentus starch in water
3.12: Effect of temperature on swelling power

xcv
Fig 4: Effect of temperature on swelling power of Cyperus esculentus starch in
water
Figs 3 and 4 show the effects of temperature on solubility and swelling power of
both Cyperus esculentus starch and corn dispersions. It can be seen that both

xcvi
solubility and swelling power obviously increased as the temperature increased.
Solubility and swelling power depends on temperature. This may be because as
temperature increases, inter-molecular bonds are broken and the molecules tend
to tear apart. The swelling power of starch has been reported to depend on water
binding capacity of starch molecules brought about by hydrogen bonding. The
result shows that the highest solubility occurred at 95 o C. The result is in
agreement with that obtained by Kong, Bao and Corke (105).
3.13 EFFECT OF pH ON PERCENT SWELLING.
Fig. 5 shows of the effect of pH on percent swelling of Cyperus esculentus
starch. SGF, SIF and distilled water represented acidic, alkaline and neutral
media.It can be seen that there was gradual increase in swelling of starch with
time in distilled water and SIF. This may be attributed to the amylose and
amylopectin contents of Cyperus esculentus starch. This is an indication that the
starch will make a good binder.
Swelling is an index of the ability of individual powdered substance to take up a
particular fluid. It can be described in terms of rate of maximum fluid uptake at
equilibrium. Starch swelling is claimed to be dependent upon amylose and
amylopectin content. As amylopectin expands, the amylose releases osmotic
pressure. No swelling occurred in the SGF medium.
Swelling can be looked at as the initial phase of dissolution (106). What
happens is that as liquid is absorbed by the semi solid substance, the void spaces
are filled. This increases the pressure within the solid. This pressure will tend to
pull the molecules apart and they begin to swell. Further increase in pressure
will lead to erosion or dissolution as the case may be. Sometimes substances
take up liquids without measurable increase in volume, and this is called
imbibition.
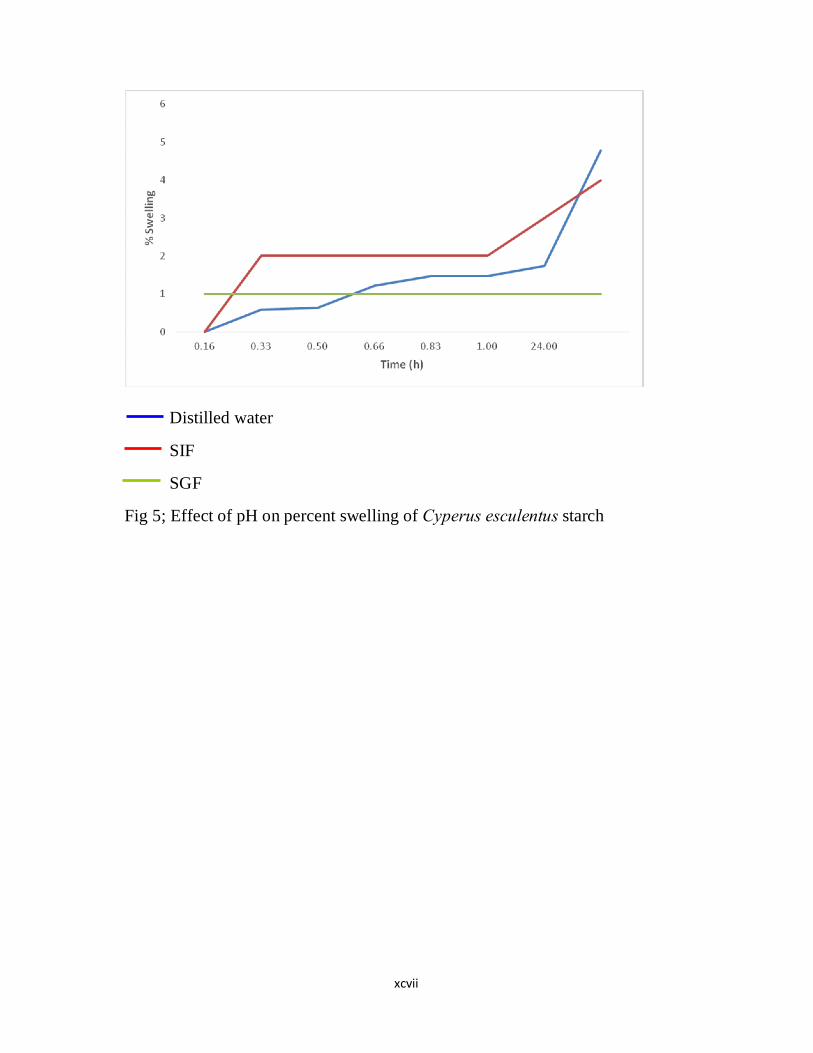
xcvii
Distilled water
SIF
SGF
Fig 5; Effect of pH on percent swelling of Cyperus esculentus starch

xcviii
3.14 EFFECT OF ELECTROLYTES (NaCl AND MgCl2) ON PERCENT
SWELLING
3.14.1 MONOVALENT ELECTROLYTE
2N
IN
0.5N
0.1N
Fig 6; Effects of monovalent electrolyte on extent of swelling of Cyperus esculentus starch
xcix
3.14.2 DIVALENT ELECTROLYTE
2N
1N
0.5N
0.1N
Fig 7; Effect of divalent electrolyte on degree of swelling of Cyperus esculentus
starch

c
Figs 6 and 7 show the effect of monovalent and divalent electrolytes (NaCl and
MgCl2 respectively) and their concentrations on the swelling properties of
Cyperus esculentus starch.
The graphs show the dependency of swelling on the ionic strength of Cyperus
esculentus starch. The decrease in the extent of swelling observed upon the
addition of electrolytes was presumably due to the effect of the electrolytes on
the polymer. The addition of large amounts of highly soluble salts to a polymer
often leads to changes in some of its physicochemical properties. The effect of
an additive depends very much on the influence it has on the structure of the
polymer or its ability to compete with solvent molecule. Various investigations
have shown that the presence of electrolytes in solution decreases the swelling
of polymers. Ionic strength, which is a measure of the integrity of the electrical
field in solution, provides a basis for evaluating electrostatic interactions
between ions (107). It has been shown that the effect of an electrolyte on
polymer depends on the intensity of electrical field in the solution (108).
Generally, increase in concentration of the electrolytes caused decrease in the
fluid uptake, a finding which has already been reported for other polymers
(109). The increase in ionic strength of the solution decreases the osmotic
pressure inside the charged molecule and its swelling is thus reduced.
3.15 CHARACTERISTICS OF GRANULES PRODUCED.
Table 10 shows the properties of granule batches produced. It can be seen that
densification of paracetamol powder improved the flow. These results revealed
a good flowing granule as indicated by the results in table 10. The values of
compressibility index ranged from 6.64 to 20.85 with most of the values falling
below 16.00%. Low compressibility index (<16) indicates that it is a free
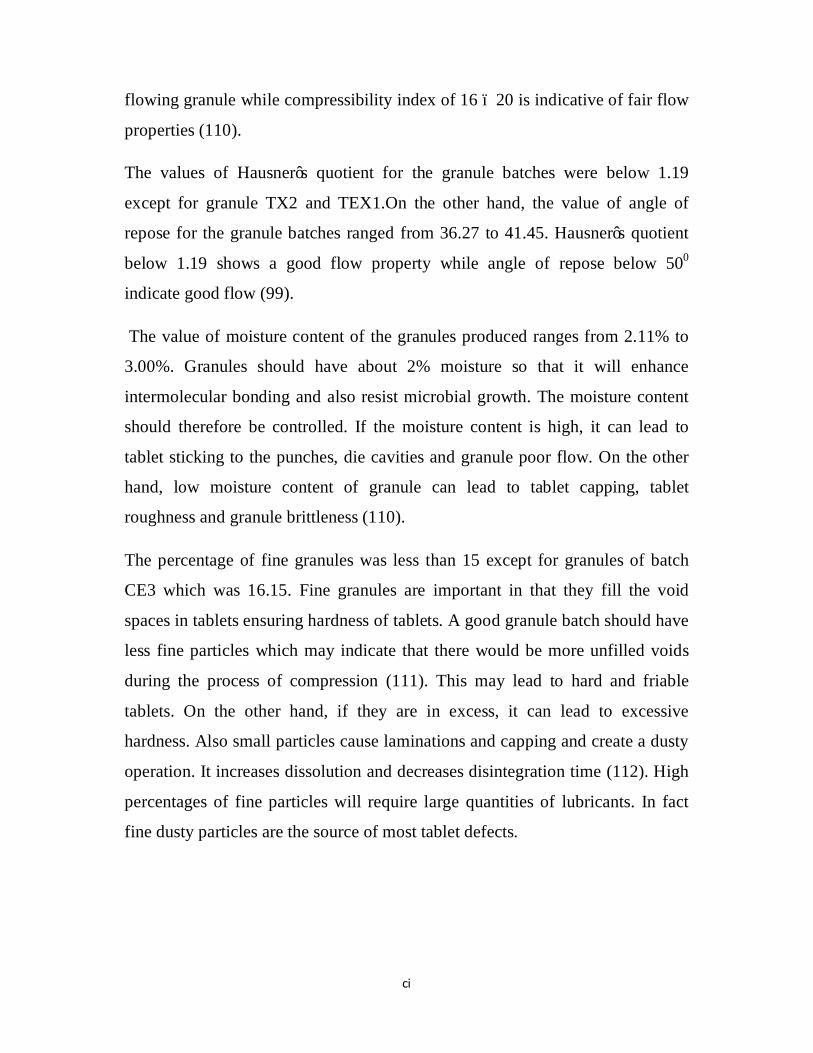
ci
flowing granule while compressibility index of 16 – 20 is indicative of fair flow
properties (110).
The values of Hausner’s quotient for the granule batches were below 1.19
except for granule TX2 and TEX1.On the other hand, the value of angle of
repose for the granule batches ranged from 36.27 to 41.45. Hausner’s quotient
below 1.19 shows a good flow property while angle of repose below 500
indicate good flow (99).
The value of moisture content of the granules produced ranges from 2.11% to
3.00%. Granules should have about 2% moisture so that it will enhance
intermolecular bonding and also resist microbial growth. The moisture content
should therefore be controlled. If the moisture content is high, it can lead to
tablet sticking to the punches, die cavities and granule poor flow. On the other
hand, low moisture content of granule can lead to tablet capping, tablet
roughness and granule brittleness (110).
The percentage of fine granules was less than 15 except for granules of batch
CE3 which was 16.15. Fine granules are important in that they fill the void
spaces in tablets ensuring hardness of tablets. A good granule batch should have
less fine particles which may indicate that there would be more unfilled voids
during the process of compression (111). This may lead to hard and friable
tablets. On the other hand, if they are in excess, it can lead to excessive
hardness. Also small particles cause laminations and capping and create a dusty
operation. It increases dissolution and decreases disintegration time (112). High
percentages of fine particles will require large quantities of lubricants. In fact
fine dusty particles are the source of most tablet defects.

cii
Table 10 Characteristics of granules produced.
Batch* Av. Flow
rate
g/s
Av. Bulk
Density
g/cm3
Tapped
density
g/cm3
True
density
g/cm3
Hausner’s
quotient
Compress-
ibility
Index (%)
Angle of
repose
(degrees)
%
Fines
Moisture
content
(%)
Loss on
drying
(%)
CE3 7.79 0.417 0.478 0.704 1.1410 12.39 40.58 16.15 2.80 3.95
TE1 8.64 0.421 0.486 0.711 1.1540 10.04 39.52 12.20 2.52 4.30
TE2 8.62 0.413 0.481 0.697 1.1650 14.14 39.77 15.60 2.95 2.10
TE3 8.49 0.421 0.467 0.711 1.1090 9.85 40.57 14.65 2.61 3.85
TE4 9.09 0.393 0.459 0.664 1.1530 13.29 38.92 13.64 2.93 4.40
CX3 8.54 0.413 0.479 0.696 1.1590 13.77 41.45 10.90 2.41 3.86
TX1 8.52 0.413 0.471 0.697 1.1400 12.31 39.64 12.20 2.31 3.54
TX2 8.59 0.387 0.489 0.654 1.2640 20.85 39.69 15.05 2.21 4.00
TX3 8.57 0.417 0.473 0.705 1.1340 11.83 40.77 9.90 2.11 4.10
TX4 8.67 0.378 0.462 0.639 1.2220 18.18 39.95 19.90 2.85 6.50
CEX3 8.13 0.422 0.452 0.713 1.0710 6.64 40.72 11.88 2.61 3.66
TEX1 8.55 0.350 0.433 0.592 1.2230 18.24 41.39 20.69 2.85 4.45
TEX2 8.96 0.370 0.438 0.625 1.1840 15.53 40.30 15.82 2.73 4.31
TEX3 8.06 0.413 0.449 0.696 1.0870 8.02 41.23 15.01 2.66 4.21
TEX4 9.12 0.390 0.450 0.659 1.2190 18.00 36.27 10.70 2.61 3.60
BC3 10.87 0.441 0.490 0.706 1.1110 10.00 39.81 11.78 2.99 3.05
BT1 9.06 0.418 0.466 0.657 1.1150 10.30 36.67 48.38 2.28 4.81
BT2 9.90 0.389 0.442 0.759 1.1360 11.90 39.38 15.39 2.50 4.21

ciii
BT3 10.00 0.449 0.490 0.758 1.0910 8.37 38.79 15.96 2.80 2.00
BT4 10.10 0.430 0.486 0.726 1.1300 11.52 37.48 14.67 3.00 3.24
*Description of symbols are shown in the glossary
Granule size distribution.
Control 1% 2% 5% 10%
Fig 8; Percentage size distribution of paracetamol granules with starch
disintegrant incorporated intra-granularly.
Control 1% 2% 5% 10%
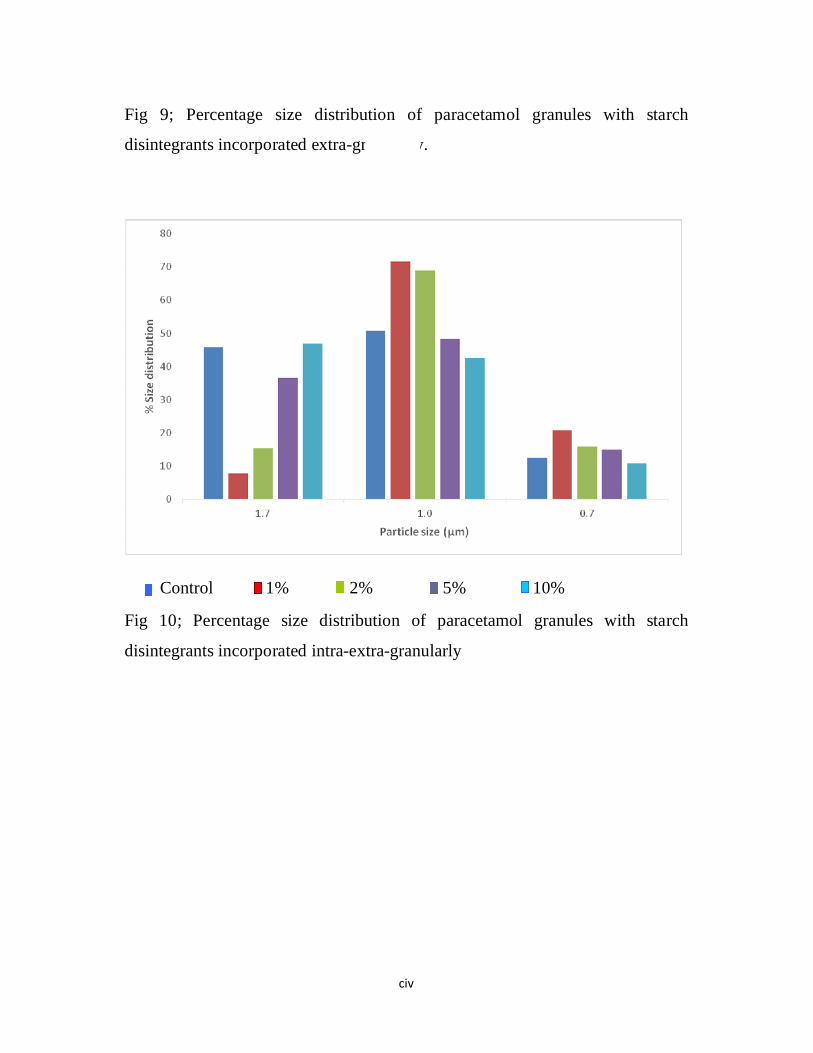
civ
Fig 9; Percentage size distribution of paracetamol granules with starch
disintegrants incorporated extra-granularly.
Control 1% 2% 5% 10%
Fig 10; Percentage size distribution of paracetamol granules with starch
disintegrants incorporated intra-extra-granularly

cv
Control 1% 2% 5% 10%
Fig. 11: Percentage size distribution of paracetamol granules with starch as
binder
Figs. 8 - 11 show the percentage size distribution of paracetamol granule
batches. The granule sizes for all the batches were appropriately distributed.
Fine particles are important as they will fill up the spaces within the coarse
granules in order to maintain good hardness. All the three sizes of granules were
well represented in each of the batches. Establishing an appropriate size
distribution will improve tablet quality and will reduce overall cost in the long
run. Particle size distribution needs to be controlled to avoid sticking or picking
as the case may be because large granules tend to lock in moisture which can
cause sticking (113).
3.16 APPEARANCE OF PRODUCED TABLETS
Paracetamol tablets of mean weight 250 ±0.1 mg, white in colour, with smooth
texture and 9.00 mm diameter, with a biconvex shape were produced.
3.17 DRUG-EXPICIENT COMPATIBILITY STUDIES
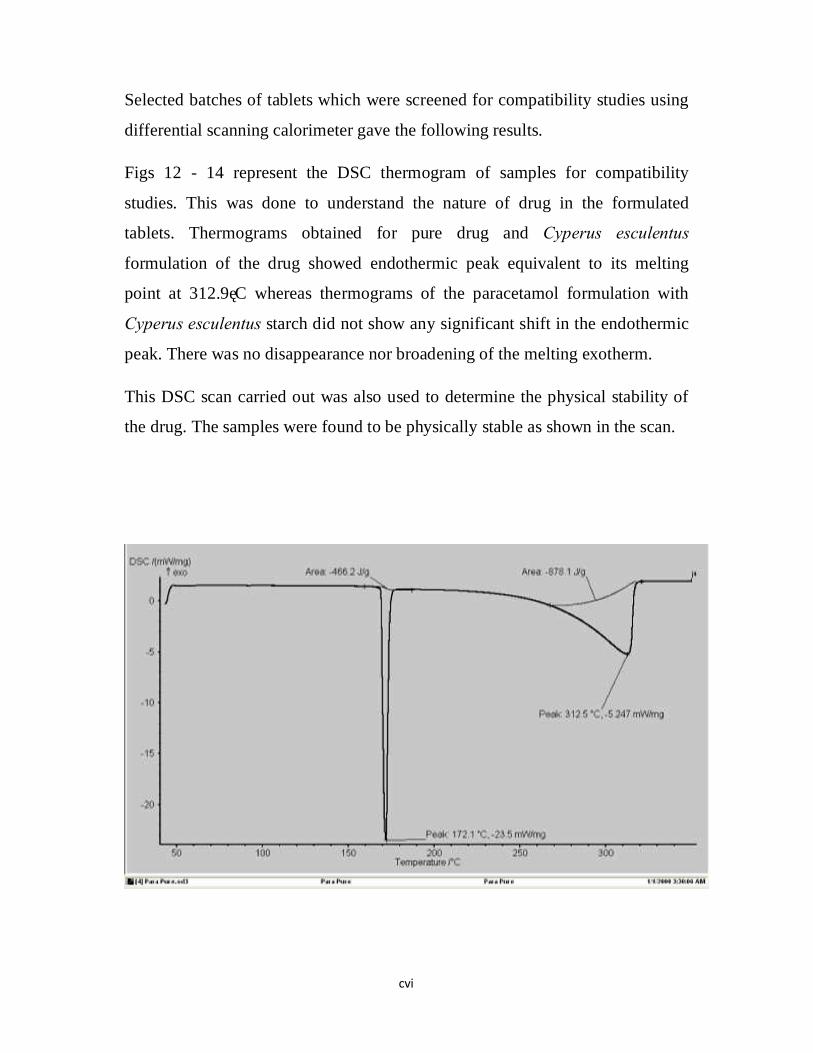
cvi
Selected batches of tablets which were screened for compatibility studies using
differential scanning calorimeter gave the following results.
Figs 12 - 14 represent the DSC thermogram of samples for compatibility
studies. This was done to understand the nature of drug in the formulated
tablets. Thermograms obtained for pure drug and Cyperus esculentus
formulation of the drug showed endothermic peak equivalent to its melting
point at 312.9˚C whereas thermograms of the paracetamol formulation with
Cyperus esculentus starch did not show any significant shift in the endothermic
peak. There was no disappearance nor broadening of the melting exotherm.
This DSC scan carried out was also used to determine the physical stability of
the drug. The samples were found to be physically stable as shown in the scan.
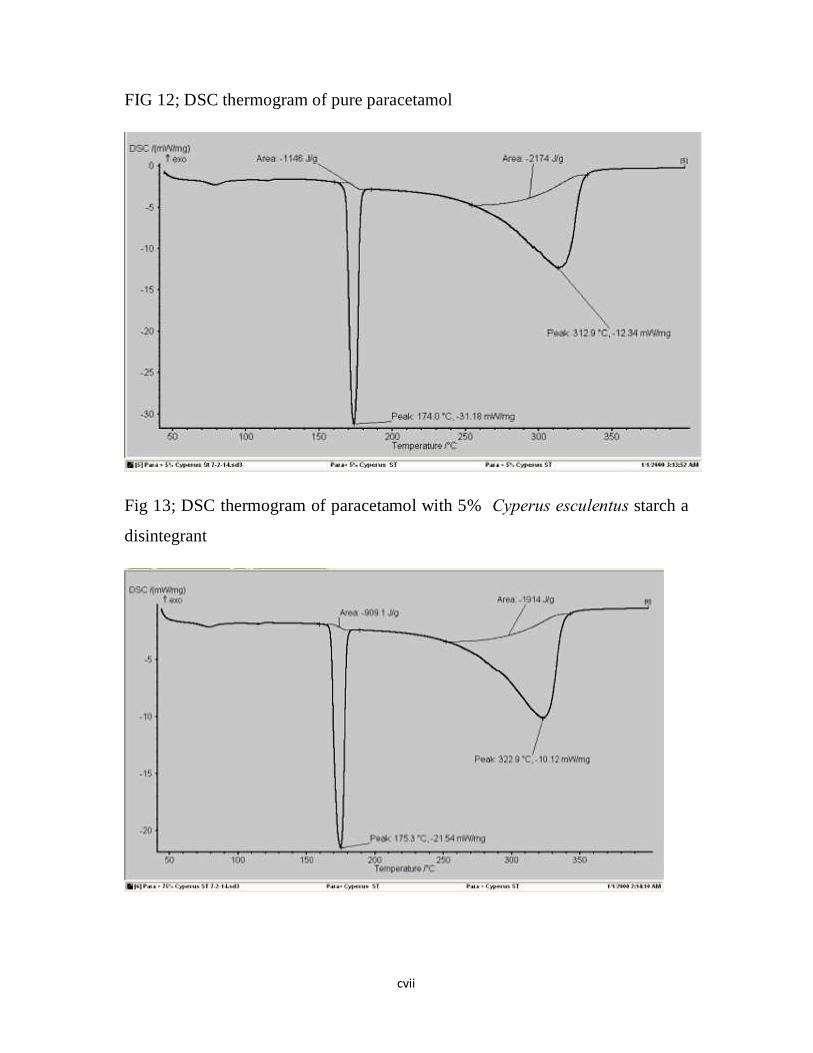
cvii
FIG 12; DSC thermogram of pure paracetamol
Fig 13; DSC thermogram of paracetamol with 5% Cyperus esculentus starch a
disintegrant
cviii
Fig 14; DSC thermogram of paracetamol tablets with 7.5% Cyperus esculentus
starch as binder.
3.18 PROPERTIES OF TABLETS
3.18.1 WEIGHT UNIFORMITY
Table 11 shows the mean weight, standard deviation and percentage deviation of the tablets
Tablet batch*
Mean weight (mg) Standard deviation
Percentage deviation (%)
CE3 286.10 4.03 0.00
TE1 285.05 6.04 -3.91
TE2 286.30 4.17 -3.97
TE3 292.00 4.10 0.00

cix
TE4 301.50 7.05 0.00
CX3 300.50 6.04 4.72
TX1 290.00 5.62 0.00
TX2 291.00 5.73 1.27
TX3 299.00 5.52 -6.66
TX4 310.00 4.66 0.00
CEX3 299.00 6.41 0.00
TEX1 285.45 11.85 4.1
TEX2 289.50 5.10 -9.16
TEX3 290.70 4.80 3.84
TEX4 307.70 4.79 3.67
BC2 292.00 4.10 0.00
BT1 280.10 4.36 -8.08
BT2 291.50 5.87 0.00
BT3 296.70 4.80 3.84
BT4 308.30 5.80 -6.60
*Description of symbols are shown in the glossary
Table 11 is a table showing the average weight percentage deviation and
standard derivation of paracetamol tablets produced. The mean weight of the
tablet produced ranged from 285.4 mg to 310.0 mg. Percentage deviation is a
statistical tool used to control variability in weight of tablets during
manufacturing. This is important because it helps to guide against over dosage
or under dose as the case may be. There are therefore acceptable values of
percentage deviation upon which the tablet weights are acceptable. For tablets
weighing 250mg and above, the value of percentage deviation should not be
more that 5 % (29). All the tablet batches passed weight variation test.
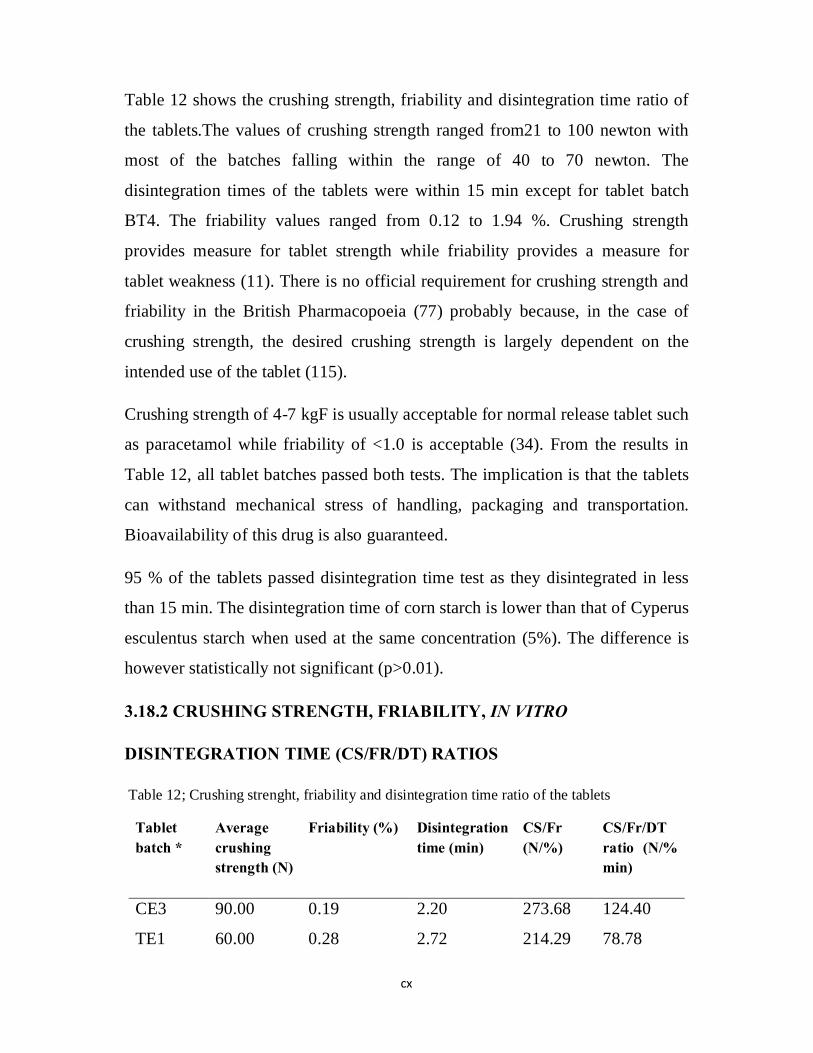
cx
Table 12 shows the crushing strength, friability and disintegration time ratio of
the tablets.The values of crushing strength ranged from21 to 100 newton with
most of the batches falling within the range of 40 to 70 newton. The
disintegration times of the tablets were within 15 min except for tablet batch
BT4. The friability values ranged from 0.12 to 1.94 %. Crushing strength
provides measure for tablet strength while friability provides a measure for
tablet weakness (11). There is no official requirement for crushing strength and
friability in the British Pharmacopoeia (77) probably because, in the case of
crushing strength, the desired crushing strength is largely dependent on the
intended use of the tablet (115).
Crushing strength of 4-7 kgF is usually acceptable for normal release tablet such
as paracetamol while friability of <1.0 is acceptable (34). From the results in
Table 12, all tablet batches passed both tests. The implication is that the tablets
can withstand mechanical stress of handling, packaging and transportation.
Bioavailability of this drug is also guaranteed.
95 % of the tablets passed disintegration time test as they disintegrated in less
than 15 min. The disintegration time of corn starch is lower than that of Cyperus
esculentus starch when used at the same concentration (5%). The difference is
however statistically not significant (p>0.01).
3.18.2 CRUSHING STRENGTH, FRIABILITY, IN VITRO
DISINTEGRATION TIME (CS/FR/DT) RATIOS
Table 12; Crushing strenght, friability and disintegration time ratio of the tablets
Tablet batch *
Average crushing strength (N)
Friability (%) Disintegration time (min)
CS/Fr (N/%)
CS/Fr/DT ratio (N/% min)
CE3 90.00 0.19 2.20 273.68 124.40
TE1 60.00 0.28 2.72 214.29 78.78
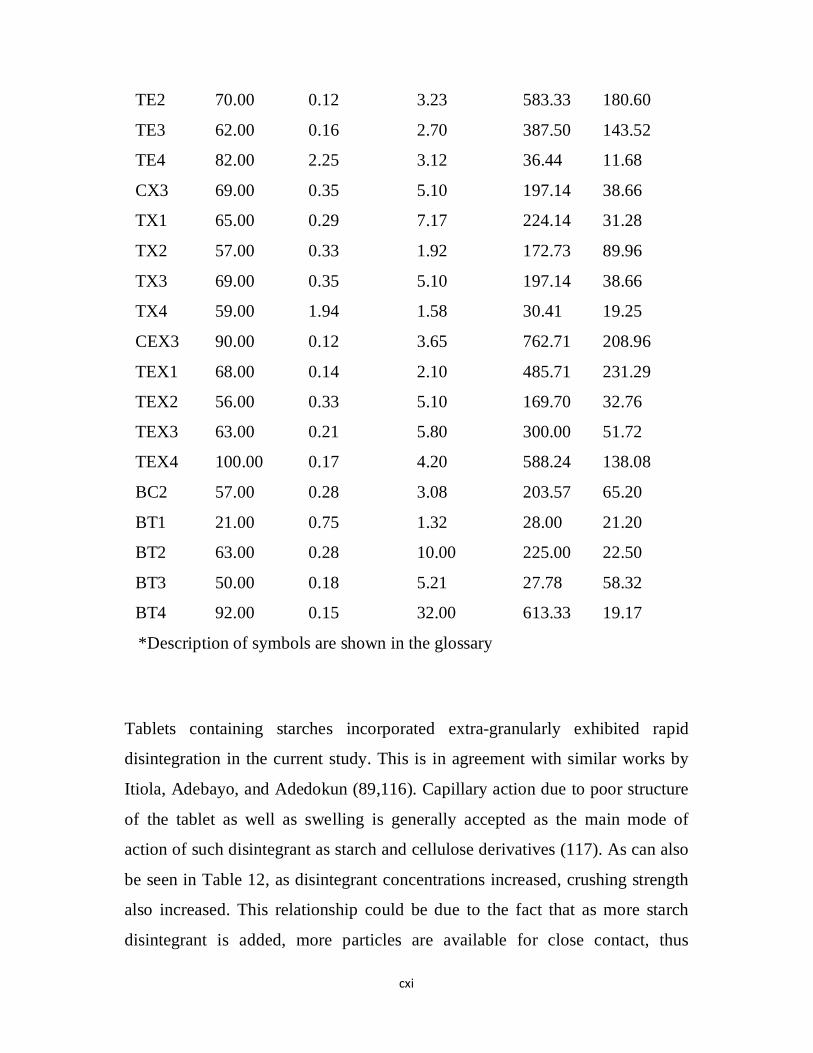
cxi
TE2 70.00 0.12 3.23 583.33 180.60
TE3 62.00 0.16 2.70 387.50 143.52
TE4 82.00 2.25 3.12 36.44 11.68
CX3 69.00 0.35 5.10 197.14 38.66
TX1 65.00 0.29 7.17 224.14 31.28
TX2 57.00 0.33 1.92 172.73 89.96
TX3 69.00 0.35 5.10 197.14 38.66
TX4 59.00 1.94 1.58 30.41 19.25
CEX3 90.00 0.12 3.65 762.71 208.96
TEX1 68.00 0.14 2.10 485.71 231.29
TEX2 56.00 0.33 5.10 169.70 32.76
TEX3 63.00 0.21 5.80 300.00 51.72
TEX4 100.00 0.17 4.20 588.24 138.08
BC2 57.00 0.28 3.08 203.57 65.20
BT1 21.00 0.75 1.32 28.00 21.20
BT2 63.00 0.28 10.00 225.00 22.50
BT3 50.00 0.18 5.21 27.78 58.32
BT4 92.00 0.15 32.00 613.33 19.17
*Description of symbols are shown in the glossary
Tablets containing starches incorporated extra-granularly exhibited rapid
disintegration in the current study. This is in agreement with similar works by
Itiola, Adebayo, and Adedokun (89,116). Capillary action due to poor structure
of the tablet as well as swelling is generally accepted as the main mode of
action of such disintegrant as starch and cellulose derivatives (117). As can also
be seen in Table 12, as disintegrant concentrations increased, crushing strength
also increased. This relationship could be due to the fact that as more starch
disintegrant is added, more particles are available for close contact, thus
cxii
enhancing inter-particulate bonding forces. This is important in formulation
studies and suggests that low concentration of disintegrant may be sufficient to
achieve desired effect in particular tablet formulation.
The values of disintegration time increased as the density of tablets increased.
This may be due to the reduction in porosity (that is capillary microstructure) of
the tablets as the particle density increased. According to Bi, Yonezawa and
Sunada (118), a decrease in porosity leads to formation of more solid bridges,
thus making annihilation of inter-particulate bonds more difficult. This
reduction in porosity may lead to slow water penetration into the tablets and
consequently swelling would be reduced. This ultimately will increase
disintegration time.
Crushing strength friability, disintegration time ratio (Cs/Fr/DT) has been
suggested as a better index for assessing tablet performance as regards
disintegrant activity especially when compared with the crushing strength
friability ratio (Cs/Fr). This is because, in addition to measuring tablet strength
(crushing strength) and weakness (friability), it simultaneously assesses the net
effect of these parameters in disintegration time (119). Generally, the higher the
value of crushing strenght/ friability/ Disintegration time, the better the
combined effect of binding and disintegrant activity in a tablet.
3.18.3 DRUG CONTENTS

cxiii
Control 1% 2% 5% 10%
Fig 15; Drug release profile of paracetamol tablet in SGF with disintegrant incorporated
intra-extragranularly
Control 1% 2% 5% 10%
Fig 16; Drug release profile of paracetamol Tablet in SGF with disintegrant incorporated
intragranularly

cxiv
Control 1% 2% 5% 10%
Fig 17; Drug release profile of paracetamol tablet in SGFwith disintegrant incorporated
extagranularly
Control 1% 2% 5% 10%
Fig 18; Drug release profile of paracetamol tablets in SGF with starch as binder
Drug release profile of paracetamol tablets in SGF with starch as binder

cxv
Control 1% 2% 5% 10%
Fig 19; Drug release profile of paracetamol tablet in SIF with disintegrant incorporated intra-
extragranularly
Control 1% 2% 5% 10%
Fig 20; Drug release profile of paracetamol tablets in SIF with disintegrant incorporated intra
granularly
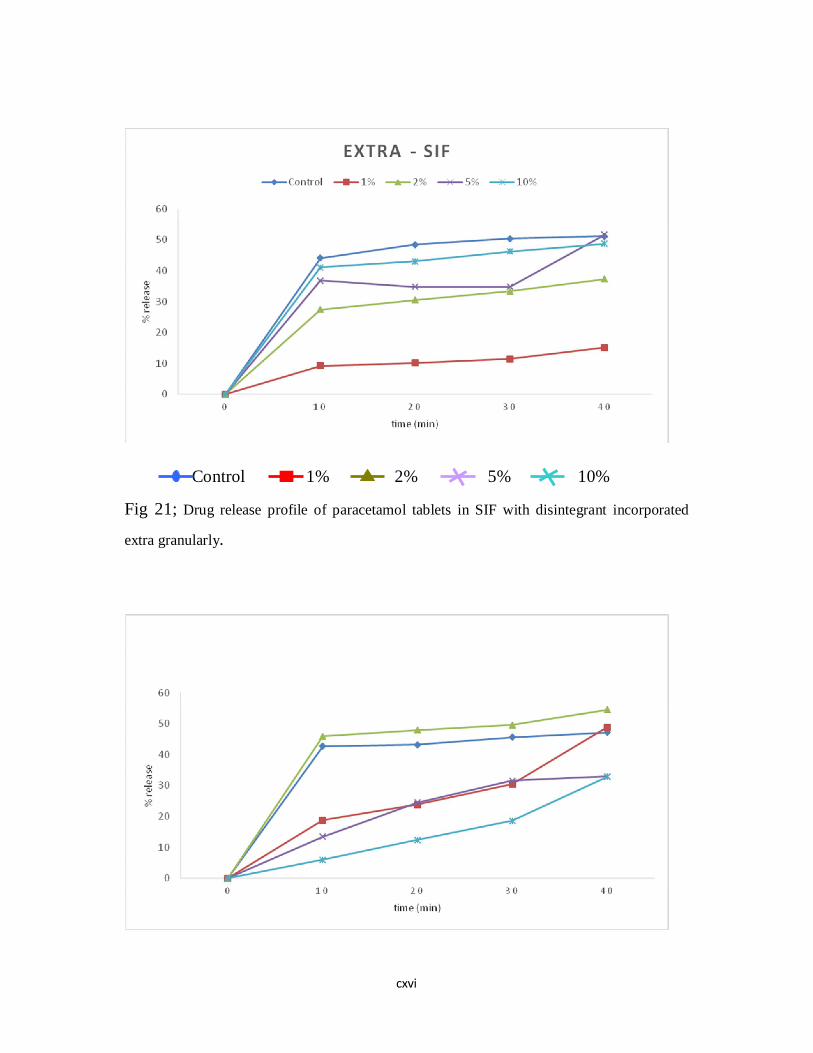
cxvi
Control 1% 2% 5% 10%
Fig 21; Drug release profile of paracetamol tablets in SIF with disintegrant incorporated
extra granularly.
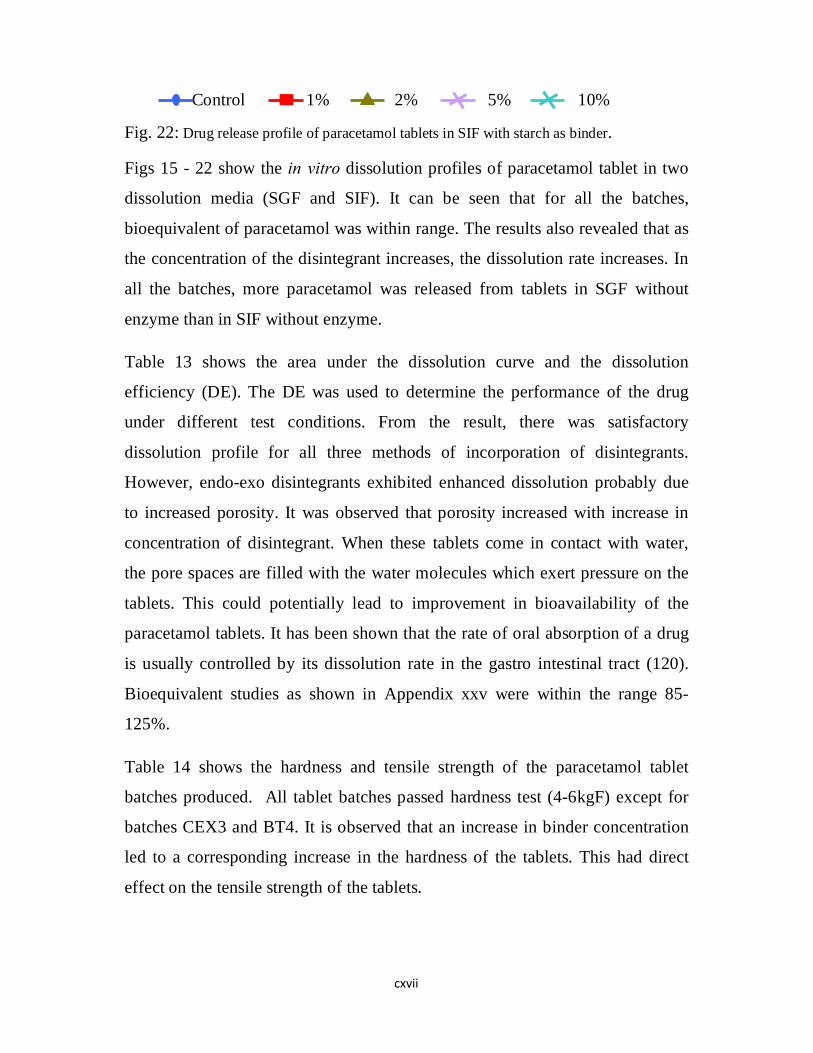
cxvii
Control 1% 2% 5% 10%
Fig. 22: Drug release profile of paracetamol tablets in SIF with starch as binder.
Figs 15 - 22 show the in vitro dissolution profiles of paracetamol tablet in two
dissolution media (SGF and SIF). It can be seen that for all the batches,
bioequivalent of paracetamol was within range. The results also revealed that as
the concentration of the disintegrant increases, the dissolution rate increases. In
all the batches, more paracetamol was released from tablets in SGF without
enzyme than in SIF without enzyme.
Table 13 shows the area under the dissolution curve and the dissolution
efficiency (DE). The DE was used to determine the performance of the drug
under different test conditions. From the result, there was satisfactory
dissolution profile for all three methods of incorporation of disintegrants.
However, endo-exo disintegrants exhibited enhanced dissolution probably due
to increased porosity. It was observed that porosity increased with increase in
concentration of disintegrant. When these tablets come in contact with water,
the pore spaces are filled with the water molecules which exert pressure on the
tablets. This could potentially lead to improvement in bioavailability of the
paracetamol tablets. It has been shown that the rate of oral absorption of a drug
is usually controlled by its dissolution rate in the gastro intestinal tract (120).
Bioequivalent studies as shown in Appendix xxv were within the range 85-
125%.
Table 14 shows the hardness and tensile strength of the paracetamol tablet
batches produced. All tablet batches passed hardness test (4-6kgF) except for
batches CEX3 and BT4. It is observed that an increase in binder concentration
led to a corresponding increase in the hardness of the tablets. This had direct
effect on the tensile strength of the tablets.
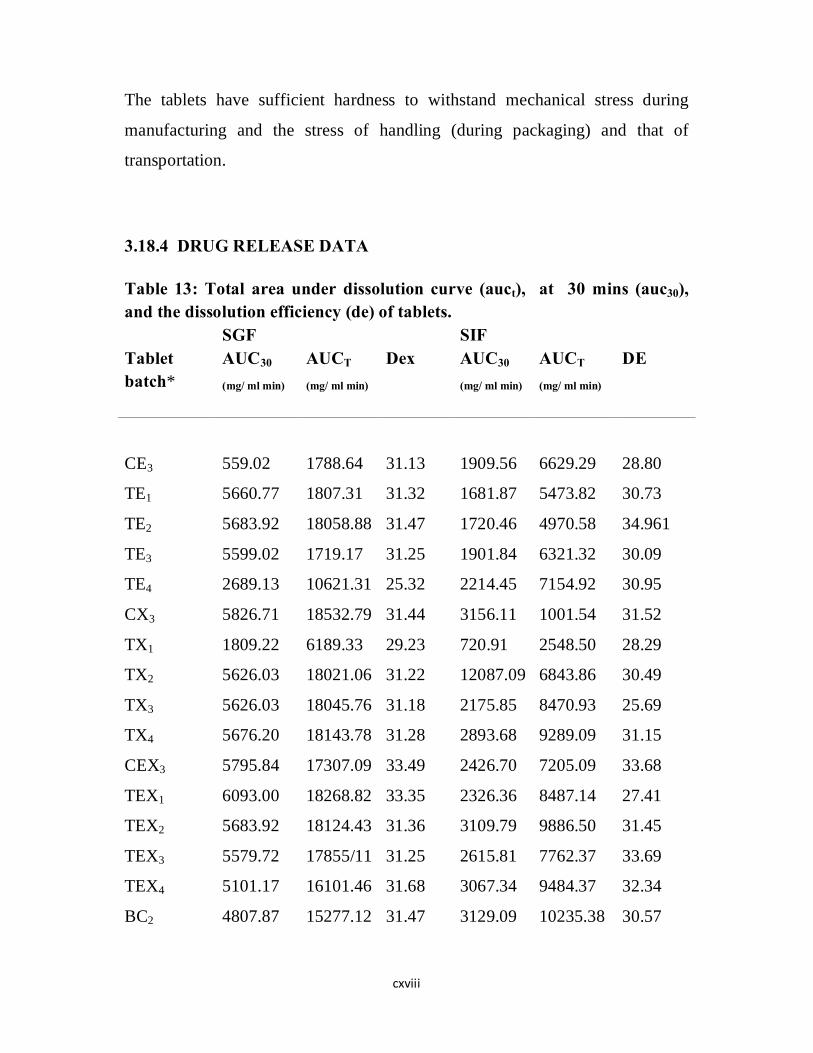
cxviii
The tablets have sufficient hardness to withstand mechanical stress during
manufacturing and the stress of handling (during packaging) and that of
transportation.
3.18.4 DRUG RELEASE DATA
Table 13: Total area under dissolution curve (auct), at 30 mins (auc30), and the dissolution efficiency (de) of tablets. SGF SIF Tablet batch*
AUC30
(mg/ ml min) AUCT
(mg/ ml min) Dex AUC30
(mg/ ml min) AUCT
(mg/ ml min)
DE
CE3 559.02 1788.64 31.13 1909.56 6629.29 28.80
TE1 5660.77 1807.31 31.32 1681.87 5473.82 30.73
TE2 5683.92 18058.88 31.47 1720.46 4970.58 34.961
TE3 5599.02 1719.17 31.25 1901.84 6321.32 30.09
TE4 2689.13 10621.31 25.32 2214.45 7154.92 30.95
CX3 5826.71 18532.79 31.44 3156.11 1001.54 31.52
TX1 1809.22 6189.33 29.23 720.91 2548.50 28.29
TX2 5626.03 18021.06 31.22 12087.09 6843.86 30.49
TX3 5626.03 18045.76 31.18 2175.85 8470.93 25.69
TX4 5676.20 18143.78 31.28 2893.68 9289.09 31.15
CEX3 5795.84 17307.09 33.49 2426.70 7205.09 33.68
TEX1 6093.00 18268.82 33.35 2326.36 8487.14 27.41
TEX2 5683.92 18124.43 31.36 3109.79 9886.50 31.45
TEX3 5579.72 17855/11 31.25 2615.81 7762.37 33.69
TEX4 5101.17 16101.46 31.68 3067.34 9484.37 32.34
BC2 4807.87 15277.12 31.47 3129.09 10235.38 30.57

cxix
BT1 3377.93 18006.39 31.27 1901.84 7305.43 26.03
BT2 4773.14 15225.41 31.35 3105.93 10246.96 30.31
BT3 1654.85 7663.57 21.59 1975.17 5947.74 33.21
BT4 871.42 2387.87 33.67 1168.59 4590.05 25.46
*Description of symbols are shown in the glossary
3.18.5 TENSILE STRENGTH
Table 14 shows the hardness, thickness, diameter and tensile strength of tablets produced
Tablet Batch* Hardness (N)
Thickness (m)
Diameter (m)
Tensile strength 2F/πDT (Nm-2)
CE3 52.00 0.0081 0.0090 4.54 x 10⁵
TE1 60.00 0.0077 0.0090 5.53 x 10⁵
TE2 74.00 0.0081 0.0090 6.46 x 10⁵
TE3 62.00 0.0078 0.0090 5.61 x 10⁵
TE4 82.00 0.0082 0.0090 7.06 x 105
CX3 69.00 0.0081 0.0090 6.03 x 105
TX1 65.00 0.0071 0.0090 6.46 x 105
TX2 57.00 0.0081 0.0090 4.98 x 105
TX3 62.00 0.0083 0.0090 5.29 x 105
TX4 60.00 0.0084 0.0090 5.06 x 105
CEX3 90.00 0.0081 0.0090 7.86 x 105
TEX1 68.00 0.0076 0.0090 5.79 x 105
TEX2 56.00 0.0080 0.0090 4.96 x 105
TEX3 63.00 0.0082 0.0090 5.45 x 10⁵
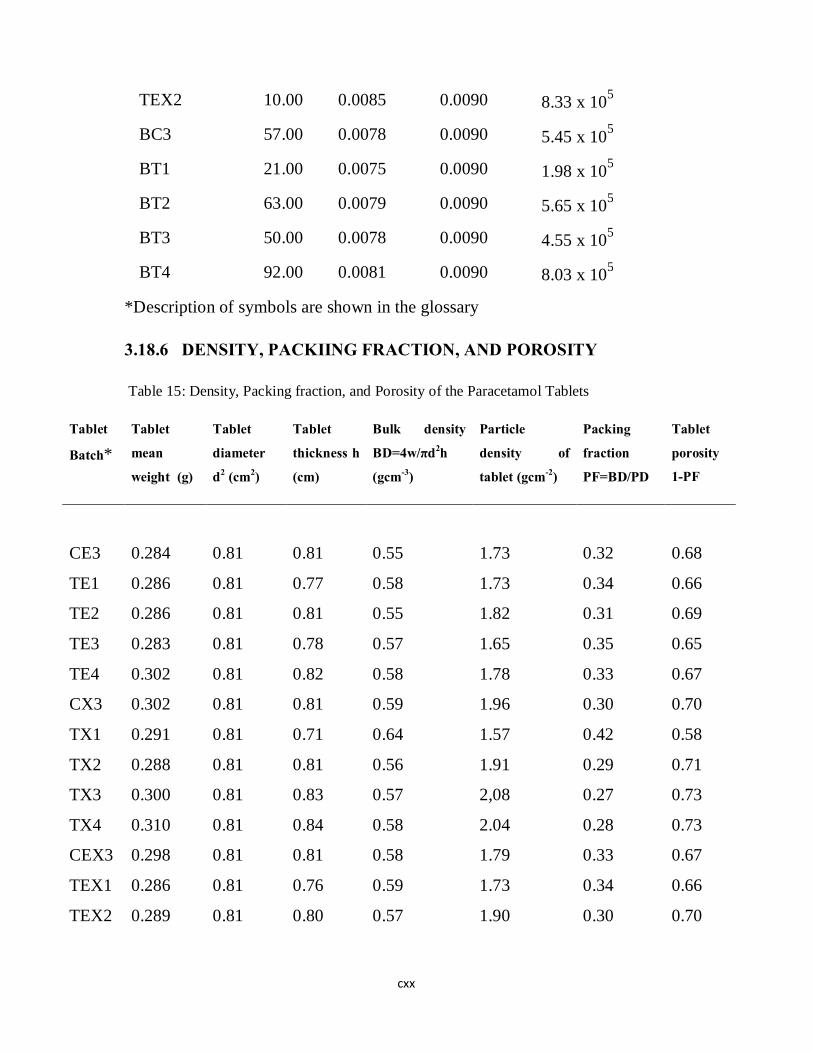
cxx
TEX2 10.00 0.0085 0.0090 8.33 x 10⁵
BC3 57.00 0.0078 0.0090 5.45 x 10⁵
BT1 21.00 0.0075 0.0090 1.98 x 10⁵
BT2 63.00 0.0079 0.0090 5.65 x 10⁵
BT3 50.00 0.0078 0.0090 4.55 x 10⁵
BT4 92.00 0.0081 0.0090 8.03 x 10⁵
*Description of symbols are shown in the glossary
3.18.6 DENSITY, PACKIING FRACTION, AND POROSITY
Table 15: Density, Packing fraction, and Porosity of the Paracetamol Tablets
Tablet
Batch*
Tablet
mean
weight (g)
Tablet
diameter
d2 (cm2)
Tablet
thickness h
(cm)
Bulk density
BD=4w/πd2h
(gcm-3)
Particle
density of
tablet (gcm-2)
Packing
fraction
PF=BD/PD
Tablet
porosity
1-PF
CE3 0.284 0.81 0.81 0.55 1.73 0.32 0.68
TE1 0.286 0.81 0.77 0.58 1.73 0.34 0.66
TE2 0.286 0.81 0.81 0.55 1.82 0.31 0.69
TE3 0.283 0.81 0.78 0.57 1.65 0.35 0.65
TE4 0.302 0.81 0.82 0.58 1.78 0.33 0.67
CX3 0.302 0.81 0.81 0.59 1.96 0.30 0.70
TX1 0.291 0.81 0.71 0.64 1.57 0.42 0.58
TX2 0.288 0.81 0.81 0.56 1.91 0.29 0.71
TX3 0.300 0.81 0.83 0.57 2,08 0.27 0.73
TX4 0.310 0.81 0.84 0.58 2.04 0.28 0.73
CEX3 0.298 0.81 0.81 0.58 1.79 0.33 0.67
TEX1 0.286 0.81 0.76 0.59 1.73 0.34 0.66
TEX2 0.289 0.81 0.80 0.57 1.90 0.30 0.70
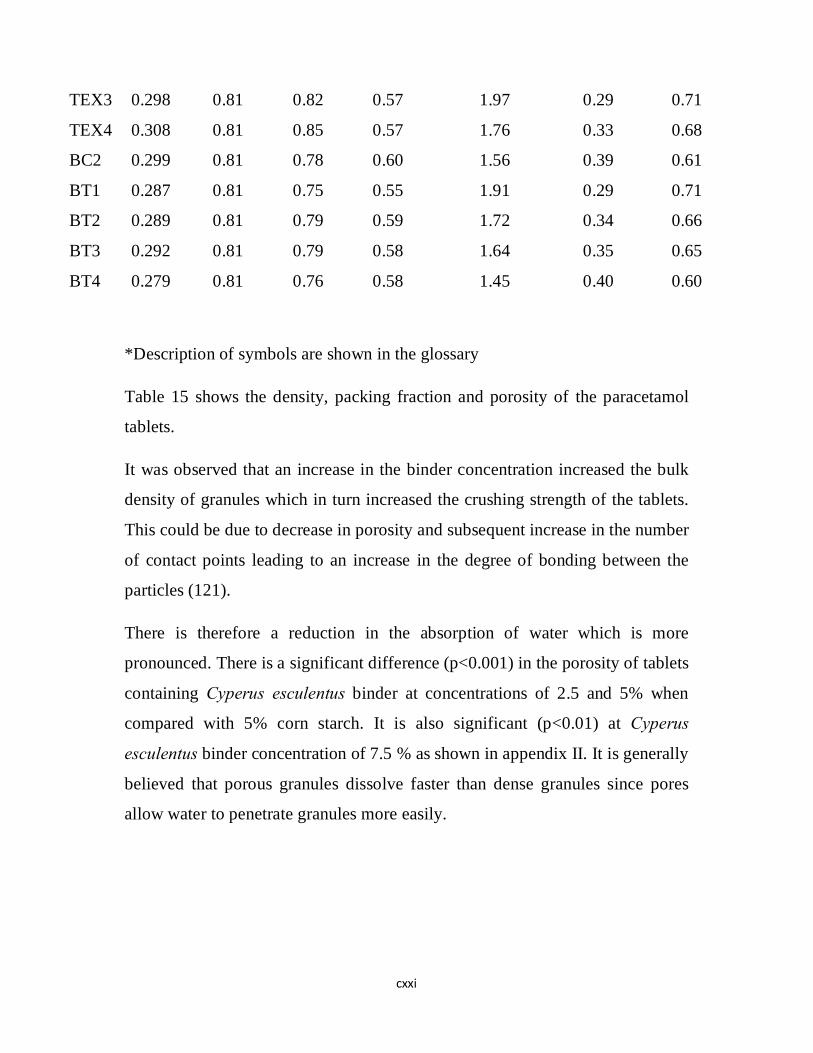
cxxi
TEX3 0.298 0.81 0.82 0.57 1.97 0.29 0.71
TEX4 0.308 0.81 0.85 0.57 1.76 0.33 0.68
BC2 0.299 0.81 0.78 0.60 1.56 0.39 0.61
BT1 0.287 0.81 0.75 0.55 1.91 0.29 0.71
BT2 0.289 0.81 0.79 0.59 1.72 0.34 0.66
BT3 0.292 0.81 0.79 0.58 1.64 0.35 0.65
BT4 0.279 0.81 0.76 0.58 1.45 0.40 0.60
*Description of symbols are shown in the glossary
Table 15 shows the density, packing fraction and porosity of the paracetamol
tablets.
It was observed that an increase in the binder concentration increased the bulk
density of granules which in turn increased the crushing strength of the tablets.
This could be due to decrease in porosity and subsequent increase in the number
of contact points leading to an increase in the degree of bonding between the
particles (121).
There is therefore a reduction in the absorption of water which is more
pronounced. There is a significant difference (p<0.001) in the porosity of tablets
containing Cyperus esculentus binder at concentrations of 2.5 and 5% when
compared with 5% corn starch. It is also significant (p<0.01) at Cyperus
esculentus binder concentration of 7.5 % as shown in appendix II. It is generally
believed that porous granules dissolve faster than dense granules since pores
allow water to penetrate granules more easily.

cxxii
CHAPTER FOUR
CONCLUSION, SUMMARY AND RECOMMENDATION
4.1 CONCLUSION
The research project is on preformulation studies of Cyperus esculentus starch
in the production of paracetamol tablets. It is aimed at determining the
physicochemical, binding, and disintegrant properties of Cyperus esculentus
starch. The study is also aimed at establishing the usefulness or otherwise of
Cyperus esculentus starch as a tablet excipient. It involved isolation of starch
from Cyperus esculentus tubers. Physicochemical tests were conducted on the
starch. Paracetamol tablets were produced by wet granulation method. The
formulated tablets were subjected to quality control tests. Statistical analysis
was carried out using SPSS Version 21. All values are expressed as mean ± SD
and statistically significant differences between means assessed by Student T-
test (p< 0.01) and ANOVA.
The results of the study showed that Cyperus esculentus starch possesses
excellent physicochemical properties that qualify it as a pharmaceutical grade
starch. The controlled particle size and morphology imply usefulness in a
variety of carrier-based formulations. Cyperus esculentus starch has also shown
good properties as disintegrant. The disintegrant activity of starch was
determined by their nature, forms, mode of incorporation and use concentration.
The disintegration times were significantly (p<0.01) affected by these. The
binding efficacy of Cyperus esculentus is more than that of corn starch. The
hardness of the tablets was significantly (p<0.01) influenced by the
concentration of the binder used in the formulation. This fact is further
corroborated by the inherent swelling ability wherein it showed resistance to
swelling. Physicochemical parameters such as swelling capacity, water
cxxiii
solubility as well as hydration capacity exhibited more direct effect on
disintegrant activity of the starch.
The widespread availability, high yield, and simplicity of the extraction serve as
impetus for its commercial exploitation. Cyperus esculentus starch has good
properties and provides excellent disintegrant and binding properties in
paracetamol tablet formulations without compromising drug release
characteristics. Therefore, to satisfy the ever increasing demand for highly
specific and functional excipients, Cyperus esculentus starch may provide a
viable alternative
4.2 SUMMARY AND RECOMMENDATION
The results of the evaluation carried out in this work showed that Cyperus
esculentus starch offers a fertile ground for further research. This is because,
some of the properties of Cyperus esculentus starch such as the ash value and
hydration capacity require further research to maximize their potential
usefulness.
The possible application of Cyperus esculentus starch in other pharmaceutical
formulations should be evaluated. Such evaluations may include its use as
dusting powder, muco-adhesive agents, and glidants. This will help to expand
the usefulness of Cyperus esculentus starch in pharmaceutical formulations. The
functionality of the starch can be improved upon by modification. Paste clarity,
and the flow properties can be enhanced by the modification of the Cyperus
esculentus starch.
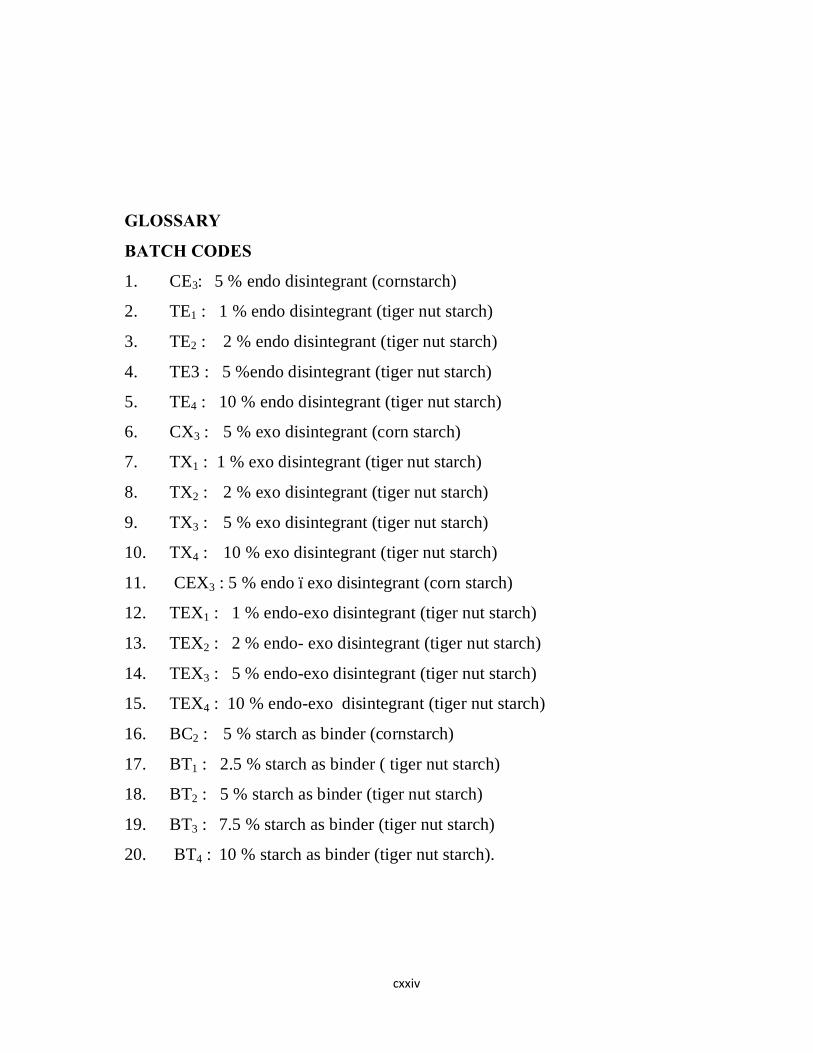
cxxiv
GLOSSARY
BATCH CODES
1. CE3: 5 % endo disintegrant (cornstarch)
2. TE1 : 1 % endo disintegrant (tiger nut starch)
3. TE2 : 2 % endo disintegrant (tiger nut starch)
4. TE3 : 5 %endo disintegrant (tiger nut starch)
5. TE4 : 10 % endo disintegrant (tiger nut starch)
6. CX3 : 5 % exo disintegrant (corn starch)
7. TX1 : 1 % exo disintegrant (tiger nut starch)
8. TX2 : 2 % exo disintegrant (tiger nut starch)
9. TX3 : 5 % exo disintegrant (tiger nut starch)
10. TX4 : 10 % exo disintegrant (tiger nut starch)
11. CEX3 : 5 % endo –exo disintegrant (corn starch)
12. TEX1 : 1 % endo-exo disintegrant (tiger nut starch)
13. TEX2 : 2 % endo- exo disintegrant (tiger nut starch)
14. TEX3 : 5 % endo-exo disintegrant (tiger nut starch)
15. TEX4 : 10 % endo-exo disintegrant (tiger nut starch)
16. BC2 : 5 % starch as binder (cornstarch)
17. BT1 : 2.5 % starch as binder ( tiger nut starch)
18. BT2 : 5 % starch as binder (tiger nut starch)
19. BT3 : 7.5 % starch as binder (tiger nut starch)
20. BT4 : 10 % starch as binder (tiger nut starch).

cxxv
REFERENCES
1. Narmada, N. (2008). Pharmaceutical Dosage Form and Design,
Pharmaceutical Information, 210-218, retrieved 22nd March, 2014 from:
www.pharminfo.net/narmadha/blog/formulationsexcipients-tablets.
2. Gangwar, S., Sigh, S., Gangwar, S., Jain, S., Verma, S. and Kumar, A.
(2010). Starch as a material for drug delivery. International Journal
Biological and Pharmaceutical Research, 1(2): 56-60.
3. Russel, R. (2004). Synthetic excipients challenge all natural organics
offer. advantages/ challenges to developer and formulators.
Pharmaceutical Technology. 27: 38-50.
4. Weiner, M and Bernsten, I. L., (1989). Adverse reaction to drug
formulation agents. A Handbook of Excipients. Marcel Dekker, New
York. pp 91-92
5. Muazu, H., Isah, A.B. and Bhatia, G. (2011). Extraction and
characterization of Kaffir potato starch: a potential source of
pharmaceutical raw material. Journal of Natural Products and Plant
Research, 1(2): 41-49.
6. Monek, R.V., Builders, P.F., Kollerg, W.M., Eneje, M., and Kunle, O.O.
(2012). Physicochemical and binder properties of starch obtained from
Cyperus esculentus. Pharmaceutical Science and Technology, 3( 2): 379-
388.

cxxvi
7. Adebayo, A.S. and Itiola, O.A. (1998). Properties of starch obtained from
Colocasia esculenta and Artocarpus communis. Nigerian Journal of
Natural Products and Medicine, 2: 29-33.
8. Hauschild, K. and Pickr – Freyer, K.M., (2004). Evaluation of a new co-
processed compound based on lactose and maize starch for tablet
formulation. AAPS Pharmaceutical Science. 6 (2): 27-38.
9. Larhed, A., Stertman, L., Edvardson, E. and Sojoholm, I.(2004). Starch
microparticles as oral vaccine adjuvant: antigen-dependent uptake in
mouse intestinal mucosa. Journal of Drug Target, 12 (5): 289-296.
10. Illium, L., Fisher, A. N., Jabbal – Gill, J., and Davis, S.S. (2001).
Bioadhesive starch microspheres and absorption enhancing agents acts
synergistically to enhance the nasal absorption of polypeptides.
International Journal of Pharmacology, 222 (1): 109-119.
11. Isa, A.B., Abdulsamad, A., Gwarzo, M.S., and Abbah, H.M., (2009).
Evaluation of the disintegrating properties of microcrystalline starch
obtained from cassava in Metronidazole tablets. Nig. Journal of Pharm.
Sci. 8( 2): 26-35.
12. Ramu, G., Mohan, G.K., Jayaveera, K.N., Suresh, N., Chandra, P.K., and
Barnesh, B. (2010). Evaluation of Abelmuschus starch as tablet
disintegrant. Indian Journal of Natural Products and Researches, 1(3):
342-347
13. Patel, N. R. and Hopponen, R. E. (1996). Mechanism of action of starch
as a tablet disintegrant and factors affecting swelling of starch granules at
37OC. Journal of Pharmaceutical Science. 55: 614-617.
14. Ibezim, E.C., Ofoefule, S.I., Omeje, E.O., Onyishi, V.I. and Odoh, U.E.
(2006). The role of ginger starch as binder in acetaminophen tablets.

cxxvii
International Journal of Pharmaceutical Research and Development,
3(22): 46-50.
15. Erebor, J.O., Iwuagwu, M.A., Uhumwangho, M.U., Arhenoh, M.I. and
Oshoma, J. (2013). Studies on the tabletting characteristicsof paracetamol
tablets using mucilage extracted from Discorea alata. Nigerian Journal of
Pharmaceutical Sciences, 12 (2): 22-29.
16. Itiola, O. A., Odeniyi, M. A. and Adetunji, O. A. (2006). Compression,
mechanical, and release properties of Chloroquine phosphate tablets
containing corn and trifoliate yam starches as binder. Tropical Journal of
Pharmaceutical Research, 5 (2): 589-596.
17. Mills, S. (2010). Pharmaceutical Excipients; An Overview Including
Considerations for Paediatric Dosing. WHO Training Workshop on
Pharmaceutical Development with Focus on Paediatric Formulations;
Beijing 21-25.
18. Alebiowu, G. and Itiola, A.O. (2001). Effects of natural and pre-
gelatinised sorghum, plantain and corn starch binders on the
compressional characteristics of paracetamol tablet formulations.
Pharmaceutical Technology (suppl), 26-30.
19. Evans, W.C. (2009). Starch by Williams, C.E. in: Trease and Evans
pharmacognosy.16th edition, Saunders Ltd, London, 616.
20 Ainley, W.A. and Weller, P.J. (2008), Handbook of Pharmaceutical
Excipients. 6th Edition, Pharmaceutical Press, London, 483.
21. Childers, N. F. (1982), Fruit Farming In the New Encyclopaedia
Britannica, Micropaedia. 15th Edition, Enclopaedia Britannica Inc.
London, 135 – 142.
cxxviii
22. William, H.L. (2003). USGS Weeds in the West Project, Status of
Introduced Plants in Southern Arizona Parks, Factsheets for Cyperus
esculentus, Tucson, Arizona.
23. Adama, K.K., Afolayan, M.O., Oberafo, A.A. , and Thomas, S. (2014):
Isolation and physicochemical characteristics of tigernut (Cyperus
esculentus ) starch as potential industrial materials. International Journal
of Materials Science and Applications, 3 (2): 37-41.
24. Bamishaiye, E., Muhammad, N., Bamishaiye, O. (2009). Hematological
parameters of albino rats fed on tiger nuts (Cyperus esculentus) oil meal
based diet. Internet Journal of Nutrition and Wellness, 10 (1)
25. Zhang, H., Hanna, M.A., Ali, Y. and Nan, L. (1996). Yellow nut sedge
(Cyperus esculentus) tuber oil as fuel. Industrial Crops and Products, 5(3)
:177-181
26. Bamishaiye, E.I., Muhammad, N.0. and Bamishaiye, O.M. (2010).
Assessment of biological value of tiger nut (Cyperus esculentus) tuber oil
meal-based diet in rats. Annals of Biological Research, 1 (4): 274-280.
27. Abano, E. E. and Amaoh K.K. (2011). Effects of moisture content in the
physical properties of tiger nuts (Cyperus esculentus). Asian Journal of
Agricultural Research, 5(1): 56- 66.
28. Tigernut Traders, S. L, (2012) Tiger nut Oil. Retrieved 19th January,
2014 from www.tigernut.com.

cxxix
29. Arafat, S., Gaafar, A., Basunya, A. and Nassef L. (2009). Chufa tubers
(Cyperus esculentus) as a new source of food. World Applied Science
Journal, 7 (2); 151 – 156.
30. Trease, G.E. and Evans,W.C. (1978), Pharmacognosy. 11th Edition,
Baillier Tindal, London, 388-480,509,540.
31. Radely, J. A., (1970), Chambers Encyclopaedia, New Revised Edition,
International Learning System Co-operation, London, 134-135.
32. Ghosh, T.K. and Jasti, B.R (2005), Theory and Practice of Contemporary
Pharmaceutics. CRC Press, Florida USA, 289-300.
33. Rana, N.A., Khokra, S.L., Chandel, A., Nanda, G.P. and Sahu, R.K.
(2011). Overview of roll compaction/dry granulation process.
Pharmacology online, 3 (32): 286-298.
34 Ram, I.M. and Ajit, S.N, (2007), Pharmaceutical Dosage Forms and Drug
Delivery. 2nd Edition, CRC Press Florida USA, 336.
35. Rowe, C.R., Sheskey, P.J. and Weller, P. J (2012), Handbook of
Pharmaceutical Excipients 7th edition, Pharmaceutical Press, London
UK, 479-482
36. Compacting, A.C, (2008), Spheronization Process, Spheronizer, retrieved
March 12th, 2014 from www.spheronizer.com/html/whyspheronize.
37. Ratul, D. and Baquee, A.A. (2013): Pellets and pelletization techniques;
a critical review. International Research Journal of Pharmacy, 4 (4): 90-
95.
38. Pastrano, G.L. and Ghaly, E.S. (2012). Physicochemical characteristics
of sprayed dried formulations containing amorphous drugs. International
Journal of Pharmacy and Pharmaceutical Sciences, 4 (4): 563-570.

cxxx
39. Agrawal, R. and Naveen, Y. (2011). Pharmaceutical processing-a review
on wet granulation technology. International Journal of Pharmaceutical
Frontier Research, 1(7): 65-83
40. World Health Organization, (2013), Guidelines on Submission of
Documentation for a Multisource (Generic) Finished Pharmaceutical
Product: Quality Part, WHO Working Document QAs/13. 522, 4-6,
retrieved March 12th, 2014 from www.who.int/medicine/areas.
41. Shalini, S. (2012). Advantages and applications of nature excipients:a
review. Asian Journal of Pharmaceutical Research, 2 (1): 30-39.
42. Oti, A.R., Allagh, T.T. and Olayemi, O.J. (2009). Comparative binding
effects of wheat, rice and maize starches in Chloroquine phosphate tablet
formulations. Research Journal of Applied Sciences, Engineering and
Technology, 1(2): 77-80
43. Enanyatifard, R., Azadbakht, M. and Fadaka T. (2012). Assessment of
Ferula gummosa gum as a binding agent in tablet formulation. Acta
Poloniac Pharma. Drug Research, 69: 291-298.
44 Dane, K., Akin-Ajani, D.O., Odeku, O.A., Itiola O.A. and Odutose O.M
(2006). Effects of pigeon pea and plantain starches on the compressional,
mechanical and disintegrating properties of paracetamol tablets. Drug
Development and Industrial Pharmacy, 32 (3): 357-565
45. Rowe, C.R., Sheskey, P.J. and Weller P. J., (2003), Handbook of
Pharmaceutical Excipients. 4th Edition, Pharmaceutical Press, London
UK,
46 Odeku, O.A. and Itiola, O.A. (2002). Characterization of khaya gum as
binder in paracetamol tablet formulation. Drug Development and
Industrial Pharmacy, 283): 329-337.
cxxxi
47 Adebayo, A.S. and Itiola, O.A. (2002). Effects of breadfruit and
cocoyam starch binder on fluidity and compressibility of paracetamol
granules and the mechanical properties of their tablets.West African
Journal of Pharmacy, 16 (1): 60-70.
48. Piffer, G., Santoro, P. and Pendrami, M. (1999). Quality and functionality
of excipients. II, Farmaco, 54 (1): 1-14.
49. Piffer, G. and Restani, P. (2003). The safety of pharmaceutical excipients.
II Farmaco, 58 (8): 541-550.
50. Moore, J.W. and Flanner, H.H. (1996). Mathematical comparison of
dissolution profile. Pharmaceutical Technology, 20(6): 64-74.
51. Levina, M. and Cunningham, C.R. (2005). The effect of core design and
formulation on the quality of film coated tablets. Pharmaceutical
Technology Europe, 17(4): 29-37
52. Patel, S., Agrawal, S. and Lohdi, B.S. (2012). Natural binding agents in
tablet formulation (review article). International Journal of
Pharmaceutical and Biological Archives, 3(3): 466-473.
53. Adebayo, A.S., Brown-Myrae, E. and Itiola, O.A.(2010). Comparative
disintegrant activities of breadfruit starches and official corn starch.
Powder Technology, 181 (2): 99-103.
54. Adebayo, A.S. and Itiola, O.A. (1998). Evaluation of breadfruit starches
as exo-disintegrants in paracetamol tablets formulation. Pharmacy and
Pharmacology Communications, 4 (8): 385-389.
55. Vyas, P. (2011). Evaluation of native corn starch as a binder for tablet
disintegration. Dissertation submitted to the Ranjiv Ghandi University of
Health Sciences, Banglore Karnataka in partial fulfillment of the
requirement for the degree of Master of Pharmacy in Pharmaceutical
Technology.

cxxxii
56. Iwuagwu, A.M. and Onyekweli, A.O. (2002). Preliminary investigation
into the use of pleurotus tuber-regium powder as a tablet disintegrant.
Tropical Journal of Pharmaceutical Research, 1 (1): 29-37.
57. Preethi, J., Farhana, B., Baba, B.C., Bhowmik, D.F. and Duraivel, S.
(2013). Recent trends in the formulation of orodispersible tablets . Indian
Journal of Research in pharmacy and Biotechnology, 1(2): 169-174.
58. Khairnan, D.A., Anantavar, S.P., Chaudhari, C.S. and Shelke, P.A.
(2014). Superdisintegrants: an emergency paradigm in orodispersible
tablets. International Journal of Biopharmaceuticals, 5(2): 119-128.
59. Faroongsarng, D. and Peek, G.E. (1994). Swelling and water reuptake of
tablets part 3 Moisture sorption behaviour of tablet disintegrants. Drug
Dev. Ind. Pharm, 20 (5): 779-798.
60. Lowenthal, W. (1972). Mechanism of action of starch as a tablet
disintegrant, effect of starch grain deformation. Journal of Pharmaceutical
Sciences, 61 (3): 455-459.
61. Bhowmik, D., Krishnakanth, C.B.N. and Chandra, P.R.M. (2009). Fast
dissolving tablet: an overview. Journal of Chemical and Pharmaceutical
Research, 1(1): 163-177.
62. Bala, R., Khana, S. and Pawar, P. (2012). Polymers in fast disintegrating
tablets: a review. Asian Journal of Pharmaceutical and Clinical Research,
5(2): 8-14.
63. Gopiath, H. (2012). Disintegant, a brief review. Journal of Chemical and
Pharmaceutical Sciences, 5 (3); 105-112
64. Kumar, A.K. and Yadar, H.K.S. (2014). Fast dissolving tablets: a review.
World Journal of Pharmacy and Pharmaceutical Sciences, 3(3): 678-701.

cxxxiii
65. Patel, N. and Shashtri, Y. (2013). Melt-in-mouth tablet: a futuristic drug
delivery system. Journal of Pharmaceutical Science and Bioscientific
Research, 3 (5): 151-157.
66. Chebili, C. and Cartilier, L. (1998). Mechanism of action of starch as a
tablet excipient: a binding/disintegrating agent. International Journal of
Pharmaceutics, 18(3): 375-383.
67. Leskinen, E. (2003). Tablet disintegration: effects of temperature and pH
of aqueous disintegrating fluids and influence of solubility of diluents on
the behavior of superdisintegrants. Seminar presented at the Division of
Pharmaceutical Technology, Department of Pharmacy, University of
Helsinky.
68. Nattawat, N., Narumol, P. and Ornamphai, S. (2008). Evaluation of
native and carboxymethyl yam (Dioscorea esculenta) starches as tablet
disintegrant. Sipakom University of Science and Technology Journal, 2
(2):18-25.
69. Jinjian, L. and Yongmei, W. (2014). Lubricants in pharmaceutical solid
dosage forms. Lubricants, 2 (1): 21-43.
70. Muazu, J., Musa, H. and Bhata, P.G. (2010). Evaluation of glidant
properties of Fonio starch. Research Journal of Applied Sciences,
Engineering and Technology, 2(2): 149-159.
71. Telaprolu, P., Anjaneyulu, M.V. and Nagarjuna, R. (2013). A review of
pharmaceutical excipients. International Journal of Research in
Pharmaceutical and Nano Sciences, 2(4): 423-431
72. Sharma, D., Kumar, D., Singh, M., Singh, G. and Singh, R.M. (2012).
Taste masking technologies: a novel approach for the improvement of

cxxxiv
organoleptic property of pharmaceutical active substance. International
Research Journal of Pharmacy, 3(4): 108-116.
73. Surana, S.J., Gokale, S.B., Rajmane, R.A. and Jackhar, R.B. (2006): Non-
saccharide natural sweeteners: an overview of current status. Natural
Product Radiance. 5(4): 270-278.
74. Kleinhams, M.G., Markies, H. de Vet S.J., Veld, A.C. and Postema F.N.
(2011). Static and dynamic angles of repose in loose granular material
under reduced gravity. Journal of Geophysical Research, 116: E1100/1-
E11004/13.
75. Zhang, Y. and Johnson, C.K. (1997). Effects of drug particle size on
content uniformity of low dose solid dosage forms. International Journal
of Pharmaceutics, 154 (2): 179 -183
76. Umerie, S.C., Obi, N.A.N. and Okafor, E.O. (1997). Isolation and
characterization of starch from Cyperus esculentus Tubers. Bioresources
Technology, 62 (1): 63-65.
77. British Pharmacopeia Vol. I and II (2002): Her Majesty’s Stationary
Office, University press, Cambridge (electronic copy).
78. Muazu, J., Musa, H., Isah, A.B., Bhatia, P.G. and Tom, G.M. (2011).
Extraction and characterization of Kaffir potato starch: a potential source
of pharmaceutical raw material. Journal of Natural Products and Plant
Resource, 1 (2): 41-49.
79. Nollet, L.M.L., (2004), Handbook of Food Analysis Vol. 1: Physical
Characterization and Nutrient Analysis (Food Science and Technology)
2nd Edition, CRC Press, Ohio USA, 77.
80. Ronald, M.A. (2004). Handbook of Microbiology Media, third edition.
volume II CRC Press, Ohio USA, 213.
cxxxv
81. European pharmacopoeia, (2011), Sabouraud dextrose agar for the
cultivation of yeast and mould, retrieved March 22nd, 2014 from:
www.condalab.com/pdf/1024.
82. Trinity College Dublin, (2008), Particle Size Analysis by the Centre of
Microscopic Analysis, retrieved March 22nd, 2014 from:
www.cma.tcd.ie/misc/particle_size.pdf
83. Oyi, A.R., Allagh, T.S. and Olayemi O.J. (2009). Comparative binding
effects of wheat, rice and maize starches in Chloroquine phosphate tablet
formulations. Research Journal of Applied Sciences, Engineering and
Technology, 1 (2): 77-80.
84. Heistand, E.N., Wells, J.E. and Ochs, J.F. (1977). Physical processes of
tabletting. Journal of Pharmarmaceutical Science, 66 (4): 510-519.
85. Alkhalidi, B.A., Alkhalidi, A.H. and Khadair A.A. (2010). Comparative
dissolution of diltiazem immediate and extended release products using
conventional USP and innovative dissolution paddles. The Open Drug
Delivery Journal, 4:48-54.
86. Ohwoavworhua, F.O. and Adelakun, T.A. (2005). Some physical
characteristics of microcrystalline cellulose obtained from raw cotton
Cochlospermum planchonii. Tropical Journal of Pharmaceutics
Research, 4 (2): 501-507.
87. Elche, F.E. and Kudehimbu, A.O. (2009). Effect of Particle Size of
Granule on Some Mechanical Properties of Paracetamol Tablets. African
Journal of Biotechnology, 8 (21): 5913-5916.
88. Malik, K., Arora, A. and Singh, I. (2012). Ocium sanctum seeds, a natural
superdisintegrant: formulation and evaluation of fast melt tablets of
nimesulide. Polymer Medicine, 42 (1): pp. 49-59
cxxxvi
89. Adebayo, A.S. and Itiola, A.O. (1998). Evaluation of breadfruit and
cocoyam starches as exo disintegrant in paracetamol tablet formulation.
Pharmacy and Pharmacology Communications, 4 (8): 355-339.
90. Busseri, E., Ruff, y., Moulin, E. and Guisepoir N. (2013). Supramolecular
self-assemblies as functional nanomaterials. Nanoscale, 5: 7098-7140.
91. Garr, J.S.M. and Bargadu, A.B. (2008). Evaluation of sorghum starches
as a tablet excipient. Drug Development and Industrial Pharmacy, 17 (1):
1-6.
92. Vezetshe H, Linder-Wald E.F.L and Tawahii (1965): Starch chemistry.
Journal of Society of Cosmetic Chemists. 1: 181-251.
93. British Pharmacopoaeia. (2009). The Commision Office London,
11: 6578 - 6585.
94. Erikson, M. (1995). The effect of original particle size and tablet porosity
on the increase in tensile strength of tablet. International Journal of
Pharmaceutics, 113 (2):119-120.
95. British Pharmacopeia. (2011). British Pharmacopeia Commission, Crown
Copy right: 205-220.
96. Builders, P.E., Emeje, M. and Kunle, O.O. (2001). Some
physicochemical properties of Cyperus starch- a potential pharmaceutical
excipient. Journal of Pharmaceutical and Allied Sciences. 2 (1); 138-144.
97. Iheagwu, E.N., Omojola, O.M., Emeje, M.O. and Kunle, O.O. (2009).
Isolation and evaluation of some physicochemical properties of Parkia
biglobosa starch. Pure and Applied Chemistry, 81(1): 97-104.
98. Omojola, M.O., Akainkunmi, Y.O., Olufunsho, K.O., Eghareva, H.O. and
Martins, E.O. (2010). Isolation and physicochemical characterization of

cxxxvii
Cola starch. African Journal of Food, Agriculture, Nutrition and
Development, 10 (7): 2884-2900.
99. Oladele, A.K. and Aina, J.O. (2007). Chemical composition and
functional properties of flour produced from two varieties of tiger nut
(Cyperus esculentus). African Journal of Biotechnology, 6(21): 2473-
2476.
100. Attama, A.A., Nnamani, P.O., Mbonu, I.K. and Adikwu, M.U. (2003).
Effects of hypochlorite oxidation on the physicochemical properties of
gladiolus starch. Journal of Pharmacy and Allied sciences, 1 (5): 128-135.
101. Kottke, M.K., Chuch, H.R. and Rhodes, C.T. (1992). Comparism of
disintegrant and binder activity of three corn starch products. Drug
Development and Industrial Pharmacy, 18(20): 2207 – 2223.
102. McPherson, A.E. and Jane, J. (1999). Comparism of waxy potato with
other root and tuber starches. Carbohydrate polymers, 40(1): 57-70.
103. Hoover, R., Li, Y.X., Hynes, G. and Sennayake, N. (1997).
Physicochemcial characterization of Mung bean starch. Food
Hydrocolloids, 11(4): 401-408.
104. Diaz-Arnold, A.M. and Williams, V.D. (1990). Effect of microbial
Contamination and pH changes in storage solutions during in vitro assay
of bonding agents, 6(3): 154 -157.
105. Kong, X.A., Bao, H. and Corke, H. (2009). Physical properties of
Amarathus starch. Food Chemistry, 113(2): 371-376.
106. Liberman, H.A, Reigun, M.M. and Bahker, G.S, (1989). Pharmaceutical
Dosage Form: Disperse Systems. 2nd Edition, Marcel Dekker Inc., New
York, 496-498.
cxxxviii
107. Theodore, D.S. (1980). Solution and Phase Equilibrium in Remington’s
Pharmaceutical Sciences. 16th Edition, Marck Publishing Co. Easton,
Pennsylvania, 223-224.
108. Flora, X.H., Ulaganathan, M. and Rajendran, S. (2012). Influence of
lithium salt concentration PAN-PMMA blend polymer electrolytes.
International Journal of Electrochemical Science,7 (8): 7451-7462.
109. Kulick, W.M., Nottelman, H., Aggour, Y.A. and Elsabee, M.Z. (1989).
Preparations, characterization and rheological behaviour of water
swellable polymers. Polymer mater, Science and Engineering. vol. 61
pp.393-397.
110. Cunningham R.C and Scattergood L.K (1999): Fluid bed granulation of
acetaminophen: effect of key process variables on granule and tablet
characteristics. American Association of Pharmaceutical Scientists, 1-7.
111. Ngwuluka, N.C., Idiakhoha, B.A., Nep, E.I., Ogaji, I. and Okafor, I.S.
(2010). Formulation and evaluation of paracetamol tablets manufactured
using the dried fruit of Phoenix dactylifera as an excipient. Research in
Pharmaceutical Biotechnology, 2(3): 25-32.
112. Bhowmik, D., Chiranjib, B., Yadav, J., Chandiran, R.M. and Kumar,
K.P.S. (2010). Emerging trends of disintegrants use in formulation of
solid dosage forms. Scholars Research Library, 2(1): 495-504.
113. Mudbidri, A. (2010). Tablet compression principles. Pharma Times,
42(11): 44-47.
114. Alebiowu, G. and Itiola, O.A. (2002): Effects of pre gelatinization of
starch binders on the interacting variables acting on the mechanical
properties of a paracetamol tablet formulation. S.T.P Pharmaceutical
Sciences,12 (6): 379- 383.

cxxxix
115. Mhinzi, G.S. (2002). Properties of gum exudates of selected Albizia
species from Tanzania. Food Chemistry, 77 (3): 301-304.
116. Adedokun, M.O. and Itiola, A.O. (2011). Disintegrant activities of
natural and pregelatinized trifoliate yams, rice, and corn starches in
paracetamol tablets. Journal of Applied Pharmaceutical Sciences, 1(10):
200-206.
117. Ibezim, E.C., Ofoefule, S.I, Omeje, E.O. and Odo, U.E. (2008).
Performance of starch obtained from Dioscorea dusotorum and
disintegrated in sodium salicylate tablet. African Journal of Pharmacol, 2
(3): 52-58.
118. Bi, Y., Yonezawa, Y., Sunada, H. (1999). Rapidly distintegrating tablets
prepared by the wet compression method: mechanism and optimization.
Journal of Pharmaceutical Science, 88 (10): 1004-1010.
119. Upradasha, S. M., Kankariri, P.K. and Nuessla, N.O. (1992). Chitosan as
a tablet binder. Drug Development and Industrial Pharmacy,
18(15):1701-1717.
120. Neduri, K., Bontha, V.K. and Vemula, S.K. (2012). Different techniques
to enhance the dissolution rate of lovastatin formulation and evaluation.
Asian Journal of Pharmaceutical and Clinical Research, 6(1): 57-60.
121. Soares, L.A.L., Ortega, G.G., Petrovick, P.R. and Schmidt, P.C. (2005).
Optimization of tablets containing a high dose of spray dried plant
extract: a technical note. AAPS Pharmaceutical Science and Technology,
26 (3): 357-371.
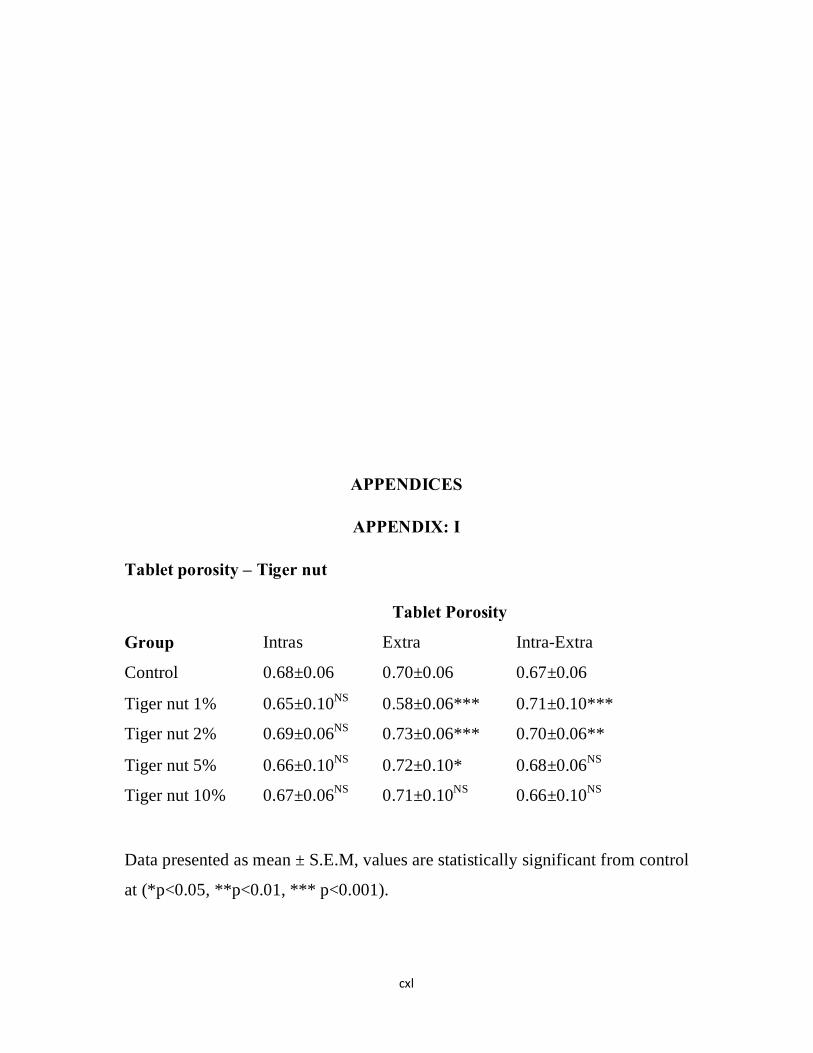
cxl
APPENDICES
APPENDIX: I
Tablet porosity – Tiger nut
Group
Tablet Porosity
Intras Extra Intra-Extra
Control 0.68±0.06 0.70±0.06 0.67±0.06
Tiger nut 1% 0.65±0.10NS 0.58±0.06*** 0.71±0.10***
Tiger nut 2% 0.69±0.06NS 0.73±0.06*** 0.70±0.06**
Tiger nut 5% 0.66±0.10NS 0.72±0.10* 0.68±0.06NS
Tiger nut 10% 0.67±0.06NS 0.71±0.10NS 0.66±0.10NS
Data presented as mean ± S.E.M, values are statistically significant from control
at (*p<0.05, **p<0.01, *** p<0.001).

cxli
APPENDIX II
Tablet porosity – Binder
Group Tablet Porosity
Control 0.61±0.12
Binder 2.5% 0.71±0.10***
Binder 5% 0.66±0.06***
Binder 7.5% 0.65±0.06**
Binder 10% 0.60±0.06NS
Data presented as mean ± S.E.M, values are statistically significant from control
at (*p<0.05, **p<0.01, *** p<0.001).
APPENDIX III
Dissolution studies- SGF
Group
Intra-extra dissolution studies
% Release in SGF
10 min 20 min 30 min 40 min
Control 49.8±0.06 70.3±0.05 92.7±0.11 94.2±0.02
Tiger nut 1% 71.6±0.07*** 77.2±0.11*** 97.4±0.13* 95.8±0.02NS
Tiger nut 2% 90.3±0.23*** 91.4±0.11*** 90.9±0.17NS 90.0±0.10*
Tiger nut 5% 88.4±0.20*** 88.9±0.10*** 89.2±0.17NS 89.5±0.02*
Tiger nut 10% 59.6±0.30*** 51.3±0.16*** 81.6±0.13*** 95.2±0.13NS
Data presented as mean ± S.E.M, values are statistically significant from control
at (*p<0.05, **p<0.01, *** p<0.001).
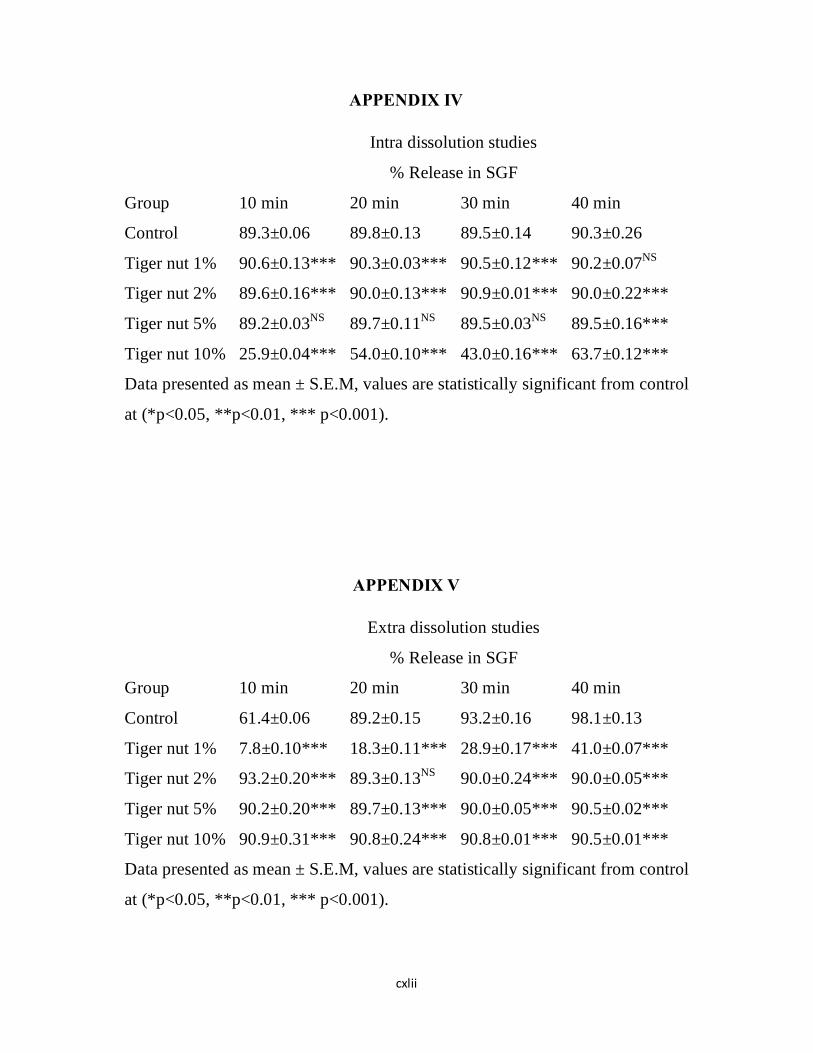
cxlii
APPENDIX IV
Group
Intra dissolution studies
% Release in SGF
10 min 20 min 30 min 40 min
Control 89.3±0.06 89.8±0.13 89.5±0.14 90.3±0.26
Tiger nut 1% 90.6±0.13*** 90.3±0.03*** 90.5±0.12*** 90.2±0.07NS
Tiger nut 2% 89.6±0.16*** 90.0±0.13*** 90.9±0.01*** 90.0±0.22***
Tiger nut 5% 89.2±0.03NS 89.7±0.11NS 89.5±0.03NS 89.5±0.16***
Tiger nut 10% 25.9±0.04*** 54.0±0.10*** 43.0±0.16*** 63.7±0.12***
Data presented as mean ± S.E.M, values are statistically significant from control
at (*p<0.05, **p<0.01, *** p<0.001).
APPENDIX V
Group
Extra dissolution studies
% Release in SGF
10 min 20 min 30 min 40 min
Control 61.4±0.06 89.2±0.15 93.2±0.16 98.1±0.13
Tiger nut 1% 7.8±0.10*** 18.3±0.11*** 28.9±0.17*** 41.0±0.07***
Tiger nut 2% 93.2±0.20*** 89.3±0.13NS 90.0±0.24*** 90.0±0.05***
Tiger nut 5% 90.2±0.20*** 89.7±0.13*** 90.0±0.05*** 90.5±0.02***
Tiger nut 10% 90.9±0.31*** 90.8±0.24*** 90.8±0.01*** 90.5±0.01***
Data presented as mean ± S.E.M, values are statistically significant from control
at (*p<0.05, **p<0.01, *** p<0.001).
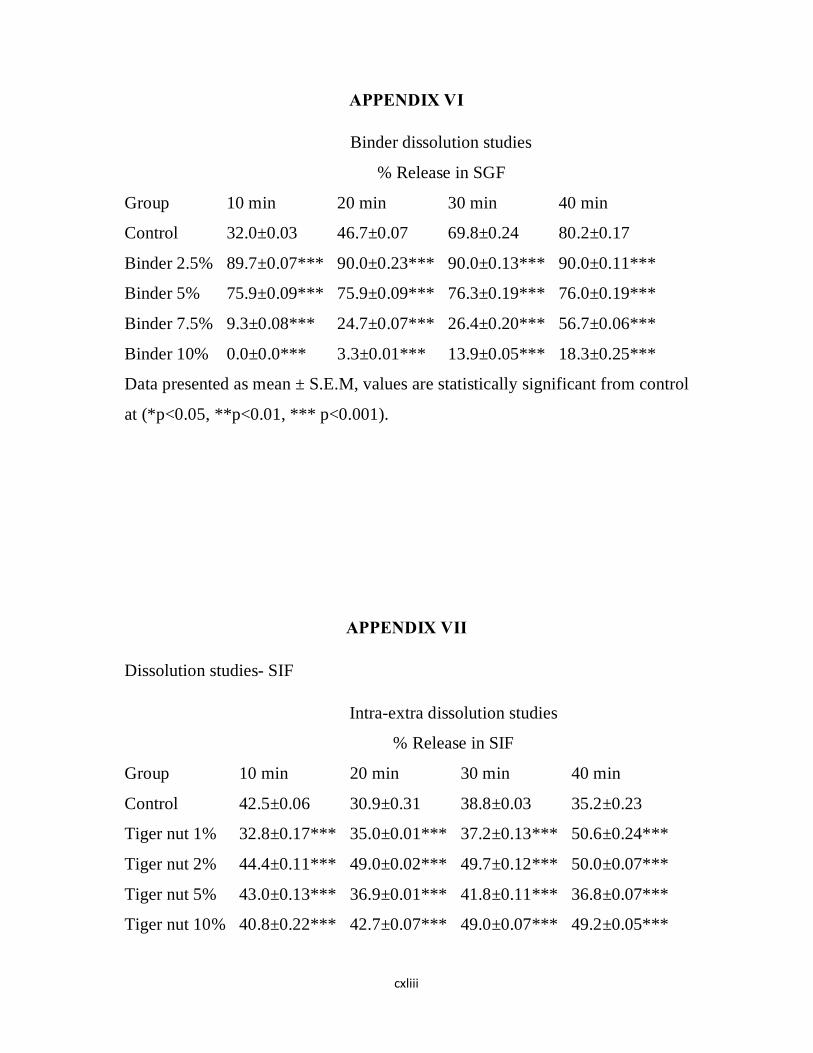
cxliii
APPENDIX VI
Group
Binder dissolution studies
% Release in SGF
10 min 20 min 30 min 40 min
Control 32.0±0.03 46.7±0.07 69.8±0.24 80.2±0.17
Binder 2.5% 89.7±0.07*** 90.0±0.23*** 90.0±0.13*** 90.0±0.11***
Binder 5% 75.9±0.09*** 75.9±0.09*** 76.3±0.19*** 76.0±0.19***
Binder 7.5% 9.3±0.08*** 24.7±0.07*** 26.4±0.20*** 56.7±0.06***
Binder 10% 0.0±0.0*** 3.3±0.01*** 13.9±0.05*** 18.3±0.25***
Data presented as mean ± S.E.M, values are statistically significant from control
at (*p<0.05, **p<0.01, *** p<0.001).
APPENDIX VII
Dissolution studies- SIF
Group
Intra-extra dissolution studies
% Release in SIF
10 min 20 min 30 min 40 min
Control 42.5±0.06 30.9±0.31 38.8±0.03 35.2±0.23
Tiger nut 1% 32.8±0.17*** 35.0±0.01*** 37.2±0.13*** 50.6±0.24***
Tiger nut 2% 44.4±0.11*** 49.0±0.02*** 49.7±0.12*** 50.0±0.07***
Tiger nut 5% 43.0±0.13*** 36.9±0.01*** 41.8±0.11*** 36.8±0.07***
Tiger nut 10% 40.8±0.22*** 42.7±0.07*** 49.0±0.07*** 49.2±0.05***

cxliv
Data presented as mean ± S.E.M, values are statistically significant from control
at (*p<0.05, **p<0.01, *** p<0.001).
APPENDIX VIII
Group
Intra dissolution studies
% Release in SIF
10 min 20 min 30 min 40 min
Control 27.4±0.03 28.7±0.06 30.5±0.23 37.7±0.07
Tiger nut 1% 12.6±0.03*** 22.5±0.05*** 26.9±0.12*** 31.8±0.06***
Tiger nut 2% 14.1±0.11*** 25.0±0.13*** 27.5±0.12*** 24.3±0.13***
Tiger nut 5% 26.8±0.20*** 27.0±0.13*** 30.4±0.13*** 35.0±0.12***
Tiger nut 10% 32.4±0.07*** 34.9±0.23*** 35.4±0.11*** 36.8±0.13***
Data presented as mean ± S.E.M, values are statistically significant from control
at (*p<0.05, **p<0.01, *** p<0.001).
APPENDIX IX
Group
Extra dissolution studies
% Release in SIF
10 min 20 min 30 min 40 min
Control 44.1±0.11 48.5±0.07 50.4±0.10 51.2±0.15
Tiger nut 1% 9.2±0.13*** 10.2±0.05*** 11.5±0.09*** 15.1±0.16***
Tiger nut 2% 27.4±0.17*** 30.5±0.01*** 33.3±0.31*** 37.3±0.20***
Tiger nut 5% 36.8±0.17*** 34.8±0.12*** 34.8±0.28*** 51.7±0.22***
Tiger nut 10% 41.1±0.12*** 43.0±0.13*** 46.2±0.27*** 48.7±0.02***
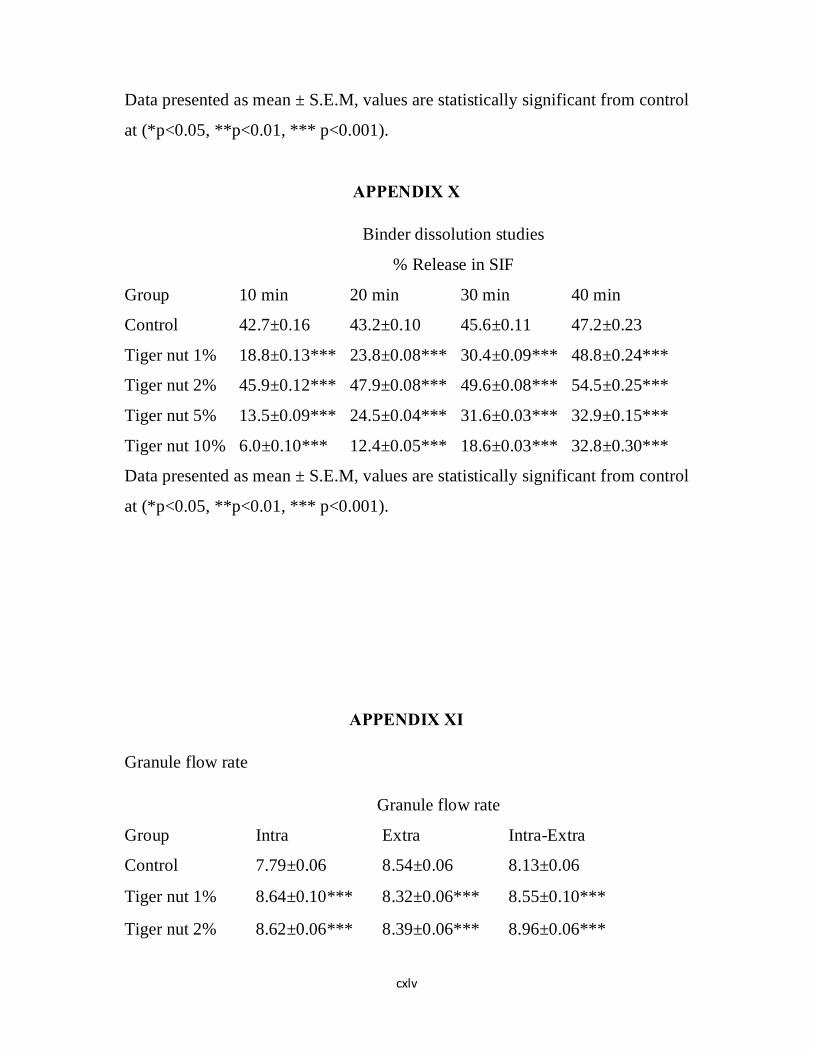
cxlv
Data presented as mean ± S.E.M, values are statistically significant from control
at (*p<0.05, **p<0.01, *** p<0.001).
APPENDIX X
Group
Binder dissolution studies
% Release in SIF
10 min 20 min 30 min 40 min
Control 42.7±0.16 43.2±0.10 45.6±0.11 47.2±0.23
Tiger nut 1% 18.8±0.13*** 23.8±0.08*** 30.4±0.09*** 48.8±0.24***
Tiger nut 2% 45.9±0.12*** 47.9±0.08*** 49.6±0.08*** 54.5±0.25***
Tiger nut 5% 13.5±0.09*** 24.5±0.04*** 31.6±0.03*** 32.9±0.15***
Tiger nut 10% 6.0±0.10*** 12.4±0.05*** 18.6±0.03*** 32.8±0.30***
Data presented as mean ± S.E.M, values are statistically significant from control
at (*p<0.05, **p<0.01, *** p<0.001).
APPENDIX XI
Granule flow rate
Group
Granule flow rate
Intra Extra Intra-Extra
Control 7.79±0.06 8.54±0.06 8.13±0.06
Tiger nut 1% 8.64±0.10*** 8.32±0.06*** 8.55±0.10***
Tiger nut 2% 8.62±0.06*** 8.39±0.06*** 8.96±0.06***
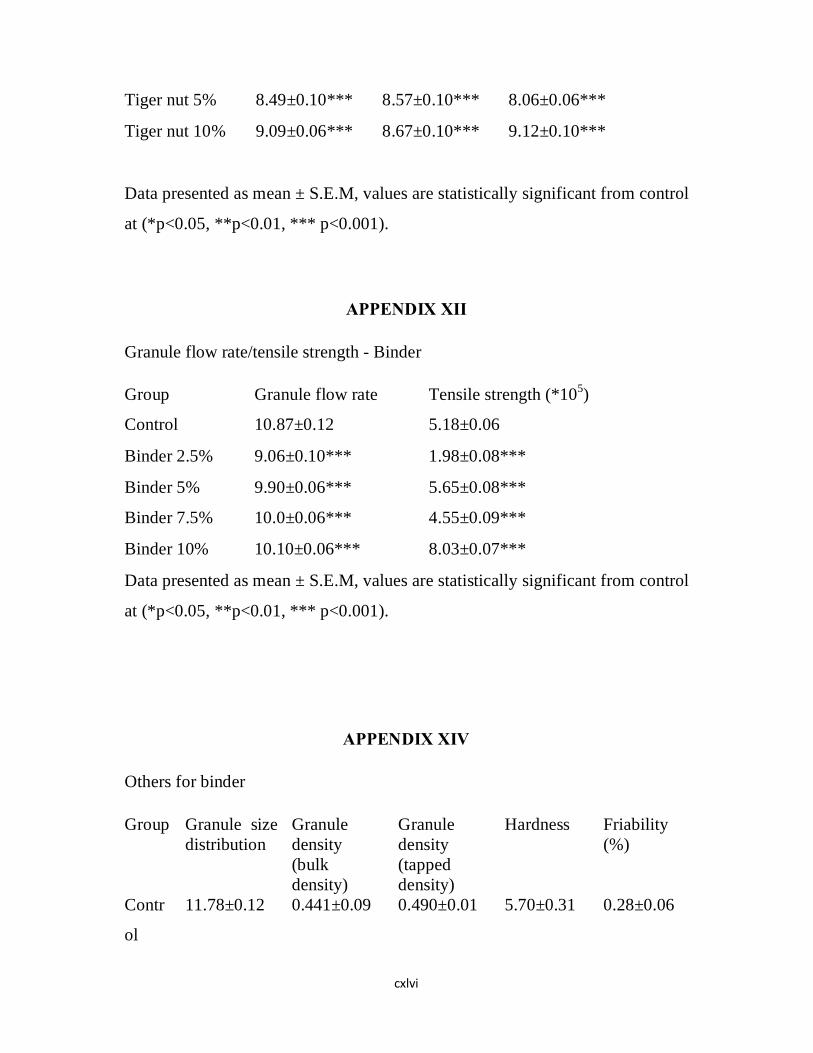
cxlvi
Tiger nut 5% 8.49±0.10*** 8.57±0.10*** 8.06±0.06***
Tiger nut 10% 9.09±0.06*** 8.67±0.10*** 9.12±0.10***
Data presented as mean ± S.E.M, values are statistically significant from control
at (*p<0.05, **p<0.01, *** p<0.001).
APPENDIX XII
Granule flow rate/tensile strength - Binder
Group Granule flow rate Tensile strength (*105)
Control 10.87±0.12 5.18±0.06
Binder 2.5% 9.06±0.10*** 1.98±0.08***
Binder 5% 9.90±0.06*** 5.65±0.08***
Binder 7.5% 10.0±0.06*** 4.55±0.09***
Binder 10% 10.10±0.06*** 8.03±0.07***
Data presented as mean ± S.E.M, values are statistically significant from control
at (*p<0.05, **p<0.01, *** p<0.001).
APPENDIX XIV
Others for binder
Group Granule size distribution
Granule density (bulk density)
Granule density (tapped density)
Hardness Friability (%)
Contr
ol
11.78±0.12 0.441±0.09 0.490±0.01 5.70±0.31 0.28±0.06

cxlvii
Binde
r 2.5%
16.0±0.10**
*
0.418±0.07*
**
0.466±0.07*
**
3.80±0.24*
**
0.25±0.08*
**
Binde
r 5%
15.39±0.06*
**
0.389±0.01*
**
0.442±0.17*
**
6.30±0.02*
**
0.28±0.08NS
Binde
r 7.5%
15.96±0.06*
**
0.449±0.12*
**
0.490±0.13N
S
5.0±0.02**
*
0.18±0.09*
**
Binde
r 10%
14.67±0.06*
**
0.430±0.12*
**
0.486±0.13*
**
9.20±0.04*
**
0.15±0.07*
**
Data presented as mean ± S.E.M, values are statistically significant from control
at (*p<0.05, **p<0.01, *** p<0.001).

cxlviii
APPENDIX XV
Tablet density
Grou
p
Tablet density
Intra Extra Intra-Extra
Bulk
density
Tapped
density
Bulk
density
Tapped
density
Bulk
density
Tapped
density
Contr
ol
0.417±0.06 0.478±0.08 0.413±0.03 0.479±0.06 0.422±0.13 0.452±0.06
Tiger
nut
1%
0.421±0.10
***
0.486±0.24
***
0.413±0.10NS
0.471±0.10
***
0.354±0.10
***
0.433±0.06
***
Tiger
nut
2%
0.413±0.06
***
0.481±0.07
***
0.387±0.06
***
0.489±0.06
***
0.370±0.06
***
0.438±0.06
***
Tiger
nut
5%
0.421±0.10
***
0.467±0.06
***
0.417±0.06
***
0.473±0.10
***
0.413±0.06
***
0.449±0.10
***
Tiger
nut
10%
0.393±0.06
***
0.459±0.10
***
0.378±0.10
***
0.462±0.06
***
0.369±0.10
***
0.450±0.10
*
Data presented as mean ± S.E.M, values are statistically significant from control
at (*p<0.05, **p<0.01, *** p<0.001).

cxlix
APPENDIX XVI
% size distribution
Group
% size distribution
Intra
< 1.7µm < 1.0µm < 0.7µm
Control 43.73±0.12 40.30±0.03 16.15±0.17
Tiger nut 1% 40.45±0.10*** 47.32±0.06*** 12.20±0.10***
Tiger nut 2% 33.33±0.06*** 51.06±0.14*** 15.60±0.15***
Tiger nut 5% 30.30±0.10*** 55.05±0.24*** 14.65±0.06***
Tiger nut 10% 23.11±0.06*** 63.26±0.10*** 13.64±0.10***
Data presented as mean ± S.E.M, values are statistically significant from control
at (*p<0.05, **p<0.01, *** p<0.001)
APPENDIX XVII
Group
% size distribution
Extra
< 1.7µm < 1.0µm < 0.7µm
Control 52.77±0.12 36.31±0.03 10.90±0.17
Tiger nut 1% 41.25±0.10*** 46.48±0.06*** 12.20±0.10***
Tiger nut 2% 44.40±0.06*** 40.55±0.14*** 15.05±0.15***
Tiger nut 5% 56.19±0.10*** 33.90±0.24*** 9.90±0.06***
Tiger nut 10% 10.06±0.06*** 70.02±0.10*** 19.90±0.10***
Data presented as mean ± S.E.M, values are statistically significant from control
at (*p<0.05, **p<0.01, *** p<0.001).
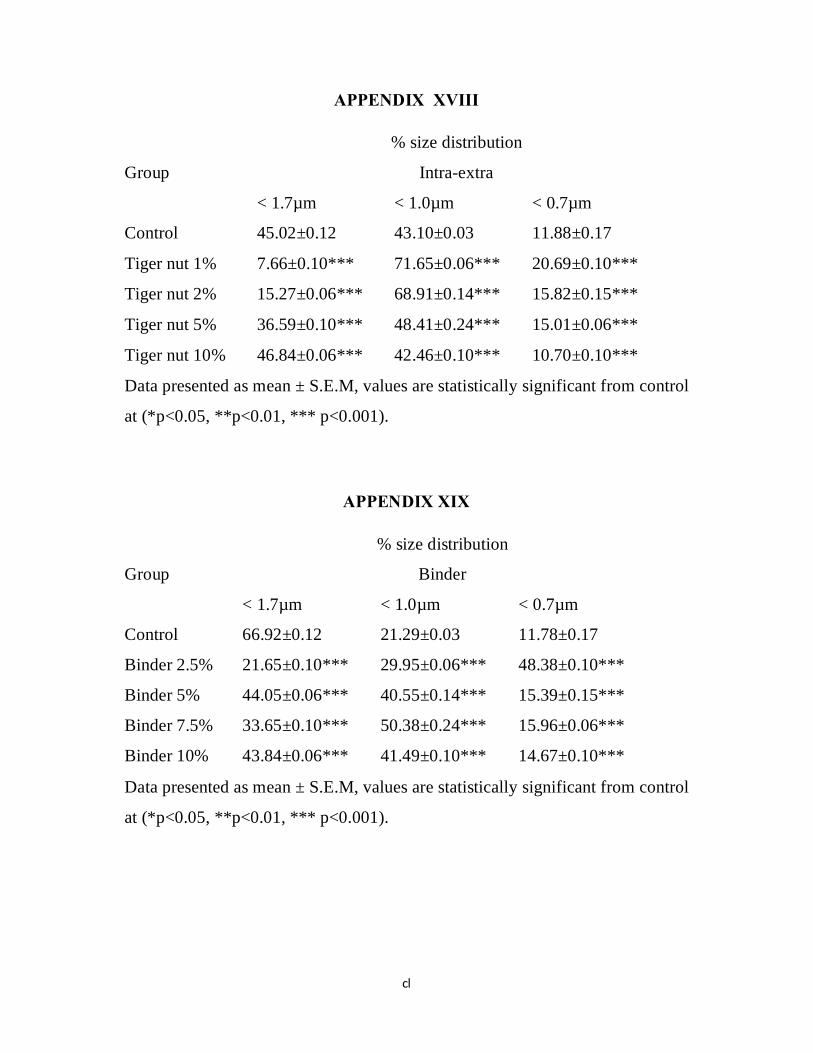
cl
APPENDIX XVIII
Group
% size distribution
Intra-extra
< 1.7µm < 1.0µm < 0.7µm
Control 45.02±0.12 43.10±0.03 11.88±0.17
Tiger nut 1% 7.66±0.10*** 71.65±0.06*** 20.69±0.10***
Tiger nut 2% 15.27±0.06*** 68.91±0.14*** 15.82±0.15***
Tiger nut 5% 36.59±0.10*** 48.41±0.24*** 15.01±0.06***
Tiger nut 10% 46.84±0.06*** 42.46±0.10*** 10.70±0.10***
Data presented as mean ± S.E.M, values are statistically significant from control
at (*p<0.05, **p<0.01, *** p<0.001).
APPENDIX XIX
Group
% size distribution
Binder
< 1.7µm < 1.0µm < 0.7µm
Control 66.92±0.12 21.29±0.03 11.78±0.17
Binder 2.5% 21.65±0.10*** 29.95±0.06*** 48.38±0.10***
Binder 5% 44.05±0.06*** 40.55±0.14*** 15.39±0.15***
Binder 7.5% 33.65±0.10*** 50.38±0.24*** 15.96±0.06***
Binder 10% 43.84±0.06*** 41.49±0.10*** 14.67±0.10***
Data presented as mean ± S.E.M, values are statistically significant from control
at (*p<0.05, **p<0.01, *** p<0.001).

cli
APPENDIX XX
Group
Friability (%)
Intra Extra Intra-Extra
Control 0.19±0.11 0.35±0.09 0.12±0.31
Tiger nut 1% 0.28±0.10*** 0.29±0.06*** 0.14±0.10*
Tiger nut 2% 0.12±0.06*** 0.38±0.06*** 0.33±0.06***
Tiger nut 5% 0.16±0.10*** 0.53±0.10*** 0.21±0.06***
Tiger nut 10% 2.25±0.06*** 2.29±0.10*** 0.17±0.10***
Data presented as mean ± S.E.M, values are statistically significant from control
at (*p<0.05, **p<0.01, *** p<0.001).
APPENDIX XXI
Group
Disintegration
Intra Extra Intra-Extra
Control 2.20±0.23 1.92±0.06 3.20±0.22
Tiger nut 1% 3.23±0.10*** 7.17±0.06*** 5.80±0.10***
Tiger nut 2% 3.12±0.06*** 3.78±0.17*** 5.10±0.06***
Tiger nut 5% 2.72±0.10*** 1.78±0.10*** 4.20±0.31***
Tiger nut 10% 2.70±0.06*** 1.43±0.10*** 2.10±0.10***
Data presented as mean ± S.E.M, values are statistically significant from control
at (*p<0.05, **p<0.01, *** p<0.001).

clii
APPENDIX XXII
Group Disintegration
Control 6.73±0.12
Binder 2.5% 1.32±0.10***
Binder 5% 5.21±0.06***
Binder 7.5% 10.0±0.06***
Binder 10% 32.0±0.06***
Data presented as mean ± S.E.M, values are statistically significant from control
at (*p<0.05, **p<0.01, *** p<0.001).
APPENDIX XXIII
Tensile strength of tiger nut
Group
Tensile strength (*105)
Intra Extra Intra-Extra
Control 4.54±0.23 6.03±0.06 7.86±0.22
Tiger nut 1% 5.53±0.10*** 6.46±0.06*** 5.79±0.10***
Tiger nut 2% 6.46±0.06*** 4.98±0.17*** 4.96±0.06***
Tiger nut 5% 5.61±0.10*** 5.29±0.10*** 5.45±0.31***
Tiger nut 10% 7.06±0.06*** 5.06±0.10*** 8.33±0.10***
Data presented as mean ± S.E.M, values are statistically significant from control
at (*p<0.05, **p<0.01, *** p<0.001).

cliii
APPENDIX XXIV
% Swelling
Time (hr)
% Swelling
Distilled water SIF (no enzyme) SGF (no enzyme)
0.0 0.00 0.00 0.00
0.16 0.58 1.00 1.00
0.33 0.63 1.00 1.00
0.50 1.21 1.00 1.00
0.66 1.74 1.00 1.00
0.83 1.74 1.00 1.00
1 1.74 1.50 1.00
24 4.79 2.00 1.00
APPENDIX XXV
% Swelling –effect of electrolytes
Time (hr)
% Swelling
2.0N 1.0N 0.5N 0.1N
NaCl MgCl2 NaCl MgCl2 NaCl MgCl2 NaCl MgCl2
0.0 0 0 0 0 0 0 0 0
0.16 -10 -5 0.5 2 2 0.3 0 0.5
0.33 -10 -10 0 -1 0 0 2 1.0
0.50 -10 -10 -1 -1 -10 0 2 1.0
0.66 -10 -10 0 -1 -10 -8 2 1.1
0.83 -10 -10 -10 -3 -10 -8 2.5 1.2
1 -10 -15 -10 -3 -20 -8 2.3 1.5
24 -20 -15 -20 -3 -20 -10 2.3 1.6
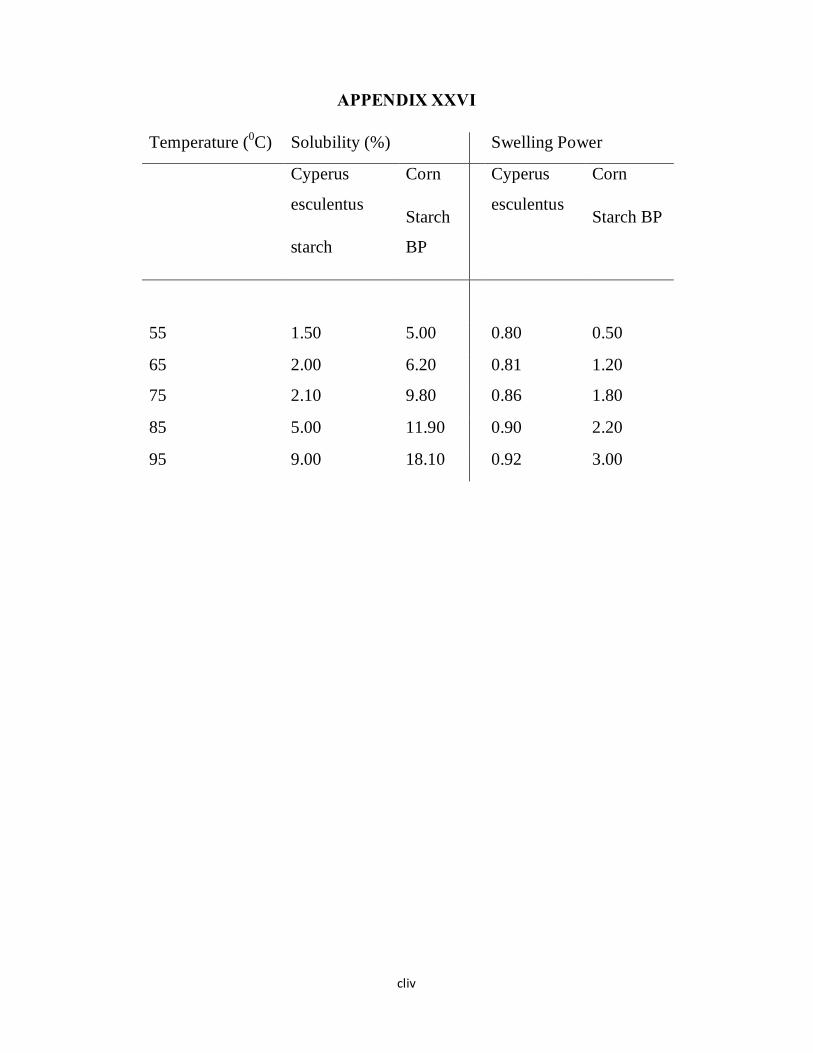
cliv
APPENDIX XXVI
Temperature (0C) Solubility (%) Swelling Power
Cyperus
esculentus
starch
Corn
Starch
BP
Cyperus
esculentus
Corn
Starch BP
55 1.50 5.00 0.80 0.50
65 2.00 6.20 0.81 1.20
75 2.10 9.80 0.86 1.80
85 5.00 11.90 0.90 2.20
95 9.00 18.10 0.92 3.00

clv
APPENDIX XXVII
TABLE SHOWING PERCENTAGE DRUG RELEASED AT
DIFFERENT TIMES
TABLET
BATCH
% DRUG RELEASE SGF
SIF
10MIN 20MIN 30MIN 40MIN 10MIN 20MIN 30MIN 40MIN
CE3 89.46 89.83 89.58 90.32 27.47 28.70 30.55 37.72
TE1 90.69 90.32 90.57 90.20 12.65 22.58 26.91 31.85
TE2 89.65 90.08 90.94 90.02 26.85 27.09 30.43 35.06
TE3 89.21 89.77 89.58 89.58 26.84 27.09 30.43 35.06
TE4 25.92 54.07 43.00 63.77 32.47 34.94 35.43 36.85
CX3 61.49 89.28 93.32 98.17 44.19 48.52 50.49 51.24
TX1 7.89 18.39 28.94 41.5 9.25 10.24 11.53 15.18
TX2 93.29 89.39 90.01 90.01 27.47 30.53 33.39 37.35
TX3 90.26 89.76 90.01 90.57 36.85 34.87 34.81 51.73
TX4 90.94 90.82 90.82 90.57 41.17 43.03 48.77 48.77
CEX3 49.88 70.38 92.73 94.27 42.59 30.98 38.83 35.24
TEX1 71.62 77.23 97.48 95.82 32.89 35.06 37.22 50.68
TEX2 90.38 91.43 90.08 90.08 44.45 49.08 49.76 50.07
TEX3 88.47 88.96 89.27 89.52 43.03 36.91 41.85 36.85
TEX4 59.69 51.30 81.62 95.20 40.80 42.72 49.08 49.14
BC2 76.24 77.29 76.93 75.63 45.99 47.84 50.07 54.14
BT2 75.94 75.94 76.37 76.06 45.99 47.90 49.69 54.57
BT3 9.31 24.74 26.48 56.73 13.57 24.50 31.60 32.96
% DRUG RELEASE
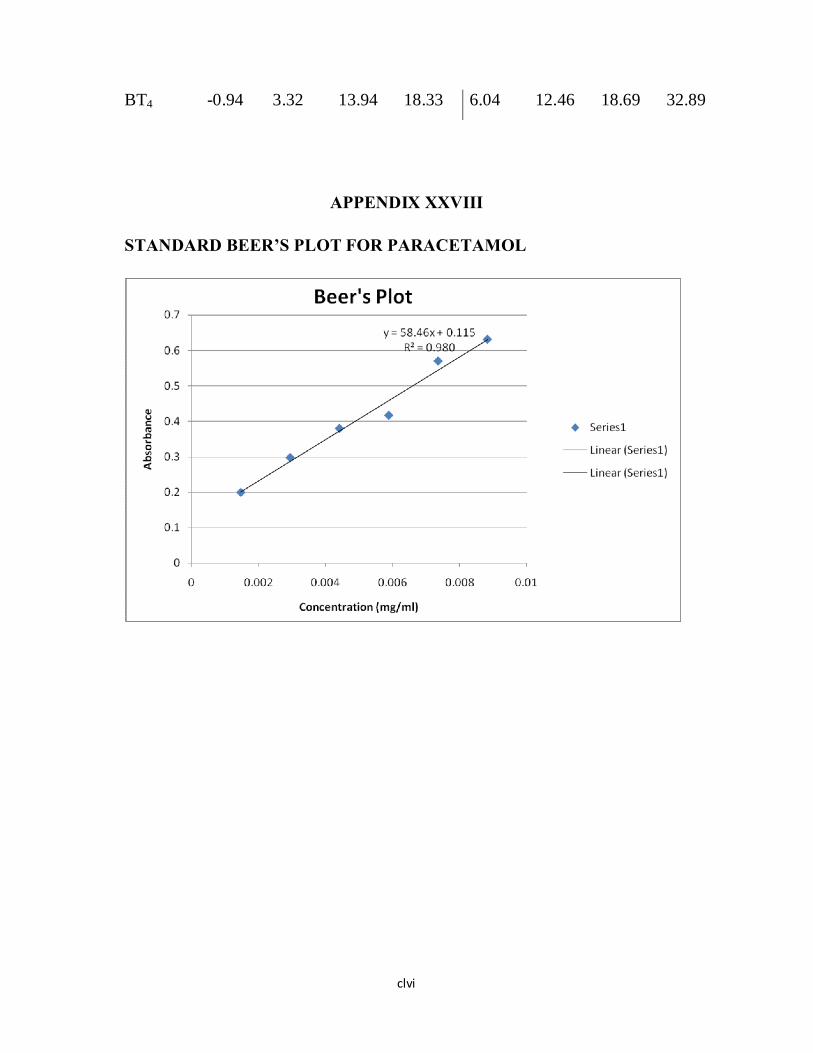
clvi
BT4 -0.94 3.32 13.94 18.33 6.04 12.46 18.69 32.89
APPENDIX XXVIII
STANDARD BEER’S PLOT FOR PARACETAMOL


