Embed Size (px)
Citation preview

6.0 Data Analysis and Interpretation
6.1 To meet the first objective the researcher had considered the following hypotheses
To study relationship between demographic factors and brand choice the researcher has proceed
as follows.
1.1.1 Demographic factor: Gender
H0: Choice of Brand Nokia is independent of Gender of User.
H1: Choice of Brand Nokia is dependent of Gender of User.
Table 6.1.1.1
Which brand of mobile
phone(s) are you presently
using Gender Total
Nokia Male Female
No Count 285 232 517
% within Gender 62.6% 68.4% 65.1%
Yes Count 170 107 277
% within Gender 37.4% 31.6% 34.9%
Total Count 455 339 794
% within Gender 100.0% 100.0% 100.0%
Source: Survey
Chi-Square Tests
Value do
Asymp. Sig.
(2-sided)
Exact Sig.
(2-sided)
Exact Sig.
(1-sided)
Pearson Chi -Square 2.876(b) 1 .090
Continuity Correction(a) 2.626 1 .105
Fisher's Exact Test .098 .052
The above hypothesis is tested at 5% LOS

P value = 0.052
Since p= 0.52 > 0.05 therefore Null hypothesis is accepted by the Researcher.
Thus Researcher concludes that Nokia is not significant with the gender of the mobile phones
users.
Therefore Choice of Brand NOKIA is independent of Gender of User.

H0 : Choice of Brand LG is independent of Gender of User.
H1 : Choice of Brand LG is dependent of Gender of User.
Table 6.1.1.2
Which brand of mobile
phone(s) are you presently
using
Gender Total
LG
Male Female
No Count 436 327 763
% within
Gender 95.8% 96.5% 96.1%
Yes Count 19 12 31
% within
Gender 4.2% 3.5% 3.9%
Total Count 455 339 794
% within
Gender 100.0% 100.0% 100.0%
Source: Survey
Chi-Square Tests
Value Df
Asymp. Sig.
(2-sided)
Exact Sig.
(2-sided)
Exact Sig.
(1-sided)
Pearson Chi -Square .209(b) 1 .647
Continuity
Correction(a) .074 1 .785
Likelihood Ratio .211 1 .646
Fisher's Exact Test .714 .396
Linear -by-Linear
Association .209 1 .647
N of Valid Cases 794
The above hypothesis is tested at 5% LOS

P value = 0.396
Since p= 0.396 > 0.05 therefore Null hypothesis is accepted by the Researcher.
Thus Researcher concludes that LG is not significant with the gender of the mobile phones users.
Therefore Choice of Brand LG is independent of Gender of User.

H0 : Choice of Brand Samsung is independent of Gender of User.
H1 : Choice of Brand Samsung is dependent of Gender of User.
Table 6.1.1.3
Which brand of mobile phone(s)
are you presently using
Gender Total
Samsung Male Female
No Count 381 283 664
% within
Gender 83.7% 83.5% 83.6%
Yes Count 74 56 130
% within
Gender 16.3% 16.5% 16.4%
Total Count 455 339 794
% within
Gender 100.0% 100.0% 100.0%
Source: Survey
Chi-Square Tests
Value Df
Asymp. Sig.
(2-sided)
Exact Sig.
(2-sided)
Exact Sig.
(1-sided)
Pearson Chi -Square .009(b) 1 .923
Continuity
Correction(a) .000 1 1.000
Likelihood Ratio .009 1 .923
Fisher's Exact Test .923 .499
Linear -by-Linear
Association .009 1 .923
N of Valid Cases 794
The above hypothesis is tested at 5% LOS
P value = 0.499
Since p= 0.499 > 0.05 therefore Null hypothesis is accepted by the Researcher.

Thus Researcher concludes that Samsung is not significant with the gender of the mobile phones
users.
Therefore Choice of Brand SAMSUNG is independent of Gender of User.

H0 : Choice of Brand Reliance is independent of Gender of User.
H1 : Choice of Brand Reliance is dependent of Gender of User.
Table 6.1.1.4
Which brand of mobile phone(s)
are you presently using
Gender Total
Reliance
Male Female
No Count 441 326 767
% within
Gender 96.9% 96.2% 96.6%
Yes Count 14 13 27
% within
Gender 3.1% 3.8% 3.4%
Total Count 455 339 794
% within
Gender 100.0% 100.0% 100.0%
Source: Survey
Chi-Square Tests
Value do
Asymp. Sig.
(2-sided)
Exact Sig.
(2-sided)
Exact Sig.
(1-sided)
Pearson Chi -Square .340(b) 1 .560
Continuity
Correction(a) .148 1 .700
Likelihood Ratio .337 1 .562
Fisher's Exact Test .560 .348
Linear -by-Linear
Association .339 1 .560
N of Valid Cases 794
The above hypothesis is tested at 5% LOS
P value = 0.348

Since p= 0.348 > 0.05 therefore Null hypothesis is accepted by the Researcher.
Thus Researcher concludes that Reliance is not significant with the gender of the mobile phones
users.
Therefore Choice of Brand RELIANCE is independent of Gender of User.

H0 : Choice of Brand Blackberry is independent of Gender of User.
H1 : Choice of Brand Blackberry is dependent of Gender of User.
Table 6.1.1.5
Which brand of mobile phone(s)
are you presently using
Gender Total
Blackberry Male Female
No Count 278 220 498
% within
Gender 61.1% 64.9% 62.7%
Yes Count 177 119 296
% within
Gender 38.9% 35.1% 37.3%
Total
Count 455 339 794
% within
Gender 100.0% 100.0% 100.0%
Source: Survey
Chi-Square Tests
Value Df
Asymp. Sig.
(2-sided)
Exact Sig.
(2-sided)
Exact Sig.
(1-sided)
Pearson Chi -Square 1.198(b) 1 .274
Continuity
Correction(a) 1.041 1 .307
Likelihood Ratio 1.201 1 .273
Fisher's Exact Test .299 .154
Linear -by-Linear
Association 1.197 1 .274
N of Valid Cases 794
The above hypothesis is tested at 5% LOS

P value = 0.154
Since p= 0.154 > 0.05 therefore Null hypothesis is accepted by the Researcher.
Thus Researcher concludes that Blackberry is not significant with the gender of the mobile
phones users.
Therefore Choice of Brand BLACKBERRY is independent of Gender of User.

H0 : Choice of Brand Apple is independent of Gender of User.
H1 : Choice of Brand Apple is dependent of Gender of User.
Table 6.1.1.6
Which brand of mobile
phone(s) are you presently
using
Gender Total
Apple
Male Female
No Count 397 307 704
% within
Gender 87.3% 90.6% 88.7%
Yes Count 58 32 90
% within
Gender 12.7% 9.4% 11.3%
Total Count 455 339 794
% within
Gender 100.0% 100.0% 100.0%
Source: Survey
Chi-Square Tests
Value Df
Asymp. Sig.
(2-sided)
Exact Sig.
(2-sided)
Exact Sig.
(1-sided)
Pearson Chi -Square 2.115(b) 1 .146
Continuity
Correction(a) 1.799 1 .180
Likelihood Ratio 2.149 1 .143
Fisher's Exact Test .174 .089
Linear -by-Linear
Association 2.112 1 .146
N of Valid Cases 794

The above hypothesis is tested at 5% LOS
P value = 0.089
Since p= 0.089 > 0.05 therefore Null hypothesis is accepted by the Researcher.
Thus Researcher concludes that Apple is not significant with the gender of the mobile phones
users.
Therefore Choice of Brand APPLE is independent of Gender of User.

H0 : Choice of Brand Motorola is independent of Gender of User.
H1 : Choice of Brand Motorola is dependent of Gender of User.
Table 6.1.1.7
Which brand of mobile phone(s)
are you presently using
Gender Total
Motorola Male Female
No Count 448 332 780
% within
Gender 98.5% 97.9% 98.2%
Yes Count 7 7 14
% within
Gender 1.5% 2.1% 1.8%
Total Count 455 339 794
% within
Gender 100.0% 100.0% 100.0%
Source: Survey
Chi-Square Tests
Value Df
Asymp. Sig.
(2-sided)
Exact Sig.
(2-sided)
Exact Sig.
(1-sided)
Pearson Chi -Square .311(b) 1 .577
Continuity
Correction(a) .081 1 .776
Likelihood Ratio .308 1 .579
Fisher's Exact Test .596 .384
Linear -by-Linear
Association .310 1 .577
N of Valid Cases 794
The above hypothesis is tested at 5% LOS
P value = 0.384
Since p= 0.384 > 0.05 therefore Null hypothesis is accepted by the Researcher.
Thus Researcher concludes that Motorola is not significant with the gender of the mobile phones
users.
Therefore Choice of Brand MOTOROLA is independent of Gender of User.

H0 : Choice of Brand Sony is independent of Gender of User.
H1 : Choice of Brand Sony is dependent of Gender of User.
Table 6.1.1.8
Which brand of mobile
phone(s) are you presently
using
Gender Total
Sony Male Female
No Count 440 324 764
% within
Gender 96.7% 95.6% 96.2%
Yes Count 15 15 30
% within
Gender 3.3% 4.4% 3.8%
Total Count 455 339 794
% within
Gender 100.0% 100.0% 100.0%
Source: Survey
Chi-Square Tests
Value Df
Asymp. Sig.
(2-sided)
Exact Sig.
(2-sided)
Exact Sig.
(1-sided)
Pearson Chi -Square .680(b) 1 .410
Continuity
Correction(a) .405 1 .524
Likelihood Ratio .673 1 .412
Fisher's Exact Test .454 .261
Linear -by-Linear
Association .679 1 .410
N of Valid Cases 794
The above hypothesis is tested at 5% LOS

P value = 0.261
Since p= 0.261 > 0.05 therefore Null hypothesis is accepted by the Researcher.
Thus Researcher concludes that Sony is not significant with the gender of the mobile phones
users.
Therefore Choice of Brand SONY is independent of Gender of User.

H0 : Choice of Brand Micromax is independent of Gender of User.
H1 : Choice of Brand Micromax is dependent of Gender of User.
Table 6.1.1.9
Which brand of mobile
phone(s) are you presently
using
Gender Total
Micromax
Male Female
No Count 450 328 778
% within
Gender 98.9% 96.8% 98.0%
Yes Count 5 11 16
% within
Gender 1.1% 3.2% 2.0%
Total Count 455 339 794
% within
Gender 100.0% 100.0% 100.0%
Source: Survey
Chi-Square Tests
Value Df
Asymp. Sig.
(2-sided)
Exact Sig.
(2-sided)
Exact Sig.
(1-sided)
Pearson Chi -Square 4.531(b) 1 .033
Continuity
Correction(a) 3.509 1 .061
Likelihood Ratio 4.508 1 .034
Fisher's Exact Test .041 .031
Linear -by-Linear
Association 4.525 1 .033
N of Valid Cases 794
The above hypothesis is tested at 5% LOS

P value = 0.031
Since p= 0.031 < 0.05 therefore Null hypothesis is Rejected by the Researcher.
Thus Researcher concludes that
users.
Therefore Choice of Brand MICROMAX is dependent of Gender of User.
Preference of Brand Micromax with Gender
Fig. 6.1.1.9
It is very clear from the above segmented bar diagram, that Females are more pro towards
the brand of Micromax than males
(jazzy) given to the handset which
0%
10%
20%
30%
40%
50%
60%
70%
80%
90%
100%
No
0.05 therefore Null hypothesis is Rejected by the Researcher.
Thus Researcher concludes that Micromax is significant with the gender of the mobile phones
Choice of Brand MICROMAX is dependent of Gender of User.
Micromax with Gender
It is very clear from the above segmented bar diagram, that Females are more pro towards
the brand of Micromax than males. The strongest reason for that is the aesthetic look
(jazzy) given to the handset which attracts more Females than males.
Yes
Female
Male
is significant with the gender of the mobile phones
It is very clear from the above segmented bar diagram, that Females are more pro towards
The strongest reason for that is the aesthetic look

H0 : Choice of Brand Tata is independent of Gender of User.
H1 : Choice of Brand Tata is dependent of Gender of User.
Table 6.1.1.10
Which brand of mobile
phone(s) are you presently
using
Gender Total
Tata Male Female
No Count 452 335 787
% within
Gender 99.3% 98.8% 99.1%
Yes Count 3 4 7
% within
Gender .7% 1.2% .9%
Total Count 455 339 794
% within
Gender 100.0% 100.0% 100.0%
Source: Survey
Chi-Square Tests
Value Df
Asymp. Sig.
(2-sided)
Exact Sig.
(2-sided)
Exact Sig.
(1-sided)
Pearson Chi -Square .603(b) 1 .438
Continuity
Correction(a) .154 1 .695
Likelihood Ratio .594 1 .441
Fisher's Exact Test .468 .343
Linear -by-Linear
Association .602 1 .438
N of Valid Cases 794

The above hypothesis is tested at 5% LOS
P value = 0.343
Since p= 0.343 > 0.05 therefore Null hypothesis is accepted by the Researcher.
Thus Researcher concludes that Tata is not significant with the gender of the mobile phones
users.
Therefore Choice of Brand TATA is independent of Gender of User.

H0 : Choice of Brand HTC is independent of Gender of User.
H1 : Choice of Brand HTC is dependent of Gender of User.
Table 6.1.1.11
Which brand of mobile
phone(s) are you presently
using
Gender Total
HTC Male Female
No Count 445 335 780
% within
Gender 97.8% 98.8% 98.2%
Yes Count 10 4 14
% within
Gender 2.2% 1.2% 1.8%
Total Count 455 339 794
% within
Gender 100.0% 100.0% 100.0%
Source: Survey
Chi-Square Tests
Value Df
Asymp. Sig.
(2-sided)
Exact Sig.
(2-sided)
Exact Sig.
(1-sided)
Pearson Chi -Square 1.162(b) 1 .281
Continuity
Correction(a) .649 1 .421
Likelihood Ratio 1.213 1 .271
Fisher's Exact Test .415 .212
Linear -by-Linear
Association 1.160 1 .281
N of Valid Cases 794
The above hypothesis is tested at 5% LOS

P value = 0.212
Since p= 0.212 > 0.05 therefore Null hypothesis is accepted by the Researcher.
Thus Researcher concludes that HTC is not significant with the gender of the mobile phones
users.
Therefore Choice of Brand HTC is independent of Gender of User.

H0 : Choice of Brand Philips is independent of Gender of User.
H1 : Choice of Brand Philips is dependent of Gender of User.
Table 6.1.1.12
Which brand of mobile
phone(s) are you presently
using
Gender Total
Philips Male Female
No Count 455 339 794
% within
Gender 100.0% 100.0% 100.0%
Total Count 455 339 794
% within
Gender 100.0% 100.0% 100.0%
Source: Survey
Chi-Square Tests
Value
Pearson Chi -Square .(a)
N of Valid Cases 794
No statistics are computed because Philips is a constant
From Table 6.1.1.12 Researcher has concluded that none of the respondent likes the brand
Philips.

H0 : Choice of Brand Spice is independent of Gender of User.
H1 : Choice of Brand Spice is dependent of Gender of User.
Table 6.1.1.13
Which brand of mobile
phone(s) are you presently
using
Gender Total
Spice Male Female
No Count 453 338 791
% within
Gender 99.6% 99.7% 99.6%
Yes Count 2 1 3
% within
Gender .4% .3% .4%
Total Count 455 339 794
% within
Gender 100.0% 100.0% 100.0%
Source: Survey
Chi-Square Tests
Value Df
Asymp. Sig.
(2-sided)
Exact Sig.
(2-sided)
Exact Sig.
(1-sided)
Pearson Chi -Square .108(b) 1 .743
Continuity
Correction(a) .000 1 1.000
Likelihood Ratio .111 1 .739
Fisher's Exact Test 1.000 .609
Linear -by-Linear
Association .108 1 .743
N of Valid Cases 794

The above hypothesis is tested at 5% LOS
P value = 0.609
Since p= 0.609 > 0.05 therefore Null hypothesis is accepted by the Researcher.
Thus Researcher concludes that Spice is not significant with the gender of the mobile phones
users.
Therefore Choice of Brand SPICE is independent of Gender of User.
H0 : Choice of Brand Videocon is independent of Gender of User.
H1 : Choice of Brand Videocon is dependent of Gender of User.
Table 6.1.1.14
Which brand of mobile phone(s)
are you presently using
Gender Total
Videocon
Male Female
No Count 455 339 794
% within
Gender 100.0% 100.0% 100.0%
Total Count 455 339 794
% within
Gender 100.0% 100.0% 100.0%
Source: Survey
Chi-Square Tests
Value
Pearson Chi-Square .(a)
N of Valid Cases 794
No statistics are computed because Videocon is a constant. From Table 6.1.1.14 Researcher
has concluded that none of the respondent likes the brand Videocon.

1.1.2 Demographic factor: AGE
H0 : Choice of Brand Nokia is independent of Age of User.
H1 : Choice of Brand Nokia is dependent of Age of User.
Table 6.1.2.1
Which brand of mobile
phone(s) are you presently
using
Age Total
Nokia
18-28 29-39 40-50
51 &
above
No Count 234 126 125 27 512
% within
Age 71.3% 60.6% 63.1% 55.1% 65.4%
Yes Count 94 82 73 22 271
% within
Age 28.7% 39.4% 36.9% 44.9% 34.6%
Total Count 328 208 198 49 783
% within
Age 100.0% 100.0% 100.0% 100.0% 100.0%
Source: Survey
Chi-Square Tests
Value Df
Asymp. Sig.
(2-sided)
Pearson Chi -Square 10.000(a) 3 .019
Likelihood Ratio 10.029 3 .018
Linear -by-Linear
Association 7.110 1 .008
N of Valid Cases 783
The above hypothesis is tested at 5% LOS

P value = 0.019
Since p= 0.019 <0.05 therefore Null hypothesis is Rejected by the Researcher.
Thus Researcher concludes that Nokia
Therefore Choice of Brand NOKIA is dependent of Age of User.
Preference of Brand Nokia with Age
Fig.
From the above segmented cone diagram it is clear that the age group of 18
years and 40-50 years have greater preference as compared to age group of 51 years and
above.
0
50
100
150
200
250
300
350
18-28 29-39
Since p= 0.019 <0.05 therefore Null hypothesis is Rejected by the Researcher.
Nokia is significant with the Age of the mobile phones users.
Choice of Brand NOKIA is dependent of Age of User.
Preference of Brand Nokia with Age
Fig. 6.1.2.1
From the above segmented cone diagram it is clear that the age group of 18
50 years have greater preference as compared to age group of 51 years and
39 40-50 51 &
above
Nokia Yes
Nokia No
is significant with the Age of the mobile phones users.
From the above segmented cone diagram it is clear that the age group of 18-28 years, 29-39
50 years have greater preference as compared to age group of 51 years and

H0 : Choice of Brand LG is independent of Age of User.
H1 : Choice of Brand LG is dependent of Age of User.
Table 6.1.2.2
Which brand of mobile
phone(s) are you
presently using
Age Total
LG 18-28 29-39 40-50
51 &
above
No Count 320 196 189 47 752
% within
Age 97.6% 94.2% 95.5% 95.9% 96.0%
Yes Count 8 12 9 2 31
% within
Age 2.4% 5.8% 4.5% 4.1% 4.0%
Total Count 328 208 198 49 783
% within
Age 100.0% 100.0% 100.0% 100.0% 100.0%
Source: Survey
Chi-Square Tests
Value Df
Asymp. Sig.
(2-sided)
Pearson Chi -Square 3.967(a) 3 .265
Likelihood Ratio 4.050 3 .256
Linear -by-Linear
Association 1.431 1 .232
N of Valid Cases 783
The above hypothesis is tested at 5% LOS
P value = 0.265

Since p= 0.265 > 0.05 therefore Null hypothesis is Accepted by the Researcher.
Thus Researcher concludes that LG is not significant with the Age of the mobile phones users.
Therefore Choice of Brand LG is independent of Age of User.

H0 : Choice of Brand Samsung is independent of Age of User.
H1 : Choice of Brand Samsung is dependent of Age of User.
Table 6.1.2.3
Which brand of mobile
phone(s) are you
presently using
Age Total
Samsung 18-28 29-39 40-50 51 & above
No Count 274 177 163 40 654
% within
Age 83.5% 85.1% 82.3% 81.6% 83.5%
Yes Count 54 31 35 9 129
% within
Age 16.5% 14.9% 17.7% 18.4% 16.5%
Total Count 328 208 198 49 783
% within
Age 100.0% 100.0% 100.0% 100.0% 100.0%
Source: Survey
Chi-Square Tests
Value Df
Asymp. Sig.
(2-sided)
Pearson Chi -Square .708(a) 3 .871
Likelihood Ratio .711 3 .871
Linear -by-Linear
Association .184 1 .668
N of Valid Cases 783
The above hypothesis is tested at 5% LOS
P value = 0.871
Since p= 0.871 > 0.05 therefore Null hypothesis is Accepted by the Researcher.

Thus Researcher concludes that Samsung is not significant with the Age of the mobile phones
users.
Therefore Choice of Brand SAMSUNG is independent of Age of User.

H0 : Choice of Brand Reliance is independent of Age of User.
H1 : Choice of Brand Reliance is dependent of Age of User.
Table 6.1.2.4
Which brand of mobile
phone(s) are you presently
using
Age Total
Reliance 18-28 29-39 40-50 51 & above
No Count 319 200 192 45 756
% wi thin
Age 97.3% 96.2% 97.0% 91.8% 96.6%
Yes Count 9 8 6 4 27
% within
Age 2.7% 3.8% 3.0% 8.2% 3.4%
Total Count 328 208 198 49 783
% within
Age 100.0% 100.0% 100.0% 100.0% 100.0%
Source: Survey
Chi-Square Tests
Value Df
Asymp. Sig.
(2-sided)
Pearson Chi -Square 3.963(a) 3 .265
Likelihood Ratio 3.116 3 .374
Linear -by-Linear
Association 1.551 1 .213
N of Valid Cases 783
The above hypothesis is tested at 5% LOS
P value = 0.265

Since p= 0.265 > 0.05 therefore Null hypothesis is Accepted by the Researcher.
Thus Researcher concludes that Reliance is not significant with the Age of the mobile phones
users.
Therefore Choice of Brand RELIANCE is independent of Age of User.

H0 : Choice of Brand Blackberry is independent of Age of User.
H1 : Choice of Brand Blackberry is dependent of Age of User.
Table 6.1.2.5
Which brand of mobile
phone(s) are you presently
using
Age Total
Blackberry 18-28 29-39 40-50
51 &
above
No Count 175 142 130 43 490
% within
Age 53.4% 68.3% 65.7% 87.8% 62.6%
Yes Count 153 66 68 6 293
% within
Age 46.6% 31.7% 34.3% 12.2% 37.4%
Total Count 328 208 198 49 783
% within
Age 100.0% 100.0% 100.0% 100.0% 100.0%
Source: Survey
Chi-Square Tests
Value Df
Asymp. Sig.
(2-sided)
Pearson Chi -Square 28.860(a) 3 .000
Likelihood Ratio 31.037 3 .000
Linear -by-Linear
Association 22.038 1 .000
N of Valid Cases 783

The above hypothesis is tested at 5% LOS
P value = 0.000
Since p= 0.00 < 0.05 therefore Null hypothesis is Rejected by the Researcher.
Thus Researcher concludes that Blackberry is significant with the Age of the mobile phones
users.
Therefore Choice of Brand BLACKBERRY is dependent of Age of User.
Preference of Brand Blackberry with Age
Fig. 6.1.2.5
From the above segmented bar graph it is observed that Blackberry is liked by the youth
and the middle age people because being smart phone they can use in their business,
service etc. the least preferred is by the age group of 51 years and above.
0
100
200
300
400
500
600
No Yes
Blackberry
51 & above
40-50
29-39
18-28

H0 : Choice of Brand Apple is independent of Age of User.
H1 : Choice of Brand Apple is dependent of Age of User.
Table 6.1.2.6
Which brand of mobile
phone(s) are you
presently using
Age Total
Apple
18-28 29-39 40-50 51 & above
No Count 283 190 171 49 693
% within
Age 86.3% 91.3% 86.4% 100.0% 88.5%
Yes Count 45 18 27 0 90
% within
Age 13.7% 8.7% 13.6% .0% 11.5%
Total Count 328 208 198 49 783
% within
Age 100.0% 100.0% 100.0% 100.0% 100.0%
Source: Survey
Chi-Square Tests
Value Df
Asymp. Sig.
(2-sided)
Pearson Chi -Square 10.503(a) 3 .015
Likelihood Ratio 16.115 3 .001
Linear -by-Linear
Association 2.794 1 .095
N of Valid Cases 783

The above hypothesis is tested at 5% LOS
P value = 0.015
Since p= 0.015 < 0.05 therefore Null hypothesis is Rejected by the Researcher.
Thus Researcher concludes that Apple is significant with the Age of the mobile phones users.
Therefore Choice of Brand APPLE is dependent of Age of User.
Preference of Brand Apple with Age
Fig. 6.1.2.6
From the above multiple Bar Graph it is notice that being apple as a Smartphone it is
highly preferred by the young and the middle age customers.
0
50
100
150
200
250
300
18-28 29-39 40-50 51 &
above
Apple No
Apple Yes

H0 : Choice of Brand Motorola is independent of Age of User.
H1 : Choice of Brand Motorola is dependent of Age of User.
Table 6.1.2.7
Which brand of mobile
phone(s) are you
presently using
Age Total
Motorola 18-28 29-39 40-50 51 & above
No Count 324 204 194 47 769
% with in
Age 98.8% 98.1% 98.0% 95.9% 98.2%
Yes Count 4 4 4 2 14
% within
Age 1.2% 1.9% 2.0% 4.1% 1.8%
Total Count 328 208 198 49 783
% within
Age 100.0% 100.0% 100.0% 100.0% 100.0%
Source: Survey
Chi-Square Tests
Value Df
Asymp. Sig.
(2-sided)
Pearson Chi -Square 2.154(a) 3 .541
Likelihood Ratio 1.839 3 .607
Linear -by-Linear
Association 1.650 1 .199
N of Valid Cases 783
The above hypothesis is tested at 5% LOS
P value = 0.541
Since p= 0.541 > 0.05 therefore Null hypothesis is Accepted by the Researcher.

Thus Researcher concludes that Motorola is not significant with the Age of the mobile phones
users.
Therefore Choice of Brand MOTOROLA is independent of Age of User.

H0 : Choice of Brand Sony is independent of Age of User.
H1 : Choice of Brand Sony is dependent of Age of User.
Table 6.1.2.8
Which brand of mobile
phone(s) are you
presently using
Age Total
Sony 18-28 29-39 40-50 51 & above
No Count 318 197 191 47 753
% within
Age 97.0% 94.7% 96.5% 95.9% 96.2%
Yes Count 10 11 7 2 30
% within
Age 3.0% 5.3% 3.5% 4.1% 3.8%
Total Count 328 208 198 49 783
% within
Age 100.0% 100.0% 100.0% 100.0% 100.0%
Source: Survey
Chi-Square Tests
Value Df
Asymp. Sig.
(2-sided)
Pearson Chi -Square 1.799(a) 3 .615
Likelihood Ratio 1.717 3 .633
Linear -by-Linear
Association .186 1 .666
N of Valid Cases 783
The above hypothesis is tested at 5% LOS
P value = 0.615
Since p= 0.615 > 0.05 therefore Null hypothesis is Accepted by the Researcher.

Thus Researcher concludes that Sony is not significant with the Age of the mobile phones users.
Therefore Choice of Brand SONY is independent of Age of User.

H0 : Choice of Brand Micromax is independent of Age of User.
H1 : Choice of Brand Micromax is dependent of Age of User.
Table 6.1.2.9
Which brand of mobile
phone(s) are you
presently using
Age Total
Micromax
18-28 29-39 40-50 51 & above
No Count 324 200 196 47 767
% within
Age 98.8% 96.2% 99.0% 95.9% 98.0%
Yes Count 4 8 2 2 16
% within
Age 1.2% 3.8% 1.0% 4.1% 2.0%
Total Count 328 208 198 49 783
% within
Age 100.0% 100.0% 100.0% 100.0% 100.0%
Source: Survey
Chi-Square Tests
Value Df
Asymp. Sig.
(2-sided)
Pearson Chi -Square 6.563(a) 3 .087
Likelihood Ratio 6.073 3 .108
Linear -by-Linear
Association .488 1 .485
N of Valid Cases 783
The above hypothesis is tested at 5% LOS
P value = 0.087
Since p= 0.087 > 0.05 therefore Null hypothesis is Accepted by the Researcher.

Thus Researcher concludes that Micromax is not significant with the Age of the mobile phones
users.
Therefore Choice of Brand MICROMAX is independent of Age of User.

H0 : Choice of Brand Tata is independent of Age of User.
H1 : Choice of Brand Tata is dependent of Age of User.
Table 6.1.2.10
Which brand of mobile
phone(s) are you
presently using
Age Total
Tata 18-28 29-39 40-50 51 & above
No Count 326 205 197 48 776
% within
Age 99.4% 98.6% 99.5% 98.0% 99.1%
Yes Count 2 3 1 1 7
% within
Age .6% 1.4% .5% 2.0% .9%
Total Count 328 208 198 49 783
% within
Age 100.0% 100.0% 100.0% 100.0% 100.0%
Source: Survey
Chi-Square Tests
Value Df
Asymp. Sig.
(2-sided)
Pearson Chi -Square 2.070(a) 3 .558
Likelihood Ratio 1.866 3 .601
Linear -by-Linear
Association .259 1 .611
N of Valid Cases 783
The above hypothesis is tested at 5% LOS
P value = 0.558
Since p= 0.558 > 0.05 therefore Null hypothesis is Accepted by the Researcher.

Thus Researcher concludes that Tata is not significant with the Age of the mobile phones users.
Therefore Choice of Brand TATA is independent of Age of User.

H0 : Choice of Brand HTC is independent of Age of User.
H1 : Choice of Brand HTC is dependent of Age of User.
Table 6.1.2.11
Which brand of mobile
phone(s) are you
presently using
Age Total
HTC
18-28 29-39 40-50
51 &
above
No Count 323 206 193 47 769
% with in
Age 98.5% 99.0% 97.5% 95.9% 98.2%
Yes Count 5 2 5 2 14
% within
Age 1.5% 1.0% 2.5% 4.1% 1.8%
Total Count 328 208 198 49 783
% within
Age 100.0% 100.0% 100.0% 100.0% 100.0%
Source: Survey
Chi-Square Tests
Value Df
Asymp. Sig.
(2-sided)
Pearson Chi -Square 3.020(a) 3 .389
Likelihood Ratio 2.732 3 .435
Linear -by-Linear
Association 1.650 1 .199
N of Valid Cases 783
The above hypothesis is tested at 5% LOS

P value = 0.389
Since p= 0.389 > 0.05 therefore Null hypothesis is Accepted by the Researcher.
Thus Researcher concludes that HTC is not significant with the Age of the mobile phones users.
Therefore Choice of Brand HTC is independent of Age of User.

H0 : Choice of Brand Philips is independent of Age of User.
H1 : Choice of Brand Philips is dependent of Age of User.
Table 6.1.2.12
Which brand of mobile
phone(s) are you
presently using
Age Total
Philips 18-28 29-39 40-50 51 & above
No Count 328 208 198 49 783
% wi thin
Age 100.0% 100.0% 100.0% 100.0% 100.0%
Total Count 328 208 198 49 783
% within
Age 100.0% 100.0% 100.0% 100.0% 100.0%
Source: Survey
Chi-Square Tests
Value
Pearson Chi -Square .(a)
N of Valid Cases 783
No statistics are computed because Philips is a constant.
From Table 6.1.2.12 Researcher has concluded that none of the respondent likes the brand
Philips.

H0 : Choice of Brand Spice is independent of Age of User.
H1 : Choice of Brand Spice is dependent of Age of User.
Table 6.1.2.13
Which brand of mobile
phone(s) are you
presently using
Age Total
Spice 18-28 29-39 40-50
51 &
above
No Count 327 207 198 48 780
% with in
Age 99.7% 99.5% 100.0% 98.0% 99.6%
Yes Count 1 1 0 1 3
% within
Age .3% .5% .0% 2.0% .4%
Total Count 328 208 198 49 783
% within
Age 100.0% 100.0% 100.0% 100.0% 100.0%
Source: Survey
Chi-Square Tests
Value Df
Asymp. Sig.
(2-sided)
Pearson Chi -Square 4.394(a) 3 .222
Likelihood Ratio 3.359 3 .339
Linear -by-Linear
Association .458 1 .499
N of Valid Cases 783
The above hypothesis is tested at 5% LOS
P value = 0.222
Since p= 0.222 > 0.05 therefore Null hypothesis is Accepted by the Researcher.

Thus Researcher concludes that Spice is not significant with the Age of the mobile phones users.
Therefore Choice of Brand SPICE is independent of Age of User.

H0 : Choice of Brand Videocon is independent of Age of User.
H1 : Choice of Brand Videocon is dependent of Age of User.
Table 6.1.2.14
Which brand of mobile
phone(s) are you presently
using
Age Total
Videocon
18-28 29-39 40-50 51 & above
No Count 328 208 198 49 783
% within
Age 100.0% 100.0% 100.0% 100.0% 100.0%
Total Count 328 208 198 49 783
% within
Age 100.0% 100.0% 100.0% 100.0% 100.0%
Source: Survey
Chi-Square Tests
Value
Pearson Chi -Square .(a)
N of Valid Cases 783
No statistics are computed because Videocon is a constant.
From Table 6.1.2.14 Researcher has concluded that none of the respondent likes the brand
VIDEOCON.

1.1.3 Demographic factor: OCCUPATION
H0 : Choice of Brand Nokia is independent of Occupation of User.
H1 : Choice of Brand Nokia is dependent of Occupation of User.
Table 6.1.3.1
Which brand of mobile phone(s)
are you presently using
Occupation Total
Nokia Service Business Professional Student Housewife
No Count 103 89 93 124 108 517
% within
Occupatio
n
60.6% 57.1% 65.0% 75.6% 67.1% 65.1%
Yes Count 67 67 50 40 53 277
% within
Occupatio
n
39.4% 42.9% 35.0% 24.4% 32.9% 34.9%
Total Count 170 156 143 164 161 794
% within
Occupatio
n
100.0% 100.0% 100.0% 100.0% 100.0% 100.0
%
Source: Survey
Chi-Square Tests
Value Df
Asymp. Sig.
(2-sided)
Pearson Chi -Square 14.225(a) 4 .007
Likelihood Ratio 14.544 4 .006
Linear -by-Linear
Association 7.097 1 .008
N of Valid Cases 794
The above hypothesis is tested at 5% LOS

P value = 0.007
Since p= 0.007 < 0.05 therefore Null hypothesis is Rejected by the Researcher.
Thus Researcher concludes that
users.
Therefore Choice of Brand NOKIA is dependent of OCCUPATION of User.
Preference of Brand Nokia with Occupation
From the above diagram, the researcher claims that there are 39.4% service class, 42.9%
business class, 35% professionals 24.4% students and 32.9% housewives shows that Nokia
is one of the prominent brands.
0%
10%
20%
30%
40%
50%
60%
70%
80%
90%
100%
0.05 therefore Null hypothesis is Rejected by the Researcher.
Thus Researcher concludes that Nokia is significant with the Occupation of the mobile phones
Choice of Brand NOKIA is dependent of OCCUPATION of User.
Preference of Brand Nokia with Occupation
Fig. 6.1.3.1
From the above diagram, the researcher claims that there are 39.4% service class, 42.9%
business class, 35% professionals 24.4% students and 32.9% housewives shows that Nokia
brands.
Nokia Yes
Nokia No
is significant with the Occupation of the mobile phones
Choice of Brand NOKIA is dependent of OCCUPATION of User.
From the above diagram, the researcher claims that there are 39.4% service class, 42.9%
business class, 35% professionals 24.4% students and 32.9% housewives shows that Nokia

H0 : Choice of Brand LG is independent of Occupation of User.
H1 : Choice of Brand LG is dependent of Occupation of User.
Table 6.1.3.2
Which brand of mobile
phone(s) are you
presently using
Occupation Total
LG Service Business Professional Student Housewife
No Count 155 151 142 161 154 763
% within
Occupatio
n
91.2% 96.8% 99.3% 98.2% 95.7% 96.1%
Yes Count 15 5 1 3 7 31
% within
Occupatio
n
8.8% 3.2% .7% 1.8% 4.3% 3.9%
Total Count 170 156 143 164 161 794
% within
Occupatio
n
100.0% 100.0% 100.0% 100.0% 100.0% 100.0%
Source: Survey
Chi-Square Tests
Value Df
Asymp. Sig.
(2-sided)
Pearson Chi -Square 17.050(a) 4 .002
Likelihood Ratio 16.676 4 .002
Linear -by-Linear
Association 5.022 1 .025
N of Valid Cases 794
The above hypothesis is tested at 5% LOS
P value = 0.002
Since p= 0.002 < 0.05 therefore Null hypothesis is Rejected by the Researcher.

Thus Researcher concludes that
users.
Therefore Choice of Brand LG is dependent of OCCUPATION of User.
Preference of Brand LG with Occupation
From the above multiple bar Graph the researcher claims that, there are 8.8% service
class, 3.2% business class, 0.7% professionals 1.8% students and 4.3% housewives shows
that LG is one of the prominent brands.
0
20
40
60
80
100
120
140
160
180
Thus Researcher concludes that LG is significant with the Occupation of the mobile phones
Choice of Brand LG is dependent of OCCUPATION of User.
Preference of Brand LG with Occupation
Fig. 6.1.3.2
From the above multiple bar Graph the researcher claims that, there are 8.8% service
class, 3.2% business class, 0.7% professionals 1.8% students and 4.3% housewives shows
LG is one of the prominent brands.
LG No
LG Yes
is significant with the Occupation of the mobile phones
From the above multiple bar Graph the researcher claims that, there are 8.8% service
class, 3.2% business class, 0.7% professionals 1.8% students and 4.3% housewives shows

H0 : Choice of Brand Samsung is independent of Occupation of User.
H1 : Choice of Brand Samsung is dependent of Occupation of User.
Table 6.1.3.3
Which brand of mobile
phone(s) are you
presently using
Occupation Total
Samsung
Service Business Professional Student Housewife
No Count 138 133 119 141 133 664
% within
Occupatio
n
81.2% 85.3% 83.2% 86.0% 82.6% 83.6%
Yes Count 32 23 24 23 28 130
% within
Occupatio
n
18.8% 14.7% 16.8% 14.0% 17.4% 16.4%
Total Count 170 156 143 164 161 794
% within
Occupatio
n
100.0% 100.0% 100.0% 100.0% 100.0% 100.0%
Source: Survey
Chi-Square Tests
Value Df
Asymp. Sig.
(2-sided)
Pearson Chi -Square 1.848(a) 4 .764
Likelihood Ratio 1.854 4 .763
Linear -by-Linear
Association .180 1 .672
N of Valid Cases 794

The above hypothesis is tested at 5% LOS
P value = 0.764
Since p= 0.764 > 0.05 therefore Null hypothesis is Accepted by the Researcher.
Thus Researcher concludes that Samsung is not significant with the Occupation of the mobile
phones users.
Therefore Choice of Brand SAMSUNG is independent of OCCUPATION of User.

H0 : Choice of Brand Reliance is independent of Occupation of User.
H1 : Choice of Brand Reliance is dependent of Occupation of User.
Table 6.1.3.4
Which brand of mobile
phone(s) are you
presently using
Occupation Total
Reliance
Service Business Professional Student Housewife
No Count 161 153 139 161 153 767
% within
Occupatio
n
94.7% 98.1% 97.2% 98.2% 95.0% 96.6%
Yes Count 9 3 4 3 8 27
% within
Occupatio
n
5.3% 1.9% 2.8% 1.8% 5.0% 3.4%
Total Count 170 156 143 164 161 794
% within
Occupatio
n
100.0% 100.0% 100.0% 100.0% 100.0% 100.0
%
Source: Survey
Chi-Square Tests
Value Df
Asymp. Sig.
(2-sided)
Pearson Chi -Square 5.489(a) 4 .241
Likelihood Ratio 5.521 4 .238
Linear -by-Linear
Association .051 1 .821
N of Valid Cases 794
The above hypothesis is tested at 5% LOS

P value = 0.241
Since p= 0.241 > 0.05 therefore Null hypothesis is Accepted by the Researcher.
Thus Researcher concludes that Reliance is not significant with the Occupation of the mobile
phones users.
Therefore Choice of Brand RELIANCE is independent of OCCUPATION of User.

H0 : Choice of Brand Blackberry is independent of Occupation of User.
H1 : Choice of Brand Blackberry is dependent of Occupation of User.
Table 6.1.3.5
Which brand of mobile
phone(s) are you
presently using
Occupation Total
Blackberry Service Business Professional Student Housewife
No Count 133 93 80 75 117 498
% within
Occupatio
n
78.2% 59.6% 55.9% 45.7% 72.7% 62.7%
Yes Count 37 63 63 89 44 296
% within
Occupatio
n
21.8% 40.4% 44.1% 54.3% 27.3% 37.3%
Total Count 170 156 143 164 161 794
% within
Occupatio
n
100.0% 100.0% 100.0% 100.0% 100.0% 100.0%
Source: Survey
Chi-Square Tests
Value do
Asymp. Sig.
(2-sided)
Pearson Chi -Square 48.014(a) 4 .000
Likelihood Ratio 48.946 4 .000
Linear -by-Linear
Association 4.968 1 .026
N of Valid Cases 794
The above hypothesis is tested at 5% LOS

P value = 0.000
Since p= 0.000 < 0.05 therefore Null hypothesis is Rejected by the Researcher.
Thus Researcher concludes that
phones users.
Therefore Choice of Brand BLACKBERRY is dependent of OCCUPATION of User.
Preference of Brand
From the above simple Graph the researcher has made an attempt to find the preference of
brand blackberry (in %) occupation wise. There are 21.8% service class, 40.4% business
class, 44.1% professionals 54.3% students and 27.3% housewives shows that
BLACKBERRY is one of the prominent brand.
0
20
40
60
80
100
120
140
160
180
0.05 therefore Null hypothesis is Rejected by the Researcher.
Thus Researcher concludes that Blackberry is significant with the Occupation of the mobile
Choice of Brand BLACKBERRY is dependent of OCCUPATION of User.
Preference of Brand Blackberry with Occupation
Fig. 6.1.3.5
From the above simple Graph the researcher has made an attempt to find the preference of
brand blackberry (in %) occupation wise. There are 21.8% service class, 40.4% business
lass, 44.1% professionals 54.3% students and 27.3% housewives shows that
BLACKBERRY is one of the prominent brand.
Blackberry Yes
Blackberry No
is significant with the Occupation of the mobile
Choice of Brand BLACKBERRY is dependent of OCCUPATION of User.
with Occupation
From the above simple Graph the researcher has made an attempt to find the preference of
brand blackberry (in %) occupation wise. There are 21.8% service class, 40.4% business
lass, 44.1% professionals 54.3% students and 27.3% housewives shows that
Blackberry Yes
Blackberry No

H0 : Choice of Brand Apple is independent of Occupation of User.
H1 : Choice of Brand Apple is dependent of Occupation of User.
Table 6.1.3.6
Which brand of mobile
phone(s) are you
presently using
Occupation Total
Apple
Service Business Professional Student Housewife
No Count 158 126 127 144 149 704
% within
Occupatio
n
92.9% 80.8% 88.8% 87.8% 92.5% 88.7%
Yes Count 12 30 16 20 12 90
% within
Occupatio
n
7.1% 19.2% 11.2% 12.2% 7.5% 11.3%
Total Count 170 156 143 164 161 794
% within
Occupatio
n
100.0% 100.0% 100.0% 100.0% 100.0% 100.0%
Source: Survey
Chi-Square Tests
Value do
Asymp. Sig.
(2-sided)
Pearson Chi -Square 15.307(a) 4 .004
Likelihood Ratio 14.559 4 .006
Linear -by-Linear
Association .475 1 .491
N of Valid Cases 794
The above hypothesis is tested at 5% LOS
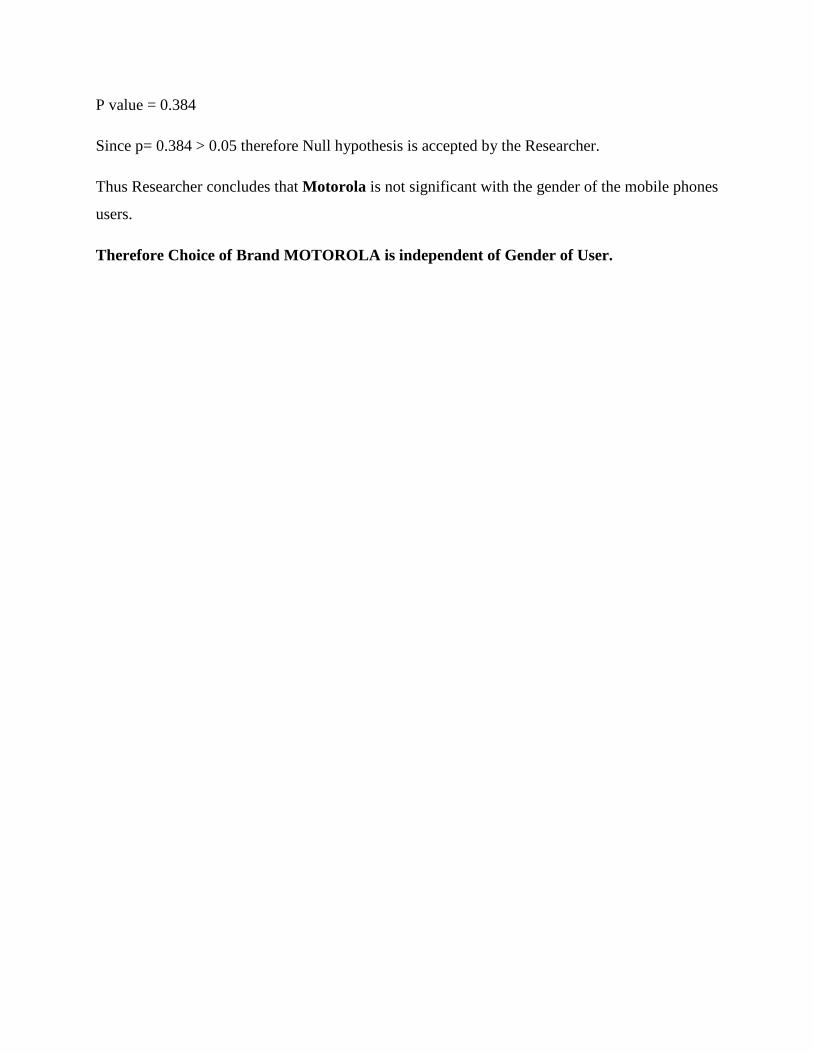
P value = 0.004
Since p= 0.004 < 0.05 therefore Null hypothesis is Rejected by the Researcher.
Thus Researcher concludes that
users.
Therefore Choice of Brand APPLE is dependent of OCCUPATION of User.
Preference of Brand
From the above diagram, the researcher claims that there are 7.1% service class, 19.2%
business class, 11.2% professionals 12.2% students and 7.5% housewives shows that
APPLE is one of the prominent brand.
0%
10%
20%
30%
40%
50%
60%
70%
80%
90%
100%
0.05 therefore Null hypothesis is Rejected by the Researcher.
Thus Researcher concludes that Apple is significant with the Occupation of the mobile phones
Choice of Brand APPLE is dependent of OCCUPATION of User.
Preference of Brand Apple with Occupation
Fig.6.1.3.6
From the above diagram, the researcher claims that there are 7.1% service class, 19.2%
business class, 11.2% professionals 12.2% students and 7.5% housewives shows that
ominent brand.
Apple No
Apple Yes
is significant with the Occupation of the mobile phones
Choice of Brand APPLE is dependent of OCCUPATION of User.
From the above diagram, the researcher claims that there are 7.1% service class, 19.2%
business class, 11.2% professionals 12.2% students and 7.5% housewives shows that

H0 : Choice of Brand Motorola is independent of Occupation of User.
H1 : Choice of Brand Motorola is dependent of Occupation of User.
Table 6.1.3.7
Which brand of mobile
phone(s) are you
presently using
Occupation Total
Motorola Service Business Professional Student Housewife
No Count 164 156 139 162 159 780
% within
Occupatio
n
96.5% 100.0% 97.2% 98.8% 98.8% 98.2
%
Yes Count 6 0 4 2 2 14
% within
Occupatio
n
3.5% .0% 2.8% 1.2% 1.2% 1.8%
Total Count 170 156 143 164 161 794
% within
Occupatio
n
100.0% 100.0% 100.0% 100.0% 100.0% 100.
0%
Source: Survey
Chi-Square Tests
Value do
Asymp. Sig.
(2-sided)
Pearson Chi -Square 7.276(a) 4 .122
Likelihood Ratio 9.272 4 .055
Linear -by-Linear
Association 1.190 1 .275
N of Valid Cases 794
The above hypothesis is tested at 5% LOS
P value = 0.122

Since p= 0.122 > 0.05 therefore Null hypothesis is Accepted by the Researcher.
Thus Researcher concludes that Motorola is not significant with the Occupation of the mobile
phones users.
Therefore Choice of Brand MOTOROLA is independent of OCCUPATION of User.

H0 : Choice of Brand Sony is independent of Occupation of User.
H1 : Choice of Brand Sony is dependent of Occupation of User.
Table 6.1.3.8
Which brand of mobile
phone(s) are you
presently using
Occupation Total
Sony
Service Business Professional Student Housewife
No Count 163 148 139 159 155 764
% within
Occupatio
n
95.9% 94.9% 97.2% 97.0% 96.3% 96.2%
Yes Count 7 8 4 5 6 30
% within
Occupatio
n
4.1% 5.1% 2.8% 3.0% 3.7% 3.8%
Total Count 170 156 143 164 161 794
% within
Occupatio
n
100.0% 100.0% 100.0% 100.0% 100.0% 100.0
%
Source: Survey
Chi-Square Tests
Value do
Asymp. Sig.
(2-sided)
Pearson Chi -Square 1.456(a) 4 .834
Likelihood Ratio 1.431 4 .839
Linear -by-Linear
Association .357 1 .550
N of Valid Cases 794
The above hypothesis is tested at 5% LOS

P value = 0.834
Since p= 0.834 > 0.05 therefore Null hypothesis is Accepted by the Researcher.
Thus Researcher concludes that Sony is not significant with the Occupation of the mobile phones
users.
Therefore Choice of Brand SONY is independent of OCCUPATION of User.

H0 : Choice of Brand Micromax is independent of Occupation of User.
H1 : Choice of Brand Micromax is dependent of Occupation of User.
Table 6.1.3.9
Which brand of mobile
phone(s) are you
presently using
Occupation Total
Micromax Service Business Professional Student Housewife
No Count 166 155 141 162 154 778
% within
Occupatio
n
97.6% 99.4% 98.6% 98.8% 95.7% 98.0%
Yes Count 4 1 2 2 7 16
% within
Occupatio
n
2.4% .6% 1.4% 1.2% 4.3% 2.0%
Total Count 170 156 143 164 161 794
% within
Occupatio
n
100.0% 100.0% 100.0% 100.0% 100.0% 100.0
%
Source: Survey
Chi-Square Tests
Value Df
Asymp. Sig.
(2-sided)
Pearson Chi -Square 6.828(a) 4 .145
Likelihood Ratio 6.384 4 .172
Linear -by-Linear
Association 1.596 1 .207
N of Valid Cases 794
The above hypothesis is tested at 5% LOS

P value = 0.145
Since p= 0.145 > 0.05 therefore Null hypothesis is Accepted by the Researcher.
Thus Researcher concludes that Micromax is not significant with the Occupation of the mobile
phones users.
Therefore Choice of Brand MICROMAX is independent of OCCUPATION of User.

H0 : Choice of Brand Tata is independent of Occupation of User.
H1 : Choice of Brand Tata is dependent of Occupation of User.
Table 6.1.3.10
Which brand of mobile
phone(s) are you
presently using
Occupation Total
Tata Service Business Professional Student Housewife
No Count 167 155 142 164 159 787
% within
Occupatio
n
98.2% 99.4% 99.3% 100.0% 98.8% 99.1%
Yes Count 3 1 1 0 2 7
% within
Occupatio
n
1.8% .6% .7% .0% 1.2% .9%
Total Count 170 156 143 164 161 794
% within
Occupatio
n
100.0% 100.0% 100.0% 100.0% 100.0% 100.0
%
Source: Survey
Chi-Square Tests
Value Df
Asymp. Sig.
(2-sided)
Pearson Chi -Square 3.373(a) 4 .497
Likelihood Ratio 4.465 4 .347
Linear -by-Linear
Association .590 1 .443
N of Valid Cases 794
The above hypothesis is tested at 5% LOS
P value = 0.497

Since p= 0.497 > 0.05 therefore Null hypothesis is Accepted by the Researcher.
Thus Researcher concludes that Tata is not significant with the Occupation of the mobile phones
users.
Therefore Choice of Brand TATA is independent of OCCUPATION of User.

H0 : Choice of Brand HTC is independent of Occupation of User.
H1 : Choice of Brand HTC is dependent of Occupation of User.
Table 6.1.3.11
Which brand of mobile
phone(s) are you
presently using
Occupation Total
HTC Service Business Professional Student Housewife
No Count 168 151 140 162 159 780
% within
Occupatio
n
98.8% 96.8% 97.9% 98.8% 98.8% 98.2%
Yes Count 2 5 3 2 2 14
% within
Occupatio
n
1.2% 3.2% 2.1% 1.2% 1.2% 1.8%
Total Count 170 156 143 164 161 794
% within
Occupatio
n
100.0% 100.0% 100.0% 100.0% 100.0% 100.0
%
Source: Survey
Chi-Square Tests
Value do
Asymp. Sig.
(2-sided)
Pearson Chi -Square 2.835(a) 4 .586
Likelihood Ratio 2.575 4 .631
Linear -by-Linear
Association .280 1 .597
N of Valid Cases 794
The above hypothesis is tested at 5% LOS

P value = 0.586
Since p= 0.586 > 0.05 therefore Null hypothesis is Accepted by the Researcher.
Thus Researcher concludes that HTC is not significant with the Occupation of the mobile
phones users.
Therefore Choice of Brand HTC is independent of OCCUPATION of User.

H0 : Choice of Brand Philips is independent of Occupation of User.
H1 : Choice of Brand Philips is dependent of Occupation of User.
Table 6.1.3.12
Which brand of mobile
phone(s) are you presently
using
Occupation Total
Philips
Service Business Professional Student Housewife
No Count 170 156 143 164 161 794
% within
Occupatio
n
100.0% 100.0% 100.0% 100.0% 100.0% 100.0%
Total Count 170 156 143 164 161 794
% within
Occupatio
n
100.0% 100.0% 100.0% 100.0% 100.0% 100.0%
Source: Survey
Chi-Square Tests
Value
Pearson Chi -Square .(a)
N of Valid Cases 794
No statistics are computed because Philips is a constant.
From Table 6.1.3.12 Researcher has concluded that none of the respondent likes the brand
Philips.

H0 : Choice of Brand Spice is independent of Occupation of User.
H1 : Choice of Brand Spice is dependent of Occupation of User.
Table 6.1.3.13
Which brand of mobile
phone(s) are you
presently using
Occupation Total
Spice
Service Business Professional Student Housewife
No Count 169 156 142 164 160 791
% within
Occupatio
n
99.4% 100.0% 99.3% 100.0% 99.4% 99.6%
Yes Count 1 0 1 0 1 3
% within
Occupatio
n
.6% .0% .7% .0% .6% .4%
Total Count 170 156 143 164 161 794
% within
Occupatio
n
100.0% 100.0% 100.0% 100.0% 100.0% 100.0
%
Source: Survey
Chi-Square Tests
Value Df
Asymp. Sig.
(2-sided)
Pearson Chi -Square 2.059(a) 4 .725
Likelihood Ratio 3.119 4 .538
Linear -by-Linear
Association .000 1 .988
N of Valid Cases 794
The above hypothesis is tested at 5% LOS

P value = 0.725
Since p= 0.725 > 0.05 therefore Null hypothesis is Accepted by the Researcher.
Thus Researcher concludes that Spice is not significant with the Occupation of the mobile
phones users.
Therefore Choice of Brand SPICE is independent of OCCUPATION of User.
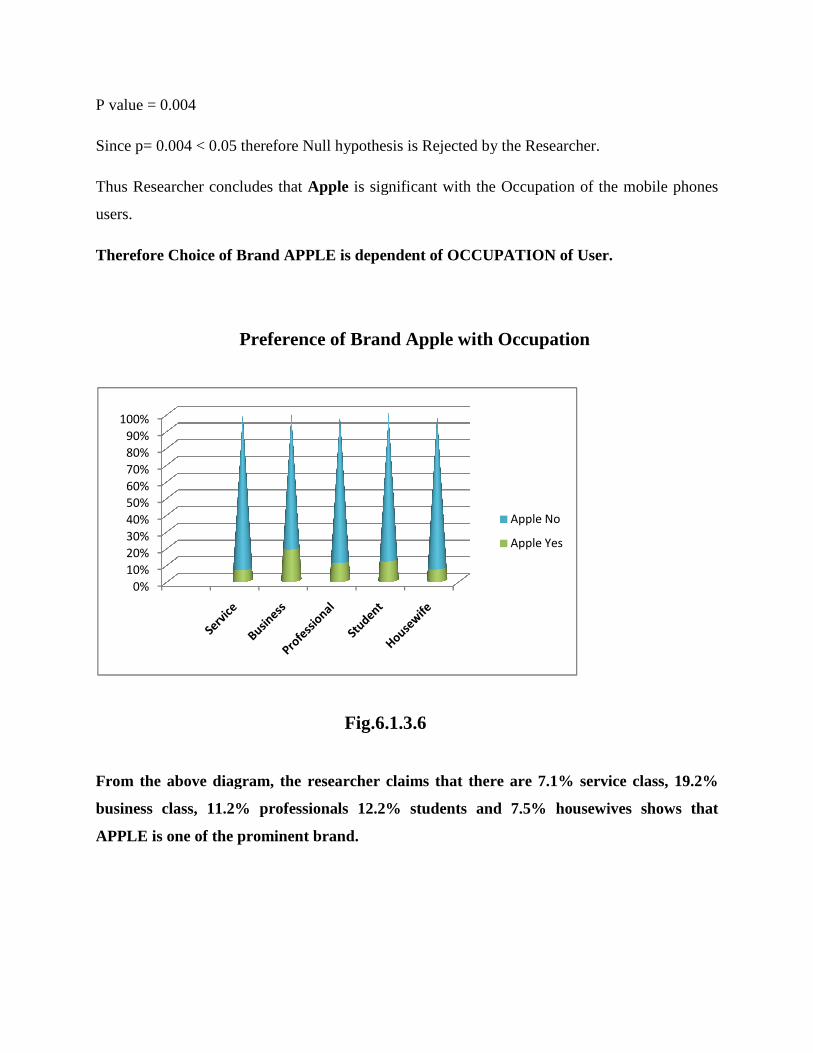
H0 : Choice of Brand Videocon independent of Occupation of User.
H1 : Choice of Brand Videocon is dependent of Occupation of User.
Table 6.1.3.14
Which brand of mobile
phone(s) are you
presently using
Occupation Total
Videocon
Service Business Professional Student Housewife
No Count 170 156 143 164 161 794
% within
Occupatio
n
100.0% 100.0% 100.0% 100.0% 100.0% 100.0%
Total Count 170 156 143 164 161 794
% within
Occupatio
n
100.0% 100.0% 100.0% 100.0% 100.0% 100.0%
Source: Survey
Chi-Square Tests
Value
Pearson Chi -Square .(a)
N of Valid Cases 794
No statistics are computed because Videocon is a constant.
From Table 6.1.3.14 Researcher has concluded that none of the respondent likes the brand
Videocon.

1.1.4 Demographic factor: INCOME
H0 : Choice of Brand Nokia independent of Income of User.
H1 : Choice of Brand Nokia is dependent of Income of User.
Table 6.1.4.1
Which brand of
mobile phone(s)
are you presently
using
Income Total
Nokia Dependent
Up to
20,000
20,001-
40,000
40,001-
60,000
Above
60,000
No Count 198 68 83 59 89 497
%
within
Income
70.0% 55.7% 65.4% 62.1% 63.1% 64.7%
Yes Count 85 54 44 36 52 271
%
within
Income
30.0% 44.3% 34.6% 37.9% 36.9% 35.3%
Total Count 283 122 127 95 141 768
%
within
Income
100.0% 100.0% 100.0% 100.0% 100.0% 100.0%
Source: Survey
Chi-Square Tests
Value Df
Asymp. Sig.
(2-sided)
Pearson Chi -Square 8.184(a) 4 .085
Likelihood Ratio 8.133 4 .087
Linear -by-Linear
Association 1.622 1 .203
N of Valid Cases 768

The above hypothesis is tested at 5% LOS
P value = 0.085
Since p= 0.085 > 0.05 therefore Null hypothesis is Accepted by the Researcher.
Thus Researcher concludes that Nokia is not significant with the Income of the mobile phones
users.
Therefore Choice of Brand NOKIA is independent of INCOME of User.

H0 : Choice of Brand LG independent of Income of User.
H1 : Choice of Brand LG is dependent of Income of User.
Table 6.1.4.2
Which brand of mobile
phone(s) are you
presently using
Income Total
LG Dependent
Up to
20,000
20,001-
40,000
40,001-
60,000
Above
60,000
No Count 275 116 117 94 137 739
% within
Income 97.2% 95.1% 92.1% 98.9% 97.2% 96.2%
Yes Count 8 6 10 1 4 29
% within
Income 2.8% 4.9% 7.9% 1.1% 2.8% 3.8%
Total Count 283 122 127 95 141 768
% within
Income 100.0% 100.0% 100.0% 100.0% 100.0% 100.0%
Source: Survey
Chi-Square Tests
Value Df
Asymp. Sig.
(2-sided)
Pearson Chi -Square 9.291(a) 4 .054
Likelihood Ratio 8.747 4 .068
Linear -by-Linear
Association .024 1 .876
N of Valid Cases 768
The above hypothesis is tested at 5% LOS
P value = 0.054

Since p= 0.054 > 0.05 therefore Null hypothesis is Accepted by the Researcher.
Thus Researcher concludes that LG is not significant with the Income of the mobile phones
users.
Therefore Choice of Brand LG is independent of INCOME of User.

H0 : Choice of Brand Samsung independent of Income of User.
H1 : Choice of Brand Samsung is dependent of Income of User.
Table 6.1.4.3
Source: Survey
Chi-Square Tests
Value Df
Asymp. Sig.
(2-sided)
Pearson Chi -Square 8.562(a) 4 .073
Likelihood Ratio 8.458 4 .076
Linear -by-Linear
Association .023 1 .879
N of Valid Cases 768
The above hypothesis is tested at 5% LOS
Which brand of mobile
phone(s) are you
presently using
Income Total
Samsung Dependent
Up to
20,000
20,001-
40,000
40,001-
60,000
Above
60,000
No Count 240 102 103 72 126 643
% within
Income 84.8% 83.6% 81.1% 75.8% 89.4% 83.7%
Yes Count 43 20 24 23 15 125
% wi thin
Income 15.2% 16.4% 18.9% 24.2% 10.6% 16.3%
Total Count 283 122 127 95 141 768
% within
Income 100.0% 100.0% 100.0% 100.0% 100.0% 100.0%

P value = 0.073
Since p= 0.073 > 0.05 therefore Null hypothesis is Accepted by the Researcher.
Thus Researcher concludes that Samsung is not significant with the Income of the mobile
phones users.
Therefore Choice of Brand SAMSUNG is independent of INCOME of User.

H0 : Choice of Brand Reliance independent of Income of User.
H1 : Choice of Brand Reliance is dependent of Income of User.
Table 6.1.4.4
Which brand of mobile
phone(s) are you
presently using
Income Total
Reliance
Dependent
Up to
20,000
20,001-
40,000
40,001-
60,000
Above
60,000
No Count 271 115 126 93 136 741
%
within
Income
95.8% 94.3% 99.2% 97.9% 96.5% 96.5%
Yes Count 12 7 1 2 5 27
%
within
Income
4.2% 5.7% .8% 2.1% 3.5% 3.5%
Total Count 283 122 127 95 141 768
%
within
Income
100.0% 100.0% 100.0% 100.0% 100.0% 100.0
%
Source: Survey
Chi-Square Tests
Value Df
Asymp. Sig.
(2-sided)
Pearson Chi -Square 5.558(a) 4 .235
Likelihood Ratio 6.593 4 .159
Linear -by-Linear
Association 1.072 1 .300
N of Valid Cases 768

The above hypothesis is tested at 5% LOS
P value = 0.235
Since p= 0.235 > 0.05 therefore Null hypothesis is Accepted by the Researcher.
Thus Researcher concludes that Reliance is not significant with the Income of the mobile phones
users.
Therefore Choice of Brand RELIANCE is independent of INCOME of User.

H0 : Choice of Brand Blackberry independent of Income of User.
H1 : Choice of Brand Blackberry is dependent of Income of User.
Table 6.1.4.5
Which brand of mobile
phone(s) are you
presently using
Income Total
Blackberry Dependent
Up to
20,000
20,001-
40,000
40,001-
60,000
Above
60,000
No Count 169 102 87 55 69 482
% within
Income 59.7% 83.6% 68.5% 57.9% 48.9% 62.8%
Yes Count 114 20 40 40 72 286
% within
Income 40.3% 16.4% 31.5% 42.1% 51.1% 37.2%
Total Count 283 122 127 95 141 768
% within
Income 100.0% 100.0% 100.0% 100.0% 100.0% 100.0%
Source: Survey
Chi-Square Tests
Value Df
Asymp. Sig.
(2-sided)
Pearson Chi -Square 38.090(a) 4 .000
Likelihood Ratio 40.706 4 .000
Linear -by-Linear
Association 6.420 1 .011
N of Valid Cases 768
The above hypothesis is tested at 5% LOS
P value = 0.000

Since p= 0.00 < 0.05 therefore Null hypothesis is Rejected by the Researcher.
Thus Researcher concludes that Blackberry is significant with the Income of the mobile phones
users.
Therefore Choice of Brand BLACKBERRY is dependent of INCOME of User.
Preference of Brand Blackberry with Income
Fig. 6.1.4.5
From the above multiple Bar Graph, the researcher has noticed that the blackberry is
highly preferred by the dependent group and than by the income group of above 60,000.
Also the respondent whose income is between 20000 to 60000 also gives preference to this
brand.
0
20
40
60
80
100
120
140
160
180
Blackberry Yes
Blackberry No

H0 : Choice of Brand Apple independent of Income of User.
H1 : Choice of Brand Apple is dependent of Income of User.
Table 6.1.4.6
Which brand of
mobile phone(s) are
you presently using
Income Total
Apple Dependent
Up to
20,000
20,001-
40,000
40,001-
60,000
Above
60,000
No Count 252 120 115 78 113 678
%
within
Income
89.0% 98.4% 90.6% 82.1% 80.1% 88.3%
Yes Count 31 2 12 17 28 90
%
within
Income
11.0% 1.6% 9.4% 17.9% 19.9% 11.7%
Total Count 283 122 127 95 141 768
%
within
Income
100.0% 100.0% 100.0% 100.0% 100.0% 100.0%
Source: Survey
Chi-Square Tests
Value Df
Asymp. Sig.
(2-sided)
Pearson Chi -Square 25.305(a) 4 .000
Likelihood Ratio 29.668 4 .000
Linear -by-Linear
Association 11.156 1 .001
N of Valid Cases 768
The above hypothesis is tested at 5% LOS

P value = 0.000
Since p= 0.00 < 0.05 therefore Null hypothesis is Rejected by the Researcher.
Thus Researcher concludes that Apple
Therefore Choice of Brand APPLE is dependent of INCOME of User.
Preference of Brand
From the above diagram researcher came to a conclusion that there are 11.0% dependent,
1.6% up to 20000, 9.4% 20001 to 40000, 17.9% 40001 to 60000 and 19.9% above 60000
respondents who prefer the brand Apple.
0
50
100
150
200
250
300
0.05 therefore Null hypothesis is Rejected by the Researcher.
Apple is significant with the Income of the mobile phones users.
Choice of Brand APPLE is dependent of INCOME of User.
Preference of Brand Apple with Income
Fig. 6.1.4.6
From the above diagram researcher came to a conclusion that there are 11.0% dependent,
1.6% up to 20000, 9.4% 20001 to 40000, 17.9% 40001 to 60000 and 19.9% above 60000
respondents who prefer the brand Apple.
Apple No
Apple Yes
is significant with the Income of the mobile phones users.
From the above diagram researcher came to a conclusion that there are 11.0% dependent,
1.6% up to 20000, 9.4% 20001 to 40000, 17.9% 40001 to 60000 and 19.9% above 60000

H0 : Choice of Brand Motorola independent of Income of User.
H1 : Choice of Brand Motorola is dependent of Income of User.
Table 6.1.4.7
Which brand of
mobile phone(s) are
you presently using
Income Total
Motorola Dependent
Up to
20,000
20,001-
40,000
40,001-
60,000
Above
60,000
No Count 280 118 124 92 141 755
%
within
Income
98.9% 96.7% 97.6% 96.8% 100.0% 98.3%
Yes Count 3 4 3 3 0 13
%
within
Income
1.1% 3.3% 2.4% 3.2% .0% 1.7%
Total Count 283 122 127 95 141 768
%
within
Income
100.0% 100.0% 100.0% 100.0% 100.0% 100.0%
Source: Survey
Chi-Square Tests
Value Df
Asymp. Sig.
(2-sided)
Pearson Chi -Square 6.520(a) 4 .164
Likelihood Ratio 8.332 4 .080
Linear -by-Linear
Association .101 1 .750
N of Valid Cases 768
.
The above hypothesis is tested at 5% LOS

P value = 0.164
Since p= 0.164 > 0.05 therefore Null hypothesis is Accepted by the Researcher.
Thus Researcher concludes that Motorola is not significant with the Income of the mobile
phones users.
Therefore Choice of Brand MOTOROLA is independent of INCOME of User.

H0 : Choice of Brand Sony independent of Income of User.
H1 : Choice of Brand Sony is dependent of Income of User.
Table 6.1.4.8
Which brand of
mobile phone(s) are
you presently using
Income Total
Sony
Dependent
Up to
20,000
20,001-
40,000
40,001-
60,000
Above
60,000
No Count 274 117 120 89 138 738
%
within
Income
96.8% 95.9% 94.5% 93.7% 97.9% 96.1%
Yes Count 9 5 7 6 3 30
%
within
Income
3.2% 4.1% 5.5% 6.3% 2.1% 3.9%
Total Count 283 122 127 95 141 768
%
within
Income
100.0% 100.0% 100.0% 100.0% 100.0% 100.0%
Source: Survey
Chi-Square Tests
Value do
Asymp. Sig.
(2-sided)
Pearson Chi -Square 3.939(a) 4 .414
Likelihood Ratio 3.874 4 .423
Linear -by-Linear
Association .020 1 .889
N of Valid Cases 768

The above hypothesis is tested at 5% LOS
P value = 0.414
Since p= 0.414 > 0.05 therefore Null hypothesis is Accepted by the Researcher.
Thus Researcher concludes that Sony is not significant with the Income of the mobile phones
users.
Therefore Choice of Brand SONY is independent of INCOME of User.

H0 : Choice of Brand Micromax independent of Income of User.
H1 : Choice of Brand Micromax is dependent of Income of User.
Table 6.1.4.9
Which brand of mobile
phone(s) are you
presently using
Micromax
Income Total
Dependent
Up to
20,000
20,001-
40,000
40,001-
60,000
Above
60,000
No Count 276 117 125 95 141 754
%
within
Income
97.5% 95.9% 98.4% 100.0% 100.0% 98.2%
Yes Count 7 5 2 0 0 14
%
within
Income
2.5% 4.1% 1.6% .0% .0% 1.8%
Total Count 283 122 127 95 141 768
%
within
Income
100.0% 100.0% 100.0% 100.0% 100.0% 100.0%
Source: Survey
Chi-Square Tests
Value do
Asymp. Sig.
(2-sided)
Pearson Chi -Square 8.624(a) 4 .071
Likelihood Ratio 11.946 4 .018
Linear -by-Linear
Association 5.549 1 .018
N of Valid Cases 768
The above hypothesis is tested at 5% LOS

P value = 0.071
Since p= 0.071 > 0.05 therefore Null hypothesis is Accepted by the Researcher.
Thus Researcher concludes that Micromax is not significant with the Income of the mobile
phones users.
Therefore Choice of Brand MICROMAX is independent of INCOME of User.

H0 : Choice of Brand Tata independent of Income of User.
H1 : Choice of Brand Tata is dependent of Income of User.
Table 6.1.4.10
Which brand of
mobile phone(s) are
you presently using
TATA
Income Total
Dependent
Up to
20,000
20,001-
40,000
40,001-
60,000
Above
60,000
No Count 281 120 125 94 141 761
%
within
Income
99.3% 98.4% 98.4% 98.9% 100.0% 99.1%
Yes Count 2 2 2 1 0 7
%
within
Income
.7% 1.6% 1.6% 1.1% .0% .9%
Total Count 283 122 127 95 141 768
%
within
Income
100.0% 100.0% 100.0% 100.0% 100.0% 100.0%
Source: Survey
Chi-Square Tests
Value Df
Asymp. Sig.
(2-sided)
Pearson Chi -Square 2.784(a) 4 .595
Likelihood Ratio 3.831 4 .429
Linear -by-Linear
Association .290 1 .590
N of Valid Cases 768

The above hypothesis is tested at 5% LOS
P value = 0.595
Since p= 0.595 > 0.05 therefore Null hypothesis is Accepted by the Researcher.
Thus Researcher concludes that Tata is not significant with the Income of the mobile phones
users.
Therefore Choice of Brand TATA is independent of INCOME of User.

H0 : Choice of Brand HTC independent of Income of User.
H1 : Choice of Brand HTC is dependent of Income of User.
Table 6.1.4.11
Which brand of mobile
phone(s) are you
presently using
HTC
Income Total
Dependent
Up to
20,000
20,001-
40,000
40,001-
60,000
Above
60,000
No Count 279 122 125 93 135 754
% within
Income 98.6% 100.0% 98.4% 97.9% 95.7% 98.2%
Yes Count 4 0 2 2 6 14
% within
Income 1.4% .0% 1.6% 2.1% 4.3% 1.8%
Total Count 283 122 127 95 141 768
% within
Income 100.0% 100.0% 100.0% 100.0% 100.0% 100.0%
Source: Survey
Chi-Square Tests
Value Df
Asymp. Sig.
(2-sided)
Pearson Chi -Square 7.278(a) 4 .122
Likelihood Ratio 8.261 4 .082
Linear -by-Linear
Association 4.252 1 .039
N of Valid Cases 768
The above hypothesis is tested at 5% LOS
P value = 0.122

Since p= 0.122 > 0.05 therefore Null hypothesis is Accepted by the Researcher.
Thus Researcher concludes that HTC is not significant with the Income of the mobile phones
users.
Therefore Choice of Brand HTC is independent of INCOME of User.

H0 : Choice of Brand Philips independent of Income of User.
H1 : Choice of Brand Philips is dependent of Income of User.
Table 6.1.4.12
Which brand of
mobile phone(s) are
you presently using
Philips
Income Total
Dependent
Up to
20,000
20,001-
40,000
40,001-
60,000
Above
60,000
No Count 283 122 127 95 141 768
%
within
Income
100.0% 100.0% 100.0% 100.0% 100.0% 100.0%
Total Count 283 122 127 95 141 768
%
within
Income
100.0% 100.0% 100.0% 100.0% 100.0% 100.0%
Source: Survey
Chi-Square Tests
Value
Pearson Chi -Square .(a)
N of Valid Cases 768
No statistics are computed because Philips is a constant
From Table 6.1.4.12 Researcher has concluded that none of the respondent like the brand
Philips.

H0 : Choice of Brand Spice independent of Income of User.
H1 : Choice of Brand Spice is dependent of Income of User.
Table 6.1.4.13
Which brand of
mobile phone(s) are
you presently using
Spice
Income Total
Dependent
Up to
20,000
20,001-
40,000
40,001-
60,000
Above
60,000
No Count 282 120 127 95 141 765
% within
Income 99.6% 98.4% 100.0% 100.0% 100.0% 99.6%
Yes Count 1 2 0 0 0 3
% within
Income .4% 1.6% .0% .0% .0% .4%
Total Count 283 122 127 95 141 768
% within
Income 100.0% 100.0% 100.0% 100.0% 100.0% 100.0%
Source: Survey
Chi-Square Tests
Value Df
Asymp. Sig.
(2-sided)
Pearson Chi -Square 6.323(a) 4 .176
Likelihood Ratio 5.561 4 .234
Linear -by-Linear
Association 1.114 1 .291
N of Valid Cases 768
The above hypothesis is tested at 5% LOS
P value = 0.176
Since p= 0.176 > 0.05 therefore Null hypothesis is Accepted by the Researcher.

Thus Researcher concludes that Spice is not significant with the Income of the mobile phones
users.
Therefore Choice of Brand SPICE is independent of INCOME of User.

H0 : Choice of Brand Videocon independent of Income of User.
H1 : Choice of Brand Videocon is dependent of Income of User.
Table 6.1.4.14
Which brand of
mobile phone(s) are
you presently using
Videocon
Income Total
Dependent
Up to
20,000
20,001-
40,000
40,001-
60,000
Above
60,000
No Count 283 122 127 95 141 768
%
within
Income
100.0% 100.0% 100.0% 100.0% 100.0% 100.0
%
Total Count 283 122 127 95 141 768
%
within
Income
100.0% 100.0% 100.0% 100.0% 100.0% 100.0
%
Source: Survey
Chi-Square Tests
Value
Pearson Chi -Square .(a)
N of Valid Cases 768
No statistics are computed because Videocon is a constant.
From Table 6.1.4.14 Researcher has concluded that none of the respondent like the brand
Videocon.

1.1.5 Demographic factor: EDUCATION
H0 : Choice of Brand Nokia independent of Education of User.
H1 : Choice of Brand Nokia is dependent of Education of User.
Table 6.1.5.1
Which brand of mobile
phone(s) are you presently
using
Education Total
Nokia
Up to
10th
Up to
12th Graduate
Post
Graduate
Other
Quail
No Count 51 108 37 207 97 500
% within
Education 63.0% 69.7% 84.1% 61.6% 63.0% 64.9%
Yes Count 30 47 7 129 57 270
% within
Education 37.0% 30.3% 15.9% 38.4% 37.0% 35.1%
Total Count 81 155 44 336 154 770
% within
Education 100.0% 100.0% 100.0% 100.0%
100.0
%
100.0
%
Source: Survey
Chi-Square Tests
The above hypothesis is tested at 5% LOS
Value do
Asymp. Sig.
(2-sided)
Pearson Chi -Square 10.651(a) 4 .031
Likelihood Ratio 11.636 4 .020
Linear -by-Linear
Association 1.546 1 .214
N of Valid Cases 770

P value = 0.031
Since p= 0.031 > 0.05 therefore Null hypothesis is Accepted by the Researcher.
Thus Researcher concludes that Nokia is not significant with the Education of the mobile phones
users.
Therefore Choice of Brand NOKIA is independent of EDUCATION of User.

H0 : Choice of Brand LG independent of Education of User.
H1 : Choice of Brand LG is dependent of Education of User.
Table 6.1.5.2
Which brand of mobile
phone(s) are you
presently using
LG
Education Total
Up to
10th
Up to
12th Graduate
Post
Graduate
Other
Quail
No Count 79 149 39 323 149 739
% within
Education 97.5% 96.1% 88.6% 96.1% 96.8% 96.0%
Yes Count 2 6 5 13 5 31
% within
Education 2.5% 3.9% 11.4% 3.9% 3.2% 4.0%
Total Count 81 155 44 336 154 770
% within
Education
100.0
% 100.0% 100.0% 100.0% 100.0% 100.0%
Source: Survey
Chi-Square Tests
Value Df
Asymp. Sig.
(2-sided)
Pearson Chi -Square 6.912(a) 4 .141
Likelihood Ratio 5.050 4 .282
Linear -by-Linear
Association .001 1 .981
N of Valid Cases 770
The above hypothesis is tested at 5% LOS
P value = 0.141

Since p= 0.141 > 0.05 therefore Null hypothesis is Accepted by the Researcher.
Thus Researcher concludes that LG is not significant with the Education of the mobile phones
users.
Therefore Choice of Brand LG is independent of EDUCATION of User.

H0 : Choice of Brand Samsung independent of Education of User.
H1 : Choice of Brand Samsung is dependent of Education of User.
Table 6.1.5.3
Which brand of mobile
phone(s) are you
presently using
Samsung
Education Total
Up to
10th
Up to
12th Graduate
Post
Graduate
Other
Quail
No Count 66 130 38 280 133 647
% within
Education 81.5% 83.9% 86.4% 83.3% 86.4% 84.0%
Yes Count 15 25 6 56 21 123
% within
Education 18.5% 16.1% 13.6% 16.7% 13.6% 16.0%
Total Count 81 155 44 336 154 770
% within
Education 100.0% 100.0% 100.0% 100.0%
100.0
% 100.0%
Source: Survey
Chi-Square Tests
Value do
Asymp. Sig.
(2-sided)
Pearson Chi -Square 1.320(a) 4 .858
Likelihood Ratio 1.337 4 .855
Linear -by-Linear
Association .491 1 .483
N of Valid Cases 770
The above hypothesis is tested at 5% LOS
P value = 0.858

Since p= 0.858 > 0.05 therefore Null hypothesis is Accepted by the Researcher.
Thus Researcher concludes that Samsung is not significant with the Education of the mobile
phones users.
Therefore Choice of Brand SAMSUNG is independent of EDUCATION of User.

H0 : Choice of Brand Reliance independent of Education of User.
H1 : Choice of Brand Reliance is dependent of Education of User.
Table 6.1.5.4
Which brand of mobile
phone(s) are you
presently using
Reliance
Education Total
Up to
10th
Up to
12th Graduate
Post
Graduate
Other
Quail
No Count 75 147 44 326 151 743
% within
Education 92.6% 94.8% 100.0% 97.0% 98.1% 96.5%
Yes Count 6 8 0 10 3 27
% within
Education 7.4% 5.2% .0% 3.0% 1.9% 3.5%
Total Count 81 155 44 336 154 770
% within
Education
100.0
% 100.0% 100.0% 100.0% 100.0% 100.0%
Source: Survey
Chi-Square Tests
Value Df
Asymp. Sig.
(2-sided)
Pearson Chi -Square 7.881(a) 4 .096
Likelihood Ratio 8.631 4 .071
Linear -by-Linear
Association 5.464 1 .019
N of Valid Cases 770
The above hypothesis is tested at 5% LOS
P value = 0.096

Since p= 0.096 > 0.05 therefore Null hypothesis is Accepted by the Researcher.
Thus Researcher concludes that Reliance is not significant with the Education of the mobile
phones users.
Therefore Choice of Brand RELIANCE is independent of EDUCATION of User.

H0 : Choice of Brand Blackberry independent of Education of User.
H1 : Choice of Brand Blackberry is dependent of Education of User.
Table 6.1.5.5
Which brand of mobile
phone(s) are you
presently using
Blackberry
Education Total
Up to
10th
Up to
12th Graduate
Post
Graduate
Other
Quail
No Count 69 92 29 214 80 484
% within
Education 85.2% 59.4% 65.9% 63.7% 51.9% 62.9%
Yes Count 12 63 15 122 74 286
% within
Education 14.8% 40.6% 34.1% 36.3% 48.1% 37.1%
Total Count 81 155 44 336 154 770
% within
Education 100.0% 100.0% 100.0% 100.0% 100.0% 100.0%
Source: Survey
Chi-Square Tests
Value Df
Asymp. Sig.
(2-sided)
Pearson Chi -Square 26.236(a) 4 .000
Likelihood Ratio 28.583 4 .000
Linear -by-Linear
Association 12.539 1 .000
N of Valid Cases 770

The above hypothesis is tested at 5% LOS
P value = 0.000
Since p= 0.000 < 0.05 therefore Null hypothesis is Rejected by the Researcher.
Thus Researcher concludes that Blackberry is significant with the Education of the mobile
phones users.
Therefore Choice of Brand BLACKBERRY is dependent of EDUCATION of User.
Preference of Brand Blackberry with Education
From the above pie diagram the researcher came to know that there are 14.8%
respondents Up to 10th, 40.6% respondents Up to 12th, 34.1% Graduate respondents,
36.3% Post Graduate respondents and 48.1% Other Qualification respondents who prefer
this brand.
Blackberry
Up to 10th
Up to 12th
Graduate
Post Graduate
Other Quali

H0 : Choice of Brand Apple independent of Education of User.
H1 : Choice of Brand Apple is dependent of Education of User.
Table 6.1.5.6
Which brand of mobile
phone(s) are you
presently using
Apple
Education Total
Up to
10th
Up to
12th Graduate
Post
Graduate
Other
Quail
No Count 78 140 38 288 137 681
% within
Educatio
n
96.3% 90.3% 86.4% 85.7% 89.0% 88.4%
Yes Count 3 15 6 48 17 89
% within
Educatio
n
3.7% 9.7% 13.6% 14.3% 11.0% 11.6%
Total Count 81 155 44 336 154 770
% within
Educatio
n
100.0% 100.0
% 100.0% 100.0% 100.0% 100.0%
Source: Survey
Chi-Square Tests
Value Df
Asymp. Sig.
(2-sided)
Pearson Chi -Square 8.096(a) 4 .088
Likelihood Ratio 9.523 4 .049
Linear -by-Linear
Association 4.071 1 .044
N of Valid Cases 770
The above hypothesis is tested at 5% LOS

P value = 0.000
Since p= 0.000 < 0.05 therefore Null hypothesis is Rejected by the Researcher.
Thus Researcher concludes that
users.
Therefore Choice of Brand APPLE is dependent of EDUCATION of User.
Preference of Brand Apple
From the above multiple Bar diagram, the researcher came to know that there are 3.7%
respondents Up to 10th, 9.7% respondents Up to 12
Post Graduate respondents and 11.0% Other Qualifi
brand.
0
50
100
150
200
250
300
0.05 therefore Null hypothesis is Rejected by the Researcher.
Thus Researcher concludes that Apple is significant with the Education of the mobile phones
Choice of Brand APPLE is dependent of EDUCATION of User.
Apple with Education
Fig.6.1.5.6
From the above multiple Bar diagram, the researcher came to know that there are 3.7%
, 9.7% respondents Up to 12th, 13.6% Graduate respondents, 14.3%
Post Graduate respondents and 11.0% Other Qualification respondents who prefer this
is significant with the Education of the mobile phones
From the above multiple Bar diagram, the researcher came to know that there are 3.7%
, 13.6% Graduate respondents, 14.3%
cation respondents who prefer this
Apple No
Apple Yes

H0 : Choice of Brand Motorola independent of Education of User.
H1 : Choice of Brand Motorola is dependent of Education of User.
Table 6.1.5.7
Which brand of mobile
phone(s) are you
presently using
Motorola
Education Total
Up to
10th
Up to
12th Graduate
Post
Graduate
Other
Quail
Count 80 153 43 327 153 756
% within
Education 98.8% 98.7% 97.7% 97.3% 99.4% 98.2%
Yes Count 1 2 1 9 1 14
% within
Education 1.2% 1.3% 2.3% 2.7% .6% 1.8%
Total Count 81 155 44 336 154 770
% within
Education
100.0
%
100.0
% 100.0% 100.0% 100.0% 100.0%
Source: Survey
Chi-Square Tests
Value Df
Asymp. Sig.
(2-sided)
Pearson Chi -Square 3.019(a) 4 .555
Likelihood Ratio 3.270 4 .514
Linear -by-Linear
Association .048 1 .826
N of Valid Cases 770
The above hypothesis is tested at 5% LOS

P value = 0.555
Since p= 0.555 > 0.05 therefore Null hypothesis is Accepted by the Researcher.
Thus Researcher concludes that Motorola is not significant with the Education of the mobile
phones users.
Therefore Choice of Brand MOTOROLA is independent of EDUCATION of User.

H0 : Choice of Brand Sony independent of Education of User.
H1 : Choice of Brand Sony is dependent of Education of User.
Table 6.1.5.8
Which brand of mobile
phone(s) are you
presently using
Education Total
Sony Up to
10th
Up to
12th Graduate
Post
Graduate
Other
Quail
No Count 78 149 41 325 148 741
% within
Education 96.3% 96.1% 93.2% 96.7% 96.1% 96.2%
Yes Count 3 6 3 11 6 29
% within
Education 3.7% 3.9% 6.8% 3.3% 3.9% 3.8%
Total Count 81 155 44 336 154 770
% within
Education 100.0% 100.0% 100.0% 100.0% 100.0% 100.0%
Source: Survey
Chi-Square Tests
Value Df
Asymp. Sig.
(2-sided)
Pearson Chi -Square 1.368(a) 4 .850
Likelihood Ratio 1.166 4 .884
Linear -by-Linear
Association .037 1 .848
N of Valid Cases 770
The above hypothesis is tested at 5% LOS
P value = 0.850

Since p= 0.850 > 0.05 therefore Null hypothesis is Accepted by the Researcher.
Thus Researcher concludes that Sony is not significant with the Education of the mobile phones
users.
Therefore Choice of Brand SONY is independent of EDUCATION of User.

H0 : Choice of Brand Micromax independent of Education of User.
H1 : Choice of Brand Micromax is dependent of Education of User.
Table 6.1.5.9
Which brand of mobile
phone(s) are you presently
using
Education Total
Micromax
Up to
10th
Up to
12th Graduate
Post
Graduate
Other
Quail
No Count 80 150 42 330 153 755
% within
Education 98.8% 96.8% 95.5% 98.2% 99.4% 98.1%
Yes Count 1 5 2 6 1 15
% within
Education 1.2% 3.2% 4.5% 1.8% .6% 1.9%
Total Count 81 155 44 336 154 770
% within
Education 100.0% 100.0% 100.0% 100.0% 100.0% 100.0%
Source: Survey
Chi-Square Tests
Value Df
Asymp. Sig.
(2-sided)
Pearson Chi -Square 4.501(a) 4 .342
Likelihood Ratio 4.367 4 .359
Linear -by-Linear
Association 1.167 1 .280
N of Valid Cases 770
The above hypothesis is tested at 5% LOS

P value = 0.342
Since p= 0.342 > 0.05 therefore Null hypothesis is Accepted by the Researcher.
Thus Researcher concludes that Micromax is not significant with the Education of the mobile
phones users.
Therefore Choice of Brand MICROMAX is independent of EDUCATION of User.

H0 : Choice of Brand Tata independent of Education of User.
H1 : Choice of Brand Tata is dependent of Education of User.
Table 6.1.5.10
Which brand of mobile
phone(s) are you
presently using
Tata
Education Total
Up to
10th
Up to
12th Graduate
Post
Graduate
Other
Quail
No Count 77 155 43 334 154 763
% within
Education 95.1% 100.0% 97.7% 99.4% 100.0% 99.1%
Yes Count 4 0 1 2 0 7
% within
Education 4.9% .0% 2.3% .6% .0% .9%
Total Count 81 155 44 336 154 770
% within
Education 100.0% 100.0% 100.0% 100.0% 100.0%
100.0
%
Source: Survey
Chi-Square Tests
Value do
Asymp. Sig.
(2-sided)
Pearson Chi -Square 18.708(a) 4 .001
Likelihood Ratio 13.849 4 .008
Linear -by-Linear
Association 6.908 1 .009
N of Valid Cases 770
The above hypothesis is tested at 5% LOS

P value = 0.001
Since p= 0.001< 0.05 therefore Null hypothesis is Rejected by the Researcher.
Thus Researcher concludes that
users.
Therefore Choice of Brand TATA is dependent of EDUCATION of User.
Preference of Brand Tata with Education
From the above segmented Bar Graph the researcher came to a conclusion that this brand
is highly preferred those who are not much educated thus indicating their brand
awareness.
92%
93%
94%
95%
96%
97%
98%
99%
100%
0.05 therefore Null hypothesis is Rejected by the Researcher.
Thus Researcher concludes that Tata is significant with the Education of the mobile phones
Choice of Brand TATA is dependent of EDUCATION of User.
with Education
Fig. 6.1.5.10
From the above segmented Bar Graph the researcher came to a conclusion that this brand
is highly preferred those who are not much educated thus indicating their brand
Tata Yes
Tata No
is significant with the Education of the mobile phones
From the above segmented Bar Graph the researcher came to a conclusion that this brand
is highly preferred those who are not much educated thus indicating their brand

H0 : Choice of Brand HTC independent of Education of User.
H1 : Choice of Brand HTC is dependent of Education of User.
Table 6.1.5.11
Which brand of mobile
phone(s) are you
presently using
Education Total
HTC Up to
10th
Up to
12th Graduate
Post
Graduate
Other
Quail
No Count 81 152 44 332 148 757
% within
Education 100.0% 98.1% 100.0% 98.8% 96.1% 98.3%
Yes Count 0 3 0 4 6 13
% wi thin
Education .0% 1.9% .0% 1.2% 3.9% 1.7%
Total Count 81 155 44 336 154 770
% within
Education 100.0% 100.0% 100.0% 100.0% 100.0% 100.0%
Source: Survey
Chi-Square Tests
Value Df
Asymp. Sig.
(2-sided)
Pearson Chi -Square 7.228(a) 4 .124
Likelihood Ratio 8.182 4 .085
Linear -by-Linear
Association 2.605 1 .107
N of Valid Cases 770
The above hypothesis is tested at 5% LOS

P value = 0.124
Since p= 0.124 > 0.05 therefore Null hypothesis is Accepted by the Researcher.
Thus Researcher concludes that HTC is not significant with the Education of the mobile phones
users.
Therefore Choice of Brand HTC is independent of EDUCATION of User.

H0 : Choice of Brand Philips independent of Education of User.
H1 : Choice of Brand Philips is dependent of Education of User.
Table 6.1.5.12
Which brand of mobile
phone(s) are you
presently using Education Total
Philips
Up to
10th
Up to
12th Graduate
Post
Graduate
Other
Quail
No Count 81 155 44 336 154 770
% within
Education
100.0
% 100.0% 100.0% 100.0% 100.0% 100.0%
Total Count 81 155 44 336 154 770
% within
Education
100.0
% 100.0% 100.0% 100.0% 100.0% 100.0%
Source: Survey
Chi-Square Tests
Value
Pearson Chi -Square .(a)
N of Valid Cases 770
No statistics are computed because Philips is a constant.
From Table 6.1.5.12 Researcher has concluded that none of the respondent likes the brand
Philips.

H0 : Choice of Brand Spice independent of Education of User.
H1 : Choice of Brand Spice is dependent of Education of User.
Table 6.1.5.13
Which brand of mobile
phone(s) are you
presently using
Spice
Education Total
Up to
10th
Up to
12th Graduate
Post
Graduate
Other
Quail
No Count 81 155 43 334 154 767
% within
Education 100.0% 100.0% 97.7% 99.4% 100.0% 99.6%
Yes Count 0 0 1 2 0 3
% within
Education .0% .0% 2.3% .6% .0% .4%
Total Count 81 155 44 336 154 770
% within
Education 100.0% 100.0% 100.0% 100.0% 100.0% 100.0%
Source: Survey
Chi-Square Tests
Value do
Asymp. Sig.
(2-sided)
Pearson Chi -Square 5.912(a) 4 .206
Likelihood Ratio 5.246 4 .263
Linear -by-Linear
Association .105 1 .746
N of Valid Cases 770
The above hypothesis is tested at 5% LOS
P value = 0.206

Since p= 0.206 > 0.05 therefore Null hypothesis is Accepted by the Researcher.
Thus Researcher concludes that Spice is not significant with the Education of the mobile phones
users.
Therefore Choice of Brand SPICE is independent of EDUCATION of User.

H0 : Choice of Brand Videocon independent of Education of User.
H1 : Choice of Brand Videocon is dependent of Education of User.
Table 6.1.5.14
Which brand of mobile
phone(s) are you presently
using
Videocon
Education Total
Up to
10th
Up to
12th Graduate
Post
Graduate
Other
Quail
No Count 81 155 44 336 154 770
% within
Education 100.0% 100.0% 100.0% 100.0% 100.0% 100.0%
Total Count 81 155 44 336 154 770
% within
Education 100.0% 100.0% 100.0% 100.0% 100.0% 100.0%
Source: Survey
Chi-Square Tests
Value
Pearson Chi -Square .(a)
N of Valid Cases 770
No statistics are computed because Videocon is a constant.
From Table 6.1.5.14 Researcher has concluded that none of the respondent likes the brand
Videocon.

1.2 Brand Switching
To satisfy the second objective of the research the researcher had focused on demographic
factors of customers of Mobile phone and change of Mobile phone. The following
hypotheses were considered for the same.
6.2.1 Demographic factor: GENDER
H0: Brand switching is independent of Gender of customer.
H1: Brand switching is dependent of Gender of customer.
Table 6.2.1
How likely are you to change your mobile phone
brand in the near future
Gender Total
Male Female
Very Unlikely Count 91 52 143
% within
Gender 20.0% 15.3% 18.0%
Unlikely Count 119 112 231
% within
Gender 26.2% 33.0% 29.1%
Neither Likely nor
Unlikely
Count 104 75 179
% within
Gender 22.9% 22.1% 22.5%
Likely Count 113 86 199
% within
Gender 24.8% 25.4% 25.1%
Very Likely Count 28 14 42
% within
Gender 6.2% 4.1% 5.3%
Total Count 455 339 794
% within
Gender 100.0% 100.0% 100.0%
Source: Survey
Chi-Square Tests

Value Df
Asymp. Sig.
(2-sided)
Pearson Chi -Square 7.081(a) 4 .132
The above hypothesis is tested at 5% LOS
P value = 0.132
Since p= 0.132 > 0.05 therefore Null hypothesis is Accepted by the Researcher. Thus change
Your mobile phone brand is not significant with Gender of User.
Thus Researcher concludes that Brand switching is independent of Gender of customer.

6.2.2 Demographic factor: AGE
H0: Brand switching is independent of Age of customer.
H1: Brand choice is dependent of Age of customer.
Table 6.2.2
How likely are you to change your
mobile phone brand in the near
future
Age Total
18-28 29-39 40-50
51 &
above
Very Unlikely Count 55 38 36 13 142
% wi thin
Age 16.8% 18.3% 18.2% 26.5% 18.1%
Unlikely Count 100 54 56 16 226
% within
Age 30.5% 26.0% 28.3% 32.7% 28.9%
Neither Likely nor
Unlikely
Count 62 54 54 6 176
% within
Age 18.9% 26.0% 27.3% 12.2% 22.5%
Likely Count 85 53 45 14 197
% within
Age 25.9% 25.5% 22.7% 28.6% 25.2%
Very Likely Count 26 9 7 0 42
% within
Age 7.9% 4.3% 3.5% .0% 5.4%
Total Count 328 208 198 49 783
% within
Age 100.0% 100.0% 100.0% 100.0% 100.0%
Source: Survey
Chi-Square Tests

Value Df
Asymp. Sig.
(2-sided)
Pearson Chi -Square 19.786(a) 12 .071
The above hypothesis is tested at 5% LOS. P value = 0.071
Since p= 0.071 > 0.05 therefore Null hypothesis is Accepted by the Researcher.
Thus change your mobile phone brand is not significant with Age of User.
Thus Researcher concludes that Brand switching is independent of Age of customer.

6.2.3 Demographic factor: OCCUPATION
H0: Brand switching is independent of Occupation of customer.
H1: Brand choice is dependent of Occupation of customer.
Table 6.2.3
Source: Survey
Chi-Square Tests
Value Df
Asymp. Sig.
(2-sided)
Pearson Chi -Square 27.769(a) 16 .034
How likely are you to change your
mobile phone brand in the near
future
Occupation Total
Service Business Professional Student Housewife
Very Unlikely Count 34 30 33 25 21 143
% within
Occupation 20.0% 19.2% 23.1% 15.2% 13.0% 18.0%
Unlikely Count 53 44 36 48 50 231
% within
Occupation 31.2% 28.2% 25.2% 29.3% 31.1% 29.1%
Neither Likely nor
Unlikely
Count 37 38 31 26 47 179
% within
Occupation 21.8% 24.4% 21.7% 15.9% 29.2% 22.5%
Likely Count 35 41 37 49 37 199
% within
Occupation 20.6% 26.3% 25.9% 29.9% 23.0% 25.1%
Very Likely Count 11 3 6 16 6 42
% within
Occupation 6.5% 1.9% 4.2% 9.8% 3.7% 5.3%
Total Count 170 156 143 164 161 794
% within
Occupation 100.0% 100.0% 100.0% 100.0% 100.0% 100.0%

The above hypothesis is tested at 5% LOS. P value = 0.034
Since p= 0.034 < 0.05 therefore Null hypothesis is Rejected by the Researcher.
Thus change your mobile phone brand is significant with Occupation of User.
Thus Researcher concludes that Brand switching is dependent of Occupation of customer.
6.2.4 Demographic factor: INCOME
H0: Brand switching is independent of income of customer.
H1: Brand switching is dependent of income of customer.
Table 6.2.4
How likely are you to change your
mobile phone brand in the near
future
Income Total
Dependent
Up to
20,000
20,001-
40,000
40,001-
60,000
Above
60,000
Very Unlikely Count 39 24 24 32 20 139
% within
Income 13.8% 19.7% 18.9% 33.7% 14.2% 18.1%
Unlikely Count 84 34 31 25 50 224
% within
Income 29.7% 27.9% 24.4% 26.3% 35.5% 29.2%
Neither Likely nor
Unlikely
Count 59 31 37 14 32 173
% within
Income 20.8% 25.4% 29.1% 14.7% 22.7% 22.5%
Likely Count 80 27 29 21 35 192
% within
Income 28.3% 22.1% 22.8% 22.1% 24.8% 25.0%
Very Likely Count 21 6 6 3 4 40
% within
Income 7.4% 4.9% 4.7% 3.2% 2.8% 5.2%
Total Count 283 122 127 95 141 768
% within
Income 100.0% 100.0% 100.0% 100.0% 100.0% 100.0%
Source: Survey

Chi-Square Tests
Value do
Asymp. Sig.
(2-sided)
Pearson Chi -Square 33.353(a) 16 .007
The above hypothesis is tested at 5% LOS. P value = 0.007
Since p= 0.007 < 0.05 therefore Null hypothesis is Rejected by the Researcher.
Thus change your mobile phone brand is significant with Occupation of User.
Thus Researcher concludes that Brand switching is dependent of Income of customer.

6.2.5 Demographic factor: EDUCATION
H0: Brand switching is independent of Education of customer.
H1: Brand choice is dependent of Education of customer.
Table 6.2.4
How likely are you to change your
mobile phone brand in the near
future
Education Total
Up to
10th
Up to
12th Graduate
Post
Graduate
Other
Quail
Very Unlikely Count 16 23 6 67 26 138
% within
Education 19.8% 14.8% 13.6% 19.9% 16.9% 17.9%
Unlikely Count 23 43 13 107 41 227
% within
Education 28.4% 27.7% 29.5% 31.8% 26.6% 29.5%
Neither Likely nor
Unlikely
Count 26 37 12 69 29 173
% within
Education 32.1% 23.9% 27.3% 20.5% 18.8% 22.5%
Likely Count 14 39 8 78 52 191
% within
Education 17.3% 25.2% 18.2% 23.2% 33.8% 24.8%
Very Likely Count 2 13 5 15 6 41
% within
Education 2.5% 8.4% 11.4% 4.5% 3.9% 5.3%
Total Count 81 155 44 336 154 770
% within
Education 100.0% 100.0% 100.0% 100.0% 100.0%
100.0
%
Source: Survey
Chi-Square Tests
Value Df
Asymp. Sig.
(2-sided)
Pearson Chi -Square 24.936(a) 16 .071

Since p= 0.071 > 0.05 thus the researcher had concluded that change your mobile phone brand is
not significant with the Education of the mobile phones users.
Therefore researcher has Accept the Null hypothesis.
Therefore Brand switching is Independent of Education of customer.

6.3 Factors Influencing Purchase Decision
To satisfy the third objective, the researcher had made an attempt to find the impact of prominent
demographic variables on purchase and switching intensions of the users. To study the factors
which are significant for the purchase decision based on the demographic factors, the researcher
had used t test and ANOVA as the statistical tool to arrive at the desire result.
6.3.1 DEMOGRAPHIC FACTOR: GENDER
Rate the factors influencing your purchase decision
Table 6.3.1 Group Statistics
Gender N Mean
Std.
Deviation
Std. Error
Mean
Brand name Male 455 3.93 1.018 .048
Female 339 3.72 1.074 .058
Value for
Price
Male 455 4.04 .853 .040
Female 339 3.97 .977 .053
Reference Male 455 3.24 1.038 .049
Female 339 3.37 .998 .054
Shopkeepers
suggestions
Male 455 2.84 1.080 .051
Female 339 2.91 1.062 .058
Good battery
life
Male 455 4.18 .880 .041
Female 339 4.04 .911 .049
Brand
ambassador
Male 455 2.39 1.179 .055
Female 339 2.40 1.193 .065
Physical
appearance
Male 455 3.89 .967 .045
Female 339 3.90 .922 .050
Utility Male 455 4.20 .805 .038
Female 339 4.09 .855 .046
User friendly Male 455 4.19 .806 .038
Female 339 4.09 .871 .047
Dual SIM card Male 455 3.93 .971 .046
Female 339 3.81 1.038 .056
3G Male 455 3.97 .982 .046

Female 339 3.81 1.028 .056
Operating
system
Male 455 3.11 .610 .029
Female 339 3.17 .583 .032
Source: Survey
Independent Samples Test
t-test for Equality of Means
T Df Sig. (2-tailed)
Brand name 2.717 706.349 .007
Value for Price 1.028 669.865 .304
Reference -1.733 792 .084
Shopkeepers suggestions -.887 792 .375
Good battery life 2.053 792 .040
Brand ambassador -.022 792 .982
Physical appearance -.098 792 .922
Utility 1.855 792 .064
User friendly 1.802 792 .072
Dual SIM card 1.651 792 .099
3G 2.204 709.509 .028
Operating system -1.390 792 .165
The researcher has made an attempt to find the prominent factors which are responsible
for brand choice while gender is considered.
The first table gives mean ratings given to factors by males and females. The second table
gives significance of difference.
From the above table p value for brand name is 0.007 which is significant at 5% LOS.
Since p <= 0.05 the difference between ratings of males and females is significant.
Therefore Brand name is significant factor for choosing a brand.
Similarly Reference, Good battery Life, Utility, User friendly, Dual SIM card and 3G
shows significance difference between ratings given by males and females. In each of the
above factor males have higher ratings than females except for reference.

Whereas Value for Price, Shopkeepers suggestions, Brand ambassador, Physical
appearance and operating system doesn’t affect the purchase decision of the respondents.

6.3.2 DEMOGRAPHIC FACTOR: AGE
Rate the factors influencing your purchase decision
Table 6.3.2 Descriptive
Age N Mean
Std.
Deviation
Std.
Error
Brand name 18-28 328 3.87 1.087 .060
29-39 208 3.74 1.116 .077
40-50 198 3.93 .932 .066
51 &
above 49 3.73 .953 .136
Total 783 3.84 1.051 .038
Value for
Price
18-28 328 3.91 .976 .054
29-39 208 3.88 .877 .061
40-50 198 4.25 .804 .057
51 &
above 49 4.29 .816 .117
Total 783 4.01 .913 .033
Reference 18-28 328 3.32 1.013 .056
29-39 208 3.29 1.052 .073
40-50 198 3.32 .995 .071
51 &
above 49 3.12 1.166 .167
Total 783 3.30 1.028 .037
Shopkeepers
suggestions
18-28 328 2.83 1.076 .059
29-39 208 2.99 1.065 .074
40-50 198 2.88 1.050 .075
51 &
above 49 2.65 1.182 .169
Total 783 2.87 1.075 .038
Good battery
life
18-28 328 4.29 .848 .047
29-39 208 3.93 .951 .066
40-50 198 4.09 .865 .062
51 & 49 3.92 .932 .133

above
Total 783 4.12 .898 .032
Brand
ambassador
18-28 328 2.46 1.221 .067
29-39 208 2.59 1.180 .082
40-50 198 2.17 1.084 .077
51 &
above 49 2.10 1.141 .163
Total 783 2.40 1.183 .042
Physical
appearance
18-28 328 3.96 .947 .052
29-39 208 3.97 .876 .061
40-50 198 3.85 .960 .068
51 &
above 49 3.37 1.093 .156
Total 783 3.90 .951 .034
Utility 18-28 328 4.18 .839 .046
29-39 208 4.13 .833 .058
40-50 198 4.17 .831 .059
51 &
above 49 4.12 .754 .108
Total 783 4.16 .829 .030
User friendly 18-28 328 4.13 .820 .045
29-39 208 4.10 .868 .060
40-50 198 4.24 .824 .059
51 &
above 49 4.20 .790 .113
Total 783 4.15 .833 .030
Dual SIM card 18-28 328 3.81 1.049 .058
29-39 208 3.88 .912 .063
40-50 198 4.01 .979 .070
51 &
above 49 3.84 1.124 .161
Total 783 3.88 1.003 .036
3G 18-28 328 4.08 .874 .048
29-39 208 3.87 1.030 .071
40-50 198 3.79 1.050 .075
51 &
above 49 3.33 1.297 .185
Total 783 3.90 1.009 .036

Operating
system
18-28 328 3.14 .631 .035
29-39 208 3.17 .694 .048
40-50 198 3.12 .457 .032
51 &
above 49 2.92 .449 .064
Total 783 3.13 .602 .022
Source: Survey
ANOVA Table
Sum of
Squares Df
Mean
Square F Sig.
Brand name Between
Groups 4.514 3 1.505 1.364 .252
Within
Groups 859.164 779 1.103
Total 863.678 782
Value for
Price
Between
Groups 22.012 3 7.337 9.075 .000
Within
Groups 629.861 779 .809
Total 651.872 782
Reference Between
Groups 1.752 3 .584 .552 .647
Within
Groups 824.718 779 1.059
Total 826.470 782
Shopkeepers
suggestions
Between
Groups 5.640 3 1.880 1.632 .181
Within
Groups 897.589 779 1.152
Total 903.229 782
Good battery
life
Between
Groups 18.621 3 6.207 7.910 .000
Within
Groups 611.333 779 .785
Total 629.954 782
Brand
ambassador
Between
Groups 23.939 3 7.980 5.811 .001
Within 1069.739 779 1.373

Groups
Total 1093.678 782
Physical
appearance
Between
Groups 16.403 3 5.468 6.164 .000
Within
Groups 691.009 779 .887
Total 707.413 782
Utility Between
Groups .415 3 .138 .200 .896
Within
Groups 537.309 779 .690
Total 537.724 782
User friendly Between
Groups 2.324 3 .775 1.118 .341
Within
Groups 539.977 779 .693
Total 542.301 782
Dual SIM
card
Between
Groups 4.615 3 1.538 1.534 .204
Within
Groups 781.340 779 1.003
Total 785.954 782
3G Between
Groups 29.323 3 9.774 9.923 .000
Within
Groups 767.301 779 .985
Total 796.623 782
Operating
system
Between
Groups 2.652 3 .884 2.452 .062
Within
Groups 280.799 779 .360
Total 283.451 782
The researcher has made an attempt to find the prominent factors which are responsible
for brand choice while age is considered.
For age groups the test applied is Analysis of Variance (ANOVA). The first table gives
mean ratings by different age groups. The second table gives significance. The last column
in second table (Sig.) is P-value. If P<= 0.05 the difference between age groups is

significant.
Value for Price, Good battery life, Brand ambassador, Physical appearance and 3G are
significant or in other words the respondents give importance to Value for Price, Good
battery life, Brand ambassador, Physical appearance and 3G while making purchasing
decision when AGE factor is considered.

6.3.3 DEMOGRAPHIC FACTOR: OCCUPATION
Rate the factors influencing your purchase decision
Table 6.3.3
Descriptive
Occupation N Mean
Std.
Deviation
Std.
Error
Brand name Service 170 3.68 1.122 .086
Business 156 4.02 .919 .074
Professional 143 3.99 .979 .082
Student 164 3.90 1.069 .084
Housewife 161 3.64 1.070 .084
Total 794 3.84 1.047 .037
Value for
Price
Service 170 4.05 .922 .071
Business 156 4.06 .756 .060
Professional 143 4.11 .840 .070
Student 164 3.87 .973 .076
Housewife 161 3.99 1.006 .079
Total 794 4.01 .908 .032
Reference Service 170 3.15 1.077 .083
Business 156 3.35 .942 .075
Professional 143 3.27 1.043 .087
Student 164 3.40 1.007 .079
Housewife 161 3.31 1.032 .081
Total 794 3.30 1.023 .036
Shopkeepers
suggestions
Service 170 2.93 1.064 .082
Business 156 2.86 1.044 .084
Professional 143 2.90 1.099 .092
Student 164 2.73 1.092 .085
Housewife 161 2.92 1.066 .084
Total 794 2.87 1.072 .038
Good battery
life
Service 170 4.01 .945 .072
Business 156 4.14 .905 .072
Professional 143 4.22 .865 .072
Student 164 4.34 .825 .064

Housewife 161 3.91 .872 .069
Total 794 4.12 .895 .032
Brand
ambassador
Service 170 2.42 1.180 .091
Business 156 2.51 1.194 .096
Professional 143 2.29 1.161 .097
Student 164 2.38 1.264 .099
Housewife 161 2.37 1.116 .088
Total 794 2.39 1.184 .042
Physical
appearance
Service 170 3.72 .974 .075
Business 156 3.94 .972 .078
Professional 143 3.90 .962 .080
Student 164 4.02 .903 .071
Housewife 161 3.90 .910 .072
Total 794 3.89 .947 .034
Utility Service 170 4.12 .841 .065
Business 156 4.24 .763 .061
Professional 143 4.27 .771 .064
Student 164 4.18 .838 .065
Housewife 161 3.99 .891 .070
Total 794 4.16 .828 .029
User friendly Service 170 4.15 .807 .062
Business 156 4.19 .858 .069
Professional 143 4.26 .738 .062
Student 164 4.21 .755 .059
Housewife 161 3.94 .966 .076
Total 794 4.15 .836 .030
Dual SIM card Service 170 3.83 1.003 .077
Business 156 3.96 .986 .079
Professional 143 3.93 .877 .073
Student 164 3.88 1.038 .081
Housewife 161 3.81 1.079 .085
Total 794 3.88 1.001 .036
3G Service 170 3.64 1.123 .086
Business 156 4.17 .864 .069
Professional 143 3.94 .973 .081
Student 164 4.15 .780 .061
Housewife 161 3.65 1.103 .087
Total 794 3.91 1.004 .036

Operating
system
Service 170 3.13 .701 .054
Business 156 3.12 .636 .051
Professional 143 3.13 .515 .043
Student 164 3.11 .554 .043
Housewife 161 3.17 .562 .044
Total 794 3.13 .599 .021
Source: Survey
ANOVA Table
Sum of
Squares Df
Mean
Square F Sig.
Brand name Between
Groups 19.380 4 4.845 4.501 .001
Within
Groups 849.306 789 1.076
Total 868.686 793
Value for
Price
Between
Groups 5.274 4 1.318 1.604 .171
Within
Groups 648.600 789 .822
Total 653.874 793
Reference Between
Groups 5.741 4 1.435 1.375 .241
Within
Groups 823.706 789 1.044
Total 829.447 793
Shopkeepers
suggestions
Between
Groups 4.226 4 1.057 .919 .452
Within
Groups 907.622 789 1.150
Total 911.849 793
Good battery
life
Between
Groups 18.982 4 4.745 6.072 .000
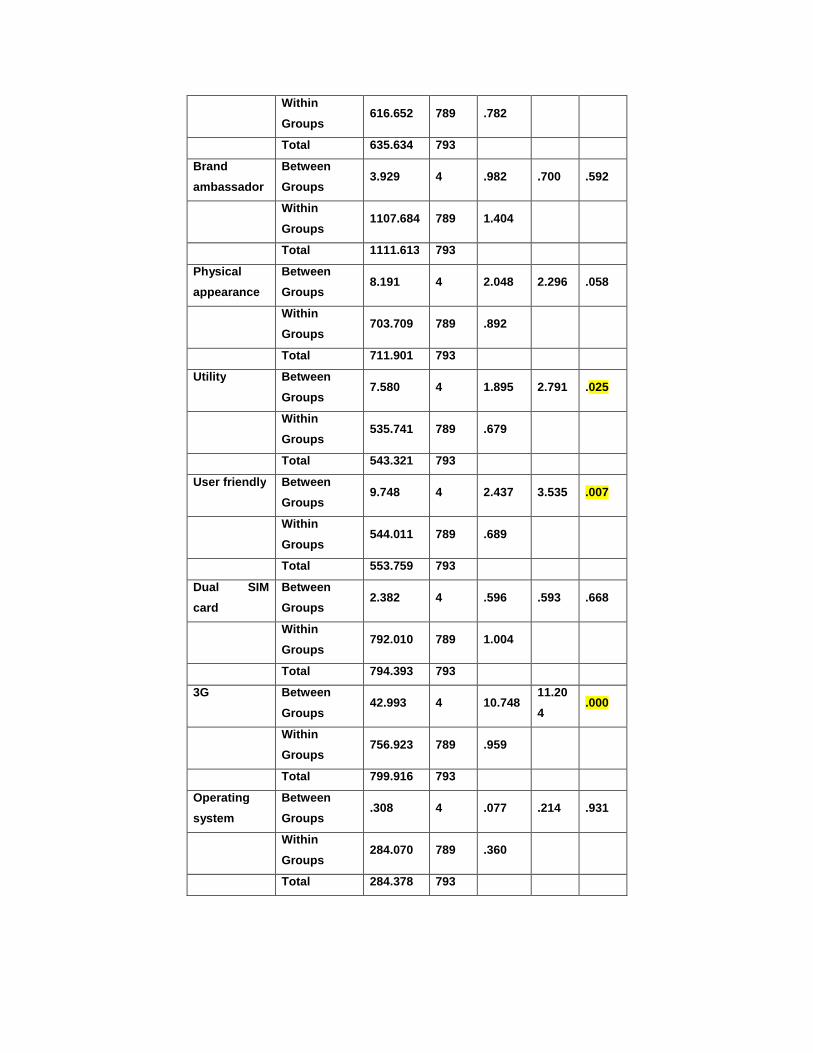
Within
Groups 616.652 789 .782
Total 635.634 793
Brand
ambassador
Between
Groups 3.929 4 .982 .700 .592
Within
Groups 1107.684 789 1.404
Total 1111.613 793
Physical
appearance
Between
Groups 8.191 4 2.048 2.296 .058
Within
Groups 703.709 789 .892
Total 711.901 793
Utility Between
Groups 7.580 4 1.895 2.791 .025
Within
Groups 535.741 789 .679
Total 543.321 793
User friendly Between
Groups 9.748 4 2.437 3.535 .007
Within
Groups 544.011 789 .689
Total 553.759 793
Dual SIM
card
Between
Groups 2.382 4 .596 .593 .668
Within
Groups 792.010 789 1.004
Total 794.393 793
3G Between
Groups 42.993 4 10.748
11.20
4 .000
Within
Groups 756.923 789 .959
Total 799.916 793
Operating
system
Between
Groups .308 4 .077 .214 .931
Within
Groups 284.070 789 .360
Total 284.378 793

The researcher has made an attempt to find the prominent factors which are responsible
for brand choice while Occupation is considered.
For occupation groups the test applied is Analysis of Variance (ANOVA). The first table
gives mean ratings by different Occupation groups. The second table gives significance.
The last column in second table (Sig.) is P-value. If P<= 0.05 the difference between
occupation groups is significant.
Brand name, Good battery life, Utility, User friendly and 3G are significant for purchasing
decision when OCCUPATION is considered as one of the demographic factors.
In other words the respondents give importance to Brand name, Good battery life, Utility,
User friendly and 3G while making purchasing decision when OCCUPATION factor is
considered.

6.3.4 DEMOGRAPHIC FACTOR: INCOME
Rate the factors influencing your purchase decision
Table 6.3.4
Descriptive
Income N Mean
Std.
Deviatio
n
Std.
Error
Brand name Dependent 283 3.73 1.124 .067
Up to 20,000 122 3.52 1.180 .107
20,001-40,000 127 4.01 .913 .081
40,001-60,000 95 4.03 .973 .100
Above 60,000 141 4.01 .866 .073
Total 768 3.83 1.053 .038
Value for Price Dependent 283 3.93 1.012 .060
Up to 20,000 122 3.97 .970 .088
20,001-40,000 127 4.10 .834 .074
40,001-60,000 95 4.07 .775 .080
Above 60,000 141 4.11 .775 .065
Total 768 4.02 .910 .033
Reference Dependent 283 3.36 1.027 .061
Up to 20,000 122 3.27 .996 .090
20,001-40,000 127 3.19 .990 .088
40,001-60,000 95 3.29 1.119 .115
Above 60,000 141 3.30 .991 .083
Total 768 3.30 1.020 .037
Shopkeepers
suggestions
Dependent 283 2.78 1.067 .063
Up to 20,000 122 3.13 .995 .090
20,001-40,000 127 2.91 1.091 .097
40,001-60,000 95 2.79 1.030 .106
Above 60,000 141 2.82 1.154 .097
Total 768 2.87 1.077 .039
Good battery
life
Dependent 283 4.16 .878 .052
Up to 20,000 122 3.97 .979 .089
20,001-40,000 127 4.14 .852 .076
40,001-60,000 95 4.26 .853 .088

Above 60,000 141 4.07 .938 .079
Total 768 4.12 .900 .032
Brand
ambassador
Dependent 283 2.33 1.197 .071
Up to 20,000 122 2.48 1.166 .106
20,001-40,000 127 2.35 1.237 .110
40,001-60,000 95 2.51 1.147 .118
Above 60,000 141 2.38 1.132 .095
Total 768 2.39 1.180 .043
Physical
appearance
Dependent 283 3.92 .944 .056
Up to 20,000 122 3.81 1.007 .091
20,001-40,000 127 3.99 .821 .073
40,001-60,000 95 3.85 .967 .099
Above 60,000 141 3.84 1.009 .085
Total 768 3.89 .950 .034
Utility Dependent 283 4.07 .906 .054
Up to 20,000 122 4.11 .791 .072
20,001-40,000 127 4.31 .663 .059
40,001-60,000 95 4.20 .858 .088
Above 60,000 141 4.25 .785 .066
Total 768 4.16 .828 .030
User friendly Dependent 283 4.10 .853 .051
Up to 20,000 122 4.09 .813 .074
20,001-40,000 127 4.15 .836 .074
40,001-60,000 95 4.20 .858 .088
Above 60,000 141 4.31 .757 .064
Total 768 4.16 .830 .030
Dual SIM card Dependent 283 3.83 1.085 .064
Up to 20,000 122 3.77 .969 .088
20,001-40,000 127 3.86 1.074 .095
40,001-60,000 95 3.97 .831 .085
Above 60,000 141 4.05 .848 .071
Total 768 3.88 .998 .036
3G Dependent 283 3.88 1.005 .060
Up to 20,000 122 3.71 1.102 .100
20,001-40,000 127 3.87 1.054 .094
40,001-60,000 95 4.01 .940 .096
Above 60,000 141 4.06 .888 .075
Total 768 3.90 1.005 .036

Operating
system
Dependent 283 3.10 .521 .031
Up to 20,000 122 3.15 .735 .067
20,001-40,000 127 3.14 .721 .064
40,001-60,000 95 3.16 .532 .055
Above 60,000 141 3.08 .448 .038
Total 768 3.12 .585 .021
Source: Survey
ANOVA Table
Sum of
Squares Df
Mean
Square F Sig.
Brand name Between
Groups 26.629 4 6.657 6.169 .000
Within
Groups 823.366 763 1.079
Total 849.995 767
Value for
Price
Between
Groups 5.019 4 1.255 1.518 .195
Within
Groups 630.793 763 .827
Total 635.812 767
Reference Between
Groups 2.706 4 .676 .648 .628
Within
Groups 796.012 763 1.043
Total 798.717 767
Shopkeeper
s
suggestions
Between
Groups 11.905 4 2.976 2.589 .036
Within
Groups 877.281 763 1.150
Total 889.186 767

Good
battery life
Between
Groups 5.550 4 1.387 1.718 .144
Within
Groups 616.189 763 .808
Total 621.738 767
Brand
ambassador
Between
Groups 3.763 4 .941 .674 .610
Within
Groups 1064.382 763 1.395
Total 1068.145 767
Physical
appearance
Between
Groups 2.739 4 .685 .758 .553
Within
Groups 689.291 763 .903
Total 692.030 767
Utility Between
Groups 7.075 4 1.769 2.604 .035
Within
Groups 518.253 763 .679
Total 525.328 767
User friendly Between
Groups 5.071 4 1.268 1.850 .117
Within
Groups 522.865 763 .685
Total 527.936 767
Dual SIM
card
Between
Groups 7.014 4 1.754 1.769 .133
Within
Groups 756.439 763 .991
Total 763.453 767
3G Between
Groups 9.450 4 2.362 2.356 .052
Within
Groups 765.030 763 1.003
Total 774.479 767
Operating
system
Between
Groups .696 4 .174 .506 .731
Within
Groups 261.991 763 .343
Total 262.686 767

The researcher has made an attempt to find the prominent factors which are responsible
for brand choice while Income is considered.
For Income groups the test applied is Analysis of Variance (ANOVA). The first table gives
mean ratings by different income groups. The second table gives significance. The last
column in second table (Sig.) is P-value. If P<= 0.05 the difference between income groups
is significant.
Thus Brand name, Shopkeepers suggestions and Utility are significant for purchasing
decision when INCOME is considered as one of the demographic factors. In other words
the respondents give importance to Brand name, Shopkeepers suggestions and Utility while
making purchasing decision when INCOME factor is considered.

6.3.5 DEMOGRAPHIC FACTOR: EDUCATION
Rate the factors influencing your purchase decision
Table 6.3.5 Descriptive
Education N Mean
Std.
Deviatio
n
Std.
Error
Brand name Up to 10 th 81 3.62 1.091 .121
Up to 12 th 155 3.70 1.100 .088
Graduate 44 3.84 .963 .145
Post Graduate 336 3.88 1.040 .057
Other Quail 154 4.02 .980 .079
Total 770 3.84 1.047 .038
Value for
Price
Up to 10 th 81 3.98 .922 .102
Up to 12 th 155 3.85 1.005 .081
Graduate 44 3.91 1.007 .152
Post Graduate 336 4.06 .884 .048
Other Quail 154 4.16 .793 .064
Total 770 4.02 .908 .033
Reference Up to 10 th 81 3.28 .965 .107
Up to 12 th 155 3.34 1.028 .083
Graduate 44 3.30 1.047 .158
Post Graduate 336 3.28 1.027 .056
Other Quail 154 3.29 1.027 .083
Total 770 3.29 1.020 .037
Shopkeepers
suggestions
Up to 10 th 81 3.22 1.061 .118
Up to 12th 155 2.85 1.039 .083
Graduate 44 2.82 1.167 .176
Post Graduate 336 2.82 1.057 .058
Other Quail 154 2.84 1.099 .089
Total 770 2.87 1.073 .039
Good battery
life
Up to 10th 81 3.84 1.030 .114
Up to 12th 155 4.12 .914 .073
Graduate 44 3.84 .914 .138
Post Graduate 336 4.19 .818 .045

Other Quail 154 4.19 .920 .074
Total 770 4.12 .895 .032
Brand
ambassador
Up to 10th 81 2.73 1.215 .135
Up to 12th 155 2.50 1.336 .107
Graduate 44 2.39 1.125 .170
Post Graduate 336 2.31 1.133 .062
Other Quail 154 2.31 1.105 .089
Total 770 2.40 1.184 .043
Physical
appearance
Up to 10th 81 3.91 .938 .104
Up to 12th 155 3.81 .992 .080
Graduate 44 3.75 1.037 .156
Post Graduate 336 3.95 .926 .051
Other Quail 154 3.82 .944 .076
Total 770 3.88 .951 .034
Utility Up to 10th 81 3.99 .929 .103
Up to 12th 155 4.04 .867 .070
Graduate 44 3.93 .900 .136
Post Graduate 336 4.22 .817 .045
Other Quail 154 4.32 .675 .054
Total 770 4.16 .827 .030
User friendly Up to 10th 81 3.91 .951 .106
Up to 12th 155 4.06 .803 .065
Graduate 44 4.07 .873 .132
Post Graduate 336 4.16 .839 .046
Other Quail 154 4.33 .750 .060
Total 770 4.15 .836 .030
Dual SIM
card
Up to 10th 81 3.73 1.000 .111
Up to 12th 155 3.90 1.070 .086
Graduate 44 3.82 .922 .139
Post Graduate 336 3.90 1.015 .055
Other Quail 154 3.96 .885 .071
Total 770 3.89 .995 .036
3G Up to 10th 81 3.67 1.037 .115
Up to 12th 155 3.85 .972 .078
Graduate 44 3.59 .996 .150
Post Graduate 336 4.00 1.013 .055
Other Quail 154 3.99 .939 .076

Total 770 3.91 .999 .036
Operating
system
Up to 10th 81 3.05 .773 .086
Up to 12th 155 3.12 .585 .047
Graduate 44 3.18 .657 .099
Post Graduate 336 3.14 .538 .029
Other Quail 154 3.16 .577 .046
Total 770 3.14 .590 .021
Source: Survey
ANOVA Table
Sum of
Squares Df
Mean
Square F Sig.
Brand name Between
Groups 12.361 4 3.090 2.847 .023
Within
Groups 830.309 765 1.085
Total 842.670 769
Value for
Price
Between
Groups 8.386 4 2.097 2.565 .037
Within
Groups 625.359 765 .817
Total 633.745 769
Reference Between
Groups .474 4 .119 .114 .978
Within
Groups 799.193 765 1.045
Total 799.668 769
Shopkeepers
suggestions
Between
Groups 11.422 4 2.855 2.498 .041
Within
Groups 874.330 765 1.143
Total 885.752 769

Good battery
life
Between
Groups 12.332 4 3.083 3.908 .004
Within
Groups 603.435 765 .789
Total 615.768 769
Brand
ambassador
Between
Groups 14.347 4 3.587 2.579 .036
Within
Groups 1064.048 765 1.391
Total 1078.395 769
Physical
appearance
Between
Groups 3.757 4 .939 1.039 .386
Within
Groups 691.724 765 .904
Total 695.481 769
Utility Between
Groups 12.362 4 3.091 4.609 .001
Within
Groups 513.019 765 .671
Total 525.382 769
User friendly Between
Groups 11.056 4 2.764 4.015 .003
Within
Groups 526.653 765 .688
Total 537.709 769
Dual SIM
card
Between
Groups 3.199 4 .800 .808 .520
Within
Groups 757.637 765 .990
Total 760.836 769
3G Between
Groups 13.600 4 3.400 3.453 .008
Within
Groups 753.217 765 .985
Total 766.817 769
Operating
system
Between
Groups .850 4 .212 .609 .657
Within
Groups 267.103 765 .349
Total 267.953 769

The researcher has made an attempt to find the prominent factors which are responsible
for brand choice while Education is considered.
For Education groups the test applied is Analysis of Variance (ANOVA). The first table
gives mean ratings by different education groups. The second table gives significance. The
last column in second table (Sig.) is P-value. If P<= 0.05 the difference between education
groups is significant.
Thus Brand name, Value for Price, Good battery life, Brand ambassador, Shopkeepers
suggestions, Utility, User friendly and 3G are significant for purchasing decision when
EDUCATION is considered as one of the demographic factors.

6.4 Factors Influencing Switching Decision
6.4.1 DEMOGRAPHIC FACTOR: GENDER
Reasons for changing current mobile phone - influencing your switching decision
Table 6.4.1
Group Statis tics
Gender N Mean
Std.
Deviation
Std.
Error
Mean
Brand name Male 361 2.93 1.246 .066
Female 267 2.86 1.217 .074
No value Male 358 3.01 1.157 .061
Female 265 2.86 1.172 .072
Ref Male 355 2.82 1.030 .055
Female 263 2.86 1.155 .071
Suggestion Male 360 2.54 1.057 .056
Female 262 2.54 1.092 .067
Poor
features
Male 358 3.05 1.236 .065
Female 262 2.91 1.258 .078
Battery Male 359 3.31 1.290 .068
Female 266 3.23 1.282 .079
Brand amb Male 353 2.35 1.172 .062
Female 261 2.27 1.118 .069
Appearance Male 358 2.88 1.233 .065
Female 261 2.81 1.174 .073
Ltd utility Male 355 3.07 1.230 .065
Female 262 3.02 1.187 .073
Small
Display
Male 359 3.13 1.290 .068
Female 266 3.10 1.288 .079
Not user
friendly
Male 356 2.84 1.296 .069
Female 260 2.73 1.188 .074
No Dual
sum
Male 358 2.57 1.274 .067
Female 264 2.51 1.230 .076

for 3G Male 355 2.98 1.269 .067
Female 261 2.84 1.287 .080
O/S Male 355 2.99 1.222 .065
Female 260 2.74 1.271 .079
No ext mem Male 352 2.92 1.262 .067
Female 262 2.74 1.236 .076
No social
net
Male 357 2.84 1.263 .067
Female 261 2.66 1.292 .080
No internet Male 354 2.84 1.230 .065
Female 258 2.63 1.270 .079
No games Male 351 2.61 1.175 .063
Female 263 2.50 1.198 .074
No
multimedia
Male 354 2.77 1.285 .068
Female 258 2.62 1.258 .078
No digicam Male 353 2.85 1.328 .071
Female 258 2.72 1.244 .077
No WAP Male 348 2.66 1.254 .067
Female 262 2.55 1.179 .073
No IM Male 356 2.79 1.323 .070
Female 262 2.69 1.283 .079
Poor App Male 356 2.98 1.262 .067
Female 263 2.90 1.240 .076
No Wifi &
Bluetooth
Male 351 2.89 1.376 .073
Female 261 2.69 1.332 .082
Other Male 112 2.75 1.305 .123
Female 64 2.98 1.291 .161
Source: Survey
Independent Samples Test
t-test for Equality of Means
T do
Sig. (2-
tailed)
Sig. (1-
tailed)
Brand name .696 626 .487 0.2435
No value 1.580 621 .115 0.0575

Ref -.410 526.407 .682 0.341
Suggestion .028 620 .977 0.4885
Poor features 1.364 618 .173 0.0865
Battery .785 623 .433 0.2165
Brand amb .825 612 .410 0.205
Appearance .755 617 .451 0.2255
Ltd utility .559 615 .576 0.288
Small Display .291 623 .771 0.3855
Not user
friendly 1.107 614 .269 0.1345
No Dual sum .574 620 .566 0.283
for 3G 1.293 614 .197 0.0985
O/S 2.439 613 .015 0.0075
No ext mem 1.773 612 .077 0.0385
No social net 1.709 616 .088 0.044
No internet 2.068 610 .039 0.0195
No games 1.145 612 .253 0.1265
No multimedia 1.384 610 .167 0.0835
No digicam 1.217 609 .224 0.112
No WAP 1.113 608 .266 0.133
No IM .900 616 .369 0.1845
Poor App .713 617 .476 0.238
No Wifi &
Bluetooth 1.812 610 .070 0.035
Other -1.151 174 .251 0.1255

The researcher has made an attempt to find the prominent factors which are responsible
for brand switching while gender is considered. The first table gives mean ratings given to
factors by males and females. The second table gives significance of difference. The
significance is tested at 5% LOS. Thus from the second table the researcher came to a
conclusion that the significant factors which leads to brand switching are O/S, No extended
memory, No social net, No internet, No Wi-Fi & Bluetooth when gender is considered as
the demographic factor.

6.4.2 DEMOGRAPHIC FACTOR: AGE
Reasons for changing current mobile phone - influencing your switching decision
Table 6.2.4
Discriptive
Age N Mean
Std.
Deviation
Std.
Error
95% Confidence
Interval for Mean
Lower
Bound
Upper
Bound
Brand
name
18-28 270 2.84 1.223 .074 2.69 2.99
29-39 168 3.10 1.241 .096 2.91 3.29
40-50 148 2.76 1.187 .098 2.56 2.95
51 &
above 35 2.89 1.388 .235 2.41 3.36
Total 621 2.89 1.233 .049 2.80 2.99
No value 18-28 268 2.91 1.172 .072 2.77 3.05
29-39 169 2.95 1.151 .089 2.77 3.12
40-50 145 2.97 1.154 .096 2.78 3.16
51 &
above 34 2.88 1.200 .206 2.46 3.30
Total 616 2.93 1.161 .047 2.84 3.02
Ref 18-28 266 2.81 1.167 .072 2.67 2.95
29-39 164 2.86 1.008 .079 2.70 3.02
40-50 147 2.77 1.021 .084 2.60 2.94
51 &
above 34 3.03 1.058 .182 2.66 3.40
Total 611 2.83 1.085 .044 2.74 2.91
Suggestion 18-28 266 2.47 1.106 .068 2.34 2.61
29-39 167 2.57 1.073 .083 2.40 2.73
40-50 147 2.57 .993 .082 2.41 2.73
51 &
above 35 2.63 1.060 .179 2.26 2.99
Total 615 2.53 1.067 .043 2.45 2.62
Poor
features
18-28 267 2.96 1.277 .078 2.80 3.11
29-39 166 3.07 1.227 .095 2.88 3.25
40-50 145 2.97 1.204 .100 2.77 3.16
51 &
above 35 2.86 1.309 .221 2.41 3.31

Total 613 2.98 1.246 .050 2.88 3.08
Battery 18-28 269 3.28 1.308 .080 3.13 3.44
29-39 165 3.37 1.246 .097 3.18 3.56
40-50 149 3.19 1.272 .104 2.99 3.40
51 &
above 35 3.11 1.388 .235 2.64 3.59
Total 618 3.28 1.287 .052 3.17 3.38
Brand
amb
18-28 264 2.32 1.166 .072 2.18 2.46
29-39 163 2.30 1.177 .092 2.12 2.48
40-50 146 2.30 1.110 .092 2.12 2.48
51 &
above 34 2.29 1.115 .191 1.90 2.68
Total 607 2.31 1.150 .047 2.22 2.40
Appearan
ce
18-28 265 2.85 1.216 .075 2.70 2.99
29-39 166 2.90 1.239 .096 2.71 3.09
40-50 147 2.85 1.149 .095 2.66 3.04
51 &
above 34 2.59 1.158 .199 2.18 2.99
Total 612 2.85 1.203 .049 2.75 2.94
Ltd utility 18-28 268 3.01 1.242 .076 2.86 3.16
29-39 163 3.18 1.151 .090 3.01 3.36
40-50 145 3.01 1.181 .098 2.81 3.20
51 &
above 34 2.79 1.366 .234 2.32 3.27
Total 610 3.04 1.212 .049 2.95 3.14
Small
Display
18-28 269 3.11 1.282 .078 2.96 3.27
29-39 166 3.31 1.259 .098 3.11 3.50
40-50 149 2.95 1.278 .105 2.74 3.15
51 &
above 34 2.82 1.403 .241 2.33 3.31
Total 618 3.11 1.287 .052 3.01 3.21
Not user
friendly
18-28 266 2.78 1.276 .078 2.63 2.94
29-39 165 2.87 1.235 .096 2.68 3.06
40-50 145 2.78 1.199 .100 2.58 2.98
51 &
above 33 2.42 1.251 .218 1.98 2.87

Total 609 2.79 1.246 .050 2.69 2.89
No Dual
sum
18-28 268 2.47 1.276 .078 2.31 2.62
29-39 165 2.73 1.290 .100 2.53 2.93
40-50 147 2.56 1.189 .098 2.36 2.75
51 &
above 35 2.23 1.031 .174 1.87 2.58
Total 615 2.54 1.251 .050 2.45 2.64
for 3G 18-28 264 3.00 1.320 .081 2.84 3.16
29-39 164 2.82 1.264 .099 2.62 3.01
40-50 146 2.90 1.228 .102 2.70 3.10
51 &
above 35 2.86 1.264 .214 2.42 3.29
Total 609 2.92 1.279 .052 2.82 3.02
O/S 18-28 264 2.86 1.242 .076 2.71 3.01
29-39 166 2.91 1.259 .098 2.72 3.10
40-50 144 2.81 1.236 .103 2.60 3.01
51 &
above 34 3.03 1.291 .221 2.58 3.48
Total 608 2.87 1.246 .051 2.77 2.97
No ext
memory
18-28 265 2.75 1.223 .075 2.61 2.90
29-39 165 2.90 1.236 .096 2.71 3.09
40-50 145 2.89 1.308 .109 2.68 3.10
51 &
above 33 2.88 1.409 .245 2.38 3.38
Total 608 2.83 1.256 .051 2.73 2.93
No social
net
18-28 264 2.80 1.300 .080 2.64 2.96
29-39 165 2.69 1.277 .099 2.49 2.89
40-50 147 2.79 1.223 .101 2.59 2.99
51 &
above 35 2.80 1.324 .224 2.35 3.25
Total 611 2.77 1.275 .052 2.67 2.87
No
internet
18-28 263 2.82 1.265 .078 2.66 2.97
29-39 165 2.79 1.295 .101 2.59 2.99
40-50 143 2.66 1.156 .097 2.47 2.86
51 &
above 34 2.47 1.261 .216 2.03 2.91
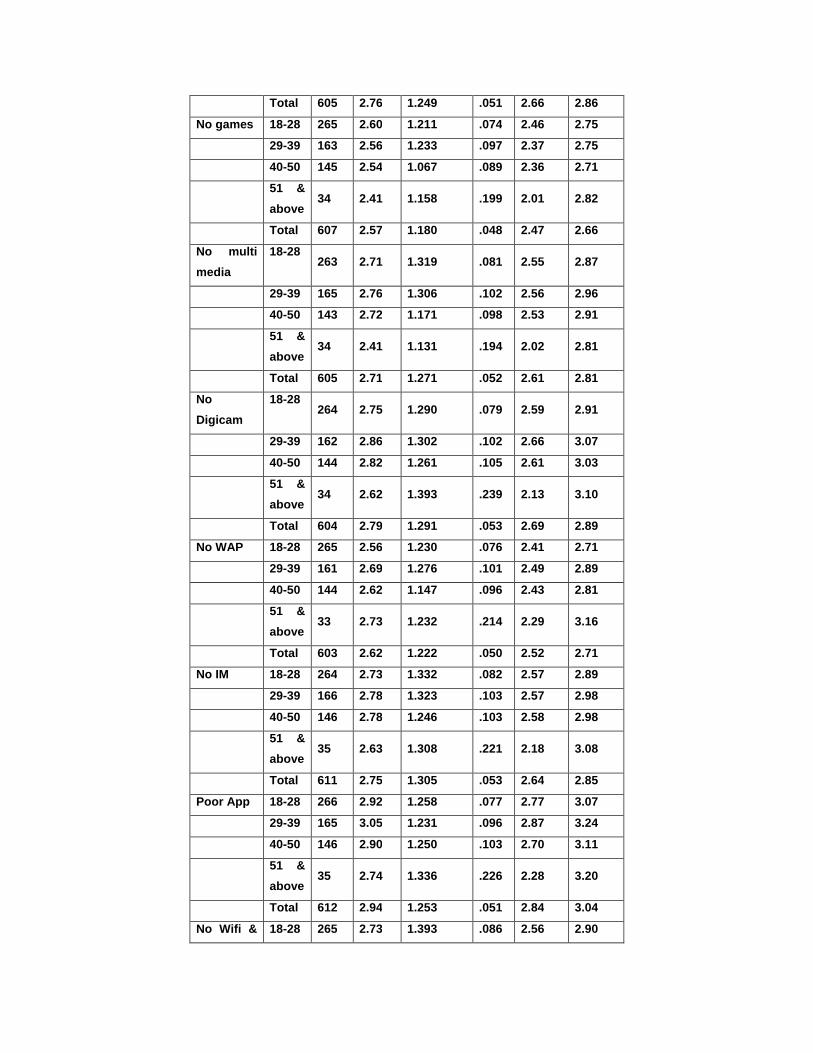
Total 605 2.76 1.249 .051 2.66 2.86
No games 18-28 265 2.60 1.211 .074 2.46 2.75
29-39 163 2.56 1.233 .097 2.37 2.75
40-50 145 2.54 1.067 .089 2.36 2.71
51 &
above 34 2.41 1.158 .199 2.01 2.82
Total 607 2.57 1.180 .048 2.47 2.66
No multi
media
18-28 263 2.71 1.319 .081 2.55 2.87
29-39 165 2.76 1.306 .102 2.56 2.96
40-50 143 2.72 1.171 .098 2.53 2.91
51 &
above 34 2.41 1.131 .194 2.02 2.81
Total 605 2.71 1.271 .052 2.61 2.81
No
Digicam
18-28 264 2.75 1.290 .079 2.59 2.91
29-39 162 2.86 1.302 .102 2.66 3.07
40-50 144 2.82 1.261 .105 2.61 3.03
51 &
above 34 2.62 1.393 .239 2.13 3.10
Total 604 2.79 1.291 .053 2.69 2.89
No WAP 18-28 265 2.56 1.230 .076 2.41 2.71
29-39 161 2.69 1.276 .101 2.49 2.89
40-50 144 2.62 1.147 .096 2.43 2.81
51 &
above 33 2.73 1.232 .214 2.29 3.16
Total 603 2.62 1.222 .050 2.52 2.71
No IM 18-28 264 2.73 1.332 .082 2.57 2.89
29-39 166 2.78 1.323 .103 2.57 2.98
40-50 146 2.78 1.246 .103 2.58 2.98
51 &
above 35 2.63 1.308 .221 2.18 3.08
Total 611 2.75 1.305 .053 2.64 2.85
Poor App 18-28 266 2.92 1.258 .077 2.77 3.07
29-39 165 3.05 1.231 .096 2.87 3.24
40-50 146 2.90 1.250 .103 2.70 3.11
51 &
above 35 2.74 1.336 .226 2.28 3.20
Total 612 2.94 1.253 .051 2.84 3.04
No Wifi & 18-28 265 2.73 1.393 .086 2.56 2.90

Bluetooth
29-39 161 2.94 1.336 .105 2.73 3.15
40-50 144 2.84 1.331 .111 2.62 3.06
51 &
above 35 2.66 1.371 .232 2.19 3.13
Total 605 2.81 1.362 .055 2.70 2.92
Other 18-28 80 2.75 1.317 .147 2.46 3.04
29-39 51 2.96 1.371 .192 2.58 3.35
40-50 35 2.97 1.175 .199 2.57 3.38
51 &
above 7 2.14 1.069 .404 1.15 3.13
Total 173 2.83 1.299 .099 2.64 3.03
Source: Survey
ANOVA
Sum of
Squares do
Mean
Square F Sig.
Brand name Between Groups 10.768 3 3.589 2.376 .069
Within Groups 932.218 617 1.511
Total 942.986 620
No value Between Groups .529 3 .176 .130 .942
Within Groups 828.608 612 1.354
Total 829.136 615
Ref Between Groups 2.128 3 .709 .602 .614
Within Groups 715.483 607 1.179
Total 717.610 610
Suggestion Between Groups 1.686 3 .562 .492 .688
Within Groups 697.445 611 1.141
Total 699.132 614
Poor
features
Between Groups 1.958 3 .653 .419 .740
Within Groups 948.845 609 1.558
Total 950.803 612
Battery Between Groups 3.361 3 1.120 .676 .567
Within Groups 1017.875 614 1.658
Total 1021.236 617
Brand amb Between Groups .049 3 .016 .012 .998
Within Groups 801.341 603 1.329
Total 801.390 606

Appearance Between Groups 2.704 3 .901 .622 .601
Within Groups 880.858 608 1.449
Total 883.562 611
Ltd utility Between Groups 5.876 3 1.959 1.335 .262
Within Groups 889.016 606 1.467
Total 894.892 609
Small
Display
Between Groups 13.239 3 4.413 2.687 .046
Within Groups 1008.497 614 1.643
Total 1021.736 617
Not user
friendly
Between Groups 5.570 3 1.857 1.197 .310
Within Groups 938.679 605 1.552
Total 944.250 608
No Dual
sum
Between Groups 10.665 3 3.555 2.287 .078
Within Groups 949.855 611 1.555
Total 960.520 614
for 3G Between Groups 3.602 3 1.201 .733 .533
Within Groups 991.455 605 1.639
Total 995.057 608
O/S Between Groups 1.750 3 .583 .374 .771
Within Groups 940.985 604 1.558
Total 942.735 607
No ext mem Between Groups 2.967 3 .989 .625 .599
Within Groups 955.255 604 1.582
Total 958.222 607
No social
net
Between Groups 1.340 3 .447 .274 .844
Within Groups 989.659 607 1.630
Total 990.998 610
No internet Between Groups 5.203 3 1.734 1.113 .343
Within Groups 936.592 601 1.558
Total 941.795 604
No games Between Groups 1.310 3 .437 .313 .816
Within Groups 841.869 603 1.396
Total 843.180 606
No
multimedia
Between Groups 3.517 3 1.172 .724 .538
Within Groups 972.440 601 1.618

Total 975.957 604
No digicam Between Groups 2.449 3 .816 .489 .690
Within Groups 1001.847 600 1.670
Total 1004.296 603
No WAP Between Groups 2.154 3 .718 .480 .697
Within Groups 896.354 599 1.496
Total 898.507 602
No IM Between Groups .911 3 .304 .177 .912
Within Groups 1038.274 607 1.711
Total 1039.185 610
Poor App Between Groups 3.804 3 1.268 .807 .490
Within Groups 955.194 608 1.571
Total 958.998 611
No Wifi &
Bluetooth
Between Groups 5.345 3 1.782 .960 .411
Within Groups 1115.029 601 1.855
Total 1120.374 604
Other Between Groups 5.389 3 1.796 1.066 .365
Within Groups 284.750 169 1.685
Total 290.139 172
The researcher has made an attempt to find the prominent factors which are responsible
for brand switching while age is considered. For age groups the test applied is Analysis of
Variance (ANOVA). The first table gives mean ratings by different age groups. The second
table gives significance. The last column in second table (Sig.) is P-value. If P<= 0.05 the
difference between age groups is significant in brand switching. Since p= 0.046 < 0.05 for
Small Display, thus Small Display is significant for brand switching when age is considered
as demographic factor.

6.4.3 DEMOGRAPHIC FACTOR: OCCUPATION
Reasons for changing current mobile phone - influencing your switching decision
Table 6.4.3
Discriptive
Occupation N Mean
Std.
Deviation
Std.
Error
95%
Confidence
Interval for
Mean
Lower
Boun
d
Upper
Boun
d
Brand name Service 137 2.88 1.245 .106 2.67 3.09
Business 116 2.98 1.251 .116 2.75 3.21
Professional 114 2.92 1.198 .112 2.70 3.14
Student 139 2.81 1.219 .103 2.61 3.02
Housewife 122 2.93 1.265 .114 2.71 3.16
Total 628 2.90 1.233 .049 2.80 3.00
No value Service 136 3.01 1.186 .102 2.81 3.22
Business 116 3.03 1.233 .115 2.80 3.25
Professional 111 2.83 1.078 .102 2.63 3.03
Student 138 2.92 1.153 .098 2.73 3.11
Housewife 122 2.91 1.171 .106 2.70 3.12
Total 623 2.94 1.165 .047 2.85 3.03
Ref Service 134 2.96 1.100 .095 2.77 3.15
Business 115 2.90 .986 .092 2.71 3.08
Professional 112 2.81 .991 .094 2.63 3.00
Student 137 2.66 1.166 .100 2.46 2.85
Housewife 120 2.88 1.134 .104 2.67 3.08
Total 618 2.84 1.085 .044 2.75 2.92
Suggestion Service 137 2.67 1.125 .096 2.48 2.86
Business 116 2.63 .965 .090 2.45 2.81
Professional 112 2.53 .958 .091 2.35 2.71
Student 137 2.36 1.117 .095 2.18 2.55
Housewife 120 2.53 1.137 .104 2.33 2.74
Total 622 2.54 1.071 .043 2.46 2.63
Poor
features
Service 136 3.04 1.256 .108 2.82 3.25
Business 115 3.03 1.213 .113 2.81 3.26
Professional 113 3.09 1.214 .114 2.86 3.31

Student 138 2.90 1.280 .109 2.68 3.11
Housewife 118 2.92 1.265 .116 2.68 3.15
Total 620 2.99 1.246 .050 2.89 3.09
Battery Service 135 3.35 1.329 .114 3.12 3.57
Business 118 3.31 1.245 .115 3.09 3.54
Professional 113 3.13 1.271 .120 2.90 3.37
Student 138 3.30 1.275 .109 3.08 3.51
Housewife 121 3.29 1.313 .119 3.05 3.53
Total 625 3.28 1.286 .051 3.18 3.38
Brand amb Service 135 2.41 1.224 .105 2.21 2.62
Business 112 2.35 1.105 .104 2.14 2.56
Professional 112 2.28 1.092 .103 2.07 2.48
Student 137 2.26 1.152 .098 2.07 2.46
Housewife 118 2.25 1.163 .107 2.04 2.47
Total 614 2.31 1.149 .046 2.22 2.40
Appearance Service 135 2.83 1.213 .104 2.62 3.04
Business 116 2.91 1.241 .115 2.69 3.14
Professional 113 2.84 1.146 .108 2.63 3.05
Student 136 2.76 1.255 .108 2.55 2.98
Housewife 119 2.92 1.187 .109 2.71 3.14
Total 619 2.85 1.208 .049 2.76 2.95
Ltd utility Service 135 3.02 1.187 .102 2.82 3.22
Business 113 3.14 1.224 .115 2.91 3.37
Professional 113 3.10 1.180 .111 2.88 3.32
Student 137 2.91 1.271 .109 2.69 3.12
Housewife 119 3.10 1.189 .109 2.89 3.32
Total 617 3.05 1.211 .049 2.95 3.14
Small
Display
Service 137 3.11 1.241 .106 2.90 3.32
Business 116 3.05 1.324 .123 2.81 3.30
Professional 115 3.36 1.244 .116 3.13 3.59
Student 137 2.94 1.333 .114 2.72 3.17
Housewife 120 3.15 1.281 .117 2.92 3.38
Total 625 3.12 1.288 .052 3.01 3.22
Not user
friendly
Service 136 2.88 1.238 .106 2.67 3.08
Business 114 2.93 1.302 .122 2.69 3.17
Professional 112 2.84 1.270 .120 2.60 3.08
Student 136 2.63 1.288 .110 2.41 2.84
Housewife 118 2.71 1.148 .106 2.50 2.92

Total 616 2.79 1.252 .050 2.69 2.89
No Dual
sum
Service 137 2.85 1.260 .108 2.63 3.06
Business 116 2.64 1.281 .119 2.40 2.87
Professional 112 2.46 1.114 .105 2.26 2.67
Student 137 2.15 1.222 .104 1.94 2.35
Housewife 120 2.64 1.282 .117 2.41 2.87
Total 622 2.55 1.255 .050 2.45 2.64
for 3G Service 135 2.99 1.258 .108 2.77 3.20
Business 116 3.10 1.288 .120 2.87 3.34
Professional 114 2.89 1.185 .111 2.67 3.11
Student 133 2.88 1.376 .119 2.64 3.12
Housewife 118 2.74 1.250 .115 2.51 2.97
Total 616 2.92 1.277 .051 2.82 3.02
O/S Service 136 2.89 1.239 .106 2.68 3.10
Business 115 3.14 1.235 .115 2.91 3.37
Professional 112 2.84 1.270 .120 2.60 3.08
Student 136 2.83 1.208 .104 2.63 3.04
Housewife 116 2.72 1.277 .119 2.48 2.95
Total 615 2.88 1.248 .050 2.78 2.98
No ext mem Service 134 2.99 1.265 .109 2.78 3.21
Business 114 3.03 1.327 .124 2.78 3.27
Professional 112 2.94 1.195 .113 2.71 3.16
Student 136 2.59 1.195 .103 2.39 2.79
Housewife 118 2.69 1.238 .114 2.46 2.91
Total 614 2.84 1.253 .051 2.74 2.94
No social
net
Service 136 2.84 1.295 .111 2.62 3.06
Business 117 2.88 1.261 .117 2.65 3.11
Professional 112 2.84 1.249 .118 2.61 3.07
Student 135 2.64 1.307 .112 2.42 2.87
Housewife 118 2.64 1.265 .116 2.40 2.87
Total 618 2.77 1.278 .051 2.66 2.87
No internet Service 135 2.81 1.198 .103 2.61 3.02
Business 116 2.88 1.259 .117 2.65 3.11
Professional 112 2.79 1.288 .122 2.55 3.04
Student 133 2.74 1.295 .112 2.52 2.97
Housewife 116 2.51 1.198 .111 2.29 2.73
Total 612 2.75 1.250 .051 2.65 2.85
No games Service 133 2.69 1.188 .103 2.49 2.90

Business 116 2.74 1.128 .105 2.53 2.95
Professional 110 2.55 1.201 .115 2.32 2.77
Student 136 2.46 1.235 .106 2.25 2.67
Housewife 119 2.39 1.143 .105 2.18 2.59
Total 614 2.57 1.185 .048 2.47 2.66
No
multimedia
Service 136 2.90 1.313 .113 2.67 3.12
Business 115 2.80 1.208 .113 2.58 3.02
Professional 112 2.61 1.247 .118 2.37 2.84
Student 134 2.65 1.361 .118 2.42 2.88
Housewife 115 2.56 1.201 .112 2.33 2.78
Total 612 2.71 1.275 .052 2.61 2.81
No digicam Service 134 2.84 1.308 .113 2.62 3.07
Business 114 2.92 1.338 .125 2.67 3.17
Professional 111 2.81 1.297 .123 2.57 3.05
Student 136 2.71 1.312 .112 2.48 2.93
Housewife 116 2.71 1.216 .113 2.48 2.93
Total 611 2.80 1.294 .052 2.69 2.90
No WAP Service 135 2.65 1.266 .109 2.44 2.87
Business 113 2.88 1.237 .116 2.65 3.12
Professional 109 2.57 1.181 .113 2.34 2.79
Student 135 2.42 1.225 .105 2.21 2.63
Housewife 118 2.57 1.166 .107 2.36 2.78
Total 610 2.61 1.223 .050 2.52 2.71
No IM Service 136 2.81 1.297 .111 2.59 3.03
Business 118 2.96 1.310 .121 2.72 3.20
Professional 113 2.60 1.257 .118 2.37 2.84
Student 134 2.59 1.333 .115 2.36 2.82
Housewife 117 2.78 1.314 .121 2.54 3.02
Total 618 2.75 1.306 .053 2.64 2.85
Poor App Service 136 3.01 1.202 .103 2.80 3.21
Business 115 3.09 1.315 .123 2.84 3.33
Professional 112 2.83 1.215 .115 2.60 3.06
Student 137 2.80 1.265 .108 2.59 3.02
Housewife 119 3.02 1.262 .116 2.79 3.25
Total 619 2.95 1.252 .050 2.85 3.05
No Wifi &
Bluetooth
Service 133 2.98 1.323 .115 2.75 3.20
Business 113 2.94 1.397 .131 2.68 3.20
Professional 111 2.75 1.352 .128 2.49 3.00

Student 136 2.62 1.420 .122 2.38 2.86
Housewife 119 2.77 1.292 .118 2.54 3.01
Total 612 2.81 1.360 .055 2.70 2.92
Other Service 50 2.92 1.291 .183 2.55 3.29
Business 39 2.54 1.189 .190 2.15 2.92
Professional 25 3.12 1.364 .273 2.56 3.68
Student 36 2.50 1.320 .220 2.05 2.95
Housewife 26 3.31 1.258 .247 2.80 3.82
Total 176 2.84 1.301 .098 2.64 3.03
Source: Survey
ANOVA
Sum of
Squares Df
Mean
Square F Sig.
Brand name Between
Groups 2.121 4 .530 .347 .846
Within Groups 951.758 623 1.528
Total 953.879 627
No value Between
Groups 3.148 4 .787 .578 .678
Within Groups 840.772 618 1.360
Total 843.920 622
Ref Between
Groups 7.194 4 1.799 1.534 .191
Within Groups 718.625 613 1.172
Total 725.819 617
Suggestion Between
Groups 7.511 4 1.878 1.644 .162
Within Groups 704.817 617 1.142
Total 712.328 621
Poor
features
Between
Groups 3.435 4 .859 .552 .698
Within Groups 957.524 615 1.557
Total 960.960 619
Battery Between
Groups 3.261 4 .815 .491 .742
Within Groups 1028.739 620 1.659
Total 1032.000 624
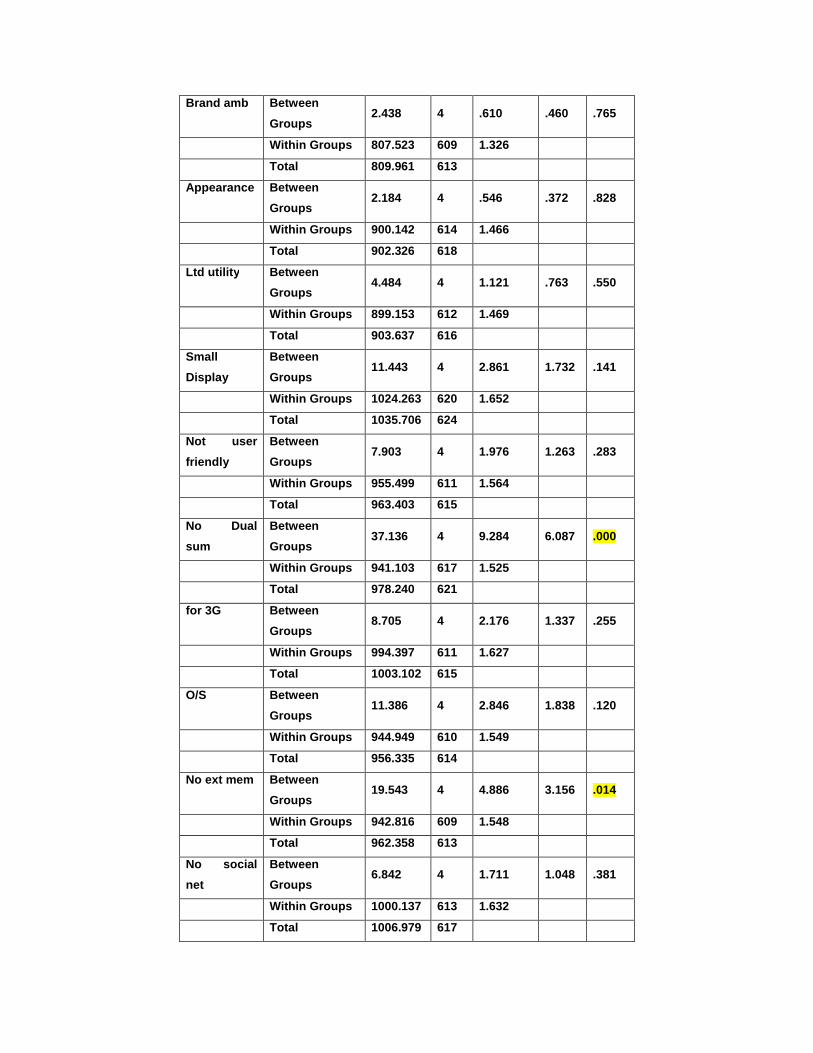
Brand amb Between
Groups 2.438 4 .610 .460 .765
Within Groups 807.523 609 1.326
Total 809.961 613
Appearance Between
Groups 2.184 4 .546 .372 .828
Within Groups 900.142 614 1.466
Total 902.326 618
Ltd utility Between
Groups 4.484 4 1.121 .763 .550
Within Groups 899.153 612 1.469
Total 903.637 616
Small
Display
Between
Groups 11.443 4 2.861 1.732 .141
Within Groups 1024.263 620 1.652
Total 1035.706 624
Not user
friendly
Between
Groups 7.903 4 1.976 1.263 .283
Within Groups 955.499 611 1.564
Total 963.403 615
No Dual
sum
Between
Groups 37.136 4 9.284 6.087 .000
Within Groups 941.103 617 1.525
Total 978.240 621
for 3G Between
Groups 8.705 4 2.176 1.337 .255
Within Groups 994.397 611 1.627
Total 1003.102 615
O/S Between
Groups 11.386 4 2.846 1.838 .120
Within Groups 944.949 610 1.549
Total 956.335 614
No ext mem Between
Groups 19.543 4 4.886 3.156 .014
Within Groups 942.816 609 1.548
Total 962.358 613
No social
net
Between
Groups 6.842 4 1.711 1.048 .381
Within Groups 1000.137 613 1.632
Total 1006.979 617

No internet Between
Groups 9.493 4 2.373 1.524 .194
Within Groups 945.257 607 1.557
Total 954.750 611
No games Between
Groups 10.984 4 2.746 1.968 .098
Within Groups 849.910 609 1.396
Total 860.894 613
No
multimedia
Between
Groups 10.075 4 2.519 1.556 .185
Within Groups 982.571 607 1.619
Total 992.645 611
No digicam Between
Groups 4.132 4 1.033 .615 .652
Within Groups 1017.295 606 1.679
Total 1021.427 610
No WAP Between
Groups 13.929 4 3.482 2.349 .053
Within Groups 896.766 605 1.482
Total 910.695 609
No IM Between
Groups 11.570 4 2.893 1.702 .148
Within Groups 1041.545 613 1.699
Total 1053.115 617
Poor App Between
Groups 7.696 4 1.924 1.229 .297
Within Groups 961.545 614 1.566
Total 969.241 618
No Wifi &
Bluetooth
Between
Groups 11.205 4 2.801 1.519 .195
Within Groups 1119.427 607 1.844
Total 1130.632 611
Other Between
Groups 15.671 4 3.918 2.388 .053
Within Groups 280.551 171 1.641
Total 296.222 175
The researcher has made an attempt to find the prominent factors which are responsible
for brand switching while Occupation is considered. For occupation groups the test applied

is Analysis of Variance (ANOVA). The first table gives mean ratings by different
Occupation groups. The second table gives significance. The last column in second table
(Sig.) is P-value. If P<= 0.05 the difference between occupation groups is significant in
brand switching. Since p value for No Dual Sims and no extended memory < 0.05 thus
researcher concludes that No Dual Sims and no extended memory are significant factors
for brand switching when occupation is considered.

6.4.4 DEMOGRAPHIC FACTOR: INCOME
Reasons for changing current mobile phone - influencing your switching decision
Table 6.4.4
Descriptive
Income N Mean
Std.
Deviation
Std.
Error
95% Confidence
Interval for Mean
Lower
Bound
Upper
Bound
Brand
name
Dependent 228 2.83 1.234 .082 2.67 2.99
Up to 20,000 99 2.95 1.240 .125 2.70 3.20
20,001-40,000 98 2.96 1.276 .129 2.70 3.21
40,001-60,000 76 3.05 1.285 .147 2.76 3.35
Above 60,000 108 2.90 1.160 .112 2.68 3.12
Total 609 2.91 1.234 .050 2.81 3.01
No value Dependent 227 2.90 1.169 .078 2.75 3.05
Up to 20,000 99 3.01 1.138 .114 2.78 3.24
20,001-40,000 97 2.92 1.256 .127 2.66 3.17
40,001-60,000 76 3.04 1.148 .132 2.78 3.30
Above 60,000 105 2.93 1.154 .113 2.71 3.16
Total 604 2.94 1.170 .048 2.85 3.04
Ref Dependent 224 2.75 1.168 .078 2.60 2.90
Up to 20,000 97 2.97 1.035 .105 2.76 3.18
20,001-40,000 96 3.00 1.036 .106 2.79 3.21
40,001-60,000 75 2.73 1.070 .124 2.49 2.98
Above 60,000 107 2.85 1.008 .097 2.66 3.04
Total 599 2.84 1.088 .044 2.75 2.93
Suggestion Dependent 225 2.47 1.138 .076 2.32 2.62
Up to 20,000 98 2.55 1.104 .112 2.33 2.77
20,001-40,000 97 2.68 1.076 .109 2.46 2.90
40,001-60,000 76 2.49 1.000 .115 2.26 2.72
Above 60,000 108 2.61 .946 .091 2.43 2.79
Total 604 2.54 1.073 .044 2.46 2.63
Poor
features
Dependent 223 2.90 1.264 .085 2.73 3.06
Up to 20,000 98 2.94 1.242 .125 2.69 3.19
20,001-40,000 98 3.13 1.181 .119 2.90 3.37
40,001-60,000 74 2.86 1.253 .146 2.57 3.16

Above 60,000 108 3.17 1.257 .121 2.93 3.41
Total 601 2.99 1.246 .051 2.89 3.09
Battery Dependent 226 3.28 1.302 .087 3.11 3.45
Up to 20,000 98 3.24 1.378 .139 2.97 3.52
20,001-40,000 96 3.36 1.162 .119 3.13 3.60
40,001-60,000 75 3.00 1.230 .142 2.72 3.28
Above 60,000 111 3.38 1.328 .126 3.13 3.63
Total 606 3.27 1.291 .052 3.17 3.37
Brand amb Dependent 222 2.27 1.156 .078 2.11 2.42
Up to 20,000 97 2.37 1.261 .128 2.12 2.63
20,001-40,000 97 2.41 1.068 .108 2.20 2.63
40,001-60,000 74 2.18 1.139 .132 1.91 2.44
Above 60,000 105 2.39 1.114 .109 2.17 2.61
Total 595 2.32 1.150 .047 2.23 2.41
Appearanc
e
Dependent 222 2.84 1.232 .083 2.68 3.01
Up to 20,000 98 2.85 1.221 .123 2.60 3.09
20,001-40,000 98 3.00 1.227 .124 2.75 3.25
40,001-60,000 76 2.63 1.141 .131 2.37 2.89
Above 60,000 106 2.89 1.190 .116 2.66 3.12
Total 600 2.85 1.211 .049 2.75 2.95
Ltd utility Dependent 223 2.97 1.193 .080 2.82 3.13
Up to 20,000 99 3.06 1.185 .119 2.82 3.30
20,001-40,000 96 3.18 1.196 .122 2.93 3.42
40,001-60,000 74 2.91 1.241 .144 2.62 3.19
Above 60,000 106 3.12 1.255 .122 2.88 3.36
Total 598 3.04 1.209 .049 2.94 3.14
Small
Display
Dependent 224 2.97 1.303 .087 2.80 3.14
Up to 20,000 99 3.18 1.312 .132 2.92 3.44
20,001-40,000 99 3.35 1.163 .117 3.12 3.59
40,001-60,000 76 2.91 1.298 .149 2.61 3.20
Above 60,000 108 3.23 1.323 .127 2.98 3.48
Total 606 3.11 1.292 .052 3.00 3.21
Not user
friendly
Dependent 221 2.64 1.219 .082 2.48 2.80
Up to 20,000 98 2.83 1.316 .133 2.56 3.09
20,001-40,000 96 2.93 1.207 .123 2.68 3.17
40,001-60,000 75 2.88 1.304 .151 2.58 3.18
Above 60,000 107 2.85 1.250 .121 2.61 3.09

Total 597 2.78 1.251 .051 2.68 2.88
No Dual
sum
Dependent 224 2.37 1.271 .085 2.20 2.53
Up to 20,000 99 2.89 1.324 .133 2.62 3.15
20,001-40,000 96 2.73 1.252 .128 2.48 2.98
40,001-60,000 76 2.49 1.160 .133 2.22 2.75
Above 60,000 108 2.53 1.203 .116 2.30 2.76
Total 603 2.55 1.262 .051 2.45 2.65
for 3G Dependent 218 2.84 1.314 .089 2.67 3.02
Up to 20,000 97 3.01 1.319 .134 2.74 3.28
20,001-40,000 98 2.99 1.180 .119 2.75 3.23
40,001-60,000 76 2.87 1.310 .150 2.57 3.17
Above 60,000 108 2.99 1.204 .116 2.76 3.22
Total 597 2.92 1.272 .052 2.82 3.03
O/S Dependent 220 2.83 1.238 .083 2.66 2.99
Up to 20,000 98 2.83 1.252 .126 2.58 3.08
20,001-40,000 97 2.90 1.220 .124 2.65 3.14
40,001-60,000 74 2.95 1.270 .148 2.65 3.24
Above 60,000 107 3.02 1.274 .123 2.77 3.26
Total 596 2.89 1.246 .051 2.79 2.99
No ext
mem
Dependent 221 2.64 1.223 .082 2.48 2.80
Up to 20,000 97 2.81 1.228 .125 2.57 3.06
20,001-40,000 95 3.15 1.255 .129 2.89 3.40
40,001-60,000 75 2.80 1.219 .141 2.52 3.08
Above 60,000 107 3.04 1.303 .126 2.79 3.29
Total 595 2.84 1.254 .051 2.74 2.94
No social
net
Dependent 220 2.65 1.292 .087 2.48 2.83
Up to 20,000 98 2.74 1.254 .127 2.49 3.00
20,001-40,000 96 2.93 1.300 .133 2.66 3.19
40,001-60,000 76 2.70 1.255 .144 2.41 2.98
Above 60,000 109 2.91 1.273 .122 2.67 3.15
Total 599 2.76 1.280 .052 2.66 2.87
No internet Dependent 216 2.65 1.271 .086 2.48 2.82
Up to 20,000 98 2.80 1.166 .118 2.56 3.03
20,001-40,000 95 2.93 1.290 .132 2.66 3.19
40,001-60,000 76 2.68 1.257 .144 2.40 2.97
Above 60,000 108 2.81 1.279 .123 2.56 3.05
Total 593 2.75 1.257 .052 2.65 2.85

No games Dependent 222 2.43 1.196 .080 2.27 2.59
Up to 20,000 97 2.59 1.197 .122 2.35 2.83
20,001-40,000 94 2.76 1.206 .124 2.51 3.00
40,001-60,000 76 2.62 1.188 .136 2.35 2.89
Above 60,000 107 2.57 1.125 .109 2.35 2.79
Total 596 2.56 1.186 .049 2.46 2.65
No
multimedia
Dependent 217 2.60 1.284 .087 2.43 2.77
Up to 20,000 97 2.72 1.344 .136 2.45 2.99
20,001-40,000 96 2.84 1.308 .134 2.58 3.11
40,001-60,000 75 2.72 1.214 .140 2.44 3.00
Above 60,000 108 2.73 1.197 .115 2.50 2.96
Total 593 2.70 1.273 .052 2.60 2.80
No digicam Dependent 220 2.72 1.286 .087 2.55 2.89
Up to 20,000 98 2.71 1.300 .131 2.45 2.97
20,001-40,000 94 3.03 1.307 .135 2.76 3.30
40,001-60,000 75 2.73 1.256 .145 2.44 3.02
Above 60,000 106 2.81 1.339 .130 2.55 3.07
Total 593 2.79 1.298 .053 2.68 2.89
No WAP Dependent 220 2.49 1.184 .080 2.33 2.65
Up to 20,000 97 2.54 1.182 .120 2.30 2.77
20,001-40,000 94 2.76 1.365 .141 2.48 3.03
40,001-60,000 74 2.73 1.185 .138 2.46 3.00
Above 60,000 106 2.72 1.225 .119 2.48 2.95
Total 591 2.61 1.223 .050 2.51 2.71
No IM Dependent 218 2.64 1.337 .091 2.46 2.82
Up to 20,000 98 2.80 1.218 .123 2.55 3.04
20,001-40,000 96 2.75 1.353 .138 2.48 3.02
40,001-60,000 76 2.78 1.302 .149 2.48 3.07
Above 60,000 111 2.86 1.313 .125 2.61 3.10
Total 599 2.74 1.310 .054 2.64 2.85
Poor App Dependent 223 2.89 1.252 .084 2.72 3.05
Up to 20,000 98 2.83 1.193 .121 2.59 3.07
20,001-40,000 95 2.97 1.224 .126 2.72 3.22
40,001-60,000 76 3.14 1.324 .152 2.84 3.45
Above 60,000 108 2.99 1.293 .124 2.74 3.24
Total 600 2.94 1.255 .051 2.84 3.04
No Wifi &
Bluetooth
Dependent 222 2.67 1.374 .092 2.49 2.85
Up to 20,000 97 2.81 1.357 .138 2.54 3.09

20,001-40,000 94 2.82 1.383 .143 2.54 3.10
40,001-60,000 75 3.01 1.236 .143 2.73 3.30
Above 60,000 105 2.87 1.394 .136 2.60 3.14
Total 593 2.80 1.360 .056 2.69 2.91
Other Dependent 53 2.83 1.369 .188 2.45 3.21
Up to 20,000 39 2.62 1.161 .186 2.24 2.99
20,001-40,000 29 3.10 1.263 .235 2.62 3.58
40,001-60,000 29 3.10 1.448 .269 2.55 3.65
Above 60,000 22 2.64 1.177 .251 2.11 3.16
Total 172 2.85 1.298 .099 2.65 3.04
Source: Survey
ANOVA
Sum of
Squares do
Mean
Square F Sig.
Brand name Between Groups 3.292 4 .823 .539 .707
Within Groups 921.920 604 1.526
Total 925.212 608
No value Between Groups 1.671 4 .418 .304 .876
Within Groups 824.415 599 1.376
Total 826.086 603
Ref Between Groups 6.752 4 1.688 1.430 .223
Within Groups 701.181 594 1.180
Total 707.933 598
Suggestion Between Groups 3.740 4 .935 .812 .518
Within Groups 690.053 599 1.152
Total 693.793 603
Poor features Between Groups 8.709 4 2.177 1.406 .231
Within Groups 923.185 596 1.549
Total 931.894 600
Battery Between Groups 7.709 4 1.927 1.158 .328
Within Groups 999.908 601 1.664
Total 1007.617 605
Brand amb Between Groups 3.794 4 .948 .716 .581
Within Groups 781.171 590 1.324
Total 784.965 594
Appearance Between Groups 5.988 4 1.497 1.021 .396
Within Groups 872.512 595 1.466
Total 878.500 599

Ltd utility Between Groups 4.907 4 1.227 .839 .501
Within Groups 867.208 593 1.462
Total 872.115 597
Small Display Between Groups 15.538 4 3.884 2.349 .053
Within Groups 993.703 601 1.653
Total 1009.241 605
Not user
friendly
Between Groups 8.017 4 2.004 1.283 .276
Within Groups 925.109 592 1.563
Total 933.126 596
No Dual sum Between Groups 22.377 4 5.594 3.572 .007
Within Groups 936.622 598 1.566
Total 958.998 602
for 3G Between Groups 3.256 4 .814 .502 .734
Within Groups 960.352 592 1.622
Total 963.608 596
O/S Between Groups 3.265 4 .816 .524 .718
Within Groups 920.203 591 1.557
Total 923.468 595
No ext mem Between Groups 22.344 4 5.586 3.616 .006
Within Groups 911.488 590 1.545
Total 933.832 594
No social net Between Groups 7.830 4 1.958 1.196 .311
Within Groups 971.980 594 1.636
Total 979.810 598
No internet Between Groups 6.063 4 1.516 .959 .429
Within Groups 929.000 588 1.580
Total 935.062 592
No games Between Groups 7.790 4 1.947 1.388 .237
Within Groups 829.383 591 1.403
Total 837.173 595
No multimedia Between Groups 4.374 4 1.094 .674 .610
Within Groups 954.594 588 1.623
Total 958.968 592
No digicam Between Groups 7.344 4 1.836 1.091 .360
Within Groups 989.884 588 1.683
Total 997.228 592
No WAP Between Groups 7.909 4 1.977 1.325 .259
Within Groups 874.582 586 1.492
Total 882.491 590
No IM Between Groups 3.990 4 .998 .579 .678

Within Groups 1022.901 594 1.722
Total 1026.891 598
Poor App Between Groups 5.406 4 1.352 .858 .489
Within Groups 937.552 595 1.576
Total 942.958 599
No Wifi &
Bluetooth
Between Groups 7.609 4 1.902 1.029 .391
Within Groups 1086.701 588 1.848
Total 1094.310 592
Other Between Groups 6.897 4 1.724 1.024 .396
Within Groups 281.173 167 1.684
Total 288.070 171
The researcher has made an attempt to find the prominent factors which are responsible
for brand switching while Income is considered.
For income groups the test applied is Analysis of Variance (ANOVA). The first table gives
mean ratings by different age groups. The second table gives significance. The last column
in second table (Sig.) is P-value. If P<= 0.05 the difference between income groups is
significant in brand switching.
Since p value for No Dual Sims and no extended memory < 0.05 thus the researcher
concludes that No Dual Sims and no extended memory are significant factors for brand
switching when Income is considered as demographic factors.

6.4.4 DEMOGRAPHIC FACTOR: EDUCATION
Reasons for changing current mobile phone - influencing your switching decision
Table 6.4.5
Descriptive
Education N Mean
Std.
Deviation
Std.
Error
95% Confidence
Interval for Mean
Lower
Bound
Upper
Bound
Brand
name
Up to 10th 70 2.77 1.119 .134 2.50 3.04
Up to 12th 129 2.95 1.207 .106 2.74 3.16
Graduate 38 2.66 1.236 .201 2.25 3.06
Post
Graduate 248 2.92 1.260 .080 2.76 3.08
Other Quail 124 2.96 1.271 .114 2.73 3.19
Total 609 2.90 1.233 .050 2.80 3.00
No value Up to 10th 70 2.93 1.081 .129 2.67 3.19
Up to 12th 129 2.96 1.182 .104 2.76 3.17
Graduate 38 2.89 1.203 .195 2.50 3.29
Post
Graduate 246 2.97 1.169 .075 2.82 3.12
Other Quail 121 2.89 1.196 .109 2.68 3.11
Total 604 2.94 1.166 .047 2.85 3.04
Ref Up to 10th 69 2.71 .909 .109 2.49 2.93
Up to 12th 128 2.73 1.126 .100 2.54 2.93
Graduate 37 2.59 1.092 .180 2.23 2.96
Post
Graduate 243 2.87 1.089 .070 2.73 3.01
Other Quail 122 2.99 1.102 .100 2.79 3.19
Total 599 2.83 1.083 .044 2.74 2.92
Suggestion Up to 10th 70 2.56 1.030 .123 2.31 2.80
Up to 12th 128 2.49 1.079 .095 2.30 2.68
Graduate 37 2.27 .962 .158 1.95 2.59
Post
Graduate 246 2.56 1.141 .073 2.41 2.70
Other Quail 122 2.64 .971 .088 2.47 2.81
Total 603 2.54 1.072 .044 2.46 2.63
Poor
features
Up to 10th 69 2.94 1.235 .149 2.65 3.24

Up to 12th 127 2.94 1.271 .113 2.71 3.16
Graduate 37 2.95 1.104 .182 2.58 3.31
Post
Graduate 245 2.97 1.269 .081 2.81 3.13
Other Quail 123 3.08 1.252 .113 2.86 3.30
Total 601 2.98 1.250 .051 2.88 3.08
Battery Up to 10th 69 3.30 1.287 .155 3.00 3.61
Up to 12th 128 3.23 1.233 .109 3.02 3.45
Graduate 37 3.70 1.077 .177 3.34 4.06
Post
Graduate 249 3.23 1.327 .084 3.07 3.40
Other Quail 123 3.27 1.331 .120 3.03 3.51
Total 606 3.28 1.290 .052 3.17 3.38
Brand amb Up to 10th 69 2.26 1.133 .136 1.99 2.53
Up to 12th 128 2.39 1.172 .104 2.19 2.60
Graduate 36 2.17 1.108 .185 1.79 2.54
Post
Graduate 240 2.25 1.125 .073 2.10 2.39
Other Quail 122 2.37 1.180 .107 2.16 2.58
Total 595 2.30 1.145 .047 2.21 2.39
Appearanc
e
Up to 10th 70 3.00 1.216 .145 2.71 3.29
Up to 12th 126 2.87 1.220 .109 2.66 3.09
Graduate 37 2.86 1.206 .198 2.46 3.27
Post
Graduate 245 2.77 1.200 .077 2.62 2.92
Other Quail 122 2.84 1.233 .112 2.62 3.07
Total 600 2.84 1.211 .049 2.74 2.94
Ltd utility Up to 10th 70 3.10 1.169 .140 2.82 3.38
Up to 12th 127 3.07 1.183 .105 2.86 3.28
Graduate 36 3.06 1.194 .199 2.65 3.46
Post
Graduate 243 2.99 1.216 .078 2.84 3.15
Other Quail 122 3.05 1.265 .115 2.82 3.28
Total 598 3.04 1.209 .049 2.94 3.13
Small
Display
Up to 10th 70 3.09 1.189 .142 2.80 3.37
Up to 12th 127 3.06 1.311 .116 2.82 3.29
Graduate 37 3.00 1.202 .198 2.60 3.40
Post 248 3.12 1.317 .084 2.96 3.29
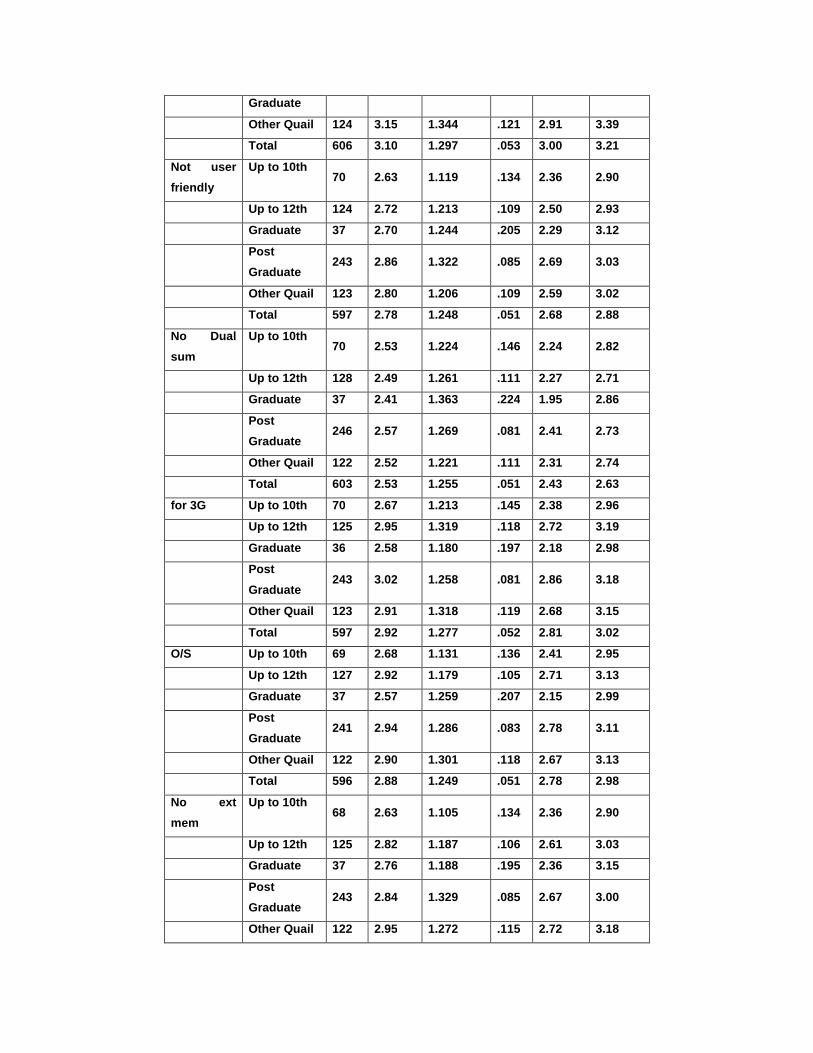
Graduate
Other Quail 124 3.15 1.344 .121 2.91 3.39
Total 606 3.10 1.297 .053 3.00 3.21
Not user
friendly
Up to 10th 70 2.63 1.119 .134 2.36 2.90
Up to 12th 124 2.72 1.213 .109 2.50 2.93
Graduate 37 2.70 1.244 .205 2.29 3.12
Post
Graduate 243 2.86 1.322 .085 2.69 3.03
Other Quail 123 2.80 1.206 .109 2.59 3.02
Total 597 2.78 1.248 .051 2.68 2.88
No Dual
sum
Up to 10th 70 2.53 1.224 .146 2.24 2.82
Up to 12th 128 2.49 1.261 .111 2.27 2.71
Graduate 37 2.41 1.363 .224 1.95 2.86
Post
Graduate 246 2.57 1.269 .081 2.41 2.73
Other Quail 122 2.52 1.221 .111 2.31 2.74
Total 603 2.53 1.255 .051 2.43 2.63
for 3G Up to 10th 70 2.67 1.213 .145 2.38 2.96
Up to 12th 125 2.95 1.319 .118 2.72 3.19
Graduate 36 2.58 1.180 .197 2.18 2.98
Post
Graduate 243 3.02 1.258 .081 2.86 3.18
Other Quail 123 2.91 1.318 .119 2.68 3.15
Total 597 2.92 1.277 .052 2.81 3.02
O/S Up to 10th 69 2.68 1.131 .136 2.41 2.95
Up to 12th 127 2.92 1.179 .105 2.71 3.13
Graduate 37 2.57 1.259 .207 2.15 2.99
Post
Graduate 241 2.94 1.286 .083 2.78 3.11
Other Quail 122 2.90 1.301 .118 2.67 3.13
Total 596 2.88 1.249 .051 2.78 2.98
No ext
mem
Up to 10th 68 2.63 1.105 .134 2.36 2.90
Up to 12th 125 2.82 1.187 .106 2.61 3.03
Graduate 37 2.76 1.188 .195 2.36 3.15
Post
Graduate 243 2.84 1.329 .085 2.67 3.00
Other Quail 122 2.95 1.272 .115 2.72 3.18

Total 595 2.83 1.255 .051 2.73 2.93
No social
net
Up to 10th 69 2.52 1.133 .136 2.25 2.79
Up to 12th 127 2.76 1.281 .114 2.54 2.99
Graduate 37 2.78 1.250 .206 2.37 3.20
Post
Graduate 244 2.74 1.306 .084 2.58 2.91
Other Quail 122 2.85 1.271 .115 2.62 3.08
Total 599 2.75 1.271 .052 2.64 2.85
No internet Up to 10th 68 2.44 1.084 .131 2.18 2.70
Up to 12th 123 2.99 1.284 .116 2.76 3.22
Graduate 37 2.73 1.170 .192 2.34 3.12
Post
Graduate 243 2.65 1.238 .079 2.50 2.81
Other Quail 123 2.84 1.321 .119 2.60 3.07
Total 594 2.74 1.252 .051 2.64 2.84
No games Up to 10th 68 2.24 1.053 .128 1.98 2.49
Up to 12th 127 2.74 1.223 .109 2.53 2.95
Graduate 37 2.51 1.044 .172 2.17 2.86
Post
Graduate 243 2.55 1.185 .076 2.40 2.70
Other Quail 120 2.59 1.206 .110 2.37 2.81
Total 595 2.56 1.180 .048 2.47 2.66
No
multimedia
Up to 10th 68 2.46 1.215 .147 2.16 2.75
Up to 12th 122 2.89 1.287 .117 2.65 3.12
Graduate 37 2.78 1.205 .198 2.38 3.19
Post
Graduate 244 2.62 1.301 .083 2.46 2.79
Other Quail 122 2.79 1.235 .112 2.57 3.01
Total 593 2.70 1.272 .052 2.60 2.80
No digicam Up to 10th 68 2.65 1.194 .145 2.36 2.94
Up to 12th 126 2.83 1.265 .113 2.60 3.05
Graduate 37 2.81 1.221 .201 2.40 3.22
Post
Graduate 241 2.78 1.331 .086 2.61 2.95
Other Quail 121 2.88 1.339 .122 2.64 3.12
Total 593 2.80 1.295 .053 2.69 2.90
No WAP Up to 10th 69 2.38 1.072 .129 2.12 2.63
Up to 12th 126 2.73 1.196 .107 2.52 2.94

Graduate 35 2.66 1.162 .196 2.26 3.06
Post
Graduate 242 2.50 1.230 .079 2.34 2.66
Other Quail 120 2.85 1.301 .119 2.61 3.09
Total 592 2.61 1.223 .050 2.52 2.71
No IM Up to 10th 69 2.59 1.089 .131 2.33 2.86
Up to 12th 124 2.81 1.321 .119 2.58 3.05
Graduate 37 2.62 1.255 .206 2.20 3.04
Post
Graduate 246 2.71 1.329 .085 2.54 2.87
Other Quail 123 2.81 1.351 .122 2.57 3.05
Total 599 2.73 1.300 .053 2.63 2.84
Poor App Up to 10th 69 2.81 1.128 .136 2.54 3.08
Up to 12th 128 3.10 1.196 .106 2.89 3.31
Graduate 37 2.95 1.268 .208 2.52 3.37
Post
Graduate 245 2.85 1.270 .081 2.69 3.01
Other Quail 122 3.03 1.336 .121 2.79 3.27
Total 601 2.94 1.254 .051 2.84 3.04
No Wifi &
Bluetooth
Up to 10th 68 2.76 1.259 .153 2.46 3.07
Up to 12th 127 2.79 1.319 .117 2.56 3.02
Graduate 36 2.83 1.404 .234 2.36 3.31
Post
Graduate 241 2.76 1.372 .088 2.59 2.93
Other Quail 121 2.89 1.407 .128 2.64 3.15
Total 593 2.80 1.354 .056 2.69 2.91
Other Up to 10th 25 2.36 1.036 .207 1.93 2.79
Up to 12th 40 2.93 1.289 .204 2.51 3.34
Graduate 6 3.17 1.169 .477 1.94 4.39
Post
Graduate 72 2.93 1.314 .155 2.62 3.24
Other Quail 26 2.96 1.483 .291 2.36 3.56
Total 169 2.86 1.297 .100 2.66 3.05
Source: Survey
ANOVA

Sum of
Squares do
Mean
Square F Sig.
Brand name Between
Groups 4.189 4 1.047 .687 .601
Within Groups 920.701 604 1.524
Total 924.890 608
No value Between
Groups .654 4 .163 .120 .976
Within Groups 819.432 599 1.368
Total 820.086 603
Ref Between
Groups 7.842 4 1.961
1.67
8 .154
Within Groups 694.128 594 1.169
Total 701.970 598
Suggestion Between
Groups 4.276 4 1.069 .930 .446
Within Groups 687.395 598 1.149
Total 691.672 602
Poor
features
Between
Groups 1.656 4 .414 .264 .901
Within Groups 935.143 596 1.569
Total 936.799 600
Battery Between
Groups 7.482 4 1.871
1.12
4 .344
Within Groups 999.943 601 1.664
Total 1007.426 605
Brand amb Between
Groups 3.079 4 .770 .585 .673
Within Groups 775.671 590 1.315
Total 778.750 594
Appearance Between
Groups 3.106 4 .777 .528 .715
Within Groups 875.534 595 1.471
Total 878.640 599
Ltd utility Between
Groups .951 4 .238 .162 .958
Within Groups 872.240 593 1.471
Total 873.191 597
Small
Display
Between
Groups 1.097 4 .274 .162 .957

Within Groups 1016.560 601 1.691
Total 1017.657 605
Not user
friendly
Between
Groups 3.938 4 .985 .631 .641
Within Groups 923.753 592 1.560
Total 927.692 596
No Dual
sum
Between
Groups 1.137 4 .284 .179 .949
Within Groups 947.105 598 1.584
Total 948.242 602
for 3G Between
Groups 10.994 4 2.749
1.69
3 .150
Within Groups 960.818 592 1.623
Total 971.812 596
O/S Between
Groups 7.526 4 1.882
1.20
7 .307
Within Groups 921.286 591 1.559
Total 928.812 595
No ext mem Between
Groups 4.662 4 1.165 .739 .566
Within Groups 930.508 590 1.577
Total 935.170 594
No social
net
Between
Groups 4.950 4 1.238 .765 .548
Within Groups 960.479 594 1.617
Total 965.429 598
No internet Between
Groups 16.826 4 4.207
2.71
4 .029
Within Groups 912.765 589 1.550
Total 929.591 593
No games Between
Groups 11.509 4 2.877
2.08
3 .082
Within Groups 815.002 590 1.381
Total 826.511 594
No
multimedia
Between
Groups 10.867 4 2.717
1.68
6 .152
Within Groups 947.302 588 1.611
Total 958.169 592
No digicam Between
Groups 2.462 4 .615 .366 .833
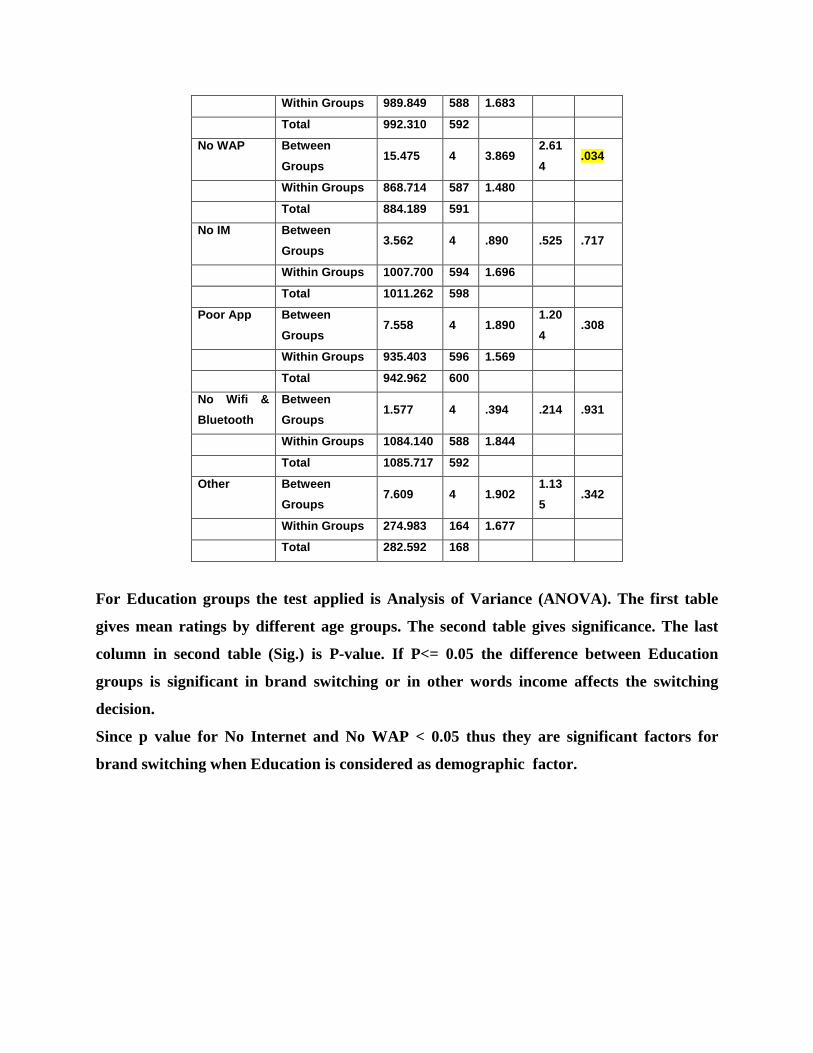
Within Groups 989.849 588 1.683
Total 992.310 592
No WAP Between
Groups 15.475 4 3.869
2.61
4 .034
Within Groups 868.714 587 1.480
Total 884.189 591
No IM Between
Groups 3.562 4 .890 .525 .717
Within Groups 1007.700 594 1.696
Total 1011.262 598
Poor App Between
Groups 7.558 4 1.890
1.20
4 .308
Within Groups 935.403 596 1.569
Total 942.962 600
No Wifi &
Bluetooth
Between
Groups 1.577 4 .394 .214 .931
Within Groups 1084.140 588 1.844
Total 1085.717 592
Other Between
Groups 7.609 4 1.902
1.13
5 .342
Within Groups 274.983 164 1.677
Total 282.592 168
For Education groups the test applied is Analysis of Variance (ANOVA). The first table
gives mean ratings by different age groups. The second table gives significance. The last
column in second table (Sig.) is P-value. If P<= 0.05 the difference between Education
groups is significant in brand switching or in other words income affects the switching
decision.
Since p value for No Internet and No WAP < 0.05 thus they are significant factors for
brand switching when Education is considered as demographic factor.

6.5 Factors influencing your purchase decision (In descending order of
Means) Overall Ratings
The researcher has made an attempt to find out the overall factors influencing the
purchase decision.
Table 6.5
Factors influencing
your purchase decision N Mean Std. Deviation
Utility 794 4.16 .828
User friendly 794 4.15 .836
Good battery life 794 4.12 .895
Value for Price 794 4.01 .908
3G 794 3.91 1.004
Physical appearance 794 3.89 .947
Dual SIM card 794 3.88 1.001
Brand name 794 3.84 1.047
Reference 794 3.30 1.023
Operating system 794 3.13 .599
Shopkeepers suggestions 794 2.87 1.072
Brand ambassador 794 2.39 1.184
Source: Survey

6.6 Preferred features for mobile handset (In descending order of Means)
Overall Ratings
The researcher has made an attempt to find prominent features preferred for buying mobile
handset.
Table 6.6
Preferred features N Mean Std. Deviation
Good Battery 794 4.41 .985
vol.speaker 794 4.06 1.076
Wi-fi,Bluetooth 794 4.02 1.259
HD Camera 794 3.92 1.203
Keypad 794 3.91 1.155
fm/Radio 794 3.91 1.224
Ext.mem 794 3.76 1.208
Conf.call 794 3.67 1.281
O/s 794 3.65 1.273
Multi player 794 3.64 1.299
PC compt 794 3.63 1.316
Sec.option 794 3.58 1.318
IM 794 3.57 1.382
Soc. Net 794 3.46 1.411
Dict & Spell chk 794 3.39 1.368
GPS/GPRS 794 3.38 1.427
3G 794 3.35 1.432
Call Rec. 794 3.23 1.328
WAP enabled 794 3.15 1.379
Games 794 3.11 1.384
Others 794 3.09 .767
Doc Editor 794 2.96 1.414
Games 794 2.77 1.381
Dual Sims 794 2.59 1.389
Source: Survey

6.7 Reasons for changing current mobile phone (In descending order of mean)
Overall Rating
The researcher has made an attempt to find prominent factors for changing mobile
handset.
Table 6.7 Reasons for changing current
mobile phone
N Mean Std. Deviation
Battery
625 3.28 1.286
Small Display 625 3.12 1.288
Ltd utility 617 3.05 1.211
Poor features 620 2.99 1.246
Poor App 619 2.95 1.252
No value 623 2.94 1.165
for 3G 616 2.92 1.277
Brand name 628 2.90 1.233
O/S 615 2.88 1.248
Appearance 619 2.85 1.208
No ext mem 614 2.84 1.253
Ref 618 2.84 1.085
Other 176 2.84 1.301
No Wifi & Bluetooth 612 2.81 1.360
No digicam 611 2.80 1.294
Not user friendly 616 2.79 1.252
No social net 618 2.77 1.278
No internet 612 2.75 1.250
No IM 618 2.75 1.306
No multimedia 612 2.71 1.275
No WAP 610 2.61 1.223
No games 614 2.57 1.185
No Dual sum 622 2.55 1.255
Suggestion 622 2.54 1.071
Brand amb 614 2.31 1.149
Source: Survey