Embed Size (px)
Citation preview

International Journal of Engineering Research and General Science Volume 5, Issue 4, July-August, 2017 ISSN 2091-2730
37 www.ijergs.org
SEISMIC ANALYSES OF SHELL SUPPORTED BRIDGE
Akshai K Sugathan 1, DR. Syed Jalaludeen Shah2
1 PG Scholar, Dept of Civil Engineering, Universal Engineering College, Vallivattom, Thrissur, Kerala, India.
2 Professor and Head, Dept of Civil Engineering, Universal Engineering College, Vallivattom, Thrissur, Kerala, India.
Abstract— This paper demonstrates the performance of shell supported bridge structure resting on different soil conditions when
subjected to seismic analysis using ANSYS 15. As a part of the bridge, shells use all the modes of structural action available to beams,
struts, arches, cables and plates. This paper provides a comparative study on the effects of structural configuration on static and
seismic analyses of pedestrian shell supported bridge resting on pile foundation. The modelling of bridge is prepared on Auto cad 3D
software and was analysed as FEM model using static structural analyses, Modal Analyses and response spectrum analyses. The
parameters considered in the study are thickness of the shell, different soil and contact conditions and their effect on stress as well as
deformation behaviour of structure under static and seismic loading.
Keywords— Shell supported Bridge, Anticlastic Shell, ANSYS 15, Response spectrum analyses, Pile Foundation
INTRODUCTION
The introductions of the concrete shell have made tremendous change in the field of construction. Shells are most commonly
seen as domes, but may also the form of ellipsoid or cylindrical sections or a combination. The shells are commonly used are roots,
nowadays for sports buildings or storage facilities. Anticlastic shells or hyper shells are shell capable of taking large compressive
loads. The advantage of shell structures is that they bring down the dead load and material cost and that it has higher load carrying
capacity. The disadvantage lies in higher cost of foam work and labour.
The confidence in shell structures over the years has led to shells being used to support bridge deck. The Musmeci Shell
supported bridge in Potenza, Italy is an example of a shell supported bridge of an anticlastic shell. Even though shell sections are thin
they have great strength derived from the shape rather than the mass. During earthquakes great damage is known to occur. Though
shell type bridges are very promising due to their overall performances, use of shell supported bridges with confidence requires an
detailed investigation of its performance.
SHELLS BRIDGES AND EARTHQUAKES
The concept of shell supported bridge is a recent innovation. The improved building terminology in structural concrete and steel work
has led designers to use different topology of steel supported bridges. In shell supported bridges the bridge deck slab is supported by
the concrete shell with beam stillness provided below the bridge deck slab. Such bridges have generally been found satisfactory under
the usual loading.
When the soil conditions are not suitable for providing foundation, deep foundations such as piles, piers etc are adopted as foundations
for bridges. Bridges supported on deep foundation need to be analyzed for soil structure interaction effects. Such shell supported
bridges as mentioned above needs studies to ascertain their safety during an earthquake. Earthquakes such as The Great Hanshin
earthquake is an example of the destructive force of an earthquake. The bridge has to be safe from damage, if it is to be adopted.
A. Scope of the Work
The scope of the research work conducted as a part of this project work is as follows;
1. To studying the role of stillness of bridge support by shell structure under static, Modal and seismic analyses by conducting
analyses of three different thickness of shells.
2. To evaluate the effects of soil structure interaction on the pile supported Shell supported bridge by conducting different
analyses in two types of soils with smooth and bonded contact condition.

International Journal of Engineering Research and General Science Volume 5, Issue 4, July-August, 2017 ISSN 2091-2730
38 www.ijergs.org
3. To understand the behavior of a shell supported bridge resting on pile foundation and to evaluate the relative influence of
each component the following analyses were performed separately.
Static structural analyses shell supported bridge structure
Static structural analyses shell supported bridge and pile foundation
Model analyses – shell supported bridge structure
Model analyses – shell supported bridge and pile foundation
R S A of shell supported bridge structure along x, y and z axis.
R S A of shell supported bridge and pile foundation.
B. Objective of the Work
This project work aims at considering the static and dynamic response of a Shell supported bridge. Shells of different
stiffness are considered in the analyses. The seismic analyses of a shell supporting bridge structure resting on pile foundation
considering the soil structure interaction is envisaged. The static analyses, model analyses and response spectrum in different soil
condition and the influence of all these on the structural behaviour of a shell supported bridge resting on the pile is planned.
C. Methodology
This work studies the seismic performance of shell supported bridge using Finite Element Methods (FEM). In order to
understand the relative role of this shell supported bridge deck, pile and soil structure interaction, each part is modelled separately and
analysed statically and dynamically. The investigation is conducted using the FEM Software ANSYS version 15. The response
spectrum of Savannah River Site Disaggregated Seismic Spectra is used for the seismic analyses. The Shell supported bridge was
modelled using AUTOCAD, modal, static and response spectrum analyses were conducted to obtain the response of various
parameters studied.
FINITE ELEMENT MODELLING OF SHELL SUPPORTED BRIDGE
In this project a finite element model of a shell supported bridge resting on pile foundation and surrounding soil is subjected in to
static, modal and dynamic analyses. Details of geometry a finite model of Shell supported bridge, foundation and soil, material
models, material properties, contact options and seismic data adopted are elaborated.
A. Shell Supported Bridge Model
The Shell supported bridge consists of an anticlastic shell which supports the deck slab of the bridge. The dimensions of the
Shell supported bridge considered in this study were fixed with reference to the design of [13]. Figure 1. shows typical Shell supported
bridge geometry.
Fig..1 Shell-supported bridges [13]
The shell supported bridge of a typical type was modelled as a part of optimisation technique by [13]. It consists of different
boundary conditions and the following data as given below.
Uniformly distributed load of 4 kN/m2
Dimension the deck slab = 40 m x 6 m
Height of 7 m from the bottom level which supports the deck and 5.5 m to the bottom shell.
Thickness of deck = 0.15 m
The thickness of the shell varies from 150 mm to 400 mm
As a part of this project 3 different models are developed for the different analyses. The 3 different models having shell
thickness of 150 mm, 200 mm, and 320 mm with a deck slab of thickness 150 mm each. The shell structure was modelled using the
Solid works and Auto Cad 2015 software’s with appropriate boundary conditions provided by [13]. Meshing was carried out using
quadrilateral and mapped mesh elements. The concrete element used here is solid 186. Figure 2 show the three model of bridge used

International Journal of Engineering Research and General Science Volume 5, Issue 4, July-August, 2017 ISSN 2091-2730
39 www.ijergs.org
in this study. The different models were prepared for analysis in ANSYS. The concrete element type used in these analyses is
solid186.
Fig. 2 Shell supported bridge of shell thickness (a) 150 mm, (b) 200 mm, (c) 320 mm
The details of the Shell supported bridge used in this study are given in table I. For seismic analyses of bridge the entire structure has
to be considered. A combination of 3 piles with soil block is modelled with the Shell supported bridge.
Table I Dimension Details of Shell supported bridge
Thickness of
the shell
(m)
Span of bridge
(m)
Width of
bridge (m)
Height of
bridge from
bottom level
(m)
Head level
from the
bottom portion
of shell (m)
Size of beam
stiffeners
along the
width
0.15 40 6 7 5.5 0.15 x 0.25
0.2 40 6 7 5.5 0.15 x 0.25
0.32 40 6 7 5.5 0.15 x 0.25
MODELLING OF PILE FOUNDATION AND SOIL GEOMETRY
The report of soil investigation carried out for design of pile foundation for the pedestrian bridge by [2] is taken. The end bearing piles
are selected from the corresponding bore-log given in the same reference. From the data a group of 3 pile was designed using IS 2911
and IS 456. Figure 3 shows the shell supported bridge with piles. Figure 4 shows the shell supported bridge with piles and soil. Table
II gives details of the pile foundation.
Fig. 3 Shell supported bridge with pile foundation modelled in Autocad 2015
Table II Dimension Details of pile
Diameter of pile 0.85m
Length of pile 8.8m
Depth including pile cap 10.2m
International Journal of Engineering Research and General Science Volume 5, Issue 4, July-August, 2017 ISSN 2091-2730
40 www.ijergs.org
Fig. 4 Shell supported bridge with soil block modelled in AUTOCAD 2015
The thickness of soil below the pile tip is ten times the pile diameter from the pile tip and five times pile diameter from pile cap end
[21]. The size of soil was restricted to small size in order to control number of nodes or elements. Since the structure is large in size,
so the system needs more time and it requires more memory space. In order to overcome this issue an inflation layer was created
between the pile and soil layer. Thus increasing the mesh size of the soil block and providing an inflation layer at the contact region
enhances better soil structure interaction.
PROPERTIES USED FOR SHELL STRUCTURES AND SOIL.
Concrete is defined as multi-linear isotropic material. The plasticity model for concrete is based on the flow theory of plasticity, Von
Mises yield criterion, isotropic hardening and associated flow rule. For concrete in compression, the ANSYS program requires the
yield and ultimate strength of the material property to properly model concrete. The multi-linier isotropic material uses the Von Mises
failure criterion to define the failure of the concrete [5]. The structures assigned for M30 grade concrete properties as tabulated in table
III. The material properties adopted for soil in the present study are given in table IV
Table III Properties of concrete
SI No. Concrete properties Value
1 Modulus of Elasticity, Ec 2.238 × 10⁷ kN/m2
2 Poisson’s Ratio, υ 0.17
3 Density 24 kN/m3
4 Tensile ultimate strength 2.9 × 10³ 2.9kN/m2
5 Compressive ultimate strength 3 × 10⁴ kN/m2
Table IV Properties of Soil
SI
No. Properties
Homogeneous soil condition
Loose sand Medium clay
1 Modulus of Elasticity, Es, (kN/m2) 24 × 103 15 × 103
2 Poisson’s Ratio, υ 0.3 0.45
3 Density (kN/m3) 18 20
4 Cohesion(kN/m2) 0 35
5 Angle of Internal Friction 30° 0
SEISMIC SPECTRUM ANALYSIS
For engineering design of earthquake-resistant structures, response spectra serve the function of characterizing ground
motions as a function of period or frequency. These motions then provide the input parameters that are used in the analyses of
structural response. Because they use the maximum response, the response spectra are an inherently conservative design tool.
Response spectra are described in terms of amplitude, duration, and frequency content, and these are related to source parameters,
travel path, and site conditions. Studies by a number of investigators have shown by statistical analyses that for different magnitudes
the response spectrum values are different for differing periods. The spectrum analysis is mainly done in bridges. The savannah river
site disaggregated seismic spectrum was mainly done in shantou bay bridge and tiger gate bridge. This response spectrum analyses can
International Journal of Engineering Research and General Science Volume 5, Issue 4, July-August, 2017 ISSN 2091-2730
41 www.ijergs.org
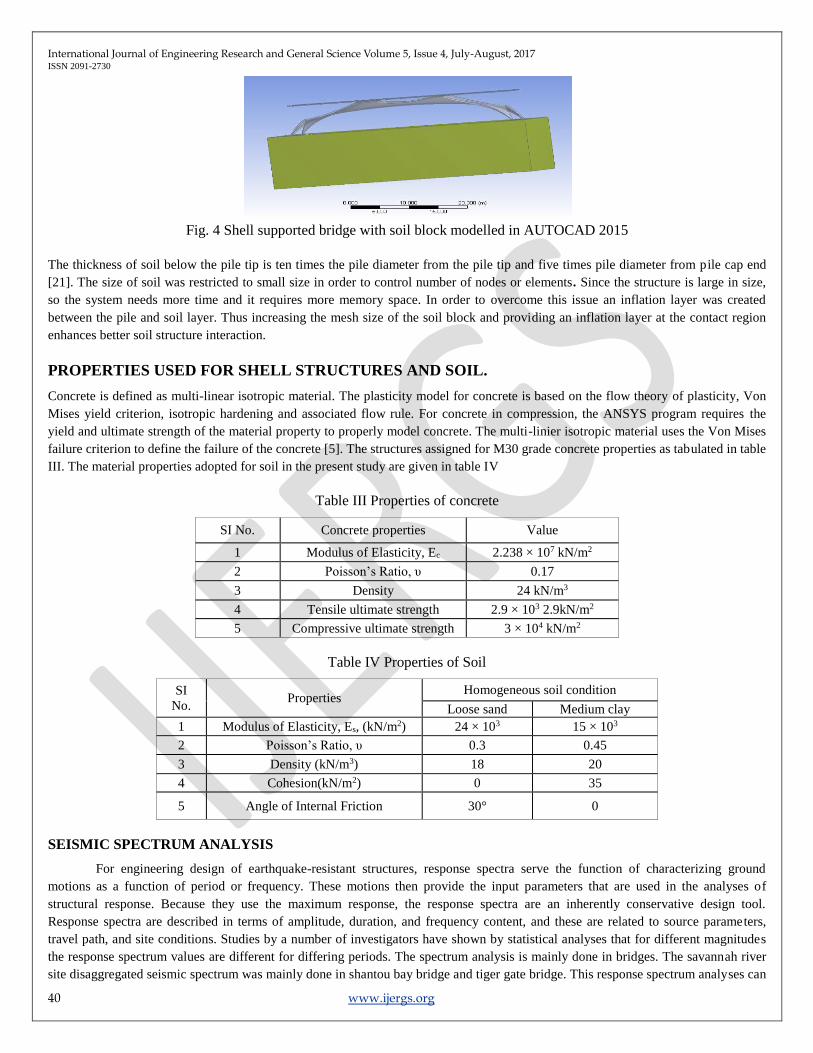
bring out the dynamic behaviour of the structure [22]. The data consist of a maximum acceleration of 0.358 m/s2 with a maximum
frequency up to 50 hz (figure 5).
Fig. 5 Acceleration frequency spectrum of Savannah River site disaggregated seismic spectrum.
RESULTS AND DISCUSSIONS
The result of static analyses, modal analyses and dynamic analyses of Shell supported bridge are discussed. The static
analysis is done in order to determine the deformation characteristics and stress generated on the Shell supported bridge. In this, static
analyses is done on varying the thickness of the shells of thickness of 150 mm, 200 mm, and 320 mm. Modal analyses is the study of
the dynamic properties of structures under vibration excitation. The modal analysis is done in order to determine the natural frequency
of the particular structure. Dynamic characteristic of the bridge are investigated by using the response spectrum analyses. The seismic
behaviour of the Shell supported bridge is conducted to check whether any possibilities for resonance conditions and to determine the
strength and performance of anticlastic shells. Also the analyses were done based on the varying soil properties such as cohesive and
cohesion-less soil and the varying interface roughness such as bonded and smooth contact to simulate the two extreme possibilities of
contact. The following five cases were subjected to static, modal and dynamic analyses.
1) Shell supported bridge, 2) Shell supported bridge with pile foundation with bonded contact in loose sand, 3) Shell supported bridge
with pile foundation with smooth contact in loose sand, 4) Shell supported bridge with pile foundation with bonded contact in medium
clay, 5) Shell supported bridge with pile foundation with smooth contact in medium clay.
A. Static Analyses Of Shell Supported Bridge
Nonlinear static analyses were done on the Shell supported bridge. The analysis was performed on the bridge without soil,
and the structure with pile foundation in different soil conditions. This was done in order to determine the behaviour of the structure.
The load was applied on to the top of the deck surface. The standard earth gravity was also considered in the case of bridge with soil
block. The boundary conditions were appropriately provided. The X, Y, Z directions in analysis is such that Y is vertical and X and Z
are horizontal.
Deformation of Shell supported bridge
The analyses were done under the static load of 4 kN/m2 throughout the deck surface. The load from the deck slab is directly
transferred through the beam stiffeners provided on the upper support of the shell. Static analyses of Shell supported bridge along with
pile foundation in soil block were also done. The static load of 4 kN/m2 along with the standard gravity load is applied. The analyses
were done based on the varying soil properties such as cohesive and cohesion-less soil and the varying interface roughness such as
bonded and smooth contact. The entire structure (i.e., bridge, pile foundation) is merged to a single body. The deformation of shell
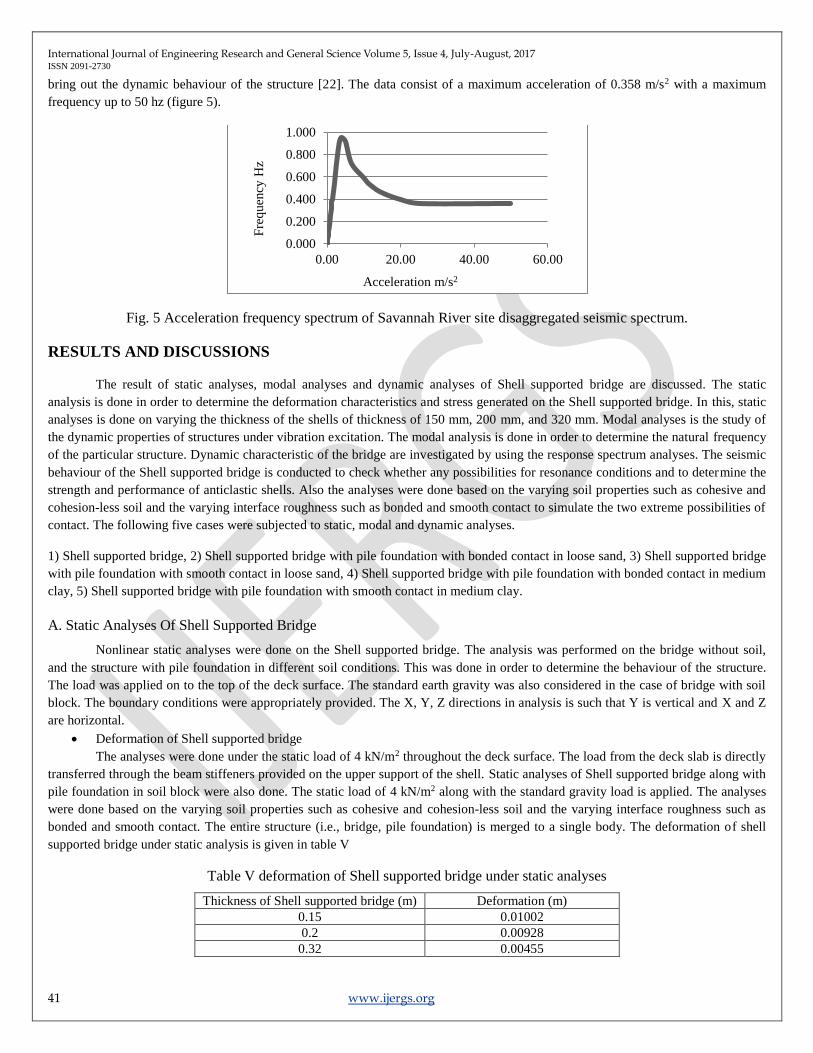
supported bridge under static analysis is given in table V
Table V deformation of Shell supported bridge under static analyses
Thickness of Shell supported bridge (m) Deformation (m)
0.15 0.01002
0.2 0.00928
0.32 0.00455
0.000
0.200
0.400
0.600
0.800
1.000
0.00 20.00 40.00 60.00
Acceleration m/s2
Fre
quen
cyH
z
International Journal of Engineering Research and General Science Volume 5, Issue 4, July-August, 2017 ISSN 2091-2730
42 www.ijergs.org
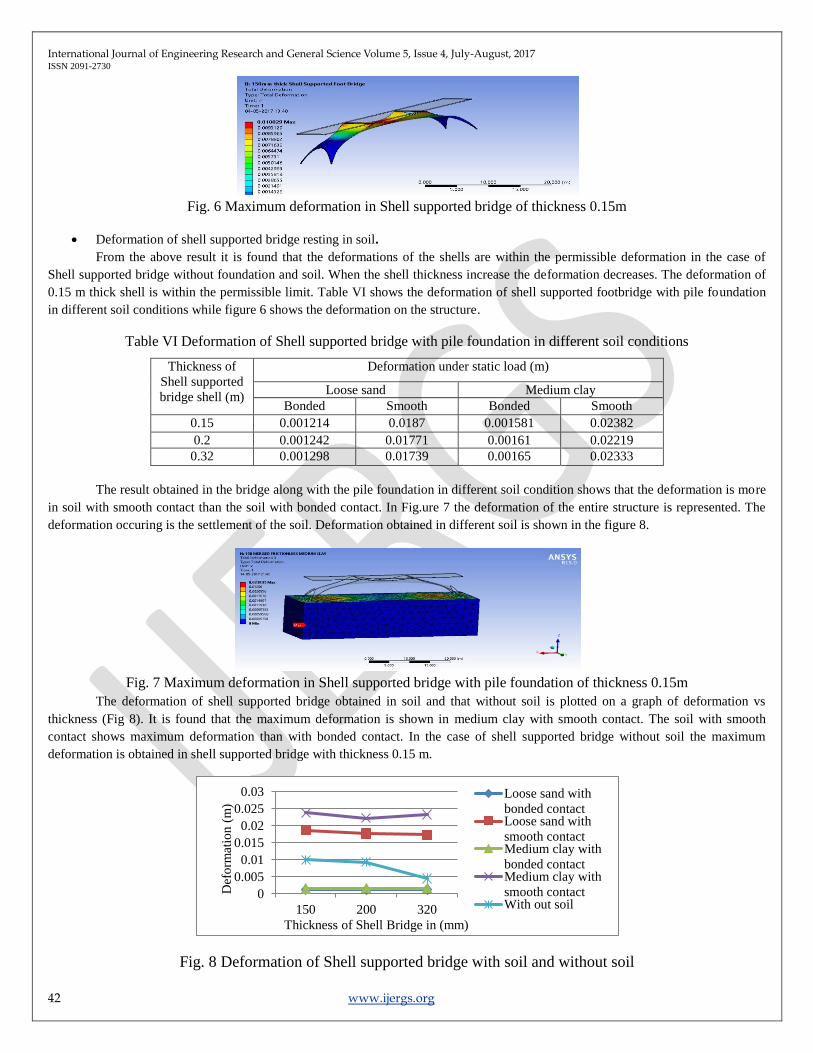
Fig. 6 Maximum deformation in Shell supported bridge of thickness 0.15m
Deformation of shell supported bridge resting in soil.
From the above result it is found that the deformations of the shells are within the permissible deformation in the case of
Shell supported bridge without foundation and soil. When the shell thickness increase the deformation decreases. The deformation of
0.15 m thick shell is within the permissible limit. Table VI shows the deformation of shell supported footbridge with pile foundation
in different soil conditions while figure 6 shows the deformation on the structure.
Table VI Deformation of Shell supported bridge with pile foundation in different soil conditions
Thickness of
Shell supported
bridge shell (m)
Deformation under static load (m)
Loose sand Medium clay
Bonded Smooth Bonded Smooth
0.15 0.001214 0.0187 0.001581 0.02382
0.2 0.001242 0.01771 0.00161 0.02219
0.32 0.001298 0.01739 0.00165 0.02333
The result obtained in the bridge along with the pile foundation in different soil condition shows that the deformation is more
in soil with smooth contact than the soil with bonded contact. In Fig.ure 7 the deformation of the entire structure is represented. The
deformation occuring is the settlement of the soil. Deformation obtained in different soil is shown in the figure 8.
Fig. 7 Maximum deformation in Shell supported bridge with pile foundation of thickness 0.15m
The deformation of shell supported bridge obtained in soil and that without soil is plotted on a graph of deformation vs
thickness (Fig 8). It is found that the maximum deformation is shown in medium clay with smooth contact. The soil with smooth
contact shows maximum deformation than with bonded contact. In the case of shell supported bridge without soil the maximum
deformation is obtained in shell supported bridge with thickness 0.15 m.
Fig. 8 Deformation of Shell supported bridge with soil and without soil
0
0.005
0.01
0.015
0.02
0.025
0.03
150 200 320
Loose sand with
bonded contactLoose sand with
smooth contactMedium clay with
bonded contactMedium clay with
smooth contactWith out soil
Thickness of Shell Bridge in (mm)
Def
orm
atio
n (
m)

International Journal of Engineering Research and General Science Volume 5, Issue 4, July-August, 2017 ISSN 2091-2730
43 www.ijergs.org
Stress in Shell supported bridge
The stresses that developed due to the same static load of 4 kN/m2 on the Shell supported bridge are shown in the table VII.
This study is to determine the stress developed in the shell. The characteristic cylindrical strength was 30000 kN/m2. The structure will
be safe if the stresses developed are within this range. The table VII shows the stress developed on the shell supported bridge.
Table VII Stress on shell supported bridge
Thickness of Shell supported bridge (m) Stress (kN/m2)
0.15 25292
0.2 19200
0.32 17628
From the above result the stress is found to be more in bridge with 0.15 m thick shell. The maximum stress is obtained at the upper
support of the shell. It can be seen that the stress obtained here does not exceeded the actual strength of the concrete. So the structure
is safe.
Fig 9 Maximum stress developed in Shell supported bridge of thickness 0.15m
Shell supported bridge resting in soil
The case of the Shell supported bridge with pile and soil block standard earth gravity is considered. The table VIII shows the
result of Stresses on shell supported bridge with pile foundation in different soil block. The table VIII shows the static analyses result
of bridge with pile foundation embedded in the soil block. The above result shows the variation of stress in soil with bonded and
smooth contact.. From the above result it is found that the stresses obtained in smooth contact are greater than that of stresses obtained
in bonded contact. The stress is found to be more in the shell with thickness 0.15 m. The maximum stress is found to be at the centre
of the shell. These stresses are developed due to the settlement of the supports or foundation.
Table VIII Stress on shell supported bridge with pile foundation in different soil
Thickness of
Shell supported
bridge shell.
Stress under static load (kN/m2)
Loose sand Medium clay
Bonded Smooth Bonded Smooth
0.15 8510.9 8926.6 8516.2 9287.1
0.2 7038 7341.76 7189.3 7541.55
0.32 5446.2 6681.4 5217.2 6121.2
Fig. 10 Stress in Shell supported bridge with pile foundation in different soil and that with shell supported bridge only.
0
5000
10000
15000
20000
25000
30000
150 200 320
Loose sand with
Smooth contact
Loose sand with
bonded contact
Medium clay with
Bonded Contact
Medium Clay with
smooth contactThickness in (mm)
Str
ess
(kN
/m2)
International Journal of Engineering Research and General Science Volume 5, Issue 4, July-August, 2017 ISSN 2091-2730
44 www.ijergs.org
The maximum stress is obtained in the shell supported bridge without soil. The maximum stress is obtained in 0.15 m thick
shell. From the figure 12 the stresses are found to be less in shell supported bridge with soil. In the case of shell supported bridge with
soil, maximum stress is obtained in the soil with smooth contact than that with the bonded contact. It is because the less amount of
friction between the soil and concrete.
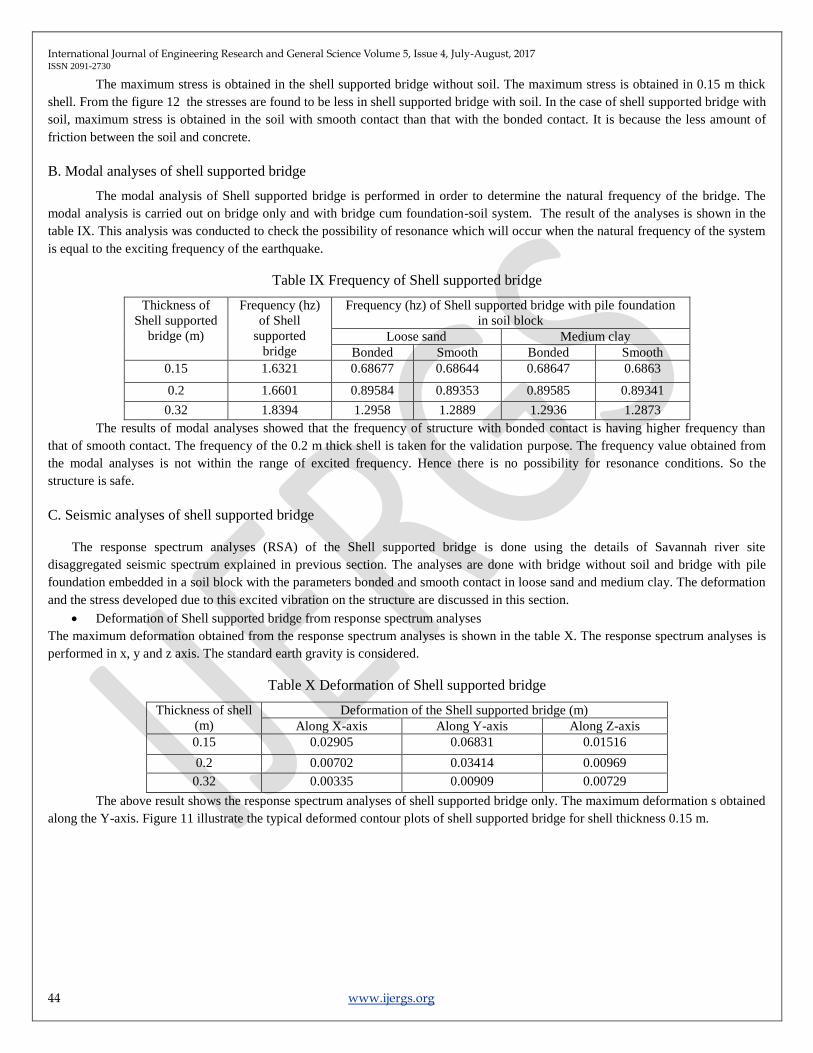
B. Modal analyses of shell supported bridge
The modal analysis of Shell supported bridge is performed in order to determine the natural frequency of the bridge. The
modal analysis is carried out on bridge only and with bridge cum foundation-soil system. The result of the analyses is shown in the
table IX. This analysis was conducted to check the possibility of resonance which will occur when the natural frequency of the system
is equal to the exciting frequency of the earthquake.
Table IX Frequency of Shell supported bridge
Thickness of
Shell supported
bridge (m)
Frequency (hz)
of Shell
supported
bridge
Frequency (hz) of Shell supported bridge with pile foundation
in soil block
Loose sand Medium clay
Bonded Smooth Bonded Smooth
0.15 1.6321 0.68677 0.68644 0.68647 0.6863
0.2 1.6601 0.89584 0.89353 0.89585 0.89341
0.32 1.8394 1.2958 1.2889 1.2936 1.2873
The results of modal analyses showed that the frequency of structure with bonded contact is having higher frequency than
that of smooth contact. The frequency of the 0.2 m thick shell is taken for the validation purpose. The frequency value obtained from
the modal analyses is not within the range of excited frequency. Hence there is no possibility for resonance conditions. So the
structure is safe.
C. Seismic analyses of shell supported bridge
The response spectrum analyses (RSA) of the Shell supported bridge is done using the details of Savannah river site
disaggregated seismic spectrum explained in previous section. The analyses are done with bridge without soil and bridge with pile
foundation embedded in a soil block with the parameters bonded and smooth contact in loose sand and medium clay. The deformation
and the stress developed due to this excited vibration on the structure are discussed in this section.
Deformation of Shell supported bridge from response spectrum analyses
The maximum deformation obtained from the response spectrum analyses is shown in the table X. The response spectrum analyses is
performed in x, y and z axis. The standard earth gravity is considered.
Table X Deformation of Shell supported bridge
Thickness of shell
(m)
Deformation of the Shell supported bridge (m)
Along X-axis Along Y-axis Along Z-axis
0.15 0.02905 0.06831 0.01516
0.2 0.00702 0.03414 0.00969
0.32 0.00335 0.00909 0.00729
The above result shows the response spectrum analyses of shell supported bridge only. The maximum deformation s obtained
along the Y-axis. Figure 11 illustrate the typical deformed contour plots of shell supported bridge for shell thickness 0.15 m.

International Journal of Engineering Research and General Science Volume 5, Issue 4, July-August, 2017 ISSN 2091-2730
45 www.ijergs.org
Fig. 11 Deformation of bridge with 0.15 m thickness obtained from RSA along X-axis
The maximum deformations along X-axis and Y-axis are found to be at the edges and curves of the shell. In the case of Z-
axis the deformation is found to be at the centre of the anticlastic shell. These deformations are within the limit. Hence the structure is
safe. The table XI shows the result for bridge with the combination of foundation and soil. The foundation is consists of three piles.
Table XI Deformation of Shell supported bridge with pile foundation and soil
Thickness of shell
(m)
Deformation (m) in loose sand Deformation (m) in medium clay
Bonded contact Smooth contact Bonded contact Smooth contact
0.15 0.012835 0.013289 0.049361 0.04943
0.2 0.013308 0.013808 0.014554 0.014638
0.32 0.014274 0.014974 0.01415 0.01425
From the results it can be seen that with bonded contact and smooth contact in sand, the settlement is low, but with bonded
and smooth contact in clay the settlement is high. It is also clear that the smooth contact show poor performance than bonded contact.
Fig. 12 The visualization of deformation in soil under RSA
The settlement is more found to be in soil with smooth contact than the bonded contact. This happens as the bridge can
undergo settlement easily under smooth condition without any resistances. The maximum deformation is found to be in bridge with
shell thickness 0.15 in medium clay with smooth contact. While comparing the deformations with shell supported bridge alone and
shell supported bridge with soil, the maximum deformation is found to be at medium clay soil and thickness of 0.15 m shows
maximum deformation. The deformation is more in smooth contact than in bonded contact cases.
Stress in Shell supported bridge from response spectrum analyses
The maximum stress obtained from the response spectrum analyses is shown in the table XII and XIV. The response spectrum
analysis of Shell supported bridge alone is done in X, Y and Z axis. The result shows that RSA along Z-axis shows higher stress than
the other axis except in the case of 0.15 m thick shell. The stress is found to be more in Y-axis than Z-axis.
Table XII Stress developed in Shell supported bridge
Thickness of shell
(m)
Stress developed on the Shell supported bridge (kN/m2)
Along X-axis Along Y-axis Along Z-axis
0.15 9864.5 22034 21606
0.2 6135 15883 17868
0.32 2957 6251.6 7848.4
The other two models show better result than the 0.15 m. The stress is found to be more in Y-axis than Z-axis. The other two
models show better result than the 0.15 m. The figure 13 shows the stress developed in 0.15m from response spectrum analyses along
X, Y and Z-axis. Figure14 shows the stresses on the shell structure and the piles.
International Journal of Engineering Research and General Science Volume 5, Issue 4, July-August, 2017 ISSN 2091-2730
46 www.ijergs.org
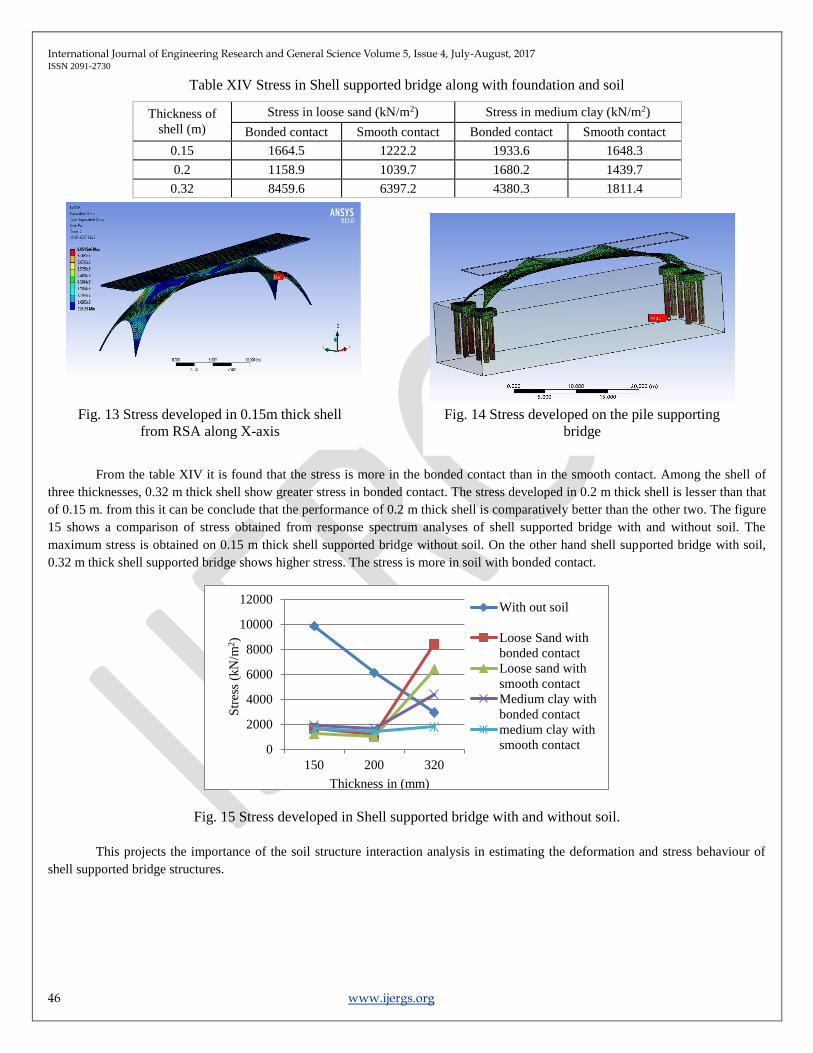
Table XIV Stress in Shell supported bridge along with foundation and soil
Thickness of
shell (m)
Stress in loose sand (kN/m2) Stress in medium clay (kN/m2)
Bonded contact Smooth contact Bonded contact Smooth contact
0.15 1664.5 1222.2 1933.6 1648.3
0.2 1158.9 1039.7 1680.2 1439.7
0.32 8459.6 6397.2 4380.3 1811.4
From the table XIV it is found that the stress is more in the bonded contact than in the smooth contact. Among the shell of
three thicknesses, 0.32 m thick shell show greater stress in bonded contact. The stress developed in 0.2 m thick shell is lesser than that
of 0.15 m. from this it can be conclude that the performance of 0.2 m thick shell is comparatively better than the other two. The figure
15 shows a comparison of stress obtained from response spectrum analyses of shell supported bridge with and without soil. The
maximum stress is obtained on 0.15 m thick shell supported bridge without soil. On the other hand shell supported bridge with soil,
0.32 m thick shell supported bridge shows higher stress. The stress is more in soil with bonded contact.
Fig. 15 Stress developed in Shell supported bridge with and without soil.
This projects the importance of the soil structure interaction analysis in estimating the deformation and stress behaviour of
shell supported bridge structures.
0
2000
4000
6000
8000
10000
12000
150 200 320
With out soil
Loose Sand with
bonded contact
Loose sand with
smooth contact
Medium clay with
bonded contact
medium clay with
smooth contact
Thickness in (mm)
Str
ess
(kN
/m2)
Fig. 14 Stress developed on the pile supporting
bridge
Fig. 13 Stress developed in 0.15m thick shell
from RSA along X-axis

International Journal of Engineering Research and General Science Volume 5, Issue 4, July-August, 2017 ISSN 2091-2730
47 www.ijergs.org
CONCLUSION
The conclusions of this study cannot be generalised as they are applicable only to the specific data used in this study. Modal
analyses of shell supported bridge is done in order to determine the natural frequency, and to compare it with the Savannah River site
earthquake data. It can be concluded that no resonance take place in the shell supported bridge. From the static analysis of shell
supported bridge without the foundation or soil shows that as the thickness of the shell increased the deformation or settlement of the
bridge decreased. However when foundation and soil are taken in to account this is not always true. In shell supported bridge without
soil, the maximum deformation is seen in shell supported bridge of shell thickness 0.15 m. In shell supported bridge with foundation
cum soil system with different contact interface (bonded and smooth), maximum deformation is found to be in soil with smooth
contact. 14. In shell supported bridge without soil, the maximum stress is seen in shell supported bridge of shell thickness 0.15
m. In case of Shell Bridge without soil as the shell thickness increase 0.15 m to 0.2 m (25 % increased) stress decreased by 24%.
When the shell thickness increased from 0.2 m to 0.32 m (37.5 % increased), the deformation decreased by 8.1 %. In shell supported
bridge with foundation cum soil system with different contact interface (bonded and smooth), maximum stress is seen in soil with
smooth contact than that of bonded. From seismic analysis (response spectrum analysis) it is found that the deformation is in shell
supported bridge with shell thickness 0.15 m. The deformation decrease with increase in the shell thickness. By varying the thickness
of the shell of shell supported bridge 0.15 m, 0.2 m, 0.32 m the percentage difference in stresses between bonded and smooth contact
in loose sand are 26.57 %, 10.28 %, 24.3 % respectively. By varying the thickness of the shell of shell supported bridge 0.15 m, 0.2 m,
0.32 m the percentage difference in stresses between bonded and smooth contact in medium clay are 14.7 %, 14.3 %, 58.6 %
respectively. The following are the common conclusions,
The bonded contact shows good soil structure interaction
The deformation decrease with increase in the thickness of shell.
Stresses are more in shell supported bridge with shell thickness 0.15 m
REFERENCES:
[1] Alireza, R. (2004), “Effect of earthquake vertical motion on rc bridge piers.” 13th World Conference on Earthquake
Engineering Vancouver, B.C, Canada August 1-6, Paper No. 3192
[2] Ancy, J., Abhishek, D., Ajith, K. R., Anju, K. S. (2014), “Design of prestressed pedestrian bridge at Aluva.” Transaction on
engineering and sciences, 2(4).
[3] ANSYS (2014), ANSYS Theory Manual, ANSYS User’s Manual, Version 15.0.
[4] ANSYS (2015), Release 15., Theory Reference for the Mechanical workbench and Mechanical applications.
[5] Anu, S. (2016), “Seismic behaviour of hyperbolic paraboloid shell footings.” M.Tech. Thesis, University of Calicut, India.
[6] Asha, J., and Glory, J. (2013), “Influence of Vertical Acceleration on Seismic Response of End-bearing Pile
Foundations.”.American Journal of Engineering Research., 10(4), 1-11.
[7] Briseghella B., Fenu, L. (2004), “Topology Optimization of Bridges Supported by a Concrete Shell.” J. Struct. Eng, 130(6):
961-968
[8] Briseghella, B., Fenu, L., (2016), “Optimization Indexes to Identify the Optimal Design Solution of Shell-Supported
Bridges.” J. Bridge Eng, ASCE, 10.1061.1943-5592.0000838
[9] Briseghella, B., Fenu, L., Feng, Y., Mazzarolo, E., and Zordan, T. (2013a). “Topology optimization of bridges supported by a
concrete shell.” Struct. Eng. Int., 23(3), 285–294.
[10] Briseghella, B., Fenu, L., Lan, C., Mazzarolo, E., and Zordan Z. (2013b) “Application of Topological Optimization to Bridge
Design.” J. Bridge Eng, ASCE 2013, 18(8), 790-800
[11] Duggal, S. K. (2013), “Earthquake Resistant Design of Structures”, Oxford University Press.
[12] Fatahi, B., and Samali, B. (2014), “Seismic performance based design for tall buildings considering soil- pile-
structure interaction.” J. Advances in Soil Dynamics and Foundation Eng., (ASCE), 333-342. Available from,
https://opus.lib.uts.edu.au/handle/10453/34637, (Accessed on 5 May 2017)
[13] Fenu, L., Briseghella, B., Congiu1, E. (2016), “Curved footbridges supported by a shell obtained as an envelope of thrust-
lines.” IABSE Conference – Structural Engineering: Providing Solutions to Global Challenges, Geneva, Switzerland.
[14] IS: 2911 Part IV (1989), Indian Standard for Design and construction of Pile foundations – Code of Practice, Bureau of
Indian Standards, New Delhi.
International Journal of Engineering Research and General Science Volume 5, Issue 4, July-August, 2017 ISSN 2091-2730
48 www.ijergs.org
[15] IS: 456 (2000), Indian Standard for Plain and Reinforced Concrete – Code of Practice, Bureau of Indian Standards, New
Delhi.
[16] Kobe earthquake (1995). Available from, http://si.wsj.net/public/resources/images/BN-
GM006_0116J__H_20150116014614.jpg
[17] Nayak, A. N., and Bandyopadhyay, J. N. (2005), “Free vibration analysis of laminated stiffened shells.” Journal of
Engineering Mechanics, ASCE, 131(1), 100-105.
[18] Potts, D. M. and Zdravkivic, L. (1999). “Finite element analysis in geotechnical engineering.” Thomas Telford Limited.
[19] Sameena, K. (2015), “Seismic behavior of inverted spherical shell foundations.” M. Tech. Thesis, University of Calicut,
India.
[20] Shahbas, A. (2014), “Seismic investigation of conical shell footings.” M. Tech. Thesis, University of Calicut, India.
[21] Sreerag, M. R. (2016), “Assesment of soil structutre interaction and vibration analysis of a tower structure.” M. Tech. Thesis,
University of Calicut, India.
[22] Yang, W. (1996), “Response analysis of Suspension bridges.” Eleventh World Conference on Earthquake Engineering, New
Zealand.