Embed Size (px)
Citation preview

229
6. PHARMACOLOGICAL ACTIVITY OF SYNTHESIZED COMPOUNDS
6.1. Materials and methods:
6.1.1. Chemicals and reagents:
All the analytical grade chemicals were purchased from SD Fine Ltd., Mumbai.
6.1.2. Laboratory animals:
Healthy, adult Wistar albino rats of both sexes (150-220g) were obtained from the
central animal house facility RVS College of Pharmaceutical Sciences, Sulur, C
oimbatore, Tamilnadu. The animals were kept in a well ventilated room and the
animals were exposed to 12 hrs day and night cycle with a temperature between
20±3ºC.The animals were housed in large spacious, hygienic polypropylene cages
during the course of the experimental period. The animals were fed with water and
rat feed ad libitum, supplied by this institution. The animal experiments were
carried out as per Committee for the Purpose of Control and Supervision of
Experiments on Animals (CPCSEA) guidelines and after the Institutional Animal
Ethics Committee (IAEC) (No: IAEC-1013/C/06/CPCSEA) approval.
6.1.3. Acute toxicity studies:
The acute toxicity test was carried out according to the Organization for Economic
Co-operation and Development (OECD) guidelines 423 (ATCM -Acute oral
Toxicity Classic Method). Albino rats of either sex weighing between 150 and 220
g were grouped into 20 groups of six animals each, starved for 24 h with water ad
libitum prior to test. On the day of the experiment animals were administered with
different compounds to different groups in an increasing dose of 10, 20, 100, 200,

230
1000 and 2000 mg/kg body weight orally. The animals were then observed
continuously for 3 h for general behavioral, neurological, autonomic profiles and
then every 30 min for next 3 h and finally for next 24 h or for a total of 14 days.
6.1.4. Evaluation of anti-inflammatory activity170
The albino rats were divided into 22 groups of six animals each as follows.
Group 1: Solvent control 1ml/kg 0.3% (w/v) Carboxy methyl cellulose (CMC).
Group 2: Animals received Indomethacin 200 mg/kg in 0.3% CMC orally.
Group 3-22: Animals received test compounds 6a-e, 7a-j, 8a-e (200 mg/kg) in 0.3%
CMC orally.
In vivo acute anti-inflammatory activity was evaluated using carrageenan-induced
rat paw edema assay model of inflammation for the compounds prepared. Male
albino rats (170–220 g) were fasted with free access to water at least 12 hour prior
to experiments and were divided randomly into 22 groups of six each. Control
group received 0.1 ml of 1% sodium carboxymethyl cellulose (sodium CMC),
standard group received 200 mg/kg of Indometacin and test groups received 200
mg/kg of synthesized compounds. The rats were dosed orally, 1 hr later; a
subplantar injection of 0.1 ml of 1% solution of carrageenan in sterile distilled
water was administered to the left hind footpad of each animal. The paw volume
was measured by using plethysmometer at 0, 1, 2, 3, and 4 hrs after carrageenin
challenge. The percent increase in the edema (paw volume) was calculated by
comparing it with zero minute reading.

231
Table No. 6.1.1. Inhibitory effects of test compounds 6a-e, 7a-j and 8a-e on
carrageenan-induced edema of the hind paw in rats
Values are expressed in terms of mean ± S.E.M (n=6), Values are expressed in terms of mean ± S.E.M,
Significance was calculated by using one way ANOVA with Dunnet’s t-test. The difference in results was
considered significant when p < 0.05. * p < 0.05 Vs control at 200 mg/kg b.w. ** p < 0.01 Vs control at 200
mg/kg b.w, *** p < 0.001 Vs control at 200 mg/kg b.w
S. No. Group Treatment Swelling volume (mL)
1hr 2hr 3hr 4hr
1. Control 1mL/kg 0.43±0.07 1.20±0.00 2.19±0.03 3.91±0.08
2. Indomethacin 200mg/kg 0.44±0.05 0.76±0.00 1.06±0.01 1.66±0.013***
3. 6a 200mg/kg 0.46±0.21 1.18±0.00 1.00±0.01*** 2.35±0.006**
4. 6b 200mg/kg 0.42±0.19 0.67±0.16 1.35±0.16** 1.74±0.003*
5. 6c 200mg/kg 0.47±0.78 0.85±0.01 1.07±0.00 1.76±0.021**
6. 6d 200mg/kg 0.36±0.03 0.91±0.01 1.13±0.00 1.88±0.024*
7. 6e 200mg/kg 0.45±0.02 0.87±0.01 0.86±0.01* 1.94±0.044
8. 7a 200mg/kg 0.44±0.01 1.03±0.01 1.22±0.00* 1.94±0.006*
9. 7b 200mg/kg 0.42±0.00 0.91±0.00 1.12±0.00*** 1.92±0.013**
10. 7c 200mg/kg 0.40±0.01 0.84±0.00 1.03±0.00 1.98±0.013
11. 7d 200mg/kg 0.41±0.02 0.89±0.00 1.00±0.01** 1.89±0.011
12. 7e 200mg/kg 0.42±0.00 0.92±0.01 1.22±0.00 2.05±0.037*
13. 7f 200mg/kg 0.41±0.01 0.85±0.01 1.14±0.00*** 1.72±0.013**
14. 7g 200mg/kg 0.45±0.01 1.12±0.01 1.33±0.00 2.14±0.013
15. 7h 200mg/kg 0.45±0.01 0.80±0.02 1.09±0.00** 1.69±0.030**
16. 7i 200mg/kg 0.43±0.01 0.69±0.00 1.02±0.00*** 1.57±0.017**
17. 7j 200mg/kg 0.43±0.01 0.96±0.00 1.16±0.01 1.92±0.023
18. 8a 200mg/kg 0.43±0.01 0.92±0.02 1.22±0.00 2.12±0.035*
19. 8b 200mg/kg 0.44±0.01 1.01±0.00 1.16±0.01** 2.23±0.046
20. 8c 200mg/kg 0.44±0.01 0.73±0.01 1.09±0.00** 1.67±0.030*
21. 8d 200mg/kg 0.43±0.01 0.93±0.01 1.06±0.00 2.02±0.026
22. 8e 200mg/kg 0.44±0.01 0.94±0.01 1.08±0.00* 2.10±0.020
232
Table No. 6.1.2. Percentage inhibition of test compounds 6a-e, 7a-j and 8a-e on carrageenan-
induced edema of the hind paw in rats
Values are expressed in terms of mean ± S.E.M, Significance was calculated by using one way
ANOVA with Dunnet’s t-test. The difference in results was considered significant when p < 0.05. * p < 0.05 Vs control at 200 mg/kg b.w.
** p < 0.01 Vs control at 200 mg/kg b.w,
*** p < 0.001 Vs
control at 200 mg/kg b.w
S. No. Group Treatment Paw volume(ml) as measured
by mercury displacement at
4 hr
Percentage inhibition
of paw edema at 4 hr
1. Control 1mL/kg 3.91±0.08 -
2. Indomethacin 200mg/kg 1.66±0.013*** 57.54
3. 6a 200mg/kg 2.35±0.006** 39.89
4. 6b 200mg/kg 1.74±0.003* 55.49
5. 6c 200mg/kg 1.76±0.021** 54.98
6. 6d 200mg/kg 1.88±0.024* 51.92
7. 6e 200mg/kg 1.94±0.044 50.38
8. 7a 200mg/kg 1.94±0.006* 50.89
9. 7b 200mg/kg 1.92±0.013** 49.36
10. 7c 200mg/kg 1.98±0.013 50.13
11. 7d 200mg/kg 1.89±0.011 51.66
12. 7e 200mg/kg 2.05±0.037* 47.57
13. 7f 200mg/kg 1.72±0.013** 56.01
14. 7g 200mg/kg 2.14±0.013 45.27
15. 7h 200mg/kg 1.69±0.030** 56.78
16. 7i 200mg/kg 1.57±0.017** 59.85
17. 7j 200mg/kg 1.92±0.023 50.89
18. 8a 200mg/kg 2.12±0.035* 45.78
19. 8b 200mg/kg 2.23±0.046 42.97
20. 8c 200mg/kg 1.67±0.030* 57.28
21. 8d 200mg/kg 2.02±0.026 52..43
22. 8e 200mg/kg 2.10±0.020 46.29

233
The percentage inhibition of edema was calculated at 4th
hour assuming 100%
Inflammation in vehicle group.
% Anti-inflammatory activity = (Vc-Vt / Vc) x 100
Where, Vt- mean increase in paw edema volume in the drug treated group,
Vc - mean increase in paw edema volume in control group.
6.2. Ulcerogenic Activity:
Albino rats of either sex were divided into control, standard and different test
groups of six animals each group (170–250 g). They were starved for 48 h (water
ad libitum) prior to drug administration. Control group received only 0.5%
sodium CMC solution, standard group was orally administered with Indomethacin
in sodium CMC solution and test compounds 7f, 7h, 7i and 8c were administered
orally at the dose of 200 mg/kg and 200 mg/kg, respectively. Six hours later the
animals were sacrificed using excess ether anesthesia. The stomach was excised
carefully, opened along the greater curvature; the luminal contents were removed.
The mucosa was flushed with saline and the stomach pinned on a frog board.
The ulcer index was calculated according to the method171
. The lesions were
counted with the aid of hand lens (10X) and each given a severity rating as
follows
Ulcer Score Descriptive Observation
0 Normal
1 Less than 1mm (Pin point)
2 1-2 mm
3 Greater than 2 mm and above

234
Statistical analysis
Statistical analysis was performed by one-way analysis of variance (ANOVA)
followed by Dunnett’s t-test for multiple comparisons of all compounds in various
pharmacological assays. Datas are expressed as mean ±SEM. The significance of
difference was accepted at p < 0.05.
(a) (b)
(c) (d)

235
(e)
Fig. No. 6.2.1. Ulcerogenic activity of a) compound 7f, b) compound 7h, c)
compound 7i, d) control, and e) Indomethacin
Table 6.2.1. Ulcerogenic activity of selected compounds in comparison with
Indomethacin
S.No Compound Ulcer index (±SEM)
1 Control 0
2 7f 7.33 ± 0.35**
3 7h 10.67 ± 0.14*
4 7i 15.82 ± 0.18*
5 8c 12.76 ± 0.22
6 Indomethacin 31.28 ± 0.48**
The results are expressed as mean ± SEM (n=6). Data analyzed by one-way
ANOVA followed by Dunnett’s t-test. *p< 0.05 significant from control;
**p<0.01 significant from control.

236
6.3. Anti Bacterial Activity:
6.3.1. In-vitro antibacterial activity:
All the twenty newly synthesized compounds were screened for their in-vitro
antibacterial activity against Gram-positive organisms, Bacillus subtilis (ATCC
6633) and Staphylococcus aureus, (ATCC 25923) and Gram-negative organisms,
Escherichia coli (ATCC 25922) and Pseudomonas aeruginosa (ATCC 27853))
by cup-plate method172
. Antimicrobial activity is measured in vitro in order to
determine a) the potency of an antibacterial agent in solution b) the sensitivity of a
given microorganism to know concentrations of the synthesized drug.
6.3.2. Procedure for In-vitro antibacterial study:
The in-vitro antibacterial activity of the synthesized compounds was evaluated
against two gram positive and two gram negative bacterias. N, N –Dimethyl
sulfoxide (DMSO) were used to prepare stock solution of standard and
synthesized drugs (0.5 mg/ml). Normal saline was used to prepare inoculum of
the bacteria to be used for in vitro antimicrobial study. In order to ensure that the
solvent had no effect on bacteria growth, an inoculated control test was performed
with only DMSO and found inactive in culture media.
6.3.3. Cup plate method:
Cup-plate method is used for the study of antimicrobial activity. A suspension of
the test organism was well mixed with 25 ml of sterile liquid nutrient agar media,
at a temperature between 40-500 C and poured immediately in to a pre-sterilized
petri-dishes. After congealing the seeded agar was punched out to make holes (10
mm in diameter) at spaced out positions on the petri dish. The cavity was filled
237
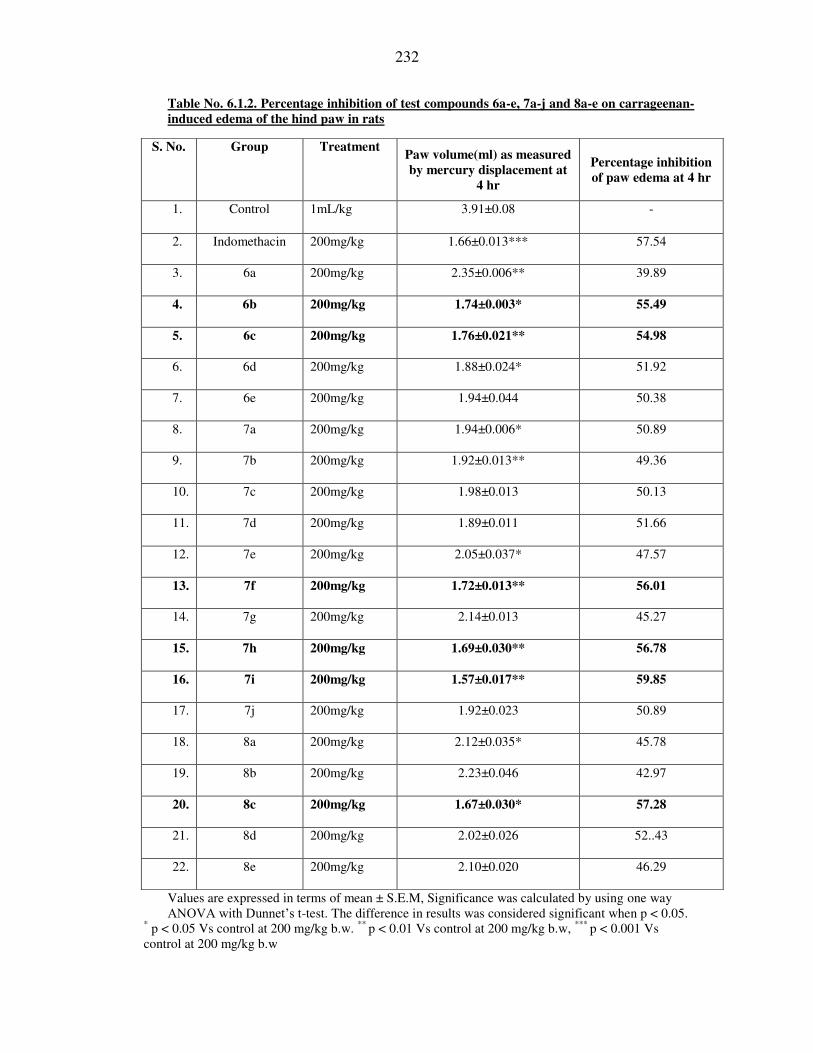
with drug solution at a concentration of 500 µg/ml. After adding drugs agar
plates were set a side in refrigeration for 15 mins, and incubated for 24 hrs at 370
C. After incubation zones were measured at mm and reported in Table no 6.3.1.
Table 6.3.1. Antimicrobial activity of synthesized compounds and standard
(500 µg/ml) [Zone of inhibition (mm)]
Compound
Gram positive Gram negative
B.subtilis S.aureus E.coli P.aeruginosa
6a --- 20 18 10
6b 22 27 29 22
6c 25 18 10 20
6d 25 30 25 19
6e 25 27 27 23
7a 23 18 21 15
7b 14 23 19 21
7c 25 27 20 18
7d 28 -- 29 22
7e 25 28 22 --
7f 21 08 -- 12
7g -- 25 27 08
7h 22 23 17 21
7i 16 18 21 17
7j 20 27 22 21
8a 08 -- 06 15
8b 25 30 25 20
8c 16 14 28 17
8d 26 25 28 22
8e 18 21 24 16
Ampicillin 32 34 32 29

238
Fig. No. 6.3.1. Anti bacterial activity of synthesized compounds 7d, 8d and 6d
239
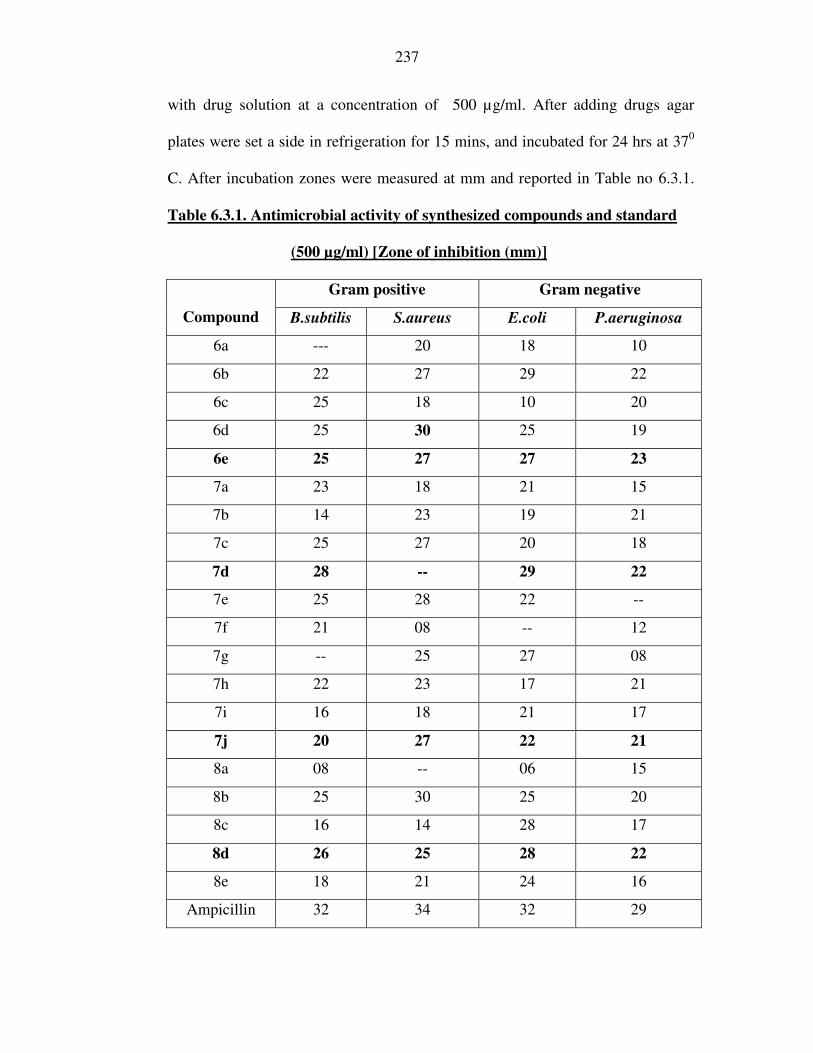
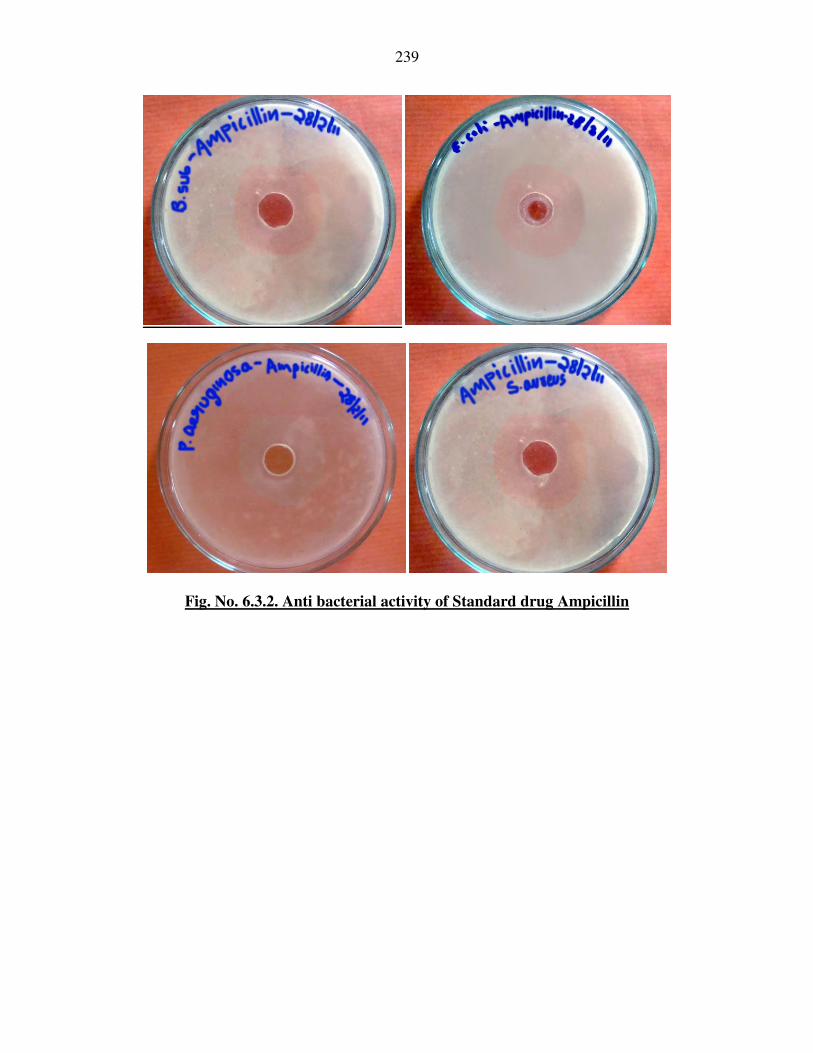
Fig. No. 6.3.2. Anti bacterial activity of Standard drug Ampicillin

240
6.3.2. DETERMINATION OF MIC:
6.3.2.1. Media Composition:
Muller-Hinton agar is a microbiological growth medium that is commonly used
for antibiotic susceptibility testing. It contains:
300 gms beef infusion
17.5 gms casein hydrolysate
1.5 gms starch
Water make up to 1000 ml
Finally, pH was adjusted to neutral at 250
C.
6.3.2.2. In vitro Evaluation of Antibacterial Activity of Compounds :
Broth microdilution method173
using Mueller-Hinton agar medium was employed to
study the preliminary antibacterial activity of synthesized compounds against Gram-
positive (Bacillus subtilis (ATCC 6633) and Staphylococcus aureus,(ATCC 25923))
and Gram-negative (Escherichia coli (ATCC 25922) and Pseudomonas aeruginosa
(ATCC 27853)) bacteria. The antibacterial activity of the test compounds was
compared with ampicillin. Twofold serial dilutions of the test compounds and
reference drugs were prepared in Muller-Hinton agar. Test compounds, standard drug
ampicillin were dissolved in dimethylsulfoxide (DMSO, 1 ml) and the solution was
diluted with distilled water (9 ml). Further progressive serial dilutions with melted
Muller-Hinton agar were performed to obtain the required concentrations from 5-
1000 μg/ml. The test tubes were inoculated with selected microorganisms and
incubated at 37 ˚C for 24 h. The minimum inhibitory concentration (MIC) was the
lowest concentration of the tested compound that yields no visible growth on the

241
plate. To ensure that the solvent had no effect on the bacterial growth, a control was
performed with the test medium supplemented with DMSO at the same dilutions as
used in the experiments.
Table No. 6.3.2. Anti bacterial activity of the synthesized compounds 6(a-e),
7(a-j) and 8(a-e)
Comp.
Minimum inhibitory concentrations (µg/ml)
B. subtilis S. aureus E. coli P. aeruginosa
6a -- 250 500 > 500
6b 125 31.2 15.6 125
6c 62.5 500 > 500 250
6d 500 125 250 500
6e 62.5 15.6 15.6 125
7a 125 500 250 > 500
7b > 500 62.5 500 125
7c 62.5 31.2 250 500
7d 31.2 -- 31.2 125
7e 62.5 31.2 125 --
7f > 500 > 500 -- > 500
7g -- 62.5 31.2 > 500
7h 125 125 > 500 250
7i > 500 500 250 > 500
7j 250 31.2 125 250
8a > 1000 -- > 1000 > 500
8b 62.5 15.6 62.5 250
8c 62.5 > 500 15.6 > 500
8d 31.2 7.8 15.6 31.2
8e 500 62.5 62.5 > 500
Ampicillin 1.56 1.56 3.13 3.13

242
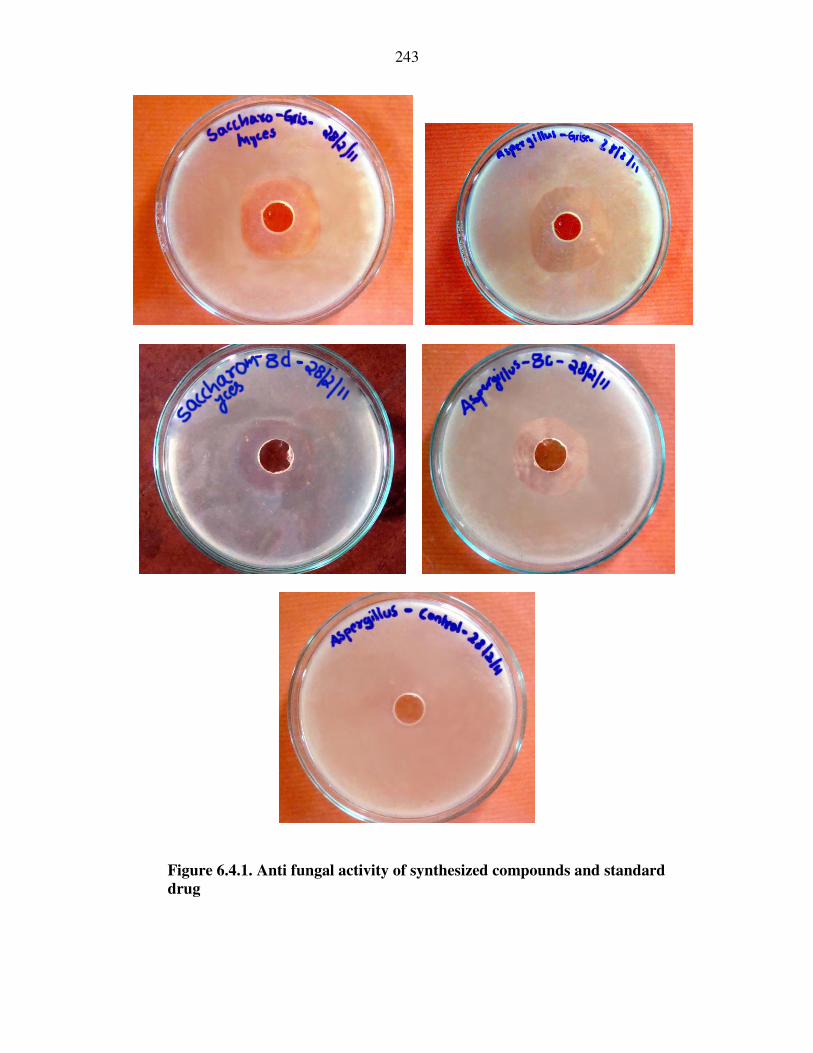
6.4. Anti-Fungal Activity:
The synthesized compounds were screened for their antifungal activity against the
organism Aspergillus niger and Saccharomyces cerevisiae by cup-plate method as
described for the evaluation of antibacterial activity except incubation period (48
hrs at 250C). The study revealed that synthesized compounds possess significant
antifungal activity.
Table No. 6.4.1 Antifungal activity of compounds and standard
(500 µgm/mL) Zone of inhibition (mm)
Compound
Organism
Aspergillus niger Saccharomyces
cerevisiae
6a -- 18
6b 20 --
6c 08 24
6d 22 21
6e 25 22
7a 12 16
7b 24 21
7c 22 19
7d -- 17
7e 19 24
7f 12 18
7g 17 14
7h 19 --
7i 22 24
7j 24 18
8a 18 06
8b 25 10
8c 26 24
8d 22 26
8e 14 27
Griseofulvin) 34 35
243
Figure 6.4.1. Anti fungal activity of synthesized compounds and standard
drug
244
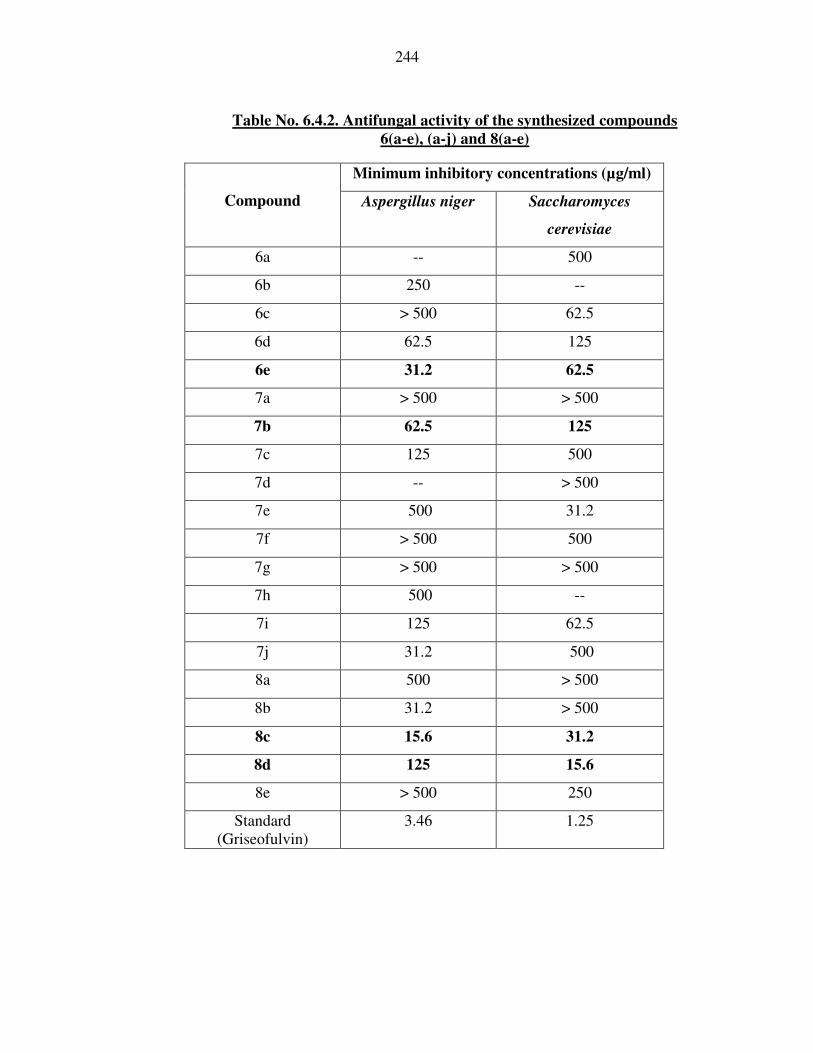
Table No. 6.4.2. Antifungal activity of the synthesized compounds
6(a-e), (a-j) and 8(a-e)
Compound
Minimum inhibitory concentrations (µg/ml)
Aspergillus niger Saccharomyces
cerevisiae
6a -- 500
6b 250 --
6c > 500 62.5
6d 62.5 125
6e 31.2 62.5
7a > 500 > 500
7b 62.5 125
7c 125 500
7d -- > 500
7e 500 31.2
7f > 500 500
7g > 500 > 500
7h 500 --
7i 125 62.5
7j 31.2 500
8a 500 > 500
8b 31.2 > 500
8c 15.6 31.2
8d 125 15.6
8e > 500 250
Standard
(Griseofulvin)
3.46 1.25
245
6.5. In vitro methods employed in antioxidant studies:
6.5.1. Reducing power ability
The reducing power ability of the synthesized compounds was measured by
according to the method of Oyaizu174
. Different concentrations of the synthesized
compounds (50-250 μg/ml) in DMSO (1 ml) were mixed with 2.5 ml of
phosphate buffer (0.2 M, pH 6.6) and 2.5 ml of 1 % potassium ferricyanide and
incubated at 500 C for 30 min. After that 2.5 ml of trichloroacetic acid (10%) was
added to the mixture and then centrifuged for 10 min at 1000 g. 2.5 ml of the
upper layer of solution was diluted with 2.5 ml of distilled water and shaken with
0.5 ml fresh 0.1% ferric chloride. The absorbance was measured at 700 nm using
UV- spectrophometer. The reference solution was prepared as above, but
contained DMSO instead of the samples. Increased absorbance of the reaction
mixture indicates increased reducing power. All experiments were done in
triplicate using ascorbic acid as positive control.
6.5.2. Hydrogen peroxide scavenging activity
The principle of this method depended on the decrease in absorbance of H2O2
upon its oxidation. Hydrogen peroxide solution (2 mM/l) was prepared with 0.1
M phosphate buffer (pH, 7.4). Then, compounds (25-400 g/ml) in 5 ml
phosphate buffer were added to hydrogen peroxide solution (0.6 ml). Absorbance
of hydrogen peroxide at 230 nm was determined spectrophotometrically after 10
min against a blank solution containing phosphate buffer without hydrogen
peroxide. The percentage scavenging of hydrogen peroxide of both synthesised
246
compounds 6 (a-e), 7(a-j) and 8 (a-e) and standard compound were determined175
.
The percentage of scavenged [H2O2]:
[H2O2] = [(Ac-At)/Ac] X 100
Where Ac was the absorbance of the control and At was the absorbance in the
presence of the standard sample or synthesized compounds.
Calculation of 50% Inhibitory Concentration (IC50)
The concentration (mg/ml) of the various compounds required to scavenge 50%
of the radicals was calculated by using the percentage scavenging activities at five
different concentrations of the compound. Percentage inhibition (I %) was
calculated using the formula,
I % = (Ac-As) x 100
Ac
Where Ac is the absorbance of the control and As is the absorbance of the sample.
Statistical analysis
Results were statistically evaluated by analysis of variance (ANOVA)
followed by Dennett’s multiple comparison test, P<0.05 was considered to be
statistically significant.

247
Table No. 6.5.1. Reductive ability of synthesized compounds
Comp Concentration in μg/ml
50 100 150 200 250
6a 0.212±0.05 0.432±0.00 0.575±0.01 0.744±0.01 1.212±0.01
6b 0.427±0.00 0.615±0.00 0.849±0.00 1.432±0.00 1.878±0.00
6c 0.442±0.00 0.793±0.00 0.952±0.00 1.268±0.00 1.734±0.00
6d 0.351±0.00 0.549±0.00 0.828±0.00 1.094±0.00 1.525±0.00
6e 0.394±0.00 0.687±0.00 0.857±0.00 1.353±0.00 1.839±0.00
7a 0.381±0.01 0.492±0.00 0.531±0.00 0.876±0.00 1.282±0.00
7b 0.442±0.01 0.638±0.00 0.816±0.00 1.217±0.00 1.497±0.00
7c 0.492±0.00 0.680±0.00 0.911±0.00 1.232±0.00 1.479±0.00
7d 0.591±0.00 0.797±0.00 0.940±0.00 1.491±0.00 1.714±0.00
7e 0.462±0.00 0.690±0.00 1.078±0.00 1.216±0.00 1.421±0.00
7f 0.282±0.005 0.439±0.005 0.622±0.006 0.811±0.005 0.916±0.004
7g 0.309±0.001 0.427±0.004 0.592±0.002 0.781±0.003 0.906±0.005
7h 0.277±0.002 0.396±0.003 0.622±0.001 0.807±0.002 0.953±0.003
7i 0.291±0.003 0.414±0.005 0.659±0.003 0.847±0.004 0.953±0.003
7j 0.371±0.003 0.488±0.002 0.722±0.005 0.925±0.001 1.037±0.003
8a 0.381±0.002 0.690±0.001 0.797±0.004 1.283±0.003 1.749±0.002
8b 0.334±0.002 0.611±0.002 0.844±0.003 1.263±0.002 1.839±0.001
8c 0.577±0.004 0.783±0.003 0.957±0.002 1.486±0.002 1.852±0.002
8d 0.488±0.001 0.622±0.001 0.933±0.004 1.232±0.002 1.479±0.003
8e 0.289±0.003 0.426±0.004 0.684±0.002 0.855±0.006 0.983±0.004
STD 0.601±0.003 0.713±0.005 0.839±0.003 0.911±0.008 1.190±0.11
Values shown are mean ± SEM for four tests p<0.01, as compared to
control
248
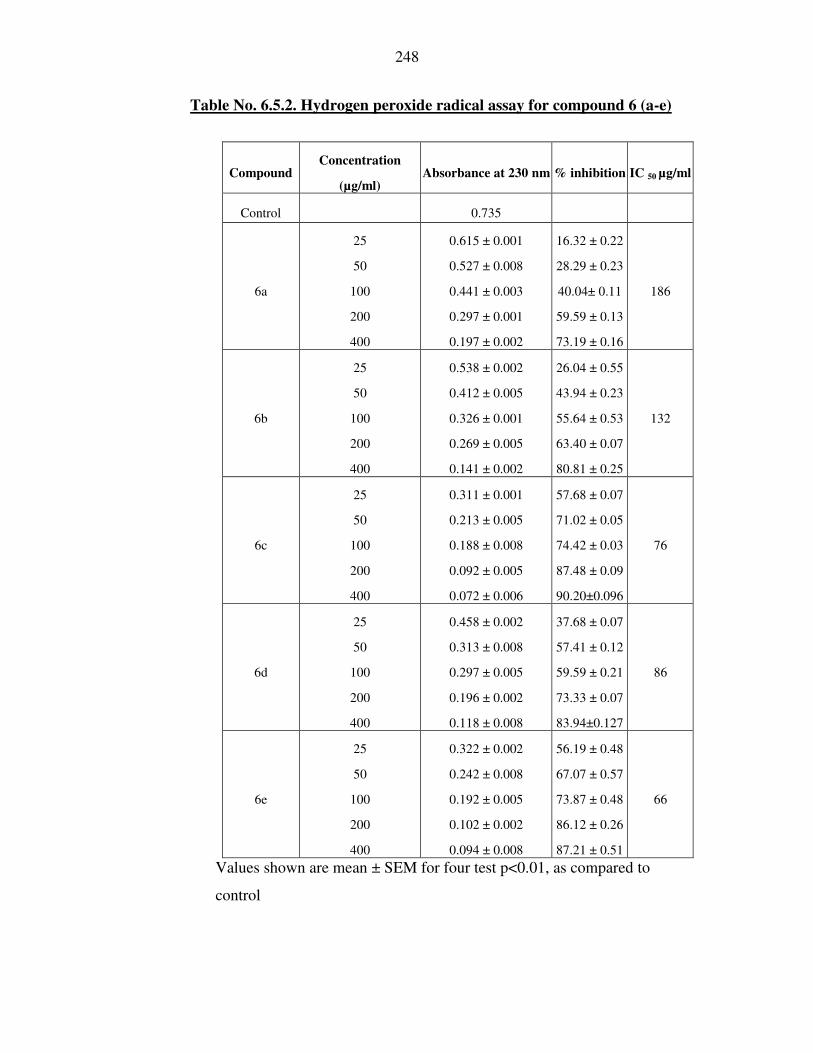
Table No. 6.5.2. Hydrogen peroxide radical assay for compound 6 (a-e)
Compound Concentration
(µg/ml) Absorbance at 230 nm % inhibition IC 50 µg/ml
Control 0.735
6a
25
50
100
200
400
0.615 ± 0.001
0.527 ± 0.008
0.441 ± 0.003
0.297 ± 0.001
0.197 ± 0.002
16.32 ± 0.22
28.29 ± 0.23
40.04± 0.11
59.59 ± 0.13
73.19 ± 0.16
186
6b
25
50
100
200
400
0.538 ± 0.002
0.412 ± 0.005
0.326 ± 0.001
0.269 ± 0.005
0.141 ± 0.002
26.04 ± 0.55
43.94 ± 0.23
55.64 ± 0.53
63.40 ± 0.07
80.81 ± 0.25
132
6c
25
50
100
200
400
0.311 ± 0.001
0.213 ± 0.005
0.188 ± 0.008
0.092 ± 0.005
0.072 ± 0.006
57.68 ± 0.07
71.02 ± 0.05
74.42 ± 0.03
87.48 ± 0.09
90.20±0.096
76
6d
25
50
100
200
400
0.458 ± 0.002
0.313 ± 0.008
0.297 ± 0.005
0.196 ± 0.002
0.118 ± 0.008
37.68 ± 0.07
57.41 ± 0.12
59.59 ± 0.21
73.33 ± 0.07
83.94±0.127
86
6e
25
50
100
200
400
0.322 ± 0.002
0.242 ± 0.008
0.192 ± 0.005
0.102 ± 0.002
0.094 ± 0.008
56.19 ± 0.48
67.07 ± 0.57
73.87 ± 0.48
86.12 ± 0.26
87.21 ± 0.51
66
Values shown are mean ± SEM for four test p<0.01, as compared to
control

249
Table No. 6.5.3. Hydrogen peroxide radical assay for compound 7 (a-e)
Compound Concentration (µg/ml) Absorbance at 230 nm % inhibition IC 50 µg/ml
Control 0.735
7a
25
50
100
200
400
0.627 ± 0.002
0.535 ± 0.003
0.455 ± 0.001
0.298 ± 0.005
0.199 ± 0.006
14.69 ± 0.51
27.21 ± 0.21
38.09 ± 0.34
59.40 ± 0.46
72.90 ± 0.41
171
7b
25
50
100
200
400
0.618 ± 0.002
0.527 ± 0.006
0.447 ± 0.001
0.299 ± 0.004
0.197 ± 0.003
15.91 ±0.22
28.29 ±0.37
39.18 ±0.43
59.31 ±0.27
73.10 ±0.34
152
7c
25
50
100
200
400
0.312 ± 0.002
0.215 ± 0.004
0.189 ± 0.005
0.093 ± 0.002
0.075 ± 0.006
57.55 ±0.38
70.74 ±0.14
74.28 ±0.35
87.34 ±0.26
89.79 ±0.18
82
7d
25
50
100
200
400
0.617 ± 0.002
0.528 ± 0.003
0.448 ± 0.002
0.298 ± 0.004
0.196 ± 0.005
16.05 ±0.43
28.16 ±0.23
39.04 ±0.53
59.45 ±0.09
73.33 ±0.36
142
7e
25
50
100
200
400
0.457 ± 0.004
0.314 ± 0.001
0.295 ± 0.004
0.198 ± 0.002
0.117 ± 0.005
37.82 ±0.43
57.27 ±0.17
59.86 ±0.09
73.06 ±0.17
84.08 ±0.33
84
Values shown are mean ± SEM for four test p<0.01, as compared to
control
250
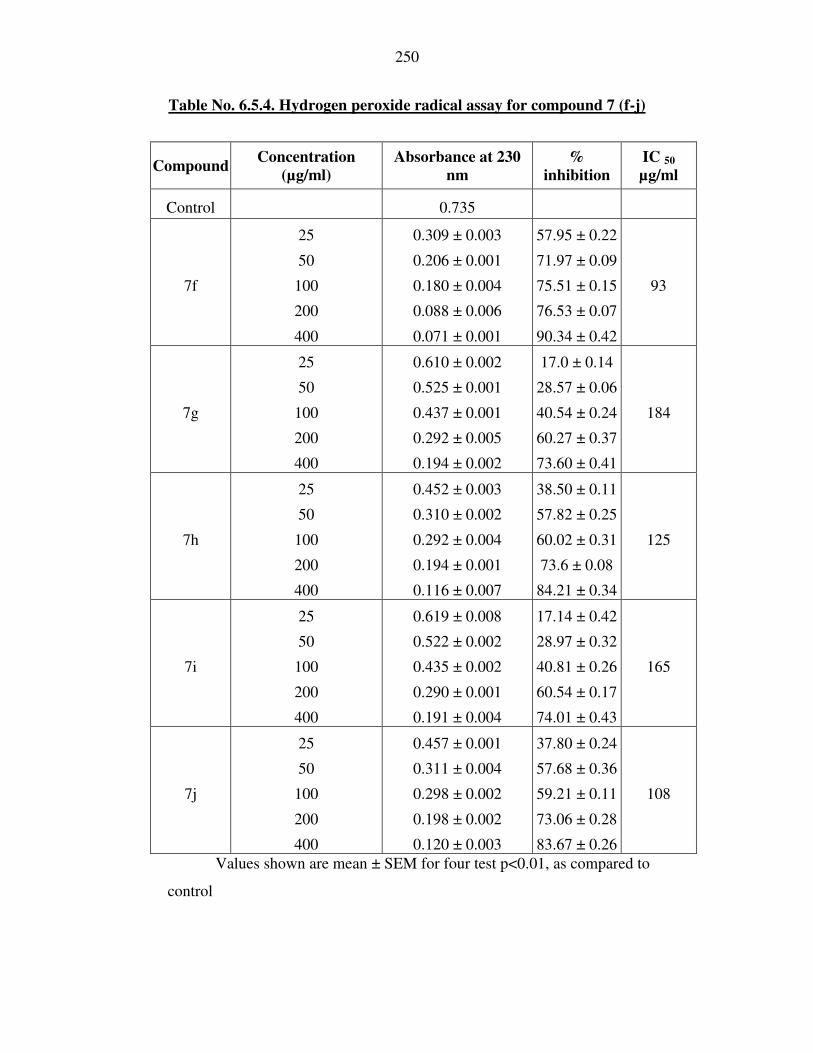
Table No. 6.5.4. Hydrogen peroxide radical assay for compound 7 (f-j)
Compound Concentration
(µg/ml)
Absorbance at 230
nm
%
inhibition
IC 50
µg/ml
Control 0.735
7f
25
50
100
200
400
0.309 ± 0.003
0.206 ± 0.001
0.180 ± 0.004
0.088 ± 0.006
0.071 ± 0.001
57.95 ± 0.22
71.97 ± 0.09
75.51 ± 0.15
76.53 ± 0.07
90.34 ± 0.42
93
7g
25
50
100
200
400
0.610 ± 0.002
0.525 ± 0.001
0.437 ± 0.001
0.292 ± 0.005
0.194 ± 0.002
17.0 ± 0.14
28.57 ± 0.06
40.54 ± 0.24
60.27 ± 0.37
73.60 ± 0.41
184
7h
25
50
100
200
400
0.452 ± 0.003
0.310 ± 0.002
0.292 ± 0.004
0.194 ± 0.001
0.116 ± 0.007
38.50 ± 0.11
57.82 ± 0.25
60.02 ± 0.31
73.6 ± 0.08
84.21 ± 0.34
125
7i
25
50
100
200
400
0.619 ± 0.008
0.522 ± 0.002
0.435 ± 0.002
0.290 ± 0.001
0.191 ± 0.004
17.14 ± 0.42
28.97 ± 0.32
40.81 ± 0.26
60.54 ± 0.17
74.01 ± 0.43
165
7j
25
50
100
200
400
0.457 ± 0.001
0.311 ± 0.004
0.298 ± 0.002
0.198 ± 0.002
0.120 ± 0.003
37.80 ± 0.24
57.68 ± 0.36
59.21 ± 0.11
73.06 ± 0.28
83.67 ± 0.26
108
Values shown are mean ± SEM for four test p<0.01, as compared to
control

251
Table No. 6.5.5. Hydrogen peroxide radical assay for compound 8 (a-e)
Compound Concentration
(µg/ml)
Absorbance at 230
nm
%
inhibition
IC 50
µg/ml
8a
25
50
100
200
400
0.612 ± 0.002
0.520 ± 0.003
0.430 ± 0.006
0.288 ± 0.004
0.190 ± 0.003
16.70 ± 0.12
29.25 ± 0.08
41.49 ± 0.11
60.81 ± 0.01
74.14 ± 0.08
169
8b
25
50
100
200
400
0.310 ± 0.001
0.208 ± 0.002
0.181 ± 0.002
0.089 ± 0.006
0.066 ± 0.005
57.80 ± 0.21
71.70 ± 0.04
75.37 ± 0.06
87.89 ± 0.02
91.02 ± 0.02
82
8c
25
50
100
200
400
0.456 ± 0.001
0.312 ± 0.002
0.294 ± 0.001
0.195 ± 0.003
0.112 ± 0.001
37.95 ± 0.19
57.55 ± 0.22
60.00 ± 0.35
73.46 ± 0.41
84.76 ± 0.06
96
8d
25
50
100
200
400
0.308 ± 0.002
0.206 ± 0.004
0.180 ± 0.003
0.086 ± 0.005
0.067 ± 0.003
58.09 ± 0.26
71.97 ± 0.35
75.51 ± 0.05
88.29 ± 0.26
90.88 ± 0.21
90
8e
25
50
100
200
400
0.611 ± 0.001
0.519 ± 0.003
0.427 ± 0.003
0.286 ± 0.002
0.192 ± 0.001
16.89 ± 0.08
29.38 ± 0.49
41.90 ± 0.41
61.08 ± 0.16
73.87 ± 0.28
168
α-tocopherol
(standard)
25
50
100
200
400
0.232 ± 0.708
0.197 ± 0.008
0.176 ± 0.001
0.091 ± 0.002
0.071 ± 0.007
68.43 ± 0.10
73.46 ± 0.15
76.05 ± 0.06
87.61 ± 0.10
90.34 ± 0.05
42
Values shown are mean ± SEM for four test p<0.01, as compared to control

252
Reference:
170. Oyanagui Y, Sato S. Inhibition by nilvadipine of ischemic and carrageenan paw
edema as well as of superoxide radical production from neutrophils and xanthine
oxidase. Arzneimittel-Forsch. 41, 1991, pp 469-474.
171. Asuzu IU, Omu U. Ant-ulcer activity of the ethanol extract of Combretum
dolichopetalum, Int.J.Crude Drugs Res. 28(1), 1990, pp 27-32.
172. Goto S., K. Jo, T. Kawakita, S. Mitsuhashi, T. Nishino, N. Ohsawa & H.
Tanami, H. Chemother. 29, 1981, pp 76-79.
173. Pandeya, S.N.; Sriram, D.; Nath, G.; De Clercq, E. Synthesis and antimicrobial
activity of Schiff and Mannich bases of isatin and its derivatives with pyrimidine.
Il Farmaco, 54 (9), 1999, pp 624-628.
174. Oyaizu, M. Studies on products of browning reaction prepared from
glucosamine. Japan. Nutri. 44, 1986, pp 307-316.
175. Ruch R.J., Cheng, S.J. Klaunig, J.E. Prevention of cytotoxicity and inhibition of
intercellular communication by antioxidant catechins isolated from Chinese green
tea. Carcinogenesis 10, 1989, pp 1003–1008.