Embed Size (px)
Citation preview

6. Pharmacological activity of fish (Plotosus lineatus) toxin and associated bacterial metabolites

116
INTRODUCTION
Newly emerging infectious diseases such as Severe Acute Respiratory
Syndrome (SARS), bird flu fever, AIDS and multidrug-resistant bacteria intend
that there is a continuous need to develop new antibiotics without side effects.
Natural products are getting much attention and these were the basis of the first
pharmaceutical practice and continue to play an important role in modern
chemotherapy (Koehn and Carter, 2005). In this scenario, the marine
environment has been considered as a storehouse of biologically active
substances, it was cited that 71% of the earth's surface is covered with water and
that the oceans teem with animal life of great diversity, with well over 500,000
species in 30 phyla (Bessey, 1976).
Isolation of natural products from marine organisms faces several
problems with respect to modern drug discovery programs. The first and
foremost problem encountered with marine invertebrate extracts is the presence
of large quantities of inorganic salts. In many cases, the presence of a major
non-selective compound can mask the activity of minor selective compounds.
Minor compounds in many cases are represented in crude extracts at
concentrations that are below detection thresholds. From a discovery standpoint,
these problems can be addressed to a certain point through the use of
prefractionation strategies (Appleton et al., 2007; Lam, 2007).
117
Of the natural products isolated from marine organisms (Rao et al., 1985),
only less than 1% has been examined so far for pharmacological activity
(Halstead, 1965). Bessey (1976) reported that only a few percentages of natural
toxic sources have been closely examined for biologically active compounds. The
production of toxins by aquatic animals is an important strategy that guarantees
their survival in a highly competitive ecosystem. The cone snail (Conus magus)
paralyses its prey using a poison tipped barb (right). More than 200 species of
marine fish, including stingrays, scorpionfish, zebrafish, stonefish, weeverfish,
toadfish, stargazers, and some species of shark, ratfish, catfish, surgeonfish and
blenny are known or suspected to be venomous (Russell, 1996).
The piscine envenomation, a common occurrence is mainly experienced
amongst fisherman and divers (Khoo et al., 1995). Virtually, there is no
information available on the venom pharmacology, venom constituents and
venom antagonists (Karmakar et al., 2004). Muhuri et al. (2004) reported the
pharmacodyanamic action of the butter fish venom (Scatophagus argus) in
experimental animals. The poison from conus magus is a painkiller which is
many times more potent than morphine and is now on the market as Prialt
(Marris, 2006). Andreev et al. (2008) reported a polypeptide named analgesic
polypeptide HC1 (APHC1) from sea anemone had analgesic effect during in vivo
experiments.

118
Microbial metabolites are a rapidly growing field and it was suspected that
a number of metabolites obtained from algae and invertebrates may be produced
by associated microorganisms (Kelecom, 2002). Wang et al. (2008a) isolated
bacterial strains (Vibrio, Shewanella, Marinomonas, Tenacibaculum and
Aeromonas) from the digestive gland of gastropod Nassarius semiplicatus and
studied the relationship between bacteria and toxicity of nassariid. This finding
suggested that tetrodotoxin-producing bacteria might play an important role in
tetrodotoxin accumulation/production in N. semiplicatus. Tetrodotoxin has been
isolated from crabs, an octopus, a goby, molluscs, flatworms and even from a
terrestrial amphibian, all suggesting its origin from microbial source (Wu et al.,
2005b). The pharmacological properties of bacterial and fungal metabolites have
been reported. Some of these metabolites affect central nervous system,
respiratory system, neuromuscular system, cardiovascular system and
gastrointestinal system and also cause pain, necrosis, edema, parasthesias,
prurities etc., (Bhakuni and Rawat, 2005).
The biomedical importance of marine venomous cat fish (Plotosus
lineatus) toxin and its venom gland associated bacteria have been investigated in
the present study. To study the pharmacological potential, few common
experiments have been done such as the Lethality test, CNS stimulant activity,
inflammatory effect, neuromuscular activity and behavioral studies.

119
MATERIALS AND METHODS
Fish venom extraction
Fish Plotosus lineatus was kept at -20 0C for 10 – 20 min and then
decapitated after bringing to laboratory; the dorsal and pectoral spines were
removed. Method of Sivan et al. (2007) was followed to extract fish toxin. Spines
were homogenized in 0.9% NaCl. The supernatant was centrifuged (UNIVERSAL
32 R, Hettich ZENTRIFUGEN) for 15 min at 5000 RPM to remove insoluble
materials. The resulting supernatant was stored at -5 °C. Freshly extracted
soluble fraction was used for all the experiments. Toxin concentrates were
expressed as mg toxin protein. Protein quantification of the toxin was determined
by the method of Lowry et al. (1951) using bovine serum albumin as standard.
Bacterial strain extraction
The selected producer strains F3 and F5 were broth cultured in 100 ml
Zobell marine broth individually for five days at 290 rpm at room temperature.
The culture broth was then centrifuged at 5000 rpm for 10 - 15 minutes and then
the supernatant was extracted employing liquid-liquid extraction (Galliot, 1998).
Butanol was used for extraction. Equal volume of butanol solvent was added to
the broth and stirred for 5 - 10 minutes, using a magnetic stirrer. The two phases
were then separated in a separating funnel and the solvent phase was
concentrated by evaporation. The concentrate (crude extract) was used for the
assessment of pharmacological activities.

120
Experimental animals
Adult albino mice weighing between 20 - 30 gm were used for all the
experiments. The animals were maintained under standard environmental
conditions with an alternating 12 hrs light-dark cycle and relative humidity of 50-
60% in the department of pharmacology, S.B College of Pharmacy, Sivakasi and
were given uniform pelleted diet and water ad libitum.
Protein profiling SDS-PAGE
The crude fish toxin was subjected to SDS-PAGE (Sodium dodecyl
sulphate-polyacrylamide gel electrophoresis) to determine the molecular weight
by comparing with standard molecular weight markers. Lane 1 was filled with
various molecular weight markers to determine the unknown molecular weight of
fish toxin and Lane 2 was filled with fish toxin (Laemmli, 1970).
Lethality test
Mice were injected (i.p.) with 0.2 ml of 0.9% saline containing different
doses (1 to 5 mg/ml) of P. lineatus toxin and crude extract of bacterial strains (F3
and F5). The LD50 (dose that killed 50% of the animals) was estimated within 48
hrs after injection by Probit analysis (Finney, 1971).
Paw edema inducing activity
Studying the thickness of paw of experimental animal after the
administration of drug is known as the paw edema inducing activity. Animals

121
were divided into four groups of 5 individuals each separately for fish toxin and
eight groups of 5 individuals each separately for butanol crude extract of F3 and
F5 strain. Extracts of 0.3 ml containing different concentration of toxin and crude
bacterial metabolites of F3 and F5 strains (0.5, 1.5, 2.5 and 4 mg/kg) were
injected into the right foot pad of mice. Control groups of mice were injected with
0.3 ml sterile 0.9% saline and butanol separately for fish toxin and bacterial
metabolites respectively. An untreated group of mice was maintained without any
drug and considered as untreated. Thickness of injected paw was measured
using Paquimeter during 0.5, 2, 6, 9, 24 and 48 hrs. Paw edema activity was
calculated by the difference between experimental and control foot pad thickness
in millimeter (Sosa-Rosales et al., 2005b).
Neuromuscular activity
To study the neuromuscular activity of P. lineatus toxin and bacterial
extract, the following method of Kulkarni, (1999) was used. Abdomen rectus
muscles were dissected out from frogs. The top and bottom end of muscles were
tied using thread. This preparation was mounted (tension of 1 g) on organ baths
separately (bubbling with air) containing ringer solution and muscles were let to
relax for 45 min. Meanwhile the muscles were washed with fresh quantum ringer
solution for four times. Neuromuscular contraction activity due to acetylcholine
was recorded by frontal writing lever (Chymograph - INCO E8 REC. DRUM)
initially. Ninety second contact time and another 5 min time cycle was used for

122
proper recording of the responses. Then five doses (10, 20, 40, 80 and 160
µg/ml) of acetylcholine were used to record the concentration-response curve.
Standard (Pancuronium 1-2 µg/ml – blocking agent) and different concentrations
of crude toxin extract and bacterial extract (F3 and F5) (0.1, 2.5, 5 and 10 µg/ml)
were added separately to the reservoir containing ringer solution and the
muscles were irrigated for 30 minutes. The response curve was recorded on
drum rounded with smoked sheet. The recorded tracing sheet was fixed with
varnish and taken to calculate the neuromuscular activity. Control was also
maintained with 0.9% saline.
CNS stimulant activity
Locomotor activity was performed by following the method of Santhana
Ramasamy and Senthilkumar, (2009). The computerized locomotion detection
system (Actophotometer) equipped with photosenser was used to measure
spontaneous locomotor activity and rearing. In this experiment, the mice were
individually placed in a transparent cage (25 X 48 X 18 cm3) before the
administration of vehicle (1% saline) or test extract to measure the locomotor
activities for 10 minutes. The animals were divided into 7 groups for fish toxin.
Group I served as an untreated control, group II and III were treated with saline
and standard caffeine (30 mg/kg, i.p) respectively. Group IV, V, VI and VII were
treated with fish toxin at 0.5, 1.5, 2.5 and 4 mg/kg.

123
The animals were divided into 11 groups for bacterial crude extracts.
Group I served as an untreated control, group II and III were treated with saline
and standard caffeine (30 mg/kg, i.p) respectively. Group IV, V, VI and VII were
treated with test extracts of F3 strain at 0.5, 1.5, 2.5 and 4 mg/kg. Likewise,
Group VIII, IX, X and XI were treated with test extracts of F5 strain at 0.5, 1.5, 2.5
and 4 mg/kg. The locomotor activity was observed after 30 minutes of extract
administration for 10 minutes and the changes in activity percentage was
calculated by the following formula (Kulkarni, 1999).
Percentage (%) = (A-B)/A x 100
Where,
A – Before drug treatment
B – After drug treatment
Behavioral study
Experimental mice were injected intra-peritoneally with fish toxin and
bacterial crude extracts at 1% and 10% of LD50 value. Kulkarni (1999) described
method was followed to study the behavioral profile. Animals displaying serial of
effects such as stimulant (Hyperacitivity, Piloerection, Twitching, Rigidity,
Irritability, Jumping, Chronic convulsion and Tonic convulsions), depression
(Ptosis, Sedation, Sleep [Loss of R.R], Loss of Traction, Loss of Pinna reflex,
Loss of Pl. Reflex, Catatonia, Ataxia, Loss of Muscle tone, Analgesia) and
autonomous (Straub Tail, Laboured Resp, Cyanosis, Blanching, Reddening,

124
Abnormal secretion) were monitored for 0.5, 1, 2, 4 and 24 hrs. The animals
were injected with different standards such as Caffeine 30 mg/kg (stimulant),
Chlorpromazine 3 mg/kg (depression) and Neostigmine 0.07 mg/kg
(autonomous). Control (saline) groups were maintained separately.
RESULTS
Protein profiling SDS-PAGE
Fish P. lineatus toxin presented four important bands in SDS-PAGE when
stained with Coomassie blue (Fig. 5.1). The molecular weight of fish toxin protein
was determined by comparing with bands of known molecular weight markers
which were observed in adjacent lane. Briefly, first and second band were
observed at 66 and 47 kDa (kilo dalton) respectively. Third band was observed
between 47 and 29 kDa. The final band was observed at 14 kDa. It is confirmed
that presence of 4 compounds with different molecular weight in crude fish toxin.
Lethality test
LD50 value of crude toxin from P. lineatus was found to be 4.27 mg/kg b.w
(i.p). F3 and F5 strains showed 50% lethality at 4.78 and 5.5 mg/kg respectively.
Paw edema-inducing activity
The results of paw edema inducing activity of fish toxin were represented
in Table 5.1. The mean value of paw thickness increased with increasing dose
125
range of 0.5 mg to 4 mg. Generally fish toxin induced edemal response
immediately after injection (30 min). The maximal edemal response of fish toxin
was observed at 4 mg (4.17 ± 0.04 mm) during 120 min; almost all other doses
showed elevated edemal response when compared with control-group over the
48 hrs. Fragile edematic activity was observed at 1.5 and 2.5 mg and very poor
activity was exhibited at 0.5 mg and persisted only for 30 min. No activity was
observed in control and untreated groups.
Butanol extracts of F3 and F5 strains produced dose dependent edemal
activity (table 5.2). Highest response of 4.09 ± 0.075 mm was observed at 4
mg/paw of F3 strain and it remained upto 360 minutes after injection and then
gradually decreased. F5 exhibited low and poor level edematogenic effect and
maximum response was observed after 30 mins (3.66 ± 0.104 mm) at the dose
of 4 mg/paw.
Neuromuscular activity
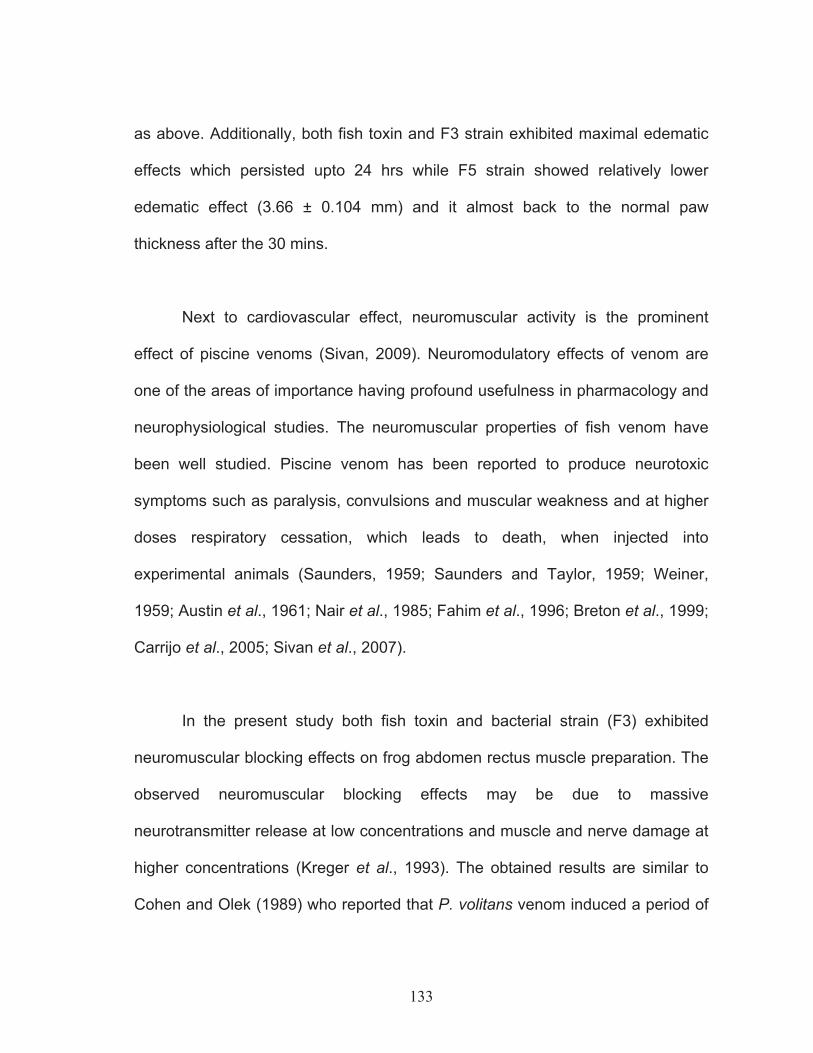
Height of response curve (presence and absence of pancuronium and test
samples with acetylcholine) was plotted on graph. At graph, right shift of test
extracts curve indicate blocking effect and left shift indicates contraction. 0.9%
saline did not show any considerable neuromuscular activity during the
experiment and so could see the equal curve in the graph (Fig. 5.2).
126
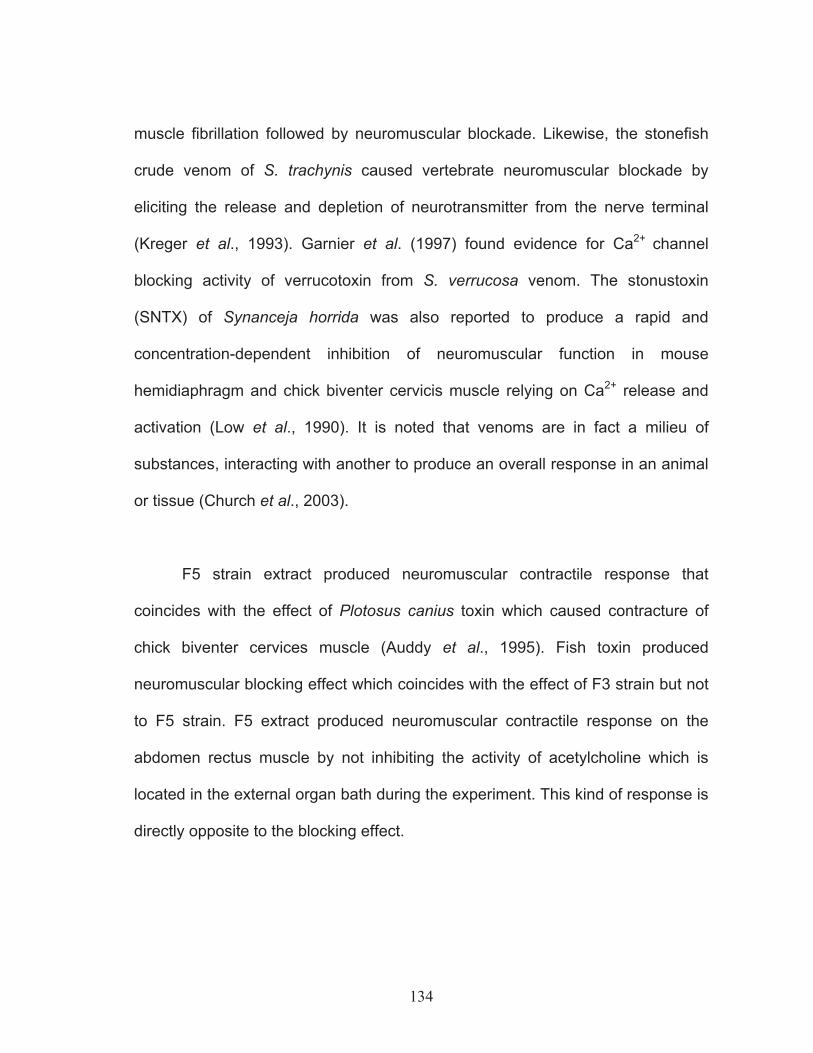
Pancuronium is a neuromuscular blocking agent which blocks the nicotinic
cholinergic receptors in the skeletal muscle. As a result the actions of
acetylcholine are inhibited in the presence of Pancuronium. In the graph (Fig.
5.3), the concentration response curve of acetylcholine was shifted to the right.
Similar effect was found in the test extracts also and the curve was shifted to the
right. 85% of highest blocking effect was recorded at the dose 1 µg/ml in toxin
extract (Fig. 5.4) and almost similar effect was observed at 2.5 µg/ml of toxin
extract. The dose response curve of Acetylcholine in the presence of toxin
extract at 2.5 µg/ml was shifted to right side of the graph indicating the
neuromuscular blocking effect of toxin extract (Fig. 5.5). The same effect of dose
response curve was observed at 5 µg/ml (Fig. 5.6) and 10 µg/ml (Fig. 5.7) of
toxin. These observations suggested that toxin sample has neuromuscular
blocking effect and hence it inhibited the natural activity of acetylcholine.
Neuromuscular activities of bacterial extract were recorded. Presence of
saline (control) did not affect the activity of acetylcholine (Fig. 5.8). The value of
control and acetylcholine are crossing same line on the graph. Standard
Pancuronium significantly affects the activity of acetylcholine indicated the
neuromuscular blocking effect (Fig. 5.9). Right shift in response curve of
acetylcholine due to the presence of 1 µg/ml crude extract indicated the
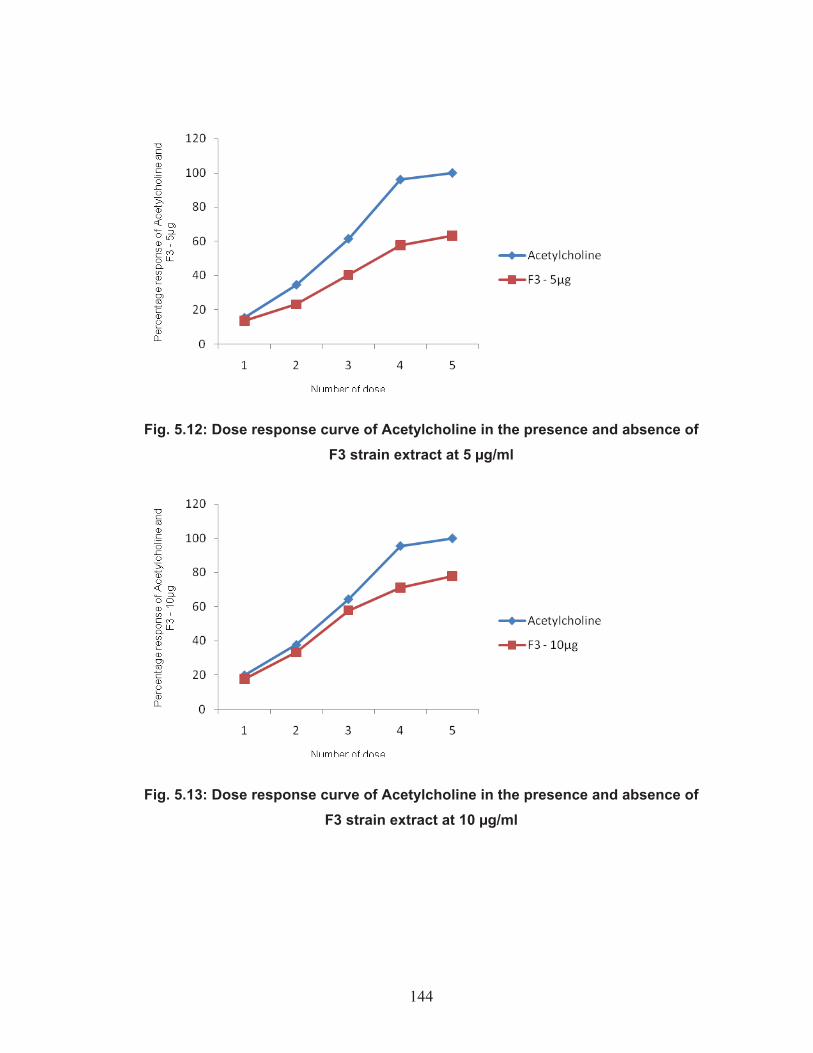
neuromuscular blocking activity of F3 strain (Fig. 5.10). Doses at 2.5 (Fig. 5.11),
5 (Fig. 5.12) and 10 µg/ml (Fig. 5.13) of F3 strain also exhibited same response

127
towards acetylcholine inhibition. Thus this study revealed potential
neuromuscular blocking activity of F3 strain.
F5 strain exhibited the muscle contraction in the abdomen rectus muscle
of frog and it did not affect the activity of acetylcholine. Interestingly,
neuromuscular blocking activity was observed only at 1 µg (Fig. 5.14). Remaining
concentrations such as 2.5 (Fig. 5.15), 5 (Fig. 5.16) and 10 µg (Fig. 5.17)
exhibited neuromuscular contraction activity.
CNS stimulant activity
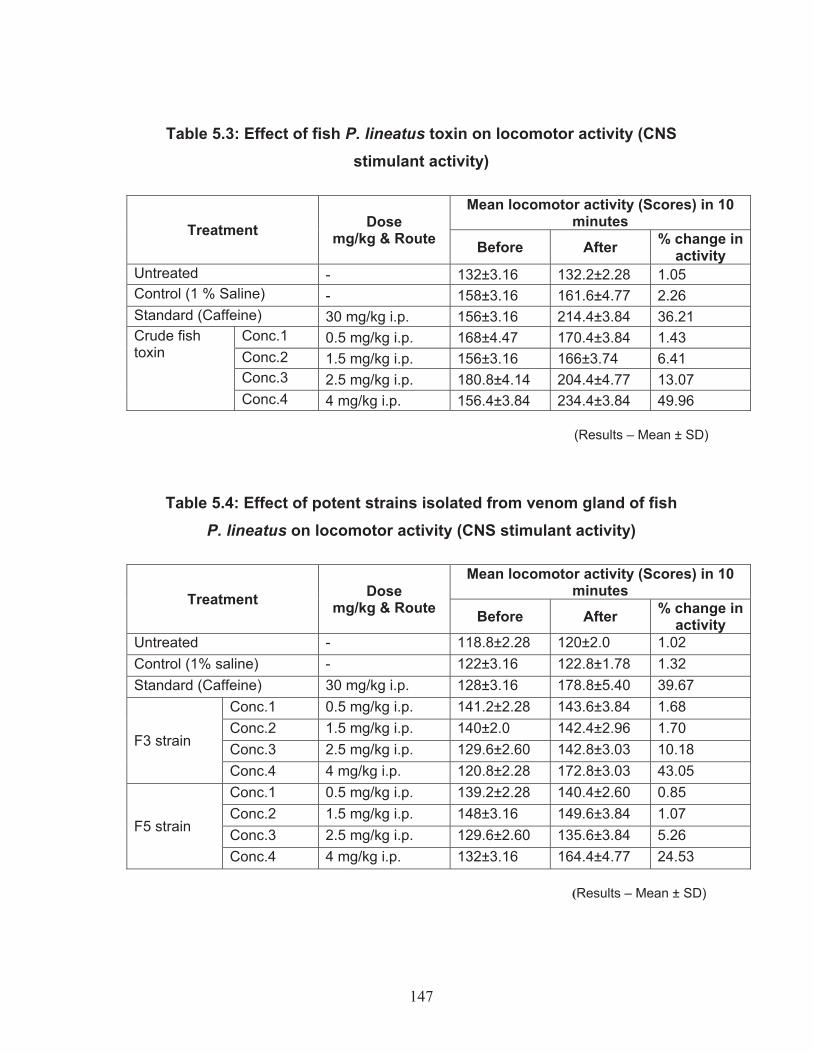
Generally highest CNS stimulant activity was observed in fish toxin than
the bacterial extracts of F3 and F5 strains. Fish toxin exhibited dose dependent
activity (Table 5.3). Maximum activity was observed at 4 mg/kg that was scored
as 234.4 ± 3.84. The percentage change in activity was 49.96% which was
significantly higher (P < 0.05) than the standard drug caffeine (36.21%). Minimum
activity was observed at 0.5 mg/kg (170.4 ± 3.84) with 1.43% change in activity.
There was no considerable effect in control and untreated groups.
Bacterial extracts, F3 and F5 showed dose dependent effect (table 5.4).
Maximum stimulant activity was 43.05 and 24.53% at 4 mg concentration of F3
and F5 strains respectively. Both extracts exhibited lower activity than standard.

128
F3 strain exhibited higher stimulant activity than F5 and variation in activity was
19% indicating the potential of F3 strain.
Behavioural studies
Fish toxin produced marked stimulant series of effects such as
Hyperacitivity, Piloerection, Twitching, Rigidity, Irritability and Jumping except
Chronic and Tonic convulsions at 0.427 mg/kg (10% of LD50) dose for 1, 2 and 4
hrs (Table 5.10) and mild effect continued up to 24 hrs at 0.0427 mg/kg (1% of
LD50); the marked effect only recorded for 2 and 4 hrs (Table 5.9). The control
group animals of 0.9% saline exhibited nil activity during the experiment (Table
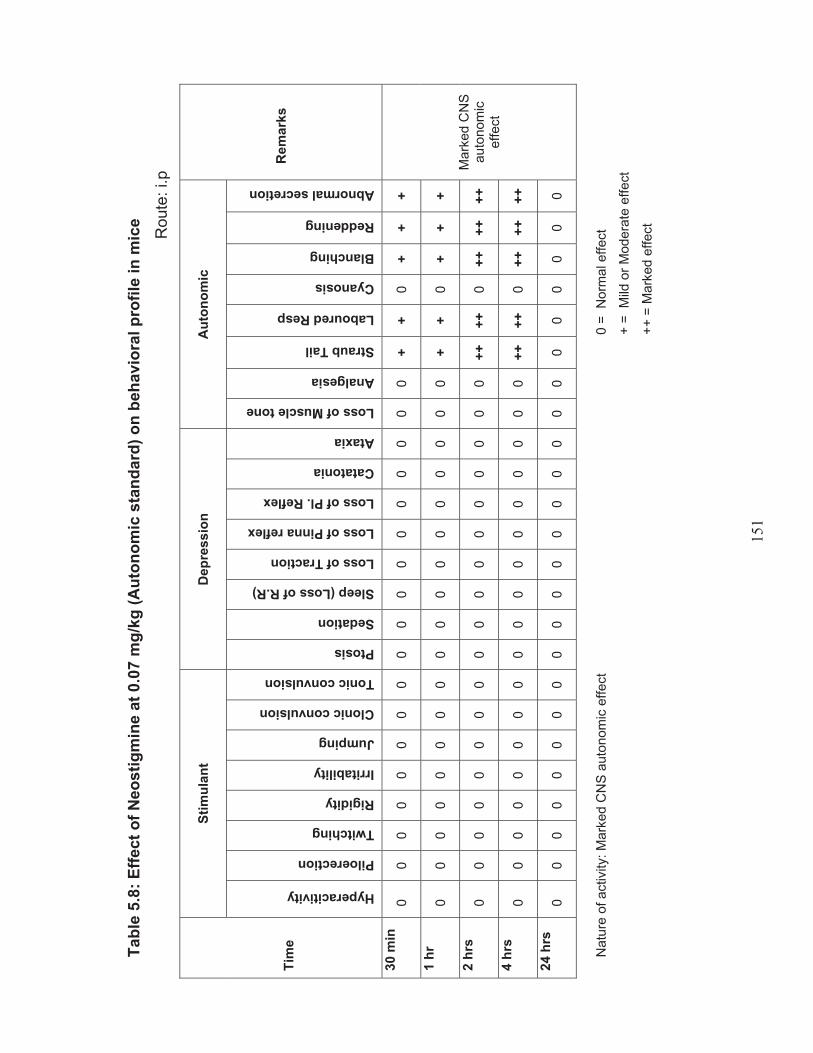
5.5). The standard drug caffeine (Table 5.6), chlorpromazine (Table 5.7) and
Neostigmine (Table 5.8) produced relevant stimulant, depressant and
autonomous activities respectively.
In the case of bacterial extract, at 0.0478 mg/kg (1% of LD50) dose of F3
strain, 30 minutes after the injection, mild or moderate stimulant effects were
noticed (Table 5.11) on the experimental mice as series of behavioral effects
such as hyperacitivity, piloerection, twitching, rigidity, irritability and jumping. It
continued up to 1 hr and marked effects were observed during 2 hrs. After 2 hrs
the effect was back to mild and normal level. Normal activity was considered as
zero level. At 0.478 mg/kg (10% of LD50), same activities were observed and
marked stimulant effects continued from 2 to 4 hrs and mild effect remained upto

129
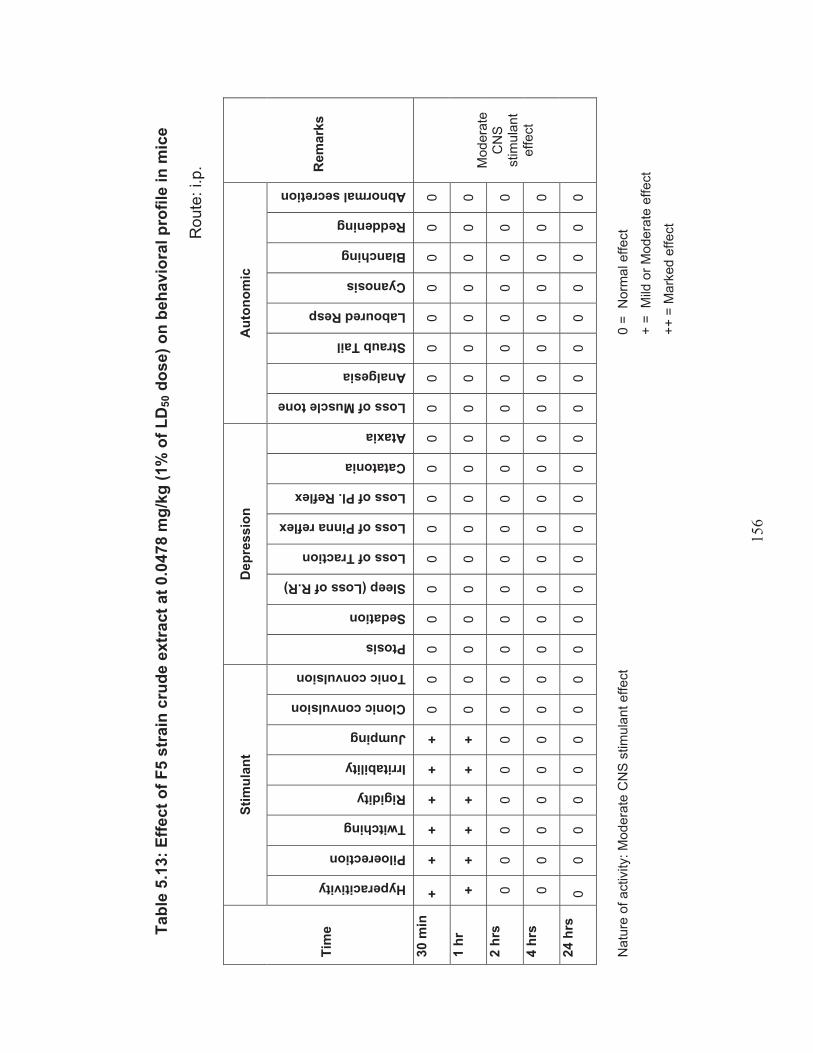
24 hrs (Table 5.12). No marked effects were recorded at both concentrations of
F5 strain and only mild effects were observed during 0.5 and 1 hr (Table 5.13
and Table 5.14). No marked effects were observed for control group (saline
received) (Table 5.5).
Statistical analysis
Statistically significant activity was exhibited by fish toxin followed by F3
and F5 strains. Paw edema inducing activity of fish toxin was found to be
statistically significant (P < 0.05) while comparing with F3 and F5. The results of
one way ANOVA are denoted in the table 5.16. For locomotor activity, fish toxin
exhibited statistically significant effect (P < 0.05) than standard caffeine, F3 and
F5 strains. Significant variance was observed when the locomotor activity of
caffeine was compared with the activity of fish toxin, F3 and F5 strains and
similar variance was observed once again when the locomotor activity of fish
toxin is compared with F3 and F5 strain. But there is no significant variance
between the locomotor activity of F3 and F5 strains. Table 5.17 shows the one
way ANOVA results of CNS activity.
DISCUSSION
Venomous creatures have been the source of much recent research in the
effort to find novel physiological tools and pharmaceuticals. Pharmacological
studies have been limited to the venoms of stingrays, scorpionfish, zebrafish,

130
toadfish, weeverfish, stonefish, stargrazers and some species of shark, catfish,
surgeonfish due to the technical difficulties of collecting venom and their marked
instability (Weiner 1959; Austin et al., 1965; Perriere et al., 1988). Hence the
venom of marine animals, particularly fishes remains a largely untapped source
of novel compounds (Church and Hodgson, 2002). Naturally, toxins have evolved
in plants, animals and microbes as a part of defensive and/or prey capture
strategies (Lewis and Garcia, 2003).
Some studies have investigated bacteria from venomous marine animals
and revealed associated bacteria as a potential source of toxin (Noguchi et al.,
1986; Yasumoto et al., 1986; Yotsu et al., 1987). There are many debates on
origin of Tetrodotoxins in TTX bearing organisms and the best-supported
hypothesis is TTXs are produced by symbiotic bacteria. It is evident that TTXs
have been detected in at least 15 genera of bacteria from TTX-bearing marine
animals, seawater or sediment (William, 1993).
In the present study, the molecular weight of fish toxin protein was
determined by SDS-PAGE electrophoresis. Three distinctive bands were
observed between 47 and 29 kDa. Obtained results are comparable to the
results of Karmakar et al. (2004) who found 18.1 kDa weight protein from the
venom of butterfish Scatophagus argus. It is notable that crude toxin was used in
the present work.

131
In lethality test, the toxicity of fish toxin was found to be very high followed
by bacterial extract of F3 and F5. To study the toxicity, LD50 value was estimated.
LD50 (i.p.) of fish toxin was estimated to be 4.25 mg/kg body weight. The LD50
value obtained for fish toxin was lower when compared with other piscine
venoms such as the stonefish Synanceia horrida which exhibited an LD50 value
of 0.36 mg/g after 24 hrs intra-venous injection (Poh et al., 1991). Similarly, LD50
of stone fishes, S. trachynis and Scorpaena plumieri was reported as 1.6 mg/Kg
and 280 µg/kg respectively (Kreger 1991; Carrijo et al., 2005). Lionfish Pterios
volitans exhibited LD50 of 42.5 µg/kg b.w. in mice (Sri Balasubashini et al.,
2006c). The crude venom extract of greater weeverfish, Trachinus draco, had a
lethal dose of 1.8 mg/g (Chhatwal and Dreyer, 1992a). However, the observed
value in the present study is closer to toadfish species Thalassophryne nattereri
and T. maculosa which exhibited lethality to mice at 4.54 mg/kg and 4.93 mg/kg
respectively (Lopes-Ferreira et al., 1998; Sosa-Rosales et al., 2005b). Likewise,
Indian catfish Plotosus canius fish venom showed lethality dose at 3.9 mg/kg
(i.p.) (Auddy et al., 1994; 1995).
One of the major systemic manifestations of piscine envenomation is
edema inducing effect. Edema formation is a common feature of the cutaneous
inflammatory processes (Brain and Williams, 1985). Fish venoms are known to
induce intense and sustained edematogenic response in mice. Sivan (2009)
reported that stonefish envenomation causes intense swelling at the site of the

132
stings. The swelling persist for 2 – 4 days even after treatment with antivenin.
Poh et al. (1991) found that stonustoxin exhibited potent inflammation lasting for
more than 24 hrs after injection in mouse hind paw. The present study
substantiates these observations; fish toxin produced edema effect which
persisted more than 24 hrs at higher doses. This is attributed to the role of
histamines, released from mast cells which causing vasodilation and increasing
vascular permeability is ruled out as pheneramine maleate, an antihistamine,
was unable to block or reduce the edematic activity (Sivan et al., 2007). The
maximal edematic effect was observed from 0.5 to 2 hrs in the present study and
align with Sivan et al. (2007) who observed relatively similar maximal response in
venom of S. argus for 1 to 3 hrs. The edematogenic response was absent during
last time-point for both venoms of Potamotrygon cf. scobina and Potamotrygon
gr. Orbignyi (Magalhaes et al., 2006) which coincides with the effects observed in
both fish toxin and bacterial extracts. Lopes-Ferreira et al. (2004) observed
edema induction by T. nattereri venom and attributed the effect to protease with
tissue-kallikrein-like activity.
F3 strain produced relatively similar edematic effects as fish toxin while F5
strain exhibited comparatively lower edema effects. It was confirmed by the
results; 4.00 ± 0.080 and 4.09 ± 0.075 mm were maximal edematic effects of F3
strain during 0.5 to 2 hrs respectively after injection which coincides with fish
P. lineatus toxin (4.08 ± 0.03 and 4.17 ± 0.04 mm) during the same time course
133
as above. Additionally, both fish toxin and F3 strain exhibited maximal edematic
effects which persisted upto 24 hrs while F5 strain showed relatively lower
edematic effect (3.66 ± 0.104 mm) and it almost back to the normal paw
thickness after the 30 mins.
Next to cardiovascular effect, neuromuscular activity is the prominent
effect of piscine venoms (Sivan, 2009). Neuromodulatory effects of venom are
one of the areas of importance having profound usefulness in pharmacology and
neurophysiological studies. The neuromuscular properties of fish venom have
been well studied. Piscine venom has been reported to produce neurotoxic
symptoms such as paralysis, convulsions and muscular weakness and at higher
doses respiratory cessation, which leads to death, when injected into
experimental animals (Saunders, 1959; Saunders and Taylor, 1959; Weiner,
1959; Austin et al., 1961; Nair et al., 1985; Fahim et al., 1996; Breton et al., 1999;
Carrijo et al., 2005; Sivan et al., 2007).
In the present study both fish toxin and bacterial strain (F3) exhibited
neuromuscular blocking effects on frog abdomen rectus muscle preparation. The
observed neuromuscular blocking effects may be due to massive
neurotransmitter release at low concentrations and muscle and nerve damage at
higher concentrations (Kreger et al., 1993). The obtained results are similar to
Cohen and Olek (1989) who reported that P. volitans venom induced a period of
134
muscle fibrillation followed by neuromuscular blockade. Likewise, the stonefish
crude venom of S. trachynis caused vertebrate neuromuscular blockade by
eliciting the release and depletion of neurotransmitter from the nerve terminal
(Kreger et al., 1993). Garnier et al. (1997) found evidence for Ca2+ channel
blocking activity of verrucotoxin from S. verrucosa venom. The stonustoxin
(SNTX) of Synanceja horrida was also reported to produce a rapid and
concentration-dependent inhibition of neuromuscular function in mouse
hemidiaphragm and chick biventer cervicis muscle relying on Ca2+ release and
activation (Low et al., 1990). It is noted that venoms are in fact a milieu of
substances, interacting with another to produce an overall response in an animal
or tissue (Church et al., 2003).
F5 strain extract produced neuromuscular contractile response that
coincides with the effect of Plotosus canius toxin which caused contracture of
chick biventer cervices muscle (Auddy et al., 1995). Fish toxin produced
neuromuscular blocking effect which coincides with the effect of F3 strain but not
to F5 strain. F5 extract produced neuromuscular contractile response on the
abdomen rectus muscle by not inhibiting the activity of acetylcholine which is
located in the external organ bath during the experiment. This kind of response is
directly opposite to the blocking effect.
135
Fish toxin, F3 and F5 strains induced locomotor activity (CNS stimulant) of
mice. Extracts from other animals have also been reported to show CNS
stimulant activity such as Echinodermata (Acanthaster planci), mollusc (Melibe
rangi, Nerita spp), Porifera (Ircina ramosa) and Arthropoda (Leptodius
arassimanus) (Naik et al., 1989; 1990). Intracerebral injection of snake Echis
carinatus venom at 400 µg/kg into mice showed characteristic CNS stimulant
activity (Reddy and Gawade, 2006). The above studies supports the present
study in which fish toxin and F3 strain (at 4 mg/kg i.p) produced marked CNS
stimulant activity. Interestingly, F3 strain showed similar effects as fish toxin.
In behavioral studies, fish toxin and bacterial strain F3 exhibited marked
stimulant effects especially during 2 and 4 hrs. The marked stimulant effects
were observed in fish toxin and F3 strain at 0.427 mg/kg and 0.478 mg/kg
concentration respectively. Moreover, effects were extended up to 24 hrs for both
fish toxin and F3 strain. These effects were not observed in F5 strain. The mild
effects of fish toxin and F3 strain during 24 hrs shows that the drug is not yet
completely excreted before 24 hrs. No convulsion effects were found during the
experiment at both concentration of fish toxin which indicates the safety drug
nature, because long term effect of convulsion could lead to the death of
experimental animal. On the other hand no depressant and autonomous effects
were observed for both concentrations of fish toxin indicating the CNS stimulant
activity.

136
Most of the pharmacological observations suggest F3 strain exhibits
relatively similar effects to fish P. lineatus toxin in lethality, paw edema, CNS
stimulant, neuromuscular and behavioral studies. This study gives a clue that the
compounds responsible for activity may be originated from gland associated
bacteria. A better understanding of this study could lead us to the development of
new therapeutic strategies complementary to conventional therapy. The
associated bacteria F3 strain was selected for further studies.
Fig. 5.1: SDS-PAGE of the fish P. lineatus toxin
(M- Molecular weight markers; FT- Fish toxin)
M FT

13
7
Tab
le 5
.1:
Esti
mati
on
of
Paw
ed
em
a-i
nd
ucin
g a
cti
vit
y o
f fi
sh
P.
lin
eatu
s t
oxin
Do
se
mg
/kg
Me
an
of
Th
ick
ne
ss
of
Pa
w (
mm
)
Be
fore
dru
g A
d.
Aft
er
30
m
ins
12
0 m
ins
3
60
min
s
54
0 m
ins
2
4 h
ou
r 4
8 h
ou
r
Un
tre
ate
d
1.9
5±0
.17
1
.95
±0
.17
1
.95
±0
.17
1
.95
±0
.17
1.9
5±0
.17
1.9
5±0
.17
1.9
5±0
.17
Co
ntr
ol (0
.9 %
Sa
line
) 1
.64
±0
.03
3
.35
±0
.04
1
.85
±0
.04
1
.74
±0
.03
1.6
7±0
.03
1.6
6±0
.03
1.6
5±0
.03
Cru
de
fis
h to
xin
0.5
mg
/pa
w
1.6
6±0
.03
3
.38
±0
.03
1
.98
±0
.03
1
.86
±0
.03
1.8
0±0
.03
1.7
6±0
.02
1.6
7±0
.03
1.5
mg
/pa
w
1.6
2±0
.10
3
.42
±0
.09
3
.32
±0
.08
2
.31
±0
.07
1.9
1±0
.07
1.7
7±0
.08
1.6
3±0
.10
2.5
mg
/pa
w
1.7
2±0
.11
3
.84
±0
.08
3
.79
±0
.08
3
.30
±0
.07
2.4
4±0
.14
1.7
9±0
.09
1.7
3±0
.11
4 m
g/p
aw
1
.61
±0
.03
4
.08
±0
.03
4
.17
±0
.04
4
.10
±0
.04
3.8
3±0
.04
3.0
1±0
.03
1.8
6±0
.05
(
Re
su
lts –
Me
an
± S
EM
)

13
8
Tab
le 5
.2:
Esti
mati
on
of
Paw
ed
em
a-i
nd
ucin
g a
cti
vit
y o
f p
ote
nt
str
ain
s i
so
late
d f
rom
ven
om
gla
nd
of
fish
P.
lin
ea
tus
os
e m
g/k
g
Me
an
of
Th
ick
ne
ss
of
Pa
w (
mm
)
Be
fore
dru
gA
dm
n.
Aft
er
30
m
ins
12
0 m
ins
3
60
min
s
54
0 m
ins
2
4 h
ou
r 4
8 h
ou
r
Un
tre
ate
d1.6
0±0
.06
5
1.6
0±0
.06
5
1.6
0±0.0
65
1.6
0±0.0
65
1.6
0±0.0
65
1.6
0±0.0
65
1.6
0±0.0
65
Co
ntr
ol (S
alin
e)
1.6
0±0
.04
8
3.3
3±0
.03
8
1.7
9±0.0
47
1.6
9±0.0
45
1.6
2±0.0
50
1.6
0±0.0
50
1.6
0±0.0
50
F3
str
ain
0.5
mg
/pa
w
1.5
1±0
.05
8
3.3
3±0
.06
2
1.8
2±0.0
61
1.7
2±0.0
57
1.6
2±0.0
54
1.5
6±0.0
57
1.5
3±0.0
58
1.5
mg
/pa
w
1.6
0±0
.07
8
3.7
6±0
.07
0
3.6
4±0.0
72
2.6
4±0.0
65
2.2
3±0.0
84
1.7
3±0.0
70
1.6
2±0.0
77
2.5
mg
/pa
w
1.5
0±0
.05
6
3.7
0±0
.05
4
3.6
6±0.0
53
3.1
7±0.0
54
2.6
5±0.0
55
1.6
2±0.0
61
1.5
1±0.0
56
4 m
g/p
aw
1.4
8±0
.07
6
4.0
0±0
.08
0
4.0
9±0.0
75
4.0
3±0.0
85
3.8
3±0.0
90
3.0
3±0.0
96
1.7
7±0.0
63
F5
str
ain
0.5
mg
/pa
w
1.7
1±0
.02
5
3.7
2±0
.05
1
1.6
5±0.0
86
1.7
6±0.0
25
1.7
3±0.0
22
1.7
2±0.0
23
1.7
1±0.0
25
1.5
mg
/pa
w
1.6
2±0
.02
2
3.6
2±0
.04
4
1.8
3±0.0
25
1.7
2±0.0
32
1.6
8±0.0
29
1.6
4±0.0
23
1.6
3±0.0
22
2.5
mg
/pa
w
1.5
9±0
.04
0
3.6
1±0
.04
9
1.8
9±0.0
32
1.7
1±0.0
33
1.6
6±0.0
34
1.6
3±0.0
36
1.6
1±0.0
37
4 m
g/p
aw
1.5
3±0
.05
6
3.6
6±0
.10
4
1.8
8±0.0
61
1.7
1±0.0
58
1.6
4±0.0
58
1.6
0±0.0
56
1.5
8±0.0
59
(
Results –
Mean ±
SE
M)
139
Fig. 5.2: Dose response curve of Acetylcholine in the presence and absence of
0.9% Saline (Control)
Fig. 5.3: Dose response curve of Acetylcholine in the presence and absence of
Pancuronium at 2 µg/ml (Standard)

140
Fig. 5.4: Dose response curve of Acetylcholine in the presence and absence of
fish toxin at 1 µg/ml
Fig. 5.5: Dose response curve of Acetylcholine in the presence and absence of
fish toxin at 2.5 µg/ml

141
Fig. 5.6: Dose response curve of Acetylcholine in the presence and absence of
fish toxin at 5 µg/ml
Fig. 5.7: Dose response curve of Acetylcholine in the presence and absence of
fish toxin at 10 µg/ml

142
Fig. 5.8: Dose response curve of Acetylcholine in the presence and absence of
Butanol (Control)
Fig. 5.9: Dose response curve of Acetylcholine in the presence and absence of
Pancuronium at 2 µg/ml (Standard)

143
Fig. 5.10: Dose response curve of Acetylcholine in the presence and absence of
F3 strain extract at 1 µg/ml
Fig. 5.11: Dose response curve of Acetylcholine in the presence and absence of
F3 strain extract at 2.5 µg/ml
144
Fig. 5.12: Dose response curve of Acetylcholine in the presence and absence of
F3 strain extract at 5 µg/ml
Fig. 5.13: Dose response curve of Acetylcholine in the presence and absence of
F3 strain extract at 10 µg/ml

145
Fig. 5.14: Dose response curve of Acetylcholine in the presence and absence of
F5 strain extract at 1 µg/ml
Fig. 5.15: Dose response curve of Acetylcholine in the presence and absence of
F5 strain extract at 2.5 µg/ml

146
Fig. 5.16: Dose response curve of Acetylcholine in the presence and absence of
F5 strain extract at 5 µg/ml
Fig. 5.17: Dose response curve of Acetylcholine in the presence and absence of
F5 strain extract at 10 µg/ml
147
Table 5.3: Effect of fish P. lineatus toxin on locomotor activity (CNS
stimulant activity)
TreatmentDose
mg/kg & Route
Mean locomotor activity (Scores) in 10 minutes
Before After % change in
activity
Untreated - 132±3.16 132.2±2.28 1.05
Control (1 % Saline) - 158±3.16 161.6±4.77 2.26
Standard (Caffeine) 30 mg/kg i.p. 156±3.16 214.4±3.84 36.21
Crude fish toxin
Conc.1 0.5 mg/kg i.p. 168±4.47 170.4±3.84 1.43
Conc.2 1.5 mg/kg i.p. 156±3.16 166±3.74 6.41
Conc.3 2.5 mg/kg i.p. 180.8±4.14 204.4±4.77 13.07
Conc.4 4 mg/kg i.p. 156.4±3.84 234.4±3.84 49.96
(Results – Mean ± SD)
Table 5.4: Effect of potent strains isolated from venom gland of fish
P. lineatus on locomotor activity (CNS stimulant activity)
TreatmentDose
mg/kg & Route
Mean locomotor activity (Scores) in 10 minutes
Before After % change in
activity
Untreated - 118.8±2.28 120±2.0 1.02
Control (1% saline) - 122±3.16 122.8±1.78 1.32
Standard (Caffeine) 30 mg/kg i.p. 128±3.16 178.8±5.40 39.67
F3 strain
Conc.1 0.5 mg/kg i.p. 141.2±2.28 143.6±3.84 1.68
Conc.2 1.5 mg/kg i.p. 140±2.0 142.4±2.96 1.70
Conc.3 2.5 mg/kg i.p. 129.6±2.60 142.8±3.03 10.18
Conc.4 4 mg/kg i.p. 120.8±2.28 172.8±3.03 43.05
F5 strain
Conc.1 0.5 mg/kg i.p. 139.2±2.28 140.4±2.60 0.85
Conc.2 1.5 mg/kg i.p. 148±3.16 149.6±3.84 1.07
Conc.3 2.5 mg/kg i.p. 129.6±2.60 135.6±3.84 5.26
Conc.4 4 mg/kg i.p. 132±3.16 164.4±4.77 24.53
(Results – Mean ± SD)

148
Tab
le 5
.5:
Eff
ect
of
0.9
% s
alin
e (
Co
ntr
ol)
on
beh
avio
ral
pro
file
in
mic
e
Ro
ute
: i.p
.
Tim
e
Sti
mu
lan
t D
ep
ressio
n
Au
ton
om
ic
Re
ma
rks
Hyperacitivity
Piloerection
Twitching
Rigidity
Irritability
Jumping
Clonic convulsion
Tonic convulsion
Ptosis
Sedation
Sleep (Loss of R.R)
Loss of Traction
Loss of Pinna reflex
Loss of Pl. Reflex
Catatonia
Ataxia
Loss of Muscle tone
Analgesia
Straub Tail
Laboured Resp
Cyanosis
Blanching
Reddening
Abnormal secretion
30 m
in
0
0
0
0
0
0
0
0
0
0
0
0
0
0
0
0
0
0
0
0
0
0
0
0
No m
ark
ed
effe
cts
are
fo
und
1 h
r 0
0
0
0
0
0
0
0
0
0
0
0
0
0
0
0
0
0
0
0
0
0
0
0
2 h
rs
0
0
0
0
0
0
0
0
0
0
0
0
0
0
0
0
0
0
0
0
0
0
0
0
4 h
rs
0
0
0
0
0
0
0
0
0
0
0
0
0
0
0
0
0
0
0
0
0
0
0
0
24
hrs
0
0
0
0
0
0
0
0
0
0
0
0
0
0
0
0
0
0
0
0
0
0
0
0
Natu
re o
f activity:
No m
ark
ed e
ffects
0 =
N
orm
al effect
+
= M
ild o
r M
od
era
te e
ffe
ct
+
+ =
Ma
rked
effe
ct

149
Ta
ble
5.6
: E
ffe
ct
of
Caff
ein
e a
t 30 m
g/k
g (
Sti
mu
lan
t S
tan
dard
) o
n b
eh
avio
ral
pro
file
in
mic
e
R
oute
: i.p.
Tim
e
Sti
mu
lan
t D
ep
ressio
n
Au
ton
om
ic
Re
ma
rks
Hyperacitivity
Piloerection
Twitching
Rigidity
Irritability
Jumping
Clonic convulsion
Tonic convulsion
Ptosis
Sedation
Sleep (Loss of R.R)
Loss of Traction
Loss of Pinna reflex
Loss of Pl. Reflex
Catatonia
Ataxia
Loss of Muscle tone
Analgesia
Straub Tail
Laboured Resp
Cyanosis
Blanching
Reddening
Abnormal secretion
30 m
in
+
+
+
+
+
+
0
0
0
0
0
0
0
0
0
0
0
0
0
0
0
0
0
0
Ma
rke
dC
NS
stim
ula
nt
effect
1 h
r +
+
+
+
+
+
0
0
0
0
0
0
0
0
0
0
0
0
0
0
0
0
0
0
2 h
rs
++
+
+
++
+
+
++
+
+
0
0
0
0
0
0
0
0
0
0
0
0
0
0
0
0
0
0
4 h
rs
++
+
+
++
+
+
++
+
+
0
0
0
0
0
0
0
0
0
0
0
0
0
0
0
0
0
0
24
hrs
0
0
0
0
0
0
0
0
0
0
0
0
0
0
0
0
0
0
0
0
0
0
0
0
Natu
re o
f activity:
Mark
ed C
NS
stim
ula
nt effect
0 =
N
orm
al effect
+
= M
ild o
r M
od
era
te e
ffe
ct
+
+ =
Ma
rked
effe
ct

150
Ta
ble
5.7
: E
ffe
ct
of
Ch
lorp
rom
azin
e a
t 3 m
g/k
g (
Dep
ressan
t sta
nd
ard
) o
n b
eh
avio
ral
pro
file
in
mic
e
Route
: i.p.
Tim
e
Sti
mu
lan
t D
ep
ressio
n
Au
ton
om
ic
Re
ma
rks
Hyperacitivity
Piloerection
Twitching
Rigidity
Irritability
Jumping
Clonic convulsion
Tonic convulsion
Ptosis
Sedation
Sleep (Loss of R.R)
Loss of Traction
Loss of Pinna reflex
Loss of Pl. Reflex
Catatonia
Ataxia
Loss of Muscle tone
Analgesia
Straub Tail
Laboured Resp
Cyanosis
Blanching
Reddening
Abnormal secretion
30 m
in
0
0
0
0
0
0
0
0
+
+
+
+
+
+
+
+
+
+
0
0
0
0
0
0
Ma
rke
dC
NS
Depre
ssant
effect
1 h
r 0
0
0
0
0
0
0
0
+
+
+
+
+
+
+
+
+
+
0
0
0
0
0
0
2 h
rs
0
0
0
0
0
0
0
0
++
+
+
++
+
+
++
++
+
+
++
+
+
++
0
0
0
0
0
0
4 h
rs
0
0
0
0
0
0
0
0
++
+
+
++
+
+
++
++
+
+
++
+
+
++
0
0
0
0
0
0
24
hrs
0
0
0
0
0
0
0
0
0
0
0
0
0
0
0
0
0
0
0
0
0
0
0
0
Natu
re o
f activity: M
ark
ed
CN
S d
epre
ssant
effect
0 =
N
orm
al effect
+
= M
ild o
r M
od
era
te e
ffe
ct
+
+ =
Ma
rked
effe
ct
151
Ta
ble
5.8
: E
ffe
ct
of
Neo
sti
gm
ine a
t 0.0
7 m
g/k
g (
Au
ton
om
ic s
tan
dard
) o
n b
eh
avio
ral
pro
file
in
mic
e
Route
: i.p
Tim
e
Sti
mu
lan
t D
ep
ressio
n
Au
ton
om
ic
Re
ma
rks
Hyperacitivity
Piloerection
Twitching
Rigidity
Irritability
Jumping
Clonic convulsion
Tonic convulsion
Ptosis
Sedation
Sleep (Loss of R.R)
Loss of Traction
Loss of Pinna reflex
Loss of Pl. Reflex
Catatonia
Ataxia
Loss of Muscle tone
Analgesia
Straub Tail
Laboured Resp
Cyanosis
Blanching
Reddening
Abnormal secretion
30 m
in
0
0
0
0
0
0
0
0
0
0
0
0
0
0
0
0
0
0
+
+
0+
+
+
Ma
rke
d C
NS
auto
nom
ic
effect
1 h
r 0
0
0
0
0
0
0
0
0
0
0
0
0
0
0
0
0
0
+
+
0
+
+
+
2 h
rs
0
0
0
0
0
0
0
0
0
0
0
0
0
0
0
0
0
0
++
+
+
0+
++
+
++
4 h
rs
0
0
0
0
0
0
0
0
0
0
0
0
0
0
0
0
0
0
++
+
+
0+
++
+
++
24
hrs
0
0
0
0
0
0
0
0
0
0
0
0
0
0
0
0
0
0
0
0
0
0
0
0
Natu
re o
f activity:
Mark
ed C
NS
auto
nom
ic e
ffect
0 =
N
orm
al effect
+
= M
ild o
r M
od
era
te e
ffe
ct
+
+ =
Ma
rked
effe
ct

152
Ta
ble
5.9
: E
ffe
ct
of
Cru
de
fis
h P
. li
ne
atu
s t
oxin
at
0.0
427 m
g/k
g (
1%
of
LD
50 d
ose)
on
beh
avio
ral
pro
file
in
mic
e
Route
: i.p
Tim
e
Sti
mu
lan
t D
ep
ressio
n
Au
ton
om
ic
Re
ma
rks
Hyperacitivity
Piloerection
Twitching
Rigidity
Irritability
Jumping
Clonic convulsion
Tonic convulsion
Ptosis
Sedation
Sleep (Loss of R.R)
Loss of Traction
Loss of Pinna reflex
Loss of Pl. Reflex
Catatonia
Ataxia
Loss of Muscle tone
Analgesia
Straub Tail
Laboured Resp
Cyanosis
Blanching
Reddening
Abnormal secretion
30 m
in
+
+
+
+
+
+
0
0
0
0
0
0
0
0
0
0
0
0
0
0
0
0
0
0
Ma
rke
dC
NS
stim
ula
nt
effect
1 h
r +
+
+
+
+
+
0
0
0
0
0
0
0
0
0
0
0
0
0
0
0
0
0
0
2 h
rs
++
+
+
++
+
+
++
+
+
0
0
0
0
0
0
0
0
0
0
0
0
0
0
0
0
0
0
4 h
rs
++
+
+
++
+
+
++
+
+
0
0
0
0
0
0
0
0
0
0
0
0
0
0
0
0
0
0
24
hrs
0
0
0
0
0
0
0
0
0
0
0
0
0
0
0
0
0
0
0
0
0
0
0
0
Natu
re o
f activity:
Mark
ed C
NS
stim
ula
nt effect
0 =
N
orm
al effect
+
= M
ild o
r M
od
era
te e
ffe
ct
+
+ =
Ma
rked
effe
ct

153
Tab
le 5
.10:
Eff
ect
of
Cru
de f
ish
P.
lin
eatu
s t
oxin
at
0.4
27 m
g/k
g (
10
% o
f L
D50 d
ose)
on
beh
avio
ral
pro
file
in
mic
e
Route
: i.p
Tim
e
Sti
mu
lan
t D
ep
ressio
n
Au
ton
om
ic
Re
ma
rks
Hyperacitivity
Piloerection
Twitching
Rigidity
Irritability
Jumping
Clonic convulsion
Tonic convulsion
Ptosis
Sedation
Sleep (Loss of R.R)
Loss of Traction
Loss of Pinna reflex
Loss of Pl. Reflex
Catatonia
Ataxia
Loss of Muscle tone
Analgesia
Straub Tail
Laboured Resp
Cyanosis
Blanching
Reddening
Abnormal secretion
30 m
in
+
+
+
+
+
+
0
0
0
0
0
0
0
0
0
0
0
0
0
0
0
0
0
0
Ma
rke
dC
NS
stim
ula
nt
effect
1 h
r +
+
++
+
+
++
+
+
++
0
0
0
0
0
0
0
0
0
0
0
0
0
0
0
0
0
0
2 h
rs
++
+
+
++
+
+
++
+
+
0
0
0
0
0
0
0
0
0
0
0
0
0
0
0
0
0
0
4 h
rs
++
+
+
++
+
+
++
+
+
0
0
0
0
0
0
0
0
0
0
0
0
0
0
0
0
0
0
24
hrs
+
+
+
+
+
+
0
0
0
0
0
0
0
0
0
0
0
0
0
0
0
0
0
0
Natu
re o
f activity:
Mark
ed C
NS
stim
ula
nt effect
0 =
N
orm
al effect
+
= M
ild o
r M
od
era
te e
ffe
ct
+
+ =
Ma
rked
effe
ct

154
Tab
le 5
.11:
Eff
ect
of
F3 s
train
cru
de e
xtr
act
at
0.0
478 m
g/k
g(1
% o
f L
D5
0 d
ose)
on
beh
avio
ral
pro
file
in
mic
e
Route
: i.p
Tim
e
Sti
mu
lan
t D
ep
ressio
n
Au
ton
om
ic
Re
ma
rks
Hyperacitivity
Piloerection
Twitching
Rigidity
Irritability
Jumping
Clonic convulsion
Tonic convulsion
Ptosis
Sedation
Sleep (Loss of R.R)
Loss of Traction
Loss of Pinna reflex
Loss of Pl. Reflex
Catatonia
Ataxia
Loss of Muscle tone
Analgesia
Straub Tail
Laboured Resp
Cyanosis
Blanching
Reddening
Abnormal secretion
30 m
in
+
+
+
+
+
+
0
0
0
0
0
0
0
0
0
0
0
0
0
0
0
0
0
0
Ma
rke
dC
NS
stim
ula
nt
effect
1 h
r +
+
+
+
+
+
0
0
0
0
0
0
0
0
0
0
0
0
0
0
0
0
0
0
2 h
rs
++
+
+
++
+
+
++
+
+
0
0
0
0
0
0
0
0
0
0
0
0
0
0
0
0
0
0
4 h
rs
+
+
+
+
+
+
0
0
0
0
0
0
0
0
0
0
0
0
0
0
0
0
0
0
24
hrs
0
0
0
0
0
0
0
0
0
0
0
0
0
0
0
0
0
0
0
0
0
0
0
0
Natu
re o
f activity:
Mark
ed C
NS
stim
ula
nt e
ffe
ct
0
= N
orm
al
+
= M
ild o
r M
od
era
te e
ffe
ct
+
+ =
Ma
rked
effe
ct

155
Tab
le 5
.12:
Eff
ect
of
F3 s
train
cru
de e
xtr
act
at
0.4
78 m
g/k
g(1
0%
of
LD
50 d
ose)
on
beh
avio
ral
pro
file
in
mic
e
Ro
ute
: i.p
.
Tim
e
Sti
mu
lan
t D
ep
ressio
n
Au
ton
om
ic
Re
ma
rks
Hyperacitivity
Piloerection
Twitching
Rigidity
Irritability
Jumping
Clonic convulsion
Tonic convulsion
Ptosis
Sedation
Sleep (Loss of R.R)
Loss of Traction
Loss of Pinna reflex
Loss of Pl. Reflex
Catatonia
Ataxia
Loss of Muscle tone
Analgesia
Straub Tail
Laboured Resp
Cyanosis
Blanching
Reddening
Abnormal secretion
30 m
in
+
+
+
+
+
+
0
0
0
0
0
0
0
0
0
0
0
0
0
0
0
0
0
0
Ma
rke
dC
NS
stim
ula
nt
effect
1 h
r +
+
+
+
+
+
0
0
0
0
0
0
0
0
0
0
0
0
0
0
0
0
0
0
2 h
rs
++
+
+
++
+
+
++
+
+
0
0
0
0
0
0
0
0
0
0
0
0
0
0
0
0
0
0
4 h
rs
++
+
+
++
+
+
++
+
+
0
0
0
0
0
0
0
0
0
0
0
0
0
0
0
0
0
0
24
hrs
+
++
++
+0
0
0
0
0
0
0
0
0
0
0
0
0
0
0
0
0
0
Natu
re o
f activity:
Mark
ed C
NS
stim
ula
nt effect
0 =
N
orm
al effect
+
= M
ild o
r M
od
era
te e
ffe
ct
+
+ =
Ma
rked
effe
ct
156
Tab
le 5
.13:
Eff
ect
of
F5 s
train
cru
de e
xtr
act
at
0.0
478 m
g/k
g(1
% o
f L
D5
0 d
ose)
on
beh
avio
ral
pro
file
in
mic
e
R
oute
: i.p.
Tim
e
Sti
mu
lan
t D
ep
ressio
n
Au
ton
om
ic
Re
ma
rks
Hyperacitivity
Piloerection
Twitching
Rigidity
Irritability
Jumping
Clonic convulsion
Tonic convulsion
Ptosis
Sedation
Sleep (Loss of R.R)
Loss of Traction
Loss of Pinna reflex
Loss of Pl. Reflex
Catatonia
Ataxia
Loss of Muscle tone
Analgesia
Straub Tail
Laboured Resp
Cyanosis
Blanching
Reddening
Abnormal secretion
30 m
in
+
+
+
+
+
+
0
0
0
0
0
0
0
0
0
0
0
0
0
0
0
0
0
0
Mo
dera
te
CN
Sstim
ula
nt
effect
1 h
r +
+
+
+
+
+
0
0
0
0
0
0
0
0
0
0
0
0
0
0
0
0
0
0
2 h
rs
0
0
0
0
0
0
0
0
0
0
0
0
0
0
0
0
0
0
0
0
0
0
0
0
4 h
rs
0
0
0
0
0
0
0
0
0
0
0
0
0
0
0
0
0
0
0
0
0
0
0
0
24
hrs
0
0
0
0
0
0
0
0
0
0
0
0
0
0
0
0
0
0
0
0
0
0
0
0
Natu
re o
f activity: M
odera
te C
NS
stim
ula
nt eff
ect
0 =
N
orm
al effect
+
= M
ild o
r M
od
era
te e
ffe
ct
+
+ =
Ma
rked
effe
ct

157
Tab
le 5
.14 E
ffect
of
F5 s
train
cru
de e
xtr
act
at
0.4
78 m
g/k
g(1
0%
of
LD
50 d
ose)
on
beh
avio
ral
pro
file
in
mic
e
Route
: i.p.
Tim
e
Sti
mu
lan
t D
ep
ressio
n
Au
ton
om
ic
Re
ma
rks
Hyperacitivity
Piloerection
Twitching
Rigidity
Irritability
Jumping
Clonic convulsion
Tonic convulsion
Ptosis
Sedation
Sleep (Loss of R.R)
Loss of Traction
Loss of Pinna reflex
Loss of Pl. Reflex
Catatonia
Ataxia
Loss of Muscle tone
Analgesia
Straub Tail
Laboured Resp
Cyanosis
Blanching
Reddening
Abnormal secretion
30 m
in
+
+
+
+
+
+
0
0
0
0
0
0
0
0
0
0
0
0
0
0
0
0
0
0
Mo
dera
te
CN
Sstim
ula
nt
effect
1 h
r +
+
+
+
+
+
0
0
0
0
0
0
0
0
0
0
0
0
0
0
0
0
0
0
2 h
rs
++
++
++
0
0
0
0
0
0
0
0
0
0
0
0
0
0
0
0
0
0
4 h
rs
0
0
0
0
0
0
0
0
0
0
0
0
0
0
0
0
0
0
0
0
0
0
0
0
24
hrs
0
0
0
0
0
0
0
0
0
0
0
0
0
0
0
0
0
0
0
0
0
0
0
0
Natu
re o
f activity: M
odera
te C
NS
stim
ula
nt eff
ect
0 =
N
orm
al effect
+
= M
ild o
r M
od
era
te e
ffe
ct
+
+ =
Ma
rked
effe
ct

158
Table 5.16: One-way ANOVA on Paw edema inducing activity between fish toxin and bacterial strains
Source of Variation SS df MS F P-value Remarks
Fish toxin Vs F3 strain 0.118422 1 0.118422 18.91729 5.38E-05 ** Columns 50.18723 5 10.03745
Total 50.7136 71
Fish toxin Vs F5 strain 36.6368 1 36.6368 9615.958 6.11E-68 ** Columns 31.52516 5 6.305032 Total 82.06978 71
** Significant (P < 0.05)

159
Table 5.17: One-way ANOVA on CNS stimulant activity between Caffeine (Standard), fish toxin and bacterial strains
Source of Variation SS df MS F P-value Remarks
Caffeine Vs Fish toxin 627.2 1 627.2 46.11765 4.33E-06 ** Columns 22579.2 1 22579.2 Total 24007.2 19
Caffeine Vs F3 strain 217.8 1 217.8 16.25373 0.000966 ** Columns 13209.8 1 13209.8 Total 13643.8 19
Caffeine Vs F5 strain 135.2 1 135.2 7.511111 0.01451 ** Columns 8652.8 1 8652.8 Total 9499.2 19
Fish toxin Vs F3 strain 11809.8 1 11809.8 1073.618 4.27E-16 ** Columns 21125 1 21125 Total 33955.8 19
Fish toxin Vs F5 strain 11139.2 1 11139.2 714.0513 1.06E-14 ** Columns 15235.2 1 15235.2 Total 29223.2 19
F3 strain Vs F5 strain 9.8 1 9.8 0.830508 0.375652 NS Columns 8904.2 1 8904.2 Total 9583 19
** Significant (P < 0.05); NS - Not significant


![Pharmacological management for agitation and … Professionals/Pharmacological... · [Intervention Review] Pharmacological management for agitation and aggression in people with acquired](https://img.dokumen.tips/doc/110x75/5a9dcaaa7f8b9a0d5a8c29c1/pharmacological-management-for-agitation-and-professionalspharmacologicalintervention.jpg)