Embed Size (px)
Citation preview

Nature © Macmillan Publishers Ltd 1997
letters to nature
308 NATURE | VOL 388 | 17 JULY 1997
synthesized by PCR. DNase I footprinting reactions were processed asdescribed24.Reporter gene construction. Substitution of a single BglII site for thequadrant enhancer Mad binding-site sequence GCTGCCGTCGCG was doneby assembling two fragments generated by PCR with Pfu polymerase.Expansion of the single BglII site to two tandem sites matching the Qm
sequence was done by insertion of an oligonucleotide containing BbsI internalsites that allowed for subsequent cleavage and ligation to generate the tandemBglII sites. Both sequences were confirmed by sequencing and ligated into theKpnI/NotI sites of the Hsp lacZ-CaSpeR Drosophila transformation vector forthe generation of transgenic lines24.
Received 20 January; accepted 21 May 1997.
1. Graff, J. M., Bansal, A. & Melton, D. A. Xenopus Mad proteins transduce distinct subsets of signals forthe TGFb superfamily. Cell 85, 479–487 (1996).
2. Hoodless, P. A. et al. MADR1, a MAD-related protein that functions in BMP2 signaling pathways. Cell85, 489–500 (1996).
3. Liu, F. et al. A human Mad protein acting as a BMP-regulated transcriptional activator. Nature 381,622–623 (1996).
4. Eppert, K. et al. MADR2 maps to 18q21 and encodes a TGF b-regulated MAD-related protein that isfunctionally mutated in colorectal carcinoma. Cell 86, 543–552 (1996).
5. Zhang, Y., Feng, X.-H., Wu, R.-Y. & Derynck, R. Receptor-associated Mad homologues synergize aseffectors of the TGF-b response. Nature 383, 168–172 (1996).
6. Lagna, G., Hata, A., Hemmati-Brivnlou, A. & Massague, J. Partnership between DPC4 and SMADproteins in TGF-b signalling pathways. Nature 383, 832–836 (1996).
7. Savage, C. et al. C. elegans genes sma-2, sma-3, and sma-4 genes define a conserved family of TGF-bpathway components. Proc. Natl Acad. Sci. USA 93, 790–794 (1996).
8. Macias-Silva, M. et al. MADR2 is a substrate of the TGF-b receptor and its phosphorylation isrequired for nuclear accumulation and signaling. Cell 87, 1215–1224 (1996).
9. Derynck, R. & Zhang, Y. Intracellular signalling: The Mad way to do it. Curr. Biol. 6, 1226–1229(1996).
10. Chen, X., Rubock, M. J. & Whitman, M. A transcriptional partner for MAD proteins in TGF-bsignalling. Nature 383, 691–696 (1996).
11. Raftery, L., Twombly, V., Wharton, K. & Gelbart, W. Genetic screens to identify elements of thedecapentaplegic pathway in Drosophila. Genetics 139, 241–254 (1995).
12. Sekelsky, J., Newfeld, S., Raftery, L., Chartoff, E. & Gelbart, W. Genetic characterization and cloning ofMothers against dpp, a gene required for decapentaplegic function in Drosophila melanogaster. Genetics139, 1347–1358 (1995).
13. Newfeld, S. J., Chartoff, E. H., Graff, J. M., Melton, D. A. & Gelbart, W. M. Mothers against dpp encodesa conserved cytoplasmic protein required in DPP/TGF-b responsive cells. Development 122, 2099–2108 (1996).
14. Wiersdorff, V., Lecuit, T., Cohen, S. M. & Mlodzik, M. Mad acts downstream of Dpp receptors,revealing a differential requirement for dpp signaling in initiation and propagation of morphogenesisin the Drosophila eye. Development 122, 2153–2162 (1996).
15. Blair, S. Compartments and appendage development in Drosophila. BioEssays 17, 229–309 (1995).16. Basler, K. & Struhl, G. Compartment boundaries and the control of Drosophila limb pattern by
hedgehog protein. Nature 368, 208–214 (1994).17. Tabata, T. & Kornberg, T. Hedgehog is a signalling protein with a key role in patterning Drosophila
imaginal discs. Cell 76, 89–102 (1994).18. Zecca, M., Basler, K. & Struhl, G. Sequential organizing activities of engrailed, hedgehog and
decapentaplegic in the Drosophila wing. Development 121, 2265–2278 (1995).19. Ingham, P. W. & Fietz, M. J. Quantitative effects of hedgehog and decapentaplegic activity on the
patterning of the Drosophila wing. Curr. Biol. 5, 432–440 (1995).20. Posakony, L., Raftery, L. & Gelbart, W. Wing formation in Drosophila melanogaster requires
decapentaplegic gene function along the anterior–posterior compartment boundary. Mech. Dev. 33,69–82 (1991).
21. Capdevilla, J. & Guerrero, I. Targeted expression of the signalling molecule decapentaplegic inducespattern duplications and growth alterations in Drosophila wings. EMBO J. 13, 4459–4468 (1994).
22. Nellen, D., Burke, R., Struhl, G. & Basler, K. Direct and long-range action of a Dpp morphogengradient. Cell 85, 357–368 (1996).
23. Lecuit, T. et al. Two distinct mechanisms for long-range patterning by Decapentaplegic in theDrosophila wing. Nature 381, 387–393 (1996).
24. Kim, J. et al. Integration of positional signals and regulation of wing formation and identity byDrosophila vestigial gene. Nature 382, 133–138 (1996).
25. de Celis, J. F., Bario, R. & Kafatos, F. C. A gene complex acting downstream of dpp in Drosophila wingmorphogenesis. Nature 381, 421–424 (1996).
26. Grimm, S. & Pflugfelder, G. O. Control of the gene optomotor-blind in Drosophila wing developmentby decapentaplegic and wingless. Science 271, 1601–1604 (1996).
27. Chouinard, S. & Kaufman, T. C. Control of expression of the homeotic labial (lab) locus of Drosophilamelanogaster: evidence for both positive and negative autogenous regulation. Development 113,1267–1280 (1991).
28. Tremml, G. & Bienz, M. Induction of labial expression in the Drosophila endoderm: response elementsfor dpp signalling and for autoregulation. Development 116, 447–456 (1992).
29. Thuringer, F., Cohen, S. M. & Bienz, M. Dissection of an indirect autoregulatory response of ahomeotic Drosophila gene. EMBO J. 12, 2419–2430 (1993).
30. Eresh, S., Riese, J., Jackson, D. B., Bohmann, D. & Bienz, M. A CREB-binding site as a target fordecapentaplegic signalling during Drosophila endoderm induction. EMBO J. 16, 2014–2022 (1997).
31. Ausubel, F. M. et al. (eds) Current Protocols in Molecular Biology supplement 28, pp. 16.6.1–16.7.7(Wiley, New York, 1994).
Acknowledgements. We thank K. Vorwerk for technical assistance; M. Hoffmann for discussion; Y. J.Chen for the MAD cDNA clone and help with sequencing; V. Wiersdorff, M. Mlodzik and S. Cohen for theMad1.2 stock; S. Paddock for help with microscopy; T. Kaufman for the labial endodermal enhancer;M. Hoffmann and G. Halder for comments on the manuscript; and J. Wilson for manuscript preparation.K. J. was supported by a genetics predoctoral training grant and the Cremer Scholarship Fund, and part ofthis work was supported by the Howard Hughes Medical Institute (S.B.C.)
Correspondence and requests for materials should be addressed to A.L. (e-mail: [email protected]).
errata
Differential activationoftranscription factorsinducedbyCa2þ responseamplitudeanddurationRicardo E. Dolmetsch, Richard S. Lewis,Christopher C. Goodnow & James I. Healy
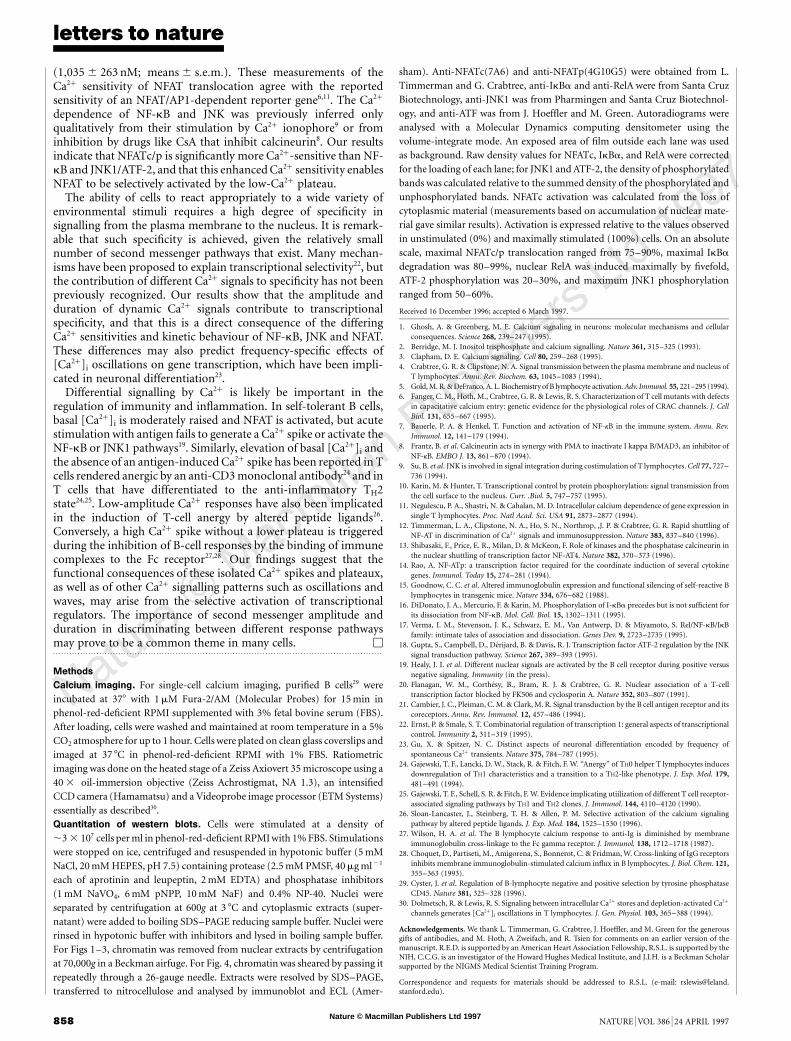
Nature 386, 855–858 (1997)..................................................................................................................................The graphs in Fig. 2e were accidentally swapped around during theproduction process. The correct versions are shown here. M
e
NFATcIκBα JNK1Act
ivat
ion (%
) 100
50
0181260
Time (min)
100
50
0181260
Time (min)
100
50
0181260
Time (min)
Large-scale tectonicdeformation inferredfromsmall earthquakesFalk Amelung & Geoffrey King
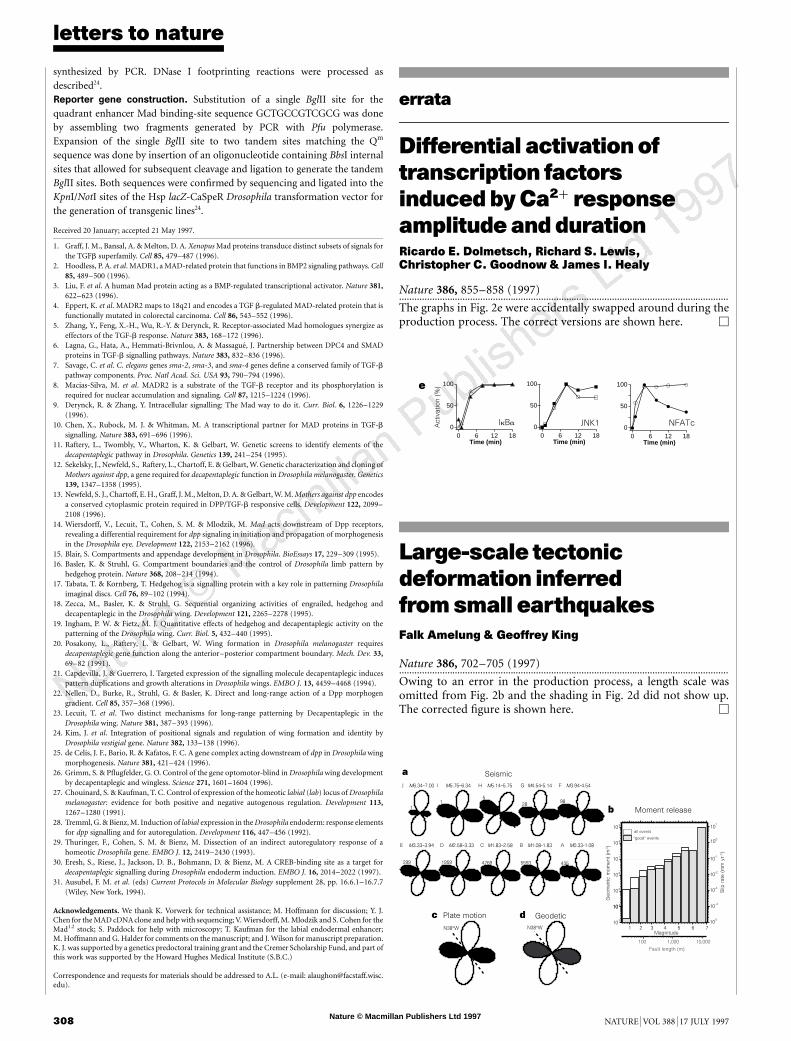
Nature 386, 702–705 (1997)..................................................................................................................................Owing to an error in the production process, a length scale wasomitted from Fig. 2b and the shading in Fig. 2d did not show up.The corrected figure is shown here. M
11
528 98
299 1959 4769 5593 435
M3.94-4.54M4.54-5.14M5.14–5.75M6.34–7.00 M5.75–6.34
M0.33-1.08M1.08-1.83M1.83–2.58M2.58–3.33M3.33–3.94
FGHJ I
ABCDE
Seismic
Moment release
GeodeticPlate motion
all events
''good'' events
10 3
10104
3
105
106
107
108
109
Geo
met
ric m
om
ent (m
3)
1 2 3Magnitude
4 5 6 7
Slip
rat
e (m
m y
r–1 )
10
-4
10-5
10
10
-3
10
-2
-1
100
101
a
c d
b
N38°W N38°W
100 1,000 10,000
Fault length (m)

Nature © Macmillan Publishers Ltd 1997
letters to nature
308 NATURE | VOL 388 | 17 JULY 1997
synthesized by PCR. DNase I footprinting reactions were processed asdescribed24.Reporter gene construction. Substitution of a single BglII site for thequadrant enhancer Mad binding-site sequence GCTGCCGTCGCG was doneby assembling two fragments generated by PCR with Pfu polymerase.Expansion of the single BglII site to two tandem sites matching the Qm
sequence was done by insertion of an oligonucleotide containing BbsI internalsites that allowed for subsequent cleavage and ligation to generate the tandemBglII sites. Both sequences were confirmed by sequencing and ligated into theKpnI/NotI sites of the Hsp lacZ-CaSpeR Drosophila transformation vector forthe generation of transgenic lines24.
Received 20 January; accepted 21 May 1997.
1. Graff, J. M., Bansal, A. & Melton, D. A. Xenopus Mad proteins transduce distinct subsets of signals forthe TGFb superfamily. Cell 85, 479–487 (1996).
2. Hoodless, P. A. et al. MADR1, a MAD-related protein that functions in BMP2 signaling pathways. Cell85, 489–500 (1996).
3. Liu, F. et al. A human Mad protein acting as a BMP-regulated transcriptional activator. Nature 381,622–623 (1996).
4. Eppert, K. et al. MADR2 maps to 18q21 and encodes a TGF b-regulated MAD-related protein that isfunctionally mutated in colorectal carcinoma. Cell 86, 543–552 (1996).
5. Zhang, Y., Feng, X.-H., Wu, R.-Y. & Derynck, R. Receptor-associated Mad homologues synergize aseffectors of the TGF-b response. Nature 383, 168–172 (1996).
6. Lagna, G., Hata, A., Hemmati-Brivnlou, A. & Massague, J. Partnership between DPC4 and SMADproteins in TGF-b signalling pathways. Nature 383, 832–836 (1996).
7. Savage, C. et al. C. elegans genes sma-2, sma-3, and sma-4 genes define a conserved family of TGF-bpathway components. Proc. Natl Acad. Sci. USA 93, 790–794 (1996).
8. Macias-Silva, M. et al. MADR2 is a substrate of the TGF-b receptor and its phosphorylation isrequired for nuclear accumulation and signaling. Cell 87, 1215–1224 (1996).
9. Derynck, R. & Zhang, Y. Intracellular signalling: The Mad way to do it. Curr. Biol. 6, 1226–1229(1996).
10. Chen, X., Rubock, M. J. & Whitman, M. A transcriptional partner for MAD proteins in TGF-bsignalling. Nature 383, 691–696 (1996).
11. Raftery, L., Twombly, V., Wharton, K. & Gelbart, W. Genetic screens to identify elements of thedecapentaplegic pathway in Drosophila. Genetics 139, 241–254 (1995).
12. Sekelsky, J., Newfeld, S., Raftery, L., Chartoff, E. & Gelbart, W. Genetic characterization and cloning ofMothers against dpp, a gene required for decapentaplegic function in Drosophila melanogaster. Genetics139, 1347–1358 (1995).
13. Newfeld, S. J., Chartoff, E. H., Graff, J. M., Melton, D. A. & Gelbart, W. M. Mothers against dpp encodesa conserved cytoplasmic protein required in DPP/TGF-b responsive cells. Development 122, 2099–2108 (1996).
14. Wiersdorff, V., Lecuit, T., Cohen, S. M. & Mlodzik, M. Mad acts downstream of Dpp receptors,revealing a differential requirement for dpp signaling in initiation and propagation of morphogenesisin the Drosophila eye. Development 122, 2153–2162 (1996).
15. Blair, S. Compartments and appendage development in Drosophila. BioEssays 17, 229–309 (1995).16. Basler, K. & Struhl, G. Compartment boundaries and the control of Drosophila limb pattern by
hedgehog protein. Nature 368, 208–214 (1994).17. Tabata, T. & Kornberg, T. Hedgehog is a signalling protein with a key role in patterning Drosophila
imaginal discs. Cell 76, 89–102 (1994).18. Zecca, M., Basler, K. & Struhl, G. Sequential organizing activities of engrailed, hedgehog and
decapentaplegic in the Drosophila wing. Development 121, 2265–2278 (1995).19. Ingham, P. W. & Fietz, M. J. Quantitative effects of hedgehog and decapentaplegic activity on the
patterning of the Drosophila wing. Curr. Biol. 5, 432–440 (1995).20. Posakony, L., Raftery, L. & Gelbart, W. Wing formation in Drosophila melanogaster requires
decapentaplegic gene function along the anterior–posterior compartment boundary. Mech. Dev. 33,69–82 (1991).
21. Capdevilla, J. & Guerrero, I. Targeted expression of the signalling molecule decapentaplegic inducespattern duplications and growth alterations in Drosophila wings. EMBO J. 13, 4459–4468 (1994).
22. Nellen, D., Burke, R., Struhl, G. & Basler, K. Direct and long-range action of a Dpp morphogengradient. Cell 85, 357–368 (1996).
23. Lecuit, T. et al. Two distinct mechanisms for long-range patterning by Decapentaplegic in theDrosophila wing. Nature 381, 387–393 (1996).
24. Kim, J. et al. Integration of positional signals and regulation of wing formation and identity byDrosophila vestigial gene. Nature 382, 133–138 (1996).
25. de Celis, J. F., Bario, R. & Kafatos, F. C. A gene complex acting downstream of dpp in Drosophila wingmorphogenesis. Nature 381, 421–424 (1996).
26. Grimm, S. & Pflugfelder, G. O. Control of the gene optomotor-blind in Drosophila wing developmentby decapentaplegic and wingless. Science 271, 1601–1604 (1996).
27. Chouinard, S. & Kaufman, T. C. Control of expression of the homeotic labial (lab) locus of Drosophilamelanogaster: evidence for both positive and negative autogenous regulation. Development 113,1267–1280 (1991).
28. Tremml, G. & Bienz, M. Induction of labial expression in the Drosophila endoderm: response elementsfor dpp signalling and for autoregulation. Development 116, 447–456 (1992).
29. Thuringer, F., Cohen, S. M. & Bienz, M. Dissection of an indirect autoregulatory response of ahomeotic Drosophila gene. EMBO J. 12, 2419–2430 (1993).
30. Eresh, S., Riese, J., Jackson, D. B., Bohmann, D. & Bienz, M. A CREB-binding site as a target fordecapentaplegic signalling during Drosophila endoderm induction. EMBO J. 16, 2014–2022 (1997).
31. Ausubel, F. M. et al. (eds) Current Protocols in Molecular Biology supplement 28, pp. 16.6.1–16.7.7(Wiley, New York, 1994).
Acknowledgements. We thank K. Vorwerk for technical assistance; M. Hoffmann for discussion; Y. J.Chen for the MAD cDNA clone and help with sequencing; V. Wiersdorff, M. Mlodzik and S. Cohen for theMad1.2 stock; S. Paddock for help with microscopy; T. Kaufman for the labial endodermal enhancer;M. Hoffmann and G. Halder for comments on the manuscript; and J. Wilson for manuscript preparation.K. J. was supported by a genetics predoctoral training grant and the Cremer Scholarship Fund, and part ofthis work was supported by the Howard Hughes Medical Institute (S.B.C.)
Correspondence and requests for materials should be addressed to A.L. (e-mail: [email protected]).
errata
Differential activationoftranscription factorsinducedbyCa2þ responseamplitudeanddurationRicardo E. Dolmetsch, Richard S. Lewis,Christopher C. Goodnow & James I. Healy
Nature 386, 855–858 (1997)..................................................................................................................................The graphs in Fig. 2e were accidentally swapped around during theproduction process. The correct versions are shown here. M
e
NFATcIκBα JNK1Act
ivat
ion (%
) 100
50
0181260
Time (min)
100
50
0181260
Time (min)
100
50
0181260
Time (min)
Large-scale tectonicdeformation inferredfromsmall earthquakesFalk Amelung & Geoffrey King
Nature 386, 702–705 (1997)..................................................................................................................................Owing to an error in the production process, a length scale wasomitted from Fig. 2b and the shading in Fig. 2d did not show up.The corrected figure is shown here. M
11
528 98
299 1959 4769 5593 435
M3.94-4.54M4.54-5.14M5.14–5.75M6.34–7.00 M5.75–6.34
M0.33-1.08M1.08-1.83M1.83–2.58M2.58–3.33M3.33–3.94
FGHJ I
ABCDE
Seismic
Moment release
GeodeticPlate motion
all events
''good'' events
10 3
10104
3
105
106
107
108
109
Geo
met
ric m
om
ent (m
3)
1 2 3Magnitude
4 5 6 7
Slip
rat
e (m
m y
r–1 )
10
-4
10-5
10
10
-3
10
-2
-1
100
101
a
c d
b
N38°W N38°W
100 1,000 10,000
Fault length (m)

Nature © Macmillan Publishers Ltd 1997
immunostained as described. Quantification was achieved by using Image-1software (Universal Imaging). Positive controls included sections of adrenalmedulla, thyroid, pancreas, intestine, ganglia and nerves.Antisense studies. 100 nM phosphorothioate oligodeoxynucleotides with C-5 propyne modifications at dC and dU (Midland) were reconstituted with2.5 mg ml2 1 GS2888 cytofectin30 (Gilead Sciences) in OptiMEM (Gibco), thenincubated with 5 3 105 NCI-H209 or DMS53 cells in 6-well plates for 48 h ingrowth media. 5 3 104 cells were cytospun per slide. Immunostaining, quan-tified using MetaMorph software (Universal Imaging), included at least ten cellclusters (over 200 cells) for each marker and oligonucleotide. Experiments weredone in triplicate for both cell lines and evaluated in a blind fashion.Oligonucleotides c5p1476 (59-GGAGCCCACUGCUUU-39), c5p1232 (59-UCCCAACGCCACUGA-39) and c5p25 (59-UCCUACUAAGGCUGC-39) cor-respond to positions 1,476–1,491 and 1,232–1,247 in the hASH1 39 UTR and25–40 in the 59 UTR, respectively; the c5pMiss1 sequence is 59-GCUACAU-CUGGUCGC-39; c5pMiss2 59-CACUGAUGCACCUGU-39:
Received 9 January; accepted 20 February 1997.
1. Campuzano, S. et al. Molecular genetics of the achaete-scute gene complex of D. melanogaster. Cell 40,327–338 (1985).
2. Jan, Y. N. & Jan, L. Y. Genetic control of cell fate specification in Drosophila peripheral nervous system.Annu. Rev. Genet. 28, 373–393 (1994).
3. Johnson, J. E., Birren, S. J. & Anderson, D. J. Two rat homologues of Drosophila achaete-scutespecifically expressed in neuronal precursors. Nature 346, 858–861 (1990).
4. Lo, L. C. et al. Mammalian achaete-scute homolog 1 is transiently expressed by spatially restrictedsubsets of early neuroepithelial and neural crest cells. Genes Dev. 5, 1524–1537 (1991).
5. Sommer, L. et al. The cellular function of MASH1 in autonomic neurogenesis. Neuron 15, 1245–1258(1995).
6. Guillemot, F. et al. Mammalian achaete-scute homolog 1 is required for the early development ofolfactory and autonomic neurons. Cell 75, 463–476 (1993).
7. Baylin, S. B. & Gazdar, A. F. in Small Cell Lung Cancer 123–143 (Grune and Stratton, New York, 1981).8. Gazdar, A. F. et al. Expression of neuroendocrine cell markers L-dopa decarboxylase, chromogranin A,
and dense core granules in human tumors of endocrine and nonendocrine origin. Cancer Res. 48,4078–4082 (1988).
9. Gazdar, A. F. et al. in Small Cell Lung Cancer 145–177 (Grune and Stratton, New York, 1981).10. Linnoila, R. I. in Neuropeptides in Respiratory Medicine 197–224 (Dekker, New York, 1994).11. Mabry, M. et al. Transitions between lung cancer phenotypes—implications for tumor progression.
Cancer Cells 3, 53–58 (1991).12. Ball, D. W. et al. Identification of a human achaete-scute homolog highly expressed in neuroendocrine
tumors. Proc. Natl Acad. Sci. USA 90, 5648–5652 (1993).13. Linnoila, R. I. et al. Neuroendocrine differentiation in endocrine and nonendocrine lung carcinomas.
Am. J. Clin. Pathol. 90, 641–652 (1988).14. Linnoila, R. I., Piantadosi, S. & Ruckdeschel, J. C. Impact of neuroendocrine differentiation in non-
small cell lung cancer. Chest 106, 367S–371S (1994).15. Linnoila, R. I. & Aisner, S. C. in Lung Cancer 73–95 (Wiley-Liss, New York, 1995).16. Carney, D. N. et al. Establishment and identification of small cell lung cancer cell lines having classic
and variant features. Cancer Res. 45, 2913–2923 (1985).17. Pettengill, O. S. et al. Isolation and growth characteristics of continuous cell lines from small-cell
carcinoma of the lung. Cancer 45, 906–918 (1980).18. Bergh, J. et al. Establishment and characterization of a continuous lung squamous cell carcinoma cell
line (U-1752). Anticancer Res. 1, 317–322 (1981).19. Gazdar, A. F. et al. Establishment of continuous, clonable cultures of small-cell carcinoma of lung which
have amine precursor uptake and decarboxylation cell properties. Cancer Res. 40, 3502–3507 (1980).20. Gazdar, A. F. et al. Characterization of variant subclasses of cell lines derived from small cell lung
cancer having distinctive biochemical, morphological, and growth properties. Cancer Res. 45, 2924–2930 (1985).
21. Brower, M. et al. Growth of cell lines and clinical specimens of human non-small cell lung cancer in aserum-free defined medium. Cancer Res. 46, 798–806 (1986).
22. Linnoila, R. I. Spectrum of neuroendocrine differentiation in lung cancer cell lines featured bycytomorphology, markers, and their corresponding tumors. J. Cell. Biochem. 24 (suppl.), 92–106 (1996).
23. Falco, J. P. et al. v-rasH induces non-small cell phenotype, with associated growth factors andreceptors, in a small cell lung cancer cell line. J. Clin. Invest. 85, 1740–1745 (1990).
24. H. C. Chen et al. Conservation of the Drosophila lateral inhibition pathway in human lung cancer: ahairy-related protein (HES-1) directly represses achaete-scute homolog-1 expression. Proc. Natl Acad.Sci. USA (in the press).
25. Jarriault, S. et al. Signalling downstream of activated mammalian notch. Nature 377, 355–358 (1995).26. Ishibashi, M. et al. Targeted disruption of mammalian hairy and enhancer of split homolog-1 (HES-1)
leads to up-regulation of neural helix-loop-helix factors, premature neurogenesis, and severe neuraltube defects. Genes Dev. 9, 3136–3148 (1995).
27. Gomez-Skarmeta, J. L. et al. Araucan and caupolican, two members of the novel iroquois complex,encode homeoproteins that control proneural and vein-forming genes. Cell 85, 95–105 (1996).
28. Nelkin, B. D. et al. Transcription factor levels in medullary thyroid carcinoma cells differentiated byHarvey ras oncogene: c-jun is increased. Biochem. Biophys. Res. Commun. 170, 140–146 (1990).
29. Broers, J. L. V. et al. Expression of c-myc in progenitor cells of the bronchopulmonary epithelium andin a large number of non-small cell lung cancers. Am. J. Resp. Cell Mol. Biol. 9, 33–43 (1993).
30. Lewis, J. G. et al. A serum-resistant cytofectin for cellular delivery of antisense oligodeoxynucleotidesand plasmid DNA. Proc. Natl Acad. Sci. USA 93, 3176–3181 (1996).
Acknowledgements. H.J.K.v.d.V. was a visiting research assistant of the National Fund for ScientificResearch, Belgium. We thank F. Guillemot and A. Joyner for the MASH1D mouse strain and for wholemouse embryo sections hybridized with MASH1; R. Wagner for GS2888 cytofectin; A. F. Gazdar for celllines; E. Gabrielson for a human fetal lung specimen; S. M. Steinberg for statistical consultation; and S.Jensen, T. Bunnag and K. Wieman for technical assistance. Animal care procedures were approved by theJohns Hopkins Animal Care and Use Committee. Supported in part by grants from the NIH, theAmerican Cancer Society and the D. Collen Research Foundation.
Correspondence and requests for materials should be addressed to D.W.B. (e-mail: [email protected]).
letters to nature
NATURE | VOL 386 | 24 APRIL 1997 855
Differential activationoftranscription factorsinducedbyCa2þ responseamplitudeanddurationRicardo E. Dolmetsch*, Richard S. Lewis*†,Christopher C. Goodnow†‡ & James I. Healy†‡
* Department of Molecular and Cellular Physiology and Neurosciences Program,† Program in Immunology, ‡ Department of Microbiology and Immunology andHoward Hughes Medical Institute, Stanford University School of Medicine,Stanford, California 94305, USA. . . . . . . . . . . . . . . . . . . . . . . . . . . . . . . . . . . . . . . . . . . . . . . . . . . . . . . . . . . . . . . . . . . . . . . . . . . . . . . . . . . . . . . . . . . . . . . . . . . . . . . . . . . . . . . . . . . . . . . . .
An increase in the intracellular calcium ion concentration([Ca2þ]i) controls a diverse range of cell functions, includingadhesion, motility, gene expression and proliferation1,2. Calciumsignalling patterns can occur as single transients, repetitiveoscillations or sustained plateaux2,3, but it is not known whetherthese patterns are responsible for encoding the specificity ofcellular responses. We report here that the amplitude and dura-tion of calcium signals in B lymphocytes controls differentialactivation of the pro-inflammatory transcriptional regulators NF-kB, c-Jun N-terminal kinase (JNK) and NFAT. NF-kB and JNK areselectively activated by a large transient [Ca2þ]i rise, whereasNFAT is activated by a low, sustained Ca2þ plateau. Differentialactivation results from differences in the Ca2þ sensitivities andkinetic behaviour of the three pathways. Our results show howdownstream effectors can decode information contained in theamplitude and duration of Ca2þ signals, revealing a mechanism bywhich a multifunctional second messenger such as Ca2þ canachieve specificity in signalling to the nucleus.
Calcium signalling is important for the growth, death, differen-tiation and function of immune cells4–6. Several Ca2þ-sensitivetranscriptional regulators, including NF-kB7,8, JNK9,10 andNFAT4,6,11–14, participate in varying combinations to promote theexpression of genes that underlie these responses. These genesencode haematopoietic growth factors such as the interleukins IL-2 and IL-4 and GM-CSF, and inflammatory cytokines such as IL-1,IL-6, IL-8 and tumour-necrosis factor (TNF)4,7,10,14. We examinedthe Ca2þ sensitivity and response dynamics of the three trans-criptional regulators in B lymphocytes from mice expressing animmunoglobulin transgene specific for the hen-egg lysozyme(HEL) antigen15. Acute stimulation of B cells with HEL and phorbolester evoked a biphasic Ca2þ response that consisted of an initialrapid rise of [Ca2þ]i from a baseline of 76 6 3 nM to a peak of1;367 6 33 nM, which subsequently declined over 10 min to a lowsustained plateau of 227 6 5 nM (means 6 s:e:m:, n ¼ 572 cells)(Fig. 1a). The time course of NF-kB activation during this responsewas assayed by the phosphorylation and degradation of its cyto-plasmic inhibitor IkBa, or by the accumulation of the NF-kBsubunit, RelA, in the nucleus7,16,17. NF-kB activation was firstdetectable 4 min after stimulation with HEL and reached comple-tion by 8 min (Fig. 1b). Like NF-kB activation, the phosphorylationof JNK1 and its nuclear substrate ATF-2 (refs 10, 18) was also firstapparent within 4 min and reached a peak by 12 min (Fig. 1c). Incontrast, activation of NFATc, as determined by its translocation tothe nucleus, was much more rapid, being essentially completewithin 1 min of stimulation with antigen (Fig. 1d, e). The activationof each of these pathways was inhibited by the immunosuppressantcyclosporin A (CsA)19 as shown previously8,9,20.
An important question is whether the spike and plateau phases ofthe Ca2þ response activate distinct transcriptional pathways. Sti-mulation of the antigen receptor activates Ca2þ-independent as wellas Ca2þ-dependent signalling pathways5,21; we therefore applied the

Nature © Macmillan Publishers Ltd 1997
letters to nature
856 NATURE | VOL 386 | 24 APRIL 1997
Ca2þ ionophore ionomycin (in the presence of phorbol ester) toidentify the specific impact of each phase of the Ca2þ response. TheCa2þ spike was generated in isolation by exposing the cells toionomycin shortly before chelating extracellular Ca2þ with EGTA(Fig. 2a, left). Single-cell Ca2þ imaging confirmed that the ionomy-cin-induced transient had about the same magnitude as the HEL-stimulated spike (1;301 6 46 nM versus 1;367 6 33 nM, respec-tively; mean 6 s:e:m:) and returned to baseline within 3 min.Furthermore, we verified that the Ca2þ spikes produced by HEL
or ionomycin are attributable to Ca2þ released from internal stores(,25%) and to Ca2þ influx (,75%) (data not shown), indicatingthat ionomycin and HEL mobilize the same sources of Ca2þ togenerate the spike. As a positive control, ionomycin was appliedwithout EGTA to create a sustained [Ca2þ]i increase that fullyactivated all three pathways (Fig. 2a, right). Stimulation withphorbol ester alone did not raise [Ca2þ]i (data not shown), nordid it activate NFATc, NF-kB, or JNK1 (Fig. 1b–d, lanes marked P),confirming that all three pathways require elevated [Ca2þ]i foractivation. In the absence of phorbol ester, Ca2þ ionophore alonedid not activate NF-kB or JNK (ref. 19, and data not shown);ionomycin did cause nuclear translocation of NFATc but previousstudies have shown that NFAT-dependent transcription requires asecond signal that can be provided by protein kinase C4,14.
The high-Ca2þ spike evoked prolonged activation of NF-kB andJNK1/ATF-2. IkBa became phosphorylated and was degradedwithin 4–8 min, and RelA accumulated in the nucleus with aparallel time course (Fig. 2b, e). The NF-kB response was compar-able when [Ca2þ]i was raised continuously (Fig. 2b, e). Likewise,JNK1 and ATF-2 phosphorylation reached a stable maximum 8 minafter the initial increase in [Ca2þ]i, regardless of whether the rise wastransient or sustained (Fig. 2c, e). Activation of both NF-kB and
0 1 4 8 12 18 P
IκBα
RelA
JNK
ATF-2
b
c
Time (min):
a
34
86
3584
d
e
NFATc(cyto)
203
118
NFATc(nuc) 120
80
Mr (K)
100
50
0
Act
ivat
ion
(%
)
181260Time (min)
2
1
0
[Ca2+
] i (µM
)
181260Time (min)
HEL 2
1
0181260
Time (min)
HEL
Figure 1 Antigen evokes a biphasic [Ca2þ]i rise that activates the NF-kB, JNK1 and
NFAT pathways. a, Purified splenic B lymphocytes expressing a hen egg
lysozyme(HEL)-specific immunoglobulin transgene were analysed by digital
video microscopy. Fura-2-loaded cells were stimulated with 500ng ml2 1 HEL
and 5ng ml2 1 phorbol 12,13-dibutyrate (PDBU) (bar). Mean responses of 285 cells
(left) and of representative single cells (right) are shown. After stimulation, nuclear
and cytoplasmic fractions were analysed by western blotting. b, NF-kB activation
is demonstrated by the phosphorylationand degradationof cytoplasmic IkBa and
the accumulation of RelA in nuclear lysates. Phosphorylated IkBa, first detectable
at 4min, has a slightly lower mobility than the dephosphorylated form. c,
Cytoplasmic JNK1 and nuclear ATF-2 are phosphorylated following stimulation.
Phosphorylation of JNK1 and ATF-2 causes a reduction in electrophoretic
mobility18 that is evident at 4–18min. d, NFATc translocates rapidly from the
cytoplasm (cyto) to the nucleus (nuc).NFATc in its phosphorylated state is present
as several bands migrating with an apparent Mr of 160K–190K (filled arrows).
NuclearNFATc is dephosphorylated andmigrates more rapidly (apparent Mr 80K–
150K; open arrows). In b–d, lane P shows lysates from cells stimulated with
5 ngml2 1 PDBU alone for 12min as a control. Time in min is indicated above each
lane and the Mr values (in K) are shown on the right. Filled and open arrows
indicate the positions of phosphorylated and unphosphorylated species, respectively.
e, Time course of IkBa degradation (O), JNK1 phosphorylation (B) and NFATc
translocation (X) as determined by densitometry of the immunoblots in b–d.
b
IκBα
Rel A
JNK1
ATF-2
0 1 4 8 12 18 0 1 4 8 12 18 (min)
Spike Continuous
3586
actin
8635
a
e
NFATcIκBα JNK1
NFATc(cyto)
actin
203
118
NFATc(nuc)
actin
118
c
d
Act
ivat
ion (%
)
Mr (K)
2
1
0
[Ca2+
] i (µM
)
181260Time (min)
Ionomycin
EGTA 4
3
2
1
0
[Ca2+
] i (µM
)
181260Time (min)
Ionomycin
100
50
0181260
Time (min)
100
50
0181260
Time (min)
100
50
0181260
Time (min)
Figure 2 A brief Ca2þ spike induces persistent activation of NF-kB, JNK1 and ATF-
2, but transient translocation of NFATc. a, Average Ca2þ response of .250 cells
treated with 950 nM ionomycin and 5 ngml2 1 PDBU (black bar). Left, 3mM EGTA
was added 40 s later (white bar) to terminate the spike. b, The Ca2þ spike (left
lanes) and the continuous [Ca2þ]i rise (right lanes) activate NF-kB similarly, as
shown by IkBa phosphorylation and degradation and RelA translocation. c, JNK1
and ATF-2 phosphorylation are also sustained following an isolated Ca2þ spike or
a prolonged [Ca2þ]i increase. d, Cytoplasmic NFATc (cyto) is dephosphorylated
and enters the nucleus (nuc) but returns to the cytoplasm after [Ca2þ]i declines to
baseline (left lanes). Continuously elevated [Ca2þ]i maintains NFATc in the
nucleus (right lanes). e, Time course of IkBa degradation, JNK1 phosphorylation
and NFATc translocation following the [Ca2þ]i spike (filled symbols) or the sustained
[Ca2þ]i rise (open symbols). Data were from the experiment shown in a–d.

Nature © Macmillan Publishers Ltd 1997
letters to nature
NATURE | VOL 386 | 24 APRIL 1997 857
JNK1 was sustained for at least 16 min after termination of the[Ca2þ]i spike, indicating that both pathways retain a memory oftransient [Ca2þ]i rises that outlasts the Ca2þ signal itself. By contrast,the Ca2þ spike evoked only a transient nuclear translocation ofNFATc, with one half of the nuclear NFATc returning to thecytoplasm in its phosphorylated form 8 min after [Ca2þ]i returnedto baseline (Fig. 2d, e). The reversal of nuclear translocation was
caused by termination of the Ca2þ spike, because nuclear NFATcpersisted in cells with constant elevated [Ca2þ]i (Fig. 2a, d). Theseresults confirm and extend findings showing that NFAT requires acontinuous [Ca2þ]i rise to remain localized in the nucleus12,13. Theyalso demonstrate that differences in deactivation kinetics contributeto the differential activation of multiple transcriptional pathways byCa2þ. Similar results were obtained when HEL followed by EGTAwas used to generate an isolated Ca2þ spike (data not shown).
We next investigated whether the low-Ca2þ plateau triggered byantigen (Fig. 1) can evoke selective activation of transcriptionalpathways. Small amounts of ionomycin were added stepwise inorder to mimic the antigen-induced plateau without creating aninitial spike (Fig. 3a). Low concentrations of ionomycin elicit Ca2þ
influx in lymphocytes predominantly by activating store-operatedCa2þ channels that underlie the antigen-evoked [Ca2þ]i plateau6;thus ionomycin seems to mimic the Ca2þ-mobilizing action ofantigen during the plateau as well as the spike. Stimulation of NF-kB or JNK1 was not detectable in response to the low-Ca2þ plateau(Fig. 3b), whereas NFATc was activated by 70% within 12 min,suggesting that the former are less Ca2þ responsive than NFATc. Toexamine the Ca2þ sensitivity of each pathway in more detail, wemeasured the activation of NF-kB, JNK1, NFATc and NFATp14
following a 10-min stimulation with increasing concentrations ofionomycin. Consistent with the results shown in Fig. 3, nucleartranslocation of NFATc/p was induced by lower concentrations ofionomycin (79 nM; Fig. 4a) than are required to activate IkBadegradation or JNK1/ATF-2 phosphorylation (400–600 nM; Fig.4a). Figure 4c shows the translocation of NFATc/p, degradation ofIkBa, and phosphorylation of JNK1 and ATF-2 as a function of thepeak [Ca2þ]i evoked by different doses of ionomycin (Fig. 4b). Theresults identify a range of [Ca2þ]i levels (200–400 nM) that promoteNFATc/p translocation without activating NF-kB or JNK1. In threeexperiments, the [Ca2þ]i needed to half-maximally translocateNFATc/p (413 6 114 nM) was substantially lower than the levelneeded to attain half-maximal degradation of IkBa(612 6 121 nM) or phosphorylation of JNK1 and ATF-2
a
b
NFAT
IκBα JNK1
24 nM 37 nM IO
[Ca2
+ ]i (
µM)
Act
ivat
ion (%
)
Time (min)
Time (min)
2
1
0181260
100
50
0
181260
Figure 3 Selective activation of NFATc by a low [Ca2þ]i plateau. a, Cells were
stimulated in the constant presence of 5 ngml2 1 PDBU with 24 nM ionomycin (IO)
for 4min, followed by addition of 37 nM ionomycin. The steady-state [Ca2þ]iplateau produced under these conditions simulates that induced by HEL stimula-
tion (Fig.1). b, Time course of NFATc translocation (X), IkBa degradation (O), and
JNK1 phosphorylation (B) for the experiment shown in a.
IκBα
JNK1
ATF-2
35
86
52
U 79 118 177 400 600 952 1427 2142 (nM)
118
Ionomycin
c
ba
NFATc(cyto)
203
118
NFATc(nuc)
118
NFATp(cyto)
118
86
Act
ivat
ion (%
)[C
a2+ ]
i (µM
)
[Ca2+]i (µM)
Time (min)
100
50
0
0.12 3 4 5 6 7 8 9
12 3
NFAT
IκBα
JNK1/ATF-2
3
2
1
01086420
Ionomycin
Figure 4 Differential Ca2þ sensitivity of NFATc/p, IkBa/RelA and JNK1/ATF-2. a,
Cells were treated with increasing concentrations of ionomycin in the presence of
5 ngml2 1 PDBU and analysed by western blotting 10min after stimulation. The
concentration of ionomycin in nM is indicated above each lane (U, unstimulated).
b, Average [Ca2þ]i responses of .250 cells stimulated with increasing doses of
ionomycin (23, 35, 52 nM, in addition to the concentrations shown in a). The same
batch of cells and incubation conditions were used as in a. c, Degradation of IkBa
(þ), phosphorylationof JNK1 (X) andATF-2 (B), and translocationof NFATc (A) and
NFATp (W) are shown as a function of peak [Ca2þ]i for each dose of ionomycin
applied in b. Peak [Ca2þ]i is most relevant for NF-kB and JNK1 because they
respond in a prolonged fashion to a transient [Ca2þ]i spike (Fig. 2). Because
NFATc/p responds reversibly to increases in [Ca2þ]i (Fig. 2), this analysis may
slightly underestimate the true Ca2þ sensitivity of NFATc/p. The graph identifies a
range of [Ca2þ]i that selectively activates NFATc/p without appreciably stimulating
NF-kB or JNK1/ATF-2.
Nature © Macmillan Publishers Ltd 1997
letters to nature
858 NATURE | VOL 386 | 24 APRIL 1997
(1;035 6 263 nM; means 6 s:e:m:). These measurements of theCa2þ sensitivity of NFAT translocation agree with the reportedsensitivity of an NFAT/AP1-dependent reporter gene6,11. The Ca2þ
dependence of NF-kB and JNK was previously inferred onlyqualitatively from their stimulation by Ca2þ ionophore9 or frominhibition by drugs like CsA that inhibit calcineurin8. Our resultsindicate that NFATc/p is significantly more Ca2þ-sensitive than NF-kB and JNK1/ATF-2, and that this enhanced Ca2þ sensitivity enablesNFAT to be selectively activated by the low-Ca2þ plateau.
The ability of cells to react appropriately to a wide variety ofenvironmental stimuli requires a high degree of specificity insignalling from the plasma membrane to the nucleus. It is remark-able that such specificity is achieved, given the relatively smallnumber of second messenger pathways that exist. Many mechan-isms have been proposed to explain transcriptional selectivity22, butthe contribution of different Ca2þ signals to specificity has not beenpreviously recognized. Our results show that the amplitude andduration of dynamic Ca2þ signals contribute to transcriptionalspecificity, and that this is a direct consequence of the differingCa2þ sensitivities and kinetic behaviour of NF-kB, JNK and NFAT.These differences may also predict frequency-specific effects of[Ca2þ]i oscillations on gene transcription, which have been impli-cated in neuronal differentiation23.
Differential signalling by Ca2þ is likely be important in theregulation of immunity and inflammation. In self-tolerant B cells,basal [Ca2þ]i is moderately raised and NFAT is activated, but acutestimulation with antigen fails to generate a Ca2þ spike or activate theNF-kB or JNK1 pathways19. Similarly, elevation of basal [Ca2þ]i andthe absence of an antigen-induced Ca2þ spike has been reported in Tcells rendered anergic by an anti-CD3 monoclonal antibody24 and inT cells that have differentiated to the anti-inflammatory TH2state24,25. Low-amplitude Ca2þ responses have also been implicatedin the induction of T-cell anergy by altered peptide ligands26.Conversely, a high Ca2þ spike without a lower plateau is triggeredduring the inhibition of B-cell responses by the binding of immunecomplexes to the Fc receptor27,28. Our findings suggest that thefunctional consequences of these isolated Ca2þ spikes and plateaux,as well as of other Ca2þ signalling patterns such as oscillations andwaves, may arise from the selective activation of transcriptionalregulators. The importance of second messenger amplitude andduration in discriminating between different response pathwaysmay prove to be a common theme in many cells. M. . . . . . . . . . . . . . . . . . . . . . . . . . . . . . . . . . . . . . . . . . . . . . . . . . . . . . . . . . . . . . . . . . . . . . . . . . . . . . . . . . . . . . . . . . . . . . . . . . . . . . . . . . . . . . . . . . . . . . . . .
Methods
Calcium imaging. For single-cell calcium imaging, purified B cells29 wereincubated at 378 with 1 mM Fura-2/AM (Molecular Probes) for 15 min inphenol-red-deficient RPMI supplemented with 3% fetal bovine serum (FBS).After loading, cells were washed and maintained at room temperature in a 5%CO2 atmosphere for up to 1 hour. Cells were plated on clean glass coverslips andimaged at 37 8C in phenol-red-deficient RPMI with 1% FBS. Ratiometricimaging was done on the heated stage of a Zeiss Axiovert 35 microscope using a40 3 oil-immersion objective (Zeiss Achrostigmat, NA 1.3), an intensifiedCCD camera (Hamamatsu) and a Videoprobe image processor (ETM Systems)essentially as described30.Quantitation of western blots. Cells were stimulated at a density of,3 3 107 cells per ml in phenol-red-deficient RPMI with 1% FBS. Stimulationswere stopped on ice, centrifuged and resuspended in hypotonic buffer (5 mMNaCl, 20 mM HEPES, pH 7.5) containing protease (2.5 mM PMSF, 40 mg ml 2 1
each of aprotinin and leupeptin, 2 mM EDTA) and phosphatase inhibitors(1 mM NaVO4, 6 mM pNPP, 10 mM NaF) and 0.4% NP-40. Nuclei wereseparated by centrifugation at 600g at 3 8C and cytoplasmic extracts (super-natant) were added to boiling SDS–PAGE reducing sample buffer. Nuclei wererinsed in hypotonic buffer with inhibitors and lysed in boiling sample buffer.For Figs 1–3, chromatin was removed from nuclear extracts by centrifugationat 70,000g in a Beckman airfuge. For Fig. 4, chromatin was sheared by passing itrepeatedly through a 26-gauge needle. Extracts were resolved by SDS–PAGE,transferred to nitrocellulose and analysed by immunoblot and ECL (Amer-
sham). Anti-NFATc(7A6) and anti-NFATp(4G10G5) were obtained from L.Timmerman and G. Crabtree, anti-IkBa and anti-RelA were from Santa CruzBiotechnology, anti-JNK1 was from Pharmingen and Santa Cruz Biotechnol-ogy, and anti-ATF was from J. Hoeffler and M. Green. Autoradiograms wereanalysed with a Molecular Dynamics computing densitometer using thevolume-integrate mode. An exposed area of film outside each lane was usedas background. Raw density values for NFATc, IkBa, and RelA were correctedfor the loading of each lane; for JNK1 and ATF-2, the density of phosphorylatedbands was calculated relative to the summed density of the phosphorylated andunphosphorylated bands. NFATc activation was calculated from the loss ofcytoplasmic material (measurements based on accumulation of nuclear mate-rial gave similar results). Activation is expressed relative to the values observedin unstimulated (0%) and maximally stimulated (100%) cells. On an absolutescale, maximal NFATc/p translocation ranged from 75–90%, maximal IkBa
degradation was 80–99%, nuclear RelA was induced maximally by fivefold,ATF-2 phosphorylation was 20–30%, and maximum JNK1 phosphorylationranged from 50–60%.
Received 16 December 1996; accepted 6 March 1997.
1. Ghosh, A. & Greenberg, M. E. Calcium signaling in neurons: molecular mechanisms and cellularconsequences. Science 268, 239–247 (1995).
2. Berridge, M. J. Inositol trisphosphate and calcium signalling. Nature 361, 315–325 (1993).3. Clapham, D. E. Calcium signaling. Cell 80, 259–268 (1995).4. Crabtree, G. R. & Clipstone, N. A. Signal transmission between the plasma membrane and nucleus of
T lymphocytes. Annu. Rev. Biochem. 63, 1045–1083 (1994).5. Gold, M. R. & DeFranco, A. L. Biochemistry of B lymphocyte activation. Adv. Immunol. 55, 221–295 (1994).6. Fanger, C. M., Hoth, M., Crabtree, G. R. & Lewis, R. S. Characterization of T cell mutants with defects
in capacitative calcium entry: genetic evidence for the physiological roles of CRAC channels. J. CellBiol. 131, 655–667 (1995).
7. Bauerle, P. A. & Henkel, T. Function and activation of NF-kB in the immune system. Annu. Rev.Immunol. 12, 141–179 (1994).
8. Frantz, B. et al. Calcineurin acts in synergy with PMA to inactivate I kappa B/MAD3, an inhibitor ofNF-kB. EMBO J. 13, 861–870 (1994).
9. Su, B. et al. JNK is involved in signal integration during costimulation of T lymphocytes. Cell 77, 727–736 (1994).
10. Karin, M. & Hunter, T. Transcriptional control by protein phosphorylation: signal transmission fromthe cell surface to the nucleus. Curr. .Biol. 5, 747–757 (1995).
11. Negulescu, P. A., Shastri, N. & Cahalan, M. D. Intracellular calcium dependence of gene expression insingle T lymphocytes. Proc. Natl Acad. Sci. USA 91, 2873–2877 (1994).
12. Timmerman, L. A., Clipstone, N. A., Ho, S. N., Northrop, ,J. P. & Crabtree, G. R. Rapid shuttling ofNF-AT in discrimination of Ca2þ signals and immunosuppression. Nature 383, 837–840 (1996).
13. Shibasaki, F., Price, E. R., Milan, D. & McKeon, F. Role of kinases and the phosphatase calcineurin inthe nuclear shuttling of transcription factor NF-AT4. Nature 382, 370–373 (1996).
14. Rao, A. NF-ATp: a transcription factor required for the coordinate induction of several cytokinegenes. Immunol. Today 15, 274–281 (1994).
15. Goodnow, C. C. et al. Altered immunoglobulin expression and functional silencing of self-reactive Blymphocytes in transgenic mice. Nature 334, 676–682 (1988).
16. DiDonato, J. A., Mercurio, F. & Karin, M. Phosphorylation of I-kBa precedes but is not sufficient forits dissociation from NF-kB. Mol. Cell. Biol. 15, 1302–1311 (1995).
17. Verma, I. M., Stevenson, J. K., Schwarz, E. M., Van Antwerp, D. & Miyamoto, S. Rel/NF-kB/IkBfamily: intimate tales of association and dissociation. Genes Dev. 9, 2723–2735 (1995).
18. Gupta, S., Campbell, D., Derijard, B. & Davis, R. J. Transcription factor ATF-2 regulation by the JNKsignal transduction pathway. Science 267, 389–393 (1995).
19. Healy, J. I. et al. Different nuclear signals are activated by the B cell receptor during positive versusnegative signaling. Immunity (in the press).
20. Flanagan, W. M., Corthesy, B., Bram, R. J. & Crabtree, G. R. Nuclear association of a T-celltranscription factor blocked by FK506 and cyclosporin A. Nature 352, 803–807 (1991).
21. Cambier, J. C., Pleiman, C. M. & Clark, M. R. Signal transduction by the B cell antigen receptor and itscoreceptors. Annu. Rev. Immunol. 12, 457–486 (1994).
22. Ernst, P. & Smale, S. T. Combinatorial regulation of transcription 1: general aspects of transcriptionalcontrol. Immunity 2, 311–319 (1995).
23. Gu, X. & Spitzer, N. C. Distinct aspects of neuronal differentiation encoded by frequency ofspontaneous Ca2þ transients. Nature 375, 784–787 (1995).
24. Gajewski, T. F., Lancki, D. W., Stack, R. & Fitch, F. W. ‘‘Anergy’’ of TH0 helper T lymphocytes inducesdownregulation of TH1 characteristics and a transition to a TH2-like phenotype. J. Exp. Med. 179,481–491 (1994).
25. Gajewski, T. F., Schell, S. R. & Fitch, F. W. Evidence implicating utiilization of different T cell receptor-associated signaling pathways by TH1 and TH2 clones. J. Immunol. 144, 4110–4120 (1990).
26. Sloan-Lancaster, J., Steinberg, T. H. & Allen, P. M. Selective activation of the calcium signalingpathway by altered peptide ligands. J. Exp. Med. 184, 1525–1530 (1996).
27. Wilson, H. A. et al. The B lymphocyte calcium response to anti-Ig is diminished by membraneimmunoglobulin cross-linkage to the Fc gamma receptor. J. Immunol. 138, 1712–1718 (1987).
28. Choquet, D., Partiseti, M., Amigorena, S., Bonnerot, C. & Fridman, W. Cross-linking of IgG receptorsinhibits membrane immunoglobulin-stimulated calcium influx in B lymphocytes. J. Biol. Chem. 121,355–363 (1993).
29. Cyster, J. et al. Regulation of B-lymphocyte negative and positive selection by tyrosine phosphataseCD45. Nature 381, 325–328 (1996).
30. Dolmetsch, R. & Lewis, R. S. Signaling between intracellular Ca2þ stores and depletion-activated Ca2þ
channels generates [Ca2þ]i oscillations in T lymphocytes. J. Gen. Physiol. 103, 365–388 (1994).
Acknowledgements. We thank L. Timmerman, G. Crabtree, J. Hoeffler, and M. Green for the generousgifts of antibodies, and M. Hoth, A Zweifach, and R. Tsien for comments on an earlier version of themanuscript. R.E.D. is supported by an American Heart Association Fellowship, R.S.L. is supported by theNIH, C.C.G. is an investigator of the Howard Hughes Medical Institute, and J.I.H. is a Beckman Scholarsupported by the NIGMS Medical Scientist Training Program.
Correspondence and requests for materials should be addressed to R.S.L. (e-mail: [email protected]).
Nature © Macmillan Publishers Ltd 1997
letters to nature
308 NATURE | VOL 388 | 17 JULY 1997
synthesized by PCR. DNase I footprinting reactions were processed asdescribed24.Reporter gene construction. Substitution of a single BglII site for thequadrant enhancer Mad binding-site sequence GCTGCCGTCGCG was doneby assembling two fragments generated by PCR with Pfu polymerase.Expansion of the single BglII site to two tandem sites matching the Qm
sequence was done by insertion of an oligonucleotide containing BbsI internalsites that allowed for subsequent cleavage and ligation to generate the tandemBglII sites. Both sequences were confirmed by sequencing and ligated into theKpnI/NotI sites of the Hsp lacZ-CaSpeR Drosophila transformation vector forthe generation of transgenic lines24.
Received 20 January; accepted 21 May 1997.
1. Graff, J. M., Bansal, A. & Melton, D. A. Xenopus Mad proteins transduce distinct subsets of signals forthe TGFb superfamily. Cell 85, 479–487 (1996).
2. Hoodless, P. A. et al. MADR1, a MAD-related protein that functions in BMP2 signaling pathways. Cell85, 489–500 (1996).
3. Liu, F. et al. A human Mad protein acting as a BMP-regulated transcriptional activator. Nature 381,622–623 (1996).
4. Eppert, K. et al. MADR2 maps to 18q21 and encodes a TGF b-regulated MAD-related protein that isfunctionally mutated in colorectal carcinoma. Cell 86, 543–552 (1996).
5. Zhang, Y., Feng, X.-H., Wu, R.-Y. & Derynck, R. Receptor-associated Mad homologues synergize aseffectors of the TGF-b response. Nature 383, 168–172 (1996).
6. Lagna, G., Hata, A., Hemmati-Brivnlou, A. & Massague, J. Partnership between DPC4 and SMADproteins in TGF-b signalling pathways. Nature 383, 832–836 (1996).
7. Savage, C. et al. C. elegans genes sma-2, sma-3, and sma-4 genes define a conserved family of TGF-bpathway components. Proc. Natl Acad. Sci. USA 93, 790–794 (1996).
8. Macias-Silva, M. et al. MADR2 is a substrate of the TGF-b receptor and its phosphorylation isrequired for nuclear accumulation and signaling. Cell 87, 1215–1224 (1996).
9. Derynck, R. & Zhang, Y. Intracellular signalling: The Mad way to do it. Curr. Biol. 6, 1226–1229(1996).
10. Chen, X., Rubock, M. J. & Whitman, M. A transcriptional partner for MAD proteins in TGF-bsignalling. Nature 383, 691–696 (1996).
11. Raftery, L., Twombly, V., Wharton, K. & Gelbart, W. Genetic screens to identify elements of thedecapentaplegic pathway in Drosophila. Genetics 139, 241–254 (1995).
12. Sekelsky, J., Newfeld, S., Raftery, L., Chartoff, E. & Gelbart, W. Genetic characterization and cloning ofMothers against dpp, a gene required for decapentaplegic function in Drosophila melanogaster. Genetics139, 1347–1358 (1995).
13. Newfeld, S. J., Chartoff, E. H., Graff, J. M., Melton, D. A. & Gelbart, W. M. Mothers against dpp encodesa conserved cytoplasmic protein required in DPP/TGF-b responsive cells. Development 122, 2099–2108 (1996).
14. Wiersdorff, V., Lecuit, T., Cohen, S. M. & Mlodzik, M. Mad acts downstream of Dpp receptors,revealing a differential requirement for dpp signaling in initiation and propagation of morphogenesisin the Drosophila eye. Development 122, 2153–2162 (1996).
15. Blair, S. Compartments and appendage development in Drosophila. BioEssays 17, 229–309 (1995).16. Basler, K. & Struhl, G. Compartment boundaries and the control of Drosophila limb pattern by
hedgehog protein. Nature 368, 208–214 (1994).17. Tabata, T. & Kornberg, T. Hedgehog is a signalling protein with a key role in patterning Drosophila
imaginal discs. Cell 76, 89–102 (1994).18. Zecca, M., Basler, K. & Struhl, G. Sequential organizing activities of engrailed, hedgehog and
decapentaplegic in the Drosophila wing. Development 121, 2265–2278 (1995).19. Ingham, P. W. & Fietz, M. J. Quantitative effects of hedgehog and decapentaplegic activity on the
patterning of the Drosophila wing. Curr. Biol. 5, 432–440 (1995).20. Posakony, L., Raftery, L. & Gelbart, W. Wing formation in Drosophila melanogaster requires
decapentaplegic gene function along the anterior–posterior compartment boundary. Mech. Dev. 33,69–82 (1991).
21. Capdevilla, J. & Guerrero, I. Targeted expression of the signalling molecule decapentaplegic inducespattern duplications and growth alterations in Drosophila wings. EMBO J. 13, 4459–4468 (1994).
22. Nellen, D., Burke, R., Struhl, G. & Basler, K. Direct and long-range action of a Dpp morphogengradient. Cell 85, 357–368 (1996).
23. Lecuit, T. et al. Two distinct mechanisms for long-range patterning by Decapentaplegic in theDrosophila wing. Nature 381, 387–393 (1996).
24. Kim, J. et al. Integration of positional signals and regulation of wing formation and identity byDrosophila vestigial gene. Nature 382, 133–138 (1996).
25. de Celis, J. F., Bario, R. & Kafatos, F. C. A gene complex acting downstream of dpp in Drosophila wingmorphogenesis. Nature 381, 421–424 (1996).
26. Grimm, S. & Pflugfelder, G. O. Control of the gene optomotor-blind in Drosophila wing developmentby decapentaplegic and wingless. Science 271, 1601–1604 (1996).
27. Chouinard, S. & Kaufman, T. C. Control of expression of the homeotic labial (lab) locus of Drosophilamelanogaster: evidence for both positive and negative autogenous regulation. Development 113,1267–1280 (1991).
28. Tremml, G. & Bienz, M. Induction of labial expression in the Drosophila endoderm: response elementsfor dpp signalling and for autoregulation. Development 116, 447–456 (1992).
29. Thuringer, F., Cohen, S. M. & Bienz, M. Dissection of an indirect autoregulatory response of ahomeotic Drosophila gene. EMBO J. 12, 2419–2430 (1993).
30. Eresh, S., Riese, J., Jackson, D. B., Bohmann, D. & Bienz, M. A CREB-binding site as a target fordecapentaplegic signalling during Drosophila endoderm induction. EMBO J. 16, 2014–2022 (1997).
31. Ausubel, F. M. et al. (eds) Current Protocols in Molecular Biology supplement 28, pp. 16.6.1–16.7.7(Wiley, New York, 1994).
Acknowledgements. We thank K. Vorwerk for technical assistance; M. Hoffmann for discussion; Y. J.Chen for the MAD cDNA clone and help with sequencing; V. Wiersdorff, M. Mlodzik and S. Cohen for theMad1.2 stock; S. Paddock for help with microscopy; T. Kaufman for the labial endodermal enhancer;M. Hoffmann and G. Halder for comments on the manuscript; and J. Wilson for manuscript preparation.K. J. was supported by a genetics predoctoral training grant and the Cremer Scholarship Fund, and part ofthis work was supported by the Howard Hughes Medical Institute (S.B.C.)
Correspondence and requests for materials should be addressed to A.L. (e-mail: [email protected]).
errata
Differential activationoftranscription factorsinducedbyCa2þ responseamplitudeanddurationRicardo E. Dolmetsch, Richard S. Lewis,Christopher C. Goodnow & James I. Healy
Nature 386, 855–858 (1997)..................................................................................................................................The graphs in Fig. 2e were accidentally swapped around during theproduction process. The correct versions are shown here. M
e
NFATcIκBα JNK1Act
ivat
ion (%
) 100
50
0181260
Time (min)
100
50
0181260
Time (min)
100
50
0181260
Time (min)
Large-scale tectonicdeformation inferredfromsmall earthquakesFalk Amelung & Geoffrey King
Nature 386, 702–705 (1997)..................................................................................................................................Owing to an error in the production process, a length scale wasomitted from Fig. 2b and the shading in Fig. 2d did not show up.The corrected figure is shown here. M
11
528 98
299 1959 4769 5593 435
M3.94-4.54M4.54-5.14M5.14–5.75M6.34–7.00 M5.75–6.34
M0.33-1.08M1.08-1.83M1.83–2.58M2.58–3.33M3.33–3.94
FGHJ I
ABCDE
Seismic
Moment release
GeodeticPlate motion
all events
''good'' events
10 3
10104
3
105
106
107
108
109
Geo
met
ric m
om
ent (m
3)
1 2 3Magnitude
4 5 6 7
Slip
rat
e (m
m y
r–1 )
10
-4
10-5
10
10
-3
10
-2
-1
100
101
a
c d
b
N38°W N38°W
100 1,000 10,000
Fault length (m)

Nature © Macmillan Publishers Ltd 1997
letters to nature
702 NATURE | VOL 386 | 17 APRIL 1997
4. Groisman, P. Ya, Karl, T. R. & Knight, T. W. Observed impact of snow cover on the heat balance and therise of continental spring temperatures. Science 263, 198–200 (1994).
5. Tucker, C. J. in Advances in the Use of NOAA AVHRR Data for Land Applications (ed. D’Souza, D.) 1–19 (European Economic Union Press, Brussells, 1995).
6. James, M. E. & Kalluri, S. N. V. The Pathfinder AVHRR land data set: an improved coarse-resolutiondata set for terrestrial monitoring. Int. J. Remote Sens. 15, 3347–3364 (1994).
7. Tucker, C. J., Fung, I. Y., Keeling, C. D. & Gammon, R. H. Relationship between atmospheric CO2
variations and a satellite-derived vegetation index. Nature 319, 195–199 (1986).8. Asrar, G., Fuchs, M., Kanemasu, E. T. & Hatfield, J. L. Estimating absorbed photosynthetic radiation
and leaf area index from spectral reflectance in wheat. Agron. J. 76, 300–306 (1984).9. Myneni, R. B., Hall, F. G., Sellers, P. J. & Marshak, A. L. the interpretation of spectral vegetation
indexes. IEEE Trans. Geosci. Remote Sens. 33, 481–486 (1995).10. Tucker, C. J., Newcomb, W. W. & Dregne, A. E. AVHRR data sets for determination of desert spatial
extent. Int. J. Remote Sens. 15, 3547–3566 (1994).11. Rao, C. R. N. & Chen, J. Inter-satellite calibration linkages for the visible and near-infrared channels of
the advanced Very High Resolution Radiometer on the NOAA-7, -9, and -11 spacecraft. Int. J. RemoteSens. 16, 1931–1942 (1995).
12. Los, S. O. Calibration adjustment of the NOAA AVHR Normalized Difference Vegetation Indexwithout recourse to component channel 1 and 2 data. Int. J. Remote Sens. 14, 1907–1917 (1993).
13. Holben, B. N. Characteristics of maximum value composite images for temporal AVHRR data. Int. J.Remote Sens. 7, 1417–1437 (1986).
14. Myneni, R. B., Tucker, C. J., Asrar, G., Keeling, C. D. & Nemani, R. R. Increased vegetation greennessamplitude and growing season duration in northern high latitudes inferred from satellite-sensedvegetation index data from 1981–91. NASATech. Memo. 104638 (NASA Goddard Space Flight Center,Greenbelt, MD, 1996).
15. Myneni, R. B., Los, S. & Tucker, C. J. Satellite-based identification of linked vegetation index and seasurface temperature anomaly areas from 1982–1990 for Africa, Australia and South America.Geophys. Res. Lett. 23, 729–732 (1996).
16. Keeling, C. D., Whorf, T. P., Wahlen, M. & van der Plicht, J. Interannual extremes in the rate of rise ofatmospheric carbon dioxide since 1980. Nature 375, 666–670 (1995).
17. Heimann, M., Keeling, C. D. & Tucker, C. J. in Aspects of Climate Variability in the Pacific and WesternAmericas (ed. Peterson, D. H.) 277–303 (Geophys. Monog. Ser., Am. Geophys. Union, WashingtonDC, 1989).
18. Kauppi, P. E., Mielikainen, K. & Kuusela, K. Biomass and carbon budget of European forests from1971–1990. Science 256, 70–74 (1992).
19. Jacoby, G. C., D’Arrigo, R. D. & Davaajamts, T. Mongolian tree rings and 20th-century warming.Science 273, 771–773 (1996).
20. Houghton, J. T. et al. (eds) Climate Change 1995 1–365 (Cambridge Univ. Press, 1995).21. Jones, P. D., Wigley, T. M. L. & Briffa, K. R. in Trends ’93: A Compendium of Data on Global Change (eds
Boden, T. A., Kaiser, D. P., Sepanski, R. J. & Stoss, F. W.) (ORNL/CDIAC-65, Oak Ridge, TN, 1994).22. Piper, S. C. & Stewart, E. F. A gridded global data set of daily temperature and precipitation for
terrestrial biosphere modelling. Glob. Biogeochem. Cycles 10, 757–782 (1996).
Acknowledgements. We thank S. C. Piper and E. F. Stewart for analysis of the station temperature data,S. C. Piper and T. P. Whorf for discussions, and S. Los for help in the calibration of GIMMS NDVI data.This work was supported by the Office of Mission ot Planet Earth of NASA. E. F. Stewart’s collaborationwas made possible by funds from the Electric Power Research Institute and the USNSF.
Correspondence should be addressed to R.B.M. (e-mail: [email protected]).
Large-scale tectonicdeformation inferredfromsmall earthquakesFalk Amelung* & Geoffrey King
Institut de Physique du Globe, 5, Rue Rene Descartes, F-67084 Strasbourg, France. . . . . . . . . . . . . . . . . . . . . . . . . . . . . . . . . . . . . . . . . . . . . . . . . . . . . . . . . . . . . . . . . . . . . . . . . . . . . . . . . . . . . . . . . . . . . . . . . . . . . . . . . . . . . . . . . . . . . . . . .
It is a long-standing question whether the focal mechanisms ofsmall earthquakes can be used to provide information abouttectonic deformation on a regional scale. Here we address thisquestion by using a 28-year record of seismicity in the SanFrancisco Bay area to compare the strain released by small earth-quakes with geological, geodetic and plate-tectonic measurementsof deformation in this region. We show that on a small spatialscale, the strain released by small earthquakes is closely related tospecific geological features. But when averaged over a regionalscale, strain release more closely follows the regional pattern oftectonic deformation: this relationship holds for all but the largestearthquakes, indicating that the earthquake strain is self-similar1,2
over a broad range of earthquake magnitudes. The lack of self-similarity observed for the largest earthquakes suggests that thetime interval studied is not large enough to sample a complete setof events—the fault with the highest probability3 for hosting onesuch missing event is the Hayward fault.
Following the formulation by Kostrov4, the seismic strain of ablock in the Earth’s crust can be obtained from the geometricmoment tensors
eij ¼1
2V ^N
n¼1
M ðnÞij ð1Þ
where M(n)ij is the geometric moment tensor of the nth earthquake, N
is the number of earthquakes and V is the volume of the block.The geometric moment tensor of an earthquake is given byM ij ¼ eAudAðuinj þ ujniÞ, where A is the surface of the fault, dA isa surface element, u is the slip in the earthquake, and ui and ni are theunit slip and fault-normal vectors, respectively. The geometricmoment tensor Mij, referred to by Ben-Menahem and Singh5 as‘‘potency’’, is related to the seismic moment tensor Mij used inseismology by Mij ¼ mM ij (ref. 6), where m is the shear modulus.
The strain in a local region, e(loc)ij , is related to the strain in a larger
region, e(reg)ij , by a fourth-order tensor that is a complicated function
of time and space. Here we consider special cases in which they areassumed to be linearly related by
eðlocÞij ¼ ceðregÞ
ij ð2Þ
where c is the amplitude of the local deformation, that is, the shapeand the orientation of the local and regional strain tensors areidentical but their amplitudes can be different. For homogeneousdeformation, c ¼ 1. If seismic strain is self-similar and if e(loc)
ij is theseismic strain by earthquakes in one scale, then equation (2) willapply at any scale with different values for c. Some examples are
* Present addresses: Department of Geophysics, Stanford University, Stanford, California 94305, USA(F.A.); Institut de Physique du Globe, Laboratoire de Tectonique, Tour 24, BP89, 4 Place Jussieu, 75252Paris, France (G.K.).
(local)
εij(regional)
c
a b
f
Strain representation
e
d
εij(local)
εij
(local)εij
(local)εij
Figure 1 Homogeneous and inhomogeneous deformation in four different
regions subject to pure shear. a, Boundary conditions and imposed strain. b, The
strain tensor is represented by two-dimensional strain rosettes for the horizontal
components. White lobes indicate directions of contraction, black lobes indicate
directions of extensions. c, Homogeneous deformation. d, Inhomogeneous
deformation due to an individual shear fault. e, Inhomogeneous deformation due
to two faults. f, Quasi-homogeneous deformation due to many shear faults with a
variety of orientations.

Nature © Macmillan Publishers Ltd 1997
letters to nature
NATURE | VOL 386 | 17 APRIL 1997 703
illustrated in Fig. 1. The (applied) regional strain is pure shear (Fig.1a). We refer to the orientation and shape of a strain tensor as thestrain pattern and use strain rosettes for the representation (Fig. 1b).In the absence of faults the strain is homogeneous and the strainpattern in a local region is identical to the regional strain (Fig. 1c).The strain due to slip on a single fault is in general different from theregional strain (Fig. 1d). Two shear faults are, in principle, sufficientto accommodate any regional shear although strain concentrationscan be large (Fig. 1e). The strain pattern in a region that contains
many faults with a variety of orientations and homogeneous spatialdistribution tends to equal the regional strain (Fig. 1f). Note thatFig. 1f is identical to Fig. 1c if the faults are small compared to thedimension of the region.
The larger San Francisco Bay area (Fig. 3a) is part of the plateboundary zone between the Pacific and North American plates. Theregional deformation is primarily simple shear. South of 378 Nnearly all the transform motion is accommodated on the SanAndreas fault and the motion is mainly aseismic (creeping section).
11
5
2898
299 1959 4769 5593 435
M3.94-4.54M4.54-5.14M5.14–5.75M6.34–7.00 M5.75–6.34
M0.33-1.08M1.08-1.83M1.83–2.58M2.58–3.33M3.33–3.94
FGHJ I
ABCDE
Seismic
Moment release
GeodeticPlate motion
all events
''good'' events
10 3
10104
3
105
106
107
108
109
Geom
etric
mom
ent (m
3)
1 2 3Magnitude
4 5 6 7
Slip
rate
(m
m y
r–1)
10
-4
10-5
10
10
-3
10
-2
-1
100
101
a
c d
b
N38°W N38°W
100 1,000 10,000
Fault length (m)
Figure 2 a, Two-dimensional strain rosettes representing the horizontal seismic
strain patterns due to the earthquakes in Fig. 3 in magnitude ranges for which
mean fault dimensionsdiffer by factors of 2 (A–J). The numbersof events summed
are shownnext to the strain rosettes. The fault plane solutions are calculated from
the first motion polarities using the computer program FPFIT32. The geometric
moments are calculated for the local or duration magnitude, M, using the
empirical relations logM0 ¼ 1:5M 2 1:5 for M . 3:33 and logM0 ¼ 1:2M 2 0:5 for
M < 3:33 (modified from Bakun’s33 relations for the seismic moment using
m ¼ 30GPa). In this study only ‘‘good’’ events satisfying some quality criteria
are used; with uncertainties in strike, dip and rake less than 308, 458 and 458, and
with magnitude > 0:3, depth > 2 km, r:m:s: < 0:3 s; horizontal location
error < 2:5 km; vertical location error < 5 km; number of first motions > 30;
azimuthal gap < 1808 (see ref. 32 for explanation of these parameters)
%rtp < 0:4; sdr > 0:4; fit < 0:4. b, Summed geometric moment within the magni-
tude intervals. The fault length is for circular faults and displacement-to-length
ratios of 3 3 102 4. The abscissa is not linear in magnitude because of two
different moment–magnitude relations. The slip rate contribution is averaged
over the observational period of 28 years and assumes that the events fall on a
250-km-long and 15-km-deep plate boundary fault. c, Predicted strain pattern for
an orientation of the Pacific–North American plate boundary of N388 W, and
relative motion of the Pacific plate in N348 W. d, Mean geodetic strain pattern
from trilateration data16. The contributions of the San Francisco Bay network and
of the Monterey network are summed. It is assumed that they cover three-
quarters and one-quarter of the region studied, respectively. The strain rosettes
in c and d represent 5% contraction perpendicular to N388 W.
Table 1 Seismic deformation in earthquake regions
Region Direction of principalcontraction
principalextensional��
��
principalcontraction��
��
Number of eventssummed
...................................................................................................................................................................................................................................................................................................................................................................
Golden Gate N38W 2.9 58...................................................................................................................................................................................................................................................................................................................................................................
San Francisco Peninsula N318W 0.29 170...................................................................................................................................................................................................................................................................................................................................................................
Loma Prieta N168W 0.57 885...................................................................................................................................................................................................................................................................................................................................................................
Hollister N38W 0.91 7,117...................................................................................................................................................................................................................................................................................................................................................................
Calaveras fault N148W 0.99 2,303...................................................................................................................................................................................................................................................................................................................................................................
Hayward fault N128W 0.88 341...................................................................................................................................................................................................................................................................................................................................................................
Livermore N338W 1 1,239...................................................................................................................................................................................................................................................................................................................................................................
San Gregorio fault N208W 0.59 75...................................................................................................................................................................................................................................................................................................................................................................
North Bay N288W 0.77 98...................................................................................................................................................................................................................................................................................................................................................................
Diablo Range N268W 0.77 182...................................................................................................................................................................................................................................................................................................................................................................Shown here are the directions of principal contraction and ratios between the principal components of the horizontal strain in the regions from Fig. 3, for all events with magnitude < 3:33.

Nature © Macmillan Publishers Ltd 1997
letters to nature
704 NATURE | VOL 386 | 17 APRIL 1997
Further north, two-thirds of the deformation7 occurs on the SanAndreas fault in occasional large earthquakes such as the 400-km-long rupture in 1906 or in smaller earthquakes that rupture faultsegments 10–40 km long3. The remaining deformation is accom-modated on subparallel strike-slip faults. The Hayward fault, forexample, has been the source of two earthquakes with magnitudes(M) between 6.5 and 7 in 1836 and 1868 (ref. 8), and the Calaverasfault has ruptured in a sequence of earthquakes with M . 5:5beginning in 1979; the M ¼ 6:2 1984 Morgan Hill earthquake wasthe largest9,10. The recurrence times of 1906-type San Franciscoearthquakes, of events on the Hayward fault and the Calaveras faultearthquakes are of the order of 250 years, 150 years and 80 years,respectively3. The seismic data covers a 28-year time period, which isnearly one-third of the shortest seismic cycle.
The seismic deformation of the San Francisco Bay area fordifferent magnitude intervals is shown in Fig. 2a. The geometricmoment tensors are derived from the fault plane solution and themagnitude for each event. The magnitude ranges have been chosensuch that the seismic moments vary from one range to the other by afactor of 8. For events that are individually self-similar this corre-sponds to a factor of 2 change in mean fault dimensions betweenranges11–13. It can be seen that the strain patterns in the magnitudeintervals below magnitude 3.94 are similar and can be interpreted asright-lateral shear across N388 W and 5% of shortening in perpen-dicular direction. The strain patterns differ only for the largestearthquakes where few events have been summed. The similarity ofthe strain patterns, together with the fact that the events occurred indifferent parts of the Bay area on faults with different orientations,suggests that the small faults slipped such that the ensemble resultedin a homogeneous reduction of elastic strain. If that is true, equation(2) is satisfied and the strain accommodated by small earthquakes
represents the applied deformation. The similarity of the strainpatterns also indicates the self-similarity of earthquake strain. Asmany other aspects of rupture of rock are self-similar phenomena,such a self-similarity is expected to occur. Although the strainpatterns for different magnitude ranges are similar, the strainamplitudes vary strongly. This can be seen in Fig. 2b where thesummed release of geometric moment is shown. The nearly linearincrease of the summed moment with the fault length is character-istic for tectonic environments with a b-value (the slope in theGutenberg–Richter frquency of earthquake-occurrence relation) of,1.0 (refs 14, 15). Note that the summed moment released by all theearthquakes and that by the ‘good’ earthquakes (with sourceparameters satisfying some quality criteria) are similar except inthe two lowest magnitude intervals. The appropriateness of thequality criteria has been checked by examining the stability of all theseismic strain patterns obtained in this study using more and lessstrict criteria.
The seismic strain pattern can be compared with the strainpattern from plate motion and from geodetic16 information (Fig.2c, d). The plate motion strain pattern is calculated from the relativevelocity between the plates and the plate boundary direction, alongwhich linear deformation is assumed not to occur17. According toplate motion models, the Pacific plate at the latitude of SanFrancisco moves N348 W with respect to North America18,19. For aplate boundary direction of N348 W, the San Francisco Bay areawould shear right-laterally at N348 W. The average strike of themajor strike-slip faults, however, is more westerly. For a plateboundary direction of N388 W the predicted mean deformationcontains some boundary normal contraction.
The good agreement between the seismic strain patterns in thelower magnitude intervals (M ¼ 0:33–3:94), and the strain patterns
Figure 3 a, Location map showing the seismicity (M . 1:0) registered by the
Northern Californian Seismic Network (NCSN) between January 1968 and
December 1995 in the broader San Francisco Bay area. This study uses 15% of
the 95,000 registered events with well constrained moment tensors. b, Two-
dimensional strain rosettes representing the horizontal strain due to earthquakes
in the magnitude ranges defined in Fig. 2a (denoted by letters A–G). Only strain
rosettes resulting from summing .5 events are shown. The numbers of events
summed are shown next to the strain rosettes.

Nature © Macmillan Publishers Ltd 1997
letters to nature
NATURE | VOL 386 | 17 APRIL 1997 705
from the plate motion and from geodesy clearly shows that thedeformation by the small earthquakes is in direction identical to theapplied deformation, that is, the seismic (local) deformation andthe applied (regional) deformation are linearly related by equation(2). The condition for this to be true appears to be that a sufficientnumber of earthquakes with comparable size and on faults with avariety of orientations are summed. If not, the deformation will bedifferent because some event types are missing. This is the case forthe higher magnitude intervals. In the M ¼ 3:94–6:34 range, someearthquakes with a significant reverse component are absent. In theM ¼ 6:34–7:00 range, a strike-slip event is missing. The fault withthe highest probability3 for such an earthquake is the Hayward fault.
We note at this stage that the seismic strain pattern, the predictedstrain pattern, as well as the geodetic strain pattern imply that, in theSan Francisco Bay area, a shortening of ,5% of the shear deforma-tion (2 mm yr2 1) occurs normal to the plate boundary (assumed tobe oriented N388 W). This is indicated by various geological andgeophysical evidence20–23, but has been questioned because thegeodetic data has been interpreted differently16,24. (Those studiesexamined the geodetic data for shortening perpendicular to theplate motion direction (N348 W) and not perpendicular to the plateboundary direction (N388 W).)
So far this study has been concerned with the overall deformationacross the entire San Francisco Bay area (Fig. 3a). Figure 3b showsthat within the Bay area the seismic deformation varies locally (seealso Table 1). In almost all local regions the strain patterns areindependent of earthquake size. A comparison with the geodeticstrain pattern in these small areas is difficult because the geodeticdata lacks sufficient resolution25. The seismic strain patterns, how-ever, are associated with local tectonics and can partly be predictedfrom the geometry of the major strike-slip faults. In regions wherethey are oriented in the plate motion direction we expect shear, asobserved for example in the Calaveras area. In regions where thetrend of the faults is more westerly or more easterly we expect netcontraction or net extension. This is observed along the San Andreasfault. In the San Francisco Peninsula, the Loma Prieta and theHollister regions (although less prominent there), where the faultstrikes more westerly than the plate motion, the seismic strain iscontractional. Around the Golden Gate, where the fault strikes moreeasterly, the seismic strain is extensional. These strain patterns arecompatible with the uplift of the southern Santa Cruz Mountainsand the subsidence of the Golden Gate area, respectively25.
Earthquake focal mechanisms are commonly interpreted withrespect to the state of stress in the Earth’s crust26–28. Here we havebeen concerned with the state of strain. In homogeneous, isotropicmaterial the elastic strain results in a stress state with identicalprincipal directions. In the Earth’s brittle crust, however, theyshould be different because the strain localizes on fractures orfaults on a range of scales. In determining strain by summing overmany events and over a large period of time we average over strainheterogeneities and reproduce the applied deformation. Stressinversion assumes that the earthquakes are driven by a singlestress tensor invariant in space and time, and if the same strainand stress directions are obtained from focal mechanism data this isfortuitous. In the Loma Prieta region, for example, the straindirections differ from stress directions previously reported29–31,possibly because the hypothesis of a spatially and temporally uni-form stress tensor is not met. M
Received 2 August 1996; accepted 21 February 1997.
1. Mandelbrot, B. B. The Fractal Geometry of Nature (Freeman, San Francisco, 1983).2. Turcotte, D. L. Fractals and Chaos in Geology and Geophysics (Cambridge Univ. Press, Cambridge,
1992).3. Working Group on Californian Earthquake Probabiities Probabilities of Large Earthquakes in the San
Francisco Bay Region, California (Circ. 1053, US Geol. Survey, 1990).4. Kostrov, V. V. Earth Phys. 1, 23–40 (1974).5. Ben-Menahem, A. & Singh, J. J. Seismic Waves and Sources (Springer, New York, 1981).6. King, G. C. P. Phil. Trans. R. Soc. Lond. A 288, 197–212 (1978).7. Kelson, K. I., Lettis, W. R. & Lisowski, M. Proc. 2nd Conf. on Earthquake Hazards in the Eastern San
Francisco Bay Area 31–38 (Spec. Publ. 113, California Dept. of Conservation, Div. of Mines andGeology, 1992).
8. Ellsworth, W. Prof. Pap. US Geol. Surv. 1515, 153–181 (1990).9. Oppenheimer, D. H., Reasenberg, P. A. & Simpson, R. W. J. Geophys. Res. 93, 9007–9026 (1988).10. Oppenheimer, D. H., Bakun, W. H. & Lindh, A. G. J. Geophys. Res. 95, 8483–8489 (1990).11. Bakun, W. H., King, G. C. P. & Cockerham, R. S. in Earthquake Source Mechanics 195–207 (Geophys.
Monogr. 37, (Maurice Ewing 6), Am. Geophys. Union, 1986).12. King, G. C. P., Lindh, A. G. & Oppenheimer, D. H. Geophys. Res. Lett. 17, 1449–1452 (1990).13. King, G. C. P., Oppenheimer, D. & Amelung, F. Earth Planet. Sci. Lett. 128, 55–64 (1994).14. King, G. C. P. Pure Appl. Geophys. 121, 761–815 (1983).15. Amelung, F. & King, G. C. P. Geophys. Res. Lett. 24, 507–510 (1997).16. Lisowski, M., Savage, J. C. & Prescott, W. H. J. Geophys. Res. 96, 8369–8389 (1991).17. Ekstrom, G. & England, P. J. Geophys. Res. 94, 10231–10257 (1989).18. DeMets, C., Gordon, R. G., Argus, D. F. & Stein, S. Geophys. J. Int. 101, 425–478 (1990).19. DeMets, C., Gordon, R. G., Argus, D. F. & Stein, S. Geophys. Res. Lett. 21, 2191–2194 (1994).20. Page, B. M. in Proc. 2nd Conf. on Earthquake Hazards in the Eastern San Francisco Bay Area 1–7 (Spec.
Publ. 113, California Dept. of Conservation, Div. of Mines and Geology, 1992).21. Page, B. M. & Brocher, T. M. Geology 21, 635–638 (1993).22. Jones, D. L. et al. Tectonics 13, 561–574 (1994).23. Zoback, M. D. et al. Science 238, 1105–1111 (1987).24. Williams, S. D. P. thesis, Univ. Durham (1995).25. Amelung, F. thesis, Univ. Louis Pasteur, Strasbourg (1996).26. Gephart, J. W. & D. W. Forsyth J. Geophys. Res. 89, 9305–9320 (1984).27. Michael, A. J. J. Geophys. Res. 89, 11517–11526 (1984).28. Rivera, L. & Cisternas, A. Bull. Seismol. Soc. Am. 80, 600–614 (1990).29. Michael, A. J., Ellsworth, W. L. & Oppenheimer, D. H. Geophy. Res. Lett. 17, 1441–1444 (1990).30. Beroza, G. C. & Zoback, M. D. Science 259, 210–213 (1993).31. Zoback, M. D. & Beroza, G. C. Geology 21, 181–185 (1993).32. Reasenberg, P. A. & Oppenheimer, D. H. US Geol. Surv. Open-File Rep. 85-739 (1985).33. Bakun, W. H. Bull. Seismol. Soc. Am. 74, 439–458 (1984).
Acknowledgements. We thank D. Oppenheimer for help with the data. This work was supported by theCNRS. F.A. was supported by the EU EPOCH programme.
Correspondence should be addressed to F.A.
Asnakewith legs from themarineCretaceousof theMiddleEastMichael W. Caldwell* & Michael S. Y. Lee†
* Department of Geology, The Field Museum, Roosevelt Road at Lakeshore Drive,Chicago, Illinois 60605, USA and Department of Biological Science, BiologicalSciences Center, University of Alberta, Edmonton, Alberta T6G 2E9, Canada† Zoology Building, School of Biological Sciences, The University of Sydney,NSW 2006, Australia. . . . . . . . . . . . . . . . . . . . . . . . . . . . . . . . . . . . . . . . . . . . . . . . . . . . . . . . . . . . . . . . . . . . . . . . . . . . . . . . . . . . . . . . . . . . . . . . . . . . . . . . . . . . . . . . . . . . . . . . .
Although snakes are descended from limbed squamates (‘lizards’),all known snakes lack well developed legs and their nearest lizardrelatives have yet to be identified1–4. Here we provide compellingevidence that the Cretaceous squamate Pachyrhachis problemati-cus, previously interpreted as a varanoid lizard5–7, is actually aprimitive snake with a well developed pelvis and hindlimbs.Pachyrhachis is the sister-taxon of all other snakes. The skullexhibits most derived features of modern snakes, and the body isslender and elongated. But unlike other snakes, Pachyrhachisretains a well developed sacrum, pelvis and hindlimb (femur,tibia, fibula, tarsals). Pachyrhachis was marine, and providesadditional support for mosasauroid–snake affinities.
Both specimens of Pachyrhachis problematicus were found inlimestone quarries at Ein Jabrud (Bed-Meir Formation, lowermostCenomanian, mid-Cretaceous8), 20 km north of Jerusalem, Israel.The first was named Pachyrhachis problematicus (HUJ-PAL 3569)5,6
and the second Ophiomorphus colberti (HUJ-PAL 3775)7.Ophiomorphus was pre-occupied, and thus changed to Estesius9.Some snake-like features were noted in both but it was concludedthat they were long-bodied varanoid lizards and probably notclosely related to snakes6,7. Our re-study found no significantdifferences between the two specimens (Figs 1 and 2). The posteriorregion of Pachyrhachis is not preserved, resulting in the reportedabsence of the hindlimb7 (Fig. 3). Pachyrhachis is slightly larger and