Embed Size (px)
DESCRIPTION
机器学习. 陈昱 北京大学计算机科学技术研究所 信息安全工程研究中心. 课程基本信息. 主讲教师:陈昱 [email protected] Tel : 82529680 助教:程再兴, Tel : 62763742 [email protected] 课程网页: http://www.icst.pku.edu.cn/course/jiqixuexi/jqxx2011.mht. Ch5 Evaluating Hypotheses. - PowerPoint PPT Presentation
Citation preview

机器学习
陈昱北京大学计算机科学技术研究所信息安全工程研究中心
课程基本信息主讲教师:陈昱[email protected] : 82529680助教:程再兴, Tel : [email protected]课程网页:
http://www.icst.pku.edu.cn/course/jiqixuexi/jqxx2011.mht
2
Ch5 Evaluating Hypotheses
1. Given observed accuracy of hypothesis over limited sample of data, how well does this estimate its accuracy over additional sample? (hypothesis accuracy)
2. Given that hypothesis h outperforms h’ over some sample of data, how probable is that h outperforms h’ in general? (difference between hypotheses)
3. When data is limited, what is best way to use the data to both learn a hypothesis and estimate its accuracy? (comparing learning algorithms)
3

Agenda
Estimating hypothesis accuracy Basics of sampling theory Deriving confidence interval
(general approach) Difference between hypotheses Comparing learning algorithm
4

Learning Problem Setting Space of possible instances X (e.g. set of all
people) over which target functions may be defined.
Assume that different instances in X may be encountered with different frequencies.
Modeling above assumption as: unknown probability distribution D that defines the probability of encountering each instance in X
Training examples are provided by drawing instances independently from X, according to D.
5
Bias & Variance In case of limited data, when we try to
estimate the accuracy of a learned hypothesis, two difficulties arise: Bias : The training examples typically provide an
optimistically biased estimate of accuracy of learned hypo over future examples (overfitting problem)
Variance: Even if the hypo accuracy is measured over an unbiased set of testing examples, the makeup of testing set could still effect the measurement of the accuracy of learned hypo
6

Agenda
Estimating hypothesis accuracy Basics of sampling theory Deriving confidence interval
(general approach) Difference between hypotheses Comparing learning algorithm
7
Qs in Focus
1. Given a hypo h and a data sample containing n examples drawing at random according to distribution D, what is best estimate of accuracy of h over future instances drawn from D?
2. What is probable error in above estimate?
8
Sample Error & True Error
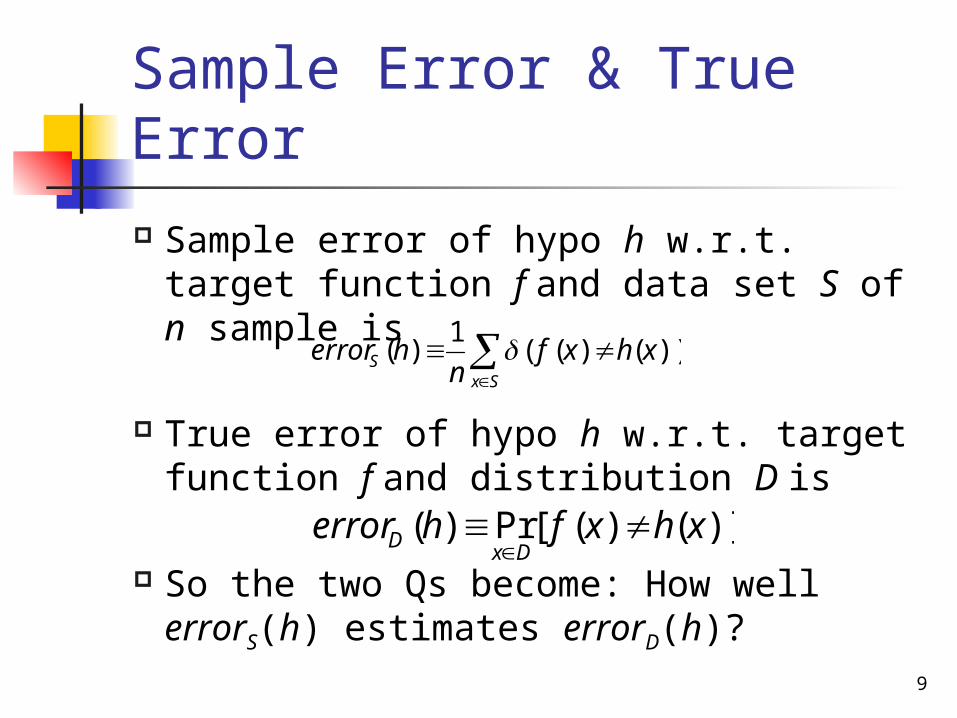
Sample error of hypo h w.r.t. target function f and data set S of n sample is
True error of hypo h w.r.t. target function f and distribution D is
So the two Qs become: How well errorS(h) estimates errorD(h)?
9
Sx
S xhxfn
herror ))()((1
)(
)]()([Pr)( xhxfherrorDx
D
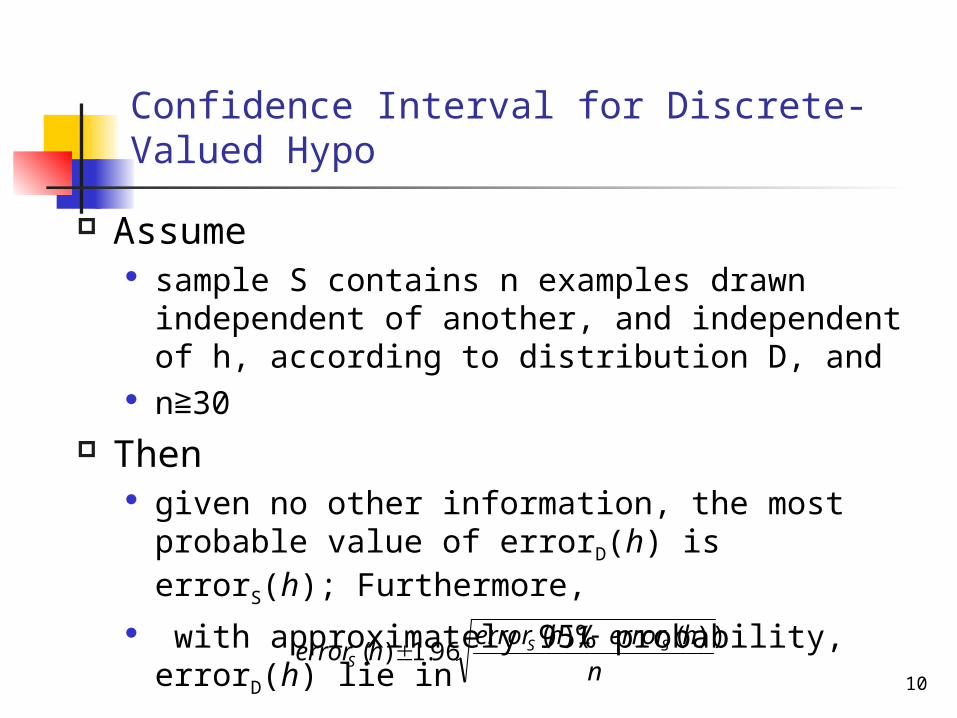
Confidence Interval for Discrete-Valued Hypo
Assume sample S contains n examples drawn
independent of another, and independent of h, according to distribution D, and
n≧30 Then
given no other information, the most probable value of errorD(h) is errorS(h); Furthermore,
with approximately 95% probability, errorD(h) lie in
10n
herrorherrorherror SS
S
))(1)((96.1)(
Agenda
Estimating hypothesis accuracy Basics of sampling theory Deriving confidence interval
(general approach) Difference between hypotheses Comparing learning algorithm
11

Binomial Probability Distribution
Probability P(r) of r heads in n coin flips, given Pr(head in one flip)=p:
Expected value of binomial distribution X=b(n,p) is: E[X]=np
Variance of X is Var(X)=np(1-p) Standard deviation of X is σΧ=sqrt(np(1-
p))
12
),;()1()!(!
!)( pnrbpp
rnr
nrP rnr
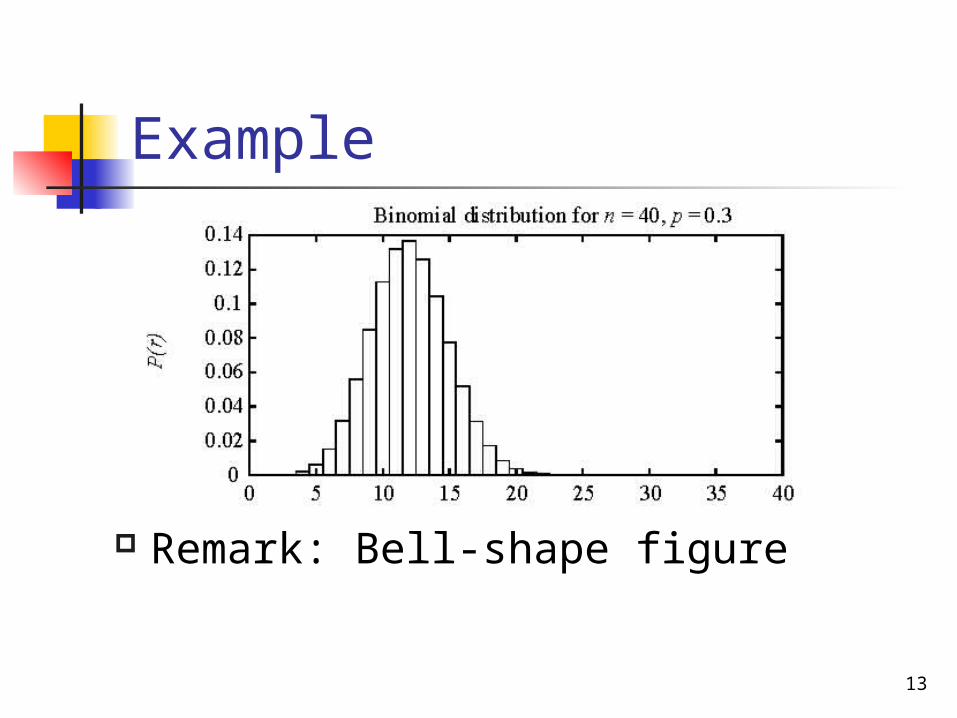
Example
Remark: Bell-shape figure
13
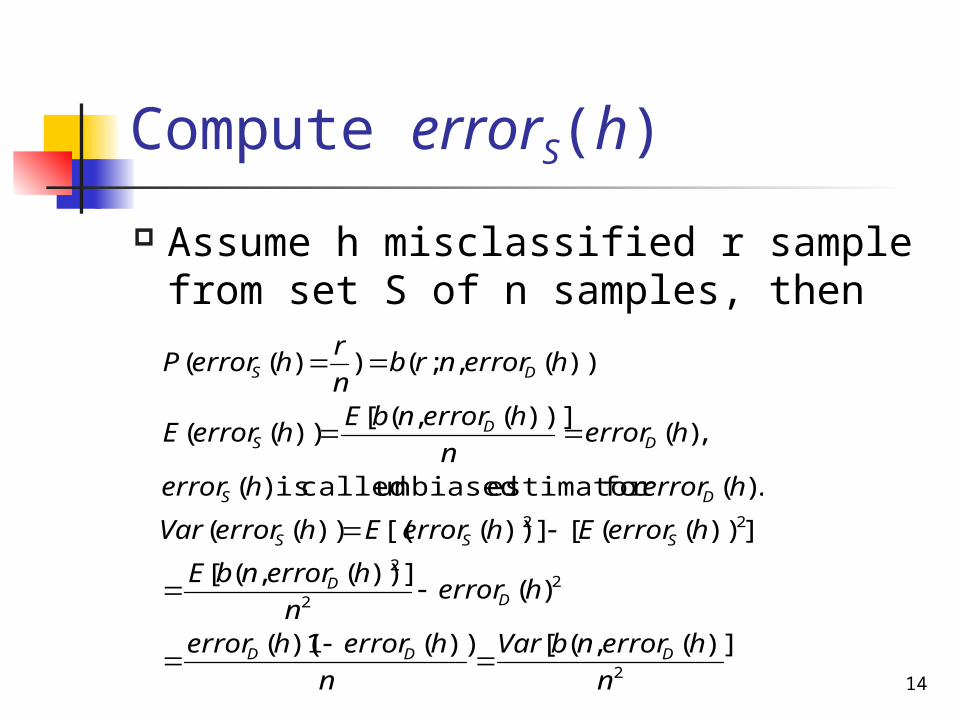
Compute errorS(h)
Assume h misclassified r sample from set S of n samples, then
142
22
2
22
)](,([))(1)((
)(]))(,([
))](([]))([())((
.)(for estimator unbiased called is )(
,)())](,([
))((
))(,;())((
n
herrornbVar
n
herrorherror
herrorn
herrornbE
herrorEherrorEherrorVar
herrorherror
herrorn
herrornbEherrorE
herrornrbn
rherrorP
DDD
DD
SSS
DS
DD
S
DS
Normal Distribution
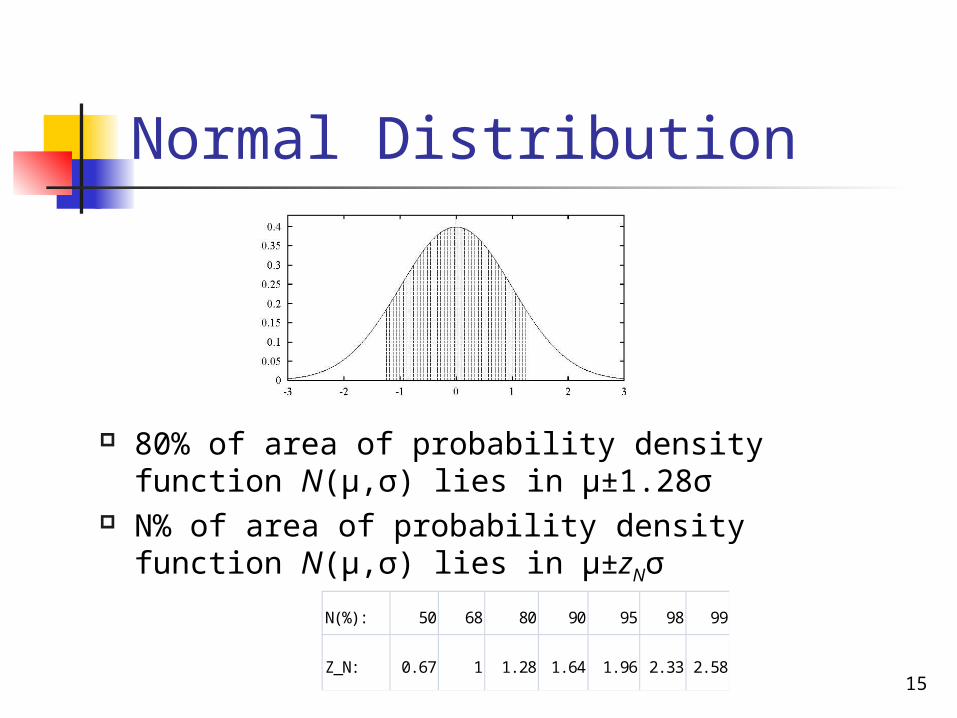
80% of area of probability density function N(μ,σ) lies in μ±1.28σ
N% of area of probability density function N(μ,σ) lies in μ±zNσ
15
N(%) : 50 68 80 90 95 98 99
Z_N: 0. 67 1 1. 28 1. 64 1. 96 2. 33 2. 58
Approximation of errorS(h)
When n is large enough, errorS(h) can be approximated by Normal distribution with same expected value & variance, i.e. N(errorD(h), errorD(h)(1-errorD(h))/n) (Corollary of Central Limit Theorem) The rule of thumb is that,
n≥30, or n ×errorD(h)(1-errorD(h))≥5
16
Confidence Interval of Estimation of errorD(h)
It follows that with around N% probability, errorS(h) lies in interval
errorD(h)±zN sqrt[errorD(h)(1-errorD(h))/n] Equivalently, errorD(h) lies in interval
errorS(h)±zN sqrt[errorD(h)(1-errorD(h))/n], which can be approximated by (贝努里大数定律 )
errorS(h)±zN sqrt[errorS(h)(1-errorS(h))/n] Therefore we have derived confidence
interval for discrete-valued hypo17
Two-Sided & One-Sided Bounds
Sometimes it is desirable to transfer two-sided bound into one-sided bound, for example, when we are interested in Q “What is probability that errorD(h) is at most U (certain upper bound)?
Transfer two-sided bound into one-sided bound using symmetry of normal distribution (fig 5.1 in textbook)
18
Qs in Focus
1. Given a hypo h and a data sample containing n examples drawing at random according to distribution D, what is best estimate of accuracy of h over future instances drawn from D?
A: Prefer unbiased estimator with minimum variance
2. What is probable error in above estimate?A: Derive confidence interval
19
Agenda
Estimating hypothesis accuracy Basics of sampling theory Deriving confidence interval
(general approach) Difference between hypotheses Comparing learning algorithm
20

General Approach
1. Pick up parameter p to be estimated e.g. errorD(h)
2. Choose an estimator, desirable unbiased plus minimum variance
e.g. errorS(h) with large n
3. Determine probability distribution that governs estimator
4. Find interval (L,U) such that N% of probability mass falls in the interval
21
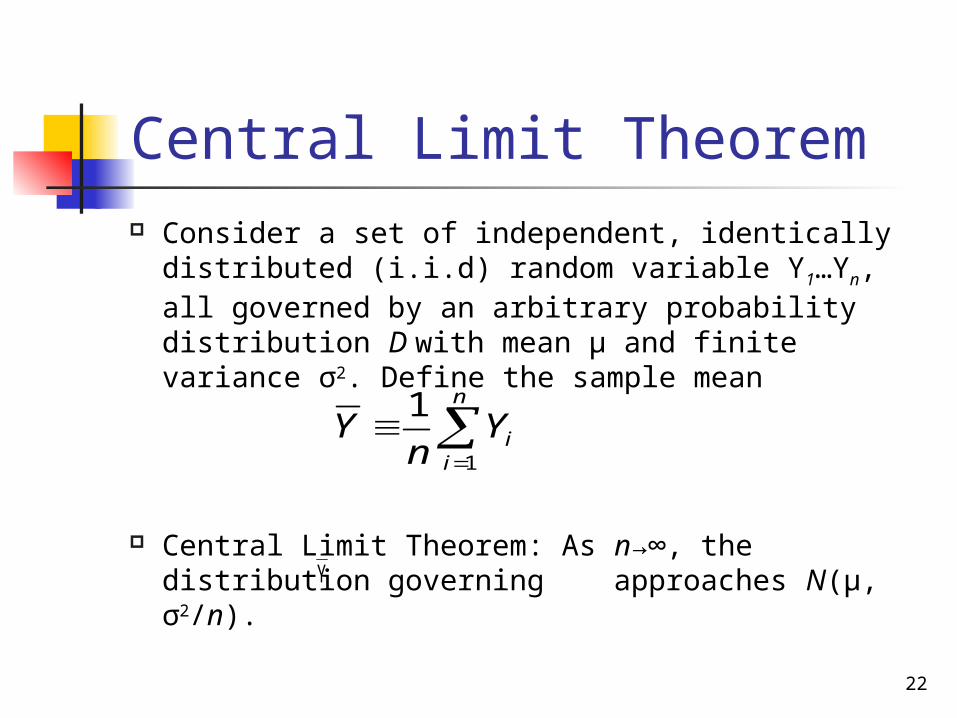
Central Limit Theorem Consider a set of independent, identically
distributed (i.i.d) random variable Y1…Yn, all governed by an arbitrary probability distribution D with mean μ and finite variance σ2. Define the sample mean
Central Limit Theorem: As n→∞, the distribution governing approaches N(μ, σ2/n).
22
n
iiYn
Y1
1
Y
Approximate errorS(h) by Normal Distribution
In Central Limit Theorem take distribution D to be Bernoulli experiment with p to be errorD(h), and we are done!
23
Agenda
Estimating hypothesis accuracy Basics of sampling theory Deriving confidence interval
(general approach) Difference between hypotheses Comparing learning algorithm
24
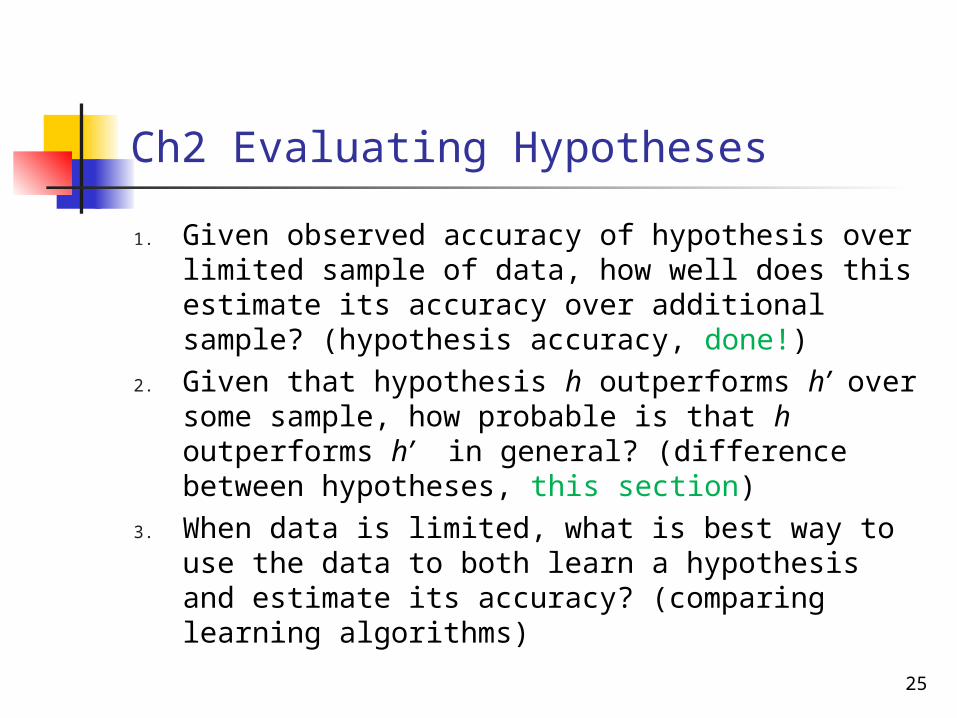
Ch2 Evaluating Hypotheses
1. Given observed accuracy of hypothesis over limited sample of data, how well does this estimate its accuracy over additional sample? (hypothesis accuracy, done!)
2. Given that hypothesis h outperforms h’ over some sample, how probable is that h outperforms h’ in general? (difference between hypotheses, this section)
3. When data is limited, what is best way to use the data to both learn a hypothesis and estimate its accuracy? (comparing learning algorithms)
25
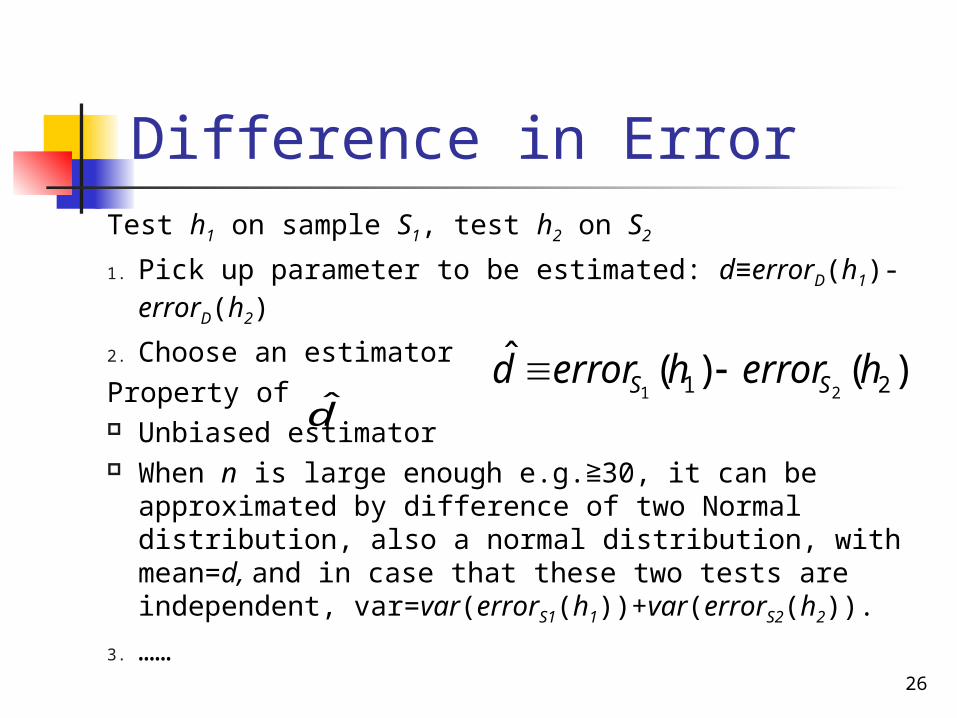
Difference in Error Test h1 on sample S1, test h2 on S2
1. Pick up parameter to be estimated: d≡errorD(h1)-errorD(h2)
2. Choose an estimatorProperty of Unbiased estimator When n is large enough e.g.≧30, it can be
approximated by difference of two Normal distribution, also a normal distribution, with mean=d, and in case that these two tests are independent, var=var(errorS1(h1))+var(errorS2(h2)).
3. …… 26
)()(ˆ21 21herrorherrord SS
d̂
Difference in Error (2)
Remark: when S1=S2, the estimator usually becomes smaller (elimination of difference in composition of two sample sets)
27
Hypothesis Tesing
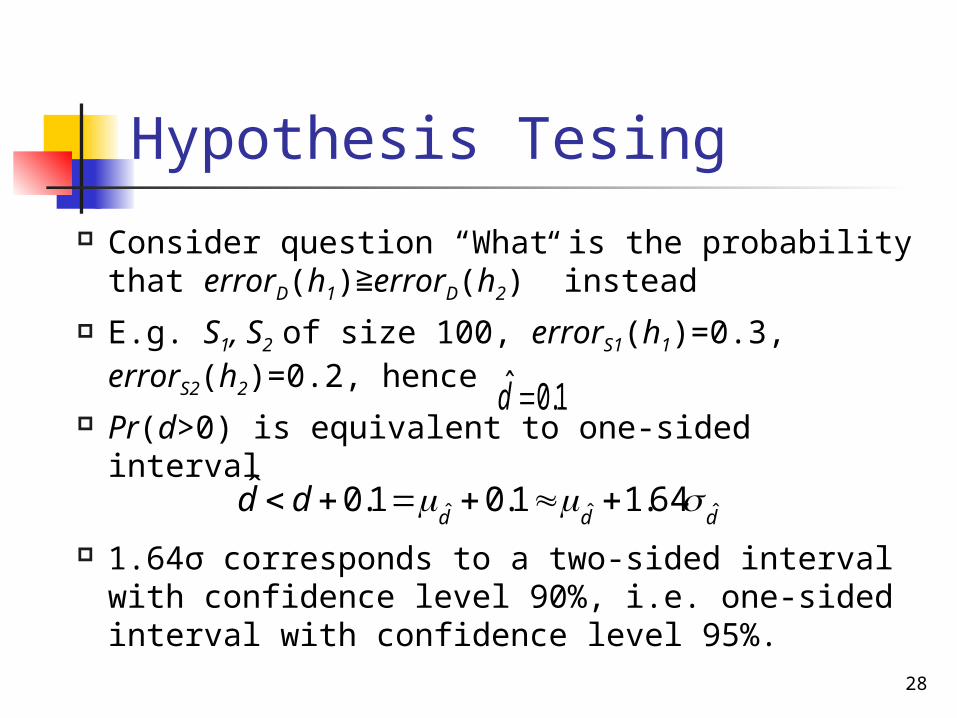
Consider question “What is the probability that errorD(h1)≧errorD(h2)” instead
E.g. S1, S2 of size 100, errorS1(h1)=0.3, errorS2(h2)=0.2, hence
Pr(d>0) is equivalent to one-sided interval
1.64σ corresponds to a two-sided interval with confidence level 90%, i.e. one-sided interval with confidence level 95%.
28
1.0ˆ d
ddddd ˆˆˆ 64.11.01.0ˆ
Agenda
Estimating hypothesis accuracy Basics of sampling theory Deriving confidence interval
(general approach) Difference between hypotheses Comparing learning algorithm
29

Ch2 Evaluating Hypotheses
1. Given observed accuracy of hypothesis over limited sample of data, how well does this estimate its accuracy over additional sample? (hypothesis accuracy)
2. Given that hypothesis h outperforms h’ over some sample, how probable is that h outperforms h’ in general? (difference between hypotheses)
When data is limited, what is best way to use the data to both learn a hypothesis and estimate its accuracy? (comparing learning algorithms)
30
Qs in Focus
Let LA and LB be two learning algorithms
What is an appropriate test for comparing LA and LB?
How can we determine whether an observed difference is statistically significant?
31

Statement of Problem
We want to estimate where L(S) is the hypothesis output by learner L
using training set S. Remark: The difference of errors is averaged over
all training set of size n randomly drawn from DIn practice, given limited data D0, what is a good
estimator? Partition D0 into training set S0 and testing set T0,
and measure Ever better, repeat above many times and average
the results32
))](())(([ SLerrorSLerrorEd BDADDS
))(())(( 00 00SLerrorSLerror BTAT
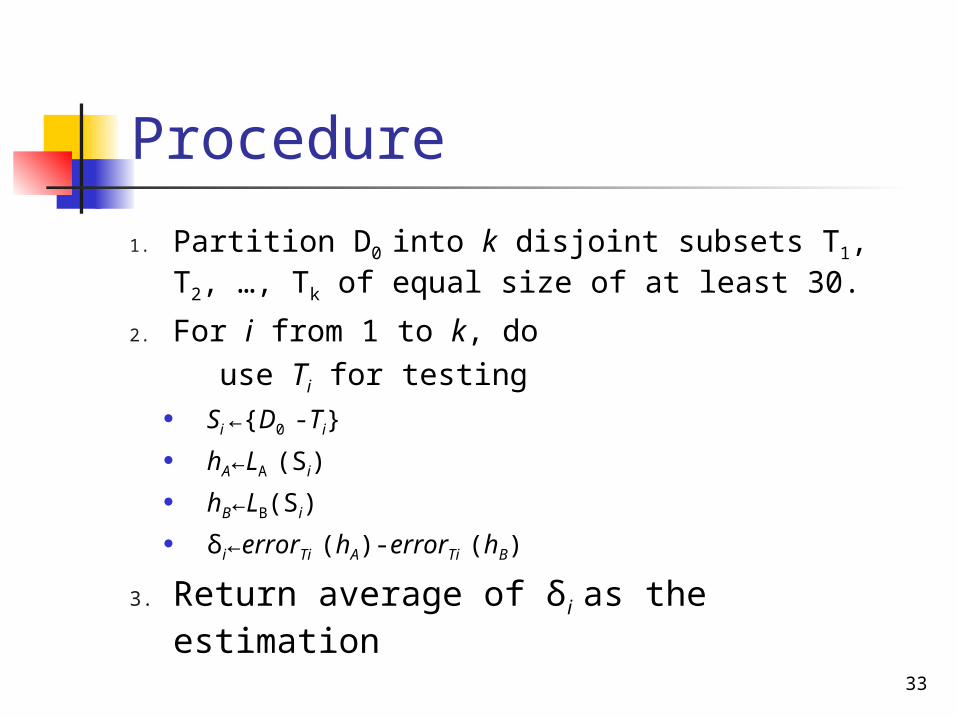
Procedure
1. Partition D0 into k disjoint subsets T1, T2, …, Tk of equal size of at least 30.
2. For i from 1 to k, do use Ti for testing
Si ←{D0 -Ti} hA←LA (Si) hB←LB(Si) δi←errorTi (hA)-errorTi (hB)
3. Return average of δi as the estimation33
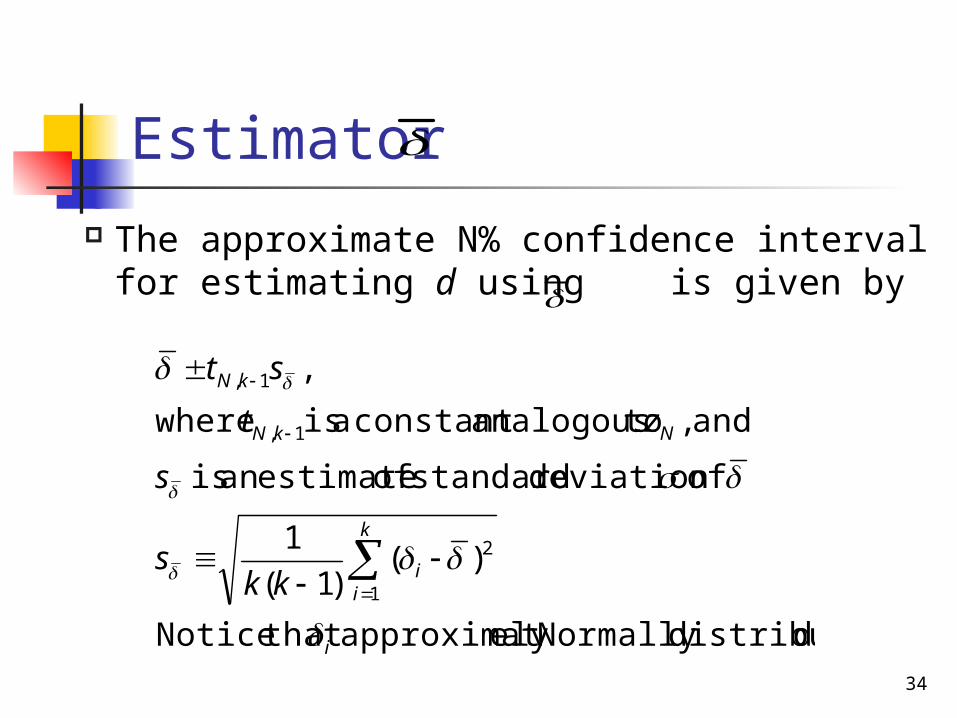
Estimator The approximate N% confidence interval
for estimating d using is given by
34
ddistributeNormally ely approximat that Notice
)()1(
1
of deviation standard of estimatean is
and , toanalogousconstant a is where
,
2
1
1,
1,
i
k
ii
NkN
kN
kks
s
zt
st
Paired t Tests
To understand justification for confidence level given in previous page, consider the following estimation problem: We are given observed values of a set of
i.i.d random variables Y1, Y2, …, Yk . Wish to estimate expected value of these Yi
Use sample mean as the estimator
35
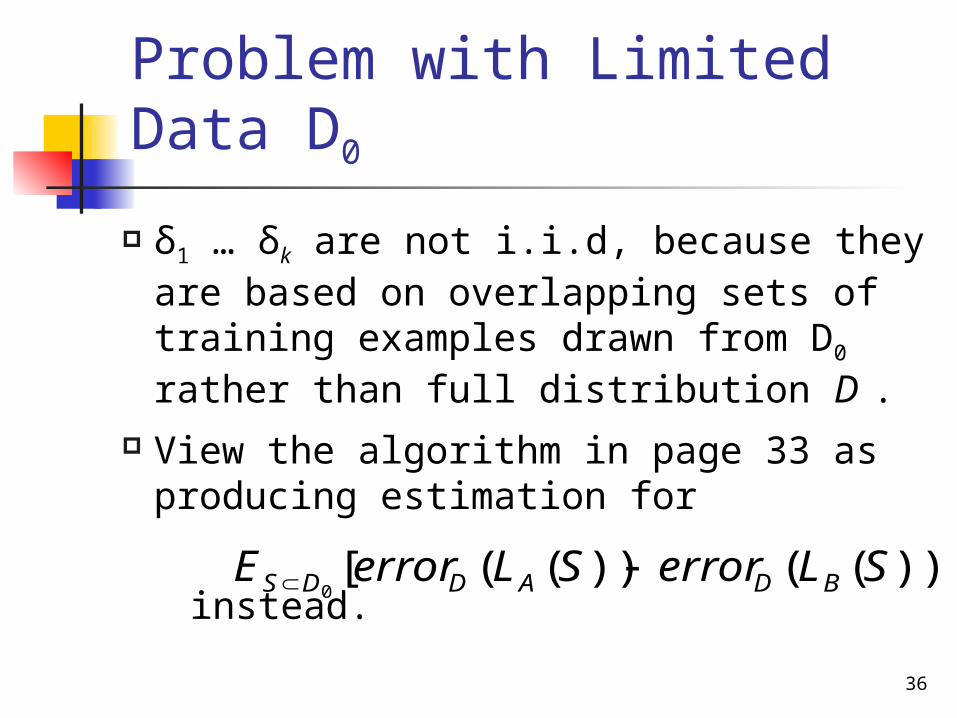
Problem with Limited Data D0
δ1 … δk are not i.i.d, because they are based on overlapping sets of training examples drawn from D0
rather than full distribution D .
View the algorithm in page 33 as producing estimation for
instead.36
))](())(([0
SLerrorSLerrorE BDADDS

HW
5.4 (10pt, Due Monday, 10-24) 5.6 (10pt, Due Monday, 10-24)
37