Embed Size (px)
Citation preview

1
15 January 2013 55 Rd ET Project Plan v2.1
55 Road 2013/14 Ecological Thinning Project Plan
and As-Built Report
Rolf Gersonde ([email protected]) and Bill Richards
SPU Watershed Services Division
January 2013

2
15 January 2013 55 Rd ET Project Plan v2.1
Plan Purpose
The purpose of this project plan is to describe and justify the ecological restoration of forests
with low resistance and resilience to combined disturbance through wind, insects, pathogens, and
ungulate browse and future extended summer drought brought on by climate change. Forest
management in this area is guided by the Cedar River Habitat Conservation Plan (CRW-HCP) to
restore and protect habitat for species of concern including the northern spotted owl. The current
disturbance regime has a high likelihood to lead to large scale disturbance in the homogeneous
second-growth forests in this area. The proximity to rural development increases the risk of
wildfire which would likely to propagate into the watershed under the current forest conditions.
The plan defines project objectives, describes current and desired future conditions (DFCs) of the
proposed project site, lays out a treatment plan to achieve those DFCs, and prescribes monitoring
needs to measure project success. Our management goal in the
project area is to provide stable and improved ecosystem
functions such as water and nutrient cycle regulation, forest
productivity, and wildlife habitat. The stability of the forest
ecosystem providing these functions depends on its ability to
resist biotic and abiotic disturbances and its resilience to recover
ecological functions after large scale disturbance.
Project Objectives
The upland forest restoration program under the CRW-HCP aims to restore late-seral forests in
the watershed to provide habitat for species that depend on attributes of western Cascades old-
growth (primary) forests such as large trees, vertically structured canopies, and decadence. The
lack of existing primary forest in this part of the watershed makes development of nesting habitat
for the northern spotted owl and potentially marbled murrelet a long-term goal, while foraging
and dispersal habitat for the owl may develop sooner. The slow development of structural
attributes in forests of low site productivity appears to be a risk in the lower watershed, but
improvement in forest resistance to disturbance agents and functional resilience will improve the
likelihood of achieving HCP goals. This project focuses on improving the stability of the forest
stand, attempting to mitigate the real threats to the long-term development of late-seral forest
habitat on this site. By improving the stability of the stand through improved tree vigor and
biodiversity, we contend that we are increasing the probability that the stand will provide
foraging and dispersal habitat for at-risk species into the future.
Historic forest conditions in this area could be described as structurally complex due to low site
productivity and persistent disturbance. The two images of primary forest, south of the
transmission line (50 Road), show forests that are similar in height to the today’s conditions,
broken crowns, a high number of snags, long crowns, multiple canopy layers, and a variety of
tree species (Figure 1) .
Stability =
Resistance + Resilience

3
15 January 2013 55 Rd ET Project Plan v2.1
Figure 1: Historical photos of the project area taken in 1909, from Seattle Municipal Archive.

4
15 January 2013 55 Rd ET Project Plan v2.1
Forests of the lower elevation Cedar River Municipal Watershed (CRMW), particularly south of
the Cedar River, grow on droughty outwash gravel soils that increase susceptibility to large-scale
disturbance. In most places, the forest is dominated by a relatively slow-growing Douglas fir
tree canopy and a dense salal understory. The landscape, topographic, and edaphic
characteristics of this forest make it particularly prone to wind damage, both branch breakage
limiting crown development and windthrow. The uniformity of the forest in this area increases
the likelihood that other disturbances such as root rot, bark beetle infestations, and fire will
propagate in this landscape, leading to large scale disturbance of the forest. Further, as climate
conditions are expected to change towards milder winters and drier, warmer summers, the
susceptibility of the forest to large scale disturbance is expected to increase over time. This
project will address these stability concerns in selected areas with the goal of improving the
forest’s resistance to disturbance and resilience to recover ecosystem functions following a large
disturbance.
The objectives of this project are:
Increase species diversity: A wider diversity of both overstory and understory plant
species will provide resistance to disease and insect disturbance, which often are species-
specific in their impacts. Species diversity may also provide resistance to exotic species
invasion, by occupying a wider array of habitat niches. Higher plant species diversity is
also linked with greater structural complexity. Species diversity will provide resilience
following disturbance by creating more pathways to recovery.
Improve structural diversity: A forest with structural diversity, such as the vertical
layering of the forest canopy or variable densities of trees, will provide stability (i.e.,
resistance and resilience) in providing ecological functions, such as habitat, productivity,
soil development, and water cycle regulation. Increased structural complexity and species
diversity will improve the maintenance of these functions through regeneration and
replacement of overstory trees in the face of disturbance. They also provide stability to
wildlife by supporting a variety of habitat niches. A structurally diverse forest is also
likely to have relatively high species diversity, and vice-versa. Spatial heterogeneity of
canopy structure and forest composition is more likely to limit the propagation of
disturbance (insects, pathogens, fire, and wind) than a homogeneous forest canopy of
limited structural and species composition.
Increase individual tree resistance to disturbance: Key habitat elements such as large
trees are susceptible to insects and pathogens under the current conditions of resource
competition. Reduced stem density (number of trees per acre) will improve vigor of
residual trees and increase their resistance to disturbance agents.
Improve landscape habitat connectivity: A more resistant and resilient forest will be
more stable in providing wildlife habitat over time and space. Though the environmental
conditions of the site may limit its ability to develop attributes of low-elevation old-
growth forests, it will continue to provide habitat (nesting) to a host of wildlife species

5
15 January 2013 55 Rd ET Project Plan v2.1
and provide habitat connectivity (foraging and dispersal) through the lower CRMW, to
riparian forests along the Cedar River, and regional lower-elevation forests. The site also
provides a buffer and habitat connection between the private lands to the south of the
CRMW, where some disturbances are more likely to originate, and both the Cedar River
and interior core forests of the CRMW.
Location
The Planning Areas for the above restoration objectives are the forests growing on low
productivity outwash gravel terraces along the Cedar River in the lower CRMW. This area
includes about 3,400 acres of upland forest of which approximately 1,200 acres are
homogeneous Douglas-fir forest that are between 60 and 80 years old (Figure 2). The area will
be split up into Project areas for project management purposes over 5-10 years. Some areas have
become inaccessible to forest operations due to road decommissioning and abandoning of
additional roads may restrict access in the future.
Figure 2: Forest Resistance and Resilience Planning Area in the lower CRMW.

6
15 January 2013 55 Rd ET Project Plan v2.1
The project area for 2013/2014 is in Sections 21, 22, and 23, Township 22 North, Range 7 East
(Figures 2 and 3). The project encompasses approximately 200 acres that are bounded by the 9
road to the north, the 50.4 and 55 roads along the watershed boundary to the south, a
decommissioned section of the 50.4 road and the power line ROW to the east, and the
decommissioned 55.3 road to the west (Figure 3). Access is provided by the 50, 55, 50.4, and
50.3 roads. The site is relatively flat with a topographic break to the west of the bisecting 55
road. The flat area to the west of the road (called “Poverty Flats”) is 750 feet above sea-level
(asl), while the flat area to east of the road is 850 feet asl. The site has continuous forest cover
with a few wind throw gaps. The southern boundary runs along the CRMW boundary which is
bordered by ruderal shrubland of a gravel pit and a revegetated clearcut with sparse tree cover.
To the east, the project area borders the Douglas-fir plantation of the Foothills Property along the
decommissioned 50.4 road. The northern boundary is close to the steep slope where the Cedar
River has carved its bed into the outwash gravel and moraine material. An old abandoned trail or
fence line appears to bisect the project area from east to west.
Figure 3: The 2013/14 Project Area between the Cedar River and CRMW boundary.

7
15 January 2013 55 Rd ET Project Plan v2.1
Analysis
The project area is located at the foothills of the western Cascade Range where glacial outwash
and moraine material were deposited when glaciers retreated during the last ice age. The
topography is flat and terraced. Soils in the project area are of the Barneston soil series and are
composed of glacial outwash and volcanic ash deposits. The sandy loam soils have high coarse
gravel content and are excessively drained with low water holding capacity. This site is
characteristic of the transition from Puget Sound Lowlands to the Western Cascades.
The area has a temperate climate with average monthly temperatures ranging from 31.4 °F in
January to 75.7 °F in July. Of the 57 inches of total annual precipitation, most falls during
November to March, while only three inches fall during July and August. Precipitation is rain
dominated with a total of 9.5 inches falling as snow, but snow accumulation only occurs in
January. This climate creates favorable growing conditions during 6 months of the year, with a
water deficit during the summer.
Climate predictions (derived from models in Climate FVS, USDA-FS, Crookston et al. 20101)
for the next 50 years show an increase of mean annual temperature of 5.4° F, an increase in
annual precipitation of ~7.9 inches (changing from 65.1 to 72.4 inches), but no change in
precipitation during the growing period. Mean minimum temperature is projected to increase by
7.5 °F (4.2 °F) and the frost free period is projected to increase from 182 days (in 1990) to 313
days (in 2060). Forests in the project area are projected to experience milder winters, earlier
spring, and longer water deficits during the summer. The increase in winter precipitation is
unlikely to lower water deficit during the summer due to the low water holding capacity of the
soils in the project area.
The project area lies in the western hemlock forest zone and due to the soils in this area belongs
to the dryer association of the series, the western hemlock/ocean spray – salal association (a list
of plant names is included in Appendix I). Given the dryer site conditions it appears that
Douglas-fir will retain dominance in late seral conditions along with western hemlock. This
forest type is closely associated with the dryer, more open Garry oak woodlands of the Puget
Sound Lowlands, which transition at richer sites into dry Douglas-fir forests. Tree species
associated with Garry oak – Douglas-fir forests are western white pine, Shore pine, Pacific
madrone, bigleaf maple, western redcedar, and bitter cherry. Deciduous shrub species in these
forests include ocean spray, wood rose, poison oak, service berry, beaked hazel, trailing
blackberry, Indian plum, snowberry, snowbrush, mooseberry, salal, Oregon grape, Pacific
rhododendron, and twinberry.
The forest at the 2013/14 project site has an abrupt edge to the south where a neighboring
landowner has cleared the forest. This edge appears to be permanent and is a gateway for several
1 Crookston, Nicholas L.; Rehfeldt, Gerald E.; Dixon, Gary E.; Weiskittel, Aaron R. 2010.
Addressing climate change in the forest vegetation simulator to assess impacts on landscape forest
dynamics. Forest Ecology and Management. 260: 1198-1211.

8
15 January 2013 55 Rd ET Project Plan v2.1
invasive plant species. There are scattered English holly growing in the forest and Scot’s broom
grows in the young forest bordering to the east. However, the abrupt edge also connects the open
shrub habitat to the south with the interior forest habitat in the watershed and provides
transitional habitat for many wildlife species.
Due to the flat and plateau topography, there are no streams with perennial flow in the area. The
area is, however, included in the hydrographic boundary of the Cedar River and two depressions
seem to provide greater soil moisture availability, as indicated by taller tree growth in Figure 3.
Current conditions
The current forest structure consists of even-aged Douglas-fir forests. The stands originated after
the primary forest was logged between 1918 and 1922 and subsequently experienced repeated
fires caused by railroad traffic. Forest stand ages are between 50 and 80 years (based on the 2003
Inventory). Most stands are dominated by Douglas-fir with few western hemlock and redcedar
and some patches of red alder. Younger stands are in the stem exclusion phase of structural
development while older stands have differentiated larger trees. The canopy is mostly single-
layered with scattered mid-story trees and a few patches of multi-layered structure. The
understory is dominated by salal with some areas of higher soil moisture having greater cover of
sword fern.
In most of the younger stands, competitive mortality dominates stand development resulting in
many smaller diameter snags that are either standing or have recently fallen or broken from snow
load or wind. The dominant disturbance agent in this area is wind from southeast direction,
which causes uprooting of individual larger trees, patchy wind throw, and breakage of limbs.
This area of the lower watershed was inventoried by consulting foresters in 2003, and that data
was recently updated to 2013 conditions using the Forest Vegetation Simulator (Table 1). Model
results were field verified in 2013 and the deviations between check cruise and model by stand
are given in Table 2. Differences in trees per acre in Stands 51 and 23 are likely due to the very
small number of trees in the lower diameter classes that were sampled in 2012. The larger
difference in basal area in stands 19 and 23 are likely due to windthrow. The remaining
differences in sampled stand density may indicate variability in stand structure but need to be
taken into account when designing thinning prescriptions because sampling intensity was higher
in 2012. Because the bias in model results was not consistent among units, the projected model
results in Table 1 were used in further analysis and timber volume calculations.

9
15 January 2013 55 Rd ET Project Plan v2.1
Table 1: Stand structure statistics of six identified sub-units in the project area. See figure 2 for
Stand ID. All stand statistics are derived from 2004 timber cruise data and projected forward to
2012 using FVS.
Stand
ID
TPA BA SDI QMD CuFt BdFt CuFt
Growth
Top
Height
Avg Ht
51 297 213 369 11.5 6292 32084 35 113 67
13 261 183 319 11.3 5410 27389 33 112 69
14 149 158 254 13.9 4827 25138 35 111 88
42 239 219 362 12.9 6563 33678 50 109 76
19 230 216 356 13.1 6639 33549 57 113 83
23 427 243 441 10.2 6640 32688 54 110 65
Table 2: Sub units were resampled in 2012 to determine the effect of windthrow and ingrowth
and subsequent deviations from model projections.
Stand
ID
TPA-
FVS
TPA-
2012
Diff BA-
FVS
BA-
2012
Diff
51 297 216 -81 213 200 -12
13 261 335 74 183 263 80
14 149 257 108 158 198 40
42 239 309 70 219 210 -9
19 230 209 -21 216 162 -54
23 427 263 -164 243 218 -25
The following figures provide a graphic description of the forest conditions in the project area.
Stand data were taken from the 2003 forest inventory and projected through 2012 using the
Forest Vegetation Simulator.
Figure 4 shows the frequency distribution of trees per acre by diameter class in the six forest
stands. Forest stands 42 and 23 show a diameter frequency distribution that is right skewed,
which indicates crown class differentiation and bimodality of the first cohort. Hemlock,
redcedar, and alder occur in the smaller diameter classes and have established after the Douglas-
fir. In forest stands 51, 42, and 13, establishment of a new cohort, in particular of western
hemlock, is apparent in the smallest diameter classes. The total number of trees per acre varies
between 149 and 427.

10
15 January 2013 55 Rd ET Project Plan v2.1
Figure 4: Frequency distribution of tree diameter classes by species in each unit of the project
area; RC=western redcedar, RA= red alder, WH= western hemlock, DF= Douglas-fir.
0
10
20
30
40
50
60
2 4 6 8 10 12 14 16 18 20 22 24 26 28 30 32
Tre
es
pe
r A
cre
Diameter Class (inch)
Stand 51
WH
RA
DF
0
10
20
30
40
50
60
2 4 6 8 10 12 14 16 18 20 22 24 26 28 30 32
Tre
es
pe
r A
cre
Diameter Class (inch)
Stand 42
WH
RC
DF

11
15 January 2013 55 Rd ET Project Plan v2.1
0
10
20
30
40
50
60
2 4 6 8 10 12 14 16 18 20 22 24 26 28 30 32
Tre
es
pe
r A
cre
Diameter Class (inch)
Stand 13
WH
RA
DF
0
10
20
30
40
50
60
2 4 6 8 10 12 14 16 18 20 22 24 26 28 30 32
Tre
es
pe
r A
cre
Diameter Class (inch)
Stand 19
WH
RC
DF

12
15 January 2013 55 Rd ET Project Plan v2.1
Figure 5 shows the basal area by diameter class of the six forest stands, which are dominated by
Douglas-fir with most of the basal area in diameter classes between 10 and 22 inches DBH. Total
basal area in 2012 is between 158 and 243 square feet per acre (Table 1). Western hemlock and
red alder are scattered throughout the stands and occupy small proportions of the basal area.
Stand density index ranges from 254 – 441 (Table 1) or 43 - 74% of maximum SDI for Douglas-
fir (SDI 595). The SDI of 254 is relatively low for an unthinned stand at the age of 65 and is
likely due to wind breakage of branches and reduced crown size, resulting in slower growth and
reduced relative stand density. Four of the six stands have SDI >360 at which point competitive
mortality occurs. Model output also estimates that average canopy cover is as low as 60%, which
is 30% lower than comparable stands on better sites and less wind disturbance. The quadratic
mean diameter (diameter of the tree with average basal area) varies between 10.2 in the densest
stand and 13.9 in the stand with the lowest density.
0
10
20
30
40
50
60
2 4 6 8 10 12 14 16 18 20 22 24 26 28 30 32
Tre
es
pe
r A
cre
Diameter Class (inch)
Stand 14
WH
RC
DF
0
20
40
60
80
100
2 4 6 8 10 12 14 16 18 20 22 24 26 28 30 32
Tre
es
pe
r A
cre
Diameter Class (inch)
Stand 23
WH
RC
DF

13
15 January 2013 55 Rd ET Project Plan v2.1
Figure 5: Distribution of basal area among tree diameter classes by species in each unit of the
project area; RC – Redcedar, RA- red alder, WH- western hemlock, DF- Douglas-fir.
0
10
20
30
40
50
2 4 6 8 10 12 14 16 18 20 22 24 26 28 30 32
Bas
al A
rea
pe
r A
cre
Diameter Class (inch)
Stand 51
WH
RA
DF
0
10
20
30
40
50
2 4 6 8 10 12 14 16 18 20 22 24 26 28 30 32
Bas
al A
rea
pe
r A
cre
Diameter Class (inch)
Stand 42
WH
RC
DF

14
15 January 2013 55 Rd ET Project Plan v2.1
0
10
20
30
40
50
2 4 6 8 10 12 14 16 18 20 22 24 26 28 30 32
Bas
al A
rea
pe
r A
cre
Diameter Class (inch)
Stand 13
WH
RA
DF
0
10
20
30
40
50
2 4 6 8 10 12 14 16 18 20 22 24 26 28 30 32
Bas
al A
rea
pe
r A
cre
Diameter Class (inch)
Stand 19
WH
RC
DF

15
15 January 2013 55 Rd ET Project Plan v2.1
The distribution of tree heights by diameter class shows that most of the larger trees are
relatively wind firm (Height/Diameter<80, Figure 6). Trees <14 inch DBH are more susceptible
to wind throw in this area, but they are less exposed to wind through their lower height; these
trees would become more susceptible if released through thinning. Stand 23 shows increasing top
breakage from wind in large exposed crowns.
0
10
20
30
40
50
2 4 6 8 10 12 14 16 18 20 22 24 26 28 30 32
Bas
al A
rea
pe
r A
cre
Diameter Class (inch)
Stand 14
WH
RC
DF
0
10
20
30
40
50
2 4 6 8 10 12 14 16 18 20 22 24 26 28 30 32
Bas
al A
rea
pe
r A
cre
Diameter Class (inch)
Stand 23
WH
RC
DF

16
15 January 2013 55 Rd ET Project Plan v2.1
Figure 6: Average tree height by diameter class in the project area; RC – Redcedar, RA- red
alder, WH- western hemlock, DF- Douglas-fir; trees below the 1:80 line are relatively stable to
windthrow.
0
20
40
60
80
100
120
140
160
0 10 20 30
Ave
rage
He
igh
t (f
t)
Diameter Class (inch)
Stand 51
DF
RA
WH
1:80
0
20
40
60
80
100
120
140
160
0 10 20 30
Ave
rage
He
igh
t (f
t)
Diameter Class (inch)
Stand 42
DF
RC
WH
1:80
0
20
40
60
80
100
120
140
160
0 10 20 30
Ave
rage
He
igh
t (f
t)
Diameter Class (inch)
Stand 13
DF
RA
WH
1:80
0
20
40
60
80
100
120
140
160
0 10 20 30
Ave
rage
He
igh
t (f
t)
Diameter Class (inch)
Stand 19
DF
RC
WH
1:80

17
15 January 2013 55 Rd ET Project Plan v2.1
The tree height distribution is left skewed (Figure 7), which is typical for single cohort stands
with sporadic regeneration, with most of the regeneration being shade tolerant species (hemlock)
and red alder establishing only in canopy gaps. The relatively wide height distribution of western
hemlock indicates that these understory trees did not establish following a single disturbance
event, but are establishing at a low annual rate.
0
20
40
60
80
100
120
140
160
0 10 20 30
Ave
rage
He
igh
t (f
t)
Diameter Class (inch)
Stand 14
DF
RC
WH
1:80
0
20
40
60
80
100
120
140
160
0 10 20 30
Ave
rage
He
igh
t (f
t)
Diameter Class (inch)
Stand 23
DF
RC
WH
1:80

18
15 January 2013 55 Rd ET Project Plan v2.1
Figure 7: Frequency distribution by tree height class for Stand 14.
The stand volume was estimated to be 5,649 cubic feet or 22,337 board feet per acre in 2003.
Projecting the stand volume development forward, stand volume in 2012 is estimated to be 6,008
cubic feet or 23,785 board feet per acre. The inventory check-cruise in 2012 showed deviation
from the model results for individual stands. Average stand density and volume across the
project area was confirmed. Stand volume increment is estimated to be 160 board feet per year
per acre, which is low compared to average Douglas-fir stands in this region.
Desired future conditions
The desired future conditions (DFCs) of the forests in the project area would ensure provision of
current ecosystem services as well as greater resistance and resilience to large-scale disturbance
events. Forest conditions that provide these functions maintain a continuous forest cover, include
multiple canopy layers, comprise diverse species composition of site adapted species, maintain
vigorous tree growth and regeneration, and maintain standing and down dead trees. We have
identified DFCs as follows:
A variety of species is established and can function as seed source to assist with forest
recovery after disturbance. Their distribution can provide seeds to 50% of the area. Tree
numbers are high enough to allow for disturbance mortality while still maintaining
sufficient propagule sources for recovery.
Forest edge habitat has a diverse plant community. Permanent forest edge is not
dominated by conifers but a variety of deciduous species that connect forest and shrub
habitat types.
0
5
10
15
20
25
30
35
10
20
30
40
50
60
70
80
90
10
0
11
0
12
0
13
0
14
0
15
0
Tre
es
pe
r A
cre
Tree Height Class (feet)
RA
WH
DF

19
15 January 2013 55 Rd ET Project Plan v2.1
Small canopy gaps, similar to those created by small-scale windthrow, are frequent
allowing for establishment of additional tree and shrub species across project site, thus
increasing species diversity.
The currently homogeneous single-layered canopy is diversified by introducing processes
of vertical and horizontal diversification in a patchy mosaic. Forest canopy structure is
balanced between (1) existing tall closed canopy, (2) initiated two cohort canopy, (3)
created diverse canopy gap, and (4) thinned high open canopy. Individual structure types
are interspersed.
Large trees with long crowns are released from intra-cohort competition through
thinning.
Areas of homogeneous canopy are intersected by contrasting canopy types and diverse
outside edge structure.
Planted trees and shrubs are growing vigorously through released from competition
(primarily by salal) and are large enough to be unaffected by browse.
Areas of continuous canopy structure are large enough to provide interior forest habitat in
the future despite ongoing disturbance. The forest has age class diversity resulting from
disturbance and regeneration with 2/3 of the area in mature forest structure. Standing and
down dead wood is provided through competition mortality in unthinned skips and
disturbance mortality of individual large trees.
Management constraints
Canopies are dominated by Douglas-fir and understory by salal. Species diversity can only be
improved through planting of alternative species and release of minor species from competition.
The existing salal understory will exert strong belowground competition for water on any planted
seedling and may increase seedling mortality and establishment time. The size of canopy gaps,
which reduce competition of overstory trees on planted seedlings, is limited to the extent of small
size windthrow gaps in this area, consistent with the overall goal of developing late-seral forest
stand structure. Introduction of additional, less shade tolerant species is limited to these gaps.
Portions of the forest experience strong resource competition and competitive exclusion among
trees. Trees in these areas will be susceptible to wind disturbance if thinned. Stands that do not
show advanced crown differentiation (stand 23) have more trees with instable height to diameter
ratios and require more canopy closure to resist windthrow. Prescribed residual tree density will
be higher in these stands.

20
15 January 2013 55 Rd ET Project Plan v2.1
Risks and Mitigation Strategies
This area is winter range for elk and deer. Past experience with planting unprotected tree
seedlings have shown heavy browse and mortality. Success of planting additional species,
especially western redcedar and bigleaf maple, in this area depends on protection from browse.
Higher planting density as well as planting larger seedlings may increase overall success of
establishing these species.
The Douglas-fir dominated forests in the lower watershed have experienced recent elevated
numbers of Douglas-fir beetle and Armillaria root disease, which have led to individual tree
mortality. Droughty site conditions make individual trees susceptible to bark beetle attack and
root disease. While the lowering of resource competition through thinning and release will
increase tree vigor and lower tree susceptibility, mortality from a variety of causes is still likely
to continue. In order to maintain Douglas-fir canopy cover, enough trees should be maintained to
allow for beetle mortality as well as windthrow and wind breakage.
Invasive species may establish in canopy gaps and forest edges where growing space is created
for planting; make planting areas discontinuous to limit spread of invasive species.
Prescription
Prescriptions for activities to achieve management objectives and desired future conditions are
outlined in the following table. Activities are listed in order of effectiveness to achieve our
objectives, and will be most effective if implemented in concert, whether on the same site or in
distinct areas.
The restoration activities in Table 3 are translated into structural and spatial prescriptions in
Table 4. Structural prescriptions apply at the patch scale and are designed to promote stand
development processes and increase diversity. Spatial prescriptions address size and location of
structure types to improve spatial heterogeneity and connectivity, but also address operational
constraints.

21
15 January 2013 55 Rd ET Project Plan v2.1
Table 3: Management activities that address individual objectives in order of their effectiveness.
Management
Objectives Activities to Address Objectives
Increase species
diversity
Plant diverse
species in canopy
gaps
Vary tree density
at stand edges,
diversify ecotones
Underplant less
abundant species
Release less
abundant species
Improve seed
sources
Release dominant
trees from
competition
Release less
abundant species
Limit browse
disturbance on less
abundant species
Plant to augment
seed sources
Improve
structural
diversity
Patches of lower
canopy cover,
retain larger trees
Underplant with
trees and shrubs
Facilitate canopy
stratification
Release dominant
trees from
competition
Diversify age
classes Plant canopy gaps
Underplant with
trees and shrubs
Limit browse
disturbance on less
abundant species
Facilitate or
maintain
decadence
Retain CWD Maintain large tree
component
Retain areas with
high density Create snags
Increase
resistance to
disturbance
Release dominant
trees from
competition
Lower stem
density, retain
largest trees
Create
discontinuous
canopy
Improve
landscape
connectivity
Improve
connectivity on
patch scale
Improve
connectivity on
landscape scale
Contrast adjacent
treatments Diversify ecotones

22
15 January 2013 55 Rd ET Project Plan v2.1
Table 4: Prescriptions for implementation of management activities in Table 3.
Activity Structural Prescription Spatial Prescription
Improve connectivity
Create elongated areas of structure
types, emphasize South-North
connectivity
Create discontinuous
canopy
Create ½ acre of canopy gaps
every 10 acres, of ¼ - ½ acre gap
size
Gaps marked on map and located by
operator, make use of existing gaps
Contrast adjacent
treatments Intersperse skips and gaps
Release dominant trees
from competition
Identify 5-6 large vigorous trees
per acre and cut competitors in 30
feet radius
Leave trees and cut trees marked
within other structure types
Lower canopy cover
Where avg H/D >80, thin from
below to 40% overstory canopy
cover
Where large tree H/D <80 thin to
30% overstory canopy cover
Vary tree density at stand
edges
Create 20-40 ft spacing of
overstory trees, wider spacing at
road edge
Indicate on map along south border
and along 50 road
Release less abundant
species
Release hardwood and minor
species in overstory, cut
competitors in 30 ft radius
Leave trees and cut trees selected by
operator
Retain areas with high
density Leave some untreated areas
Areas outside marked boundary of
other types, and small interspersed
patches
Underplant less abundant
species
Plant 300-350 trees per acre:
THPL, ABGR, PREM, ACMA
Underplant 30% of thinned area in
clustered planting at 10ft spacing in
one acre patches where canopy cover
is lowest
Plant diverse species in
canopy gaps
Plant 300-350 trees per acre
(ACMA, PIMO, PICO, POTR,
PREM) + shrubs (refer to Table 6)
Clustered planting in gaps, trees at
10ft spacing, shrubs at 5ft spacing
Plant diverse species in
stand edge
50 each per acre (ACMA, PREM,
MAFU, QUGA) + shrubs
Dispersed planting along edge, trees
at 10ft spacing, shrubs at 5ft spacing
Limit browse disturbance
on less abundant species
Single tree protection of seedlings
(THPL, ACMA) in canopy gaps,
underplanting patches, and edge
treatments

23
15 January 2013 55 Rd ET Project Plan v2.1
The larger trees (>18 inch DBH) in this forest will not be cut, except in small canopy gaps.
Stands will be thinned from the small end of the diameter distribution (thinning from below).
Implementation of the project with ground-based logging equipment increases the flexibility of
avoiding larger trees in yarding corridors.
The retention targets for the treatment options in this project are within the natural variability of
forests of this type. The objective of the retention levels is to increase the variability of canopy
coverage across the landscape while providing growing space for the various planted species that
augment the area’s biodiversity.
While the management of deer and elk habitat is not part of this project objectives or the HCP,
this project may provide short-term foraging habitat for these species. The long-term goals for
this project focus on forest stability and resilience to support the objective of developing late-
seral forest habitat.
Spatial Scale of Variability
Current variability of structure and composition in the project area is provided by change in
edaphic conditions at 50-200 acre scale, but is masked by structural homogeneity due to forest
management history. Small scale heterogeneity is being created through wind-throw gaps at the
sub-acre scale. Spatial variability at intermediate scales can be increased by creating thinning
units of variable size and irregular shape. Unit size varies between 12 and 28 acres with lower
density areas of 3 acres (Figure 8). Thinning is prescribed in areas of relatively homogeneous
canopies. Areas of irregular canopy and existing gaps are excluded from thinning. Additional
heterogeneity is created through placement of canopy gaps (0.25-0.5 acre) and unthinned areas
(skips, 0.25-0.5 acre) at the sub-acre scale. Skips are located to retain areas of two-layered
canopy, protect large individual trees or snag clusters, or are associated with canopy gaps to
increase structural contrast. A network of unthinned area is maintained to provide connected
areas of higher CWD and canopy cover. Within-unit heterogeneity is achieved by thinning to
basal area targets, rather than a more uniform spacing prescription. Variability at the inter-tree
distance is created by retaining neighbor tree groups (see thinning prescription) and operator
located 10th
acre gaps. Variability in vertical structure is created by under-planting in clusters of
1-2 acres in size in areas of lower canopy cover.

24
15 January 2013 55 Rd ET Project Plan v2.1
Figure 8: Layout of thinning units with varying density, canopy gaps, and unthinned skips in the
55 Road Project.
Thinning and Canopy Gaps
Thinning density is prescribed by management unit (see Table 5). In all units, trees are thinned
starting from the smaller diameter classes (>7.5” DBH, thinning from below) to a maximum
diameter of 18” DBH. Residual stand density ranges from 80 square feet of basal area (BA) to
140 BA. Variability in tree density within the management unit scale is achieved by following
basal area prescriptions throughout the variable size class distribution, resulting in variability in
numbers of trees per acre depending on average tree size. Additional variability is achieved by
retaining small unthinned areas (skips) and creating canopy gaps up to half-acre in size. Due to
variability in stand density and structure within the management units, harvested and retained
stand volume will vary between units. Increase in tree species diversity is achieved by cutting
only Douglas-fir and retaining all minor species, including western hemlock, western redcedar,
big leaf maple, red alder.

25
15 January 2013 55 Rd ET Project Plan v2.1
Feathering of the southern canopy edge through creating lower density areas is prescribed along
core roads. This low density canopy edge will be under-planted with diverse deciduous and
evergreen shrubs and trees to create deep transitional edge habitat. Additional Cut&Leave
treatment to augment CWD outside the thinning areas is not prescribed because of existing CWD
and expected input through various causes of mortality.
Prescriptions:
BA80 – Thin trees to a residual basal area of 80 square feet per acre by thinning from below
(cutting smaller diameter trees first). Do not cut live trees smaller than 7.5 inches DBH or trees
larger than 18 inches DBH. Retain 5 (five) groups of close neighbor-trees per acre (2-3 trees).
BA100 – Thin trees to a residual basal area of 100 square feet per acre by thinning from below.
Do not cut live trees smaller than 7.5 inches DBH or trees larger than 18 inches DBH. Retain 10
(ten) groups of close neighbor-trees per acre (2-3 trees). Create 5 (five) 1/10 acre gaps per acre.
BA120 – Thin trees to a residual basal area of 120 square feet per acre by thinning from below.
Do not cut live trees smaller than 7.5 inches DBH or trees larger than 18 inches DBH. Retain 10
(ten) groups of close neighbor-trees per acre (2-3 trees). Create 5 (five) 1/10 acre gaps per acre.
BA140 – Thin trees to a residual basal area of 140 square feet per acre by thinning from below.
Do not cut live trees smaller than 7.5 inches DBH or trees larger than 18 inches DBH. Retain 15
(fifteen) groups of close neighbor-trees per acre (2-3 trees). Create 5 (five) 1/10 acre gaps per
acre.
Canopy Gap – Locate gaps in areas that have no minor species. Cut all trees within the circular
perimeter of a ½ acre gap with a diameter of 166 feet. Remove or pile slash to provide planting
spots.

26
15 January 2013 55 Rd ET Project Plan v2.1
Table 5: Post-thinning stand structure and harvested component for each stand and prescription.
Unit #
Post-Thin Harvested
Prescription Acres TPA BA TPA %BA CUFT/ac BDFT/ac
19
80BA 3.85 86 87 143 60
354
3
1971
5
120BA 21.55 115 127 114 42
229
5
1294
8
Gap 1.5 0 0 230
10
0
618
7
3354
9
Skip 1 230 216 0 0 0 0
23
80BA 2.9 217 106 208 57
326
6
1886
5
120BA 21 254 146 171 40
215
4
1271
9
140BA 5.5 278 165 147 32
164
5 9856
Gap 1.5 0 0 427
10
0
585
5
3268
9
Skip 0.75 427 243 0 0 0 0
42
120BA 27.75 123 130 115 41
225
0
1280
3
Gap 1.28 0 0 239
10
0
609
7
3367
9
Skip 0.78 239 219 0 0 0 0
13
120BA 15.4 169 127 91 30
120
3 6908
Gap 1 0 0 261
10
0
494
1
2739
0
Skip 0.5 261 183 0 0 0 0
14
80BA 3.2 63 82 86 48
196
2
1103
5
100BA 23 77 102 71 35
134
9 7674
Gap 1.5 0 0 149
10
0
455
2
2513
8
Skip 1.05 149 158 0 0 0 0
51
120BA 11.25 173 128 123 40
191
0
1096
8
Gap 0.5 0 0 297
10
0
578
1
3208
4
Skip 0.75 297 213 0 0 0 0
Total Area 135.4 acres
27
15 January 2013 55 Rd ET Project Plan v2.1
Planting
Areas thinned to 80-120 square feet of basal area will be underplanted in one-acre patches
covering one third of the area. Shade tolerant grand fir and western redcedar will be planted in
clusters with small groups of big leaf maple and bitter cherry interspersed in small canopy gaps.
Areas with lower canopy cover will be prioritized for planting. Larger canopy gaps (0.5 acre,
total area of 7.28 acres) will be planted with groups of white pine, big leaf maple, black
cottonwood, shore pine, and shrub species including beaked hazel, cascara, and red elderberry.
Planting density will allow for mortality from browse, shrub competition, and summer drought.
Grouped planting patterns will reduce inter-species competition and retain less competitive
species in the future stand. A section of the south-facing forest edge along the 55 and 50 roads
will be thinned to lower density and interplanted with diverse species to create a deep transitional
edge habitat between forest and open-shrub habitat. Plant species include trees and shrubs that
are common in lowland Puget Sound plant associations as well as Garry oak/Douglas-fir
associations. Browse protection for individual trees and shrubs will be applied to a portion of the
planted stock in each of the areas.

28
15 January 2013 55 Rd ET Project Plan v2.1
Table 6: Planting specifications for structure types.
Structure Type Acres Species (per acre) Count Pattern
30% Canopy
Cover BA80
5.0 Western redcedar (150) 750 1 acre patches 10x
Grand fir (100) 500 10x10 group of 16
Bitter cherry (50) 250 10x10 group of 9
Big leaf maple (50) 250 10x10 group of 9
40% Canopy
Cover BA100-120
30.0 Western redcedar (100) 3000 1 acre patches 10x
Grand fir (100) 3000 10x10 group of 16
Bitter cherry (50) 1500 10x10 group of 9
Big leaf maple (50) 1500 10x10 group of 9
Canopy Gap
7.0 Big leaf maple (50) 350 10x10 group of 16
Western white pine (100) 700 10x10 group of 16
Black cottonwood (50) 350 10x10 group of 9
Shore pine (50) 350 10x10 group of 9
Beaked hazel (50) 350 5x5 group of 9
Cascara (50) 350 5x5 group of 9
Red elderberry (50) 350 5x5 group of 9
Edge
2.0 Bigleaf maple (50) 100 10x10 group of 3
Black cottonwood (50) 100 10x10 group of 3
Bitter cherry (50) 100 10x10 group of 3
White oak (50) 100 10x10 group of 3
Crabapple (50) 100 10x10 group of 3
Beaked hazel (50) 100 5x5 group of 3
Indian plum (50) 100 5x5 group of 3
Chinquapin (50) 100 5x5 group of 3
Service berry (50) 100 5x5 group of 3
Red elderberry (50) 100 5x5 group of 3
Snow brush (50) 100 5x5 group of 3
TOTAL 44.0

29
15 January 2013 55 Rd ET Project Plan v2.1
Layout
Thinning and Canopy Gaps
Locations for specific activities are guided by local stand conditions and desired pattern of
structural diversity at the patch and landscape scale. Multiple management objectives (tree
stability, vertical diversification) can be achieved in the same location while others (species
diversification, edge habitat) can only be achieved in discrete areas.
Unit boundaries are marked in the field. Interior boundaries such as gaps and changes in thinning
density are only provided on the map and need to be located by the contractor using a GPS.
Some skips that are located to explicitly protect areas of larger trees and multiple canopy layers
will also be marked in the field.
Thinning units are located along roads to allow access by yarding equipment. Unthinned areas
are located where access is restricted and where sensitive features or complex canopy structures
exist. Areas of lower density thinning (80 BA) are located where large diameter, wind-firm trees
exist that already grow at wider spacing.
Planting
Planting in canopy gaps and under-planting in low density thinning areas will use a clumped
planting pattern. Trees will be planted at 10 feet spacing in groups of 16 trees per species in
canopy gaps. Shrub species will be planted at 5 feet spacing in groups of 9 plants. Under-
planting will be patchy (approximately 1 acre patches) with trees planted in groups of 9 or 16
trees per species.
Safety and Access
Site access is through the 50, 55, and 50.4 roads. Access for log haul is through the Selleck Gate,
81 and 80 Roads. Traffic control will easily be addressed via road closed signs on the 55 Road at
either end during the tree felling and yarding operation. The 55 and 50.4 roads will be open to
traffic after work hours and on weekends. SPU staff will also be notified in advance of this work
to minimize disturbance to other required road access needs. Access permits for crews needing
entry to the project site will be facilitated through the Project Manager as needed, in cooperation
with SPU Security. The contractor is responsible for providing and servicing a sanican at the
worksite, and to abide by SPU watershed access regulations.
SPU will develop a safety and communication plan for this project that addresses protocols for
emergency and fire management, spill response, and communication with SPU personnel.
Two small sections of road on the east and west end of the project area will be rocked prior to the
thinning operations. Occasional grading on the 80 road will remove washboard surface due to

30
15 January 2013 55 Rd ET Project Plan v2.1
haul traffic. Speed limit signs of 25mph will be posted on the 50 Road during thinning and haul
operations.
Monitoring and Adaptive Management
The objectives for monitoring are:
assure that the prescriptions are followed during the implementation,
the desired stand density, variability, species composition are achieved,
track growth and mortality of planted seedlings,
establish baseline to track tree growth and mortality of overstory trees.
Compliance monitoring will be conducted by SPU staff throughout the thinning and planting
activities to assure that the project is implemented according to the project plan and
implementation contracts. Compliance monitoring will also provide information on post-
treatment stand structure and composition that will be used to update the forest inventory
database. The evaluation of project implementation will be based on compliance monitoring data
and will be used in future project design. A subsample of planted trees and shrubs in gaps and
under the canopy will be marked in the field and surveyed for survival and growth over the first
three years. This information will be used for future plant selection, gap opening size, and plant
protection.
Monitoring plots for tracking tree growth and mortality will be established by student volunteers
or interns. These plots will provide baseline data for possible long-term tracking of forest
development in different stand structure types. Students will have the opportunity to use
sampling methods and monitoring data in academic projects.

31
15 January 2013 55 Rd ET Project Plan v2.1
Appendix I. Plant species names and abbreviations:
Common Name Scientific Name Abbreviation
Beaked hazel Corylus cornuta COCO
Bigleaf maple Acer macrophyllum ACMA
Bitter cherry Prunus emarginata PREM
Black cottonwood Pupulus trichocarpa POTR
Crabapple Malus fuscum MAFU
Cascara Rhamnus pursiana RHPU
Chinquapin Castanopsis crysophyllum CACR
Douglas-fir Pseudotsuga menziesii PSME
Elderberry Sambucus racemosa SARA
English holly Ilex aquifolium ILAQ
Garry oak Quercus garryana QUGA
Grand fir Abies grandis ABGR
Indian plum Oemleria cerasiformis OECE
Madrone Aburtus menziesii ABME
Mooseberry Viburnum edule VIED
Ocean spray Holodiscus discolor HODI
Oregon grape Mahonia nervosa MANE
Pacific rhododendron Rhododendron macrophyllum RHMA
Poison oak Toxicodendron diversiloba TODI
Salal Gaultheria shallon GASH
Scot’s broom Cytisus scoparius CYSC
Service berry Amelanchier alnifolia AMAL
Shore pine Pinus contorta var. contorta PICO
Snow berry Symphoricarpos albus SYAL
Snowbrush Ceanothus velutinus CEVE
Trailing blackberry Rubus ursinus RUUR
Twin berry Lonicera hispidula LOHI
Western hemlock Tsuga heterophylla TSHE
Western redcedar Thuja plicata THPL
Western white pine Pinus monticola PIMO
Wood rose Rosa gymnocarpa ROGY

32
15 January 2013 55 Rd ET Project Plan v2.1
As-Built Documentation of the 55 Road Ecological Thinning Project
Project Layout and Permits
This ecological thinning project was approved by Ordinance for Ecological Thinning Council
Bill Number 117567. The ordinance allows SPU to conduct ecological thinning in select
locations on approximately 2800 acres of second-growth forest over a period of 5 years.
We submitted a SEPA exemption letter for the project that was approved and signed on
9/20/2012.
A forest practices application was submitted to the WA DNR for a previous version of the
project plan in 2012, which was approved on 5/18/2012. Because of significant changes in the
project re-design in 2013, we requested to withdraw the 2012 FPAN and resubmitted a new FPA
in 2013, which was approved on 3/6/2013.
The project boundaries were laid out during the winter of 2012/13 according to the project map.
Location of skips and gaps was modified to accommodate the logging operation.

33
15 January 2013 55 Rd ET Project Plan v2.1
Project bids, costs, and revenue
A request for proposal was sent to the vendor pool developed in 2013. SPU awarded the 55 Road
Ecological Thinning Project to Pulley Corporation under the blanket contract 3062-1. The
contact was awarded for one year with a bid price of $35.33 per ton of saw timber sold to the
contractor. Pulpwood was sold for $1 per ton to the contractor. A second bid, received from
Westek Forest Ldt., was not awarded.
Thinning operations started after March 15, 2013 with cutting in Unit 0014 and finished on
August 8, 2013. A total of 11,089 tons of timber (1431 MBF) were shipped during that period.
Total stumpage payments were $343,332. The contractor was credited a total of $12,855 for
slash management. The contractor paid a total of $3037 to SPU for road construction and
maintenance (see below). The total revenue from the sale of surplus timber, deposited into the
SPU Water Fund was $333,514.
Total project costs were approximately $69,430, including planning ($12,660), design ($13,900),
contracting ($12,270) and implementation ($30,600)
Roads
Two short (50 feet) rock spurs were constructed under the SCL ROW along the 50 road to
facilitate access to units 0013 and 0019. The rock spurs were constructed by SPU and the
contractor reimbursed SPU for the work. Road maintenance during the operation consisted of
rocking two short section of the 55 Road along the fence line and grading of the access roads
during operations. The contractor reimbursed SPU for the road maintenance costs.
Thinning Units
The project area was divided into distinct thinning units as outlined in the Project Plan. The units
were thinned according to the prescriptions in the plan and post-thinning statistics can be found
in the following table.
Unit ID Plots Trees Trees/Acre Avg_DBH Avg_Hight Rel_Density Basal_Area
0013 12 80 106 15.2 94 34.2 134
0019 22 130 106 14.3 101 31.1 117
0023 17 122 101 16.1 108 35.6 143
0042 21 130 89 16 114 31 124
0051 9 62 128 13.9 118 36.4 136
0231 7 41 146 21.1 91 33.7 117
0014 27 238 88 15.8 NA 30.2 120

34
15 January 2013 55 Rd ET Project Plan v2.1
Soil and Tree Damage
We conducted compliance monitoring on stand density, tree and soil damage. Tree and soil
damage were assessed on randomly located transects of 100 feet length. Soil damage was
assessed along the transect in 1 foot increments and recorded as four levels of disturbance with
increasing severity (see Protocol for Soil Disturbance Transects, below). The following graph
shows Soil and Tree damage for unit 19 (23 sample plots). Soil and tree damage was estimated to
be similar between all units and no further sampling was conducted in the remaining units.
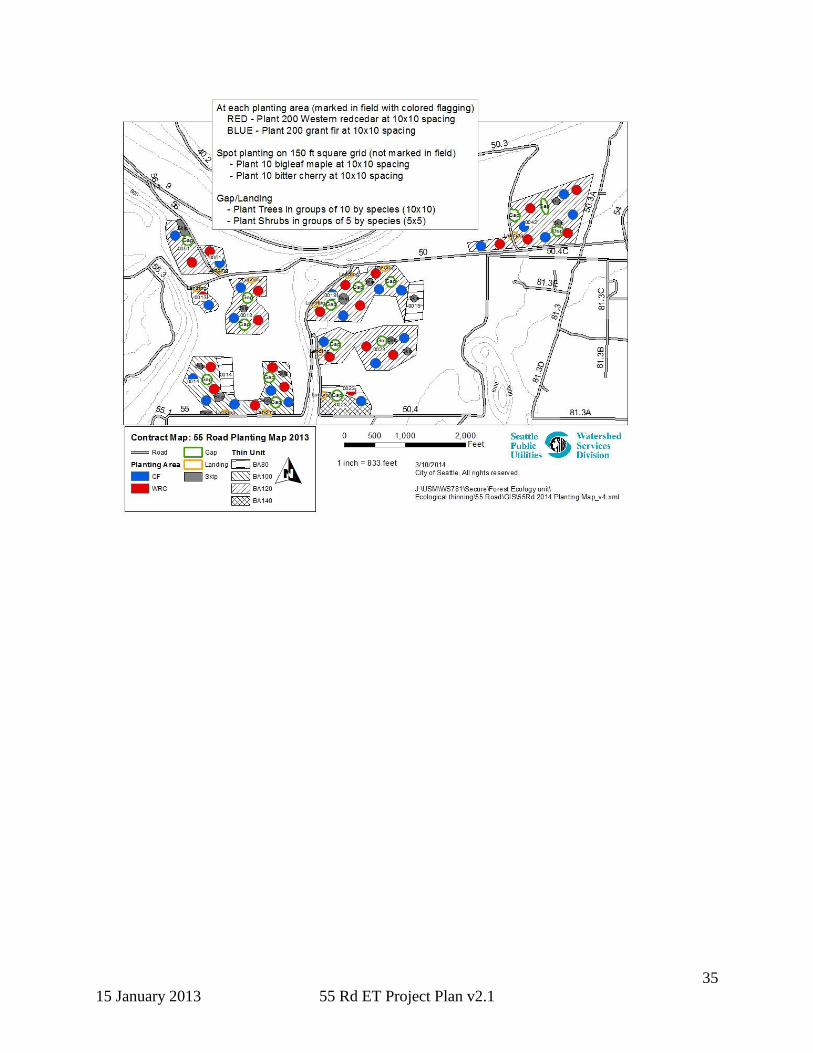
Planting
The thinning units were planted in the winter of 2014 with a variety of shrub and tree species.
See 2014 Restoration Planting Plan and As-Built for detail of the planting project (available on:
http://www.seattle.gov/util/EnvironmentConservation/OurWatersheds/Habitat_Conservation_Pla
n/ManagingtheWatershed/UplandForestHabitatRestoration/Metrics/index.htm ). Planting
followed the spatial pattern and prescription in the following graphic. The planting
specifications of the project plan were followed in canopy gaps, including landings, and edge
plantings. Thinned areas were planted with the prescribed number of trees and species according
to the plan, however, the total area planted was larger. Tree planters concentrated planting more
along the skid trails due to the dense brush cover outside the trail. The total area affected by
planting is therefore estimated to be 87 acres within the 135 acres of project area.
No Damage
49%
Level 1 16%
Level 2 19%
Level 3 16%
Soil Damage
No Damage
91%
Level 1 7%
Level 2 2%
Tree Damage
35
15 January 2013 55 Rd ET Project Plan v2.1

36
15 January 2013 55 Rd ET Project Plan v2.1
Protocol for Soil Disturbance Transects
Plots were spaced on a 1 acre grid with 100’ transects in random directions.
Both soil disturbance and tree damage measurements were taken. The soil disturbance
measurement is a linear measurement with disturbance recorded in 1 foot increments. The tree
damage was recorded on all trees within 5 feet of the soil transect.
Soil disturbance – the first unit was sampled on a scale from 0-2 with 0= no disturbance, 1= light
disturbance and 2=heavy disturbance. In the second unit a scale of 0-3 was used. It was decided
after the first unit was complete that a level 2 disturbance included a lot of variability and that
adding an additional, more severe level of disturbance (3) would be useful. In the second unit 2=
moderate disturbance and 3= heavy disturbance. Note: in the first unit sampled classes 2 and 3
are represented in one class (2).
Soil Disturbance Classes
0- No damage
No evidence of equipment
No depressions from tires or equipment track marks
Duff layer is present and intact
No soil displacement
No compaction
1- Low damage
Wheel tracks or depressions can be present but are faint and shallow
Duff layer has been disturbed or removed
Surface soil has not been displaced
Soil compaction is shallow
2- Moderate damage
Wheel tracks are present and moderate
A horizon is removed
Some surface soil is present and may be mixed with subsoil
Soil compaction is moderately deep
3- Heavy damage
Wheel tracks are present and deep
Surface soil is removed through gouging or piling
Surface soil is displaced
Soil compaction is severe and deep
Tree damage was measured on all trees 5 feet out on both sides of every soil damage transect.

37
15 January 2013 55 Rd ET Project Plan v2.1
Tree Damage Classes
0- No visible damage to the tree
1- Less than 30 square inches of visible damage
2- More than 30 square inches of visible damage