Embed Size (px)
Citation preview

1 hour 30 minutes.
Write your Centre Number and Candidate Number in the spaces provided at
the top of this page.
Write your answers in the spaces provided in this question paper.
Answer all eight questions.
You are provided with Photograph 1.4 for use with Question 4 in this paper.
Do not write your answers on this photograph.
INFORMATION FOR CANDIDATES
The total mark for this paper is 75.
Section A carries 60 marks. Section B carries 15 marks.
Figures in brackets printed down the right-hand side of pages
indicate the marks awarded to each question or part question.
You are reminded of the need for good English and clear
presentation in your answers.
Use accurate scientific terminology in all answers.
You should spend approximately 20 minutes on Section B.
You are expected to answer Section B in continuous prose.
Quality of written communication will be assessed in Section B, and
awarded a maximum of 2 marks.
5456
ADVANCED SUBSIDIARY (AS)
General Certificate of Education
2010
For Examiner’s use only
Question Marks
Number
1
2
3
4
5
6
7
8
TotalMarks
71
Centre Number
Candidate Number
New
Specifi c
ation
TIME
INSTRUCTIONS TO CANDIDATESA
B111
Biology
Assessment Unit AS 1assessing
Module 1: Molecules and Cells
[AB111]
THURSDAY 3 JUNE, AFTERNOON
5456 2 [Turn over
Examiner Only
Marks Remark
Section A
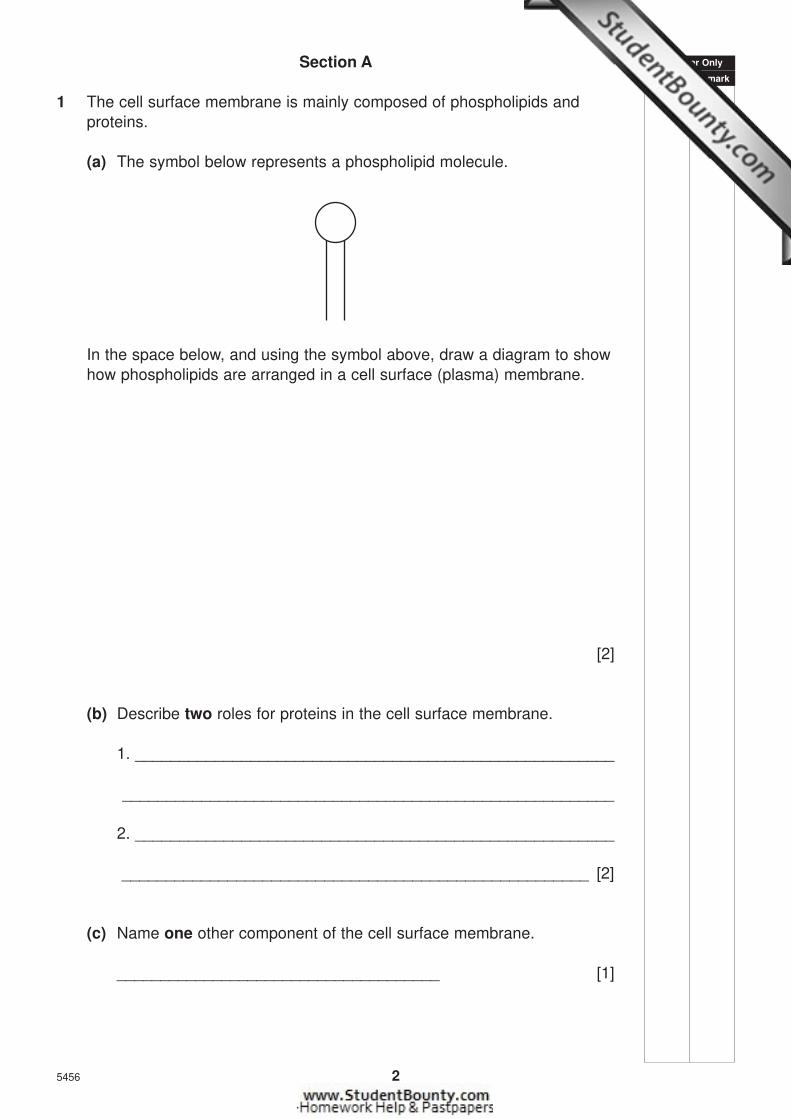
1 The cell surface membrane is mainly composed of phospholipids and
proteins.
(a) The symbol below represents a phospholipid molecule.
In the space below, and using the symbol above, draw a diagram to show
how phospholipids are arranged in a cell surface (plasma) membrane.
[2]
(b) Describe two roles for proteins in the cell surface membrane.
1. ______________________________________________________
________________________________________________________
2. ______________________________________________________
_____________________________________________________ [2]
(c) Name one other component of the cell surface membrane.
_____________________________________ [1]

5456 3 [Turn over
Examiner Only
Marks Remark
2 The diagrams below represent some important stages (labelled A to D)
during mitotic cell cycle in an animal cell.
A B C D
(a) Identify stage B.
_____________________________________________________ [1]
(b) The diagrams are not in the correct sequence. Rearrange the letters
to illustrate the correct sequence of the stages.
_____________________________________________________ [1]
(c) Give one piece of evidence which suggests that the diagrams
represent animal cells and not plant cells.
_____________________________________________________ [1]
(d) Give two pieces of evidence from the diagrams which suggest that
the stages take place during mitosis and not meiosis.
1. ______________________________________________________
________________________________________________________
2. ______________________________________________________
_____________________________________________________ [2]
5456 4 [Turn over
Examiner Only
Marks Remark
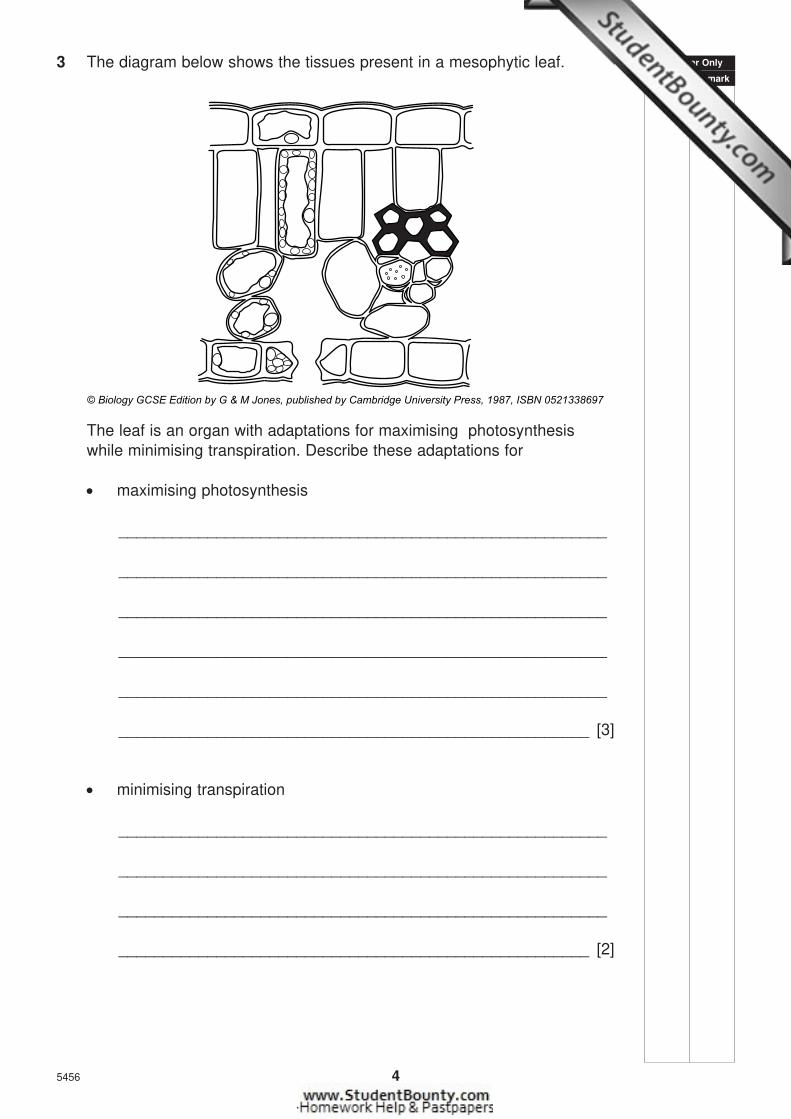
3 The diagram below shows the tissues present in a mesophytic leaf.
The leaf is an organ with adaptations for maximising photosynthesis
while minimising transpiration. Describe these adaptations for
• maximising photosynthesis
_______________________________________________________
_______________________________________________________
_______________________________________________________
_______________________________________________________
_______________________________________________________
_____________________________________________________ [3]
• minimising transpiration
_______________________________________________________
_______________________________________________________
_______________________________________________________
_____________________________________________________ [2]
© Biology GCSE Edition by G & M Jones, published by Cambridge University Press, 1987, ISBN 0521338697

5456 5 [Turn over
Examiner Only
Marks Remark
4 Photograph 1.4 is an electron micrograph of part of a mammalian liver
cell.
(a) Identify the structures labelled A to C.
A _____________________________________________________
B _____________________________________________________
C ___________________________________________________ [3]
(b) Using the scale bar on the photograph, calculate the magnification of
the electron micrograph. (Show your working.)
Answer _____________________ [3]
The storage polysaccharide glycogen is labelled on the electron
micrograph.
(c) Apart from liver cells, in which other mammalian tissue would
glycogen stores be located?
_____________________________________________________ [1]
(d) Describe two ways in which glycogen is adapted to its function as a
storage polysaccharide.
1. _____________________________________________________
_______________________________________________________
2. _____________________________________________________
_____________________________________________________ [2]
(e) Name the equivalent storage polysaccharide in plant cells.
_____________________________________________________ [1]

5456 6 [Turn over
Examiner Only
Marks Remark
5 The diagram below summarises the polymerase chain reaction (PCR).
(a) (i) Explain the role of heating the sample DNA to 94 ºC in step 1.
___________________________________________________
___________________________________________________
___________________________________________________
_________________________________________________ [2]
(ii) State one function of the primers added in step 2.
___________________________________________________
_________________________________________________ [1]
(iii) Explain why the DNA sample is cooled during the addition of the
primers in step 2.
___________________________________________________
_________________________________________________ [1]
A G T G C T T G A C A G T G C T T G A C
A G T G C
T T G A C
T C A C GA A C T G
T C A C GA A C T G
T C A C GA A C T G
G A C
T C
CC
GAT
AT
G A C
G A C
TC
A T C A
Primers
plus
Nucleotides
DNA polymerase
Sample DNA –
double-strandedDNA polymerase
starts copying
Copies of
sample DNA
removed
Step 2
Cool to 46–65°C
Step 1
Heat to 94°C
Step 3
Step 4
T
T
G
A C
T

5456 7 [Turn over
Examiner Only
Marks Remark
(b) Describe the structure of the nucleotides added in step 3.
_______________________________________________________
_______________________________________________________
_______________________________________________________
_____________________________________________________ [2]
(c) Restriction endonuclease enzyme cuts DNA into fragments. The
restriction endonuclease enzyme EcoR1 recognises the sequence
of bases GAATTC (from the 59 end to the 39 end) in a DNA molecule
and cuts the DNA between G and A bases.
(i) Show the position of the cuts in the seqence of bases in the
diagram below.
[1]
(ii) State the type of end that is produced.
_________________________________________________ [1]
(d) Outline how a DNA probe is used to locate a specific DNA fragment.
_______________________________________________________
_______________________________________________________
_______________________________________________________
_______________________________________________________
_______________________________________________________
_____________________________________________________ [3]
G
:
C
G
:
C
C
:
G
C
:
G
T
:
A
T
:
A
G
:
C
C
:
G
T
:
A
G
:
C
G
:
C
A
:
T
A
:
T
T
:
A
T
:
A
C
:
G
A
:
T
A
:
T
39
59
59
39

BLANK PAGE
5456 8 [Turn over

5456 9 [Turn over
Examiner Only
Marks Remark
6 In an investigation into the effect of temperature on the movement of
pigment through cell membranes, small cylinders were cut from fresh
beetroot. In beetroot cells the red anthocyanin pigment occurs within the
vacuoles. Each vacuole is surrounded by a tonoplast membrane and,
outside this membrane, the cytoplasm is surrounded by the cell surface
(plasma) membrane.
After cutting and rinsing six beetroot cylinders, each small cylinder was
placed in a test tube containing water. Each of the six test tubes had been
maintained at a particular temperature. Each cylinder was left for one
minute during which some pigment leaked out.
After cooling, samples from each test tube were placed in cuvettes and
the percentage transmission of light through each sample was measured
using a colorimeter.
(a) (i) Explain why a blue filter was selected for use in the colorimeter.
___________________________________________________
___________________________________________________
___________________________________________________
_________________________________________________ [2]
(ii) State one precaution required, when using a colorimeter, to
ensure that an accurate meter reading is obtained.
___________________________________________________
_________________________________________________ [1]
(iii) Explain precisely how the colorimeter is used to measure the
amount of red pigment in each sample.
___________________________________________________
___________________________________________________
___________________________________________________
_________________________________________________ [2]

5456 10 [Turn over
Examiner Only
Marks Remark
The results of the investigation are shown in the table below.
Temperature/ ºCPercentage
transmission/%
40 90
50 90
55 80
58 25
60 20
70 15
(b) Plot the above results, using an appropriate graphical technique.
(Use the graph paper opposite.) [5]
(c) (i) Identify the trends evident in the results.
___________________________________________________
___________________________________________________
___________________________________________________
_________________________________________________ [2]
(ii) Suggest explanations for the trends identified in (i) above.
___________________________________________________
___________________________________________________
___________________________________________________
_________________________________________________ [2]

5456 11 [Turn over

5456 12 [Turn over
Examiner Only
Marks Remark
7 In an experiment to determine the solute potential (ψs) of leaf tissues by
means of the incipient plasmolysis method, tissues from two plants were
immersed in a series of sucrose solutions of different concentrations.
Samples of the tissue were observed under a microscope, the total
number of cells counted and the number of plasmolysed cells recorded
for each sample.
The two leaf tissues were onion bulb leaves and leaves from the
pondweed, Elodea. The onion leaf cells are modified for storage of
sugars. The Elodea is a common freshwater aquatic plant, found in many
ponds and lakes.
It was predicted that the onion cells would have a lower solute potential
than the Elodea cells.
(a) (i) Unstained onion cells can be difficult to see under a microscope
unless the light is reduced. Describe one method of reducing the
light passing through the onion tissue.
___________________________________________________
_________________________________________________ [1]
(ii) Describe how you would recognise a plasmolysed onion cell
under a microscope.
___________________________________________________
_________________________________________________ [1]
(b) Plasmolysed Elodea cells were identified by a clumping of
chloroplasts in the centre of the cell. Explain why the chloroplasts
clumped in the centre of a plasmolysed cell.
_______________________________________________________
_____________________________________________________ [1]

5456 13 [Turn over
Examiner Only
Marks Remark
The results of the experiment are presented in the graph below.
100
80
60
Percentage
plasmolysed
cells in
sample/%
Solute potential of
immersing solution/kPa
40
20
0
–1000–2000–3000–4000
onion
Elodea
(c) (i) Use the graph to determine the solute potentials of the onion and
Elodea cells.
Onion cells ____________________ kPa
Elodea cells ____________________ kPa [2]
(ii) Explain the basis of the method used to determine the solute
potential of the tissues.
___________________________________________________
___________________________________________________
___________________________________________________
_________________________________________________ [2]
(iii) Suggest one reason for the difference in the solute potentials
determined in (i) above.
___________________________________________________
___________________________________________________
_________________________________________________ [2]
5456 14 [Turn over
Examiner Only
Marks Remark
(d) Explain why the pondweed, Elodea, cannot survive in seawater which
has a high concentration of salts.
_______________________________________________________
_____________________________________________________ [1]

5456 15 [Turn over
Examiner Only
Marks Remark
Section B
Quality of written communication is awarded a maximum of two marks in this section. [2]
8 Enzymes are sensitive to a number of factors. The three graphs in this
question illustrate the influence of three independent variables on the
activity of an enzyme. For each of the three graphs
• identify the independent variable
• describe trends evident in the graph
• explain the trends described [13]
Enzyme
activity
Independent variable
__________________________________________________________
__________________________________________________________
__________________________________________________________
__________________________________________________________
__________________________________________________________
__________________________________________________________
__________________________________________________________
__________________________________________________________
__________________________________________________________
__________________________________________________________
__________________________________________________________
__________________________________________________________

5456 16 [Turn over
Examiner Only
Marks Remark
• identify the independent variable
• describe trends evident in the graph
• explain the trends described
Enzyme
activity
Independent variable
__________________________________________________________
__________________________________________________________
__________________________________________________________
__________________________________________________________
__________________________________________________________
__________________________________________________________
__________________________________________________________
__________________________________________________________
__________________________________________________________
__________________________________________________________
__________________________________________________________
__________________________________________________________

Examiner Only
Marks Remark
5456 17
• identify the independent variable
• describe trends evident in the graph
• explain the trends described
Enzyme
activity
Independent variable
__________________________________________________________
__________________________________________________________
__________________________________________________________
__________________________________________________________
__________________________________________________________
__________________________________________________________
__________________________________________________________
__________________________________________________________
__________________________________________________________
__________________________________________________________
__________________________________________________________
__________________________________________________________
THIS IS THE END OF THE QUESTION PAPER


Permission to reproduce all copyright material has been applied for.In some cases, efforts to contact copyright holders may have been unsuccessful and CCEAwill be happy to rectify any omissions of acknowledgement in future if notified.
5456

GCE Biology Advanced Subsidiary (AS)
Assessment Unit AS 1
Module 1: Cell Biology
Summer 2010
Photograph 1.4
(for use with Question 4)
5456.02 AB111INS1
2 μm
A B
Cglycogen
© George McCartney