Embed Size (px)
Citation preview

SPECIMEN
Advanced Subsidiary GCE
PHYSICS B (ADVANCING PHYSICS) G491 QP
Unit G491: Physics in Action
Specimen Paper
Candidates answer on the question paper. Time: 1 hour Additional Materials: Data, Formulae and Relationships Booklet
Electronic calculator
Candidate Name
Centre Number Candidate
Number
INSTRUCTIONS TO CANDIDATES • Write your name, Centre number and Candidate number in the boxes above. • Answer all the questions. • Use blue or black ink. Pencil may be used for graphs and diagrams only. • Read each question carefully and make sure you know what you have
to do before starting your answer. • Do not write in the bar code. • Do not write outside the box bordering each page. • WRITE YOUR ANSWER TO EACH QUESTION IN THE SPACE PROVIDED.
INFORMATION FOR CANDIDATES
• The number of marks is given in brackets [] at the end of each question or part question.
• !Where you see this icon you will be awarded marks for the quality of written communication in your answer.
• You may use an electronic calculator. • You are advised to show all the steps in any calculations. • The total number of marks for this paper is 60.
FOR EXAMINER�S USE
Section Max. Mark
A 21
B 39
TOTAL 60
This document consists of 19 printed pages and 1 blank page. SP (SLM) T12103 © OCR 2007 QAN 500/2257/X OCR is an exempt Charity [Turn Over
SPECIMEN

2
Answer all the questions.
Section A
1 Here is a list of electrical units
A s C s-1 J s-1 J C-1 V A-1
Choose the correct unit for
(a) electric current ............................................................................................................................
.....................................................................................................................................................
(b) resistance ....................................................................................................................................
.....................................................................................................................................................
(c) potential difference.. .....................................................................................................................
............................................................................................................................................... [3]
2 Three temperature sensors A, B and C were plunged into boiling water at the same moment. The graph below shows their responses.
(a) State the sensor with the longest response time..................................................................... [1]
0.0
0.2
0.4
0.6
0.8
1.0
1.2
1.4
1.6
1.8
0 2 4 6 8 10
time / s
output p.d. / V
A
B
C
SPECIMEN

3
(b) The temperature rise of each sensor was 80 ºC.
Calculate the average sensitivity of sensor A between room and boiling water temperatures.
sensitivity = ...................................................................................................................unit [2]
[Turn Over
SPECIMEN

4
3 Fig. 3.1 and Fig. 3.2 show two satellite images, taken about two weeks apart in early
2000, of the Ninnis Glacier disintegrating into the Antarctic Ocean.
Fig. 3.1 Fig. 3.2
(a) Both images are 300 pixels wide x 250 pixels high.
A 40 km scale marker has been added to Fig. 3.1.
Estimate the resolution of these images.
resolution = .................................. m pixel-1[1]
(b) Estimate the distance ice shelf B has drifted during the two weeks.
distance ................................................ km [1]
(c) The images show the first large-scale break up of the Ninnis Glacier in recorded history.
Suggest one way in which the evidence presented in this pair of images is important to humans.
[1]
40 km
SPECIMEN

5
4 Fig. 4.1 shows two waveforms displayed on an oscilloscope screen.
One is the original analogue signal from a recording of a dolphin whistling.
The other is the result of digitising it to the nearest of 8 binary coded levels.
Fig. 4.1
(a) (i) Read from the graph the time period T in microseconds for one complete cycle of the dolphin whistle.
T = .......................................................... μs [1]
(ii) Calculate the frequency f corresponding to this time period T.
f = ........................................................... Hz [1]
(b) The waveform is sampled every 1.0 μs.
Calculate the rate at which the sampled information is transmitted.
information rate = ........................... bits s -1 [2]
[Turn Over
SPECIMEN

6
5 An original signal of amplitude 3.0 V has a random noise signal of amplitude 0.5 V added to it.
Calculate the maximum number of bits per sample that can be coded for this signal.
maximum number of bits per sample = ................................... [1]
6 Here are five mechanical properties of materials
elasticity hardness toughness stiffness strength
For each of the following descriptions of mechanical properties of materials write down the property being described from the list.
The stress required to break a material ..............................................................................................
A measure of the difficulty of scratching or denting the material .................................................. [2]
7 A resistor is rated at 470 Ω and maximum power of 0.50 W.
Calculate the potential difference across the resistor, when running at its maximum power.
potential difference = ............................... V [2]
SPECIMEN

7
8 A class experiment sets out to measure the breaking force of cotton thread. The histogram below shows the frequency of occurrence for each breaking force measured.
Showing your working clearly, state your best estimate of the breaking force of this cotton thread.
Give an estimate of the uncertainty in the measurement.
Give your answers to a sensible number of significant figures.
breaking force = ............... ± ............... N [3]
Section A Total: [21]
[Turn Over
0
1
2
3
4
5
6
7
8
9
10
11
12
13
14
9.0 9.5 10.0 10.5 11.0 11.5 12.0 12.5 13.0 13.5 14.0 14.5 15.0 15.5 16.0
breaking force / N
number of occurrences
SPECIMEN

8
Section B
9 A vertical filament lamp is set up a distance u in front of a converging lens as shown in Fig.9.1.
A real image of height h is focused on the screen at distance v from the lens.
filament lens screen lamp and image
h u v
Fig. 9.1
(a) (i) On Fig. 9.1, mark with the letter F the focus of the converging lens.
[1]
(ii) Explain using Fig. 9.1 why in this example the real image is not formed at F.
! You will be awarded marks for the quality of your written communication.
[2]
SPECIMEN

9
(b) The distance of the screen from the lens is varied; the image is refocused by changing the object distance u.
Fig. 9.2 shows image height h with a ± 5% uncertainty, plotted against image distance v.
Fig. 9.2
(i) Draw accurately the lines of best, maximum and minimum possible slope through the data points on Fig. 9.2. [1]
(ii) State the best estimate and the range of possible values of the intercept on the horizontal axis.
best intercept = ............................................. m [1]
intercept range from ................ to .................. m [1]
[Turn Over
0102030405060708090
0.0 0.1 0.2 0.3 0.4 0.5 0.6 0.7 0.8 0.9 1.0 1.1
v / m
h / mm
SPECIMEN

10
(c) (i) Explain why this intercept is equal to the focal length f of the lens.
[1]
(ii) State the power of the lens with an estimate of its uncertainty.
Use data from (b), making your method clear.
power of lens = ............... ± ..................D [4]
[Total 11]
SPECIMEN

11
10 10.1 shows how the resistance of a thermistor varies with temperature.
Fig. 10.1
(a) Use the graph to describe in detail how the resistance varies with temperature, and to illustrate the meaning of the term sensitivity.
! You will be awarded marks for the quality of your written communication.
[4]
[Turn Over
0
100
200
300
400
500
0 20 40 60 80 100
temperature / o C
resistance / Ω
SPECIMEN
12
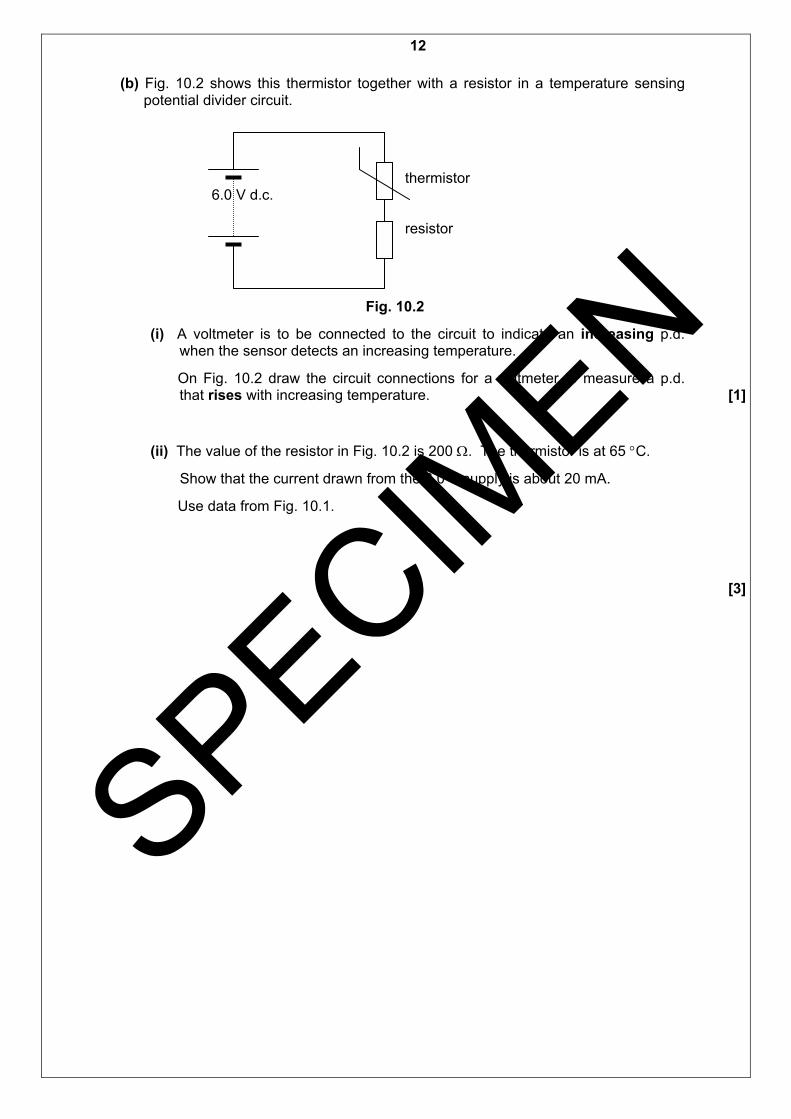
(b) Fig. 10.2 shows this thermistor together with a resistor in a temperature sensing potential divider circuit.
thermistor
6.0 V d.c. resistor
Fig. 10.2
(i) A voltmeter is to be connected to the circuit to indicate an increasing p.d. when the sensor detects an increasing temperature.
On Fig. 10.2 draw the circuit connections for a voltmeter to measure a p.d. that rises with increasing temperature. [1]
(ii) The value of the resistor in Fig. 10.2 is 200 Ω. The thermistor is at 65 °C.
Show that the current drawn from the 6.0 V supply is about 20 mA.
Use data from Fig. 10.1.
[3]
SPECIMEN

13
0.0
1.0
2.0
3.0
4.0
5.0
6.0
0 20 40 60 80 100
temperature / o C
p.d. / V
(c) The graphs X, Y and Z in Fig. 10.3 show how the p.d. across the resistor varies with temperature, for three different values of the resistor.
Fig. 10.3
(i) The values of resistance used are 20 Ω, 200 Ω and 1000 Ω.
State which graph, X, Y or Z, is the curve for the 1000 Ω resistor. .......................... [1]
(ii) State one advantage and one disadvantage of using output Z for the temperature sensing circuit.
[2]
[Total : 10]
[Turn over
Z
Y
X
SPECIMEN

14
11 This question is about an experiment to measure
either the electrical resistivity
or the electrical conductivity
of a highly conducting material of your choice.
(a) (i) State the material and circle the physical property above that you have chosen.
Material ...........................................................................................................................
(ii) The experiment would usually be performed on a long and thin sample of the material, such as a wire.
Justify this shape of the sample for your experiment.
[2]
(iii) Describe with the help of a labelled diagram the equipment and method you would use to make your measurement.
[3]
SPECIMEN

15
(b) Suggest an experimental difficulty that needs to be overcome, in limiting the uncertainty in the measurement of your chosen property. Describe how this difficulty can be overcome in practice.
! You will be awarded marks for the quality of your written communication.
[3]
(c) State the quantities, other than sample dimensions, that you need to measure to complete your calculation of the resistivity or conductivity.
[1]
[Total: 9]
[Turn over
SPECIMEN

16
12 This question is about two methods of estimating the size of a molecule.
(a) This is the first method.
Fig. 12.1 is an STM (scanning tunnelling microscope) image of a layer of molecules. The field of view is 20 nm wide.
20 nm
Fig. 12.1 Courtesy of © Matthias Boehringer, University of Lausanne
Estimate the size of a molecule using this information.
molecular size = ..................................... m [2]
SPECIMEN

17
(b) Another method is to allow one drop of oil to spread out on a water surface.
(i) The oil drop has a diameter of 0.50 mm.
Show that the volume of oil in the drop is about 0.07 mm3.
Volume of sphere = 4 π r3 3
[2]
(ii) When the oil spreads out on the water surface it forms a circular patch.
This is assumed to be one molecule thick. Therefore the thickness of the patch gives an estimate of the size of the molecule.
The diameter of the patch can be measured because the oil has moved aside powder scattered on the water surface as illustrated in Fig. 12.2.
circular patch of oil scattered one diameter powder of patch water surface before and after addition of oil drop
Fig.12.2
The diameter of the patch is measured in four different directions.
The results are given below.
diameter / mm 300 280 280 260
Calculate the mean diameter of the patch from these measurements.
mean diameter = ................................ mm [1]
[Turn over
SPECIMEN
18
(iii) For a patch of area A and thickness h the volume = A h.
Calculate an estimate of the size of an oil molecule using the data from parts (b)(i) and (b)(iii).
You may assume that the patch of oil is one molecule thick.
estimate of molecular size = ........................ m
[3]
[Total 8]
Total Section B [39]
Paper Total [60]
SPECIMEN

19
Copyright Acknowledgements:
Sources
Figs 3.1 & 3.2 © 2000 Canadian Space Agency
Fig 12.1 Courtesy of © Matthias Boehringer, University of Lausanne
Permission to reproduce items where third-party owned material protected by copyright is included has been sought and cleared where possible. Every reasonable effort has been made by the publisher (OCR) to trace copyright holders, but if any items requiring clearance have unwittingly been included, the publisher will be pleased to make amends at the earliest opportunity.
OCR is part of the Cambridge Assessment Group. Cambridge Assessment is the brand name of University of Cambridge Local Examinations Syndicate (UCLES), which is itself a department of the University of Cambridge.
© OCR 2007
SPECIMEN

20
BLANK PAGE
SPECIMEN

This document consists of 5 printed pages and 3 blank pages. SP (SLM) T12103 © OCR 2007 QAN500/2257/X OCR is an exempt Charity
OXFORD CAMBRIDGE AND RSA EXAMINATIONS
Advanced Subsidiary GCE
PHYSICS B (ADVANCING PHYSICS) [G491 MS] Unit G491: Physics in Action
Specimen Mark Scheme
The maximum mark for this paper is 60.
SPECIMEN

2
Section A Question Number Answer Max
Mark1 C s-1 " ; V A-1 " ; J C -1 " [3]
2(a) B " [1] (b) (1.6-0.4) / 80 = 0.015 ; V °C-1 (15 mV °C-1 )
" evaluation ; " unit [2]
3(a) 410 ± 20 ( m pixel-1 ) " (b) 21 ± 2 ( km) " (c) Allow any response which suggests any reasonable impact of
global warming or Antarctic ice-shelf loss on people, which could be environmental, demographics or academic /scientific. " e.g. evidence of global warming / sea levels rising / flooding lowlands / population movements / refugees . [3]
4(a)(i) 50 ± 1 (μs ) " [1] (ii) {20 ± 0.4 } x 10 3 ( Hz ) ecf consistent with (i) " [1] (b) Identifying no of bits /sample = 3 & samples /s = 106 "
3 × 106 "
[2] 5 Log2(3.0/0.5) = 2.58 so 2 is the maximum number " [1] Allow reverse argument& trial and error using 2n = 3.0/0.5
6 strength " ; hardness " [2] Combines P=IV & R=V/I or recalls P=V2/R "
7 V = √ ( P R ) / = √ ( 0.5 x 470 ) ; = 15.3 ( V ) " [2] 8 Accept 12.3 (mean) with no calculation shown. |f 12.5 given,
either justification for choice of mode should be present or calculation of median; " ± in range 1 to 2 (N) ; " 3rd mark for 3 s.f. in estimate and 1 S.F in uncertainty. ". [3]
Total section A : [21] 9(a)(i) F where rays parallel to principal axis meet" [1]
(ii) F would be image position if lamp were at very distant/ object fairly close to lens so image outside focal length owtte "
QWC: spelling, punctuation & grammar " [2] (b)(i) 1 line through points and 2 through uncertainty bars " [1] (ii) intercept best estimate 0.10 m by eye "
range 0.095 to 0.105 m " lower limit should be > 0.090, < 0.10; upper limit should be >0.10, <0.11 If graphs drawn inaccurately, allow values consistent with actual lines providing the lines are actually straight. [2]
(c)(i)
it is the closest to the lens a real image can be formed / object at ∞ needed for 1/v = 1/f / to give incoming waves zero curvature AW " NOT h = 0 NOT v = f unless explained clearly, e.g. when image is a point when the object is at infinity. [1]
SPECIMEN

3
Section B Question Number Answer Max
Mark(ii)
P = 1/f " = 1/ 0.1 = 10.0 D " uncertainty method using ± 5% or least or most intercept " uncertainty evaluation ± 0.5 D " Allow calculation of P for extreme values of horizontal intercept and subtraction to give uncertainty provided that it is 1S.F. [4]
Total [11] 10(a) R decreases / falls / drops as T increases "
Mathematical description of the change " , e.g. change in resistance per degree gets less and less as T increases, or increase in temperature needed for R to half gets smaller, or quantitative comparisons to the same effect, e.g. R drops by 100 Ω in 5° to start with but by the end it�s dropping by only about 10 Ω in 5°C. Sensitivity is the change in the measured variable owtte per unit change in the independent variable owtte;is greater at low temperatures " for the mark it is essential that both the idea of sensitivity as gradient of the graph and the decrease in sensitivity with T are described.
QWC: clear organisation (1) [4] (bi) connections in parallel with fixed resistor " [1] (ii) RThermistor = 100 ± 5 Ω " (evidence from graph)
R Total = 200 + RThermistor (Ω) = 300 Ω; ecf " I = (V / RTotal ) = 6 / RTotal = 0.02 A " (conversion to mA not required) [3]
(c)(i) X " [1]
(ii) advantage (near) constant sensitivity / linear (output) " NOT �just� straight line disadvantage less sensitive (over most of range) / range of voltages is small / battery lasts for less time " allow AW or other sensible quality physics [2]
Total [11] 11(a)(i) student choice sets appropriate context � no marks (0)
(ii) long so resistance large enough /conductance small enough to measure " thin so smaller cross sectional area and therefore resistance is larger/ conductance is smaller " OR reasonable current at low p.d. in each case, but both must
be justified separately. [2] (iii) correct circuit diagram (circuit with A and V meters (accept
Ωmeter) " Clear method to include measurement of L and d of wire "
Description of calculation of resistivity / conductivity " [3]
SPECIMEN

4
Section B Question Number Answer
Max Mark
(b) identify systematic error / source of greatest random uncertainty " suggest reasonable solution " e.g. small resistance for good conductor needing thin long wire with difficulty in measuring diameter " ,use of micrometer / Vernier caliper [accept repeated readings and averaging] " e.g. contact resistance at wire ends results in voltage drops (inside voltmeter loop) " solder connections/ make firmer voltmeter contacts "
QWC: appropriate form and style " [3] (c) p.d. and current "(allow resistance if Ωmeter used in (a)(iii) ) [1]
Total 9 12(a) 20 (nm) / 14 = 1. 4 x 10⁻⁹ m accept 1 nm
Method " ; evaluation " Allow count of molecules 13 or 15, giving d = 1.5 nm and 1.3 nm respectively. If a bald �1nm� is given with no working, give one mark only. Correct answer with 4 or more S.F. gets one mark only [2]
(b)(i) V = 4 π (0.50 / 2)3 / 3 ; = 0.065 mm3 ≈ 0.07 mm3 substitution "; evaluation " Calculating 4 π (0.50)3 / 3 = 0.52 mm3 gets evaluation " only. Correct expression followed by 0.07 mm3 without clear evaluation of V (i.e. to at least 2 SF) gets substitution "only [2]
(ii) (300 + 280 + 280 + 260)/4 = ( 1120)/4 = 280 mm accept bare answer [1]
(iii) A = π (280 / 2)2 ; = 6.2 x 104 mm2 " ecf on (ii) h = V/A = 0.065 / (6.2 x 10⁴ ) mm substitution " = 1.0 x 10⁻⁶ mm = 1.0 × 10⁻⁹ m evaluation " Accept answers in e.g. mm if correct, and correct prefix is put before m on answer line. [3]
Total 8 Total Section B [39]
Paper Total [60] SPECIMEN

5
Assessment Objectives Grid (includes QWC)
Question AO1 AO2 AO3 QWC Total 1 3 3 2 3 3 3 1 2 3 4 2 2 4 5 1 1 6 2 2 7 1 1 2 8 1 2 3
9(a) 1 1 1 3 9 (b) 3 3 9(c) 1 2 2 5
10(a) 2 1 1 4 10(b) 2 2 4 10(c) 1 2 3 11(a) 4 1 5 11(b) 2 1 3 11(c) 1 1 12(a) 1 1 2
12(b)(i) and (ii)
1 2 3
12(b)(iii) 3 3 Totals 27 19 11 3 60
SPECIMEN

6BLANK PAGE
SPECIMEN

7
BLANK PAGE
SPECIMEN

8
BLANK PAGE
SPECIMEN