Embed Size (px)
Citation preview

113
5.1. INTRODUCTION:
The study of the interactions between heavy metals and microorganisms has been specially
focused on bacterial transformation and conversion of metallic ions by reduction in different
polluted environments (Chang et al., 1993), the selection of metal-resistant microorganisms from
polluted environments (Hiroki, 1994), and the use of resistant microorganisms as indicators of
potential toxicity to other forms of life (Doelman et al., 1994) as well as on mechanisms,
determinants and genetic transfer of microbial metal-resistance (De Rore et al., 1994). Many
heavy metal ions are “soft” Lewis acids, which mean that their affinity for soft donor atoms such
as phosphorus and sulfur are considerably higher than for hard donor atoms such as nitrogen and
oxygen. Examples of soft metal ions are Hg2+, Pb2+, Cd2+, Cu2+, Ag+, Au3+, Pt4+, and Tl+. Many
soft metal ions are of concern because they are highly toxic and are present in a variety of waste
streams that can potentially contaminate the environment if released. Safe, efficient, and cost
effective separation and recovery of these toxic metals are of great concern in modern day
environmental scenario.
An inherent problem in bioremediation of toxic wastes is when the heavy metal contamination in
the environment, over a period of time, leads to reaction with organic moieties. One of the main
aims of this study is concerned with MRB-mediated removal of heavy metals like Hg, Cd and Pb
from aqueous solutions. As heavy metals are not biodegradable in the same sense as carbon-
based molecules, metals, unless removed completely either through precipitation, ligand binding
or diffused out from a system, they will persist indefinitely (Roane, 1996). Cadmium, copper,
lead, mercury, nickel and zinc are considered the most hazardous and are included on the US
Environmental Protection Agency’s (EPA) list of priority pollutants (Cameron, 1992). In the US,

114
37% of the tested sites polluted with organic compounds were also found to be polluted with
metals such as arsenic, mercury, lead and zinc (Kovalick, 1991).
Mercury has no known biological function and is highly toxic to humans (Goldwater & Clarkson,
1972). It can exist in three oxidation states viz. elemental mercury, Hg0; mercurous mercury,
Hg+; or mercuric mercury, Hg2+, and the latter two can combine with other elements to form
either organic or inorganic mercury compounds (Hu, 1998). The distinction between elemental,
inorganic and organic mercury is much more important than oxidation states in determining
toxicity as, organic mercury compounds are the most toxic (Goldwater & Clarkson, 1972; Hu,
1998). Organic mercury compounds, like the metal, are volatile at room temperature. Some of the
compounds that have important industrial applications are those in which mercury is coupled
with methyl or ethyl (alkyl mercury compounds), or phenyl groups (aryl mercury compounds).
The alkyl mercury compounds are more toxic, particularly methyl mercury, than the aryl mercury
compounds (Taylor & Francis, 1995).
Mercury exerts its toxicity by binding its ions to sulphydryl groups in the body. These groups
may be part of some enzymes, structural and functional proteins and hence mercury and its
compounds are potent inhibitors of some enzymes (Livingstone, 1972; Taylor & Francis, 1995;
Williams, 1999). Mercury also blocks the transport of potassium and sugars into cells. These
effects are due to the binding of mercury to the S-H groups in or on the cell membrane. Once
inside the cell, it may be sequestered as an inactive combination, or it may react with enzymes or
other compounds to elicit toxic effects (Livingstone, 1979). Organic mercury is able to reach the
CNS, where it is oxidized (alkyl mercury compounds are demethylated) to Hg2+ and leads to
neurological damage (Taylor & Francis, 1995). Exposure of the body to mercury in any of its

115
forms stimulates kidneys to produce metallothionein, a metal-binding protein that affords partial
protection against mercury toxicity (Hu, 1998). In recent years, there has been some concern that
mercury contained in dental amalgams adversely affects human health, produces illnesses
including multiple sclerosis and Alzheimer’s disease, but this conjecture has not been
conclusively proven (Hu, 1998; Baldwin & Marshall, 1999).
Mercury poisonings have been reported from ingestion of mercuric chloride (an inorganic
compound which is used as a disinfectant), as well as from contaminated illegal drugs, for
example, amphetamines. Poisoning has also occurred from exposure to fungicides containing
organic mercury compounds and from industrial accidents in which mercury vapour was inhaled.
Environmental discharges of mercury have also occurred, by discharge of industrial wastes
(Livingstone, 1972).
Cadmium is well known for its toxicity, bioaccumulation and biomagnification through the food
chain. Cadmium has no essential biological function and is extremely toxic to humans. In
chronic exposure, it also accumulates in the body, particularly in kidney and the liver (Goldwater
& Clarkson, 1972; Williams et al., 1999). These properties, along with its common usage in Ni-
Cd batteries, make cadmium one of the commonest environmental metal poisonings. Acute
poisoning from inhalation of fumes and ingestion of cadmium salts can also occur and at least
one death has been reported from self-poisoning with cadmium chloride (Baldwin & Marshall,
1999).
Cadmium has a wide variety of sources in the environment and from industry. One source is from
ingestion of grown foodstuffs, especially grain and leafy vegetables, which readily absorb

116
cadmium from the soil. It may also contaminate fish (Hu, 1998; Williams et al., 1999). In
addition, being a constituent of alloys, pigments, batteries, metal coatings, plastics and fertilizers,
it may occur naturally or as a contaminant. Contaminants such as sewage sludge, fertilizers,
polluted groundwater and mining effluents are important sources of Cd. Occupational exposure
may occur from the manufacture of these products and from welding, and smelting of lead, zinc
and copper as these occur in mixed ores with cadmium. It is also found in cigarette (0.007 to 0.35
µg per cigarette) and vehicular fumes. Residential sites may be contaminated by municipal waste
or leaks from hazardous waste sites (Taylor & Francis, 1995; Hu, 1998; Williams et al., 1999).
The toxic effects of cadmium are due to its inhibition of various enzyme systems. Like similar
heavy metals, it is able to inactivate enzymes containing sulphydryl groups and it can produce
uncoupling of oxidative phosphorylation in mitochondria (Fassett, 1972). Cadmium may also
compete with other metals such as zinc and selenium for inclusion into metallo-enzymes and it
may compete with calcium for binding sites on regulatory proteins such as calmodulin (Hu,
1998). In prolonged cadmium exposure, disorders of calcium metabolism occur causing
osteomalacia (Hu, 1998; Williams et al., 1999). This leads to painful fractures, hence the name
given to the chronic exposure disease in Japan: Itai-itai disease (literally "ouch!-ouch!" disease;
Williams et al., 1999; Hu, 1998; Taylor & Francis, 1995). Cadmium is also known to be
carcinogenic, and has often been linked with lung and prostate cancers (Taylor & Francis, 1995;
Hu, 1998; Williams et al., 1999).
Lead has no known biological function, is highly toxic and accumulates in humans (Williams et
al., 1999). People have known about the toxicity of lead for centuries, at least since 200BC, when
Dioscorides wrote, "lead makes the mind give way". Despite this, lead has been used extensively

117
for both industrial and domestic applications for hundreds of years (Baldwin & Marshall, 1999).
The major source of lead in the environment is earth’s crust. Lead enters the food and water
supply (Goyer & Chisholm, 1972; Williams et al., 1999) quite naturally and is absorbed by
foodstuffs (particularly green leafy vegetables) growing on soil where lead is present.
Contamination from vehicle exhausts or wastes or from the areas naturally high in lead (Hu,
1998) is substantial sources of Pb. Previously, tetraethyl lead was an additive in petrol and lead
was used in plumbing (Hu, 1998; Williams et al., 1999). In many countries the use of leaded
petrol is being phased out, and lead piping in households is gradually being replaced, due to
health concerns. Lead also used to be used in paints and some cases of lead poisoning are due to
small children eating flakes of this paint (Taylor &Francis, 1995; Williams et al., 1999). Today,
lead is still used in batteries, some insecticides, and is found in cigarette smoke, where there is
between 0.017 and 0.98 micrograms per cigarette (Taylor & Francis, 1995; Williams et al.,
1999).
Occupational exposure to lead may occur during the manufacture of the products above, but in
addition to this lead is mined and smelted (Hu, 1998; Williams et al., 1999). Exposure to organic
lead substances such as tetraethyl and tetramethyl lead may occur in some industries
(Livingstone, 1979). There may also be exposure in people who mine gold and zinc, as lead is a
contaminant of the ore (Williams et al., 1999).
Elemental lead and inorganic lead compounds are absorbed by ingestion or inhalation, but
organic lead compounds e.g. tetraethyl lead may also be absorbed by skin contact. Organic lead
compounds are the most toxic. Absorption of lead by the lungs is very efficient, especially when
the particles are less than 1 micrometre in diameter, as may happen for example with fumes from

118
burning lead paint. Gastrointestinal absorption of lead varies with the age of the individual;
children absorb around 50% of what they ingest, but adults only absorb 10-20% of what they
ingest (Taylor & Francis, 1995; Hu, 1998). It also affects sodium, potassium and calcium ATP-
ase pumps, which maintain the cells’ concentration gradients of these ions. Activities of calcium-
dependent intracellular messengers and functions of protein kinase C in the brain are also
impaired. Lead also stimulates the formation of inclusion bodies in cells that may translocate the
metal into nuclei and alter gene expression (Hu, 1998).
Microbial metal resistance mechanisms include precipitation of metals as phosphates, carbonates
and sulfides; metal volatilization by methyl or ethyl group addition; physical exclusion by
electronegative components in membranes and extracellular polymeric substances (EPS); energy-
dependent metal efflux systems; and intracellular sequestration with low molecular weight,
cysteine-rich proteins (Hughes & Poole, 1989; Gadd, 1990; Silver, 1998). In general, while
microbial metal resistance includes a variety of strategies to deal with toxic metal concentrations
in the environments (Roane et al., 1996), these strategies are either to prevent entry of the metal
into the cell or to actively pump the metal out of the cell. Such resistance can be divided into two
classes: metal dependent and metal-independent (Roane & Pepper, 1997). Unlike the mercury
and arsenic resistance systems that are highly homologous in all bacteria studied, other resistance
systems have evolved several times (Silver & Phung, 1996). In addition, many moieties of
chromosomal DNA have been shown to be important in resistance to heavy metals. For example,
Cánovas et al. (2003) reported that the genome sequence of Pseudomonas putida KT2440 has 61
open reading frames (ORFs) involved in different metal tolerance/resistance. Pain et al. (1998)
reported that most of the TBT-resistant bacteria are also resistant to six heavy metals (Hg, Cd,
Zn, Sn, Cu, Pb), which suggest that resistance to many types of toxicants may be present in the

119
same organism. Present investigation was planned to address such mechanisms. Several mercury-
resistant marine bacteria positive for resistance primarily to toxic mercury and other toxic heavy
metals as well as many xenobiotics were chosen and their detoxification of Hg, Cd and Pb. Since
these toxicants are present in many aquatic environments, remediation of such environments, or
the avoidance of contamination, is an area of active research interest, this study has attempted to
understand the potential of MRB in dealing with the above listed toxicants.
5.2. MATERIALS AND METHODS:
5.2.1. Growth of MRB in heavy metals (Hg, Cd and Pb):
MRB were grown in seawater nutrient broth (SWNB; 5g peptone, 5g yeast extract, 500 ml
seawater and 500 ml distilled water). An inoculum of 100 µl was added to 100 ml SWNB to
which individual heavy metal salt was aseptically added to a final concentration of 100, 50, or 10
ppm. Hg (as HgCl2), Cd (CdCl2) and Pb [(CH3COO)2Pb] were the different salts used for this
experiment. Suitable controls were maintained without any addition of heavy metal. The optical
density was recorded at specific time intervals as a measure of growth. The OD values were
transformed into cell numbers using an empirical formula of 1 OD = 9.98 X 10⁹ cells ml-1
(Ramaiah, 1989).
5.2.2.1. Detoxification of mercury by volatilization:
Eleven mercury-resistant bacterial isolates viz. GP15 (A. faecalis), CM10 (Bacillus sp.), CH07
(P. aeruginosa), GP08 (B. iodinium), GP13 (B. iodinium), GO02 (A. faecalis), GP16 (A.
faecalis), GP17 (A. faecalis), GP14 (B. iodinium), GP06 (A. faecalis), CH13 (B. pumilus), one
mercury-sensitive (unidentified) and P. putida KT2442::mer73 (as positive control) were grown

120
in marine broth for 24 hours and the cells were pelleted by centrifugation at10, 000 rpm. The
cells were washed with phosphate buffer and placed in wells of microtitre plates. Mercury stock
solution was added to the phosphate buffer to a final concentration of 10 ppm and then added to
wells containing the cells. The whole plate was covered with Kodak XAR film and the plate was
incubated at 30° C in dark for 4 hours. After incubation, the XAR film was removed and
developed in a darkened room.
5.2.2.2. Kinetics of Hg removal:
Figure 5.2.2.1 shows the set up for online system to measure the kinetics of mercury
transformation by bacteria. It comprised of an atomic absorption spectrophotometer (AAS), a
three-reaction vessels-assembly, one magnetic stirrer, a water bath (with temperature control),
and one motor with timer and channels for carrying air and mercury. Accumulated metallic
mercury was blown out from time to time into the AAS by airflow through the reaction vessel. A
magnetic stirrer was used for complete mixing. The reaction vessels had a volume of 50 ml. Each
lid had a plastic tube for inflow and outflow of air and a needle to couple the syringe. Air tubes
had unidirectional valves above the reaction vessels so that there was no back- flow into the
vessels. Direction of the airflow was always from the reaction vessels directly into the AAS.
Therefore the reaction vessel was airproof when the inflow valve was closed. The reaction
vessels were maintained at a temperature of 25°C.
5.2.2.2.1. Bacterial cultures:
CH07 (a marine P. aeruginosa), P. putida (P. putida KT 2442 mer::73) and Bro12 (a P.
aeruginosa isolated from chloralkali wastewater) were grown overnight (approx. 16 hours) in
modified M9 minimal medium (10x salts: Na2HPO4.7H2O, 70 g; KH2PO4, 30 g; NaCl, 25 g;

121
NH4Cl, 10.0 g; distilled water 1 litre), trace elements(MgO, 10.75 g; CaCO3, 2.0 g; ZnSO4, 1.44
g; MnSO4, 1.12 g; CuSO4, 0.25 g; CaSO4, 0.28 g; H3BO3, 0.06 g; MgSO4, 120 g; FeSO4.7H2O,
10 g; conc. HCl, 51.3 ml; distilled water, 1 litre) and glucose (4g l-1) with 1 mg l-1 HgCl2 at 30°C
on a rotary shaker. “Preculture” was made by adding this overnight grown culture to fresh
medium and allowing them to grow to a desired cell density in the exponential phase. This was
examined by frequent measurements of OD. For reliable comparison between the experimental
runs, adequate care was taken to transfer the precultures at the right time to meet with the rigor
that these precultures always came from the same stage of the exponential growth phase.
5.2.2.2.2. Hg biotransformation assay:
For this assay 20 ml of minimal medium (including carbon source) was prepared with the defined
mercury concentration to be tested (for example 1, 2, 5, 10, 15 mg Hg l-1). Mercury
transformation was allowed to take place in 3 parallel reaction vessels where 600 µl culture
containing approximately same cell numbers/protein concentration was added to 5.6 ml minimal
medium (M9) amended with defined mercury concentration. Effect of NaCl concentration on Hg
removal was done with all three isolates at a fixed Hg concentration of 8 ppm. NaCl
concentrations of 5gm l-1 to 30 g l-1 were used for this experiment. A standard solution of 1000
ppm (1 g l-1) Hg(NO3)2 was used to prepare different concentrations for calibration curve
throughout the experiment.
5.2.2.2.3. Hg Measurement and protein analysis:
Aliquot of 1 ml from the culture was taken simultaneously for protein detection. This sample was
centrifuged (13,000 rpm, 5 minutes, 4°C) and the resulting pellet was stored – 20°C till analysis
of total protein following Bradford method (Bradford, 1976).

122
5.2.2.2.4. Calculation:
The highest peak area was taken from each vessel and the background level was subtracted from
the last cycle of the pre-blowouts. This value was calculated together with the calibration curve
into the total amount of mercury in ng per cycle. The kinetics of Hg biotransformation (ν) was
expressed as Hg2+ cell-1 min-1.
ν=Hg2+ (ng)/0.6 ml culture* cells (no. ml-1)*3.2 minutes = ng Hg2+ cell-1 minute-1
5.2.3. Removal of cadmium and lead by MRB:
Two sets of separate experiments were carried out for determining the removal of Cd and Pb.
CH07, GP06 were used in the experiment with Cd whereas CH07, GP13 and S3 were used in the
experiment with Pb. A sensitive strain CH05 was used in all cases as a negative control.
Once every 24 hour, one ml sample was withdrawn aseptically into two sets. One set of sample
was centrifuged at 13,000 rpm for 15 minutes at 24ºC. The supernatant was filtered through
preweighed 0.22 µ membrane filters and the filtrate was diluted (10 x dilution) with 10% HNO3
for estimation of the heavy metals (either Cd or Pb) from the medium. The pellets were treated
overnight using 1N HCl and further treated including a sonification step twice for 45 seconds
followed by centrifugation at 10,000 rpm for 5 minutes. The supernatant was collected and
diluted with 10% HNO3 for estimation of heavy metals (either Cd or Pb) accumulated by the
cells. The cell pellets were dried for 48 h at 70 °C and weighed for noting bacterial biomass. The
Cd concentrations were determined by inductively coupled plasma -atomic emission
spectrometry (ICP-AES) and Pb was measured using atomic absorption spectrophotometry
(AAS) following manufacturer’s protocols. Their concentrations were calculated using proper

123
blanks (the growth medium after diluting with 10% HNO3 in the same way as was done for the
samples) and several standards ranging from 5 ppm to 20 ppm were used for calibration.
5.2.3.1. Biomass measurement:
One ml sample was always withdrawn aseptically when taking samples for Hg concentration
determination and was centrifuged at 10,000 rpm for 5 minutes at 4° C. The dry weight of the
cell mass was used in calculating accumulation of heavy metals per unit biomass and also the
removal rate of Cd and Pb by cell mass was calculated using the results obtained from the ICP-
AES and AAS analyses.
5.2.4. SEM and EDS analyses:
Ten ml broth culture was centrifuged at 10,000 rpm at 4º C for five minutes. The pelleted cells
were washed twice with 0.1 M phosphate buffer solution (PBS; pH 7) and were fixed for
overnight in 2% glutaraldehyde (Roane, 1996). The cells were washed again with PBS and then
distilled water before further processing. The cells were dehydrated through a series of different
concentrations (10% to absolute) of ethanol by holding them in each concentration for half an
hour. The cells were fixed onto a brass stub, sputter-coated with gold and scanning electron
microscopy (SEM) was carried out. Energy dispersive x-ray spectroscopy (EDS) was carried out
to detect Cd and Pb and their compounds adsorbed to the cell surface, precipitated on the cell
membrane or entrapped in the extracellular polymeric substances (EPS) produced by the cell.
5.2.5. Protein concentration and profile of MRB exposed to Hg and Cd:
In order to quantify the protein concentration and to qualitatively detect the expression, if any, of
metal binding proteins, the following experiments were carried out. Cultures of GP06, GP14,

124
GP15, GP16, CH07, GO02, were grown in the medium amended either with Hg (1 and 25 ppm)
or Cd (10, 50 ppm) with suitable control with no metal solutions added to the medium. Three ml
of the broth culture was removed from each flask and centrifuged at 10,000 rpm at 4ºC for 5-10
minutes. The supernatant was discarded and 1 ml lysis buffer (QC buffer) was added to the pellet.
The pellets were sonicated for a total of 2 minutes (4 times for 30 seconds each time with a gap
of 30 seconds between successive sonications). The sonicated sample was centrifuged at 5000
rpm at 4° C for 2 minutes. Two hundred microlitres of this supernatant was incubated with 1600
µl acetone (always stored at -20° C) for 30 minutes at 4° C. The precipitated protein was dried
under the clean bench for nearly 20 minutes. Five hundred microlitres PBS was added to this
precipitated protein for brining it into solution. The protein was estimated using 1mg ml-1 bovine
serum albumin (BSA) with BIORAD protein estimation kits following manufacturer’s protocol.
The BIORAD protein estimation kit used during the Hg experiment was based on the Bradford
method (Bradford, 1976). Whereas, method of Lowry (1970) was followed for protein
estimation from experimental cultures exposed to Cd. Equal amount of protein samples were
loaded and SDS- PAGE (Lamelli, 1951) was run using 15-150 KDa and 10-225 KDa protein
markers (perfect protein marker, Novagen). The gels were stained overnight in comassie blue,
fixed in 10% acetic acid and destained in distilled water prior to scanning for documentation.
5.3. RESULTS:
5.3.1. Growth of MRB in heavy metals:
In medium amended with mercury:
The MRB showed a diauxic growth response when exposed to mercury. Details of these
observations are already presented in chapter 3 (see Figure 3.1).

125
In medium amended with cadmium:
The growth curves of both the isolates (CH07 and GP06) showed similar growth response
(Figure 5.1.1). Both the isolates showed a lag phase of nearly 6 h and they reached the stationary
phase around 48 hours after having an exponential growth phase for ca. 18 h. There was no
growth in the negative control (isolate CH05) in presence of Cd even after 48 hours vis a vis
normal growth in medium without Cd. Toxic effect of Cd was hardly discernible on the growth
of two MRB isolates tested.
In medium amended with lead:
All three MRB isolates (CH07, GP13 and S3) grew quite spontaneously in presence of Pb in the
SWNB (Figure 5.1.2). All the isolates reached the stationary phase around 24 h and there was
almost no difference in the test condition from that of the controls. The negative control (CH05)
did not grow in presence of lead also as was the case with the other two heavy metals.
5.3.2.1. Volatilization of Hg:
The foggy areas on the XAR plate denoted the reaction of silver (Ag) reduction by the Hg vapor
as seen in the photograph (Figure 5.2.1). All isolates tested during this study (viz. GP15, CM10,
CH07, GP08, GP13, GO02, GP16, GP17, GP14, GP06 and CH13) volatilized mercury from the
assay medium though all of them were not positive for merA. The negative control showed
indication of no Hg vapour.
5.3.2.2. Kinetics of Hg removal:
CH07 was able to remove mercury by means of volatilization from the M9 assay medium
containing 20 ppm (≡100 µM) mercury. The highest removal rate was in the reaction with 1 ppm

126
Hg concentration though the removal rate was quite good up to 8 ppm (i.e., 40 µM) Hg in the
medium (Figure 5.2.2.2) with removal concentrations as high as 1.16x10⁻⁶ ng cell-1 min-1. P.
putida showed the fastest removal rate when compared to the other two isolates (Figure 5.2.2.3)
and it was discernible that all three isolates had high removal rates at 1 ppm (5 µM) Hg
concentration. More importantly, Hg removal rate increased with increasing concentrations of
NaCl (Figure 5.2.2.4.). The marine pseudomonad CH07 was most efficient at a high salt
concentration of 30 g l-1. Bro12 (P. aeruginosa) was most efficient at salt concentrations of 20-
25 g l-1 NaCl whereas P. putida (P. putida KT2442 mer::73) had its best removal efficiency at
moderate salt concentrations of 12-15 g l-1 NaCl.
5.3.3. Removal of Cd and Pb:
The pseudomonad CH07 removed Cd at a faster rate from the medium during the first 48 hours.
After the third day, the removal of Cd by both the isolates (viz, CH07 and GP06) was almost
similar (Figure 5.3.1.1). In medium amended with 100 ppm Cd, the concentration in the
medium was reduced to 17.41 ppm by CH07 and 19.19 ppm by GP06 (A. faecalis) in about 72 h
and the maximum accumulation of Cd in the biomass was observed within 72 hours
corroborating with the removal rate (Figure 5.3.1.2). GP06 removed >70% Cd and, CH07 was
also equally efficient removing >75% from growth media containing 100 ppm Cd.
All three strains of MRB were able to remove Pb from the growth medium. In case of CH07 the
concentration of Pb in medium amended with 100 ppm Pb reached as low as 1.8 ppm (>98%
removal) in 96 h and it was found to be entrapped in the extracellular polymeric substances (EPS)
as revealed by the SEM and EDS (Figure 5.4.3.2. and 5.4.6). GP13 (B. iodinium) and S3 (B.

127
pumilus) precipitated lead in the sulfide form (5.3.2.3) removing more than 87 and 88% during
the same period.
5.3.3.1. Biomass:
The dry weight of the bacterial biomass changed in accordance with the growth phase. The
biomass in the later stage showed marginal increases in case of CH07 probably due to the
production of EPS and entrapment of heavy metals into the biomass and also due to precipitation
of the heavy metals on the cell surface. The biomass of CH07 reached as high as 19.2 mg ml-1 in
the SWNB with Cd whereas it was higher in case of GP06 with 21.3 mg ml-1. Increased
concentration of toxic metals bore no specific effect on biomass. In the experiment with Pb, the
maximum biomass of 5.5 mg ml-1 was attained by CH07 whereas, GP13 and S3 had a biomass
each of 4.8 and 2.3 mg ml-1 respectively.
5.3.4. SEM and EDS:
From the SEM photographs and EDS signature it was evident that the Cd was mostly entrapped
in the EPS in case of both the isolates (Figures 5.4.1.1 to 5.4.2.2). This could be due to efflux
commonly seen in gram-negative bacteria as a detoxification measure. Extracellular matrices
with negative charges form metal complexes so as to confer resistance to the cell. Lead was
precipitated as sulfide in case of GP13 and S3 (Figure 5.3.2.3) whereas, it was entrapped in the
EPS of CH07 (Figure 5.4.3.1 and 5.4.3.2). The EDS of the cell masses showed the concentration
of Pb as high as 21% and the Cd had a percentage signal of 19%, when the added concentrations
in the growth medium was 100 ppm (0.01%). Bacteria grown in medium without these heavy
metals showed no signals of either of Cd or Pb in the EDS analyses.

128
5.3.5. Protein concentrations and profiles:
As a detoxification response, there were changes in protein concentrations in case of all the
isolates exposed to 1-25 ppm Hg. There was an increase in the total protein concentration in the
medium with mercury though the amount did not increase with further increasing concentration
of Hg (Figure 5.5.1.1). The SDS-PAGE revealed that one fragment of protein corresponding to
75 KDa disappeared from all the tested isolates when exposed to Hg (Figure 5.5.1.2 and 5.5.1.3).
The two isolates exposed to Cd also showed a similar trend (Figure 5.5.2). There was an increase
in the total protein concentration when there was Cd in the medium, but similar to the
observations from Hg effect, protein concentration did not increase with increase in the
concentration of Cd. The protein profile showed appearance of new band in the test condition,
which were absent in case of the control condition (Figure 5.5.2).
5.4. DISCUSSION:
Microorganisms have a high surface area-volume ratio because of their small size and therefore
provide themselves with a large contact area that can interact with matter in the surrounding
environment. There are many approaches for the use of bacteria to remove heavy metals from the
environment: bioaccumulation and bioabsorption, oxidation and reduction, methylation and
demethylation, and ligand degradation by bacteria (Bolton & Gorby, 1995). Lower costs and
higher efficiency at low metal concentrations make biotechnological processes very attractive in
comparison with physicochemical methods for heavy metal removal (Gadd, 1992). Among the
principal pollutant transformation processes, microbial degradation/biotransformation may be the
most efficient way for removal of chemical pollutants and their toxicity from the environments.
Until recently, the interest was focused on technologies that could be applied to achieve in situ

129
immobilization of metals (Roane et al., 1996). However, within the last few years, the focus has
begun to shift towards the actual metal removal, because it is difficult to guarantee that metals
will remain immobilized indefinitely (Roane et al., 1996).
Silver (1996) summarized the mechanisms of bacterial resistance to heavy metals as follows:
i) bacteria have specific genes for resistance to the toxic ions including Ag+, AsO2-, Cd2
+,
and Hg2+ and there is no general resistance mechanism to all heavy metals;
ii) metal-ion resistance have been found on plasmids as well as chromosomes of all
eubacterial group tested;
iii) the mechanisms of resistance are generally efflux pumping (removing toxic ions that
enter the cell by means of transport systems evolved for nutrient cations or anions) and enzymatic
detoxification (generally redox chemistry) converting a more toxic to a less toxic or less available
metal-ion species. It seems that the metabolic penalty for having more specific uptake pump is
greater than the genetic cost of having plasmid genes in the population that can spread and
become induced. Efflux pumps are the major currently known group of plasmid resistance
systems.
Several studies have shown that metals are more toxic when they are in liquid medium than in
agar medium (Chang et al., 1993; Inhoue et al., 1996). The pH dependence of microbial metal
accumulation can be entirely different, both between metals and between organisms (Ledin,
2001). The pH-dependence of anions is generally significantly different from that of cations. As
pH increases, functional sites on the microbial surface become deprotonated and may bind
cationic metals instead. This results in the common trend of increasing accumulation of metals
with increasing pH. However, in many cases, the accumulation at higher pH is smaller (Ledin,

130
2001). So, in all the experiments carried out in this thesis, a near neutral pH (7-7.5) was
maintained to minimize this effect of pH.
Bacterial chromosomes contain genes for resistance to many heavy metal cations and oxyanions,
as do plasmids or other genetic elements (Silver & Phung, 1996). Detoxification of mercury by
enzymatic reduction was proposed more than three decades ago (Summers & Silver, 1972) and, it
has been realized later that the mer operon -conferring both resistance and detoxification
capabilities to its possessor- is almost universally distributed in resistant bacterial populations
(Summers & Silver, 1978; Robinson & Tuovinen, 1984; Osborn et al., 1997; Barkay et al., 2003).
Okino et al. (2002) studied the effect of initial cell concentration of removal of HgCl2 and
concluded that the removal rate increased with increasing initial cell concentrations. Rasmussen
et al. (1997) reported that the expression of mer operon was increased at lower cell density due to
a reduction in the number of cellular binding sites that may compete with the MerR for binding
of the inducer, Hg2+. In the present study, it was found that the removal rate was the highest at
low Hg concentration, and it reduced with increasing Hg concentration. However, the removal
rate was quite effective upto a concentration of 8 ppm of Hg from the minimal medium used in
all the detoxification experiments for this study. Genetically engineered E. coli strain with Hg2+
transport system and metallothionein has been used to bioaccumulate mercury from wastewater
(Deng & Wilson, 2001). High concentrations of NaCl, causing less bioavailability of metal
usually inhibit the volatilization of mercury by bacteria (Selifonova & Barkay, 1994; Barkay et
al., 1997). At the NaCl concentrations of 35ppt all the merA positive isolates vaporized Hg. This
is pointing to the possibility of marine MRB potential to deal with Hg toxicity. Indeed, there are
many halophiles tolerant to Hg (Harithsa et al., 2002), which might be accomplishing the survival
in their extreme environment. The ‘multiutilitarian’ Deinococcus radiodurans has been

131
engineered to remediate radioactive mixed waste containing mercury as a contaminant (Brim et
al., 2000), which detoxifies Hg through vaporization.
There was no clear relation between the percentage of Cd bioabsorbed by the microorganisms
and the Cd concentration in the medium. This phenomenon may be explained by the role of the
microbial metabolism onto the bioabsorption (Nies, 1999). The Cd concentrations play a major
role in bioabsorption. Although molecular analyses examining the Cd resistance mechanisms
were not attempted during this study, it is quite likely that one or several of the following
mechanisms reported in literature do operate in the marine MRB isolates examined during this
study.
Liesegang et al. (1993) reported that Alcaligenes eutrophus CH34 harbours numerous heavy
metal resistance determinants including three for mercury resistance, one for chromate resistance
and two for divalent cations called czc (for Cd2+, Zn2+ and Co2+ resistances) and cnr (for Co2+ and
Ni2+ resistances). Czc is an efflux pump (Nies et al., 1989) that functions as a chemio-osmotic
divalent cation/proton antiporter (Nies, 1995; Nies & Silver, 1995). Homologues of the czc
genes, called czr, which conferred cadmium and zinc resistance, were recently identified in
Pseudomonas aeruginosa genomic DNA and appear to be highly conserved in environmental
isolates of that species (Hassan et al., 1999). Mutational analysis indicated that cadA and cadR
are fully responsible for cadmium resistance and partially for zinc resistance (Lee et al., 2001).
P. aeruginosa CW-96-1 was shown to grow well aerobically upto 5 mM Cd in a medium
containing citrate and S2O32- (Wang et al., 1997). A Klebsiealla planticola strain (Cd-1) has been
reported to grow anaerobically at high Cd concentration (15 mM) and precipitate CdS (Sharma et

132
al., 2000). Lebeau et al. (2002) was unable to grow the bacterium ZAN-044 at a Cd concentration
of 10 mg l-1 (ppm). But, Bang et al. (2000) achieved 98% removal of Cd from medium with 150
µM Cd and 91% from medium with 200 µM Cd by using a strain of Escherichia coli. P.
aeruginosa PU21 has been able to uptake 58 mg Cd g-1 dry wt (Chang et al., 1997). Two most
resistant isolates Bacillus H9 and Pseudomonas H1 were highly resistant upto 275 and 225 µg
ml-1 of soluble Cd respectively (Roane & Pepper, 2000).
The resting cells of P. aeruginosa PU21 (Rip64) have been reported to take up upto 110 mg Pb g-
1 dry cell mass whereas, the inactivated cells could absorb 70 mg Pb g-1 dry cell (Chang et al.,
1997). The P. aeruginosa PU21 (Rip64) was reported to adsorb Hg2+ upto 400 mg Hg g-1 dry cell
mass and this adsorption might have originated from the cysteine-rich transport proteins
associated with the cell membrane and the adsorption efficiency of the biomass reached its
maxima at a low pH of 2 (Chang et al., 1997). As mentioned earlier, it is quite likely that the
multi-metal resistant strains such as CH07, GP14, GP15, GP16 and GP06 possess the genetic
components for dealing with many toxic metal ions.
From the SEM photographs and EDS signal it was evident that the Cd was mostly entrapped in
the EPS in case of both the isolates. This could be due to efflux commonly seen in gram-negative
bacteria as a detoxification measure as reported by Nies (1999). The EDS was not successful in
detecting Hg as, the sputter coating by gold (Au), overlapped the Hg signal.
There are numerous practical reasons for selectively separating heavy metal ions of all types from
aqueous media. A few obvious examples are the remediation of hazardous or radioactive wastes,
remediation of contaminated groundwater, and recovery of precious and/or toxic metals from

133
industrial processing solutions. A variety of well-known techniques are available to the chemists
or engineers for these tasks, including solvent extraction, ion-exchange chromatography, and
precipitation. In modern applications of these techniques, recovery and re-use of the extractant
materials is becoming more and more important. This is being driven by tougher environmental
regulations, the high initial costs of new, more effective and more selective extractants, and the
need to minimize the volume of waste destined for permanent disposal. Already proven to be
economical, bioremediation by marine bacterial means for detoxification of metals holds
promise. Results from the present study clearly demonstrate the possibilities of employing them
for metal detoxification/recovery and even sequestration under special circumstances. Further,
leads from this study can be explored to adapt marine bacteria for bioremediation under various
situations.

134
CH07
8
9
10
11
0 6 12 24 48 72 96 168
Time (hr)
Log
cell
no (m
l-1)
100 ppm50 ppm10 ppm0 ppm
GP06
8
9
10
11
0 6 12 24 48 72 96 168Time (hr)
Log
cell
no (m
l-1)
100 ppm50 ppm10 ppm0 ppm
Figure 5.1.1. Growth patterns of the isolates subjected to different concentrations of Cd.

135
Figure 5.1.2. Growth patterns of the isolates subjected to different concentrations of Pb
CH07
8
9
10
11
0 12 24 48 72Time (hr)
Log
cell
no m
l-1
100 ppm50 ppm10 ppmcontrol
GP13
8
9
10
11
0 12 24 48 72Time (hr)
Log
cell
no m
l-1
100 ppm50 ppm10 ppmcontrol
S-3
8
9
10
11
0 12 24 48 72Time (hr)
Log
cell
no m
l-1
100 ppm50 ppm10 ppmcontrol

136
Plate 5.2.1. Mercury volatilization by MRB as visualized on Kodak XAR film Upper row (from left to right): GP15 (A.faecalis); CM10 (Bacillus sp.); CH07 (P.aeruginosa); GP08 (B.iodinium); +ve control (P. putida KT2442::mer73); Middle row: GP13 (B.iodinium); GO02 (A. faecalis); GP16 (A. faecalis); GP17 (A. faecalis); GP14 (B. iodinium); Lower row: mercurated PBS used in the experiment, non MRB isolate(-ve control), 3C (Virgobacillus panto), GP06 (A. faecalis), CH13 (B.pumilus)

137
Figure 5.2.2.1. Set up of the Hg-kinetics system
0
100
200
300
400
1 2 4 8 10 20
Hg (ppm)
Tra
nsfo
rmed
Hg
(ng)
Hg (ng)
Figure 5.2.2.2. Hg biotransformation by CH07
Exit
Carrier gas
Magnetic stirrer
Water bath
Printer
Motor ventilator
Connecting ventilator
Reaction vessel with syringe

138
Figure 5.2.2.3. Rates of Hg removal by CH07, P.pudida KT 2442 mer::73, Bro12
Figure 5.2.2.4. Effect of NaCl on Hg removal rate by different experimental strains
0.0E+00
1.0E-06
2.0E-06
3.0E-06
4.0E-06
5.0E-06
6.0E-06
7.0E-06
1 2 4 8 12 20Hg (ppm)
Hg
rem
oval
(ng
cell-1
min
-1)
CH07Bro12P.putida
0.0E+00
1.5E-06
3.0E-06
4.5E-06
6.0E-06
7.5E-06
5 10 12 15 18 20 25 30
NaCl (g l-1)
ng H
g ce
ll-1 m
in-1
CH07P.putidaBro12

139
CH07
0
25
50
75
100
0 24 48 72 96
Time (hr)
Cd
(in p
pm) i
n m
ediu
m
GP06
0
25
50
75
100
0 24 48 72 96Time (hr)
Cd
(in p
pm) i
n m
ediu
m
10 ppm50 ppm100 ppm
Figure 5.3.1.1. Removal of Cd from medium by different MRB when grown in different concentrations

140
Figure 5.3.1.2. Cell biomass associated quantities of Cd (µg g-1 dry wt. h-1) by marine MRB strains from the media containing different concentrations of this toxic metal.
CH07
0
20
40
60
80
100
24 48 72 96
Time (hr)
Cd
(!g
gm-1
dry
wt.
h-1)
10 ppm50 ppm100 ppm
GP06
0
30
60
90
120
150
24 48 72 96
Time (hr)
Cd
(!g
gm-1
dry
wt.
h-1)
10 ppm50 ppm100 ppm

141
Figure 5.3.2.1. Cell biomass associated quantities of lead by different MRB strains grown in media with various concentrations of Pb.
CH07
0
0.1
0.2
0.3
0.4
0.5
24 48 72 96
Time (hr)
ug P
b gm
-1 b
iom
ass h
r-1
10 ppm50 ppm100 ppm
GP13
0
0.1
0.2
0.3
0.4
0.5
24 48 72 96Time (hr)
ug P
b gm
-1 b
iom
ass h
r-1
10 ppm50 ppm100 ppm
S-3
0
0.1
0.2
0.3
0.4
0.5
24 48 72 96Time (hr)
ug P
b gm
-1 b
iom
ass h
r-1 10 ppm50 ppm100 ppm

142
Figure 5.3.2.2. Removal of Pb from medium by different MRB when grown in different concentrations
CH07
0
25
50
75
100
0 24 48 72 96
Time (hr)
Pb (p
pm) i
n m
ediu
m10 ppm50 ppm100 ppm
GP13
0
25
50
75
100
0 24 48 72 96Time (hr)
Pb (p
pm) i
n m
ediu
m 10 ppm50 ppm100 ppm
S-3
0
25
50
75
100
0 24 48 72 96Tine (hr)
Pb (
ppm
) in
med
ium
10 ppm50 ppm100 ppm
143
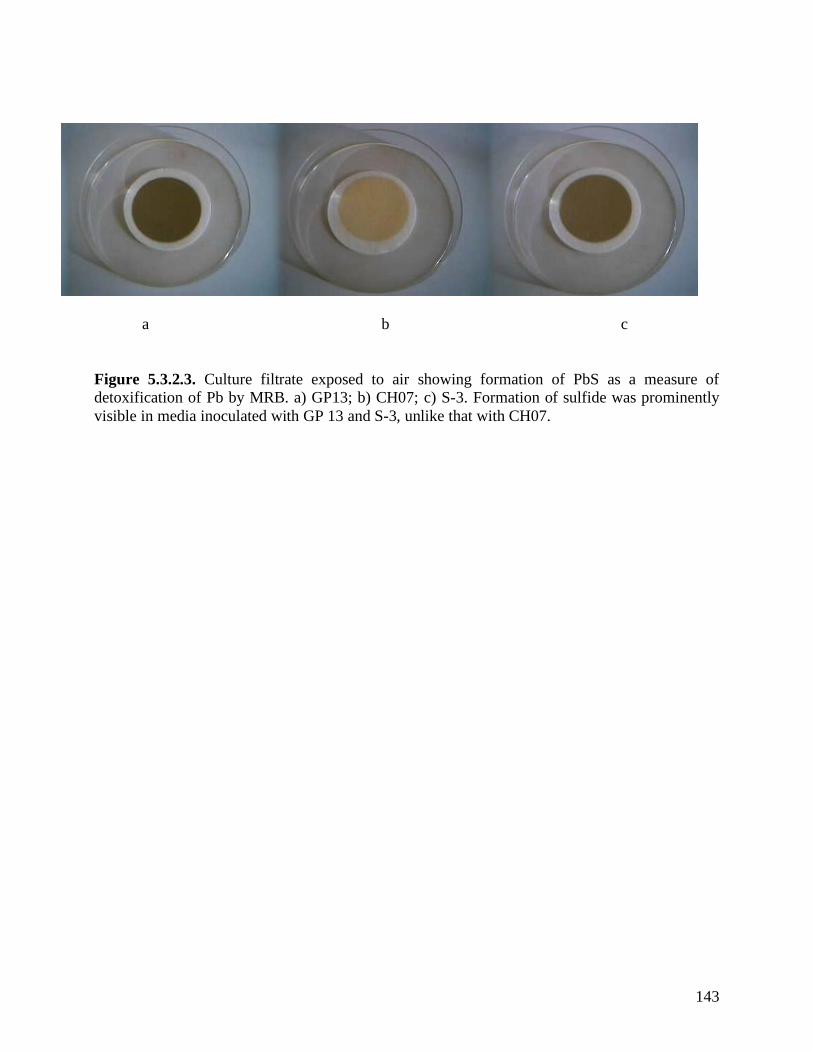
a b c
Figure 5.3.2.3. Culture filtrate exposed to air showing formation of PbS as a measure of detoxification of Pb by MRB. a) GP13; b) CH07; c) S-3. Formation of sulfide was prominently visible in media inoculated with GP 13 and S-3, unlike that with CH07.

144
Figure 5.4.1.1. SEM photograph of CH07 grown in normal seawater nutrient broth (i.e.,) without
any heavy metal salts.

145
Figure 5.4.1.2. SEM photograph of CH07 grown in seawater nutrient broth containing 100 ppm Cd.
Figure 5.4.2.1. SEM photograph of GP06 grown in normal seawater nutrient broth
Figure 5.4.2.2. SEM photograph of GP06 grown in seawater nutrient broth containing 100 ppm Cd.

146
Figure 5.4.3.1. SEM photograph of CH07 grown in normal seawater nutrient broth
Figure 5.4.3.2. SEM photograph of CH07 grown in seawater nutrient broth containing 50 ppm Pb.

147
Figure 5.4.4.1. SEM photograph of GP13 grown in normal seawater nutrient broth
Figure 5.4.4.2. SEM photograph of GP13 grown in seawater nutrient broth containing 50 ppm Pb.

148
Figure 5.4.5.1. SEM photograph of S3 grown in normal seawater nutrient broth
Figure 5.4.5.2. SEM photograph of S3 grown in seawater nutrient broth containing 50 ppm Pb.

149
Figure 5.4.6. EDS showing presence of Pb in the cell precipitate of GP13
Figure 5.5.1.1. Change in total protein concentrations in MRB grown in different concentration of Hg
0
0.1
0.2
0.3
GO02 GP06 GP14 GP15 GP16 CH07
MRB
Prot
ein
(mg
ml-1
)
0 ppm1 ppm25 ppm

150
Figure 5.5.1.2. SDS-PAGE protein profile of MRB showing effect of Hg. From left to right; lane 1, marker (10-225 KDa); 2-4, GP15 (no Hg, 1 ppm Hg, 25 ppm Hg); 5-6, GP16 (no Hg, 1 ppm Hg); 7, marker (15-150 KDa); 8, Gp16 (25 ppm Hg); 9-11, CH07 (no Hg, 1 ppm Hg, 25 ppm Hg)
Figure 5.5.1.3. SDS-PAGE protein profile of MRB showing effect of Hg. From left to right; lane 1, marker (15-150 KDa); 2-4, GO02 (no Hg, 1 ppm Hg, 25 ppm Hg); 5-7, GP06 (no Hg, 1 ppm Hg, 25 ppm Hg); 8-10, GP14 (no Hg, 1 ppm Hg, 25 ppm Hg)

151
Figure 5.5.2. SDS-PAGE protein profile of two MRB showing their response to Cd. From left to right; lanes 1-3,GP06- no Cd, 10 ppm Cd, 100 ppm Cd and 4-6, CH07- no Cd, 10 ppm Cd, 100 ppm Cd, 7, 15-150 KDa marker (Perfect protein marker, Novagen), 8, 10-225 KDa, marker (Perfect protein marker, Novagen)