Embed Size (px)
Citation preview

-1-
5 Wide Area Monitoring and Control
The Use of Synchrophasors for Wide Area Monitoring of Electrical Power Grids
Luis Fabiano dos Santos1*, Galina Antonova2, Mats Larsson3, Sergio Fujii4(1) ABB Switzerland Ltd, Switzerland
(2) ABB Inc., Canada (3) ABB Corporate Research, Switzerland
(4) ABB SA Systems, Brazil *[email protected]
KEYWORDS Wide Area Monitoring Systems, Synchrophasors
Abstract This paper describes the latest developments in the wide area monitoring of electrical power grids, based on IEEE C37.118.1-2011 synchrophasor measurements. It outlines the fundamentals of synchrophasor systems, and focuses on the latest technological advancements and practical applications deployed in the existing and emerging power grids.
With the emphasis on higher utilization of power systems while maintaining high systems reliability and availability, dynamic monitoring of the power systems’ operation remains to be important, and challenging. Analysis of recent blackout events showed multiple systems vulnerabilities and improvement areas. The use of synchrophasor measurements system-wide or on a smaller scale could provide significant assistance and risk mitigation to these tasks.
Introduction of synchrophasor measurements as well as advances in communications and processing power made it technically feasible to monitor the stability of the power system on-line in near real-time, using a wide area perspective. Stored synchrophasor data can also be used for off-line analysis of past events, or serve as an input for calibration and verification of the dynamic models of systems components. The main aspects of both on-line monitoring and off-line analysis are summarized in the paper.
Synchrophasor-based applications discussed in the paper include phase angle monitoring, voltage stability monitoring, line thermal monitoring, power oscillation monitoring and phasor-enhanced state estimation. The applications that are currently in operation, planning and pilot project stages will also be presented.
Finally, practical considerations on projects execution are covered, including guidance on Phasor Measurement Unit (PMU) functionality, locations, hardware selection, time synchronization options and common challenges in phasor deployment.
1 Introduction Consider the ability to measure the voltage magnitude and phase angle at every system bus and current magnitude and phase angle at every branch (lines, transformers and other series elements) in the power system network simultaneously and continuously and having them instantly available where we need them when we need them [1]. This is the exactly the approach of Wide Area Monitoring Systems using Synchrophasors.
The Wide Area Monitoring System (WAMS) consists of geographically dispersed Phasor Measurement Units (PMUs) delivering Synchrophasors, i.e., time-tagged data samples of a power system’s sinusoidal voltage or current using a standard time signal as the reference, to Phasor Data Concentrators (PDCs). These PDCs perform the desired signal handling and assembly of synchronized phasor measurements into snapshots. They may also facilitate long-term storage in high-resolution historical archives. The data in each PMU are time-synchronized to Universal Coordinated Time (UTC), for example via Global

-2-
Positioning System (GPS) receivers – with an accuracy of one microsecond – and stored in PDCs. The phasors measured simultaneously provide snapshots of the state of the monitored nodes. By comparing these snapshots, not only during steady state, also the dynamic state of critical nodes in transmission, sub-transmission and distribution networks can be observed. [1]
The concept of WAMS was first introduced in the 1980’s, and the first commercial products and software tools became available in the 1990’s. Since then many investigations and pilot projects were developed in several utilities. In some of them the wide area system was fully implemented, with clear results and return of investments. But many markets and customers were not prepared for the full deployment of this technology, both from an organizational and financial point of view, although most of them have understood the potential benefits.
Today’s increased pressure on utilities all over the world to integrate distributed and renewable power generation (e.g. wind power) creates a higher demand for WAMS, Figure 1.1. The observed migration from traditional power grids towards a decentralized power generation model will create the need for improved monitoring tools. The multi-directional power flow associated with the intermittent renewable power generation requires the operation to be based more on real-time data, and the WAMS is one of the best approaches to handle these requirements.
Figure 1.1 : From traditional to future grids
The more recent emergence of Smart Grid concepts is another fundamental aspect to bring further discussions and deployment of the synchrophasors technology, associated with the real possibility of on-line monitoring applications. The remarkable usage of Flexible AC Transmission Systems (FACTS) and HVDC technology in modern power systems is another important factor that brings further needs regarding monitoring and control based on wide area information, as shown in Figure 1.2. Besides, the synchrophasor technology is now more mature and better understood. The communication infrastructure required for wide area monitoring systems has also reached a higher level within and between power utility companies. Therefore we can now see the first utilities moving from small-scale pilot projects to full deployment of phasor measurement technology.

-3-
Figure 1.2 : Industry challenges and demand for WAMS
2 Fundamentals of Synchrophasor Technology A phasor represents a complex quantity whose angle changes with time normally at a constant rate. It is easily understood by first understanding Euler’s formula for complex analysis. The quantity ejx is a unit vector (complex number) that is the orthogonal projection of the sine and cosine wave with the amplitude of 1. It “rotates” counterclockwise at a constant speed with the sine and cosine waves. The phasor angle is cyclical with its reference (zero) angle the positive real (Re) axis. Hence the distinction between a phasor and a vector is that a phasor rotates with time and a vector has a fixed magnitude and angle.
Similarly, a phasor can be referenced to a time source that is synchronized to a specific frequency. The phase angle, , of a function f(t) = Acos(t + ) is relative to a cosine function at nominal system frequency synchronized to Coordinated Universal Time (UTC). Basically a new one second pulse is generated where the reference cosine function at its maximum positive value. The phase angle of f(t) is defined to be 0° when the maximum of f(t) occurs at the UTC second rollover [1 pulse per second (PPS) time signal], and –90° when the positive zero crossing (from negative to positive) occurs at the UTC second rollover. A synchrophasor is defined as a phasor that is calculated from “time-tagged” data samples of a power system sinusoidal voltage or current using a standard time signal as the reference for the measurement.
With today’s network and timing technology, synchrophasor measurements may be made from widely dispersed locations across the power system, giving us a snapshot of the system state at any near instant of time. Each phasor is computed within a PMU function from sampled voltage or current sinusodial wave data using Fourier transforms and time-tagged to a common clock reference as defined in IEEE Standard C37.118.1 – 2011. The synchrophasors are streamed from all the connected PMU’s at a reporting rate generally in the range of 10 to 60 reports per second and collected, time synchronized and archived by the PDC function and served with minimum latency to other client applications for system awareness monitoring, analysis, protection and control actions. This technology, which allows us to communicate and use time-synchronized data in local areas or from around the system, is opening the door to new opportunities for improved system monitoring, protection and control.
The phasor data concentrator could include applications that allow the display of measured and calculated values in real-time through a graphical interface. These applications typically allow the visualization of historical data from the database, as well as events and alarms. PDC deployments must be very flexible, allowing the presentation of data in real-time, historical data curves, polar phasor diagrams and other user-configurable information. The graphical user interface could use coloring functions for dynamic data in order to provide identification of normal, alarm and emergency conditions.
-4-
3 Standards on Synchrophasor Technology Current standard on Synchrophasors Measurements for Power Systems is IEEE C37.118.1-2011, see [8]. It replaced the previous standards namely IEEE C37.118-2005 [7] and IEEE Std 1344-1995 [6]. The new IEEE C37.118.1-2011 standard is based on IEEE C37.118-2005, but also includes dynamic tests, higher synchrophasor data reports, description of two PMU classes (Protection and Measurement) and improvements on reporting Time Traceability and Time Quality information, essential for accurate synchrophasor measurements. The standard has been divided into two parts: IEEE C37.118.1-2011 [8] that specifies the synchrophasor measurements, and IEEE C37.118.2-2011 [9] that specifies communications of the synchrophasor data. Both standards were approved and published in December 2011. It should be noted that IEEE C37.118.2-2011 standard does not cover cyber security.
IEC Technical Committee (TC) 57 Working Group (WG) 10 is responsible for the IEC 61850 suite of standards. Its new additions include IEC 61850-90-5 Technical Report on communications of synchrophasors data, see [10]. This Technical Report covers cyber security aspects, inclusion of synchrophasors data into IEC 61850 Logical Nodes, etc. The IEC 61850-90-5 Technical Report has been approved and published in May 2012.
To assist the synchrophasor community, especially the users of this technology, generation of an IEEE Guide on Synchronization, Testing and Calibration of Synchrophasors has been initiated in IEEE Power and Energy Society (PES) Power System Relaying Committee (PSRC) Working Group C5, see [13]. This guide, PC37.242, used five key North American Synchrophasor Initiative (NASPI) documents, updated and revised them appropriately. IEEE PC37.242 draft is currently undergoing the IEEE approval process, with sponsor ballot and first recirculation completed. Reviews lead to updates to multiple sections including addition of IEEE 1588 time synchronization, addressing testing of GPS receivers, etc.
Another effort that aims to assist the synchrophasor community is a generation of an IEEE Guide on functional requirements and testing for PDCs, led by the IEEE PES PSRC Working Group C4. This work used an initial input from NASPI documents, and progressed rapidly towards a complete revised document. It contains a description of PDC functions, guidance on performance requirements and testing [14]. The IEEE C37.244 draft passed Working Group ballot, and IEEE sponsor ballot. Comments resolution is currently underway.
An interesting effort on the use of synchrophasor for protective relay applications has been conducted by IEEE PES PSRC Working Group C14. This group generates a report with possible use cases of synchrophasors for protection of the power grids [15].
Multiple standardization efforts on synchrophasors present both challenges and opportunities. Challenges include possibly different specifications and/or interpretations by different standardization groups, and lack of approved and mature standards that made it very difficult for vendors to proceed with new product developments. On the other hand, the variety of standardization activities presents unique opportunities for cooperation and collaboration between different standardization bodies, and, arguably more importantly, the users and the vendors. Such cooperation enables the broader community to take a leadership role in shaping this technology in the most constructive and technically viable way beneficial for the power industry as a whole.
4 Wide Area Monitoring Systems The benefits of collecting phasors for post-analysis assessments are definitely recognized by several institutions, but the most important WAMS application is the on-line assessment of the power system stability, especially to supervise critical corridors. The monitoring systems based on synchrophasor measurements allow utilities to better understand the behavior and constraints of their power systems, and to prepare better remedial actions for future implementations. Run-time applications based on such measurements today are already available for monitoring. The synchrophasors can be communicated to SCADA/EMS systems in order to improve e.g. the quality of state estimation. Although highly sophisticated algorithms for automatic stability management are not yet wide commercially available as off-the-shelf products, the operator has at least a clear indication how far the system is away from a collapse and that he has to react in time. Also the first trials of closed loop wide-area stability controls have been performed in practice [16].
-5-
The advanced application of WAMS will enable the system load distribution to be directly measurable, allowing maximum safe load transfer. The system branch, load and shunt impedances can be directly verified to validate system models, and an accurate system state for anticipated contingencies can be instantly computed and prepared for abnormalities. The required actions can be readily identified and solutions promptly implemented. Furthermore, the WAMS allows secure access to these data at all hierarchical levels of the power system grid, i.e. in the substation, utility regional centers, utility operations centers, Independent System Operator (ISO) centers, and even at national or continental grids, where data can be acted upon accordingly in real-time or manually, and archived for future planning or event analysis. [1]
Following the experience gained with wide area monitoring systems, the wide area control and protection systems are slowly coming as a normal evolution results from the application point of view. The wide area monitoring with active response (control) brings more alternatives to improve even further the operation of the power system. For example, it will be possible to use the monitoring results to trigger or block local actions such as: blocking or changing tap changer control position, change of setting groups in protection relays, load and/or generation shedding, islanding detection and respective actions, etc. Another example for wide area control is the operation of FACTS with the results of the monitoring respectively synchrophasor data. This may be seen as a real new concept on the controlling the power system and, especially the power flow. A more specific example is the detection of power system oscillations with help of synchrophasor measurements and the use of FACTs for the related damping control [3]. Other examples of emerging applications include the use of phase angle differential protection and control based on synchrophasor measurements. These schemes allow integration of angle difference criteria into remedial action schemes and backup protection.
The wide area monitoring system is able to provide operators with processed data and alarms in the conventional SCADA/EMS system. The WAMS interface ideally is platform-independent and enables data access from different SCADA/EMS systems. The dynamic monitoring gives support for all operators and protection engineers by providing fast and exact information inside Network Control Center (NCC) system. Typically, it provides one of the following common protocols towards the NCC:
IEC60870-5-101 IEC60870-5-104 DNP 3.0
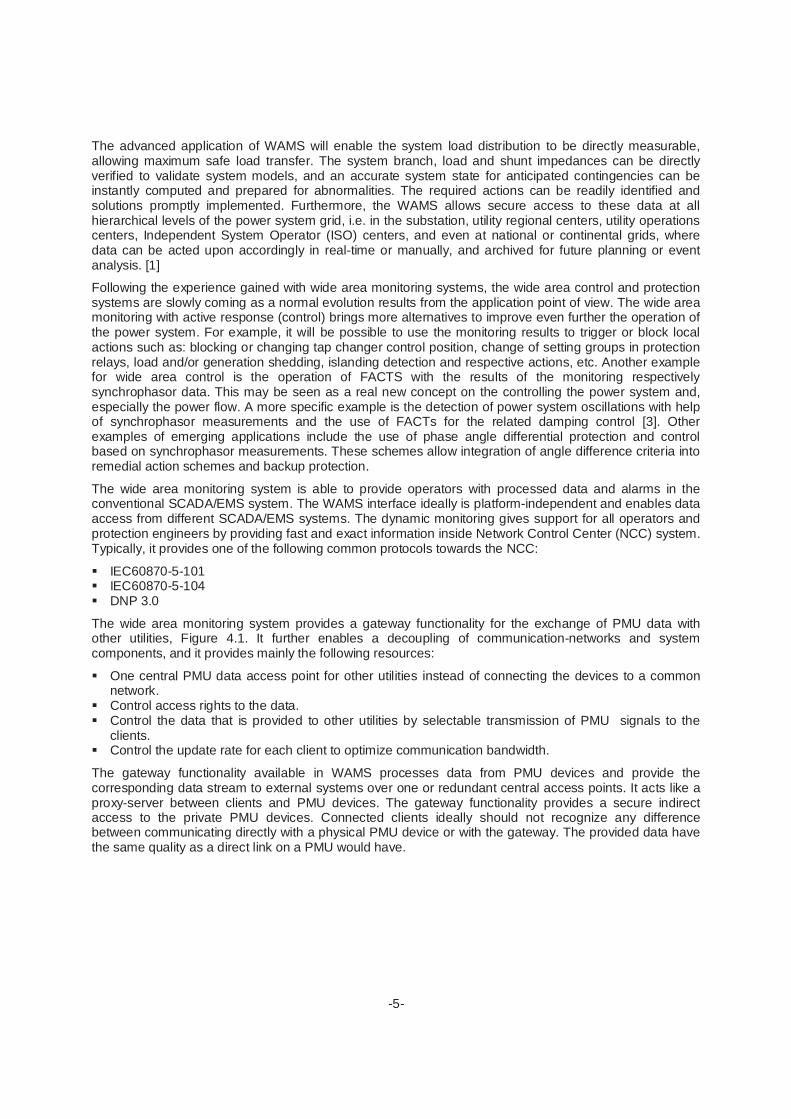
The wide area monitoring system provides a gateway functionality for the exchange of PMU data with other utilities, Figure 4.1. It further enables a decoupling of communication-networks and system components, and it provides mainly the following resources:
One central PMU data access point for other utilities instead of connecting the devices to a common network.
Control access rights to the data. Control the data that is provided to other utilities by selectable transmission of PMU signals to the
clients. Control the update rate for each client to optimize communication bandwidth.
The gateway functionality available in WAMS processes data from PMU devices and provide the corresponding data stream to external systems over one or redundant central access points. It acts like a proxy-server between clients and PMU devices. The gateway functionality provides a secure indirect access to the private PMU devices. Connected clients ideally should not recognize any difference between communicating directly with a physical PMU device or with the gateway. The provided data have the same quality as a direct link on a PMU would have.
-6-
Figure 4.1 : Exchange of PMU data among utilities and SCADA/EMS systems
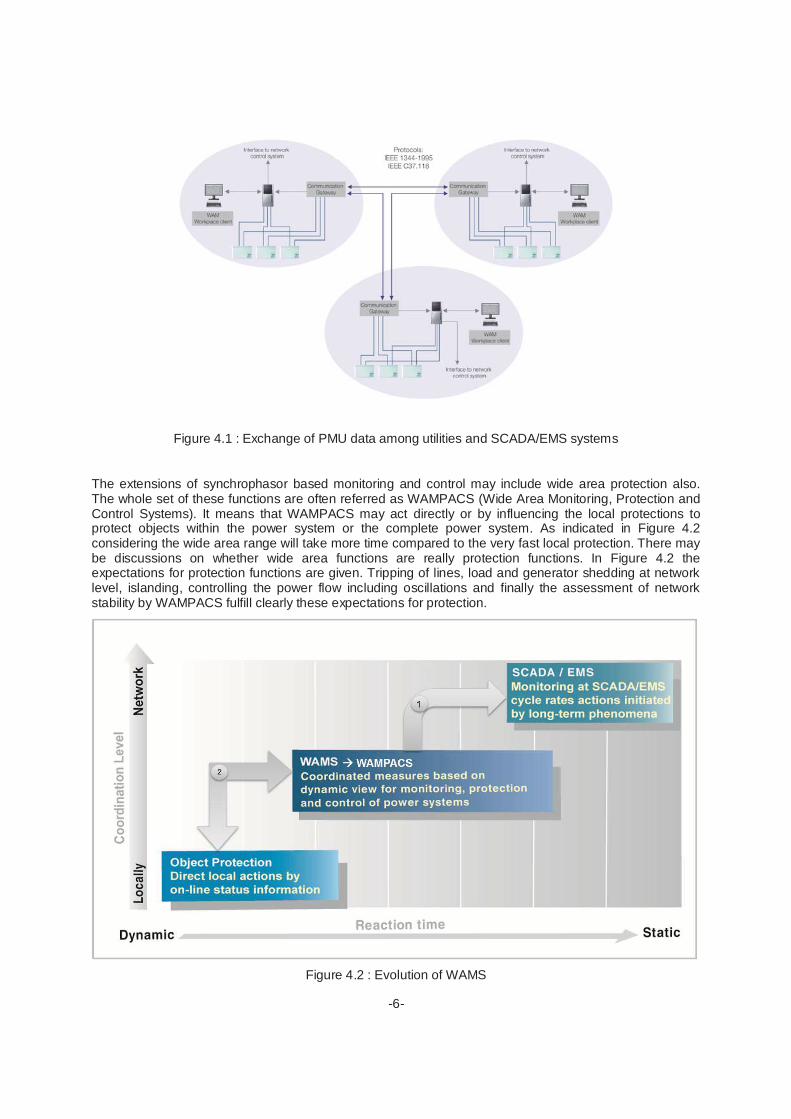
The extensions of synchrophasor based monitoring and control may include wide area protection also. The whole set of these functions are often referred as WAMPACS (Wide Area Monitoring, Protection and Control Systems). It means that WAMPACS may act directly or by influencing the local protections to protect objects within the power system or the complete power system. As indicated in Figure 4.2 considering the wide area range will take more time compared to the very fast local protection. There may be discussions on whether wide area functions are really protection functions. In Figure 4.2 the expectations for protection functions are given. Tripping of lines, load and generator shedding at network level, islanding, controlling the power flow including oscillations and finally the assessment of network stability by WAMPACS fulfill clearly these expectations for protection.
Figure 4.2 : Evolution of WAMS
-7-
5 Deployment and Practical Considerations The final goal of the WAMS is the ability of providing immediate indication of the power system status based on synchrophasor measurements and results of the on-line applications. As for any other system, the initial deployment of WAMS can use two different approaches:
1) Bottom-up: PMUs are available first, and the applications are developed or integrated later 2) Top-down: PMUs are specified and installed following the application requirements
The first case is found when PMUs are installed before the deployment of the applications. This can happen, for example, when the PMU functionality is integrated into protection or control devices, and the advanced applications were not considered at the time of the installation of the PMUs, or for stand-alone PMUs in pilot projects. In this approach the first target is to establish the required communication to such installed devices in order to collect and store the data.
The PMUs, or devices with PMU functionality, are then connected to some sort of PDC for data concentration and visualization. After, based on the application requirements, the PMU locations are evaluated for one or several applications, and depending on the results additional PMUs are installed. In such approach much of the attention is focused on the data collection and storage, and the main application is typically the Phase Angle Monitoring (PAM). This type of approach is found in several pilot installation initiatives, with the positive aspect of allowing a quick and simple investigation of the synchrophasor technology. On the other hand one must be aware that the PMU functions inside protection devices are connected to the same analog chain of the protection scheme. The deployment of some applications can also be limited.
In the second approach the allocation of PMUs, and their installation, is defined based on the foreseen applications intended for the power system, i.e., the PMU locations are derived based on the deployment of the applications. This is typically a more advanced approach, since the utility takes into consideration all the aspects of the system, and the reasons that justify the WAMS are identified in advance, with a clear goal to observe or solve a specific problem, or a combination of them. From this perspective also the number of PMUs to be installed is a result of such previous investigation, resulting in a good level of “observability” of the power system, especially when inter-area oscillations are likely to occur. Compared to the first approach it is interesting to note that, for example, the measurement selection of the Phase Angle Monitoring function is not a critical aspect of the implementation, and it is deployed as a natural result of the system configuration. Figure 5.1 shows an example of WAMS architecture and the possible deployment approaches.
Several tools, including power flow and stability studies, can be used to bring the conclusions of the best PMU locations that will serve the specific applications for the wide area monitoring. The placement of the PMUs along the system and the particular physical requirements and constraints of each installation are of concern. As the sensor unit providing the core information to the WAMS, the PMUs placement demands several considerations, including the amount of devices necessary for the intended monitoring functionality. For example, if the pre-study indicates that some transmission lines are likely to present overload during certain conditions, and that this overloading is to be monitored by the Line Thermal Monitoring (LTM) application from WAMS, then the immediate conclusion is that these lines will require the installation of PMUs in each of the line-ends. If the main interest of the synchrophasor applications is a future deployment of more advanced and improved state estimator based on WAMS, then the number of PMUs in the system can increase dramatically, and their allocation will probably need to be spread out along the power system.
Therefore, each application may bring its own requirement for the position and number of the PMUs in the power system. Additionally, one must observe that the installation of each PMU has also to take the physical aspects of local environment into consideration. More precisely, the available metering (protection) CT cores have to be evaluated for the applications. The CT ratio and the secondary value of 1A or 5A will immediate bring requirements on the analog channels of the PMUs, as well. The number of analog channels available, or required, in each PMU must also be considered. Some PMUs are bay (or feeder) oriented, and more PMUs are necessary to cover certain amount of feeders, whilst some PMUs are station-oriented, meaning that more analog channels are available to enable the connection of more

-8-
feeders in the same PMU. The time synchronization mechanism is also of relevance. Some PMUs present the possibility of internal GPS receiver, while other PMUs require external GPS receivers.
Figure 5.1 : WAMS architecture and deployment
Among other crucial aspects for the application of the WAM technology are the developments in the field of telecommunication. Due to the fact that one of the advantages of this technology is based on centralized data acquisition, its reliability and availability is highly dependent on a permanent on-line link between PMUs and data concentrator [5]. The new standards and the new communication protocols (chapter 3) must be considered, as well.
6 Synchrophasor-based Applications As mentioned before, the collection of streaming data up to PDCs for data storage and visualization allows several possibilities for system studies and planning. However, the main benefit of the synchrophasor technology is the possibility of on-line applications, where not only data is available, but a complete set of on-line information. In the next chapter some samples of on-line wide area monitoring applications are presented.
6.1 Phase Angle Monitoring The Phase Angle Monitoring (PAM) gives a rough estimation of the actual corridors load through a computation of voltage angle difference, providing operators with real-time information about voltage phase angle deviations between two locations, and to safely operate power-carrying components closer to their design limits, without jeopardizing stability, security or reliability. Assuming the voltage stays within relatively small variations, the voltage angle difference gives information about how heavily loaded the power system is, in relation to the strength of the power network. The status of phase angles is typically regarded directly in the Single Line Diagram, and enables a more visible network, combined with the capability to set individual warning and alarm levels for angle deviations.
botto
m-u
pap
proa
ch
top-down
approach

-9-
As a general rule it is possible to have the phase angle monitoring integrated several times at different locations and with different application configurations, or to integrate it at the same location as a new instance. Additionally, it is possible to integrate the outputs of the phase angle monitoring in SCADA EMS / Network control systems. On the detection of an abnormal status, the application is able to alert the operator by giving an early warning or, in critical cases, an emergency alarm. Figure 6.1 presents an example of the PAM visualization.
Figure 6.1 : Online calculation of voltage phase angle difference
6.2 Line Thermal Monitoring The objective of the Line Thermal Monitoring (LTM) application is to guard the transmission line against overheating of line conductors which may result in violation of sag limits, and in extreme cases permanent damage to the conductor. The line thermal monitoring is be able to monitor and display the actual situation regarding thermal stability of a transmission line. The operator is then able to decide about the loading based on the actual on-line transmission line temperature provided. The application allows the possibility to set individual warning and alarm levels for the temperature values.
The function calculates the online average line temperature based on synchrophasors measured at both ends of the transmission line by PMUs. No additional sensors are used along the corridor, and the temperature obtained is the average value over the line, enabling operational personnel to take fast decisions in an emergency case. The operator has the possibility to define warning and alarm levels online, as a significant help in detecting overheated lines. The line thermal monitoring provides information about the present line resistance as well as active and reactive line losses.
Figure 6.2 shows the comparison of the measured conductor temperature of four days based on direct and indirect measurement techniques. The measured values were recorded with a time resolution of ten minutes using the following methods [4]:
MTS (mechanical tension sensors), in combination with solar radiation and ambient temperature measurements
SAW (surface acoustic wave) sensors WAM (wide area monitoring) line temperature monitoring approach
The LTM based on wide area monitoring system calculates the temperature from the changes of the line resistance, and it delivers an average value of the line temperature with a time resolution of one second. Figure 6.2 shows additionally a faceplate of the LTM function that can be available to system operators.

-10-
Figure 6.2 : Line thermal monitoring
The deployment of the line thermal monitoring application can be based on the analysis of the load flow output. Each of the LTM instances requires the placement of PMUs to measure voltage as well as current synchrophasors at either end of the line. The selection of the transmission lines can also be based on the utility experience concerning the most likely lines that may suffer from overloading. In many cases such knowledge is already available to system operator. Otherwise the analysis of the state estimator output or the study of load flow output from the network management system for a realistic peak load case can support the decision on the choice of the most critical transmission corridors. Finally, an off-line simulation model can be used.
Once the lines to be monitored with LTM have been selected, PMUs need to be deployed such that the voltage phasors as well as line current phasors can be measured from both line-ends. Once a number of candidate lines have been identified additional checks, like accuracy of current and voltage measurements, are necessary to guarantee that all requirements are fulfilled.
6.3 Voltage Stability Monitoring
The objective of the Voltage Stability Monitoring (VSM) application is to guard against low voltage and possible voltage collapse due to instability in the interaction between the dynamics of the load and the dynamics of the feeding system. In extreme cases such events can happen due to sudden load growth but more commonly due to outages in a corridor feeding the load area. The voltage stability monitoring application provides system operators with valuable online information to assess the present power margin with respect to voltage stability. Therefore, this monitoring functionality and its outputs are used as decision support for operators actions. The application is designed to monitor transmission corridors and it delivers the dynamic current and voltage phasors and resulting calculations in real-time.
The voltage stability application monitors the Power-Voltage-Curve (PV-Curve), with the actual loading point, the point of maximum loadability and the power margin. All these results are displayed graphically to give the operator a fast overview of the current situation. The phasor measurements are taken by two PMUs at both ends of the line. No other measuring equipment is necessary to keep the most cost-effective solution for monitoring the voltage stability of a transmission corridor. It is also more reliable, since it does not rely on a converged state estimator solution for the assessment.

-11-
In addition to the PV-Curve, the voltage stability application provides the operators with information about voltage and current phasors at both ends of the line, with calculated values such as active and reactive power as well as the power flow direction, so that operators are always informed with exact real-time data on the current voltage stability situation, as a base for further steps. The result of each VSM application is displayed in the single line diagram. Figure 6.3 shows the on-line monitoring of a transmission corridor as a result of the VSM application.
Figure 6.3 : Voltage stability monitoring
The VSM application can be applied in locations where a generation area feeds a voltage weak area of the predominant load through a transfer corridor. The corridor may consist of multiple lines. The VSM application computes a power-voltage characteristic (PV-curve) that illustrates the current operating point in comparison with the maximum loadability of the corridor. Depending on the topology of the power system network and the amount of generation injected in the transmission corridor the accuracy of the estimated maximum loadability may vary due to operating conditions if significant voltage support is given by generators at the receiving end of the corridor. At every execution the internal model of the VSM is recalibrated such that when the actual loading is close to the maximum loadability the estimate and margin are always accurate.
The selection of the corridors for the VSM application is based on the experience of the utility referred to the load areas prone to low conditions following the load increase, tripping or reactive power limitation of local generation. The dominant load areas can also be identified by inspection of load flow computation results. For each load, a group of lines referred to as a corridor, that connects the load area to a generation area that can be considered as voltage strong, is identified. PMUs are then deployed to monitor the voltage and current phasors of all selected lines at both the beginning and end of the corridor.
6.4 Power Oscillation Monitoring The objective of the Power Oscillation Monitoring (POM) application is to detect poorly damped low-frequency oscillations in a frequency range of 0.1-2 Hz. Such oscillations are ever-present in power networks and are under normal circumstances of little concern. However they may pose a threat to security if their amplitude is large or if they are poorly damped. The power oscillation monitoring gives the operating personnel an immediate awareness of the power system state in terms of oscillations, so that operators will see the urgency of the situation more quickly. The power oscillation monitoring processes the selected input signals and detects the various power swing modes, which can e.g. lead to angular instability, causing disturbances.
The power oscillation monitoring quickly identifies the frequency and the damping of swing modes and, in the first instance it provides improved power system visibility, combined with the capability to set individual warning and alarm levels for oscillations to ensure a higher level of network security. Additionally the power oscillation monitoring indicates the frequency of an oscillation, which may then be compared with

-12-
the existing known modes of the power system, i.e., the operator is able to distinguish if a local or inter-area mode is present, as shown in Figure 6.4.
Figure 6.4 : Power oscillation monitoring
The POM application analyses a selected PMU measurement signal or in some cases the phase-angle difference measured by PAM, and it issues alarms when their amplitude is large or when they are growing due to poor damping. The POM application can be used both to detect local modes and inter area modes. The selection of measurement location for the POM applications can be chosen based on the local or inter-area modes requirements.
Local modes can appear at any generation unit as a result of poorly tuned or malfunctioning control systems. Therefore in principle all units are potential candidates for a POM placement. With respect to the impact on the overall power system the largest units will normally have the largest effect, and therefore generally larger units are considered first.
To monitor inter-area oscillation, the definition of the areas is best done based on a prior knowledge of the power system and existing oscillatory modes. This information may be available from the eigenvalue analysis package of modern power system simulation tools which can identify the oscillatory modes and their expected damping, as well as which generation units participate in the oscillations. Typically one would select the worst mode for monitoring by the POM and choose frequency or angle difference based on the participation information. If such information is not available a general rule is to select locations close to the edge of the system and form an angle difference to a central location in the power system using a PAM application. Typical several instances of the POM applications are applied, to monitor oscillations between the central area and the outskirts of the power system.
6.5 Power Damping Monitoring The Power Damping Monitoring (PDM) application is a new damping estimation application that employs WAMS data to estimate the damping of oscillatory modes from ambient data before a disturbance. This application complements the POM application in that it can give an indication of the damping of transient oscillations that will follow a disturbance, once it occurs. The application is based on a system identification procedure that is carried out in real-time using a sliding measurement window. If the transfer between two grid areas is limited by inadequate damping, the damping monitor can assist in maximizing
Bus Voltage
Mode Frequency, HzDamping, %
Mode Amplitude, V
-13-
the power transfer capability by providing a faster and more accurate view of the current situation than the one obtained via off-line dynamic simulations.
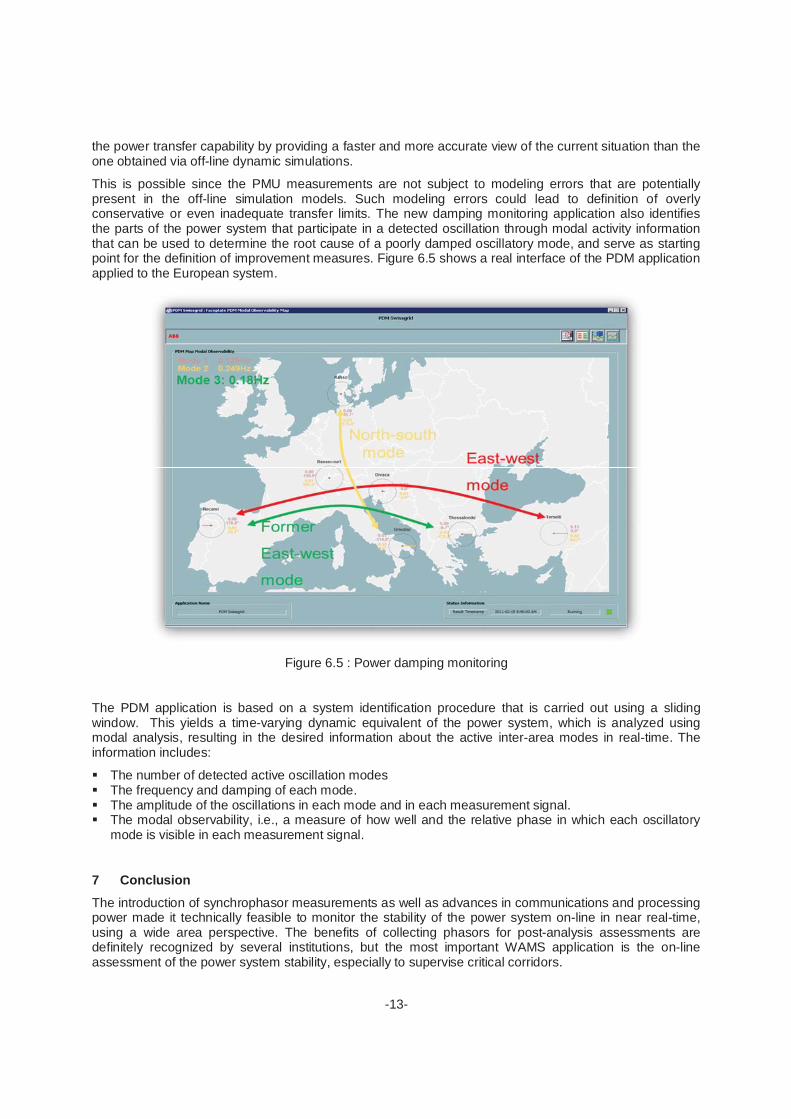
This is possible since the PMU measurements are not subject to modeling errors that are potentially present in the off-line simulation models. Such modeling errors could lead to definition of overly conservative or even inadequate transfer limits. The new damping monitoring application also identifies the parts of the power system that participate in a detected oscillation through modal activity information that can be used to determine the root cause of a poorly damped oscillatory mode, and serve as starting point for the definition of improvement measures. Figure 6.5 shows a real interface of the PDM application applied to the European system.
Figure 6.5 : Power damping monitoring
The PDM application is based on a system identification procedure that is carried out using a sliding window. This yields a time-varying dynamic equivalent of the power system, which is analyzed using modal analysis, resulting in the desired information about the active inter-area modes in real-time. The information includes:
The number of detected active oscillation modes The frequency and damping of each mode. The amplitude of the oscillations in each mode and in each measurement signal. The modal observability, i.e., a measure of how well and the relative phase in which each oscillatory
mode is visible in each measurement signal.
7 Conclusion The introduction of synchrophasor measurements as well as advances in communications and processing power made it technically feasible to monitor the stability of the power system on-line in near real-time, using a wide area perspective. The benefits of collecting phasors for post-analysis assessments are definitely recognized by several institutions, but the most important WAMS application is the on-line assessment of the power system stability, especially to supervise critical corridors.

-14-
The extensions of synchrophasor-based monitoring may include wide area control and protection also. The evolution of WAMS to WAMPACS will be a natural step, as the synchrophasor technology and the understanding of this technology evolve. Some examples of pilot installations and research prototypes address this potential for control using synchrophasors, like: wide area control for damping oscillations using FACTS/HVDC or fast excitation systems, island balancing, load/generation shedding, controlled islanding, tap changer and load control.
More and more examples of WAMPACS are presented every day. However, some include a simple approach with the use of PDC and the associated communication links to issue commands back to the power system, and no further requirements are discussed. As pilot initiatives these kind of solutions are certainly welcome, as the learning and results of such experiences will enable more advanced applications. But the full deployment of the synchrophasor technology for protection and control based on this simple approach must be further evaluated, especially regarding additional risks to the operation of the power system.
The traditional bay protection and control requirements are very severe in all circumstances, and typically require redundant systems (Main 1 and Main 2) to be applied, as reliability and availability of the protection schemes are mandatory. Additional logics and coordinated backup protection are also always considered to guarantee the appropriate performance of the protection scheme. For the control, interlocking and additional precautions like “select before operate” are also implemented in order to avoid wrong operation. In today’s substation automation systems the redundant communication network infrastructure can be provided by standard based solutions such as Parallel Redundancy Protocol (PRP) and High Availability Seamless Redundancy (HSR) specified in IEC 62439-6, as a way to improve the availability of the system, especially during critical circumstances. From WAMS to WAMPACS these aspects will certainly have to be addressed soon.
The main concern about the migration of the synchrophasor technology from monitoring to protection and control, and their potential applications, is not related to the technology itself, but to the definition of the system requirements needed to guarantee the appropriate performance and reliability of the system. As a matter of fact the algorithms and functionalities for protection and control using wide area information can be implemented by manufacturers today, based on the concepts used for monitoring. But the infrastructure (especially communication), the architecture of the WAMPACS, system and performance requirements that guarantee availability and reliability require more developments.
8 References
[1] G.Antonova, S.Paduraru, J.Naccarino, E.Price, “Wide-Area Awareness: Smarter Power Grid Monitoring and Analysis”, PACWorld 2011
[2] K.P.Brand, L.F.Santos, “Trends in Protection Concepts”, PACWorld Budapest 2012
[3] M.Larsson, P.Korba, P.Owen “Monitoring and control of power system oscillations using FACTS/HVDC and wide-area phasor measurements”, Cigré Paris 2012
[4] M.Weibel et al, “Overhead Line Temperature Monitoring Pilot Project”, B2-211, Cigré Paris 2006
[5] W.Sattinger, J.Bertsch, P.Reinhardt, “Operational Experience with Wide Area Monitoring Systems”, B5-216, Cigré Paris 2006
[6] IEEE Std 1344 - 1995. IEEE Standard for Synchrophasors for Power Systems
[7] IEEE Std C37.118 - 2005, IEEE Standard for Synchrophasors for Power Systems
[8] IEEE C37.118.1-2011 Standard for Synchrophasor Measurements for Power Systems, December 2011
[9] IEEE C37.118.2-2011 Standard for Synchrophasor Data Transfer for Power Systems, December 2011
[10] IEC TR 61850-90-5: Use of IEC 61850 to transmit synchrophasor information according to IEEE C37.118, May 2012

-15-
[11] RES670, Technical Reference and Application Manuals, ABB Substation Automation Products
[12] PSGuard, Brochure and technical data sheets, ABB Substation Automation Systems
[13] IEEE PC37.242 Draft Guide for Synchronization, calibration, testing and installation of Phasor Measurement Units (PMUs) for Power System Protection and Control, September 2012
[14] IEEE PC37.244 Draft Guide for Phasor Data Concentrator Requirements for Power System Protection, Control and Monitoring, June 2012
[15] IEEE PES PSRC Working Group C14 Report “Use of Synchrophasor Measurements in Protective Relay Applications”, September 2012
[16] Wide-Area Power Oscillation Damper Implementation and Testing in the Norwegian Transmission Network, K. Uhlen, L. Vanfretti et.al, Proceedings of IEEE General Meeting 2012, San Diego, USA.