Embed Size (px)
Citation preview
Chapter 4: Scanning Electron Microscopy (SEM)
108
4.1.3 Scanning Electron Microscopy (SEM)
Scanning electron microscopy (SEM) is a powerful imaging tool used to analyze the
physical structure of a substance under various magnifications. In this study, SEM
analyses was carried out on different categories of treated fibers and composites to
determine several features to support the results obtained by other experimental analysis
done such as the tensile test and the biodegradable test. The fibers used in this study as
part of the composite blends was first subjected to a bleaching process and then treated
with NaOH to remove all of its natural and artificial impurities adhering to the fibers.
Pure samples (Different fibers)
Figure 4.37 to 4.44 illustrates the SEM images of the different fibers used that have
been bleached and mercerized under various magnifications.
Fig. 4.37 SEM image of treated bamboo Fig. 4.38 SEM image of treated bamboo
fibers at 400x magnification fibers at 3000x magnification
Chapter 4: Scanning Electron Microscopy (SEM)
109
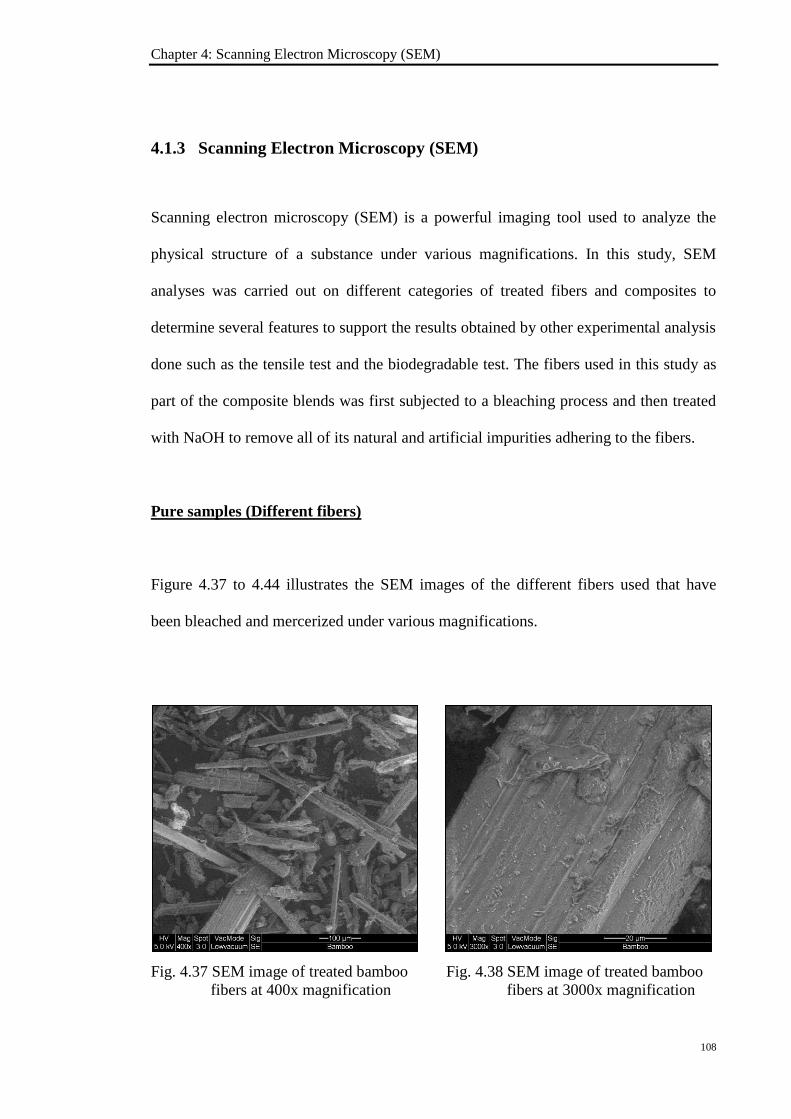
Fig 4.39 SEM image of treated kenaf Fig. 4.40 SEM image of treated kenaf
fibers at 400x magnification fibers at 3000x magnification
Fig. 4.41 SEM image of treated roselle Fig. 4.42 SEM image of treated roselle
fibers at 400x magnification fibers at 3000x magnification
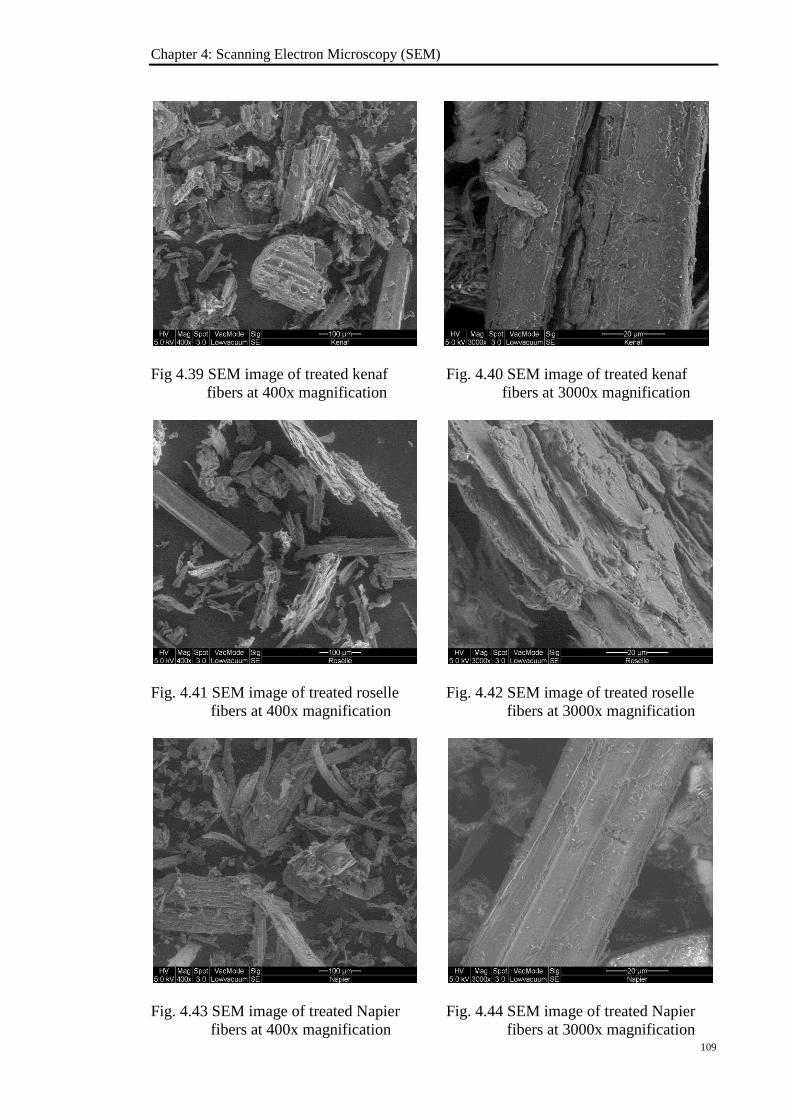
Fig. 4.43 SEM image of treated Napier Fig. 4.44 SEM image of treated Napier
fibers at 400x magnification fibers at 3000x magnification
Chapter 4: Scanning Electron Microscopy (SEM)
110
From the SEM images of the treated fibers, generally it can be observed that the
bleaching and mercerization process done on the fibers resulted in the breaking down of
the fiber bundles into smaller bundles that measures around 100-250 m in length and
40-60 m in width. This fibrillation process increases the effective surface area
available for contact with the polymer matrix. The removal of impurities such as wax,
oil, hemicellulose, and pectin covering the external surface of the fiber cell wall by the
surface treatment process can also be seen from the 3000x magnification images of the
different fibers. Rough surface topography was formed upon removal of these
impurities. The surface roughness of the treated fibers will result in better mechanical
interlocking between fibers and the polymer matrix thus producing stronger interfacial
adhesion. The removal of the impurities also produces an increased amount of cellulose
exposed on the fiber surface, and this increases the number of possible reaction sites for
the hydroxyl groups of fibers and matrix to interact and form linkages (Rosa, et al.,
2009). Despite of the positive attributes distinguished from the images that will
contribute to better interfacial interlocking and subsequently producing a stronger blend
when the fibers are incorporated into the PVA/starch matrix, one feature that can cause
the composite to have lower mechanical strength is that the treated fibers illustrated in
the images varies in shapes and sizes. Basically, if the fibers are of non-uniform sizes
and shapes, then the capability of the fiber to support stress in the composites are lower
(Rosa, et al., 2009). The non-uniformity of the treated fibers can contribute to poor
interfacial adhesion between fiber and matrix, which results in a less efficient stress
transfer between matrix and fiber. Inefficient stress transfer between fibers and matrix
will lead to breakage of the fibers during the mechanical testing. This phenomenon can
be seen in the SEM images of the fractured samples of the PVA/starch/fibers
composites.
Chapter 4: Scanning Electron Microscopy (SEM)
111
The SEM analysis was also carried out to determine on how well the dispersion of the
treated fibers in the polymer matrix, the adhesion between fiber and matrix and to detect
the presence of any micro defects on the surface of the composites. A comparison was
done on the images of pure PVA, PVA/different starches and PVA/different
starches/different fibers composites.
PVA/different starches composites
SEM images of the pure PVA, PVA/starch composites are shown in Figures 4.45 and
Figures 4.46 to 4.51.
Fig. 4.45 SEM image of pure PVA film at 500x
magnification
Chapter 4: Scanning Electron Microscopy (SEM)
112
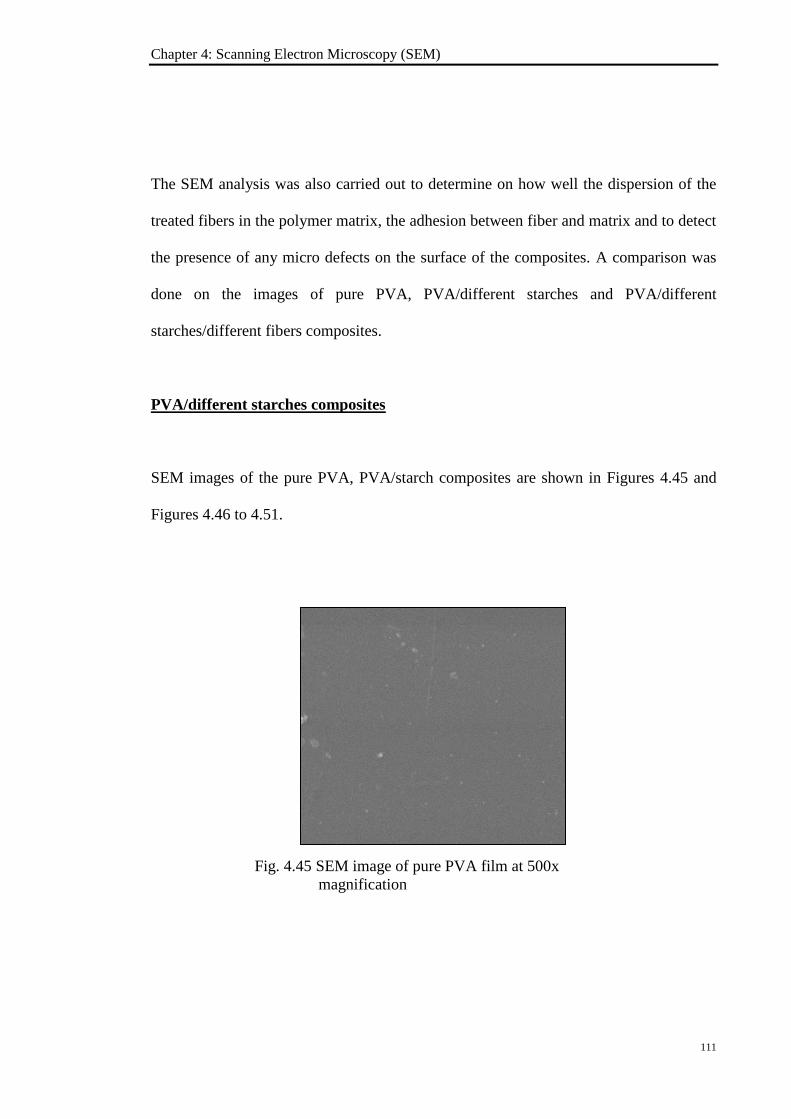
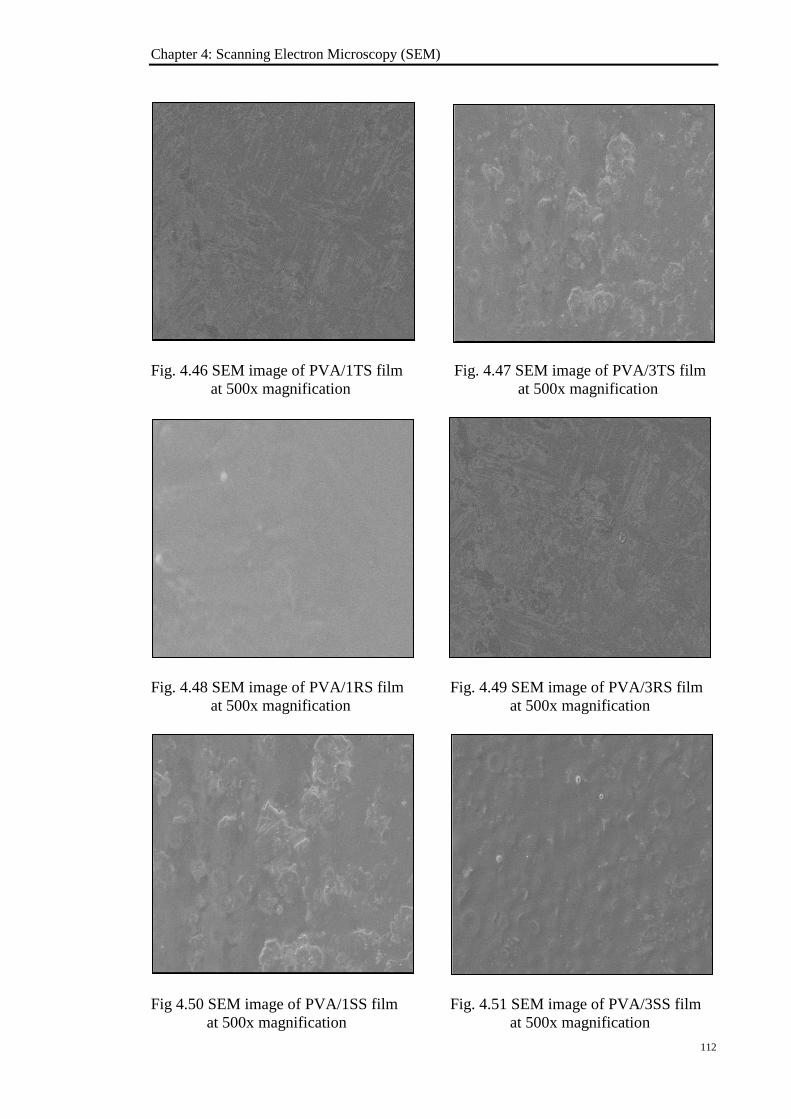
Fig. 4.46 SEM image of PVA/1TS film Fig. 4.47 SEM image of PVA/3TS film
at 500x magnification at 500x magnification
Fig. 4.48 SEM image of PVA/1RS film Fig. 4.49 SEM image of PVA/3RS film
at 500x magnification at 500x magnification
Fig 4.50 SEM image of PVA/1SS film Fig. 4.51 SEM image of PVA/3SS film
at 500x magnification at 500x magnification
Chapter 4: Scanning Electron Microscopy (SEM)
113
As shown in Figure 4.45, the surface of pure PVA film appeared to be smooth and
compact. The photomicrographs of PVA blended with 1g of different starches show a
rather smooth surface except for the composite of PVA blended with 1g of sago starch.
Images in Figure 4.46 and 4.48 show a rather clean surface except for a few scratches
produced when the films were removed from the casting plate. The smooth surface
structure may indicate that the miscibility and compatibility in each component of the
PVA/starch blends were increased. The image of PVA blended with 1g of sago starch
composite revealed in what appears to be groups of bumps that resembles
agglomeration of sago starch granules on the film’s surface. Sago starch has by far one
of the biggest granule sizes of all the commercial starches. The average sago starch
granule is around 30 m. Due to the large granule size and partly because of partial
gelatinization of the sago starch; several agglomerations of sago starch were clearly
seen on the surface of the film. Agglomeration of starches will lead to a decrease in the
tensile properties of the composite formed because these agglomerations may not be
fully covered by the PVA phase and eventually will lead to the weakening of the
interfacial adhesion between starch and the polymer matrix. These findings conforms
the result obtained from the tensile test where the PVA blended with 1g of sago starch
shows the lowest tensile strength value. For the composite PVA blended with 3g of
different starches, the blend of PVA/3TS and PVA/3SS showed rough surfaces where
agglomerations of starch granules can be clearly seen on the surface of the films. This
may be due to partial gelatinization of the starches and the blends mentioned have lower
tensile properties. Gelatinization of starch is a method to enhance the interfacial affinity
between starch and polymer matrix. Starch is gelatinized to disintegrate granules and
overcome the strong interaction of starch molecules in the presence of water and
polymer matrix, which leads to well dispersion of the starches. If only partial
Chapter 4: Scanning Electron Microscopy (SEM)
114
gelatinization occurred then the ungelatinized starches would form clusters and this
leads to the lowering of mechanical properties of the composites.
PVA/different starches/different fibers composites
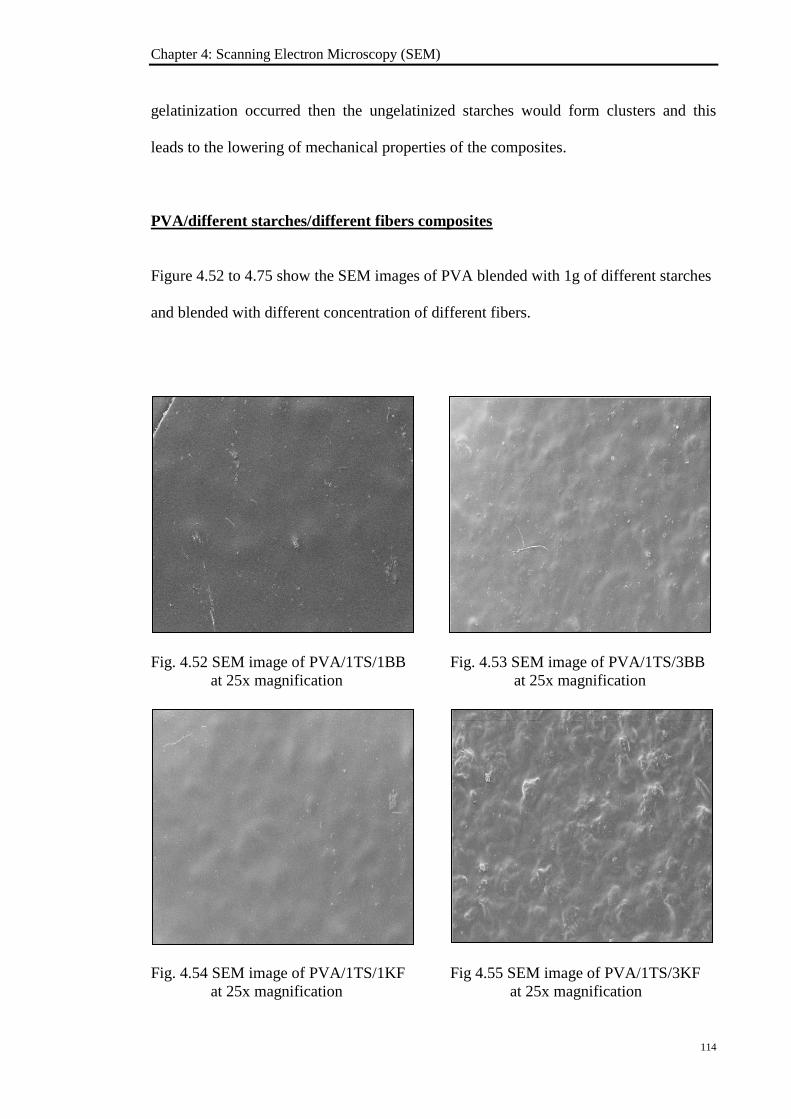
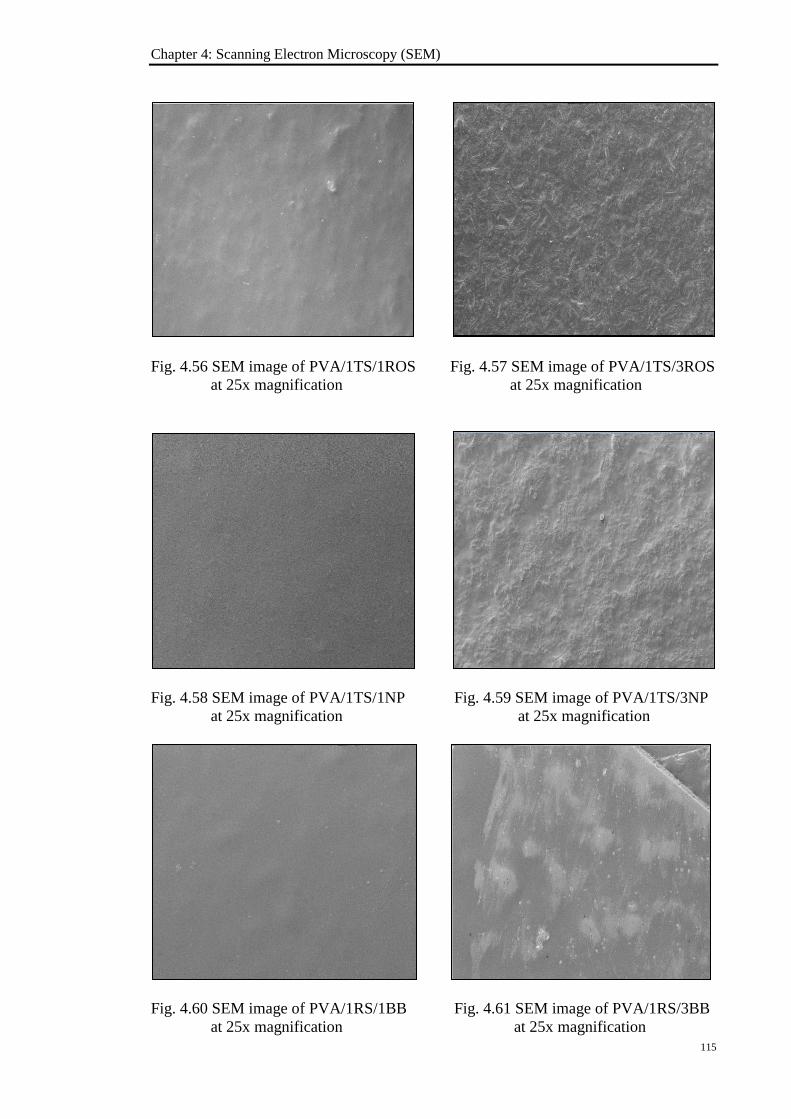
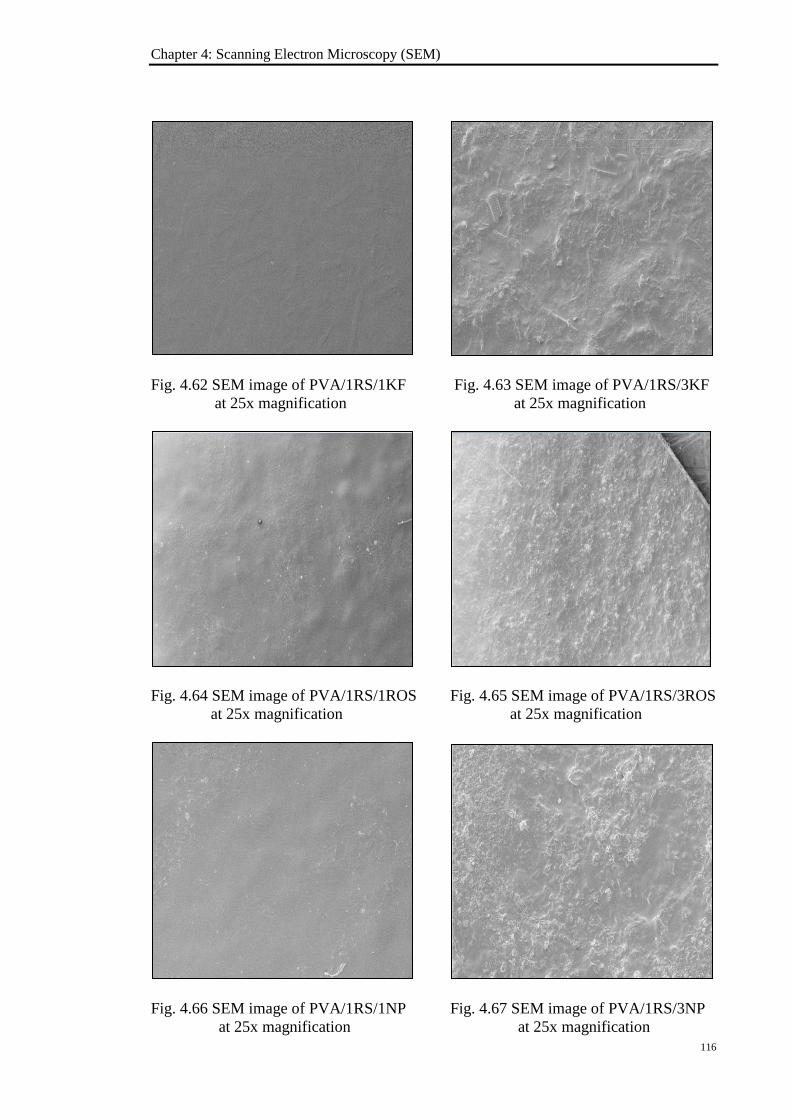
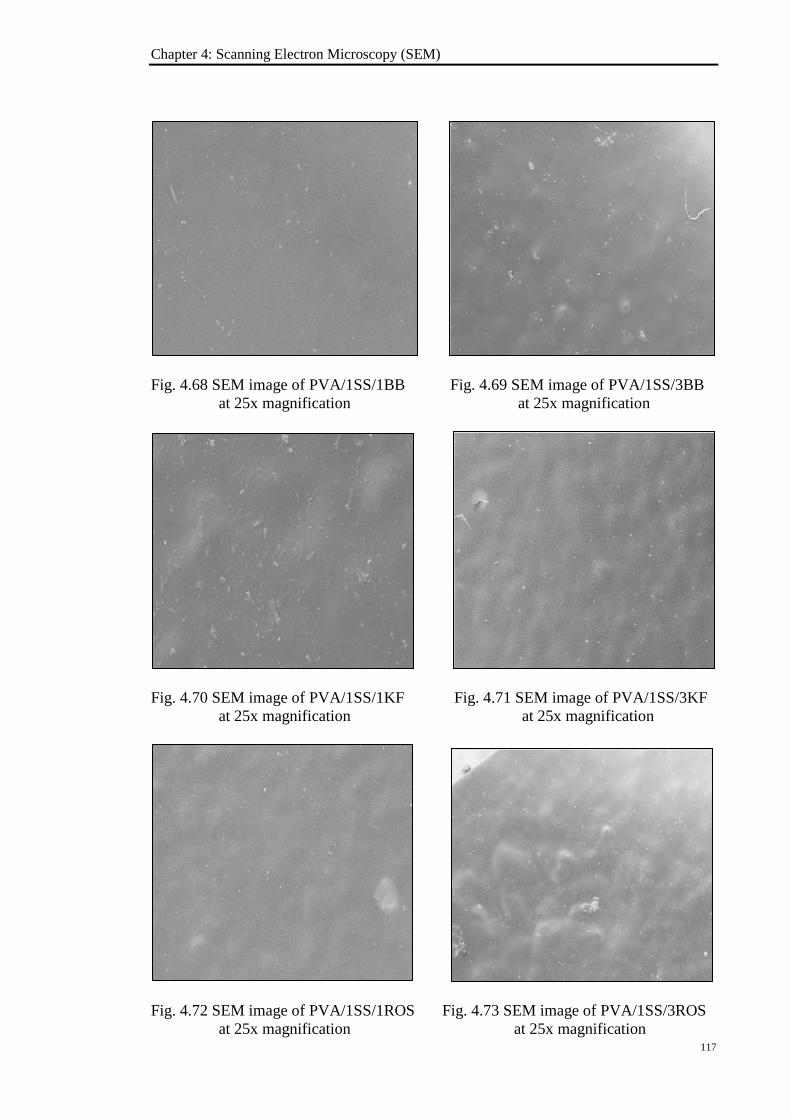
Figure 4.52 to 4.75 show the SEM images of PVA blended with 1g of different starches
and blended with different concentration of different fibers.
Fig. 4.52 SEM image of PVA/1TS/1BB Fig. 4.53 SEM image of PVA/1TS/3BB
at 25x magnification at 25x magnification
Fig. 4.54 SEM image of PVA/1TS/1KF Fig 4.55 SEM image of PVA/1TS/3KF
at 25x magnification at 25x magnification
Chapter 4: Scanning Electron Microscopy (SEM)
115
Fig. 4.56 SEM image of PVA/1TS/1ROS Fig. 4.57 SEM image of PVA/1TS/3ROS
at 25x magnification at 25x magnification
Fig. 4.58 SEM image of PVA/1TS/1NP Fig. 4.59 SEM image of PVA/1TS/3NP
at 25x magnification at 25x magnification
Fig. 4.60 SEM image of PVA/1RS/1BB Fig. 4.61 SEM image of PVA/1RS/3BB
at 25x magnification at 25x magnification
Chapter 4: Scanning Electron Microscopy (SEM)
116
Fig. 4.62 SEM image of PVA/1RS/1KF Fig. 4.63 SEM image of PVA/1RS/3KF
at 25x magnification at 25x magnification
Fig. 4.64 SEM image of PVA/1RS/1ROS Fig. 4.65 SEM image of PVA/1RS/3ROS
at 25x magnification at 25x magnification
Fig. 4.66 SEM image of PVA/1RS/1NP Fig. 4.67 SEM image of PVA/1RS/3NP
at 25x magnification at 25x magnification
Chapter 4: Scanning Electron Microscopy (SEM)
117
Fig. 4.68 SEM image of PVA/1SS/1BB Fig. 4.69 SEM image of PVA/1SS/3BB
at 25x magnification at 25x magnification
Fig. 4.70 SEM image of PVA/1SS/1KF Fig. 4.71 SEM image of PVA/1SS/3KF
at 25x magnification at 25x magnification
Fig. 4.72 SEM image of PVA/1SS/1ROS Fig. 4.73 SEM image of PVA/1SS/3ROS
at 25x magnification at 25x magnification
Chapter 4: Scanning Electron Microscopy (SEM)
118
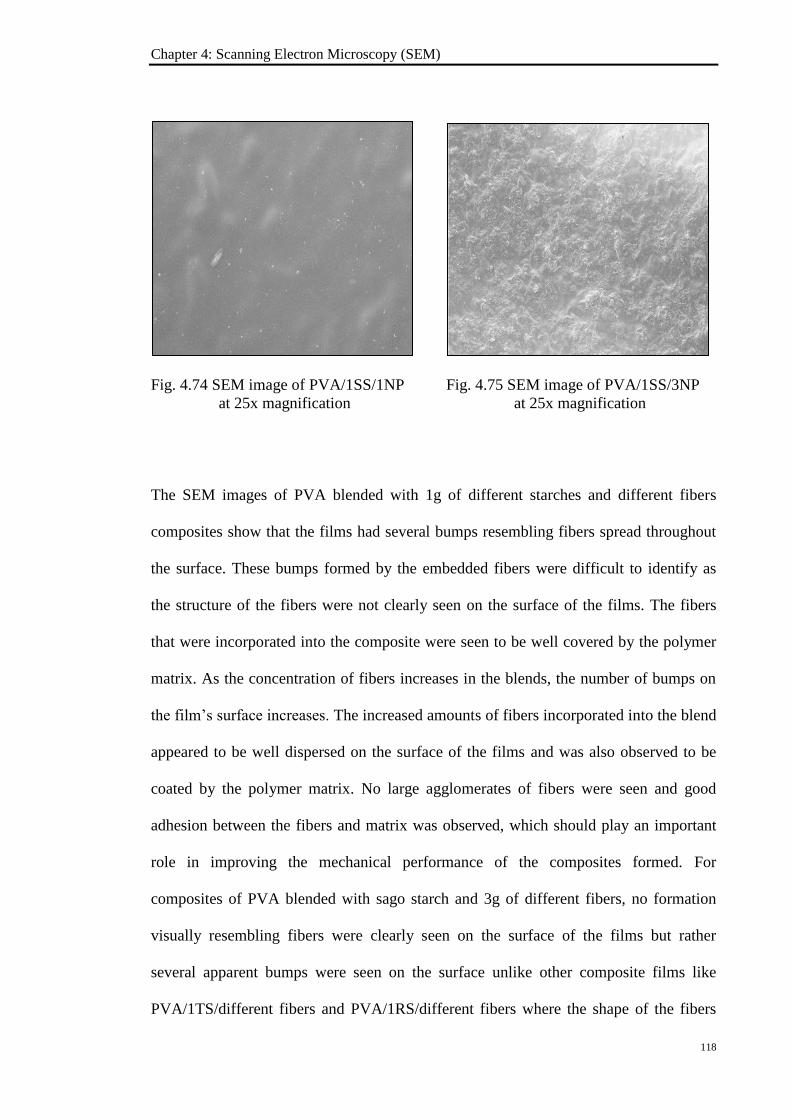
Fig. 4.74 SEM image of PVA/1SS/1NP Fig. 4.75 SEM image of PVA/1SS/3NP
at 25x magnification at 25x magnification
The SEM images of PVA blended with 1g of different starches and different fibers
composites show that the films had several bumps resembling fibers spread throughout
the surface. These bumps formed by the embedded fibers were difficult to identify as
the structure of the fibers were not clearly seen on the surface of the films. The fibers
that were incorporated into the composite were seen to be well covered by the polymer
matrix. As the concentration of fibers increases in the blends, the number of bumps on
the film’s surface increases. The increased amounts of fibers incorporated into the blend
appeared to be well dispersed on the surface of the films and was also observed to be
coated by the polymer matrix. No large agglomerates of fibers were seen and good
adhesion between the fibers and matrix was observed, which should play an important
role in improving the mechanical performance of the composites formed. For
composites of PVA blended with sago starch and 3g of different fibers, no formation
visually resembling fibers were clearly seen on the surface of the films but rather
several apparent bumps were seen on the surface unlike other composite films like
PVA/1TS/different fibers and PVA/1RS/different fibers where the shape of the fibers
Chapter 4: Scanning Electron Microscopy (SEM)
119
were clearly seen even though covered by the PVA matrix. The fibers blended in the
PVA/sago/different fiber composites were well coated and this provides a graphical
evidence for its slightly improved mechanical performance when compared to its
tapioca and rice composites counterpart.
Fracture samples (PVA/different starches/different fibers composites)
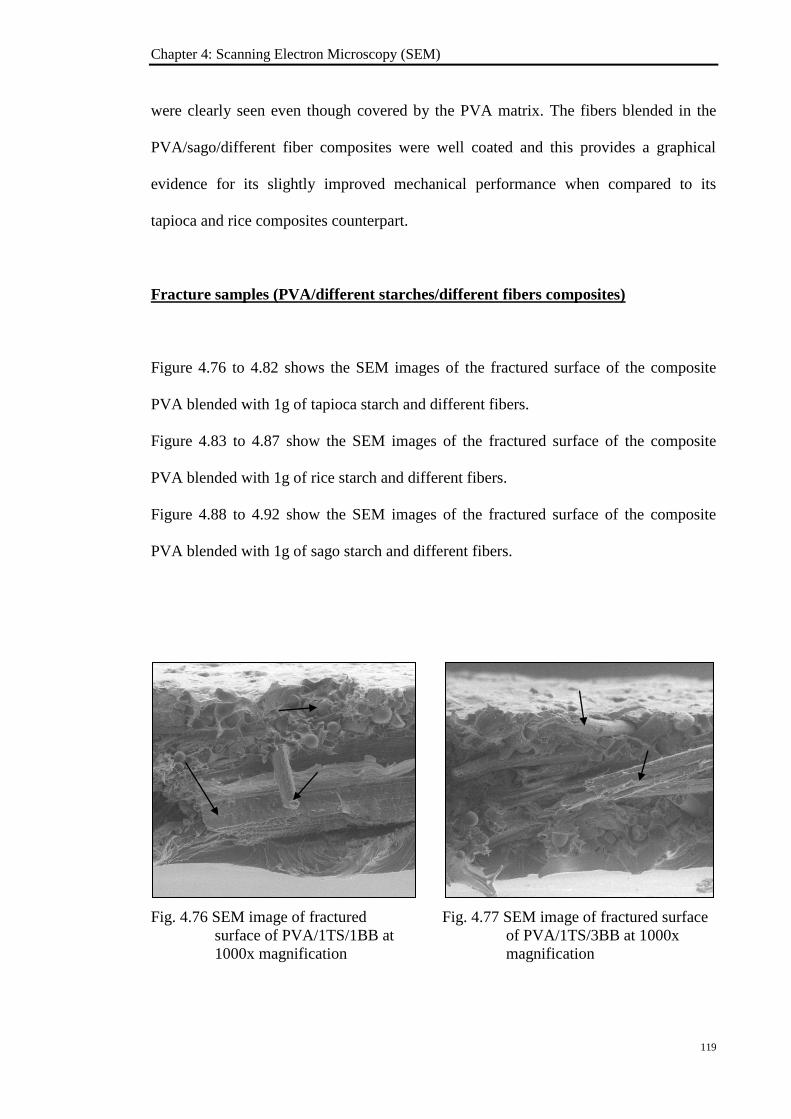
Figure 4.76 to 4.82 shows the SEM images of the fractured surface of the composite
PVA blended with 1g of tapioca starch and different fibers.
Figure 4.83 to 4.87 show the SEM images of the fractured surface of the composite
PVA blended with 1g of rice starch and different fibers.
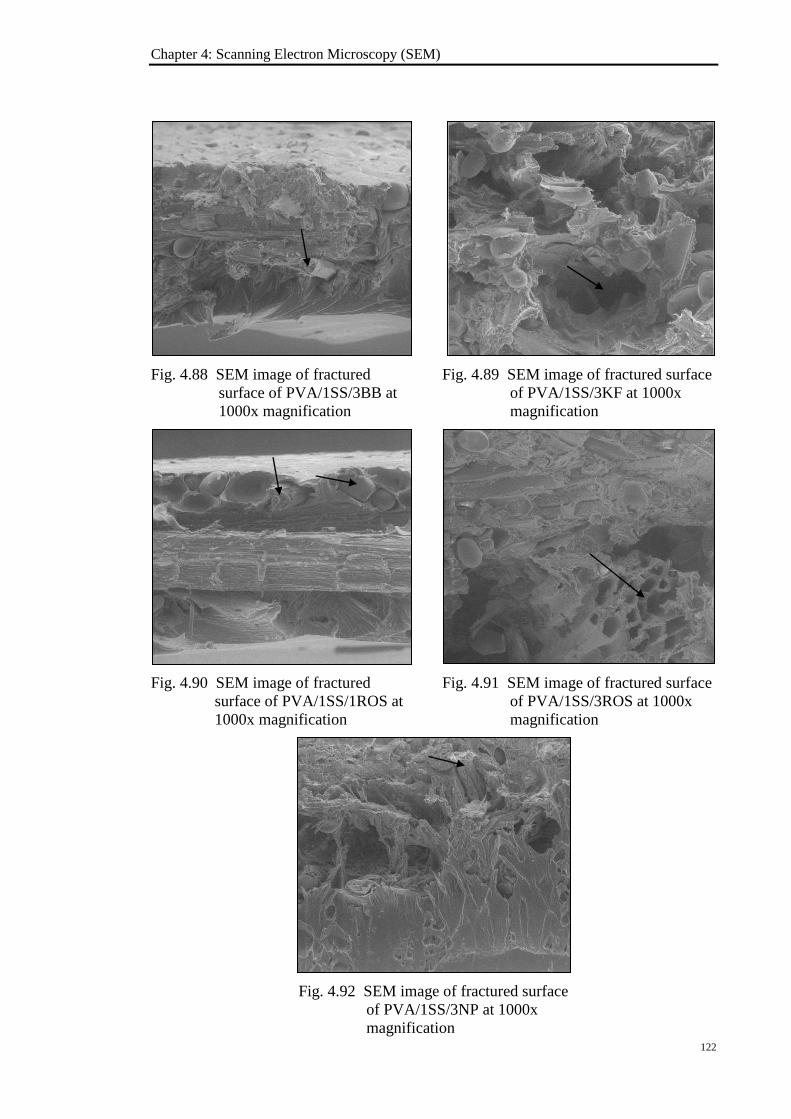
Figure 4.88 to 4.92 show the SEM images of the fractured surface of the composite
PVA blended with 1g of sago starch and different fibers.
Fig. 4.76 SEM image of fractured Fig. 4.77 SEM image of fractured surface
surface of PVA/1TS/1BB at of PVA/1TS/3BB at 1000x
1000x magnification magnification
Chapter 4: Scanning Electron Microscopy (SEM)
120
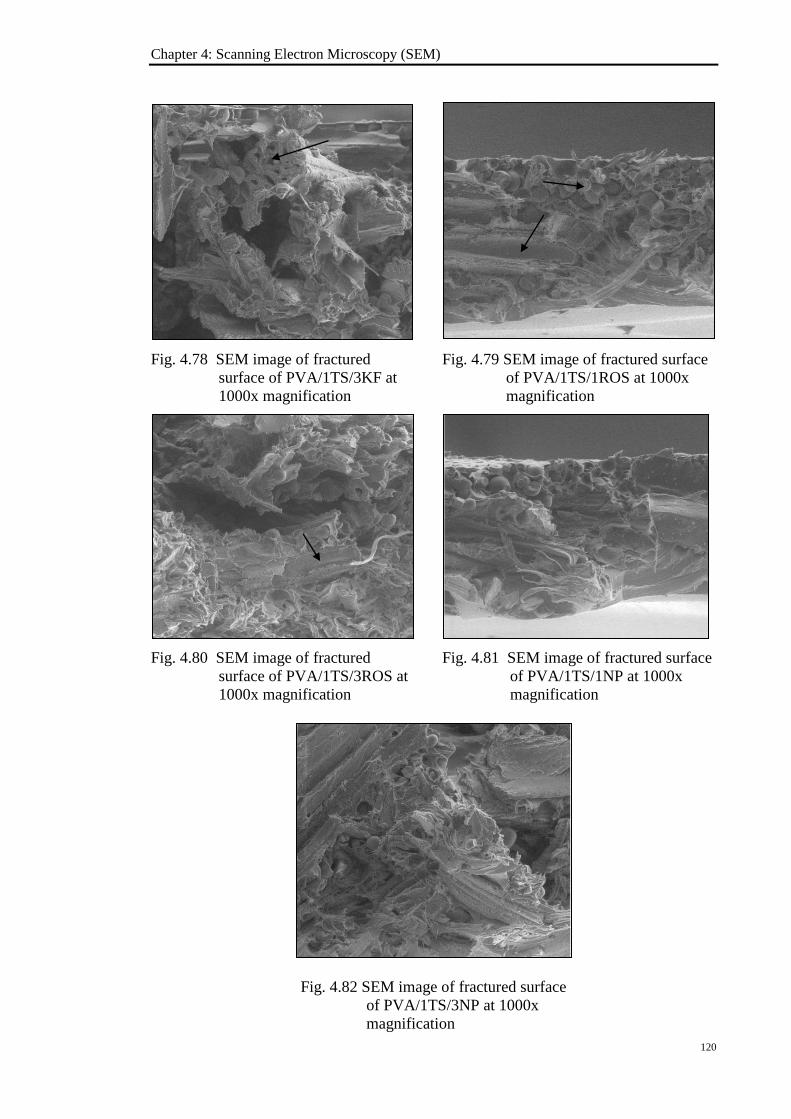
Fig. 4.78 SEM image of fractured Fig. 4.79 SEM image of fractured surface
surface of PVA/1TS/3KF at of PVA/1TS/1ROS at 1000x
1000x magnification magnification
Fig. 4.80 SEM image of fractured Fig. 4.81 SEM image of fractured surface
surface of PVA/1TS/3ROS at of PVA/1TS/1NP at 1000x
1000x magnification magnification
Fig. 4.82 SEM image of fractured surface
of PVA/1TS/3NP at 1000x
magnification
Chapter 4: Scanning Electron Microscopy (SEM)
121
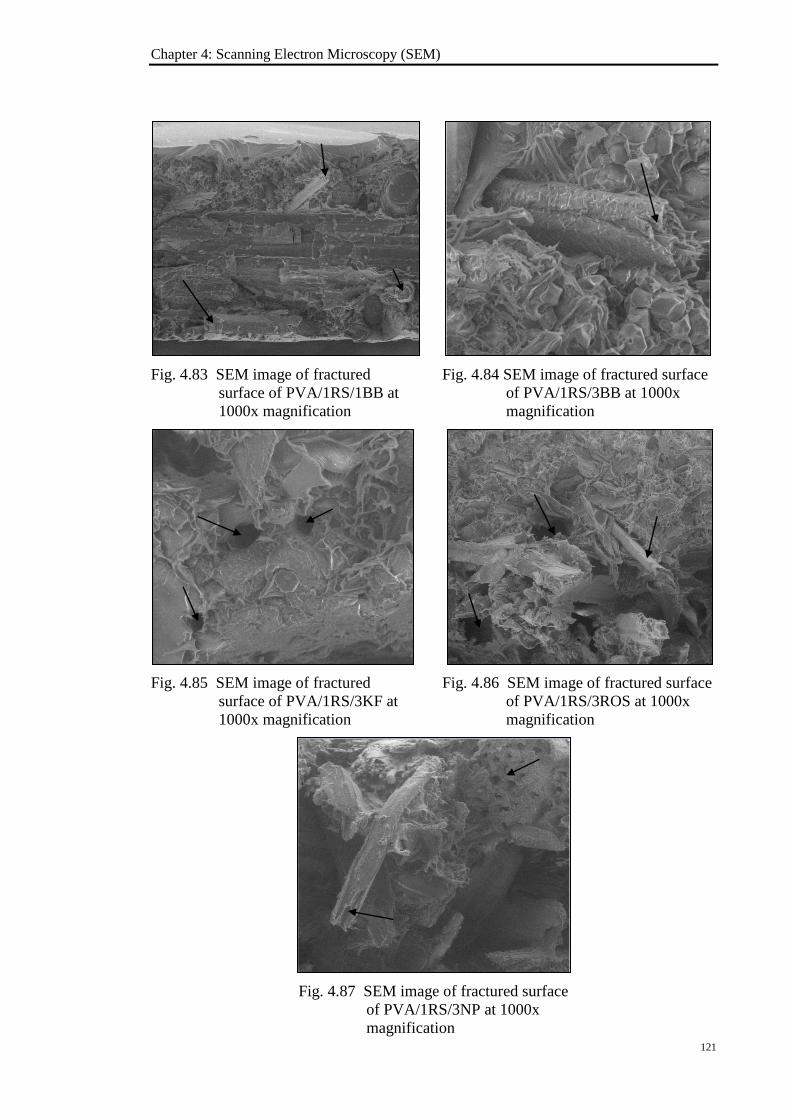
Fig. 4.83 SEM image of fractured Fig. 4.84 SEM image of fractured surface
surface of PVA/1RS/1BB at of PVA/1RS/3BB at 1000x
1000x magnification magnification
Fig. 4.85 SEM image of fractured Fig. 4.86 SEM image of fractured surface
surface of PVA/1RS/3KF at of PVA/1RS/3ROS at 1000x
1000x magnification magnification
Fig. 4.87 SEM image of fractured surface
of PVA/1RS/3NP at 1000x
magnification
Chapter 4: Scanning Electron Microscopy (SEM)
122
Fig. 4.88 SEM image of fractured Fig. 4.89 SEM image of fractured surface
surface of PVA/1SS/3BB at of PVA/1SS/3KF at 1000x
1000x magnification magnification
Fig. 4.90 SEM image of fractured Fig. 4.91 SEM image of fractured surface
surface of PVA/1SS/1ROS at of PVA/1SS/3ROS at 1000x
1000x magnification magnification
Fig. 4.92 SEM image of fractured surface
of PVA/1SS/3NP at 1000x
magnification
Chapter 4: Scanning Electron Microscopy (SEM)
123
For the fracture samples, only certain SEM images were shown from all of the blended
composites because some of the images did not show the presence of fibers or starches.
The different natural fibers that were incorporated into the composites were bleached
and mercerized. The effects of the surface modifications done on the fibers were
investigated on the micro failure mode using the fractured specimens of the composites
that were subjected to tensile stresses in the mechanical test. The SEM images of the
fractured surfaces were taken at a cross section angle to discover the effects mentioned.
Observations from the SEM images of the fractured specimens, as a whole, revealed
that several fibers were pulled out from the matrix in the fracture process, with large
voids thereby being created (as indicated by the arrows). Despite the fact that there were
many cavities left by the pulled-out fibers, the surface of the fibers pulled-out from the
matrix showed many traces of polymer matrix adhering to it indicating a closer contact
between fiber and matrix and a better wetting of the fibers. This is also an indication
that there were good fiber-matrix adhesions. In the blended composites, it can also be
seen that were several breakages of fibers (as indicated by the arrows). This event may
be caused by the non-uniformity of the treated fibers used. The non-uniformity of the
fibers contributes to poor interfacial adhesion between the fiber and matrix that leads to
inefficient stress transfer between fiber and matrix. Inefficient stress transfer
subsequently leads to the breakage of fibers during the tensile testing. From the SEM
images of the surface of the composites, the starch granules were not clearly seen but
under SEM analyses of the fractured specimens it was revealed that there were some
exposed starch granules underneath the surface of the films (indicated by arrows in the
figures). The ungelatinized starches may partly cause lower mechanical properties for
the composites because the starch granules form gaps between the granule and the
continuous phase of the PVA matrix.