Embed Size (px)
Citation preview

CHAPTER OUTLINE
1
Introduction
Differences in myoglobin and hemoglobin function areexplained by differences in myoglobin and hemoglobinstructure
Normal adult hemoglobin (HbA) differs from sickle cellhemoglobin (HbS) by only one amino acid
Immunoglobulin G and the domain concept: Largepolypeptides fold into globular units called domains
Enzymes are proteins that catalyze chemical reactions
Different methods can be used to detect enzyme activity
Enzymes lower the energy of activation but do not affectthe equilibrium position
All enzyme reactions proceed through an enzyme-substrate complex
Molecular details for enzyme-substrate complexes havebeen worked out for many enzymes
Regulatory enzymes control committed steps inbiochemical pathways
Regulatory enzymes exhibit sigmoidal kinetics and arestimulated or inhibited by allosteric effectors
Enzyme activity can be altered by covalent modification
G protein signal systems transmit external signals intothe cell
Summary
What’s Next?
2.14
2.13
2.12
2.11
2.10
2.9
2.8
2.7
2.6
2.5
2.4
2.3
2.2
2.1
Protein functionBurton E. TroppQueens College, City University of New York
2
40632_CH02_tropp.qxd 4/4/07 2:59 PM Page 1
2 CHAPTER 2 Protein function
Introduction
The function of all proteins depends on theirability to specifically interact with other mole-cules. Such specificity is possible becausepolypeptides with different amino acid se-quences fold into different tertiary structures.Each kind of protein evolved to interact with aspecific molecule or ligand. Catalytic proteins—the enzymes—convert the ligands into othermolecules. Structural proteins interact with spe-cific molecules, often endowing the bound mol-ecules with special biological properties. Forinstance, one class of proteins, the histones,binds to DNA to form compact nucleoproteinstructures called nucleosomes, while a secondclass of proteins combines with RNA to formthe ribonucleoprotein complex known as theribosome. Transport proteins (such as hemoglo-bin) bind to specific ligands (in this case oxygen)and transport the ligand to a site where it isneeded. Other kinds of transport proteins al-low specific molecules to pass through biolog-ical membranes. Storage proteins such asmyoglobin, another oxygen-binding protein,allow the cell to store higher concentrations ofthe ligand than otherwise would be possible.Regulatory proteins interact with other pro-teins or with nucleic acids to slow down or speedup some crucial biological process. Receptorproteins change conformation after binding aspecific ligand and then trigger a series of meta-bolic changes. There are even toxic proteinssuch as cholera toxin that modify other pro-teins so that they no longer work properly.
Although it might seem that transport pro-teins and storage proteins would be of some-what less interest to molecular biologists thanother kinds of proteins, in fact this is not true.The oxygen storage protein myoglobin and theoxygen transport protein hemoglobin have aspecial place in the early history of molecularbiology. They were the first two proteins to havetheir structures determined. Moreover, the les-sons learned about structure–function relation-ships from studying these two proteins remainrelevant today. We therefore begin our exam-ination of protein function by considering thestructure–function relationships that exist formyoglobin and hemoglobin.
Key concept• Protein function is based on the specific interac-
tions between proteins and other molecules (lig-ands).
2.1 Differences in myoglobinand hemoglobin functionare explained bydifferences in myoglobinand hemoglobinstructure
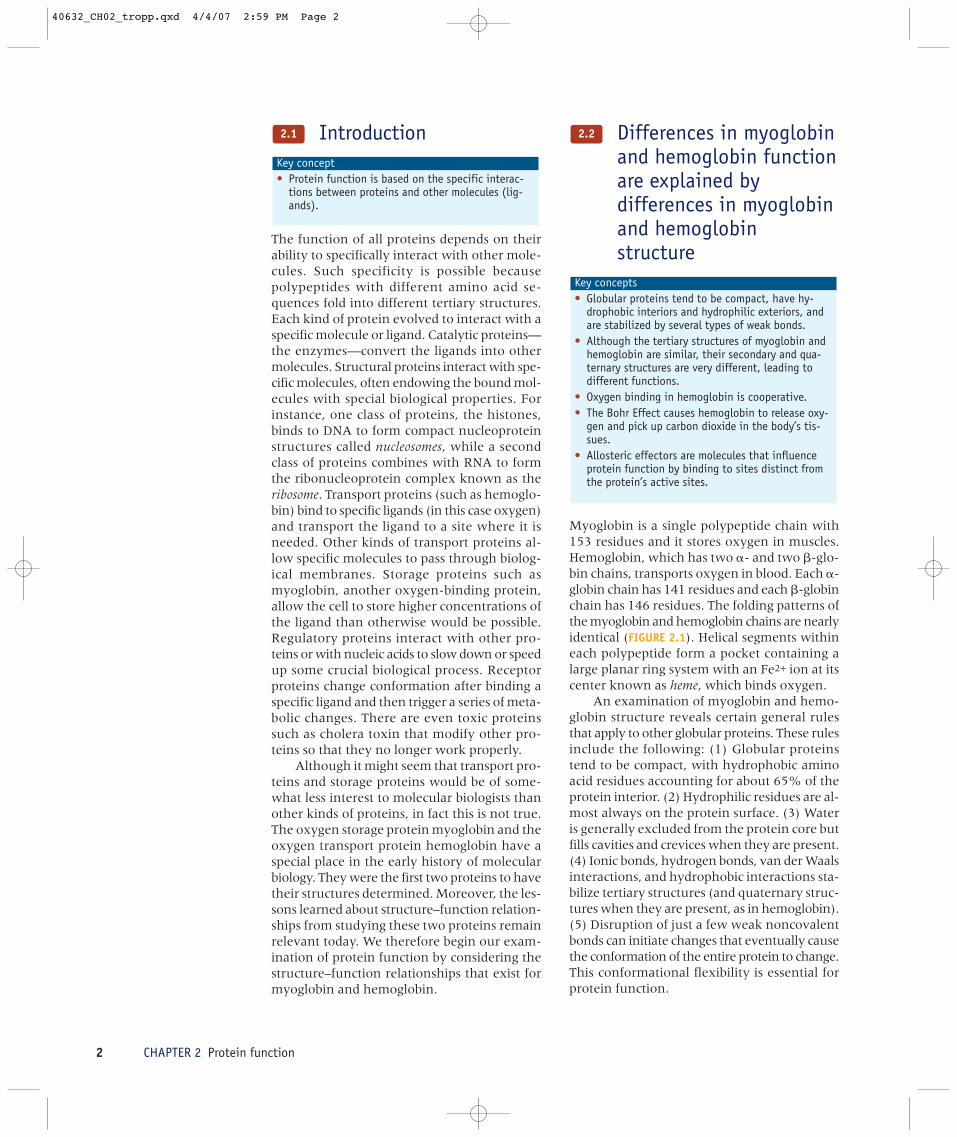
Myoglobin is a single polypeptide chain with153 residues and it stores oxygen in muscles.Hemoglobin, which has two �- and two �-glo-bin chains, transports oxygen in blood. Each �-globin chain has 141 residues and each �-globinchain has 146 residues. The folding patterns ofthe myoglobin and hemoglobin chains are nearlyidentical (FIGURE 2.1). Helical segments withineach polypeptide form a pocket containing alarge planar ring system with an Fe2+ ion at itscenter known as heme, which binds oxygen.
An examination of myoglobin and hemo-globin structure reveals certain general rulesthat apply to other globular proteins. These rulesinclude the following: (1) Globular proteinstend to be compact, with hydrophobic aminoacid residues accounting for about 65% of theprotein interior. (2) Hydrophilic residues are al-most always on the protein surface. (3) Wateris generally excluded from the protein core butfills cavities and crevices when they are present.(4) Ionic bonds, hydrogen bonds, van der Waalsinteractions, and hydrophobic interactions sta-bilize tertiary structures (and quaternary struc-tures when they are present, as in hemoglobin).(5) Disruption of just a few weak noncovalentbonds can initiate changes that eventually causethe conformation of the entire protein to change.This conformational flexibility is essential forprotein function.
Key concepts• Globular proteins tend to be compact, have hy-
drophobic interiors and hydrophilic exteriors, andare stabilized by several types of weak bonds.
• Although the tertiary structures of myoglobin andhemoglobin are similar, their secondary and qua-ternary structures are very different, leading todifferent functions.
• Oxygen binding in hemoglobin is cooperative.• The Bohr Effect causes hemoglobin to release oxy-
gen and pick up carbon dioxide in the body’s tis-sues.
• Allosteric effectors are molecules that influenceprotein function by binding to sites distinct fromthe protein’s active sites.
2.2
40632_CH02_tropp.qxd 4/4/07 2:59 PM Page 2
2.2 Differences in myoglobin and hemoglobin function are explained by differences in myoglobin and hemoglobin structure 3
Comparisons of myoglobin and hemoglo-bin structure and function also help to spotlightthe contribution that quaternary structuremakes to protein function. Based on the simi-larities in their tertiary structures, one mightexpect the polypeptides in myoglobin and he-moglobin to behave in the same way. At thesimplest level this expectation is justified. Both
proteins bind oxygen, changing from a red pur-ple color to a scarlet color in the process.
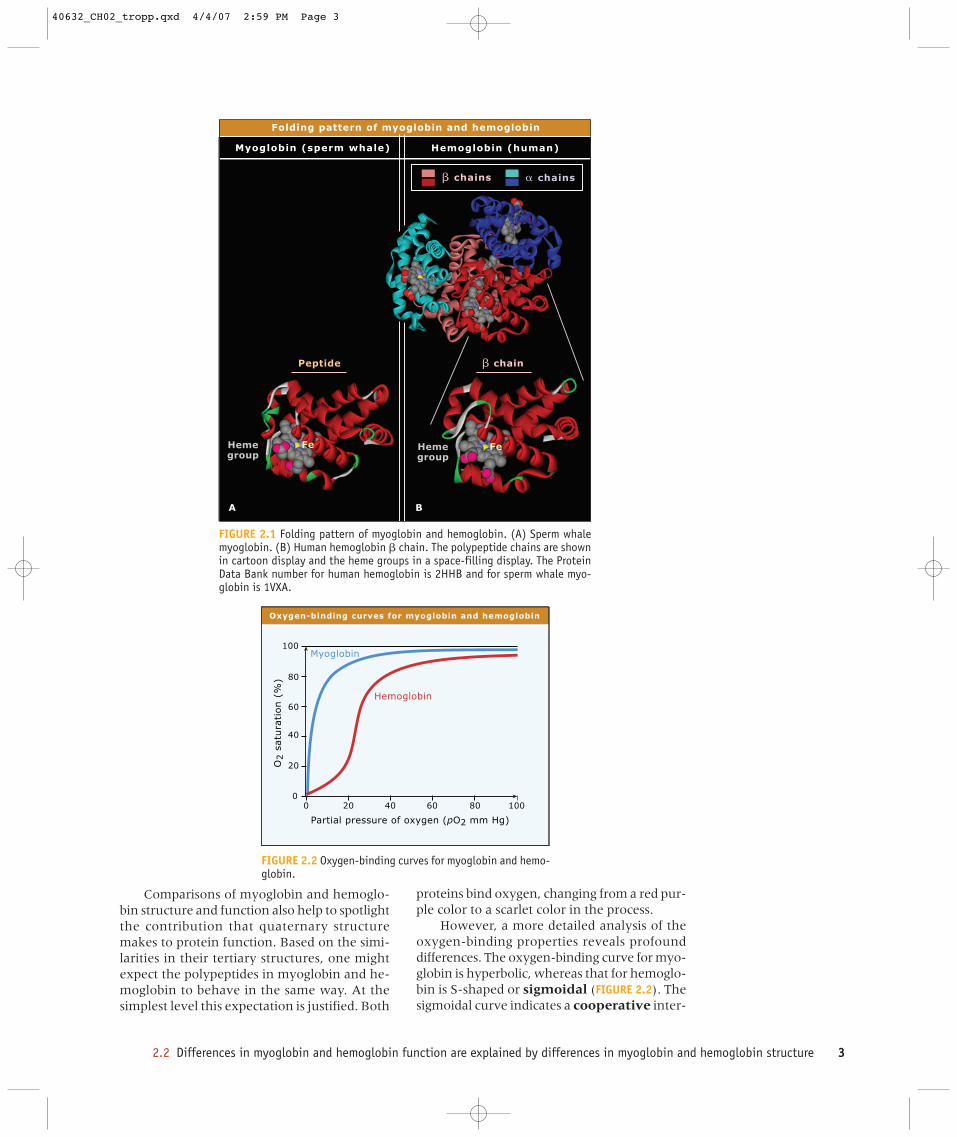
However, a more detailed analysis of theoxygen-binding properties reveals profounddifferences. The oxygen-binding curve for myo-globin is hyperbolic, whereas that for hemoglo-bin is S-shaped or sigmoidal (FIGURE 2.2). Thesigmoidal curve indicates a cooperative inter-
A B
Myoglobin (sperm whale) Hemoglobin (human)
� chain
� chains � chains
Folding pattern of myoglobin and hemoglobin
Peptide
Hemegroup
Hemegroup
FeFe
FIGURE 2.1 Folding pattern of myoglobin and hemoglobin. (A) Sperm whalemyoglobin. (B) Human hemoglobin � chain. The polypeptide chains are shownin cartoon display and the heme groups in a space-filling display. The ProteinData Bank number for human hemoglobin is 2HHB and for sperm whale myo-globin is 1VXA.
100
100
80
80
60
60
40
40
20
200
0
Hemoglobin
Myoglobin
O2 s
atu
rati
on (
%)
Partial pressure of oxygen (pO2 mm Hg)
Oxygen-binding curves for myoglobin and hemoglobin
FIGURE 2.2 Oxygen-binding curves for myoglobin and hemo-globin.
40632_CH02_tropp.qxd 4/4/07 2:59 PM Page 3
4 CHAPTER 2 Protein function
action among the oxygen-binding sites in the he-moglobin molecule. That is, the binding of oxy-gen to one of the hemes in a hemoglobinmolecule increases the remaining hemes’ affin-ity for oxygen. On the other hand, the loss ofan oxygen molecule from one of the hemes ina hemoglobin molecule decreases the otherhemes’ affinity for oxygen. Cooperativity, whichrequires some kind of communication amongthe hemes, permits hemoglobin to bind oxy-gen in the lungs where oxygen is plentiful, andrelease oxygen near actively respiring cells whereoxygen is scarce. Cooperativity is impossible in
myoglobin because each myoglobin moleculehas only one heme group.
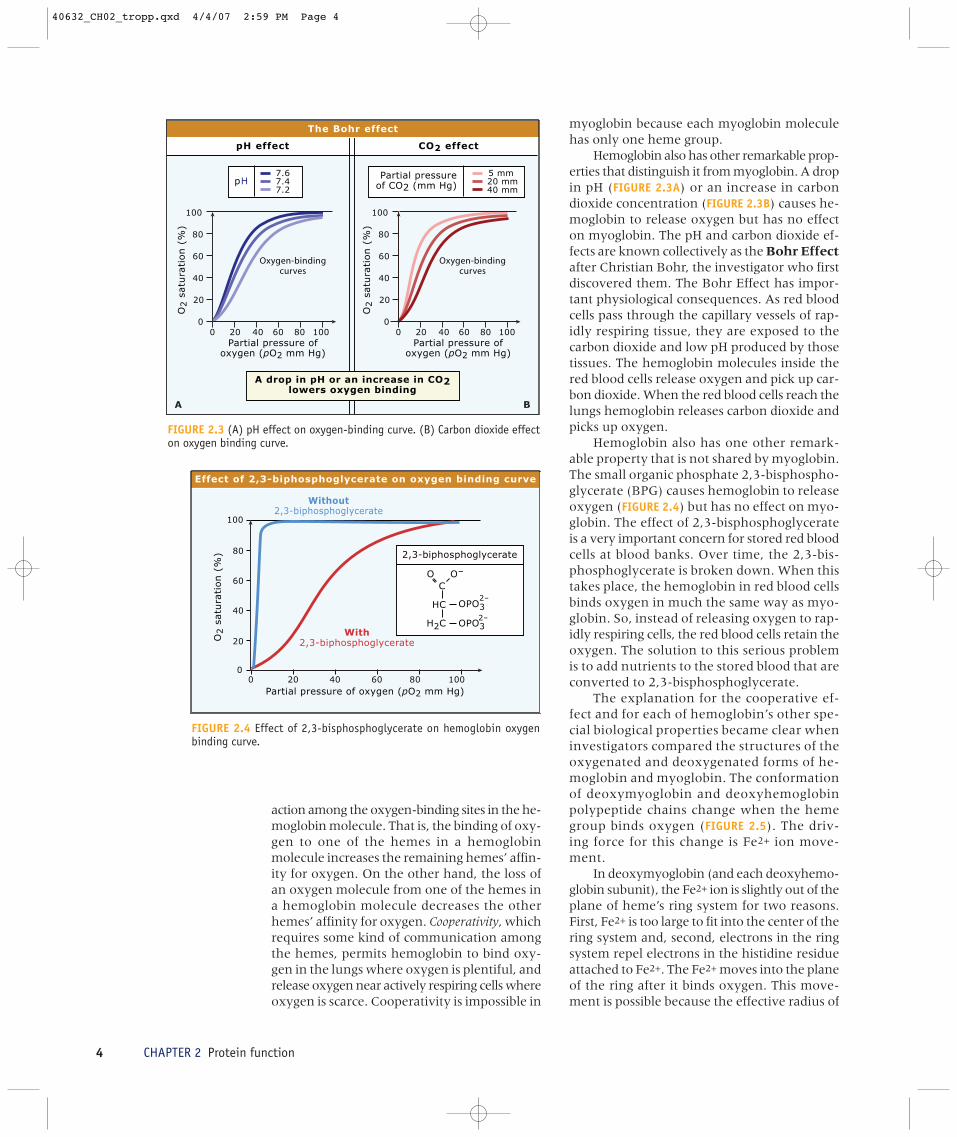
Hemoglobin also has other remarkable prop-erties that distinguish it from myoglobin. A dropin pH (FIGURE 2.3A) or an increase in carbondioxide concentration (FIGURE 2.3B) causes he-moglobin to release oxygen but has no effecton myoglobin. The pH and carbon dioxide ef-fects are known collectively as the Bohr Effectafter Christian Bohr, the investigator who firstdiscovered them. The Bohr Effect has impor-tant physiological consequences. As red bloodcells pass through the capillary vessels of rap-idly respiring tissue, they are exposed to thecarbon dioxide and low pH produced by thosetissues. The hemoglobin molecules inside thered blood cells release oxygen and pick up car-bon dioxide. When the red blood cells reach thelungs hemoglobin releases carbon dioxide andpicks up oxygen.
Hemoglobin also has one other remark-able property that is not shared by myoglobin.The small organic phosphate 2,3-bisphospho-glycerate (BPG) causes hemoglobin to releaseoxygen (FIGURE 2.4) but has no effect on myo-globin. The effect of 2,3-bisphosphoglycerateis a very important concern for stored red bloodcells at blood banks. Over time, the 2,3-bis-phosphoglycerate is broken down. When thistakes place, the hemoglobin in red blood cellsbinds oxygen in much the same way as myo-globin. So, instead of releasing oxygen to rap-idly respiring cells, the red blood cells retain theoxygen. The solution to this serious problemis to add nutrients to the stored blood that areconverted to 2,3-bisphosphoglycerate.
The explanation for the cooperative ef-fect and for each of hemoglobin’s other spe-cial biological properties became clear wheninvestigators compared the structures of theoxygenated and deoxygenated forms of he-moglobin and myoglobin. The conformationof deoxymyoglobin and deoxyhemoglobinpolypeptide chains change when the hemegroup binds oxygen (FIGURE 2.5). The driv-ing force for this change is Fe2+ ion move-ment.
In deoxymyoglobin (and each deoxyhemo-globin subunit), the Fe2+ ion is slightly out of theplane of heme’s ring system for two reasons.First, Fe2+ is too large to fit into the center of thering system and, second, electrons in the ringsystem repel electrons in the histidine residueattached to Fe2+. The Fe2+ moves into the planeof the ring after it binds oxygen. This move-ment is possible because the effective radius of
5 mm 20 mm40 mm
7.67.47.2
00
20
20 40 60 80 100
40
60
80
100
O2 s
atu
rati
on (
%)
O2 s
atu
rati
on (
%)
00
20
20 40 60 80 100
40
60
80
100
pHPartial pressure
of CO2 (mm Hg)
Partial pressure ofoxygen (pO2 mm Hg)
Partial pressure ofoxygen (pO2 mm Hg)
pH effect CO2 effect
Oxygen-bindingcurves
Oxygen-bindingcurves
The Bohr effect
A drop in pH or an increase in CO2lowers oxygen binding
A B
FIGURE 2.3 (A) pH effect on oxygen-binding curve. (B) Carbon dioxide effecton oxygen binding curve.
100
100
80
80
60
60
40
40
20
200
0
With2,3-biphosphoglycerate
Without2,3-biphosphoglycerate
O2 s
atu
rati
on (
%)
Partial pressure of oxygen (pO2 mm Hg)
2,3-biphosphoglycerate
C
OPO3
HC
O O-
H2C2-
OPO32-
Effect of 2,3-biphosphoglycerate on oxygen binding curve
FIGURE 2.4 Effect of 2,3-bisphosphoglycerate on hemoglobin oxygenbinding curve.
40632_CH02_tropp.qxd 4/4/07 2:59 PM Page 4

2.2 Differences in myoglobin and hemoglobin function are explained by differences in myoglobin and hemoglobin structure 5
the Fe2+ ion decreases upon binding oxygen,and the binding energy of the Fe2+ ion for oxy-gen exceeds the repulsive electrostatic forcesbetween the heme ring system and the histi-dine residue. As Fe2+ moves into the plane ofthe heme system, it pulls the attached histidineand its associated helix along with it. In myo-globin, the helix is not locked into place and sois free to move.
The situation is different in hemoglobinbecause the conformation of each chain is sta-bilized by ionic bonds to other chains.Therefore, ionic bonds between hemoglobinchains must be broken before a chain canchange from the deoxygenated form to theoxygenated form. Disruption of salt bridgesbetween chains in a hemoglobin molecule notonly affects the subunit that binds oxygen butalso the subunits with which it interacts.Therefore, the binding of oxygen to one sub-unit also loosens restraints on other subunits,making it easier for them to bind oxygen. Thiscooperative interaction is responsible for thesigmoidal shape of the oxygen-binding curvefor hemoglobin.
The Bohr Effect can also be explained interms of hemoglobin’s quaternary structure. Thenumber of salt bridges between the polypeptidesubunits increases when H+ or carbon dioxidebind to the polypeptide subunits, stabilizing thestructure of the deoxygenated form of hemoglo-bin. 2,3-Bisphosphoglycerate also interacts bystabilizing the structure of deoxygenated hemo-globin; it fits into a cavity between the �-sub-units of deoxyhemoglobin forming an ionic bridgebetween them (FIGURE 2.6). Oxyhemoglobin,which lacks the cavity, cannot bind BPG.Deoxyhemoglobin must release BPG before itcan bind oxygen and oxyhemoglobin must re-lease oxygen before it can bind BPG. Thus, eventhough the oxygen- and BPG-binding sites aredistinct and distant, binding at one site preventsbinding at the other.
Carbon dioxide, H+, and BPG all lower theability of hemoglobin to bind oxygen by increas-ing the number of salt links between the sub-units of hemoglobin. Thus, each acts at a sitedistinct from the oxygen-binding site. Moleculesthat influence protein activity by binding to sitesthat are distinct from the functional or activesites are called allosteric effectors. Thus, bind-ing an allosteric effector to a site on the proteinthat is some distance from the active site canmodify a protein’s activity, permitting the pro-tein to “sense” its chemical environment andto act accordingly.
HisHis
0.6 AFe2+
O2
HEME RING
DESOXYHEMOGLOBIN
SUBUNITOXYHEMOGLOBIN
SUBUNITHELIX
HELIX
Movement of heme and helix during transition
FIGURE 2.5 Movement of Fe2+ and its associated helix during the transitionfrom deoxyhemoglobin to oxyhemoglobin. In deoxymyoglobin (and each de-oxyhemoglobin subunit), the Fe2+ ion is slightly out of the plane of heme’sring system. Fe2+ moves into the plane of the ring after it binds oxygen. AsFe2+ moves into the plane of the heme system, it pulls its attached histidinewith its associated helix along with it.
Human deoxyhemoglobin with BPG bound to β-globin chains
β chains
α chains
BPG (2,3-biphosphoglycerate)
FIGURE 2.6 Human deoxyhemoglobin with 2,3-bisphosphoglycerate boundto the two �-globin chains. The globin chains are in cartoon display witheach chain a different color. The heme groups are in van der Waals display andthe 2,3-bisphosphoglycerate bound to the two �-globin chains in the cavityformed by the four globin chains is in ball-an-stick display. Protein Data Bankfile 1B86.
40632_CH02_tropp.qxd 4/4/07 2:59 PM Page 5

6 CHAPTER 2 Protein function
Normal adult hemoglobin(HbA) differs from sicklecell hemoglobin (HbS) byonly one amino acid
In 1904, a West Indian student of African ori-gin who was suffering from anemia, recurrentpains, leg ulcers, jaundice, a low red blood cellcount, and an enlarged heart sought the assis-tance of James Herrick, a Chicago physician.Upon examining the student’s blood under themicroscope, Herrick observed that many redblood cells had a sickle or crescent shape ratherthan the biconcave appearance normally ob-served. Herrick hypothesized that the sickle-shaped red blood cells might be the key tounderstanding the patient’s anemia and othersymptoms. The disease suffered by the student,which is now known to be an inborn error ofmetabolism, was given the name sickle cellanemia.
Herrick’s hypothesis received additionalsupport in 1927, when investigators observedthat red blood cells isolated from individualswith sickle cell anemia change from a bicon-cave to a sickle shape when deprived of oxy-gen, whereas red blood cells from normalindividuals remain biconcave (FIGURE 2.7).
Linus Pauling and coworkers tried a new
Key concepts• Deoxygenated red blood cells of those who suffer
from sickle cell anemia have a crescent (sickle)shape, rather than the normal biconcave shape.
• The substitution of one amino acid for another onthe � chain of the hemoglobin drastically altersthe protein’s function.
• Carriers of the sickle cell trait are more resistant tomalaria than those with normal hemoglobin.
2.3approach to the study of sickle cell anemia in1949. They knew that hemoglobin, the majorprotein in red blood cells, was responsible forbinding oxygen and suspected that individualswith sickle cell anemia have a variant form ofhemoglobin. Their hypothesis was tested bycomparing the electrophoretic mobilities of nor-mal adult hemoglobin (HbA) and sickle cell he-moglobin (HbS). HbA migrated as though itwere slightly more negative than HbS, suggest-ing that sickle cell anemia is caused by one ormore amino acid substitutions in hemoglobin.However, the studies by Pauling and cowork-ers did not reveal whether the amino acid sub-stitution(s) altered the �-globin chain, �-globinchain, or both, nor did the studies reveal whichamino acid(s) was (were) altered.
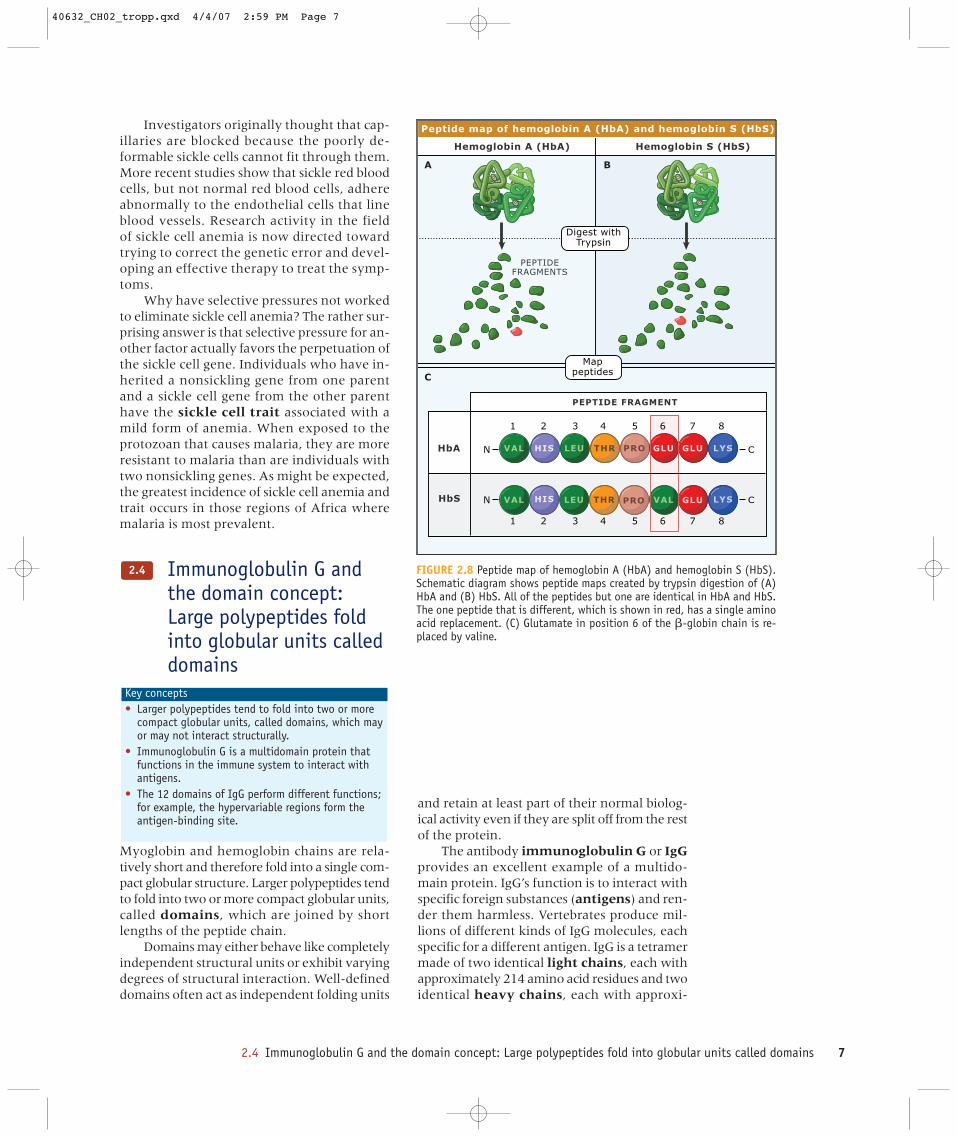
The problem was solved in an ingeniousfashion by Vernon Ingram in 1954. Moderntechniques for sequencing polypeptide chainswere not yet available, so Ingram could notcompare the two forms of hemoglobin aminoacid by amino acid. Instead, he used trypsin tocut HbA and HbS into well-defined fragments,which he spotted onto filter paper and partiallyseparated by electrophoresis. Then he dried thepaper, turned it on a right angle, and developedit in a second direction by chromatography.Because each type of protein treated in this fash-ion yields a unique two-dimensional pattern,the method is called peptide fingerprintingor peptide mapping. With one important ex-ception, the “fingerprint” of HbS is identical tothat of HbA (FIGURE 2.8).
Amino acid and sequence analyses showedthat the fragment obtained from HbA thatdoes not match up with one from HbS is anoctapeptide derived from the N-terminal endof the � chain. The only difference betweenthe two fragments is that HbS contains a va-line residue in place of the glutamate residuefound in HbA. This substitution was shownto be in the sixth residue from the N-terminalresidue of the � chain (FIGURE 2.8C). The ob-served substitution is consistent with the ob-servation by Pauling and coworkers that HbAmigrates as a slightly more negatively chargedprotein than does HbS. Ingram’s studiesshowed for the first time that a single aminoacid substitution can cause a profound changein protein function. This finding stimulatedgreat interest in the nascent field of molecu-lar biology and reinforced the importance ofstudying structure–function relationships.Moreover, Ingram’s studies introduced pep-tide mapping, a very powerful technique thatis still used today.
Biconcave Sickle shaped
Biconcave and sickle shaped red blood cells
Biconcave Sickle shaped
FIGURE 2.7 Biconcave- and sickle-shaped red blood cells. © Dr. StanleyFlegler/Visuals Unlimited.
40632_CH02_tropp.qxd 4/4/07 2:59 PM Page 6
2.4 Immunoglobulin G and the domain concept: Large polypeptides fold into globular units called domains 7
Investigators originally thought that cap-illaries are blocked because the poorly de-formable sickle cells cannot fit through them.More recent studies show that sickle red bloodcells, but not normal red blood cells, adhereabnormally to the endothelial cells that lineblood vessels. Research activity in the fieldof sickle cell anemia is now directed towardtrying to correct the genetic error and devel-oping an effective therapy to treat the symp-toms.
Why have selective pressures not workedto eliminate sickle cell anemia? The rather sur-prising answer is that selective pressure for an-other factor actually favors the perpetuation ofthe sickle cell gene. Individuals who have in-herited a nonsickling gene from one parentand a sickle cell gene from the other parenthave the sickle cell trait associated with amild form of anemia. When exposed to theprotozoan that causes malaria, they are moreresistant to malaria than are individuals withtwo nonsickling genes. As might be expected,the greatest incidence of sickle cell anemia andtrait occurs in those regions of Africa wheremalaria is most prevalent.
Immunoglobulin G andthe domain concept:Large polypeptides foldinto globular units calleddomains
Myoglobin and hemoglobin chains are rela-tively short and therefore fold into a single com-pact globular structure. Larger polypeptides tendto fold into two or more compact globular units,called domains, which are joined by shortlengths of the peptide chain.
Domains may either behave like completelyindependent structural units or exhibit varyingdegrees of structural interaction. Well-defineddomains often act as independent folding units
Key concepts• Larger polypeptides tend to fold into two or more
compact globular units, called domains, which mayor may not interact structurally.
• Immunoglobulin G is a multidomain protein thatfunctions in the immune system to interact withantigens.
• The 12 domains of IgG perform different functions;for example, the hypervariable regions form theantigen-binding site.
2.4
and retain at least part of their normal biolog-ical activity even if they are split off from the restof the protein.
The antibody immunoglobulin G or IgGprovides an excellent example of a multido-main protein. IgG’s function is to interact withspecific foreign substances (antigens) and ren-der them harmless. Vertebrates produce mil-lions of different kinds of IgG molecules, eachspecific for a different antigen. IgG is a tetramermade of two identical light chains, each withapproximately 214 amino acid residues and twoidentical heavy chains, each with approxi-
PRO
PRO
LEU
LEU
VAL VAL
VAL
THR
THR
HIS
HIS
LYS
LYSGLU
GLU
GLU
Hemoglobin A (HbA) Hemoglobin S (HbS)
PEPTIDEFRAGMENTS
PEPTIDE FRAGMENT
N C
N C
1 2 3 4 5 6 7 8
1 2 3 4 5 6 7 8
Digest with Trypsin
Mappeptides
HbA
HbS
Peptide map of hemoglobin A (HbA) and hemoglobin S (HbS)
A
C
B
FIGURE 2.8 Peptide map of hemoglobin A (HbA) and hemoglobin S (HbS).Schematic diagram shows peptide maps created by trypsin digestion of (A)HbA and (B) HbS. All of the peptides but one are identical in HbA and HbS.The one peptide that is different, which is shown in red, has a single aminoacid replacement. (C) Glutamate in position 6 of the �-globin chain is re-placed by valine.
40632_CH02_tropp.qxd 4/4/07 2:59 PM Page 7

8 CHAPTER 2 Protein function
mately 446 amino acid residues (FIGURE 2.9).Each L-chain is attached to an H-chain by adisulfide bond as well as by weak non-covalentinteractions. Disulfide bonds and weak nonco-valent interactions also join the two H-chains.
Each L-chain can be divided into two re-gions of about equal size. The first region, ex-tending from residue 1 to 108, has differentsequences in different IgG molecules and istherefore called the variable region of the L-chain (abbreviated VL). The second region, ex-tending from residue 109 to the end of the chain,has the same sequence in all IgG molecules andis therefore called the constant region of the L-chain (abbreviated CL).
The H-chain also has a variable region (VH)extending from residue 1 to about residue 110.The remainder of the H-chain can be dividedinto three regions of about equal size, each witha constant amino acid sequence. Each of these
constant regions, called CH1, CH2, and CH3, hasan amino acid sequence that is quite similar butnot identical to the others. C and V regions haveseparate functions in IgG. C regions are respon-sible for the overall structure of the molecule andfor its recognition by other components of theimmune system. V regions confer antigen-bind-ing specificity.
Three small regions within VL and anotherthree within VH display much more variationthan the rest of the variable regions. These re-gions, called hypervariable regions, make anespecially important contribution to antigen-bind-ing specificity. As one might expect, V regions ofboth the L and H chains are closely associated andcomprise the antigen-binding regions in IgG.
X-ray crystallography studies indicate thateach region of the L- and H-chains fold into acompact globular structure or domain, produc-ing 12 domains (FIGURE 2.10). Constant regiondomains from either light or heavy chains foldin the same way, resembling a collapsed barrelwith four � strands on one side and three onthe other (Figure 2.10). A short loop joins each� strand to the one next to it.
Domains formed by the variable regions ofthe L- and H-chains also resemble collapsed bar-rels. However, one side of the barrel has five �strands rather than three strands. The hyper-variable regions are located in the loops joiningthe � strands in the VL and VH domains.Hypervariable regions from neighboring H- andL-chains form the antigen-binding site.
Enzymes are proteins thatcatalyze chemicalreactions
We now apply the lessons learned from study-ing the globins and immunoglobulins to pro-tein catalysts known as enzymes. Virtually allchemical reactions that take place in the cell arecatalyzed by enzymes or RNA catalysts calledribozymes. Enzymes catalyze the vast major-ity of the reactions involved in DNA, RNA, andprotein metabolism. A large number of differ-ent enzymes are required to catalyze a complexprocess such as replication, transcription, ortranslation. To understand these processes, wemust learn how the enzymes involved in themwork.
Key concept• Enzymes catalyze such vital processes as replica-
tion, transcription, and translation.
2.5
S
S
S
S
S
S
S
S
S
S
S SS S
SS
SS
SS S
S
SS
S SS S
SSS
S
Heavy chainLight chain
Antigenbinding
site
CONSTANTDOMAINS
VARIABLEDOMAINS
C
C
C
C
VLVL
CL CLVH VH
CH1 CH1
CH2 CH2
CH3 CH3
S S Disulfide bond
Schematic of immunoglobin G (IgG) structure
FIGURE 2.9 Schematic of immunoglobulin G (IgG) structure.
40632_CH02_tropp.qxd 4/4/07 2:59 PM Page 8

2.6 Different methods can be used to detect enzyme activity 9
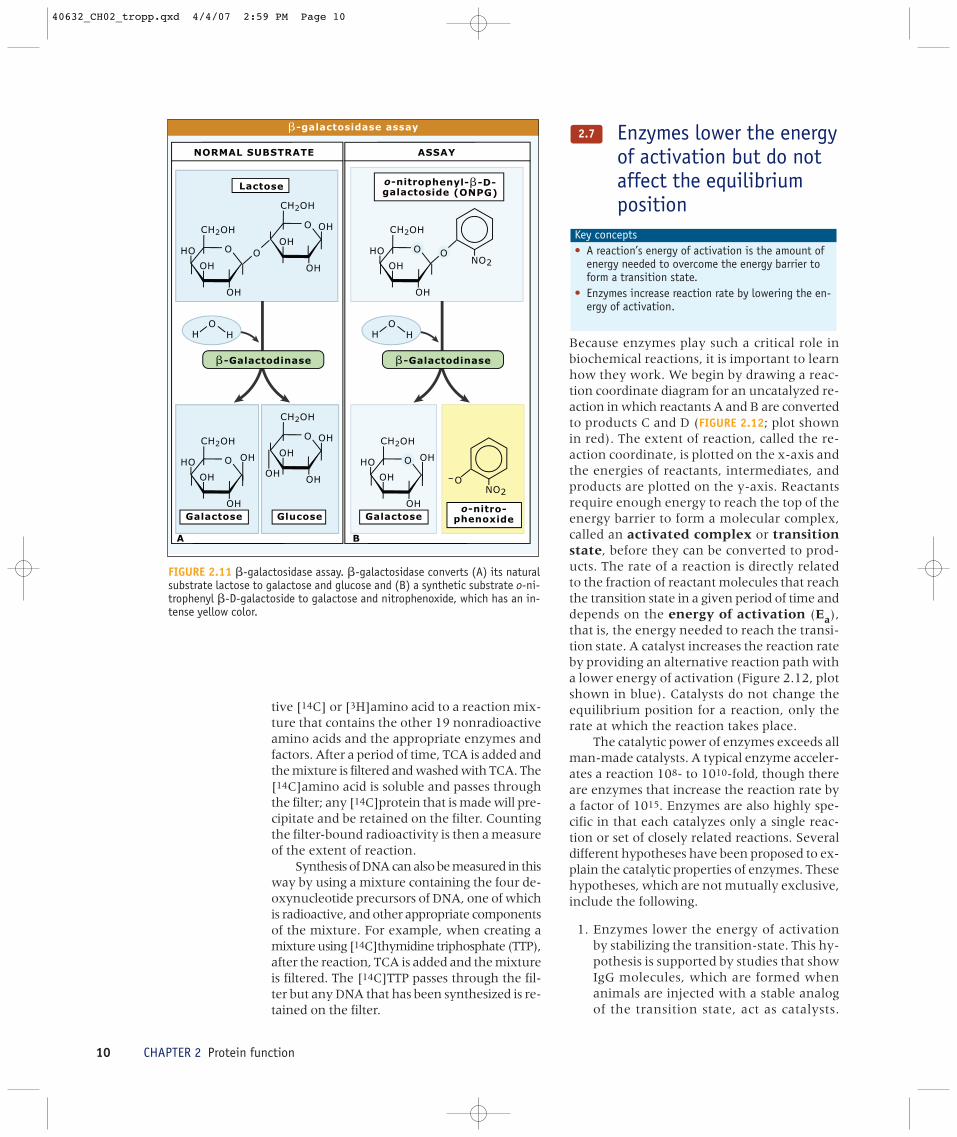
trophotometer. For this reason, investigatorsoften work with specially designed substratesthat generate products with unique light ab-sorption properties. One such specially de-signed substrate is �-nitrophenyl-�-D-galactoside (ONPG), which is used to assay �-galactosidase, an enzyme that cleaves lactoseto form galactose and glucose (FIGURE 2.11A).The bond broken, a �-galactoside linkage isalso present in ONPG. �-galactosidase hy-drolyzes the colorless ONPG to form galactoseand �-nitrophenoxide, which is intensely yel-low (FIGURE 2.11B). Thus, �-galactosidase activ-ity is readily followed by measuring theconcentration of �-nitrophenoxide at a wave-length of 420 nm (blue light).
In a radioactivity assay, radioactive sub-strate is added to a reaction mixture and eitherthe appearance of radioactive product or theloss of radioactive substrate is measured. Thistype of assay is used to measure the conversionof a radioactive amino acid into a radioactiveprotein or a radioactive nucleotide into a ra-dioactive nucleic acid. The assay used is basedupon the following fact: proteins and nucleicacids are insoluble in 0.5 M trichloracetic acid(TCA), whereas amino acids and nucleotidesare TCA-soluble. This property allows proteinsynthesis to be measured by adding a radioac-
Different methods can beused to detect enzymeactivity
The molecule on which an enzyme acts is itssubstrate. Only a small number of substratemolecules, sometimes only one, participate ina single catalyzed reaction. Enzymatic activ-ity is measured by following the rate of sub-strate breakdown or product formation. Severaldifferent physical techniques can be used tomonitor an enzyme-catalyzed reaction. Thetwo most common techniques used are col-orimetric and radiotracer techniques.
Colorimetric assays are based on the fact thata substrate (or product) absorbs light of a par-ticular wavelength. When a substance that ab-sorbs visible or ultraviolet light is either asubstrate or product of an enzyme-catalyzedreaction, then substrate breakdown or prod-uct formation can be followed using a spec-
Key concepts• Enzymes act on substrates.• Enzyme activity can be monitored using colorimet-
ric (light absorption) or radiotracer (radioactivity)techniques.
2.6
Light chains
Heavy chainsVL
CL
VH
CH1
CL
VL
CH1
VH
CH2
CH3CH2
CH3
Structure of mouse immunoglobin G
FIGURE 2.10 Structure of mouse immunoglobulin G. Immunoglobulin G foldsinto a total of 12 domains. Each light chain (red and red-orange) has twodomains and each heavy chain (blue and blue-green) has four domains.Protein Data Bank number 1IGY.
40632_CH02_tropp.qxd 4/4/07 2:59 PM Page 9
10 CHAPTER 2 Protein function
tive [14C] or [3H]amino acid to a reaction mix-ture that contains the other 19 nonradioactiveamino acids and the appropriate enzymes andfactors. After a period of time, TCA is added andthe mixture is filtered and washed with TCA. The[14C]amino acid is soluble and passes throughthe filter; any [14C]protein that is made will pre-cipitate and be retained on the filter. Countingthe filter-bound radioactivity is then a measureof the extent of reaction.
Synthesis of DNA can also be measured in thisway by using a mixture containing the four de-oxynucleotide precursors of DNA, one of whichis radioactive, and other appropriate componentsof the mixture. For example, when creating amixture using [14C]thymidine triphosphate (TTP),after the reaction, TCA is added and the mixtureis filtered. The [14C]TTP passes through the fil-ter but any DNA that has been synthesized is re-tained on the filter.
Enzymes lower the energyof activation but do notaffect the equilibriumposition
Because enzymes play such a critical role inbiochemical reactions, it is important to learnhow they work. We begin by drawing a reac-tion coordinate diagram for an uncatalyzed re-action in which reactants A and B are convertedto products C and D (FIGURE 2.12; plot shownin red). The extent of reaction, called the re-action coordinate, is plotted on the x-axis andthe energies of reactants, intermediates, andproducts are plotted on the y-axis. Reactantsrequire enough energy to reach the top of theenergy barrier to form a molecular complex,called an activated complex or transitionstate, before they can be converted to prod-ucts. The rate of a reaction is directly relatedto the fraction of reactant molecules that reachthe transition state in a given period of time anddepends on the energy of activation (Ea),that is, the energy needed to reach the transi-tion state. A catalyst increases the reaction rateby providing an alternative reaction path witha lower energy of activation (Figure 2.12, plotshown in blue). Catalysts do not change theequilibrium position for a reaction, only therate at which the reaction takes place.
The catalytic power of enzymes exceeds allman-made catalysts. A typical enzyme acceler-ates a reaction 108- to 1010-fold, though thereare enzymes that increase the reaction rate bya factor of 1015. Enzymes are also highly spe-cific in that each catalyzes only a single reac-tion or set of closely related reactions. Severaldifferent hypotheses have been proposed to ex-plain the catalytic properties of enzymes. Thesehypotheses, which are not mutually exclusive,include the following.
1. Enzymes lower the energy of activationby stabilizing the transition-state. This hy-pothesis is supported by studies that showIgG molecules, which are formed whenanimals are injected with a stable analogof the transition state, act as catalysts.
Key concepts• A reaction’s energy of activation is the amount of
energy needed to overcome the energy barrier toform a transition state.
• Enzymes increase reaction rate by lowering the en-ergy of activation.
2.7
CH2OH
O
OH
OH
CH2OH
O
OH
OHHO O O
OH
CH2OH
O
OH
OH
CH2OH
O
OH
OHHO
OH
OH
OH
OH H
CH2OH
O
OH
OH
HO
-O
CH2OH
O
OH
OH
HO OH
OH H
NO2
NO2
�-galactosidase assay
ASSAYNORMAL SUBSTRATE
�-Galactodinase
Lactose o-nitrophenyl-�-D-galactoside (ONPG)
o-nitro-phenoxideGalactose Glucose
�-Galactodinase
Galactose
A B
FIGURE 2.11 �-galactosidase assay. �-galactosidase converts (A) its naturalsubstrate lactose to galactose and glucose and (B) a synthetic substrate o-ni-trophenyl �-D-galactoside to galactose and nitrophenoxide, which has an in-tense yellow color.
40632_CH02_tropp.qxd 4/4/07 2:59 PM Page 10

2.8 All enzyme reactions proceed through an enzyme-substrate complex 11
Catalytically active antibodies are calledabzymes.
2. Enzymes lower the energy of activation byputting a strain on a susceptible bond.Distortion of the susceptible bond makes iteasier to break the bond.
3. Enzymes lower the energy of activation forreactions involving two or more substratesby holding the substrates near to each otherand in the proper orientation.
4. Enzymes lower the energy of activation byforming a covalent bond with a reactantmolecule that destabilizes some other bond.
5. Enzymes lower the energy of activationby acting as proton donors and accep-tors.
All enzyme reactionsproceed through anenzyme-substratecomplex
In any enzyme-catalyzed reaction, the en-zyme, E, always combines with its substrate,S, to form an enzyme-substrate complex,ES, which can then either dissociate to re-form substrate or go forward to product, P,and enzyme, E. After the ES complex forms,the substrate is usually altered in some waythat facilitates further reaction. The processcan be summarized by the following equa-tion:
where k+1, k-1, and k+2 are rate constants for
E + S E + PESk+2
k+1
k-1
Key concepts• Since the reaction rate is directly proportional to
the enzyme-substrate concentration, the theoreti-cal maximum rate of reaction occurs when all en-zyme molecules are in complex with substrate.
• The turnover number is the number of substratemolecules converted to product by an enzyme in agiven amount of time.
• The selectivity of enzyme catalysis is due to speci-ficity in the active site; this specificity can beconferred by the lock-and-key mechanism (theshape of the active site is complementary to theshape of the substrate), or by induced fit (theshape of the active site changes to fit the sub-strate subsequent to binding).
2.8
the reaction. (By convention, kinetic constantsfor forward reactions k+1 and k+2 have a (+)symbol in their subscript, and kinetic constantsfor reverse reactions (k-1) have a (–) symbol intheir subscript.)
The rate of reaction is directly proportionalto the ES concentration. Hence, the theoreti-cal maximum rate of reaction (Vmax), is ob-served when all of the enzyme molecules arepresent in enzyme-substrate complexes. Theratio (k-1 + k+2)/k+1 is called the Michaelis con-stant (KM). For most enzymatic reactions, for-mation of ES is reversible in the sense that EScan dissociate, yielding free E and free S.
Usually, dissociation of the ES-complex ismore rapid than conversion of the complex toenzyme and product. When this is the case, thevalue of KM is a measure of the strength of theES binding. That is, when k-1���k+2, KM ap-proaches k-1/k+1, the dissociation constant forenzyme-substrate and KM is a measure of anenzyme’s affinity for its substrate. A high valueof KM indicates low affinity (and weak bind-ing), and a low value of KM means high affin-ity (and strong binding). Strength of bindingdepends on several conditions, such as temper-ature, pH, the presence of particular ions, andthe overall ion concentration. For most en-zymes, KM ranges from 10-6 to 10-1 M, whichshows that the affinity of E and S varies widely
BA
DC
Reactants
Products
Transition state
Transition state
Energy
Reaction coordinate
Reaction coordinates for uncatalyzed and catalyzed reactions
Total energyproduced
Activation energy of the catalyzed reaction
Activation energy of the uncatalyzed reaction
Uncatalyzed reactionCatalyzed reaction
FIGURE 2.12 Reaction coordinate diagram for an uncatalyzed reaction (red) andan enzyme catalyzed reaction (blue). The enzyme lowers the activation energybut does not affect the energy released by the reaction. The enzyme thereforeincreases the reaction rate but does not affect the equilibrium.
40632_CH02_tropp.qxd 4/4/07 2:59 PM Page 11

12 CHAPTER 2 Protein function
for different enzymes. Vmax and KM values canbe determined from a hyperbolic curve such asthat shown in FIGURE 2.13, which is generatedby plotting the initial rate of reaction (vo) onthe y-axis and substrate concentration ([S]) onthe x-axis. The theoretical maximum velocity
(Vmax) is the limiting velocity obtained as thesubstrate concentration approaches infinity. TheKM value corresponds to the substrate concen-tration at which the reaction rate is Vmax/2. Itis the same as the concentration at which halfof the enzyme molecules in the solution havetheir active sites occupied by a substrate mole-cule.
The number of substrate molecules convertedto product molecules by an enzyme molecule ina specified time is called the turnover number.The turnover number is determined by dividingVmax by the molar concentration of the total en-zyme present in the reaction mixture.
The site on the enzyme at which the sub-strate binds and the chemical reaction takesplace is called the active site. The extraordi-nary selectivity in enzyme catalysis is almostentirely a result of specificity of enzyme-sub-strate binding. The lock-and-key and inducedfit mechanisms have been proposed to explainhow enzymes bind their substrates (FIGURE 2.14).
In the lock-and-key mode, the shape of theactive site of the enzyme is complementary tothe shape of the substrate (FIGURE 2.14A). In theinduced fit mode, the enzyme changes shapeupon binding the substrate and the active sitehas a shape that is complementary to that ofthe substrate only after the substrate is bound.Although the induced fit model is primarily con-cerned with the change in enzyme shape, it isimportant to note that substrates often changeshapes when they bind to enzymes (FIGURE2.14B). For every enzyme-substrate interactionexamined to date, one of these two mechanismsapplies. It is often the case, though, that thesubstrate itself undergoes a small change inshape. In fact, the strain to which the substrateis subjected is often the principal mechanismof catalysis; that is, the substrate is held in anenormously reactive conformation.
Molecular details forenzyme-substratecomplexes have beenworked out for manyenzymes
Key concept• In many cases, protein structural changes occur
upon substrate binding.
2.9
Substrate
Products
Enzyme Enzyme
Enzyme
Enzyme
Activesites Active
siteActivesite
Enzyme
Enzyme
BA
BA
DC
BA
BA
DC
Enzyme-substrate reaction
Shapes are complementary before binding
Shapes are complementary after binding
LOCK-AND-KEY MODEL INDUCED FIT MODEL
Transition stateconformation
A B
FIGURE 2.14 Enzyme-substrate interaction. There are two majormechanisms of enzyme binding, (a) lock-and-key and (b) inducedfit. In the lock-and-key model, the shape of the active site of theenzyme is complementary to the shape of the substrate. In the in-duced fit mode, the enzyme changes shape upon binding the sub-strate and the active site has a shape that is complementary to thatof the substrate only after the substrate is bound.
Calculation of Vmax and KM
KMSubstrate concentration
Vmax
Vmax
2
Init
ial ra
te (
v o)
FIGURE 2.13 Calculation of Vmax and KM. Vmax and KM values canbe determined from a hyperbolic curve generated by plotting theinitial rates of reaction, vo, on the y-axis, and substrate concen-tration on the x-axis. The theoretical maximum velocity, Vmax, isthe limiting velocity obtained as the substrate concentration ap-proaches infinity. The KM value corresponds to the substrate con-centration at which the reaction rate is Vmax/2.
40632_CH02_tropp.qxd 4/4/07 2:59 PM Page 12
2.10 Regulatory enzymes control committed steps in biochemical pathways 13
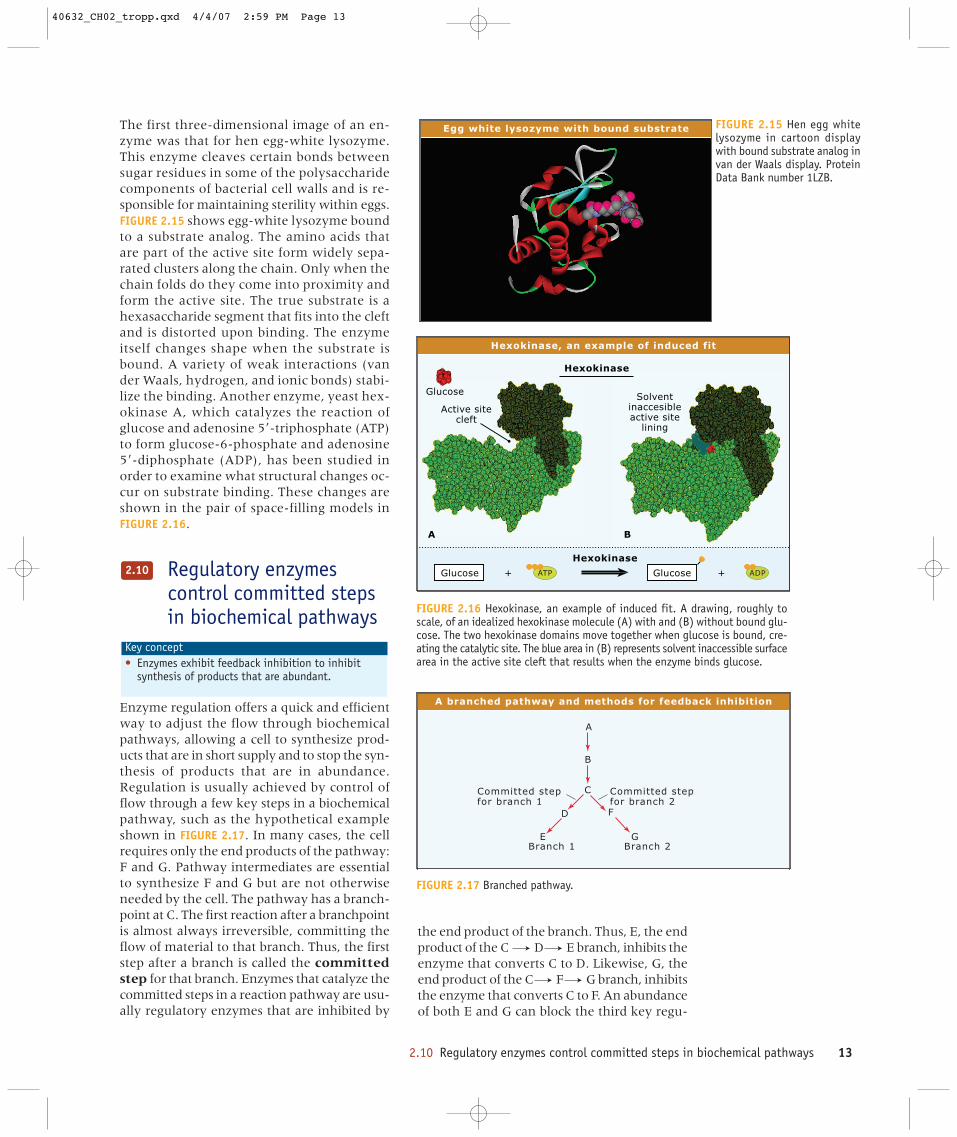
The first three-dimensional image of an en-zyme was that for hen egg-white lysozyme.This enzyme cleaves certain bonds betweensugar residues in some of the polysaccharidecomponents of bacterial cell walls and is re-sponsible for maintaining sterility within eggs.FIGURE 2.15 shows egg-white lysozyme boundto a substrate analog. The amino acids thatare part of the active site form widely sepa-rated clusters along the chain. Only when thechain folds do they come into proximity andform the active site. The true substrate is ahexasaccharide segment that fits into the cleftand is distorted upon binding. The enzymeitself changes shape when the substrate isbound. A variety of weak interactions (vander Waals, hydrogen, and ionic bonds) stabi-lize the binding. Another enzyme, yeast hex-okinase A, which catalyzes the reaction ofglucose and adenosine 5�-triphosphate (ATP)to form glucose-6-phosphate and adenosine5�-diphosphate (ADP), has been studied inorder to examine what structural changes oc-cur on substrate binding. These changes areshown in the pair of space-filling models inFIGURE 2.16.
Regulatory enzymescontrol committed stepsin biochemical pathways
Enzyme regulation offers a quick and efficientway to adjust the flow through biochemicalpathways, allowing a cell to synthesize prod-ucts that are in short supply and to stop the syn-thesis of products that are in abundance.Regulation is usually achieved by control offlow through a few key steps in a biochemicalpathway, such as the hypothetical exampleshown in FIGURE 2.17. In many cases, the cellrequires only the end products of the pathway:F and G. Pathway intermediates are essentialto synthesize F and G but are not otherwiseneeded by the cell. The pathway has a branch-point at C. The first reaction after a branchpointis almost always irreversible, committing theflow of material to that branch. Thus, the firststep after a branch is called the committedstep for that branch. Enzymes that catalyze thecommitted steps in a reaction pathway are usu-ally regulatory enzymes that are inhibited by
Key concept• Enzymes exhibit feedback inhibition to inhibit
synthesis of products that are abundant.
2.10
the end product of the branch. Thus, E, the endproduct of the C D E branch, inhibits theenzyme that converts C to D. Likewise, G, theend product of the C F G branch, inhibitsthe enzyme that converts C to F. An abundanceof both E and G can block the third key regu-
Egg white lysozyme with bound substrate FIGURE 2.15 Hen egg whitelysozyme in cartoon displaywith bound substrate analog invan der Waals display. ProteinData Bank number 1LZB.
A branched pathway and methods for feedback inhibition
A
B
C
D
E
F
GBranch 1
Committed stepfor branch 1
Committed stepfor branch 2
Branch 2
FIGURE 2.17 Branched pathway.
Active sitecleft
Hexokinase
Hexokinase
Glucose Glucose+ +ATP ADP
Glucose
Hexokinase, an example of induced fit
Solvent inaccesible active site
lining
A B
FIGURE 2.16 Hexokinase, an example of induced fit. A drawing, roughly toscale, of an idealized hexokinase molecule (A) with and (B) without bound glu-cose. The two hexokinase domains move together when glucose is bound, cre-ating the catalytic site. The blue area in (B) represents solvent inaccessible surfacearea in the active site cleft that results when the enzyme binds glucose.
40632_CH02_tropp.qxd 4/4/07 2:59 PM Page 13

14 CHAPTER 2 Protein function
latory enzyme in the path, the enzyme that con-verts A to B. This can occur in one of three ways(FIGURE 2.18). C will accumulate when bothbranches are blocked and inhibit the enzymethat converts A to B (FIGURE 2.18A). Alternatively,E and G will act together to block the enzymethat converts A to B (FIGURE 2.18B). Sometimesboth types of inhibition contribute (FIGURE 2.18C).The method of control, in which an end prod-uct inhibits specific steps in a biochemical path-way, is called feedback inhibition.
Regulatory enzymesexhibit sigmoidal kineticsand are stimulated orinhibited by allostericeffectors
Regulatory enzymes often produce S-shapedor sigmoidal kinetic curves when the ini-tial velocity (vo) is plotted on the y-axis andsubstrate concentration ([S]) is plotted on thex-axis (FIGURE 2.19). The reason for the S-shaped curve is exactly the same as that givenfor the oxygen-binding curve for hemoglo-bin. The regulatory enzyme is made of sub-units that bind substrate in a cooperativefashion.
Regulatory enzymes are also inhibited andstimulated by allosteric effectors. Once again,hemoglobin is a useful model. Subunits of an
Key concepts• Allosteric effectors can have a positive or negative
effect on enzyme activity. • Most regulatory enzymes acted upon by allosteric
effectors have more than one subunit; if the twoare different, the catalytic subunit contains an ac-tive site and the regulatory subunit has an al-losteric site.
2.11
allosteric enzyme can exist in two differentconformations, a more active conformationand a less active one. Allosteric effectors actby binding to sites on the enzyme that are dis-tinct from the catalytic site. Positive allostericeffectors, which stabilize the more active formof the enzyme, lower the substrate concentra-tion required to give half the maximal veloc-ity, increase Vmax, or both. Negative allostericeffectors, which stabilize the less active formof the enzyme, increase the substrate concen-tration required to give half the maximal ve-locity, decrease Vmax, or both. The activities ofmany regulatory enzymes are influenced by acombination of positive and negative allostericeffectors.
Regulatory proteins that are inhibited orstimulated by allosteric effectors are almost al-ways made of two or more subunits (FIGURE2.20). When the subunits are all identical, eachsubunit has an active site and at least one al-losteric site (FIGURE 2.20A). When the subunitsare different, one kind of subunit, the catalyticsubunit, has the active site and another typeof subunit, the regulatory subunit, has theallosteric site(s) (FIGURE 2.20B). Both types ofregulatory enzymes play important roles in thecell.
Vmax
V0Substrate concentration
Init
ial Rate
(V
0)
Sigmoidalcurve
Hyperboliccurve
Sigmoidal kinetics for regulatory enzymes
FIGURE 2.19 Sigmoidal kinetics for regulatory enzymes.Plots of substrate concentration versus initial velocity(vo) generate hyperbolic curves for nonregulatory enzymesbut usually generate sigmoidal curves for regulatory en-zymes. The sigmoidal curve indicates that substrate bind-ing is cooperative, that is, the binding of a substratemolecule to one enzyme subunit increases the chances thatother enzyme subunits will also bind substrate molecules.
Alternative methods for feedback inhibition
A
B
C
D
E
F
GBranch 1
A
Branch 2
A
B
C
D
E
F
GBranch 1
B
Branch 2
A
B
C
D F
C
FIGURE 2.18 Alternative methods for feedback inhibition to take place in a pathway withtwo branch points.
40632_CH02_tropp.qxd 4/4/07 2:59 PM Page 14

2.13 G protein signal systems transmit external signals into the cell 15
Enzyme activity can bealtered by covalentmodification
Typically, allosteric regulation involves non-covalent modification of enzymes. Enzymesalso may be regulated by covalent modifi-cation. The activities of some enzymes aremodified by peptide bond cleavages. For in-stance, trypsinogen, an inactive precursorof trypsin, is converted to the active enzymeby peptide bond cleavage. The activities ofother enzymes are modified by phosphory-lating specific seryl, threonyl, or tyrosylresidues.
In some cases, phosphorylation in-creases the activity of an enzyme and inothers it decreases it. Enzymes that catalyzethe phosphorylation and dephosphoryla-tion of other enzymes are usually undersome form of control themselves. The na-ture of this control was elucidated by bio-chemists who wished to know how specifichormones such as glucagon and adrenalineregulate carbohydrate and lipid metabo-lism. The results obtained from the hor-mone studies provide important lessons forthe molecular biologist and so will be exam-ined in some detail.
Key concept• Enzyme activity can be modified by peptide bond
cleavage.
2.12
G protein signal systemstransmit external signalsinto the cell
In order for cells to interact with their envi-ronment and to communicate with other cells,they must be able to transfer informationacross their cell membrane. One method fordoing so involves transport of materials acrossthe cell membrane. Eukaryotic cells also useanother method, in which proteins belong-ing to the G protein signal system transferinformation (but not chemical substances)across the cell membrane. In its most basicform, the G protein signal system consists ofthree protein components: a receptor, a Gprotein complex, and an effector.Membrane proteins, which belong to the Gprotein signal system, play a central role inregulating the phosphorylation of specific en-zyme systems.
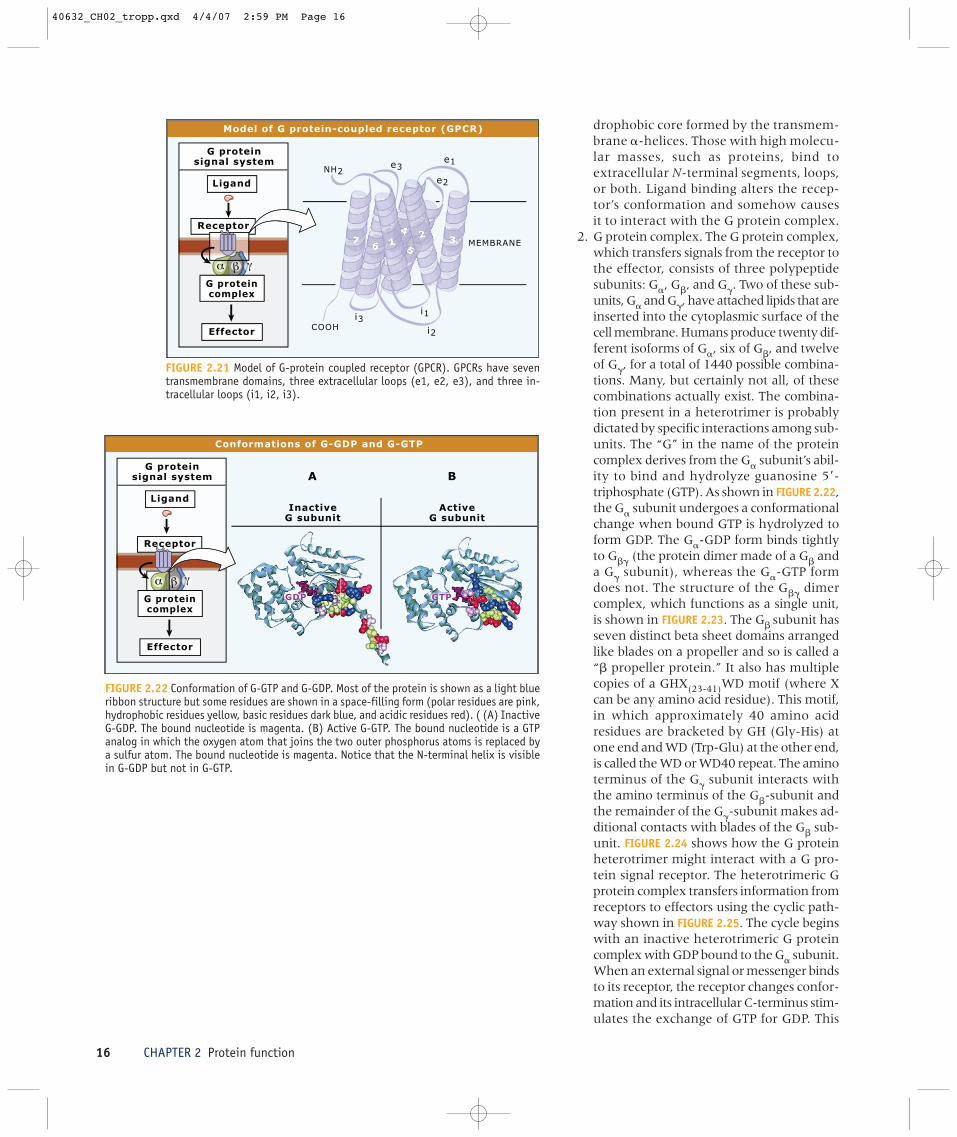
1. G protein-coupled receptors. Eukaryoticcells have a wide variety of receptors on theouter surface of their cell membrane. Eachreceptor responds to a unique externalphysical or chemical signal. These signalsrange in size from a single photon to apolypeptide such as the hormone glucagon.Each kind of receptor has its own uniqueamino acid sequence. Although varyinggreatly in specificity, the receptors haveseveral structural features in common.These features, which include an extra-cellular N-terminal segment, an intracel-lular C-terminal segment, and seven�-helical segments embedded in the cellmembrane to form the transmembranecore, are summarized in FIGURE 2.21. Threeextracellular loops and three intracellularloops connect the helical segments.Chemical signals with low molecularmasses, such as nucleotides, amines, andlipids, tend to bind to sites within the hy-
Key concepts• G protein signaling transmits information—but
not chemical substances—across cell membranes.• Ligand binding alters the conformation of a recep-
tor protein, causing it to interact with the G pro-tein complex.
• The G protein complex transfers signals from thereceptor to the effector.
• Effectors, such as adenylyl cyclase and phospholi-pase C, carry out the cellular response to the vari-ous stimuli detected by the receptor.
2.13Regulatory enzymes
Allostericsite
(a) Identical subunits
(b) Different subunits
Allostericsite
Allostericsite
Active site
Active site
Active site
Catalyticsubunit
Regulatorysubunit
FIGURE 2.20 Regulatory enzymes. Nearly all regulatoryenzymes are made up of two or more subunits. The sub-units of a regulatory enzyme may be (a) identical toone another or (b) different from one another.
40632_CH02_tropp.qxd 4/4/07 2:59 PM Page 15
16 CHAPTER 2 Protein function
drophobic core formed by the transmem-brane �-helices. Those with high molecu-lar masses, such as proteins, bind toextracellular N-terminal segments, loops,or both. Ligand binding alters the recep-tor’s conformation and somehow causesit to interact with the G protein complex.
2. G protein complex. The G protein complex,which transfers signals from the receptor tothe effector, consists of three polypeptidesubunits: G�, G�, and G�. Two of these sub-units, G� and G�, have attached lipids that areinserted into the cytoplasmic surface of thecell membrane. Humans produce twenty dif-ferent isoforms of G�, six of G�, and twelveof G�, for a total of 1440 possible combina-tions. Many, but certainly not all, of thesecombinations actually exist. The combina-tion present in a heterotrimer is probablydictated by specific interactions among sub-units. The “G” in the name of the proteincomplex derives from the G� subunit’s abil-ity to bind and hydrolyze guanosine 5�-triphosphate (GTP). As shown in FIGURE 2.22,the G� subunit undergoes a conformationalchange when bound GTP is hydrolyzed toform GDP. The G�-GDP form binds tightlyto G�� (the protein dimer made of a G� anda G� subunit), whereas the G�-GTP formdoes not. The structure of the G�� dimercomplex, which functions as a single unit,is shown in FIGURE 2.23. The G� subunit hasseven distinct beta sheet domains arrangedlike blades on a propeller and so is called a“� propeller protein.” It also has multiplecopies of a GHX(23-41)WD motif (where Xcan be any amino acid residue). This motif,in which approximately 40 amino acidresidues are bracketed by GH (Gly-His) atone end and WD (Trp-Glu) at the other end,is called the WD or WD40 repeat. The aminoterminus of the G� subunit interacts withthe amino terminus of the G�-subunit andthe remainder of the G�-subunit makes ad-ditional contacts with blades of the G� sub-unit. FIGURE 2.24 shows how the G proteinheterotrimer might interact with a G pro-tein signal receptor. The heterotrimeric Gprotein complex transfers information fromreceptors to effectors using the cyclic path-way shown in FIGURE 2.25. The cycle beginswith an inactive heterotrimeric G proteincomplex with GDP bound to the G� subunit.When an external signal or messenger bindsto its receptor, the receptor changes confor-mation and its intracellular C-terminus stim-ulates the exchange of GTP for GDP. This
GDP GTP
G proteinsignal system
Ligand
Effector
Receptor
G proteincomplex
InactiveG subunit
ActiveG subunit
Conformations of G-GDP and G-GTP
A B
FIGURE 2.22 Conformation of G-GTP and G-GDP. Most of the protein is shown as a light blueribbon structure but some residues are shown in a space-filling form (polar residues are pink,hydrophobic residues yellow, basic residues dark blue, and acidic residues red). ( (A) InactiveG-GDP. The bound nucleotide is magenta. (B) Active G-GTP. The bound nucleotide is a GTPanalog in which the oxygen atom that joins the two outer phosphorus atoms is replaced bya sulfur atom. The bound nucleotide is magenta. Notice that the N-terminal helix is visiblein G-GDP but not in G-GTP.
G proteinsignal system
Ligand
COOH
NH2
7 62 3
4
5
Effector
Receptor
G proteincomplex
i1
e1
e2
e3
i3i2
Model of G protein-coupled receptor (GPCR)
MEMBRANE
FIGURE 2.21 Model of G-protein coupled receptor (GPCR). GPCRs have seventransmembrane domains, three extracellular loops (e1, e2, e3), and three in-tracellular loops (i1, i2, i3).
40632_CH02_tropp.qxd 4/4/07 2:59 PM Page 16

2.13 G protein signal systems transmit external signals into the cell 17
nucleotide exchange causes the G� subunitto change from the inactive G�-GDP form tothe active G�-GTP form, which then sepa-rates from the G�� subunit. Once the het-erotrimeric G protein complex dissociates,G�-GTP and G�� subunits are free to inter-act with effectors. However, this interactionis short-lived because the G� subunit hy-drolyzes the bound GTP and the resultingG�-GDP complex once again assumes its in-active conformation, causing it to bind to theG�� subunit and re-form the heterotrimericprotein.
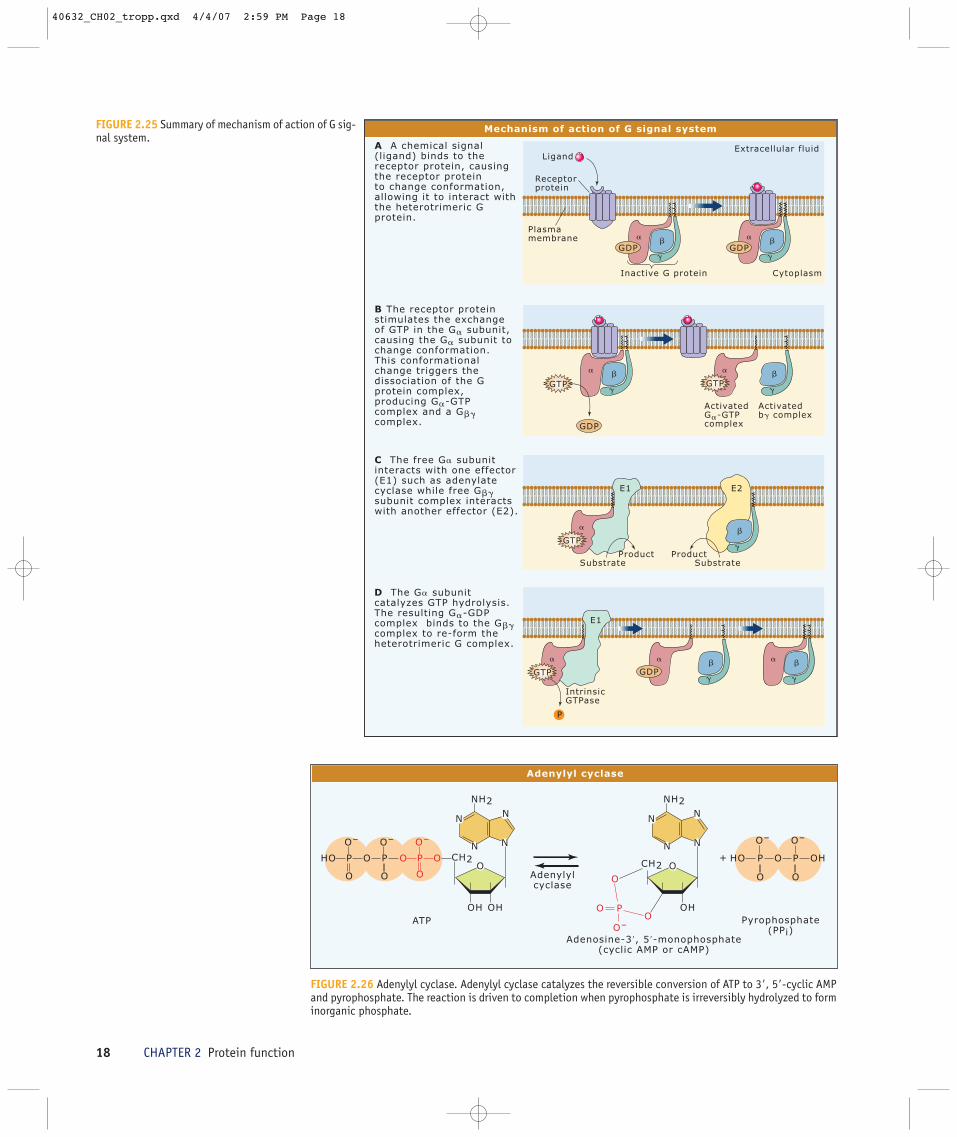
3. Effectors. Cells require a wide variety ofeffectors to allow them to respond effec-tively to the myriad chemical and physicalstimuli they encounter. We limit the pres-ent discussion to adenylyl cyclase andphospholipase C. Adenylyl cyclase is anintegral membrane protein that convertsATP to cyclic AMP (cAMP) and pyrophos-phate (FIGURE 2.26). Nine isozymes of mam-malian adenylyl cyclase have been cloned.Each appears to have two transmembraneregions with functions that are not yet
known and two cytoplasmic regions that as-sociate to form the catalytic site (FIGURE2.27). One isoform of GTP-bound G� pro-tein known as Gs� activates all mammalianadenylyl cyclases. The subscript s indicatesstimulation. Another isoform of GTP-boundG� protein called Gi� inhibits some formsof adenylate cyclase, where the subscript iindicates inhibition. External signals, act-ing through specific G-coupled receptors,induce the formation of the Gs�-GTP com-plex or the Gi�-GTP complex. Thus, oneexternal signal may induce cAMP forma-tion while another may inhibit its forma-tion. The G�� subunit also influencesadenylyl cyclase activity. Once formed, thecyclic nucleotide activates cAMP-depend-ent protein kinase A (FIGURE 2.28). Eachprotein kinase A molecule has two catalyticsubunits (C) and two regulatory subunits(R) and so has the general formula R2C2.Each R-subunit has two cAMP binding sites.When cAMP binds to these sites, the R2dimer is released and the C-subunits, nowfree of the regulatory proteins, catalyze
GDP
G proteinsignal system
Ligand
Effector
Receptor
G proteincomplex
G protein signalreceptor
HeterotrimericG protein
MEMBRANE
G protein interaction with G protein signal receptor
FIGURE 2.24 G-protein heterotrimer interaction with a G-protein signal re-ceptor and the lipid bilayer. The G-protein signal receptor is shown in lightand dark green. 11-cis retinal, a photon acceptor bound to a transmembranehelical segment, is magenta. The conformations of the intra- and extracel-lular loops are not known and are hand-drawn to show the helical connec-tions. The G� subunit is medium blue, the G� subunit is pink, and G� is blue.The bound GDP is magenta. Regions of the heterotrimer that contact the re-ceptor are shown in red.
G proteinsignal system
Ligand
Effector
Receptor
G proteincomplex
The GβGγ subunit complex
FIGURE 2.23 The G�G� subunit complex. The G� subunit, which is shown inmetallic pink, resembles a propeller with seven blades. The G� subunit, whichis shown in blue, has an �-helical structure and lies at the outer edge of theG� subunit.
40632_CH02_tropp.qxd 4/4/07 2:59 PM Page 17
18 CHAPTER 2 Protein function
Adenylyl cyclase
N
N
N
N
NH2
CH2
OH OH
OO
O O
O–
P
O
O
O–
P
O
HO
O–
P
N
N
N
N
NH2
CH2
OH
OO
OO–
P
O
O
O–
P
O
HO OH
O–
P
OATP
Adenylylcyclase
Adenosine-3′, 5′-monophosphate(cyclic AMP or cAMP)
Pyrophosphate(PPi)
+
FIGURE 2.26 Adenylyl cyclase. Adenylyl cyclase catalyzes the reversible conversion of ATP to 3�, 5�-cyclic AMPand pyrophosphate. The reaction is driven to completion when pyrophosphate is irreversibly hydrolyzed to forminorganic phosphate.
Mechanism of action of G signal system
P
Receptorprotein
Plasmamembrane
Ligand
Inactive G protein
ActivatedG�-GTP complex
Activatedb� complex
� �
�
� �
�GDP GDP
� �
�
� �
�
GDP
Substrate SubstrateProduct Product
GTP GTP
� �
�GTP
E1 E2
E1
Cytoplasm
Extracellular fluid
� �
�
� �
�GTP
�
GDP
IntrinsicGTPase
D The G� subunit catalyzes GTP hydrolysis. The resulting G�-GDP complex binds to the G�� complex to re-form the heterotrimeric G complex.
A A chemical signal (ligand) binds to the receptor protein, causing the receptor protein to change conformation, allowing it to interact with the heterotrimeric G protein.
B The receptor protein stimulates the exchange of GTP in the G� subunit, causing the G� subunit to change conformation. This conformational change triggers the dissociation of the G protein complex, producing G�-GTP complex and a G�� complex.
C The free G� subunit interacts with one effector (E1) such as adenylate cyclase while free G�� subunit complex interacts with another effector (E2).
FIGURE 2.25 Summary of mechanism of action of G sig-nal system.
40632_CH02_tropp.qxd 4/4/07 2:59 PM Page 18

2.13 G protein signal systems transmit external signals into the cell 19
phosphoryl group transfer from ATP to spe-cific serine or threonine residues on targetenzymes. Some enzymes become more ac-tive when phosphorylated while others be-come less active.
Phosphoinositide-specific phospholi-pase C (PLC) also acts as an effector in eukary-otic cells. Members of this family of enzymes,which are also associated with the cell mem-brane, catalyze the hydrolytic cleavage of phos-phatidylinositol 4,5-bisphosphate to formdiacylglycerol and inositol 1,4,5-trisphosphate(FIGURE 2.29).
Mammalian cells synthesize three types ofPLC. The smallest of the three, PLC-�, is alsopresent in lower eukaryotes such as yeast. Theother two, PLC-� and PLC-�, share some se-quence homology with PLC-� but are abouttwice its size.
An isoform of GTP-bound G� protein calledGq� stimulates PLC-� (FIGURE 2.30). Both degra-dation products of the PLC-catalyzed reaction
act as intracellular messengers to regulate bio-logical processes. Inositol 1,4,5-trisphosphate dif-fuses away from the cell membrane andstimulates the endoplasmic reticulum to releaseits stored calcium ions to the cytoplasm, wherethe ions alter the activity of a wide variety of en-zymes. Diacylglycerol, the other product of thePLC-catalyzed reaction, acts together with phos-phatidylserine and calcium ions to activate pro-tein kinase C or C-kinase. Upon activation, proteinkinase C catalyzes the ATP-dependent phospho-rylation of other proteins and thereby modifiestheir physiological activity. Thus, external sig-nals such as photons, odorants, growth factors,hormones, and neurotransmitters act as “firstmessengers” to stimulate the G receptor signal sys-tem, while cAMP, inositol 1,4,5-trisphosphate,and diacylglycerol act as “second messengers” toalter the activity of intracellular enzymes as wellas membrane proteins. This remarkable mech-anism allows a cell to amplify an external signalconsisting of a single molecule and to then re-spond to it in an appropriate fashion.
Adenylyl cyclase structure
Ligand
G proteincomplex
+ AMPc
Receptor
Adenylylcyclase
Adenylyl cyclaseactivation
C Y TO P L A S M
Catalyticregion 1Catalytic
region 2
Trans-membraneregion 1
Trans-membraneregion 2
COOH
NH2
6
GiαGβγ
Gsα
ATP
FIGURE 2.27 Adenylyl cyclase structure. Composite figure showing high reso-lution image of the two catalytic domains attached to region drawn by artistto represent the two transmembrane regions. Binding sites for Gs�, Gi�, andG�� are indicated.
40632_CH02_tropp.qxd 4/4/07 2:59 PM Page 19

20 CHAPTER 2 Protein function
SummaryThe function of proteins is based on the specificinteractions between proteins and other mole-cules, called ligands. The necessary specificity ismade possible by the tertiary structure of eachprotein, dictated by the proteins amino acid se-quence (primary structure) of the polypeptide.Each kind of protein evolved to interact specif-ically with a particular ligand. Different types ofproteins carry out different functions throughligand binding. Transport proteins carry ligandsto where they are needed, or allow moleculesto pass through membranes. Storage proteins al-low cells to store higher concentrations of lig-ands than would normally be possible.Regulatory proteins can slow down or speed upbiological processes. Receptor proteins bind aligand, change conformation, and trigger a se-ries of metabolic changes.
Some of the earliest work on protein terti-ary structure was done on the globular oxygenstorage protein, myoglobin. The tertiary struc-tures of myoglobin and the oxygen transportprotein, hemoglobin, are nearly identical.Indeed, they identify several rules that apply toother globular proteins. They tend to be com-pact, have hydrophobic interiors and hydrophilicexteriors, and their tertiary structures are sta-bilized by weak interactions, such as ionic bonds,hydrogen bonds, van der Waals interactions,and hydrophobic interactions stabilize their ter-tiary structure. Globular proteins also tend tohave a high degree of conformational flexibil-ity.
Despite the similarities in tertiary structures,myoglobin and hemoglobin perform differentfunctions. This difference is explained by the factthat hemoglobin has a quaternary structure butmyoglobin does not. This dissimilarity causesthem to interact with oxygen in very differentmanners. The oxygen binding curve for myoglo-bin is hyperbolic whereas that for hemoglobin issigmoidal, indicating that hemoglobin binds oxy-gen cooperatively. This means that when oneheme in a hemoglobin molecule binds oxygen,the affinity for oxygen of other hemes in the mol-ecule increases. Since myoglobin has only oneheme per molecule, cooperativity is impossible.The Bohr Effect is observed in hemoglobin, butnot myoglobin; a decrease in pH or an increasein carbon dioxide concentration causes hemo-globin to release oxygen. This release occurs inthe body’s tissues when oxygen levels are low, butcarbon dioxide is plentiful. Hemoglobin deliversoxygen to the tissues, and picks up carbon diox-
2.14
PP
P
PP
P
PP P
� �
�
GDP
GTP
Activated� subunit
InactiveG protein
�
GTP
Phospholipase C
Ligand
Receptor
Extracellular fluid
Cytoplasm
Phosphatidylinositol 4,5-P2
DiacylglycerolActivated protein kinase C
Inositol-P3
Ca2+
Ca2+
Smooth endoplasmic reticulum
Phosphoinositide cascade
FIGURE 2.30 Phosphoinositide cascade.
+
Regulatorysubunit
Inactivecatalyticsubunit
Protein kinase (R2C
2)
(inactive)Cyclic AMP
Activecatalyticsubunit
Regulatorysubunit (R
2-cAMP
4)
Protein kinase activation by cAMP
FIGURE 2.28 Protein kinase activation by cAMP. cAMP binds to the regula-tory (R) subunits of protein kinase A, releasing the active catalytic (C) sub-units. Then the C subunits catalyze the ATP-dependent phosphorylation ofother proteins.
Phospholipase C activity
O
O O
O–
P
OHOH
OH
OPO32–
OPO32–
CH2
R2
R1
C HC
O
O
CO
O
CH2
O
–O O
O–
P
OHOH
OH
OPO32–
OPO32–
CH2 OH
R2
R1
C HC
O
O
CO
O
CH2
H2OPhospholipase C
Phosphatidylinositol-4,5-bisphosphate
Diacylglycerol Inositol-1,4,5-trisphosphate
+
FIGURE 2.29 Phospholipase C activity.
40632_CH02_tropp.qxd 4/4/07 2:59 PM Page 20
2.14 Summary 21
ide to carry back to the lungs. Molecules that in-fluence a protein’s activity by binding to sitesother than the active site(s), such as carbon diox-ide, H+ ions, or 2,3-bisphosphoglycerate, arecalled allosteric effectors.
The substitution of only one amino acid inthe primary structure of a polypeptide can af-fect the higher-level structure of the protein.For example, the substitution of a valine residuefor a glutamate residue on the � chain of hemo-globin causes the condition known as sickle cellanemia. When red blood cells with a sickle cellhemoglobin (HbS) are deprived of oxygen, theyassume a crescent, sickle shape, whereas redblood cells with normal hemoglobin molecules(HbA) remain biconcave. Interestingly, individ-uals who inherit a sickle cell gene from one par-ent and a normal gene from another are moreresistant to malaria than individuals who in-herit two normal genes. This observation helpsto explain why selective pressures have notworked to eliminate sickle cell anemia.
The polypeptide chains that make up myo-globin and hemoglobin are relatively short, thusthey form a single compact globular structure.Proteins composed of longer polypeptides mayfold into two or more compact globular struc-tures, called domains. Domains of the same pro-tein may behave independently, or they mayinteract structurally with one another. The an-tibody immunoglobulin G (IgG), which binds toantigens in the body and renders them harm-less, is a good example of a multidomain pro-tein. Its twelve domains perform differentfunctions. Constant regions are responsible forthe overall structure of the protein and are in-volved in recognition of the protein by othercomponents of the immune system. Variableregions are concerned with antigen-bindingspecificity. Hypervariable regions, located in theloops in the variable region, form the antigen-binding site.
Virtually all chemical reactions that occurin a cell are catalyzed by proteins called en-zymes or RNA catalysts called ribozymes. Manydifferent enzymes are involved in vital processessuch as replication, transcription, and transla-tion. Enzymes act on one, or a small numberof, substrate(s) to catalyze a reaction. Enzymaticactivity is measured by monitoring rates of sub-strate breakdown or of product formation. Theserates are often determined using colorimetric(based on substrate or product absorption oflight) and radiotracer (radioactive substrate isadded to the reaction and monitored) tech-niques.
In any reaction, the reactants involved mustovercome an energy barrier to reach a transi-tion state before they can be converted to prod-ucts. The energy required to reach the transitionstate is called the energy of activation. Catalystscan increase the rates of reactions by loweringthe energy of activation, but they do not affectthe equilibrium position for the reaction. Whenan enzyme catalyzes a reaction, it binds to thesubstrate to form an enzyme-substrate com-plex. The theoretical maximum rate of reaction(Vmax) is reached when all enzyme moleculespresent are in complex with substrate. Enzymesbind to substrate molecules at the active site,which confers the specificity to the enzyme-substrate binding mechanism. Specific bindingcan occur through the lock-and-key mode(shape of the active site is complementary tothe shape of the substrate), or through inducedfit (the enzyme changes shape upon bindingthe substrate). The number of substrate mole-cules converted to product in a given amountof time is called the turnover number.
Regulatory enzymes control biochemicalpathways in cells through feedback inhibition,blocking synthesis of abundant products. Likeoxygen binding in hemoglobin, regulatory en-zymes exhibit sigmoidal substrate-binding curvesbecause they, too, bind substrate cooperatively.Allosteric effectors bind to regulatory enzymes,either stimulating or inhibiting enzymatic activ-ity. Most regulatory enzymes have more thanone subunit. When the subunits are identical,each subunit has a substrate binding site and atleast one allosteric site. When the subunits aredifferent, one type of subunit has the catalyticactivity and the other type of subunit has reg-ulatory activity. Enzyme activity can also be al-tered by covalent modification.
In addition to catalyzing reactions, proteinsalso play a vital role in the interaction of cellswith the environment and with each other. Gprotein signal systems transmit information(though not chemical substances) across cellmembranes. G protein-coupled receptors (ofwhich there are many types) respond to exter-nal signals such as a photon or a hormone. Whenthey bind to a specific ligand, the conformationof the receptor changes and causes it to inter-act with the G protein complex. This complextransfers signals from the receptor to an effec-tor, such as adenylyl cyclase or phospholipaseC. Cells have a wide variety of effectors, whichenables them to respond appropriately to a mul-titude of stimuli.
40632_CH02_tropp.qxd 4/4/07 2:59 PM Page 21

22 CHAPTER 2 Protein function
References
Introduction
Branden, C-I., and Tooze, J. 1999. J. Introductionto Protein Structure (2nd ed). New York:Garland Publishing.
Creighton T. E. 1993. Proteins: Structures andMolecular Properties. New York: W. H.Freeman.
Petsko, G. A., and Ringe, D. 2003 Protein Structureand Function. Sunderland, MA: SinauerAssociates.
Differences in myoglobin and hemoglo-bin function are explained by differencesin myoglobin and hemoglobin structure
Allison, A. C. 2002. The discovery of resistance tomalaria of sickle cell heterozygotes. Mol BiolEduc 30:279–287.
Dickerson R. E., and Geis, I. 1983. Hemoglobin:Structure, Function, and Pathology. UpperSaddle River, NJ: Benjamin Cummings.
Edsall, J. T. 1980. Hemoglobin and origins of theconcept of allosterism. Fed Proc 39:226–235.
Garry, D. J., Ordway, G. A., Lorenz, J. N., et al.1998. Mice without myoglobin. Nature395:905–908.
Gelin B. R., Lee, A. W. M., and Karplus, M. 1983.Hemoglobin tertiary structural change on lig-and binding: its role in the co-operative mech-anism. J Mol Biol 171:489–559.
Ho, C., and Lukin, J. A. 2001. Haemoglobin: coop-erativity in protein–ligand interactions.Encyclopedia of Life Sciences. pp. 1–11.London, UK: Nature Publishing Co.
Hsia, C. C. W. 1998. Respiratory function of hemo-globin. N Engl J Med 338:239–248.
Ishimori, K. 2002. Myoglobin. Encyclopedia of LifeSciences. pp. 1–5. London, UK: NaturePublishing Co.
Jones, S., and Thornton, J. M. 2001. Protein qua-ternary structure: subunit–subunit interac-tions. Encyclopedia of Life Sciences. pp. 1–7.London, UK: Nature Publishing Co.
Manning, J. M., Dumoulin, A., Li, X., andManning, L. R. 1998. Normal and abnormalprotein subunit interactions in hemoglobins. JBiol Chem 273:19359–19362.
Perutz, M. F. 1978. Hemoglobin structure and res-piratory transport. Sci Am 239:92–125.
Perutz, M. F. Wilkinson, A. J., Paoli, M., andDodson, G. G. 1998. The sterochemical mech-anism of the cooperative effects in hemoglo-bin revisited. Ann Rev Biphys Biomol Struct27:1–34.
Springer, B.A., Sliger, S. G., Olson J. S., andPhillips, G. N. Jr. 1994. Mechanism of ligandrecognition in myoglobin. Chem Rev94:699–714.
2.2
2.1
Strasser, B. J. 1999. Sickle-cell anemia, a molecu-lar disease. Science 286:1488–1490.
Stuart, M. J., and Nagel, R. L. 2004. Sickle-cell dis-ease. Lancet 364:1443–1360.
Wittenberg, J. B., and Wittenberg, B. A. 1990.Mechanisms of cytoplasmic hemoglobin andmyoglobin function. Annu Rev BiophysBiophys Chem 19:217–241.
Normal adult hemoglobin (HbA) differsfrom sickle cell hemoglobin (HbS) byonly one amino acid
Alzari, P. M., Lascombe, M-B., and Poljak, R. J.1988. Three-dimensional structure of antibod-ies. Annu Rev Immunol 6:555–580.
Capra, J. D., and Edmundson, A. B. 1977. The an-tibody combining site. Sci Am 236:50–59.
Edelman, G. M. 1970. The structure and functionof antibodies. Sci Am 223:34–42.
Kumagai, I., and Tsumoto, K. 2001. Antigen-anti-body binding. Encyclopedia of Life Sciences.pp. 1–7. London, UK: Nature Publishing Co.
Lucas, A. H. 2001. Antibody function.Encyclopedia of Life Sciences. pp. 1–8. London,UK: Nature Publishing Co.
Wingren, C., Alkner,U., and Hansson, U. B, 2001.Antibody classes. Encyclopedia of Life Sciences.pp. 1–8. London, UK: Nature Publishing Co.
Zanetti, M., and Capra, J. (eds). 1999. TheAntibodies, vol. 6. New York: HarwoodAcademic Publishers.
Zouali, M. 2001. Antibodies. Encyclopedia of LifeSciences. pp. 1–8. London, UK: NaturePublishing Co.
Immunoglobulin G and the domain con-cept: Large polypeptides fold into globu-lar units called domains
Bugg, T. D. H. 2001. Enzymes: general properties.Encyclopedia of Life Sciences. pp. 1–8. London,UK: Nature Publishing Co.
Cleland, W. W. 2001. Enzyme kinetics: steadystate. Encyclopedia of Life Sciences. pp. 1–5.London, UK: Nature Publishing Co.
Copeland, R. A. 2001. Enzymology methods.Encyclopedia of Life Sciences. pp. 1–5. London,UK: Nature Publishing Co.
Cornish-Bowden, A. 1995. Fundamentals ofEnzyme Kinetics. London, UK: Portland Press.
Fersht, A. (ed). 1998. Structure and Mechanism inProtein Science: A Guide to Enzyme Catalysisand Protein Folding. New York: W. H.Freeman.
Fisher, H. F. 2001. Protein-ligand interactions: mo-lecular basis. Encyclopedia of Life Sciences. pp.1–9. London, UK: Nature Publishing Co.
Gigant, B., and Knossow, M. 2001. K catalytic anti-bodies. Encyclopedia of Life Sciences. pp. 1–7.London, UK: Nature Publishing Co.
2.4
2.3
40632_CH02_tropp.qxd 4/4/07 2:59 PM Page 22

References 23
Hedstrom, L. 2001. Enzyme specificity and selec-tivity. Encyclopedia of Life Sciences. pp. 1–7.London, UK: Nature Publishing Co.
Jencks, W. P. 1969. Catalysis in Chemistry andEnzymology. New York: McGraw-Hill.
Knowles, J. R. 1991. To build an enzyme. PhilTrans R Soc Lond B Biol Sci 332:115–121.
Mobashery, S., and Kotra, L. P. 2002. Transitionstate stabilization. Encyclopedia of LifeSciences. pp. 1–6. London, UK: NaturePublishing Co.
Pliska, V. K. 2001. Substrate binding to enzymes.Encyclopedia of Life Sciences. pp. 1–10.London, UK: Nature Publishing Co.
Post, C. B. 2002. Transition states: substrate in-duced conformational transitions.Encyclopedia of Life Sciences. pp. 1–7. London,UK: Nature Publishing Co.
Rossomando, E. F. 1990. Measurement of enzymeactivity. Meth Enzymol 182:38–49.
Schultz, P. G., and Lerner, R. A. 1995. From molec-ular diversity to catalysis: lessons from the im-mune system. Science 269:1835–1842.
Scopes, R. K. 2001. Enzyme activity and assays.Encyclopedia of Life Sciences. pp. 1–6. London,UK: Nature Publishing Co.
Toney, M. D. 2001. Binding and catalysis.Encyclopedia of Life Sciences. pp. 1–6. London,UK: Nature Publishing Co.
Traut, T. 2001. Enzyme activity: allosteric regula-tion. Encyclopedia of Life Sciences. pp. 1–11.London, UK: Nature Publishing Co.
Yohrling, G. J. IV, Jiang, G. C-T., and Vrana, K. E.2001. Enzymatic activity: control.Encyclopedia of Life Sciences. pp. 1–6. London,UK: Nature Publishing Co.
Enzymes are proteins that catalyze chem-ical reactions
2.5
Bockaert, J. 2001. G protein-coupled receptors.Encyclopedia of Life Sciences. pp. 1–9. London,UK: Nature Publishing Co.
Bourne, H. 1997. How receptors talk to trimeric Gproteins. Curr Opin Cell Biol 9:134–142.
Chuang, T. T., Iacovelli, L., Sallese, M., and DeBlasi, A. 1996. G protein coupled receptors:heterologous regulation of homologous de-sensitization and its implications. TrendsPharmacol Sci 17:416–421.
Gether, U., and Kobilka, B. K. 1998. G protein-coupled receptors. II. Mechanism of agonistactivation. J Biol Chem 273:17979–17982.
Gilman, A. G. 1987. G proteins: transducers of re-ceptor-generated signals. Ann Rev Biochem56:615–649.
Hamm, H. E., and Gilchrist, A. 1996.Heterotrimeric G proteins. Curr Opin Cell Biol8:189–196.
Karoor, V., and Malbon, C. C. 1998. G-protein-linked receptors as substrates for tyrosine ki-nases: cross-talk in signaling. Adv Pharmacol42:425–428.
Ji, T. H., Grossmann, M., and Ji, I. 1998. G protein-coupled receptors. I. Diversity of receptor–lig-and interactions. J Biol Chem273:17299–17302.
Malbon, C. C., Wang, H-Y. 2001. Adrenergic recep-tors. Encyclopedia of Life Sciences. pp. 1–8.London, UK: Nature Publishing Co.
Sutherland, E. 1972. Studies on the mechanism ofhormone action. Science 177:401–408.
Strader, C., Fong, T., Tota, M., et al. 1994.Structure and function of G protein-coupledreceptors. Ann Rev Biochem 63:101–132.
Wess, J. 1997. G-protein-coupled receptors: mo-lecular mechanisms involved in receptor acti-vation and selectivity of G-proteinrecognition. FASEB J 11:346–354.
40632_CH02_tropp.qxd 4/4/07 2:59 PM Page 23