Embed Size (px)
Citation preview


PERFORMANCE OF COMPOSITE PAVEMENT AS MAINTENANCE STRATEGY FOR CRCP
Shabbir Hossain, Ph.D., P.E., Virginia Transportation Research Council, VDOTRaja Shekharan, Ph.D., P.E., Maintenance Division, VDOT
53rd Mid-Atlantic Quality Assurance Workshop, Williamsburg, VA
February 12, 2020

• VDOT has more than 500 lane-miles of Continuously Reinforced Concrete Pavement (CRCP) built 1967 to 1992.
• Design life of 20-30 years (?)• Thickness – 8 to 9 inches• Needed rehabilitation and repair
• Patched• Overlaid with Asphalt (HMA and/ or SMA)
• I-64, I-664, I-295, I-85, I-95, US-58, US-60, SR-288, SR-76• Charlottesville, Richmond (south), Norfolk/ VA Beach
Introduction
Virginia Department of Transportation
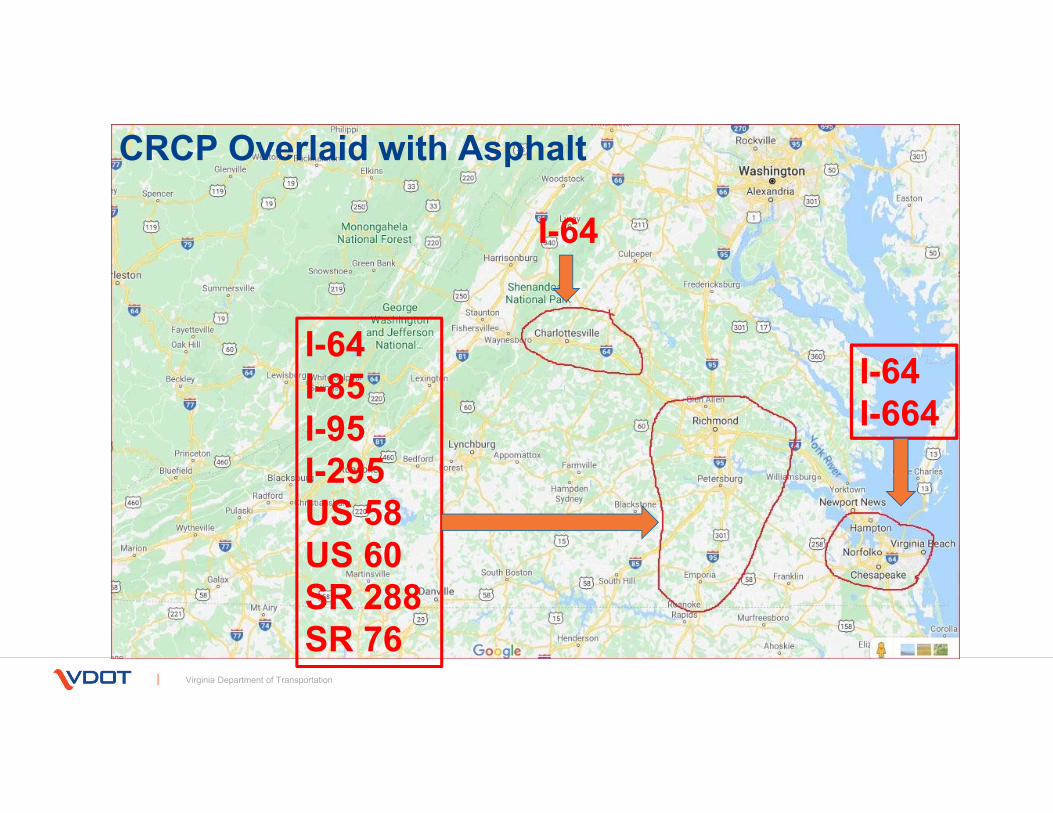
CRCP Overlaid with Asphalt
Virginia Department of Transportation
I-64
I-64I-85I-95I-295US 58US 60SR 288SR 76
I-64I-664

• Many of them are still serving the Transportation need of the public after 20-50 years of service• Currently composite pavement
• Focus of this presentation• Performance of these Composite Pavements
• Age of each treatment• Traffic level• Surface Condition
• Primarily based on VDOT Pavement Management System (PMS) data
Introduction
Virginia Department of Transportation

• Pavement construction history• Maintenance record• Condition Rating
• IRI• CCI – LDR and NDR
• Excellent: 90 and above• Good: 70-89• Fair: 60-69• Poor: 50-59• Very Poor: 49 or below
PMS Data
Virginia Department of Transportation

• Condition data collected – semi automated data collection
• Data aggregation (state condition rating system and MAP-21)
• Quality assurance (certification, sampling, data acceptance)
• DQMP for HPMS • Data collection equipment calibration and certification; • Certification process for persons performing manual data collection; • Data quality control measures to be conducted before data collection begins and periodically during the data collection program; • Data sampling, review and checking processes; and • Error resolution procedures and data acceptance criteria
7
Pavement Management Data

• Condition data collected (distress types, sampling, in-house vs. contracted, cost if available, miles covered, technology utilized)
• Data aggregation (state condition rating system and MAP-21)
• Quality assurance (certification, parameters comparison, sampling, data acceptance)
• DQMP for HPMS • Who is developing• Coordination HPMS/PMS • Requirements
• Data collection equipment calibration and certification; • Certification process for persons performing manual data collection; • Data quality control measures to be conducted before data collection begins and periodically during the data collection program; • Data sampling, review and checking processes; and • Error resolution procedures and data acceptance criteria
8
Pavement Management Data
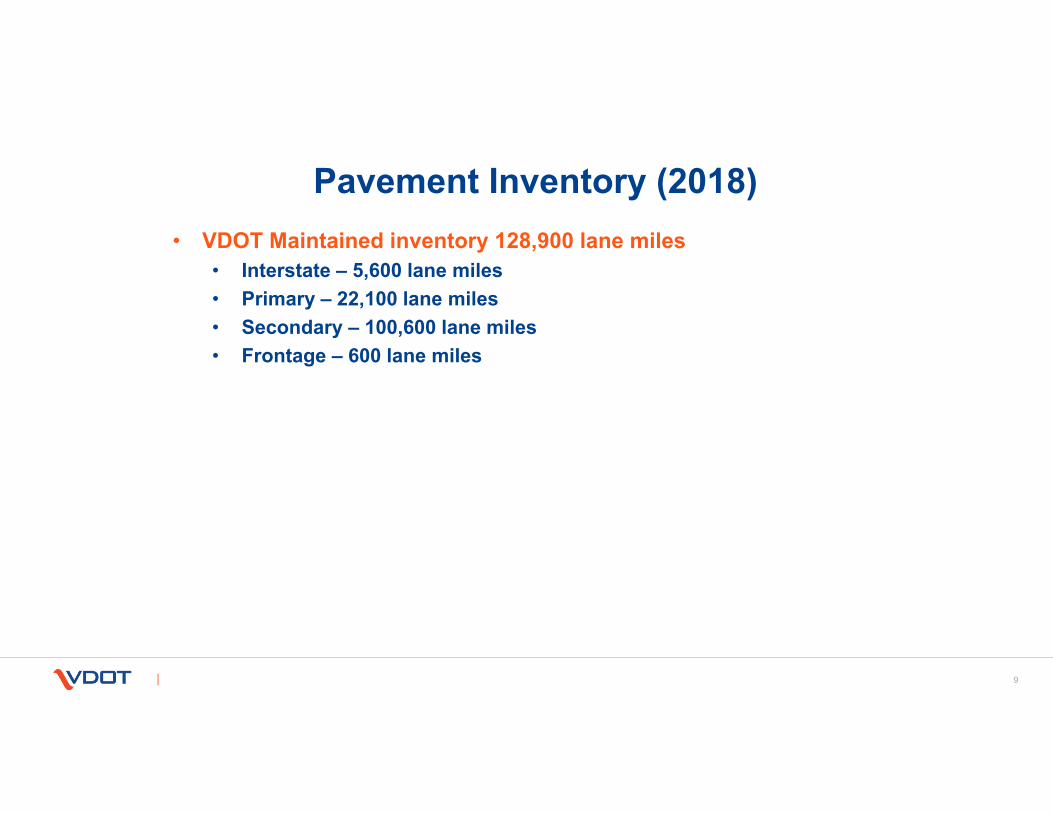
• VDOT Maintained inventory 128,900 lane miles• Interstate – 5,600 lane miles• Primary – 22,100 lane miles• Secondary – 100,600 lane miles• Frontage – 600 lane miles
9
Pavement Inventory (2018)

• Data is collected every year• Data is collected on travel lane (right most) only• Data for entire length collected and not on sample-basis
• Total yearly collection: Approx. 20,400 directional miles• 100% of the interstate network, approx. 2,200 miles• 100% of the primary network, approx. 10,500 miles• 20% - 25% of the secondary network, approx. 12,000 miles
• Data collection and processing work is contracted out • ARAN data collection vehicles used by contractor• A third party consultant performs IV&V
• VDOT performs QA & final acceptance tests
10
Virginia Department of Transportation (VDOT) Network

• Distress rating manual – protocol to identify and quantify distresses
• Originated from PAVER manual used by US Army Corps of Engineers
• Modified following guidance from LTPP distress rating manual
11
Distress Rating Protocol/Guide
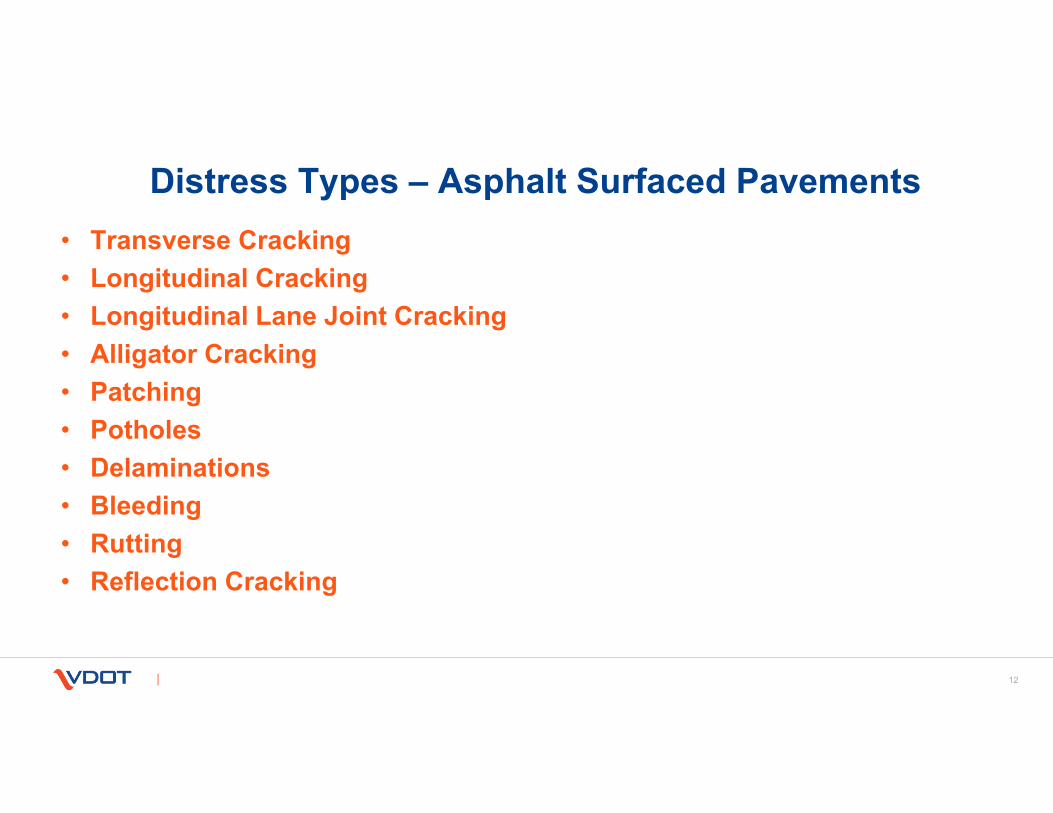
• Transverse Cracking• Longitudinal Cracking• Longitudinal Lane Joint Cracking• Alligator Cracking• Patching• Potholes• Delaminations• Bleeding• Rutting• Reflection Cracking
12
Distress Types – Asphalt Surfaced Pavements

• Corner Breaks• Joint Seal Condition• Spalling of Transverse and
Longitudinal Joints• Transverse Cracking• Longitudinal Cracking• Divided slabs• Blowups• PCC Patch/Patch Deterioration• Asphalt Patch
13
Distress Types – Jointed Concrete Pavements

• Transverse Cracking• Clustered Cracking• Punchouts• PCC Patch/Patch Deterioration• Asphalt Patch• Longitudinal Cracking• Longitudinal Joint Spalling• Longitudinal Pavement/Shoulder Joint
Seal Condition
14
Distress Types –Continuously Reinforced Concrete Pavements

• Summarization of Production Data• Split by road system
• Interstate and Primary are identical but differ from Secondary• Secondary lacks distinct pavement management sections and history
• Split by pavement type• Asphalt Concrete Pavements (ACP)
• Bituminous• Bituminous over Continuously Reinforced Concrete• Bituminous over Jointed Reinforced Concrete
• Continuously Reinforced Concrete Pavement (CRCP)• Jointed Concrete Pavement (JRCP)
• Delivered in 0.10 Mile and Summary Homogeneous Sections
15
Data Summarization – Data Delivery Formats

• Flexible Pavement• Load Related Distress Rating (LDR)
• Alligator (Fatigue) Cracking, Wheel Path Patching, Rutting• Non-load Related Distress Rating (NDR)
• Longitudinal and Transverse Cracking, Non-Wheel Path Patching, Bleeding• Jointed Concrete Pavement
• Slab Distress Rating (SDR)• Continuously Reinforced Concrete Pavement
• Concrete Distress Rating (CDR)• Longitudinal and Transverse Cracking, PCC patching, AC patching, Longitudinal Joint
Spalling• Concrete Punchout Rating (CPR)
• Punchouts, Cluster Cracking, PCC patching, AC patching• The lower of the two index values is the Critical Condition Index (CCI)
16
Data Summarization -Pavement Condition Indices

• Data collection at control sites
• Production data collection
• Contractor’s SOP and internal QA/QC
• Independent Validation and Verification (IV&V) by third party
• QA and acceptance by VDOT
17
Data collection, QC/QA and IV&V

• Data quality process flow diagram
18
Data collection, QC/QA and IV&V
NoNo
NoNo
Start Up Process Control Sites
Control Site Acceptance
(VDOT)
Production Data CollectionVerification SitesImage QualityField QCSOP
Data Processing D-RateWiseCraxQA
Internal QA (RWG)
Independent Verification & Validation by QES5% Data ReviewData CompletenessIndex Limits
Pass IV&V?(QES)
Delivery to VDOTDeliverable Files via ftp SiteImages via Portable Hard Drive
Batch Acceptance
(VDOT)
DeliverablesQC ReportsDeliverables
DataReportsDocuments
DeliverablesQA Reports
PMS DatabaseVideo Database
A
A
DeliverablesIV&V ReportDeliverable Tables
DeliverablesQA & IV&V Reports0.10 mile Delivery TblHomogenous Section Delivery Tbl

• Control Sites• Covers all systems and pavement types with wide range of pavement conditions
• IV&V review of results from control sites to:• Measure precision and bias values for roughness and rutting measurements • Calibrate the pavement distress rating process
• Contractors ratings are reviewed against reference values (based on average manual rating from four experienced raters)
• If results are within tolerable limits of variation, contractor moves on to production data collection
19
Data Collection at Control Sites: Preliminary IV&V

• Comparison of each data collection vehicle to reference values • 5 runs per site by each truck• Results from each truck are reviewed for precision and repeatability
• ASTM E177-14 (Standard Practice for Use of the Terms Precision and Bias in ASTM Test Methods)
• Roughness precision and bias (by wheel path) determined against average value of 10 runs of VDOT truck
• Rutting precision and bias (by wheel path) determined against average values of all runs by all trucks
20
Preliminary Data Collection IV&V: Roughness and Rutting

• Accuracy/Precision• IRI: ± 5% of VDOT Reference Value• Rut: ± 2mm of VDOT Reference Value
• Repeatability/Bias• 5 runs at highway speeds, limit < 5%
21
Preliminary Data Collection IV&V: Roughness and Rutting Tolerance Limits

• Contractor developed and executed QC Plan : approved by VDOT• Certification/training of personnel• Validation of equipment• Daily equipment QC procedures• On-going QC procedures
22
Contractors SOP and Internal QA/QC
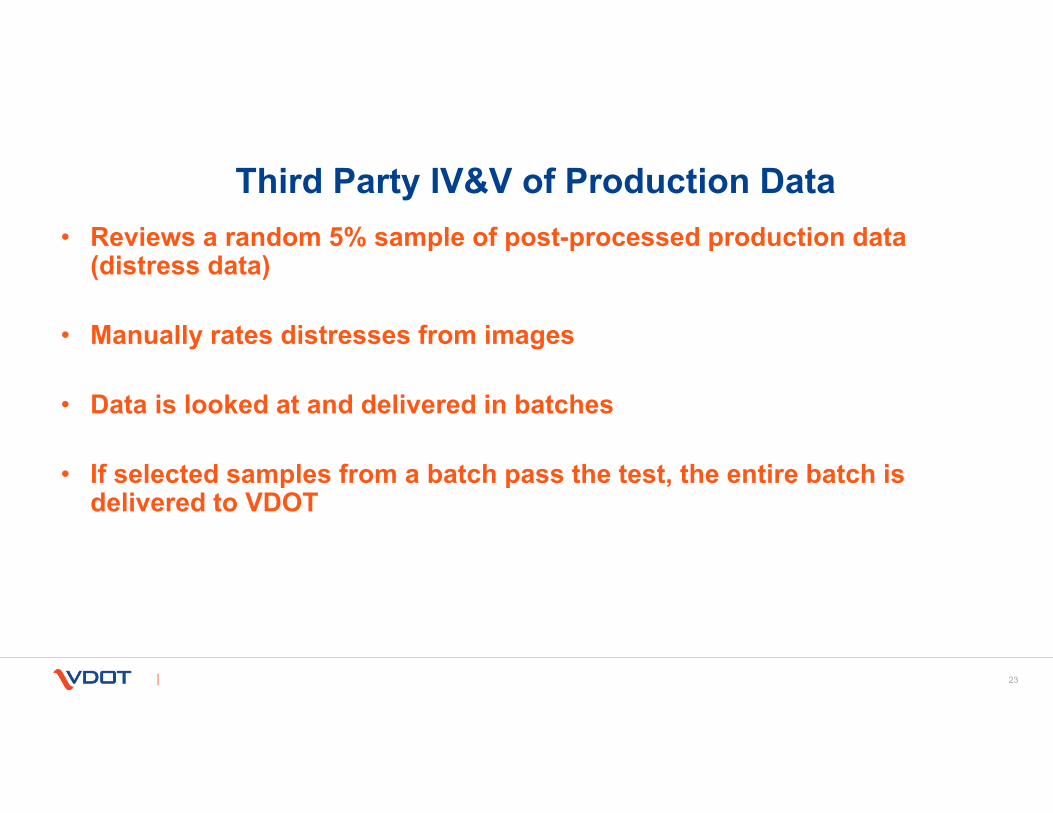
• Reviews a random 5% sample of post-processed production data (distress data)
• Manually rates distresses from images
• Data is looked at and delivered in batches
• If selected samples from a batch pass the test, the entire batch is delivered to VDOT
23
Third Party IV&V of Production Data

• Increases the confidence level in the reported data
• Provides additional QC/QA for vendor
• Modifications to rating protocols if needed
• Increased QA checks prior to data delivery to the Agency
24
Independent Verification & Validation - Benefits

• VDOT has access to images and ratings from previous years
• Summary sections from current delivery compared with previous year• Review occurs where:
• Index changes beyond expected values• High or low index values for reported pavement age
• VDOT is looking for • Unreported maintenance• Problems with distress ratings
• Errors reported to the contractor for reprocessing
25
Production Data – VDOT QA

• Data is accepted after it passes • IV&V checks • Year-to-year comparison and reasonableness checks
• Data is not delivered (or accepted) all at once• Interstate (statewide)• Primary (district by district)• Secondary (district by district)
26
Final Acceptance of Production Data

• Pavement type, Last treatment category, Distresses summarized to feed the decision tree, AADTT (Truck traffic), Surface age, and Pavement structure.
• Age data showing surface life ofmore than 20 years is likely dueto lack of data rather than true life of surface
• SR00288SB 13.63-15.21
27
Other Data Used for the Analysis

CRC Pavements in VDOT System: I-64
Virginia Department of Transportation
County Year MP Lane-miles
AADTT
Albemarle 1970 127-107 W 35 30001970 107-130 E 35 3000
Louisa 1987 136-135 W 2 30001970 131-136 E 10 3000
• 8 inch CRCP• 32 & 49 Years

Maintenance History: I-64
Virginia Department of Transportation
County MP Year Layer Age (Y)* IRI CCI
Albemarle
127-120 W1970 8.0” CRCP 261996 2.5” IM-1A + 1.5” SMA 22 ? 100 582018 2.0” SMA 12.5 (Mill and Fill) 1+ 61 93
119-114 W
1970 8.0” CRCP 231993 3.0” B-3 + 1.4” SM-2C 61999 1.5” SMA 18 ? 107 552017 2.0” SMA 12.5 (Mill and Fill) 2+ 71 99
114-107 W
1970 8.0” CRCP 231993 3.0” B-3 + 1.4” SM-2C 72000 1.5” SM-9.5D 12 68 432012 : 2.0” SMA 9.5 (Mill and Fill) 7+ 71 98
* Age at the end of service

Maintenance History: I-64
Virginia Department of Transportation
County MP Year Layer Age (Y) IRI CCI
Albemarle
107-114 E1970 8.0” CRCP 221992 2.9” BM-2 + 1.4” SM-2C 16 85 402008 1.5” SMA 9.5 11+ 82 84
119-127 E1970 8.0” CRCP 261996 2.5” IM-1A + 1.5” SMA 18 84 852014 0.75” THMACO 5+ 64 97
127-130 E1970 8.0” CRCP 241994 3.0” BM-2 + 1.5” SM-2A 16 592010 1.5” SMA 9.5 (Mill and Fill) 9+ 67 95

Maintenance History: I-64
Virginia Department of Transportation
County MP Year Layer Age (Y) IRI CCI
Louisa
136-135 W1987 8.0” CRCP 182005 2.0” SMA 19.0 + 1.5” SMA 9.5 8 96 762013 2.0” SMA 12.5 (Mill and Fill) 6+ 82 84
130-136 E
1970 8.0” CRCP 241994 3.0” BM-2 + 1.4” SA-2A 82002 1.5” SM 9.5A 10 61 702012 0.3” Latex Modified 5 68 582017 2.0” SMA 12.5 (Mill and Fill) 2+ 56 100

CRC Pavements in VDOT System: I-295 (North of I-64)
Virginia Department of Transportation
I-295: 9 inch CRCP, 39 Years
County Year MP Lane-miles AADTT
Henrico 1980 29-32 N 11 2350Hanover 1980 32-36 N 17 2750
1980 38-42 N 15 3150Henrico 1980 42-52 N 28 1200Hanover 1980 32-36 S 17 2750
1980 36-42 S 19Henrico 1980 46-47 S 4 1700
I-295

Maintenance History: I-295 (East of I-95; AADTT ≈ 3000)
Virginia Department of Transportation
County MP Year Layer Age (Y) IRI CCI
Henrico 29-32 N1980 9.0” CRCP 191999 2.0" IM-1D + 1.5" SM-2D 17 106 332016 2.0" SMA 12.5 (Mill & Fill) 3+ 65-93 87
Hanover 32-36 N1980 9.0” CRCP 161996 2.0" IM-1A + 1.50" SMA-Surface 23+ ? 72 92
Hanover 38-42 N1980 9.0” CRCP 272007 2.0" IM 19.0 + 2.0" SMA 12.5 12+ 59-86 81-96
32-36 S1980 9.0” CRCP 161996 2.0" IM-1A + 1.50" SMA-Surface 23+ ? 71-75 89-94
36-42 S 1980 9.0” CRCP 23-3036-38 S 2005 2.0" IM 19.0 + 1.5" SMA 12.5 14+38-40 S 2010 2.0" SMA 19.0 + 1.5" SMA 9.5 9+ 71 9440-42 S 2003 2.0" SMA 19.0 + 1.5" SMA 12.5 16+

Maintenance History: I-295 (West of I-95; AADTT ≈ 1500)
Virginia Department of Transportation
County MP Year Layer Age (Y) IRI CCI
Henrico42-52 N
1980 9.0” CRCP 272007 2.0" IM-1D + 2.0" SMA-12.5D 12+ 56-71 84-92
46-47 S1980 9.0” CRCP 161998 2.0" IM-1D + 1.5" SM-2D 21+ ? 110 21

CRC Pavements in VDOT System: I-295 (South of I-64)
Virginia Department of Transportation
I-295: 8-9 inch CRCP, 27-29 Years
County Year MP Lane-miles AADTT
Prince George
1992 0-12 N 23 26001992 9-13 S 24 2900
Chesterfield1990 15-17 N 6 28761990 15-17 S 6
I-295
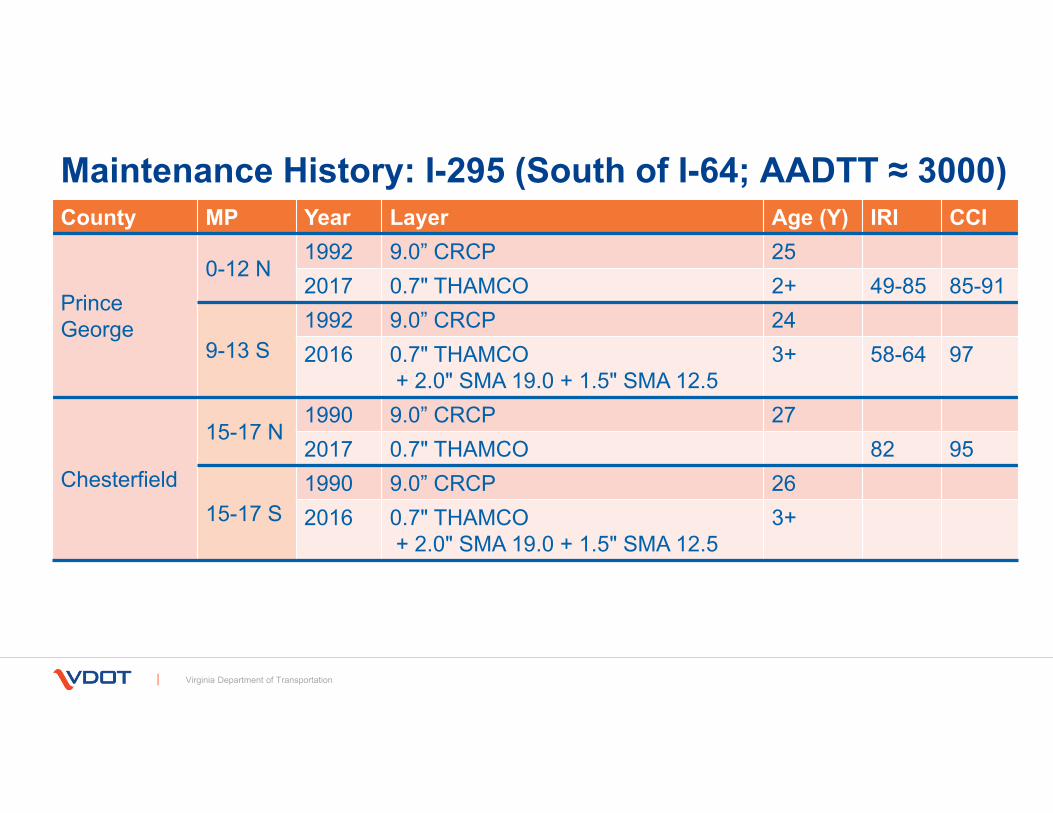
Maintenance History: I-295 (South of I-64; AADTT ≈ 3000)
Virginia Department of Transportation
County MP Year Layer Age (Y) IRI CCI
Prince George
0-12 N1992 9.0” CRCP 252017 0.7" THAMCO 2+ 49-85 85-91
9-13 S1992 9.0” CRCP 242016 0.7" THAMCO
+ 2.0" SMA 19.0 + 1.5" SMA 12.5 3+ 58-64 97
Chesterfield
15-17 N1990 9.0” CRCP 272017 0.7" THAMCO 82 95
15-17 S1990 9.0” CRCP 262016 0.7" THAMCO
+ 2.0" SMA 19.0 + 1.5" SMA 12.5 3+
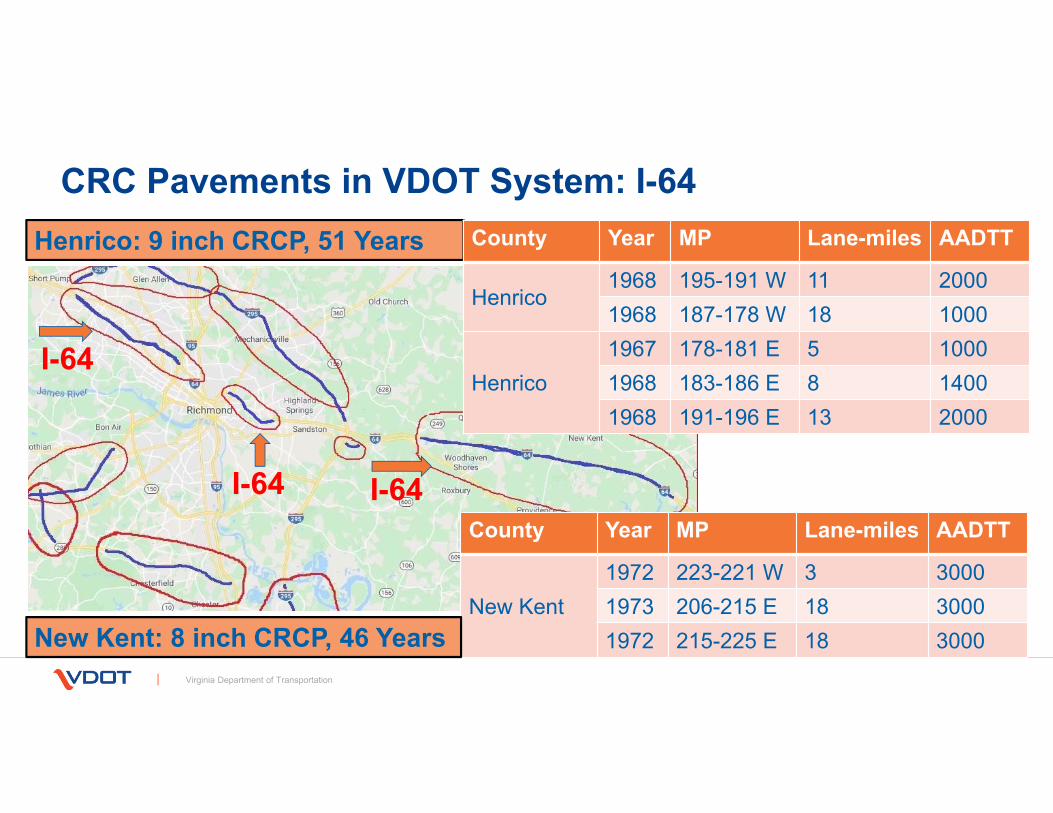
CRC Pavements in VDOT System: I-64
Virginia Department of Transportation
Henrico: 9 inch CRCP, 51 Years
County Year MP Lane-miles AADTT
New Kent1972 223-221 W 3 30001973 206-215 E 18 30001972 215-225 E 18 3000
County Year MP Lane-miles AADTT
Henrico1968 195-191 W 11 20001968 187-178 W 18 1000
Henrico1967 178-181 E 5 10001968 183-186 E 8 14001968 191-196 E 13 2000
New Kent: 8 inch CRCP, 46 Years
I-64
I-64 I-64

Maintenance History: I-64 East (Henrico)
Virginia Department of Transportation
County MP Year Layer Age (Y) IRI CCI
Henrico
178-181 E 1967 9.0” CRCP 382005 2.0” SMA 19.0 + 1.5” SMA 12.5 14+ ? 88 78-85
183-186 E 1968 9.0” CRCP 42 502010 2.0” SMA 19.0 + 1.5” SMA 9.5 9+ 85 84-94
191-196 E 1968 9.0” CRCP 352003 2.0” SMA 19.0 + 1.7” SMA 12.5 16 116 78-902019 0.7” THMACO (0.5”Mill) 0+

Maintenance History: I-64 W (Henrico)
Virginia Department of Transportation
County MP Year Layer Age (Y) IRI CCI
Henrico
195-191 W 1968 9.0” CRCP 352003 2.0” SMA 19.0 + 1.7” SMA 12.5 16+ 102 73-87
187-186 W 1968 9.0” CRCP 362004 3.0” SMA 19.0 32007 1.5” SMA 9.5 12+ 141 68
186-183 W 1968 9.0” CRCP 422010 2.0” SMA 19.0 + 1.5” SMA 9.5 9+ 106 82
182-178 W 1967 9.0” CRCP 382005 2.0” SMA 19.0 + 1.5” SMA 12.5 14+ 81 80-85

Maintenance History: I-64 (New Kent)
Virginia Department of Transportation
County MP Year Layer Age (Y)
IRI CCI
New Kent
206-215 E 1973 8.0” CRCP 201993 2.5" IM-1B + 1.4" SM-2C 132006 0.2” Latex Modified 9 59-742015 3.0" SMA 19.0 + 2.0" SMA 12.5 (M &F) 4+ 74 97
215-225 E 1972 8.0” CRCP 18 501990 4.0" IM-1B + 1.4" SM-2C 162006 0.2” Latex Modified 9 59-702015 3.0" SMA 19.0 + 2.0" SMA 12.5 (M &F) 4+ 85 98
223-221 W 1972 8.0” CRCP 181990 4.0" IM-1B + 1.4" SM-2C 16 592012 3.0" SMA 19.0 + 2.0" SMA 12.5 (M &F) 7+ 87 91
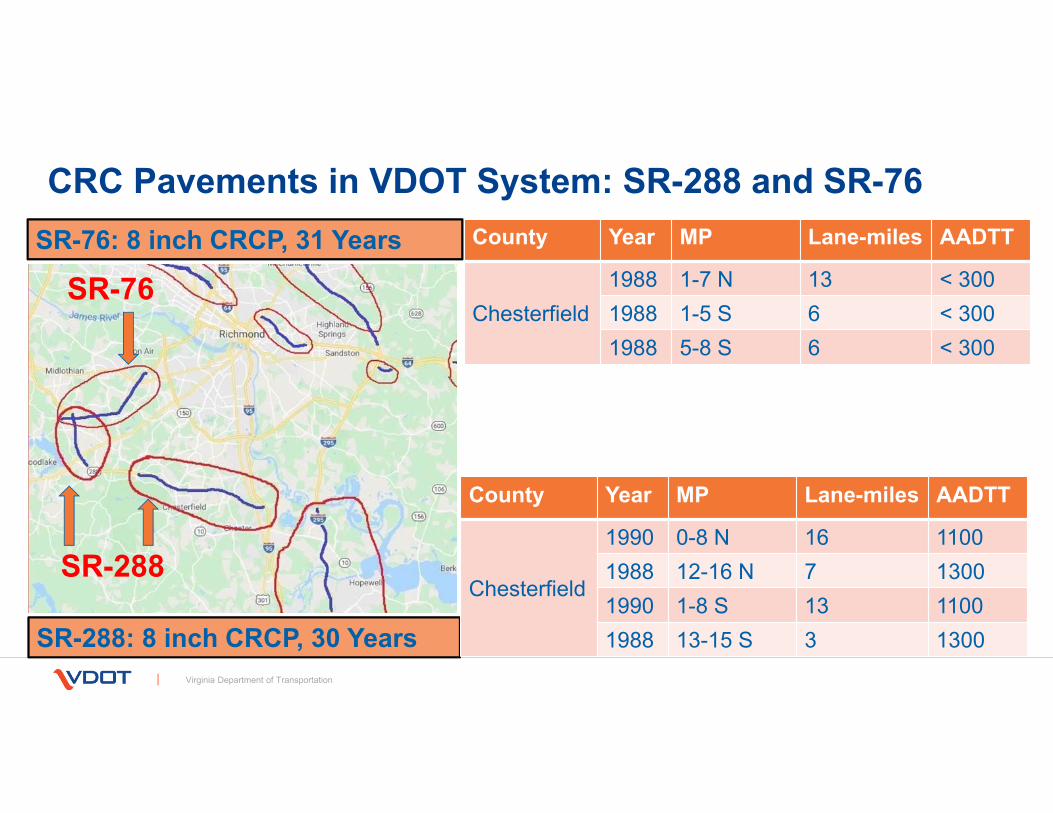
CRC Pavements in VDOT System: SR-288 and SR-76
Virginia Department of Transportation
SR-288: 8 inch CRCP, 30 Years
County Year MP Lane-miles AADTT
Chesterfield1988 1-7 N 13 < 3001988 1-5 S 6 < 3001988 5-8 S 6 < 300
County Year MP Lane-miles AADTT
Chesterfield
1990 0-8 N 16 11001988 12-16 N 7 13001990 1-8 S 13 11001988 13-15 S 3 1300
SR-76: 8 inch CRCP, 31 Years
SR-76
SR-288

Maintenance History: SR-288 (AADTT ≈ 1200)
Virginia Department of Transportation
County MP Year Layer Age (Y) IRI CCI
Chesterfield
0-8 N 1990 8.0” CRCP 262016 1.5" SMA 9.5 3+ 66 98
12-16 N 1988 8.0” CRCP 262014 4.0" SMA 19.0 + 1.5" SMA 12.5 5+ 59-73 92
1-8 S 1990 8.0” CRCP 262016 4.0" SMA 19.0 + 1.5" SMA 12.5 3+ 73 98
13-15 S 1988 8.0” CRCP 272015 2.0" SMA 19.0 + 1.5" SMA 9.5 4+ 81 97

Maintenance History: SR-76 (AADTT < 300)
Virginia Department of Transportation
County MP Year Layer Age (Y) IRI CCI
Chesterfield
1-7 N 1988 8.0” CRCP 292017 0.75" THAMCO 2+ 88-93 83-97
1-5 S 1988 8.0” CRCP 272015 2.0" IM-19.0D + 1.5" SM-9.5E 4+ 84 84
5-8 S 1988 8.0” CRCP 272015 0.75" THAMCO 3+ 72-82 94

CRC Pavements in VDOT System: I-85 and I-95
Virginia Department of Transportation
I-95: 8 inch CRCP, 37 Years
County Year MP Lane-miles AADTT
Dinwiddie1969 44-46 N 4 21001969 55-62 N 11 2500
County Year MP Lane-miles AADTT
Sussex1982 17-22 N 10 32001982 17-22 S 10 3200
I-85: 9 inch CRCP, 50 Years
I-85
I-95

Maintenance History: I-85 (AADTT 2100-2500)
Virginia Department of Transportation
County MP Year Layer Age (Y) IRI CCI
Dinwiddie
44-46 N 1969 9.0” CRCP 48 ??2017 2.0" SMA 19.0 + 1.5" SMA 12.5 2+ 59 98
55-62 N 1969 9.0” CRCP 48 ??2017 2.0” SMA 19.0 + 1.5” SMA 12.5 2+ 74 94

Maintenance History: I-95 (AADTT 3200)
Virginia Department of Transportation
County MP Year Layer Age (Y)
IRI CCI
Sussex
17-22 N 1982 8.0” CRCP 17 1999 3.0" BM-3 + 2.0" IM-1B + 1.4" SM-12.5D 92008 0.2" Latex Modified 11 80 64*2019 2.0" SM-12.5D (Mill & Fill) 0+
17-22 S 1982 8.0” CRCP 17 1999 3.0" BM-3 + 2.0" IM-1B + 1.4" SM-12.5D 92008 0.2" Latex Modified 11+ ?? 80 79**
*174-325 transverse cracks/ mile**137-387 transverse cracks/ mile
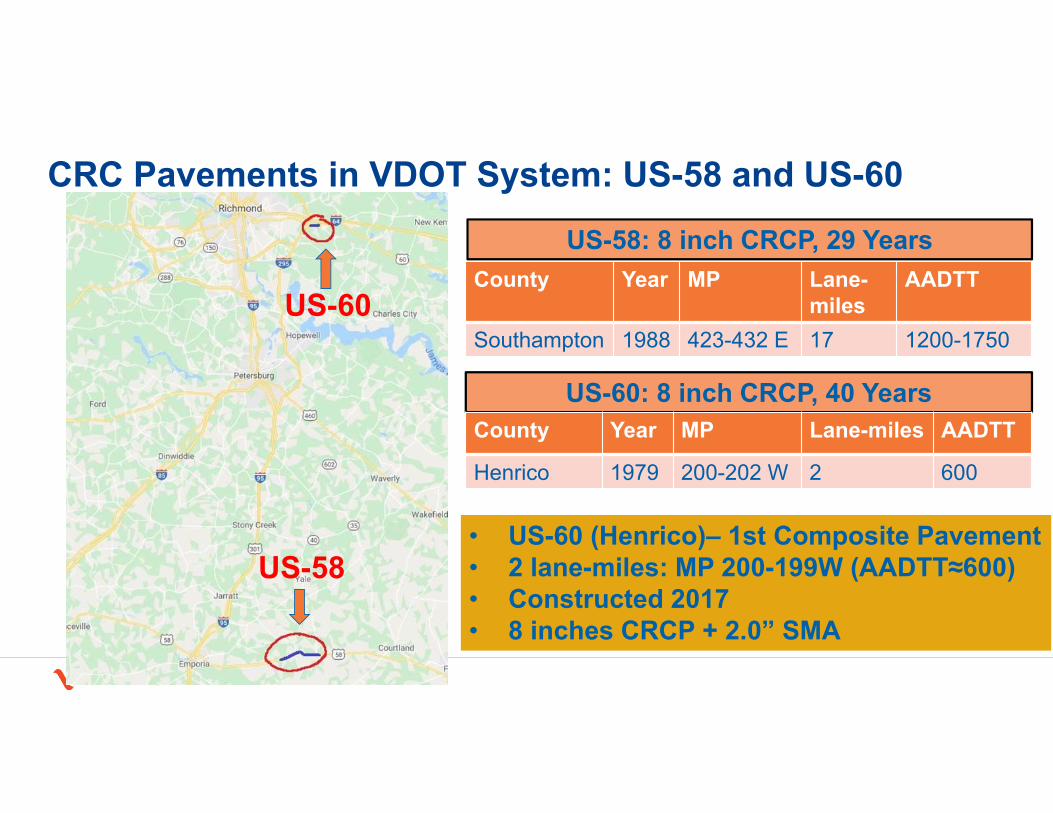
CRC Pavements in VDOT System: US-58 and US-60
Virginia Department of Transportation
US-60: 8 inch CRCP, 40 Years
County Year MP Lane-miles
AADTT
Southampton 1988 423-432 E 17 1200-1750
County Year MP Lane-miles AADTT
Henrico 1979 200-202 W 2 600
US-58: 8 inch CRCP, 29 Years
• US-60 (Henrico)– 1st Composite Pavement• 2 lane-miles: MP 200-199W (AADTT≈600)• Constructed 2017• 8 inches CRCP + 2.0” SMA
US-60
US-58
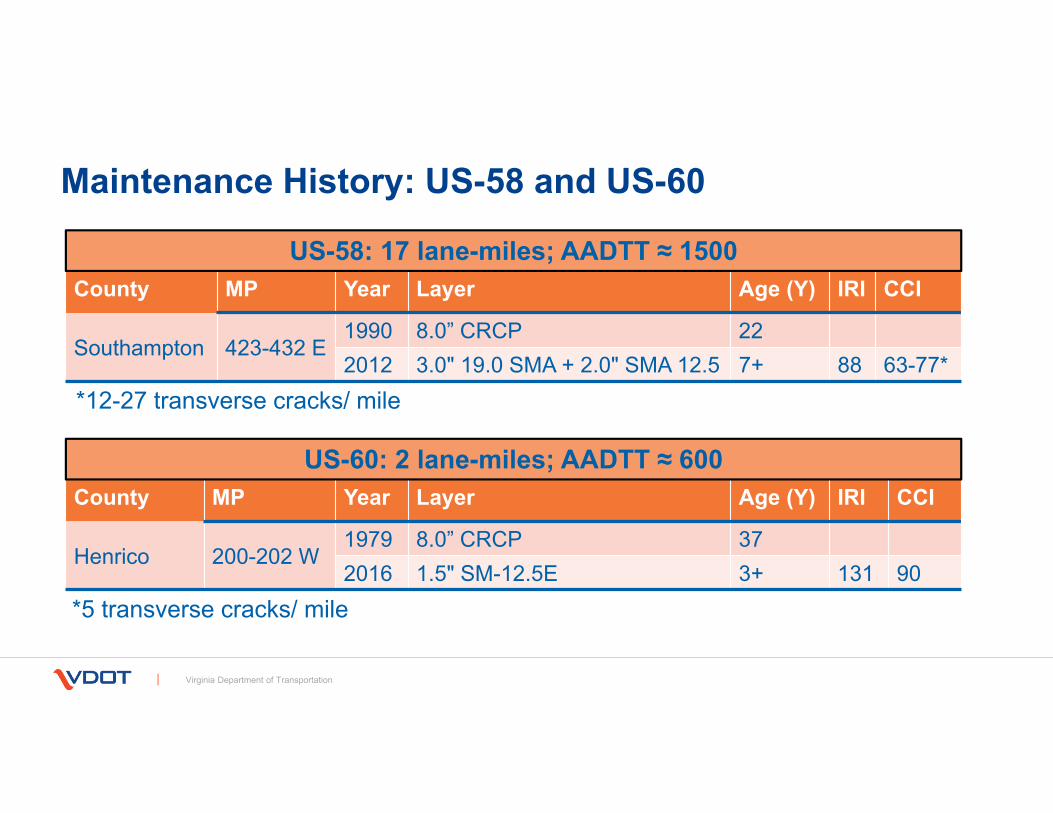
Maintenance History: US-58 and US-60
Virginia Department of Transportation
County MP Year Layer Age (Y) IRI CCI
Southampton 423-432 E1990 8.0” CRCP 222012 3.0" 19.0 SMA + 2.0" SMA 12.5 7+ 88 63-77*
County MP Year Layer Age (Y) IRI CCI
Henrico 200-202 W1979 8.0” CRCP 372016 1.5" SM-12.5E 3+ 131 90
US-58: 17 lane-miles; AADTT ≈ 1500
US-60: 2 lane-miles; AADTT ≈ 600
*12-27 transverse cracks/ mile
*5 transverse cracks/ mile

CRC Pavements in VDOT System: I-664 and I-64
Virginia Department of Transportation
I-664: 9 inch CRCP (28-36 Years)County Year MP Lane-
milesAADTT
York 1983 1-3 East 7Nansemond 1991 11-14 East 10 2000
Norfolk 1991 14-18 East 8 2300-2600
County Year MP Lane-miles
AADTT
Norfolk
1975 274-277 E 5 1500-20001969 293-300 E 14 2900-5600
1975 277-274 W 5 1750-2000
I-64: 8 inch CRCP (44-50 Years)

Maintenance History: I-64
Virginia Department of Transportation
County MP Year Layer Age (Y) IRI CCI
Norfolk
274-277 E 1975 8.0” CRCP 40 < 252015 0.75" THAMCO + 2.0" SMA
19.0 + 1.75" SMA 12.54+ 119 83
293-300 E 1969 8.0” CRCP 42 65-802011 2.0” SMA 19.0 + 1.5” SMA 12.5 8+ 75 83
277-274 W 1975 8.0” CRCP 22 < 502013 0.75" THAMCO + 2.0" SMA
19.0 + 1.75" SMA 12.5 4+ 126 85

Maintenance History: I-664
Virginia Department of Transportation
County MP Year Layer Age (Y) IRI CCI
York 1-3 E 1983 9.0” CRCP 322015 0.7" THAMCO 4+
Nansemond 11-14 E 1991 9.0” CRCP 222013 0.7" THAMCO 4 70 862017 2.0" SMA 19.0 + 1.5" SMA 12.5 2+ 61 98
Norfolk 14-18 E 1991 9.0” CRCP 222013 0.7" THAMCO 4 832017 2.0" SMA 19.0 + 1.5" SMA 12.5 2+ 63-71 94

• CRCP Pavement constructed as early as 1967• More than 500 lane-miles overlaid with asphalt • In Service Age (Composite Pavement)
• Average 40 years (Standard Deviation 8.7)• Lane-mile weighted average: 40 years• Maximum 52 years and Minimum 27 years
• Age at 1st Asphalt Overlay• Average 27 years (Standard Deviation 8.5)• Lane-mile weighted average: 26 years• Maximum 48 years and Minimum 11 years• Might have received concrete patching before this!
Results – Pavement Age
Virginia Department of Transportation

• 2 to 5 inch BM &/or IM + 1.5 inch SM – 119 lane-miles• < 3.0” BM &/or IM – 43 lane-miles• ≥ 3.0” BM &/or IM – 76 lane-miles
• Mostly 1st Overlay – 1992-1999 – 14 sections• Truck Traffic – AADTT ≈ 3000
• Only 25 lane-miles: 275-2700 • Average Service 12 years
• Max: 22; Min: 6; SD 5; (Received 2nd Treatment – 104 Lane-miles)• Still in-service – 15 Lane-miles: 4 to 21+ years• IRI ≈ 100 and CCI ≈ 21 to 59 ( Only 4 section data)
Results – HMA Overlay (3.5 to 6.5 inch total)
Virginia Department of Transportation

• 1.5 to 2.0 inch Surface Mix – 38 lane-miles• Mostly 2nd or 3rd Overlay (except 2 lane-miles)• Mostly Mill and Fill
• Constructed after 2000 – Six sections• Truck Traffic – AADTT ≈ 3000
• Only 2 lane-miles < 600• Average Service Life
• 10 and 12 years – 20 lane-miles (received 3rd treatment)• IRI ≈ 61 & 68 and CCI ≈ 70 & 43
• Still in-service – 18 Lane-miles: 0 to 6+ years• IRI ≈ 77-131 and CCI ≈ 78-91
Results – HMA Overlay (1.5-2.0 inch Surface layer only)
Virginia Department of Transportation

• 0.2 to 0.3 inch Surface Treatment – 47 lane-miles• Mostly 2nd or 3rd Treatment
• Constructed after 2006 – Four sections• All overlaid by 2019
• Truck Traffic – AADTT ≈ 3000• Average Service Life 9 Years
• Range 5 to 11• IRI ≈ 87 and CCI ≈ 65 (before overlaid)
Results – Latex Modified (Surface Treatment)
Virginia Department of Transportation

• 0.7 to 0.75 inch Surface Treatment – 100 lane-miles• Mostly 1st Treatment• 2nd Treatment – Two section (29 lane-miles)
• Constructed after 2013 – Nine sections• Truck Traffic – AADTT ≈ 2500
• Only 19 lane-miles (2 sections): 200-300 • Average Service Life - > 4 years
• 4 years – 18 lane-miles (Two sections)• Still in-service – 82 Lane-miles: 0-5 years (Seven sections)• IRI ≈ 75 and CCI ≈ 89 (mostly still in service)
Results – THMACO (Surface Treatment)
Virginia Department of Transportation

• 2 to 2.5 inch IM + 1.5 to 2.0 inch SMA – 106 lane-miles• Mostly 1st Overlay – Seven sections
• Constructed 1996 and 2007 – 7 sections• 1996 – 62 lane-miles (5 sections) & 2007 – 44 lane-miles (2 sections)
• Truck Traffic – AADTT ≈ 2700-3200• Only one section (29 lane-miles) – 1300
• Average Service 21 years• Max: 23; Min: 18; Received 2nd Treatment – 28 Lane-miles
• IRI ≈ 94 and CCI ≈ 71 (before overlaid)• Still in-service – 78 Lane-miles: 12 to 23 years
• IRI ≈ 70 and CCI ≈ 91 (still in service)
Results – HMA + SMA Overlay (3.5 to 4.0 inch total)
Virginia Department of Transportation

• 1.5 to 2.0 inch SMA Surface 9.5 or 12.5 – 92 lane-miles• Mostly 2nd or 3rd – Mill and Fill – 8 sections• One as 1st and one as 4th – 2 sections
• Constructed 2006-2019, except one in 1999 (AADTT 3300)• Truck Traffic – AADTT ≈ 2900-3300
• One 1300 and another 2300 • Average Service Life
• One section received treatment after 18 years – 9 Lane-miles• IRI ≈ 107 and CCI ≈ 54 (before overlaid)
• Still in-service – 83 Lane-miles: 0 to 7 years• IRI ≈ 73 and CCI ≈ 91 (still in service)
Results – SMA Overlay (1.5 to 2.0 inch total)
Virginia Department of Transportation

• 2.0 inch SMA 19.0 + 1.5 inch SMA 12.5 or 9.5 – 120 lane-miles• Mostly 1st Overlay – 15 sections
• Constructed 2003 to 2017• Truck Traffic – AADTT ≈ 2000
• Range: 1000-3700• Average Service life – 2 to 16 (average 12)
• 2 sections overlaid after 8 and 16 years – 16 lane-miles• IRI ≈ 113 & 116 and CCI ≈ 70 & 87 (before overlaid)
• Still in-service – 104 Lane-miles: 2 to 16 years• IRI ≈ 82 and CCI ≈ 89 (still in service)
Results – SMA Overlay (3.5 inch total)
Virginia Department of Transportation

• 3.0-4.0 inch SMA 19.0 + 1.5-2.0 inch SMA 12.5 – 42 lane-miles• 1st , 2nd ( Mill & Fill) or even 3rd (Mill & Fill)
• Constructed 2007 to 2015• 5 sections
• Truck Traffic – AADTT ≈ 2000• Range: 1000-3500
• Average Service life – all in service: 3 to 12 years• IRI ≈ 92 (range 141 to 73) • CCI ≈ 81 (range 97 to 68)
Results – SMA Overlay (4.5-6.5 inch total)
Virginia Department of Transportation

• THMACO + 2.0 inch SMA 19.0 + 1.5-1.75 inch SMA 12.5• Mostly 1st Overlay/ treatment – 7 sections, 45 lane-miles
• Two sections were overlaid after 4 years of THMACO – 18 lane-miles• THMACO – 0.75 inches
• Constructed 2013 to 2017 – 7 Sections – 45 lane-miles• Truck Traffic – AADTT ≈ 2300
• Range: 2000-3000• Average Service life – all in service: 2 to 6 years
• IRI ≈ 93 (range 130 to 61) • CCI ≈ 91 (range 98 to 83)
Results – THMACO (0.75”) + SMA Overlay (<4.0”)
Virginia Department of Transportation

Treatment Total LM
TrucksPer day
In-service Overlaid/ next Treatment
LM Age, Y Condition LM Age, Y Condition
HMA (3.5” – 6.5”)(BM+IM+SM)
119 3000 15 4-21 IRI: 100CCI: 21-59
104 12(6-22)
HMA IM (2-2.5”)+ SMA Surface (1.5-2”)
106 3000 78 12-23 IRI: 70CCI: 91
28 21(18-23)
IRI: 94CCI: 71
SMA (3.5”)(19.0 + 12.5/ 9.5)
120 2000 104 2-16 IRI: 82CCI: 89
16 12(8-16)
IRI: 114CCI:70-87
THMACO (0.7-0.75”) 100 2500 82 0-5 IRI: 75CCI: 89
18 4
1st Overlay or treatment
Virginia Department of Transportation

Treatment Total LM
TrucksPer day
In-service Overlaid/ next Treatment
LM Age, Y Condition LM Age, Y Condition
HMA (1.5” – 2.0”)(Mostly Mill & Fill)
38 3000 18 0-6 IRI: 77-131CCI: 78-91
20 11(10-12)
IRI: 61-68CCI:43-70
SMA Surface (1.5”– 2”)(Mostly Mill & Fill)
92 3000 83 0-7 IRI: 73CCI: 91
9 18 IRI: 107CCI: 54
0.2-0.3” Latex Modified 47 3000 47 9(5-11)
IRI: 87CCI: 65
2nd or 3rd Overlay or treatment
Virginia Department of Transportation
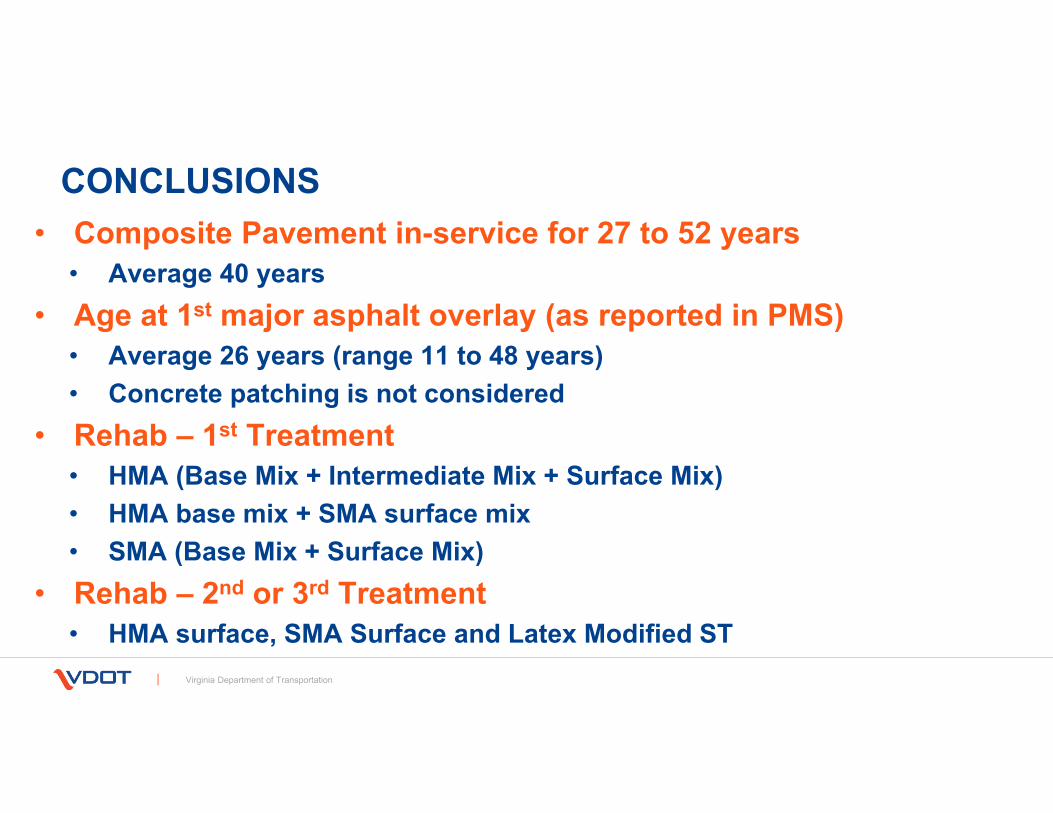
• Composite Pavement in-service for 27 to 52 years• Average 40 years
• Age at 1st major asphalt overlay (as reported in PMS)• Average 26 years (range 11 to 48 years)• Concrete patching is not considered
• Rehab – 1st Treatment• HMA (Base Mix + Intermediate Mix + Surface Mix) • HMA base mix + SMA surface mix• SMA (Base Mix + Surface Mix)
• Rehab – 2nd or 3rd Treatment• HMA surface, SMA Surface and Latex Modified ST
CONCLUSIONS
Virginia Department of Transportation

• VDOT maintenance strategies appropriate• Composite Pavement – longer service life ?
CONCLUSIONS
Virginia Department of Transportation


![Composite Pavement Virginia Tech 09 Cr2[1]](https://img.dokumen.tips/doc/110x75/577d36c61a28ab3a6b93fd5c/composite-pavement-virginia-tech-09-cr21.jpg)
