Embed Size (px)
Citation preview

The Use of GIS and ICT to Enhance School Geography 4. Long-term classroom activities: Building a GIS project
- 153 -
4 Long-term classroom activities: Building a
GIS project
This chapter dedicates itself to depicting the procedure used by the author to develop and
implement a long-term GIS project in 4e ES.
After explaining the background motives for the project, the discussion turns to elucidating
the responsibilities of the teacher in the role of a project leader.
The tutorials contained within this chapter are based on the needs for this project. However,
they are designed in a generic way, meaning that their content and approach are not
restricted to the specific project discussed herein. Indeed, they are to be understood as a
contribution to geographical teaching material that can be fully adapted to each teacher’s
needs and thus be used in a multitude of activities, since they provide universal guidelines
to achieve common GIS goals.
This chapter also provides a sample way of creating a poster layout that encompasses GIS
work as well as students’ analyses of the research conducted. Moreover, it also features a
model evaluation grid to assess students’ performance in GIS, research and layout work.
In addition, it features the planning grids used to structure group and individual work as well
as a project timeline as a sample way of organising such a project.
4.1 Background
Inspired by the outcomes of the first mapping activities with C&D, the author was on the
lookout for a project that could make use of more developed GIS techniques. He was also
curious to see what level of performance students in 4e could achieve.
The author tried to find a project that was capable of showing the students what power they
have with their knowledge and proficiency they had acquired so far. If this project could also
allow them working on a real scenario, not staged for educational purposes, the author
believed he might provide an invigorating learning experience, giving students the
opportunity to foster their citizenship and make a difference in an ever interconnecting and
globalising world.
The Map Kibera project immediately captivated the author’s attention. Kibera is the largest
slum in Africa and is located south of Nairobi, Kenya’s capital. Despite the fact that it is one
of the most well serviced and researched slums in the world, it had been a blank spot on
official maps. The Map Kibera initiative created in 2009 wanted to remedy this crucial
shortcoming. As the Map Kibera initiators put it: ‘Without basic knowledge of the geography
of Kibera it is impossible to have an informed discussion on how to improve the lives of

The Use of GIS and ICT to Enhance School Geography 4. Long-term classroom activities: Building a GIS project
- 154 -
residents of Kibera.‘ The founding team, Erica Hagen and Mikel Maron, recruited Kibera
locals and set-up a mapping procedure using OpenStreetMap techniques (Mapkibera.org,
2011). The mapping initiative was able to create a detailed map of Kibera, which is
continuously maintained by a set of volunteers.
As the project is community-driven, it radiates a welcoming feel for any person interested in
the project, since there is no sterile company structure that has to be penetrated before
getting involved in the matter. This appeal is also supported by the fact, that the Map Kibera
initiative led to the creation of other community-driven web presences such as Kibera News
Network, featuring video reports on Kibera and the Voice of Kibera site, where the
community posts news and cultural events, but also crimes to create community awareness.
This gave the impression of getting in touch with a vibrant community and it was hoped that
students would also pick up this feeling, as this should support and further their intrinsic
motivation in the project.
The decisive advantage that led to further researching this initiative is that data are open
source and thus available at no cost. After inspection, data was found to be of good enough
quality, along with valuable attribute data, to be used in class.
Contact was made with Mikel Maron, explaining the intentions for doing research on their
data and enquired if they were interested in the students’ research results. The author also
asked whether there were special research topics they were focussing on and how the
students could contribute. Mikel stated that since Kibera was a well-researched area, there
were no specific topics on their agenda indeed, but they were eager to see the project
results, as it is rare that they get interest from foreign countries, let alone schools.
4.2 The teacher as a project coordinator
If a teacher choses to engage in a GIS project with a class, he or she effectively promotes
to the project coordinator; a role that comes with new responsibilities discussed in this
section.
The set of duties chiefly infers from the manner in which the project is set up. In relation to
fieldwork, Bland et al. (1997, p. 173), Kent & Foskett (2002, pp. 166, 172) and Lambert &
Balderstone (2000, pp. 234–246) describe different ways in which enquiry-based work can
be conducted. A GIS project, such as the one presented here, can be seen as form of
virtual fieldwork and thus the classifications established by the former authors apply to an
equal extent.
This project adopts a ‘framed semi-negotiated’ enquiry-based approach. The framed
approach pre-sets the main area of research before submitting the project to the students.
This frame limits the scope investigation, useful to thrive students towards a common goal.

The Use of GIS and ICT to Enhance School Geography 4. Long-term classroom activities: Building a GIS project
- 155 -
However, it is only a scaffold upon which students should build further work. The semi-
negotiated component allows the students to dress this scaffold with their own area of
investigation after consulting with the teacher, confirming they remain within the research
area.
Combining framed and semi-negotiated styles creates a work environment encompassing
individual and group work. Indeed, each student produces a personal piece of research,
which fits within the greater research area of his or her group.
This approach, where the learning experience shifts from teacher-controlled to student-led
and student-centred, is believed to motivate students in the way that they are given the
leeway of researching matter of personal interest, but also being compelled to produce
decent results for the benefit of peer appraisal and their group’s overall success.17
In view of these principles, the teacher needs to organise and manage both group and
individual tasks, without losing track of the goals set and the deadlines to be met.
Additionally, the teacher needs to be able to advise the students, whether they may need
assistance in relation to their research or in relation to issues with the GIS. This further
supports the student-centred and differentiated approach, as the teacher needs to attend to
the student’s individual requests.
Also, checking up regularly on students’ work and monitoring progression is key to
completing the project within a given timeframe. Therefore, a precise timetable with tasks to
be completed and goals to be met was handed out to the students at the beginning of the
project. Respecting the deadlines was enforced by implementing a strict check-up routine
on each key date coupled with detailed notes on the progression. In addition, failure to meet
deadlines forfeited marks.
Moreover, it is also the teacher’s responsibility to provide the students with evaluation
criteria at the beginning of the project to ascertain that students concentrate their efforts on
important work without drifting into processes that might lead to products not meeting the
requirements and aims of the project, thus losing precious time.
Since this project leads to works and pictures of classroom activity being published outside
school walls, the author asked for parents’ permission by means of a form, which had to be
signed an submitted at the beginning of the project (see Appendix F – Consent form).
17 In 2010, the author conducted an outdoor fieldwork project with success using the same teaching styles and approaches (Klapp, 2010a).

The Use of GIS and ICT to Enhance School Geography 4. Long-term classroom activities: Building a GIS project
- 156 -
4 .3 Tutorials
The tutorials presented in this section can be classified into three categories. The first kind
prepares the students towards defining a research topic. These activity sheets introduce
them to the Map Kibera problematic by presenting websites covering the area and inciting
them to read through recent online posts on the most common issues in relation to Kibera.
While doing so, students should take spontaneous notes of any subject that attracts their
attention. These notes will help the students formulating a more precise research topic in
the subsequent tutorials, which provide further guidance by presenting the data available for
research.
Table 28 lists the GIS tasks explained in the first set of tutorials.
Tutorial Content See pages
Map Kibera 2012 Introduces the Map Kibera initiative to the students and explains its origins. Instructs the students to read up and take notes on major issues in Kibera. Presents the philosophy of the school project and its links Kibera community.
p. 158
1. Presents the data available for analysis. p. 159
2.1 Explains how students obtain Map Kibera data (shapefiles in a zipped file) p. 160
2.2 Explains how students load the data into QGIS. Explains how to build the initial QGIS project, containing all the data, forming the standardised building block for all students.
pp. 160-161
Map Kibera 2012 Questions de recherche
Guides students in: 1) specifying a research topic for their group 2) specifying individual research projects
pp. 162-163
3.1 Introduces students to the attribute table: opening, selecting elements, showing the link between geographical features and their attribute values
p. 164
3.2 Introduces the students to advanced attribute table features such as: sorting data, zoom to selected objects, editing mode.
p. 165
3.3 Introduces students to the query editor: structure, SQL language, first query formulation
p. 165
Table 28: Map Kibera project tutorials – set 1 Author: Klapp, 2012
The second kind of tutorials guide students through completing the GIS tasks necessary to
achieve their research goal. These tutorials have been designed to feature an easy-to-
follow, step-by-step structure. However, they cannot be worked off in a mechanical way, as
students have to reflect critically how the tasks have to be completed to match the needs of
their individual research topic (e.g.: manipulating the correct layers, specifying different
values for buffer zones, etc. …).

The Use of GIS and ICT to Enhance School Geography 4. Long-term classroom activities: Building a GIS project
- 157 -
Table 29 lists the GIS tasks explained in the second set of tutorials.
Tutorial Content See pages
4. Explains the basic principles according to which analyses are to be carried out. Informs the students of the way in which QGIS performs geoprocessing. Explains the use of the operator LIKE and ‘%’ to devise flexible queries
p. 167
4.A Explains how to create buffers. pp. 168-169
4.B Explains how to extract areas not covered by buffers using the Difference module. p. 170
4.C Explains how to create suggestions for new equipment location within the areas outside a buffered zone using the Polygon Centroids module.
pp. 171-172
4.D Explains how to adapt semiology by using the Symbology module p. 173
4.E Explains how to represent classes of object using different symbols based on sets of rules, using the Symbology module.
p. 174
4.F Explains how to count points inside a polygon using the Point in polygon module. Explains how to create a choropleth map using the Symbology module, making use of the previous point-in-polygon count.
pp. 175-176
4.G Explains how to extract intersections between two buffers (or between two area vector layers in general) using the Intersect module.
p. 177
4.H Explains how to identify the points contained within an area (buffers in this case) using the Spatial Query module. Explains how to save the result of the spatial query as a new layer.
p. 178
Table 29: Map Kibera project tutorials – set 2 Author: Klapp, 2012
The third set of tutorials leads the students through the finalising tasks. At first, they are
required to present their individual work by means of a thematic map along with a brief
commentary discussing the results of their research. At second, an information sheet also
presents the criteria against which students’ work is evaluated. For quick reference, a final
summary table reminds the students of the tasks to be carried out. This sheet also guides
the students in relation to what information needs to be included on the group posters.
Table 30 lists the tasks explained in the third set of tutorials.
Tutorial Content See pages
5. Explains how to create a map sheet containing map, title, legend, scale, orientation and a map commentary using the Print Composer functionality
pp. 197-180
Map Kibera 2012 Evaluation
Explains the marking scheme for individual and group work. Explains the contents of the group poster. Summarises the tasks to be completed
p. 181
Table 30: Map Kibera project tutorials – set 3 Author: Klapp, 2012

The Use of GIS and ICT to Enhance School Geography 4. Long-term classroom activities: Building a GIS project
- 158 -
Map Kibera 2012LE PROJET INITIAL:Il s’agit d’un projet de cartographie de Kibera, le plus grand bidonville du Kenya. Avant la mise en place de ce projet pionnier et même encore à l’heure actuelle, les autorités kenyanes n’ont jamais fait !gurer ce bidonville sur des cartes o"cielles. « [C’est] une manière d’en nier l’existence qui a !ni par pousser ses habitants à bout : aidés par des ONG, ils ont décidé de révéler leur univers grâce à Internet. [...] les habitants ont décidé de cartographier leur existence, en ligne, forçant les autorités à les en prendre en compte. (france24, 2010)».
Créez un nouveau document LibreOffice Writer dans le répertoire MapKibera sur votre netbook. Ce document sera votre bloc de notes numérique. Il sert à enregistrer tout genre d’informations que vous jugez intéressantes et importantes. Utilisez ce document aussi pour collectionner des liens internet en relation avec votre travail de recherche tout au long du projet. Nommez-le simplement NOM_PRENOM_MapKibera_Notes.odt (utilisez votre nom/prénom!). Ce fichier deviendra à fur et à mesure une ressource d’informations précieuse - il contiendra vos idées de recherches, critiques, émotions, pensées que vous vivrez au cours du projet.✎ Exercice :! Renseignez-vous sur la mise en place du projet MapKibera en lisant l’article
! ! indiqué ci-dessous: Notez les informations-clé dans votre document de notes!! ! • Mise en place du projet MapKibera http://www.france24.com/fr/20100930-kibera-map-bidonville-carte-internet-kenya-nairobi
MAP KIBERA - déclenchement d’une motivation jamais vue auprès des habitants de la communauté:Map Kibera a su tirer pro!t des nouvelles technologies informatiques et cartographiques avec le support d’internet qui est devenu de plus en plus accessible au Kenya. Le site web du projet est accessible sous http://mapkibera.org. Suite au projet initial et la mise en place des infrastructures (connexions, réseau, électricité) dans les locaux de l’organisation Map Kibera, un e#et de boule de neige s’est développé. Les habitants ont pris conscience du fait qu’à l’aide d’internet ils savent a"rmer leur existence et aider la communauté de Kibera à combattre les problèmes quotidiens et à créer un sentiment d’identité.
C’est ainsi que les habitants de Kibera on développé leur propre chaîne de télévision en ligne (KIBERA NEWS NETWORK, http://kiberanewsnetwork.org et un site communautaire de Kibera qui reprend les évènements du bidonville (culture, crimes, décès, urgences, etc.) appelé VOICE OF KIBERA (http://voiceo!ibera.org). Voice of Kibera reprend la fonction d’un quotidien classique et sert de nœud d’échanges d’actualités et d’informations!
D’où provient ce dynamisme de la population de Kibera?
Kibera, comme tout bidonville, a"che des manques préoccupants en termes de développement. Ces manques sont en partie à l’origine du dynamisme de la communauté à Kibera a!n d’améliorer leurs conditions de vie.
✎ Recherche :! Les manques de développement à KiberaLe site indiqué ci-dessous propose un aperçu des conditions de vie défavorables à Kibera. En français, faites-en un résumé en mots-clés dans votre document de notes. Puisque le site est en anglais, il faut que vous utilisiez un dictionnaire pour
rechercher les termes équivalents en français.! • http://www.kibera.org.uk/Facts.html • Dictionnaire: http://www.wordreference.com/enfr/
La « famille » Map Kibera dans leurs locaux
Géographie 4ème - Projet Classe Netbook! Map Kibera 2012
- 1 -

The Use of GIS and ICT to Enhance School Geography 4. Long-term classroom activities: Building a GIS project
- 159 -
Comment pouvons-nous contribuer?Le travail de recherche de la page précédente vous a introduit aux préoccupations dominantes à Kibera. Certes, depuis que cet article fut rédigé, maintes améliorations ont déjà été mises en place. Néanmoins, Kibera est loin d’avoir surmonté ses problèmes.
Le projet Map Kibera met à disposition gratuitement des données que nous pouvons utiliser pour analyser les problèmes mentionnés dans un contexte spatial (p.ex.: où doit-on encore installer des équipements sanitaires, quelles sont les régions les mieux desservies par des écoles, où se situent les lieux à éviter le soir et pour quelles raisons, où se trouvent des points d’aide. etc… ).
NOTRE CONTRIBUTION AU PROJET DÉPENDRA ESSENTIELLEMENT DE VOS IDÉES DE RECHERCHE ET
DE VOTRE MOTIVATION PERSONNELLE POUR AIDER UNE COMMUNAUTÉ EN DÉVELOPPEMENT. Le chapitre suivant vous expliquera les données qui sont à notre disposition et comment les lire et les interpréter.
1.Présentation des données Map Kibera disponibles:Nous disposons de 8 types d’informations, à savoir:
Type d’information Nom de la couche (layer) Attributs ( = informations additionnelles)Limites d’extension de Kibera boundary-shapefile name: nom des villages/quartiers de Kibera
Localisation des écoles education-shapefile name: nom de l’école type: primaire, maternelle, ...
Localisation des points de traitement médicaux
health-shapefile name: nom du point de traitementtype: clinique, pharmacie, droguerie, herboristeoperator: gérant du point (ONG, privé, …)status: point de traitement fermé ou non
Localisation des lieux de culte religion-shapefile name: nom du lieu de cultereligion: christianisme, islam, denom: confession (catholicisme, protestantisme, sunni, …)
Localisation des lieux à sécurité confirmée ou redoutable
security-shapefile security: type de point de « sécurité »(Attention: il faudra déterminer par d’autres informations, surtout dans la
colonne description, si un point est un endroit de sécurité ou non)
name: nom du point de « sécurité »status: équipement fonctionnel ou nondescript: description du point (détails importants!)light_type: type de lumière installée (un renseignement
apparemment bizarre, qui pourrait s’avérer être intéressant lors des analyses)
Voies de circulation transport-shapefile(dont Road et Railway)
name: nom de la voie type: route principale, chemin privé,…
Localisation des équipements sanitaires
watsan -shapefile watsan: type d’équip. (toilette publique, accès public, recyclage, ...)nom: nomsatus: état de l’équipement (non opérationnel, fonctionnel)descrip: description du type de point
Localisation de points de services - toutes sortes confondues
unsorted-amenities-shapefile name: nom du point amenity: type d’équipement (toutes sortes confondues)
Géographie 4ème - Projet Classe Netbook! Map Kibera 2012
- 2 -

The Use of GIS and ICT to Enhance School Geography 4. Long-term classroom activities: Building a GIS project
- 160 -
2.Obtenir les fichiers shapefile de Map Kibera et chargement dans QGIS2.1.Télécharger les shapefiles
• Connectez-vous sur myDisk et naviguez dans le répertoire de Geographie\MapKibera\GISDATA.
• Vous y trouverez le fichier MapKibera-Shapefiles.zip. Téléchargez ce fichier zip.
• Déballez le fichier .zip téléchargé sur votre netbook dans le répertoire de Geographie\MapKibera\GISDATA. (voir image à droite).
SI VOUS NE SAVEZ PLUS COMMENT MANIPULER LES FICHIERS ZIP RELISEZ LE TUTORIEL CORRESPONDANT!
2.2.Créer le projet QGIS initial qui regroupe toutes les couches (layers) disponiblesCette première étape vous amènera à créer un projet initial (autrement dit: un document QGIS de démarrage) qui servira comme point de départ. Dans ce projet figureront touts les 8 types d’informations disponibles et un fond de carte en images aériennes!
• Lancez QGIS.
• Avant de charger les fichiers il faut d’abord communiquer quelques conditions générales de travail. Pour ce faire, cliquez sur le menu Settings → Project Properties.
• Dans le dialogue qui s’ouvre spécifiez sous l’onglet General le Project title Map Kibera 2012.
• Cliquez ensuite sur Coordinate Reference System. Ici nous communiquons à QGIS de travailler avec le système de coordonnées Google Mercator, car nous allons ajouter des images aériennes qui sont encodées à l’aide de ce système. Vous trouvez Google Mercator dans cette longue liste sous Projected Coordinate System → Mercator → Google Mercator.
• IMPORTANT: Cliquez sur Enable ‘on the fly’ CRS transformation. QGIS convertira alors toutes les références en Google Mercator. Si vous oubliez de sélectionner cette option, les shapefiles de Kibera se trouveront déplacés de quelques centaines de kilomètres par rapport aux images aériennes.
• Validez avec OK.
Géographie 4ème - Projet Classe Netbook! Map Kibera 2012
- 3 -

The Use of GIS and ICT to Enhance School Geography 4. Long-term classroom activities: Building a GIS project
- 161 -
Maintenant on peut procéder à charger les shapefiles que vous avez téléchargés et dé-zippés dans votre répertoire de géographie.
• Dans la barre d’outils cliquez sur l’icône Add Vector Layer ou utilisez le menu Layer → Add Vector Layer.
• Dans le dialogue qui s’ouvre, recherchez les shapefiles à l’aide du bouton Browse. Naviguez sous le répertoire de géographie MapKibera\GISDATA où devront maintenant se trouver les 8 répertoires de shapefiles du fichier zip décompressé.
• Entrez dans le répertoire boundary-shapefile.Vous y trouverez une seule shapefile: Boundary.shp1.Chargez ce fichier. Validez avec Open.
✌ Et voilà, votre premier shapefile est chargé. ✌
• Chargez les 8 shapefiles restants! (Attention: deux shapefiles dans le répertoire transport-shapefile!)
• Quand vous avez terminé vous obtenez une carte similaire à l’image à droite:
• Dans l’espace Layers (image à droite, encadré en rouge), vous pouvez maintenant cocher et décocher les couches (= layers) à représenter selon vos besoins. L’ordre dans lequel les couches figurent dans l’espace Layer est leur ordre de superposition. C’est-à-dire, « Boundary » est placé en-dessous de toutes les autres couches, par exemple. Vous pouvez changer cet ordre en cas de besoin en déplaçant les couches vers le haut ou vers le bas.
• Sauvegardez votre projet! (File → Save Project) dans votre répertoire de géographie sous MapKibera\CARTES_QGIS. Nommez ce projet 00_MapKibera_INITIAL.qgs. Gardez QGIS ouvert!
• Ajoutez l’imagerie aérienne à votre projet: Choisissez Plugins → OpenLayers plugin → Add Bing Aerial layer. L’image aérienne se superposera à votre carte. Glissez la couche Bing Aerial tout en bas de vos couches. Puis décochez-la! Sauvegardez votre projet (File → Save Project (pas besoin de spécifier le nom une deuxième fois.
• Les noms des couches sont « en vrac », peu explicatifs. Pour les renommer, faites un clic droit sur la couche et cliquez sur Rename. Renommez selon le système suivant:
watsan → Équipements sanitaires religion → Lieux de culteAmenities → Équipements health → Services médicauxRoad → Routes education → ÉducationRailway → Chemin de fer Boundary → Villages de Kiberasecurity → Sécurité Bing Aerial → Images aériennes BingN’oubliez pas de sauvegarder votre projet une dernière fois!
✌ Félicitations pour la mise en place de votre document de démarrage pour votre recherche! ✌
Projet Map Kibera chargé SANS images aériennes verticales
Géographie 4ème - Projet Classe Netbook! Map Kibera 2012
- 4 -
1 Rappelez-vous qu’un shapefile se compose de 7 fichiers en total; ici QGIS ne nous montre que le fichier principal. Les autres fichiers se trouvent néanmoins dans le répertoire.

The Use of GIS and ICT to Enhance School Geography 4. Long-term classroom activities: Building a GIS project
- 162 -
Map Kibera 2012
QUESTIONS DE RECHERCHE ET ÉTAPES DE TRAVAIL:Avant d’entamer un projet de recherche, il faut d’abord être clair sur le sujet et le but de la recherche. C’est pourquoi que vous vous mettez d’accord sur un sujet d’enquête et un résultat probable (qui pourra changer à fur et à mesure que vous progressez) de votre recherche dans la leçon précédente.
Ce travail a deux !nalités:
1. Il est utile pour vous: À la !n vous notez le thème général (p.ex.: sécurité, éducation, sanitaire,…) de recherche et trois sujets plus concrets (p.ex.: où se trouvent les écoles primaires? / quelles sont les régions qui ne disposent pas encore d’écoles dans un périmètre de X m?). Ainsi vous avez une idée claire de votre tâche dans les leçons qui suivent.
2. Il est utile pour vos enseignants: Sur base de vos idées et de vos intérêts, ils/elles préparent des tutoriels et des guides qui vous expliquent comment exécuter les étapes nécessaires à vos analyses et comment en créer une carte.
Voici un guide sur les étapes à e"ectuer:
• Chacun est responsable d’un travail cartographique qui traite son sujet de recherche choisi (travail individuel).
• Votre carte doit être explicitée à l’aide d’un commentaire de carte (± 250 mots) (travail individuel).
• Votre travail doit comprendre une introduction au problème dans le contexte de Kibera: Recherchez des documentations dans les médias (rappelez-vous les trois sites indiqués en début de projet) pour expliquer et illustrer l’importance de votre sujet d’analyse. La rédaction de cette introduction sera un travail commun au sein de votre groupe (± 250 mots).
!
Composition des groupes:
• 6 groupes à 3 personnes
• 1 groupe à 4 personnes!
Membres de ce groupe (1 sujet par membre):• _________________________________________• _________________________________________• _________________________________________
✎ Notre groupe souhaite traiter le thème global suivant
✎ Et nous aimerions enquêter en détail sur les problèmes / questions suivantes:
Géographie 4ème - Projet Classe Netbook! Map Kibera 2012
- 5 -

The Use of GIS and ICT to Enhance School Geography 4. Long-term classroom activities: Building a GIS project
- 163 -
✎ RÉSULTATS: Dans le cas idéal, nous souhaitons produire des cartes qui montrent:(Les thèmes des cartes découlent évidemment de vos sujets de recherche!)
✎ ACTIVITÉ: ! Cochez les shapefiles et attributs qui vous semblent nécessaires pour ! ! votre travail de recherche et de cartographie dans la table ci-dessus.
Rappel: Nous disposons des informations suivantes:
Nom du layer dans QGIS Nom du répertoire du shapefile Colonne(s) d’attribut utilisée(s) probablement
❑ Équipements sanitaires ❑ watsan-shapefile ❑ watsan ❑ status ❑ descrip
❑ Équipements ❑ unsorted-amenities-shapefile ❑ name ❑ amenity type
❑ Routes ❑ transport-shapefile ❑ name ❑ type
❑ Chemin de Fer ❑ transport-shapefile ❑ name ❑ type
❑ Sécurité ❑ security-shapefile ❑ security ❑ name ❑ status ❑ descript ❑ light_type
❑ Lieux de culte ❑ religion-shapefile ❑ name ❑ religion ❑ denom
❑ Services médicaux ❑ health-shapefile ❑ name ❑ type ❑ operator ❑ status
❑ Éducation ❑ education-shapefile ❑ name ❑ type
✔ Villages de Kibera ✔ boundary-shapefile ❑ name
❑ Images aériennes Bing / /
Structurez vos idées autour des sujets touchant: ! • Les lieux de culte (sujet limité tout seul, à mettre en relation avec d’autres recherches)! • L’éducation! • Les services médicaux ! • Les équipements sanitaires! • Les équipements (toutes sortes confondues)! • La question de sécurité (sujet vaste, minimum 2 groupes devraient traiter ce sujet)
Les layers suivants contiennent des information qui peuvent servir comme complément à vos données principales, mais sont trop limités pour en faire une analyse individuelle:! • Chemin de fer ! • Routes
Géographie 4ème - Projet Classe Netbook! Map Kibera 2012
- 6 -

The Use of GIS and ICT to Enhance School Geography 4. Long-term classroom activities: Building a GIS project
- 164 -
3.Analyser les données
3.1.La table des attributsLes shapefiles desquels on dispose sont plus que de simples représentations cartographiques. En plus des formes (points, surfaces, lignes) qu’ils fournissent, chaque élément d’un shapefile contient des informations additionnelles. On appelle ces informations additionnelles des attributs.✎ EXERCICE: Voici un exemple concret pour démonrter l’utilité et l’importance des attributs:
• Lancez QGIS et chargez votre projet MapKibera initial (fichier: 00_MapKibera_INITIAL.qgs).
• Sélectionnez la couche Villages de Kibera.
• Ensuite cliquez sur l’icône (Identify Features). Votre curseur se met en « mode identification ».
• Cliquez sur un village de Kibera. Une nouvelle fenêtre s’ouvre et affiche les attributs de l’élément choisi; dans ce cas, un village de Kibera. Le layer Villages de Kibera a deux attributs attachés, à savoir name (contenant le nom du village) et admin_leve (qui n’a pas été renseigné). Sous Derived QGIS vous calcule automatiquement l’aire d’une surface.
• Désactivez le mode identification en cliquant sur (Pan Map).
Comment faire alors pour accéder aux attributs de tous les éléments d’une couche? (Notez bien qu’il existe, par exemple, plus de 582 équipements sanitaires; une identification élément par élément serait tout simplement impossible).
QGIS offre la possibilité d’afficher tous les attributs de chaque élément d’une couche sélectionnée sous forme de table, qu’on peut trier et filtrer selon les besoins. Ainsi on a une vue d’ensemble rapide et claire. Cette table est appelée la table des attributs (Attribute Table).✎ EXERCICE: Afficher la table des attributs pour le layer Villages des
Kibera.
• Faites un clic-droit sur le layer Villages de Kibera.
• Dans le menu de contexte qui s’affiche cliquez sur Open attribute table.
• La table des attributs s’affiche.
•La structure de la table des attributs est simple:! Chaque rangée correspond à un élément qui est affiché (p.ex. un village dans le cas présent).! Chaque colonne contient un attribut de l’élément (p.ex.: le nom dans la colonne name)
• Cliquez sur l’élément 0 (Makina). Makina est relevé en jaune sur la carte.
•Donc, la table des attributs et directement liée à la carte. Et vous disposez d’une deuxième méthode pour identifier des éléments. (C’est pratique pour rechercher un élément dont vous connaissez le nom, mais pas sa localisation.)
Géographie 4ème - Projet Classe Netbook! Map Kibera 2012
- 7 -

The Use of GIS and ICT to Enhance School Geography 4. Long-term classroom activities: Building a GIS project
- 165 -
3.2.Manipuler la table des attributsLa table des attributs sera un élément essentiel de votre travail. C’est le point central pour trier les données, choisir des éléments selon des critères (p.ex.: uniquement afficher les écoles primaires) ou encore corriger des erreurs dans les attributs (p.ex.: changer le nom d’une école).
✎ EXERCICE:! Se familiariser avec les actions de base de la table des attributs.
• TRIER: ! Vous pouvez trier les colonnes en ordre croissant/décroissant (numérique & alphabétique) ! ! en cliquant sur les headers des colonnes.! ! Essayez de trier la table en ordre alphabétique des villages. Puis inversez cet ordre.
• ZOOM SUR UN OU PLUSIEURS ÉLÉMENT(S) SÉLECTIONNÉ(S):! Si vous sélectionnez un élément de la table des attributs, vous avez la possibilité de zoomer ! directement sur cet élément à l’aide de l’icône (Zoom map to the selected rows).! Cliquez sur Anany (affiché alors en jaune) et puis sur . Vous voyez Anany en gros-plan.
• EDITER LES ATTRIBUTS:! Par défaut votre shapefile est protégé contre toute manipulation (déplacement des éléments, ! édition d’attributs). C’est ainsi que nous devons d’abord activer le mode édition (Editing mode).
! ! Dans la table des attributs, cliquez sur (Toggle editing mode). Dès maintenant, vous ! ! pouvez déplacer des éléments et éditer les attributs.
! ! Exercice d’entrainement: Changer la valeur admin_level pour tous les villages.! ! Pour chaque village, remplacez la valeur NULL avec town.
! ! Désactivez le mode édition en cliquant à nouveau sur . QGIS vous demande si vous ! ! souhaitez sauvegarder vos changements. Confirmez avec Save.
3.3.Lancer une recherche sur les données (Query)Notre projet Map Kibera est un projet GIS relativement petit! Et pourtant il contient 3778 éléments! Il est donc impossible d’analyser les éléments un par un. On doit pouvoir les analyser et filtrer selon des critères. Cette tâche est accomplie par des queries (= recherche).✎ EXERCICE-EXEMPLE:!N’afficher que les écoles exclusivement
maternelles.
• Étape préliminaire: décochez toutes les couches sauf Éducation et Villages de Kibera pour dégager la représentation cartographique.
• Clic-droit sur Éducation, puis cliquez sur Query….
• La fenêtre du Query Builder, divisée en quatre parties s’affiche: ! • Fields: sélectionnez l’attribut sur lequel vous souhaitez effectuer votre recherche! • Operators: fonctions mathématiques et logiques! • Values: ici s’affichent les valeurs de l’attribut en question! • SQL where clause: espace qui résume votre requête
Géographie 4ème - Projet Classe Netbook! Map Kibera 2012
- 8 -

The Use of GIS and ICT to Enhance School Geography 4. Long-term classroom activities: Building a GIS project
- 166 -
• Créer la recherche (query):! QGIS utilise une structure de recherche qui correspond un peu au ! ! ! ! langage « normal ».Nous souhaitons instruire QGIS d’exécuter la tâche suivante:! « Montre-nous les éléments qui sont des écoles maternelles uniquement ».Notre recherche demande donc de filtrer selon un type d’école; d’où la recherche suivante:
• double-cliquez type qui s’ajoute alors dans l’espace de résumé.
• le type doit être « égal à » une école maternelle: cliquez sur le signe = qui se rajoute alors dans l’espace résumé.
• Maintenant, le problème suivant se pose: Comment savons-nous comment le type des écoles maternelles s’appelle dans le shapefile? L’auteur a bien pu utiliser une autre langue ou un autre dénomination, non?Le bouton All dans l’espace Values fournit la solution. Cliquez dessus.S’affichent alors toutes les valeurs différentes qui se trouvent de l’attribut type.Et voilà, nous voyons que les types sont enregistrés en langue anglaise. Une école maternelle s’appelle donc kindergarten.Et comme nous souhaitons seulement afficher les écoles qui sont exclusivement des maternelles, nous devons choisir le type kindergarten seul. Double-cliquez-le, il s’ajoute dans l’espace résumé.Voilà! Notre recherche est complète! En langage SQL (le langage de QGIS et de nombreux autres logiciels) elle se lit: ! ! ! ! ! "type" = 'kindergarten'
• Cliquez sur Test pour vérifier qu’elle fonctionne. QGIS devrait confirmer en informant qu’il y a 9 éléments qui correspondent à ce critère de recherche. Validez avec OK.
• Exécutez la recherche avec OK.
• Ne s’affichent alors plus que les 9 écoles maternelles dans le layer Éducation.
• Astuce finale: ! Pour désélectionner des éléments sélectionnés auparavant, cliquez sur ! ! ! Deselect features from all layers.
• Fermez QGIS SANS enregistrer le projet!
Query Builder avec recherche spécifiée
Le layer Éducation n’affiche plus que les points qui correspondent aux critères de recherche
✌ Félicitations! Vous avez maintenant appris comment éditer et filtrer les données selon vos besoins de recherche ✌
Géographie 4ème - Projet Classe Netbook! Map Kibera 2012
- 9 -

The Use of GIS and ICT to Enhance School Geography 4. Long-term classroom activities: Building a GIS project
- 167 -
4.Exécuter des analyses GIS (geoprocessing (angl))Ce chapitre vous propose une série de tutoriels qui vous expliquent comment exécuter les manipulations nécessaires pour achever vos travaux de recherche. Les tutoriels montrent chaque fois une manipulation détaillée qui sert d’exemple standard. C’est-à-dire que vous devez choisir les données correctes qui correspondent à votre sujet de recherche!
REMARQUES PRÉLIMINAIRES – À LIRE SOIGNEUSEMENT
• Avant de commencer vos analyses décochez les layers dont vous n’aurez pas besoin. Ceci dégagera votre espace de travail et fournira une représentation plus claire.
• Votre projet (fichier 00_MapKibera_INITIAL.qgs) ne doit JAMAIS être modifié puis qu’il s’agit de votre point de départ. C’est-à-dire que chaque analyse doit être enregistrée comme nouveau projet: File → Save Project As…
• Augmentez le numéro au début du fichier de 1 pour chaque nouvelle analyse et nommez le selon le sujet analysé. Ceci permettra à vous de suivre l’évolution de votre travail.p.ex.: 01_MapKibera_Localisation_Dentistes.qgs Enregistrez les fichiers de projet .qgs TOUJOURS dans le répertoire Cartes_QGIS.
• Principe de fonctionnement des modules d’analyse de QGIS: 1. Specify Input 2. Execute Analysis 3. Produce Output’Quand vous lancez un module d’analyse, QGIS vous demande toujours de spécifier :1) Les données avec lesquelles vous souhaitez travailler = Input2) Les travaux à exécuter = Process3) L’endroit de sauvegarde des résultats = OutputQGIS sauvegarde les résultats de vos analyses dans un nouveau shapefile. Il faut que vous lui spécifiez le nom et l’endroit du shapefile de résultats (= Output shapefile). Suivez la logique suivante consciencieusement (sinon vous perdez vos fichiers!) Répertoire Input Shapefile = Répertoire du Output Shapefile (p.ex: Si l’Input Shapefile est enregistré dans le répertoire GISDATA\watsan-shapefile, alors l’Output Shapefile sera enregistré dans le même répertoire!) Ainsi, cliquez sur Browse et naviguez dans le répertoire qui contient l’Input Shapefile et nommez l’Output Shapefile de manière claire. Recommandation pour cet exemple: buffers_100m_toilettes.shp).
UN OPÉRATEUR DE QUERY IMPORTANT POUR VOTRE TRAVAIL: LIKE ET LE SIGNE %• Imaginez que vous voulez limiter la représentation de points aux écoles primaires.
• Beaucoup d’écoles à Kibera offrent le primaire, la maternelle et même le secondaire sous un même toit. Ainsi vous avez des points qui ont comme type kindergarten,nursery,primary ou encore primary,secondary. Le query “type” = ‘primary’ ne sélectionnera pas ces établissements - car QGIS cherchera les points contentant UNIQUEMENT primary comme type.
• L’opérateur LIKE en combinaison avec % permet de formuler un query plus flexible - il permet de spécifier des variables.Ainsi: vous pouvez dire à QGIS de sélectionner tous les points qui contiennent primary dans leur type même s’il y a d’autres types d’enseignement.
• Voici un tel exemple: Les % expriment que le type peut contenir d’autres informations que seulement primary."type" LIKE '%primary%'
Géographie 4ème - Projet Classe Netbook! Map Kibera 2012
- 10 -
The Use of GIS and ICT to Enhance School Geography 4. Long-term classroom activities: Building a GIS project
- 168 -
4.A.Établir un périmètre autour d’un objet (un tampon (fr) ou buffer (angl))
Utile pour répondre à une question du genre: « Quelle est l’aire d’in!uence/attraction (Einzugsgebiet) d’une école, etc... en présumant un périmètre de x mètres ? »
• Module utilisé : (accessible sous Vector → Geoprocessing Tools → Buffer(s))
• Attention: Normalement vous ne travaillez que sur des éléments spécifiques, (p.ex.: uniquement les écoles primaires). Il faut alors exécuter un Query afin d’afficher uniquement les éléments de votre choix! (Dans l’exemple fourni ne figurent que les toilettes. Query utilisé: "watsan" = 'toilet_public' sur le layer Équipement sanitaires.)
Module Buffer(s)
• Exécution: !1) Sélectionnez le layer sur lequel vous souhaitez créer le buffer sous Input vector layer.2) Spécifiez que les cercles se composent de 10 segments pour avoir un cercle bien lisse: Segments to approximate 103) Indiquez le radius du buffer sous Buffer distance! Attention, les unités sont graduées selon le principe suivant:! 0.0001 pour 10m 0.001 pour 100m 0.01 pour 1km4) Cochez Dissolve buffer results. Les buffers formeront une surface continue.5) Étape importante:!! QGIS sauvegarde les résultats (ici: les buffers) dans un nouveau shapefile. ! Il faut que vous lui spécifiez le nom et l’endroit du shapefile de résultats (= Output shapefile).! Suivez la logique suivante consciencieusement (sinon vous perdez vos fichiers!)! ! ! Répertoire Input Shapefile = Répertoire du Output Shapefile! (p.ex: L’ Input Shapefile est enregistré dans le répertoire GISDATA\watsan-shapefile, ! alors l’Output Shapefile sera enregistré dans le même répertoire!)! Ainsi, cliquez sur Browse et naviguez dans le répertoire qui contient l’ Input Shapefile et ! nommez l’Output Shapefile de manière claire. Recommandation pour cet exemple: ! buffers_100m_toilettes.shp).
Géographie 4ème - Projet Classe Netbook! Map Kibera 2012
- 11 -

The Use of GIS and ICT to Enhance School Geography 4. Long-term classroom activities: Building a GIS project
- 169 -
6) Lancez le calcul avec OK.7) La question que QGIS vous pose maintenant demande si vous souhaitez afficher les résultats de l’analyse et ajouter le shapefile des résultats aux layers du projet. Validez avec Yes.8) Fermez le module Buffer(s) avec Close.9) Dans l’espace Layers déplacez les résultats de votre analyse en dessous du shapefile contenant les points pour superposer les points aux buffers créés.
• Sauvegarde du projet: ! Pour terminer, sauvegardez votre projet: File → Save Project As…! ! ! ! Enregistrez vos projets toujours dans le répertoire CARTES_QGIS!! ! ! ! Pour l’exemple démontré ici un nom convenable serait:! ! ! ! 01_MapKibera_Toilettes_buffer_100m.qgs
Résultats de la création de tampons / buffers de 100m autour de toilettes à Kibera
Géographie 4ème - Projet Classe Netbook! Map Kibera 2012
- 12 -

The Use of GIS and ICT to Enhance School Geography 4. Long-term classroom activities: Building a GIS project
- 170 -
4.B.Déterminer les surfaces non couvertes par les buffers (tampons)
Utile pour répondre à une question du genre: « Quelles sont les surfaces qui se situent en dehors de l’aire d’attraction des écoles/hôpitaux, etc... ? »
VOUS DEVEZ DISPOSER D’UN SHAPEFILE CONTENANT DES BUFFERS AVANT DE POUVOIR EXÉCUTER CE TUTORIEL.
• Module utilisé : (accessible sous Vector → Geoprocessing Tools → Difference)
• Note: Cette partie reprend l’exemple précédent et travaille avec un buffer de 100m autour des toilettes.
• Méthode: ! Vous instruisez QGIS à soustraire les buffers (les surfaces qui sont desservies par un ! ! équipement), des surfaces qui ne sont pas dessertes (donc les surfaces non couvertes ! ! par un buffer).
• Exécution:! 1) Vous disposez de votre projet contenant un layer à buffers.! 2) Lancez le module Difference sous Vector → Geoprocessing Tools → Difference.! 3) Configurez le dialogue du module:! ! Input vector layer:! le layer qui sera découpé. ! ! ! ! ! Ici: Villages de Kibera! ! Difference layer:! le layer qui contient les éléments qui ! ! ! ! ! servent à découper.! ! ! ! ! Ici: le layer qui contient vos buffers: ! ! ! ! ! buffers_100m_toilettes Output shapefile:! l’endroit et le nom pour enregistrer les ! ! ! ! ! surfaces découpées. ! ! ! ! ! Endroit et nom pour l’exemple donné:! ! ! ! ! GISDATA\watsan-shapefile\surfaces_without_toilet_coverage.shp.! 4) Lancez le calcul avec OK et confirmez avec YES pour visualiser le résultat dans votre projet.
Difference des surfaces non desservies par des toilettes: avec autres couches activées Layer de Difference seul
Paramètres du module Difference
Géographie 4ème - Projet Classe Netbook! Map Kibera 2012
- 13 -

The Use of GIS and ICT to Enhance School Geography 4. Long-term classroom activities: Building a GIS project
- 171 -
4.C.Suggérer des emplacements pour nouveaux équipements
Utile pour répondre à une question du genre : « Où faudrait-il construire un équipement X pour desservir une surface non couverte? »
VOUS DEVEZ DISPOSER D’UN SHAPEFILE CONTENANT LES ZONES NON-COUVERTES PAR UN SERVICE AVANT DE POUVOIR EXÉCUTER CE TUTORIEL. (DONC UN LAYER CRÉE PAR LE MODULE Difference VOIR TUTORIEL 4.B.)
• Méthode: ! Vous instruisez QGIS à créer des points dans des surfaces qui ne sont pas couvertes par ! ! un service. Le but est que vous puissiez dire où des équipements manquent et créer ! ! simultanément une proposition d’emplacement.! ! (p.ex.: En utilisant les surfaces non desservies par les écoles primaires, QGIS vous ! ! calcule les emplacements probables pour la construction de nouvelles écoles.)
• Note: ! Cette partie reprend l’exemple précédent et travaille avec les surfaces non desservies par des toilettes.
• Modules utilisés : ! 1) ! (accessible sous Vector → Geometry Tools → Multipart to Singleparts)! 2) ! (accessible sous Vector → Geometry Tools → Polygon Centroids)
• Exécution: !! 1ère partie! 1) Vous disposez de votre projet contenant un layer qui montre les surfaces non couvertes par un ! équipement donné. ! 2) Avant de produire des suggestions de localisation, nous devons surmonter un problème ! technique: Regardez votre shapefile qui contient les surfaces non couvertes. Il paraît bien ! qu’il soit composé de plusieurs formes détachées. Mais en réalité, ces surfaces ne sont pas ! détachées - elles sont regroupées par village! Sous ce format, QGIS ne calculera qu’un seul ! point pour un village, même s’il existent dix surfaces sans équipement! Nous obtenons donc ! de faux résultats!! Ainsi, la première étape découpe justement ces surfaces combinées (Multipart) dans des ! surfaces individuelles (Singleparts).! 3) Pour ce faire, lancez le module Multipart to Singleparts sous Vector → Geometry Tools.! 4) Dans le dialogue qui s’ouvre choisissez le layer que vous ! souhaitez découper en singleparts. ! (ici: surfaces_without_toilet_coverage.shp).! Ensuite, il faut que vous donniez un nom aux shapefile qui! contiendra les formes singleparts.! Conseil: Utilisez le même nom de fichier, mais ajoutez -SINGLEPARTS à la fin pour faire la ! différence entre fichiers. Sauvegardez dans le même répertoire que le shapefile d’origine!! D’où le répertoire et le nom pour cet exemple:! GISDATA\watsan-shapefile\surfaces_without_toilet_coverage-SINGLEPARTS.shp.! 5) Validez avec OK et confirmez avec Yes. Puis, supprimez le shapefile qui n’est pas singlepart ! de votre liste de layers.
Module Multipart to singleparts
Géographie 4ème - Projet Classe Netbook! Map Kibera 2012
- 14 -

The Use of GIS and ICT to Enhance School Geography 4. Long-term classroom activities: Building a GIS project
- 172 -
! ! ! 2ème partie! 6) Maintenant vous pouvez lancer le procès qui suggérera de nouveaux emplacements pour ! l’équipement que vous analysez. ! 7) Lancez le module Polygon centroids sous Vector → Geometry Tools.! 8) Dans le dialogue qui s’ouvre, sélectionnez le shapefile ! singleparts que vous venez de créer.! 9) Donnez un nom au shapefile qui contiendra les points suggérés! et sauvegardez dans le même répertoire que le shapefile ! d’input. Pour l’exemple cité ici un l’endroit et le nom est: ! GISDATA\watsan-shapefile\suggestion_new_toilets.shp.! 10) Validez avec OK et confirmez avec Yes. Fermez ensuite le module Polygon centroids.! 11) Votre carte affiche maintenant les nouveaux emplacements! Changez la couleur et le ! symbole utilisé pour bien faire ressortir les recommandations d’emplacement! ! (voir tutoriel 4.D)
• Remarque importante: La méthode n’est pas sans faille. Comme on peut le voir sur la carte ci-dessous, QGIS ne calcule qu’un seul point par polygone – n’importe quelle soit sa taille. Ainsi les grandes surfaces continues (ici: moitié ouest) n’auront qu’une seule suggestion.
Nouveaux emplacements de toilette suggérés représentés en losanges verts après le calcul par le module Polygon centroids
Module Polygon centroids
Géographie 4ème - Projet Classe Netbook! Map Kibera 2012
- 15 -
The Use of GIS and ICT to Enhance School Geography 4. Long-term classroom activities: Building a GIS project
- 173 -
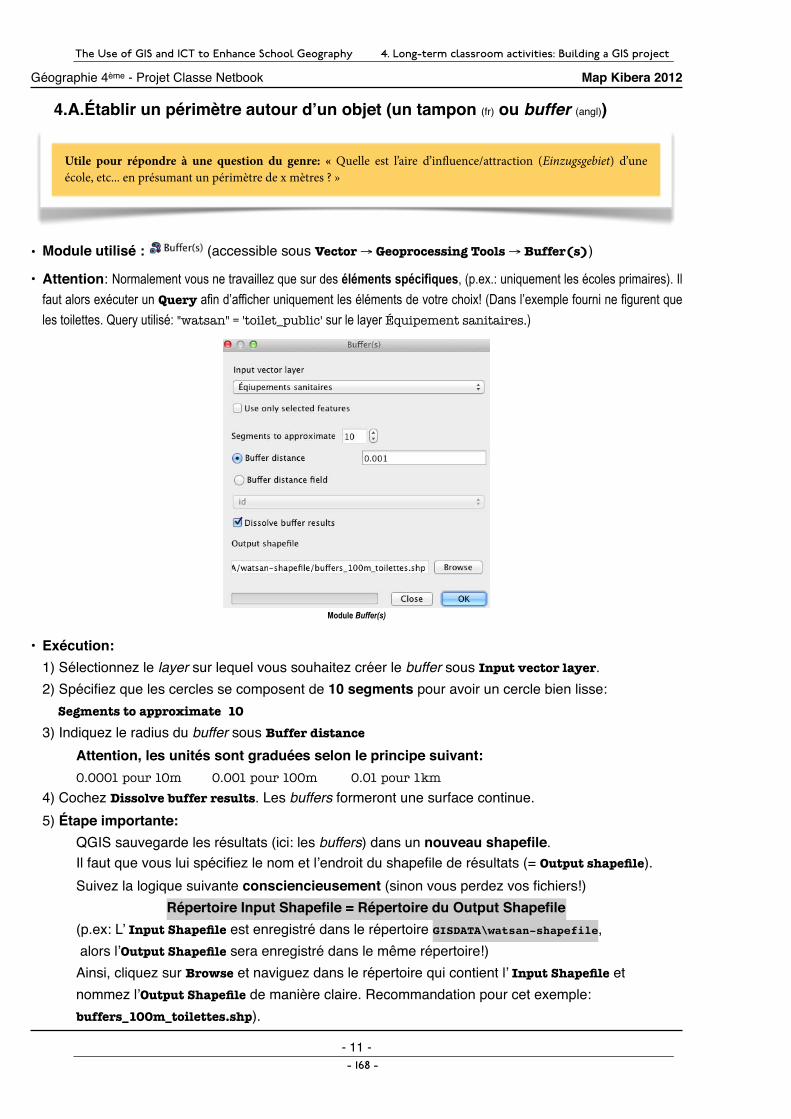
4.D.Changer les couleurs et les symboles des éléments représentés
Utile pour: Améliorer la représentation graphique de votre travail.
Selon le type layer choisi, vous pouvez changer la couleur des surfaces (polygones) ou la couleur et la forme des points.
• Exécution:! 1) Faites un clic droit sur le layer qui contient les éléments choisis et sélectionnez Properties.! 2) L’onglet Style vous permet de changer l’apparence de votre layer (voir ci-dessous).! 3) Pour changer la couleur des éléments du layer ! cliquez sur Change dans la ligne Couleur.! 4) Pour changer le symbole d’un point cliquez sur ! .! 5) La fenêtre Symbol properties s’ouvre.
! ! 5) Vous avec accès à deux sortes de symboles à choisir grâce à l’option Symbol layer type.! Choisissez Simple marker pour choisir parmi des formes simples pour vos points.! Choisissez SVG marker pour accéder à un grand nombre de symboles pour vos points.
Un bon choix de symboles clairs et de couleurs parlantes a un impact considérable sur la lisibilité de votre carte!
Dialogue Properties pour un layer contenant des points
Géographie 4ème - Projet Classe Netbook! Map Kibera 2012
- 16 -

The Use of GIS and ICT to Enhance School Geography 4. Long-term classroom activities: Building a GIS project
- 174 -
4.E.Classifier des objets par type et représenter à l’aide de symboles différents
Utile pour: Visualiser des éléments selon leur nature en utilisant des symboles propres à chaque type d’élément (p.ex.: hôpitaux en croix rouge, dentistes en triangle bleu, etc... )
L’exemple traité dans ce tutoriel représente les hôpitaux par une croix blanche sur fond rouge.
• Méthode: ! Vous instruisez QGIS à représenter des symboles spécifiques en fonction d’une sélection ! ! d’éléments.
• Exécution:! 1) Faites un clic droit sur le layer qui contient les éléments choisis (ici: Services ! médicaux) et sélectionnez Properties.! 2) Dans le dialogue qui s’affiche choisissez l’onglet Style.! 3) Changez Single Symbol (représentation des éléments par le même symbole) en ! Rule-based (représentation des éléments par des symboles différents en ! ! ! fonction de critères).! 4) Maintenant il faut définir les règles selon lesquelles QGIS affichera les éléments: ! premièrement indiquer quels éléments à représenter et secondement spécifier les symboles à ! utiliser.! 5) Double-cliquez sur la première ligne dans la liste des règles dont le filtre indique (no rule).! 6) Le dialogue Rule properties s’ouvre pour spécifier le filtrage et le symbole à utiliser.! 7) Dans l’espace Label indiquez ce que vous allez représenter (ici: Hôpitaux).! 8) Sous Filter, cliquez sur le bouton pour lancer l’éditeur de requête (Query).! 9) Composez votre requête (ici: type = 'hospital' ), testez le résultat avec Test et validez avec OK.! 10) Sous l’espace Symbol cliquez sur . Vous lancez l’éditeur de symboles.! 11) Changez Symbol layer type de Simple marker en SVG marker (= utiliser des icônes).! Vous obtenez alors une liste d’icônes à votre disposition. Ici nous allons utiliser un icône! de croix blanche sur fond rouge ( ), qui se situe vers la fin de la liste. Validez avec OK.! Si la taille du symbole ne vous convient pas, changez-la à l’aide du paramètre Size du dialogue.! 12) Vous vous retrouvez alors avec le dialogue comme montré à gauche. Validez avec OK.
13) La fenêtre des propriétés du layer contient maintenant la règle que vous venez de spécifier. Si vous souhaitez ajouter d’autres règles, appuyez sur et répétez les étapes 7 à 12.14) Validez avec OK et vos éléments filtrés s’afficheront avec le symbole choisi.
Hôpitaux représentés suite à un filtrage et spécification de symbole
NOTEZ BIEN:Vous pouvez combiner plusieurs Rules afin de représenter plusieurs types d’éléments à l’aide de symboles différents.
Changement du style de représentation
Dialogue spécifiant filtrage et symbole à utiliser
Géographie 4ème - Projet Classe Netbook! Map Kibera 2012
- 17 -

The Use of GIS and ICT to Enhance School Geography 4. Long-term classroom activities: Building a GIS project
- 175 -
4.F.Représenter des surfaces en dégradé de couleurs en fonction d’un critère
Utile pour répondre à une question du genre: « Combien d’écoles/hôpitaux se situent dans le village de X? » – Les villages seront alors représentés en dégradés de couleurs en fonction de leur nombre d’écoles/hôpitaux qu’ils hébergent.
• Module utilisé : (accessible sous Vector → Analysis Tools → Points in polygon)
• Note: Cette procédure est composée de deux étapes: 1) Déterminer le nombre d’éléments par village 2) Créer une carte à remplissage où les couleurs de villages varient en fonction du nombre d’éléments contenus
La procédure détermine combien d’écoles primaires il y a par village. Puis les villages sont colorés en fonction du nombre d’écoles après création de classes.
• Exécution:! 1) Cet exemple ne considère que les écoles primaires. Ainsi doit-on d’abord lancer un Query pour! afficher uniquement les écoles primaires. (Query utilisé: "type" LIKE '%primary%' )! 2) Lancez le module Points in polygon sous Vector → Analysis Tools → Points in polygon.! 3) Configurez le dialogue du module:! ! Input polygon vector layer:! le layer de surfaces. ! ! ! ! ! ! Ici: Villages de Kibera! ! Input point vector layer:! le layer contenant les points à ! ! ! ! ! ! compter par polygone! ! ! ! ! ! Ici: Éducation (avec Query appliqué) Output count field name:! nom de la colonne dans laquelle ! ! ! ! ! ! les résultats seront stockés dans la table des attributs! ! ! ! ! ! suggestion: E_PRIMAIR (maximum 10 caractères!) Output shapefile:! ! l’endroit et le nom pour enregistrer les ! ! ! ! ! ! surfaces découpées. ! ! ! ! ! ! Endroit et nom pour l’exemple donné:! ! ! ! ! ! GISDATA\boundary-shapefile\comptage_ecoles_primaires.shp
! 4) Lancez le calcul avec OK et confirmez avec YES pour ! visualiser le résultat dans votre projet.! 5) Le nouveau layer comptage_ecoles_primaires s’ajoutera à ! votre projet. Ouvrez la table des attributs et vous voyez que ! QGIS a créé une nouvelle colonne qui contient le nombre ! d’écoles primaires par village!! 6) Maintenant, il s’agit de créer la carte à remplissage qui ! représente les villages en fonction de leur nombre d’écoles ! primaires.! 7) Faites un clic droit sur le layer que vous venez de créer ! (comptage_ecoles_primaires) et sélectionnez Properties.
Paramètres du module points in polygon
Nouvelle colonne contenant le comptage
Géographie 4ème - Projet Classe Netbook! Map Kibera 2012
- 18 -

The Use of GIS and ICT to Enhance School Geography 4. Long-term classroom activities: Building a GIS project
- 176 -
! 8) Dans le dialogue qui s’affiche choisissez l’onglet Style.! 9) Changez Single Symbol (représentation des éléments par le même symbole) en ! Graduated (représentation en dégradé de couleurs continu).! 10) Quelques paramètres sont à spécifier: (voir capture d’écran ci-dessous)! ! Column: ! colonne qui contient les valeurs à représenter. ici: E_PRIMAIR! ! Classes:! nombre de classes. RECOMMANDATION: 3 ou 4 classes! ! Mode:! ! méthode de classification (QGIS classifie automatiquement, contrairement à C&D!)
(La méthode Standard Deviation n’est pas utilisable pour nos besoins)! ! Color ramp:! palette de couleurs. Vous devez créer une nouvelle palette, car celles qui ! ! ! ! sont disponibles ne sont pas adaptées à nos besoins.! ! ! ! Pour ce faire, cliquez sur la palette sélectionnée puis choisissez ! ! ! ! New color ramp… Puis, validez Gradient avec OK. ! ! ! ! Dans le dialogue qui s’ouvre vous devez spécifier deux couleurs. ! ! ! ! Color 1: un teint clair d’une couleur (ici: bleu clair)! ! ! ! Color 2: un teint foncé de la même couleur (ici: bleu foncé)! ! ! ! Validez avec OK et donnez un nouveau nom à votre palette. (ici: Bleue)! ! Label:! ! La colonne Label montre les valeurs telles qu’elles seront affichées dans la ! ! ! ! légende de la carte finale. Éditez les labels par double-clic et retirez les “0” ! ! ! ! superflus. Utilisez le schéma suivant: [x - y] pour la première classe! ! ! ! ]y - z] pour les classes qui suivent.
Paramètres du dialogue des propriétés pour une carte à remplissage
5) Validez avec OK. Et voilà - votre carte à remplissage qui représente les villages de Kibera en fonction de leur nombre d’écoles primaires!
Villages de Kibera en fonction de leur nombre d’écoles primaires
Géographie 4ème - Projet Classe Netbook! Map Kibera 2012
- 19 -

The Use of GIS and ICT to Enhance School Geography 4. Long-term classroom activities: Building a GIS project
- 177 -
4.G.Relever des intersections entre deux tampons
Utile pour répondre à une question du genre: « Quelles sont les surfaces qui sont à la fois des aires d’in!uence d’une école et d’un bar ? »
VOUS DEVEZ DISPOSER DE DEUX SHAPEFILES CONTENANT DES BUFFERS AVANT DE POUVOIR EXÉCUTER CE TUTORIEL.
• Module utilisé : (accessible sous Vector → Geoprocessing Tools → Intersect)
• Méthode: ! Vous instruisez QGIS à intersecter deux buffer layers pour identifier des zones qui sont à la fois couvertes par l’équipement A et couvertes par l’équipement B.
• Note: Cette partie utilise les buffer layers suivants: buffer de 100m autour des toilettes et un buffer de 50m autour des points d’eau.
• Exécution:! 1) Vous disposez de votre projet contenant deux layers à buffers.! 2) Lancez le module Intersect sous Vector → Geoprocessing Tools → Intersect.! 4) Configurez le dialogue du module:! ! Input vector layer:! un des layers à intersecter. ! ! ! ! ! Ici: buffers_100m_toilettes! ! Intersect layer:! le deuxième layer à intersecter! ! ! ! ! Ici: buffers_50m_points_eau Output shapefile:! l’endroit et le nom pour enregistrer les ! ! ! ! ! surfaces découpées. ! ! ! ! ! Endroit et nom pour l’exemple donné:! ! ! ! ! GISDATA\watsan-shapefile\intersection_buffer_toilettes_points_eau.shp
! 5) Lancez le calcul avec OK et confirmez avec YES pour visualiser le résultat dans votre projet.
Intersect des surfaces desservies par l’aire d’influence de toilette ET aires d’influence des points d’eau
Paramètres du module Intersect
Géographie 4ème - Projet Classe Netbook! Map Kibera 2012
- 20 -

The Use of GIS and ICT to Enhance School Geography 4. Long-term classroom activities: Building a GIS project
- 178 -
4.H.Relever les points qui se situent à l’intérieur d’un buffer
Utile pour répondre à une question du genre: « Quelles bâtiments se trouvent dans l’aire de desserte des toilettes ? »
VOUS DEVEZ DISPOSER D’UN SHAPEFILE CONTENANT DES BUFFERS AVANT DE POUVOIR EXÉCUTER CE TUTORIEL
L’exemple présenté relève les églises qui se situent aux alentours de 30 mètres des toilettes.
• Module utilisé : (accessible sous Plugins → Spatial Query → Spatial Query)
• Méthode: ! Vous instruisez QGIS à relever les éléments qui se trouvent à l’intérieur d’un buffer. QGIS ! ! créera alors un nouveau layer contenant les éléments concernés.
• Installation du plugin:! 1) Comme le plugin n’est pas disponible par défaut dans QGIS il faut l’installer d’abord.! 2) Dans le menu Plugins choisissez Manage Plugins.! 3) En bas de la liste cochez le plugin Spatial Query (s’il n’est pas déjà coché) et validez avec OK.! 4) Le plugin est maintenant accessible sous Plugins → Spatial Query → Spatial Query.
• Exécution:! 1) Vous disposez de votre projet contenant un shapefile à buffer ! sur des éléments quelconques (ici: des buffers de 30m autour ! des toilettes, voir image à droite).! 2) Pour déterminer maintenant les églises qui se situent à ! l’intérieur de ce buffer nous allons exécuter un Spatial Query.! 3) Lancez le module Spatial Query .! 4) Le dialogue qui se présente offre de nombreuses possibilités de configuration.! Au fond, vous construisez une phrase pour QGIS qui contient les instructions: ! Sélectionne les objets de sources provenant de Lieux de culte dont les objets (points) se trouvent à l’intérieur (Within) des objets de buffers_30m_toilets et utilise les résultats de cette recherche pour créer une nouvelle sélection (Create new selection).
! 5) Lancer le calcul avec Apply.! 6) Le dialogue se transforme et vous donne les résultats du calcul. En bas ! s’affiche le nombre d’objets qui sont contenus dans les buffers.! 7) Cliquez sur Create new selection pour ajouter les éléments ! concernés à votre liste de layers.
! 8) La nouvelle sélection s’affiche dans la liste des layers→ .! 9) Sauvegardez ce nouveau layer comme shapefile en faisant un clic droit sur le layer et ! sélectionnez Save as… Sans sauvegarde, ce layer sera perdu quand vous quittez QGIS.! 10) Renommez cette couche en donnant un titre significatif et modifiez le symbole pour faire ! ressortir clairement ces éléments.
Villages, lieux de culte et buffer de 30 m autour des toilettes
Module Spatial Query
Module Spatial Query - résultats
Géographie 4ème - Projet Classe Netbook! Map Kibera 2012
- 21 -

The Use of GIS and ICT to Enhance School Geography 4. Long-term classroom activities: Building a GIS project
- 179 -
5.Mise en page d’une carte finaleFélicitations! En attaquant ce chapitre, vous confirmez que vous avez achevé avec succès votre travail de recherche. Pour que cet effort puisse être mis à disposition d’un grand public, il est important que vous l’exportiez hors de QGIS dans un format bien connu: le format PDF, lisible par presque l’intégralité des ordinateurs personnels au monde!
QGIS vous permet en effet de produire un carte complète contenant titre, légende, échelle, indication du Nord géographique et, bien évidemment, votre carte.
Ce tutoriel vous explique comment créer une mise en page de votre cartographie en utilisant le Print Composer , le module de mise en page de cartes de QGIS.
• Module utilisé : Print Composer (icône située dans la barre d’icônes principale)
• Exécution:! 1) Assurez-vous que l’intégralité de votre carte soit affichée dans l’espace de carte. Si tel n’est! pas le cas, cliquez sur l’icône Zoom Full qui recentre votre carte.! 2) Lancez le module Print Composer en cliquant sur l’icône , ou File → Print Composer ou en appuyant sur Ctrl+P (Windows) / CMD+P (Mac).! 3) Le module s’ouvre et vous présente la fenêtre ci-dessous:
! Les icônes encadrés en rouge permettent d’ajouter des éléments à votre mise en page.! Les icônes encadrés en vert permettent de sauvegarder ou d’exporter votre mise en page.! 4) Maintenant il s’agit d’ajouter les composantes de votre document final, à savoir: ! votre carte et son habillage: le titre, nom de l’auteur, la légende, l’indication du Nord, la source ! et le commentaire de carte. ! Note importante: Rédigez le commentaire de carte avant de continuer avec ce tutoriel!! 5) Ajoutez votre carte à la mise en page en cliquant sur l’icône ! Add new map. Sur votre espace de mise en page, cliquez et ! tirez (Click’n drag) pour tracer l’emplacement de votre carte.! Dans l’espace créé, recentrez la carte cliquant sur l’icône . ! Ensuite, déplacez la carte dans l’espace concerné.! 6) Ajoutez la légende à la mise en page en cliquant sur l’icône . Click’n drag-ez un espace ! pour votre légende et déplacez-là dans la coin inférieur droit. Cliquez en suite sur Item dans ! l’espace de configuration à droite et configurez votre légende avec les paramètres suivants:! ! Segment size: 500 ! Map units per bar unit: 1000 2 right segments 0 left segments Style: Double Box Unit label: km Ceci vous donnera une échelle d’un kilomètre, subdivisée en parties de 500 m.
QGIS: Print composer
QGIS: Print composer avec carte
Géographie 4ème - Projet Classe Netbook! Map Kibera 2012
- 22 -

The Use of GIS and ICT to Enhance School Geography 4. Long-term classroom activities: Building a GIS project
- 180 -
! 7) Ajoutez l’indication du Nord à la mise en page en cliquant sur l’icône . Click’n drag-ez un ! espace pour l’indication du Nord au-dessus de votre légende.! 8) Ajoutez la légende à la mise en page en cliquant sur l’icône . Placez la légende dans le coin! supérieur gauche de la mise en page. Dans l’espace de configuration à droite changez le nom ! de la légende en Légende sous la rubrique Title.! 9) Ajoutez le titre à la mise en page en cliquant sur l’icône . Cliquez dans la partie supérieure ! pour placer le titre. Dans l’espace de configuration à droite, vous disposez de toutes les ! options nécessaires pour ajuster l’apparence du titre.! Gardez la police (le font) Lucida Grande par défaut. Et ne changez que la taille en fonction de ! vos besoins. Centrez horizontalement et verticalement dans l’espace de configuration! 9) Ajoutez le nom de l’auteur et la source à la mise en page en cliquant une seconde fois sur ! l’icône . Placez le nom et l’année (p.ex.: Auteur, 2012) et l’indication de source (source: Map ! Kibera.org 2012) en-dessous du titre. Gardez la police (le font) Lucida Grande par défaut. ! Ne changez que la taille en fonction de vos besoins. Centrez le texte horizontalement et ! verticalement dans l’espace de configuration.! 10) Ajoutez un troisième espace de texte en cliquant sur l’icône . Cet espace contiendra cotre ! commentaire de carte.! 11) Finalement vous obtenez une mise en page similaire à celle ci-dessous (plus votre ! commentaire de carte):
! 11) Exportez votre mise en page en cliquant sur l’icône Export as PDF.! Sauvegardez votre document dans le répertoire MapKibera\CARTES_EN_PDF. ! Nommez-la selon la nomenclature officielle: ! ! [PREFIX]_MapKibera-SUJET_DE_VOTRE_CARTE.pdf ainsi p.ex.:! ! 4M6_MuMa666_GEOGR_2012-02-05-MapKibera-Villages_de_Kibera.pdf
! 12) Fermez le Print composer avec Close et sauvegardez votre projet File → Save Project.! 13) Quittez QGIS.
QGIS: Print composer avec mise en page complète
Géographie 4ème - Projet Classe Netbook! Map Kibera 2012
- 23 -

The Use of GIS and ICT to Enhance School Geography 4. Long-term classroom activities: Building a GIS project
- 181 -
Map Kibera 2012: Évaluation
Votre travail sur Map Kibera sera noté sur 60 points et comptabilisé comme deuxième note pour le second trimestre de cette année académique.• La note se composera de deux volets:
• premièrement, vous serez noté sur 30 points pour votre carte individuelle• deuxièmement, une note sur 30 points sera attribué à votre groupe pour la création d’une
affiche (détails en bas).Le tableau ci-dessous vous indique les critères d’évaluation de votre travail individuel.
Map Kibera 2012: Évaluation du travail individuelMap Kibera 2012: Évaluation du travail individuel
Critères Points
Définition du query qui délimite bien les éléments à représenter 5 pts
Exécution du travail de façon autonome 5 pts
Adaptation des symboles et des couleurs pour obtenir une carte claire et facile à lire 5 pts
Légende exhaustive, dont toutes les layers sont nommées de façon adéquate(p.ex.: non pas surfaces_without_toilet_coverage, mais Surfaces non desservies par des toilettes publiques)
5 pts
Habillage de la carte 5 pts
Commentaire de la carte (présentation, description, explication) 5 pts
Respecter la date de remise -5 pts en cas de non respect
Le tableau ci-dessous vous indique les critères d’évaluation de votre travail de groupe.Map Kibera 2012: Évaluation du travail en groupe: la création d’une afficheMap Kibera 2012: Évaluation du travail en groupe: la création d’une affiche
Critères Points
Rédaction d’un paragraphe de ±150 mots qui explique l’intérêt de votre sujet de recherche(pensez aux notes que vous avez prises au début du projet dans votre document LibreOffice!)
10 pts
Mise en page organisée, utilisant le modèle LibreOffice Drawing fourni 5 pts
Recherche d’un article ou d’un reportage vidéographié qui soutient votre sujet de recherche - le lien vers cet article figurera sur l’affiche finale (sites à consulter en premier lieu: voiceofkibera.org, kiberanewsnetwork.org)
5 pts
Résumé de vos résultats individuels (= conclusions essentielles) 5 pts
Indication claire de vos sources 5 pts
Respecter la date de remise -5 pts en cas de non respect
RAPPEL:Voici un guide sur les étapes à e!ectuer:• Travaux individuels
• Chacun est responsable d’un travail cartographique qui touche son sujet de recherche choisi.• Votre carte doit être explicitée à l’aide d’un commentaire de carte (± 150 mots).
• Travail en groupe: Création d’une a"che en grand format A2. Le template pour LibreO"ce Draw est fourni sur myDisk.
• L’a!che doit comprendre une introduction au problème dans le contexte de Kibera: Recherchez des documentations dans les médias (rappelez-vous les trois sites indiqués en début de projet) pour expliquer et illustrer l’importance de votre sujet d’analyse (± 150 mots).
• L’a!che comprendra les cartes individuelles dans la partie inférieure.• Recherchez un article / reportage vidéographié qui touche votre sujet de recherche. Le lien vers cet article "gurera sur l’a!che pour témoigner de la réalité des problèmes que vous avez analysés.
• Indiquez les conclusions essentielles de vos analyses sur l’a!che.• Indiquez les sources utilisées.
Géographie 4ème - Projet Classe Netbook! Map Kibera 2012
- 1 -

The Use of GIS and ICT to Enhance School Geography 4. Long-term classroom activities: Building a GIS project
- 182 -
4 .4 Conducting the project
As the author deemed counterproductive to force a project on students, they were asked
first if they would like to participate in a new kind of activity, tied to the real word, with the
potential of helping real people. The unanimously positive response, in late December 2011,
cleared the way for implementing the project.
The ‘4M6 Maps Kibera’ project was introduced to the students in February 2012 by means
of a video footage giving the students a first impression of the look and feel of the study
area. Intrigued at first, unsure how to approach the topic, their sense of discovery kicked in
as they sensed that it was a very specific and new kind of topic, with a complex of problems
yet to be disclosed.
For the first two lessons, students focused on getting in touch with the area, reading up on
prominent issues and starting to record their research topics.
After collecting the students’ research sheets stating topics of interest, the author devised
tutorials allowing the students to achieve their research goals. With the exception of a few,
students provided information ample and specific enough to create appropriate instructions.
A few weeks later, students received the set of tutorials along with the Map Kibera data. A
specific tutorial was devised to load the data into QGIS so that students starting out from a
standardised, common configuration. This allowed students to help each other, since every
computer was set-up in the same way and eased troubleshooting by the teacher.
During the two weeks following project introduction, students worked on their individual
piece of research during geography lessons, but also pursued their work at home. At the
end of each week, the teacher took notes of the progression. In class, students were
allowed to sit together in groups working on the same area of research, so that discussing
issues and findings while being
able to help each other out was
considerably eased. This
scheme proved to be productive
in the way that students kept
being motivated throughout, all
in a positive and calm
atmosphere. It also took some
pressure off the teacher in his
consulting role, since proficient
students were able to help out
trailing ones (Fig. 56).
Fig. 56: Group doing research on education (l) Student helping student (r)
Source: Klapp, 2012

The Use of GIS and ICT to Enhance School Geography 4. Long-term classroom activities: Building a GIS project
- 183 -
At the end of the first project phase, the author collected the individual pieces of work and
provided formative feedback. Another two lessons were dedicated to rectifying the map
products based on the advice received. Appendix D – page 238 features early mapping
products, which had been reviewed and handed back to the students for correction.
The second phase of the project gave students the possibility to train their skills in using
more general-purpose ICT packages. After shortcomings in their individual work had been
addressed, students were asked to produce a group poster containing individual mapping
results, but also a summary of their findings. In addition, they should include some media
reports and links to websites discussing their research topics.
As LibreOffice was already installed on the students’ machines and since it contains a
drawing and publishing module, LibreOffice Draw became the software of choice for this
purpose.
A template was provided to assure adherence to
a common layout and to speed up the process by
means of pre-defined locations for text, images
and maps (Fig. 57).
Beyond this guidance, students were free to
structure task allocation and research. By this
time, the students felt such at ease with the
project on an individual level that most groups
turned to parallel task processing. Some students
researched eye-catching media to illustrate the
posters, while others focused more on skimming
through the Kibera News Network and Voice of
Kibera sites to identify community contributions
best matching the group’s research topic and
support the students’ findings. Another set of
students, for instance, focused more intensively on layout matters or writing the introductory
analysis report.
The author was especially pleased with the fact that students were not afraid to ask if they
were allowed to make amendments to the layout template. Some students suggested
including a QR-code on the posters, so that passers-by were able to scan the codes with
their smartphones and instantly obtain further media reports or websites based on the
information programmed into the QR-code. Such suggestions, displaying intrinsic motivation
and involvement with the matter on a personal level with the ambition to produce good
results were wholeheartedly embraced and recommended to all groups.
Fig. 57: Poster layout template
Author: Klapp, 2012 Source: AL, 2012

The Use of GIS and ICT to Enhance School Geography 4. Long-term classroom activities: Building a GIS project
- 184 -
Table 31 presents the detailed timetable with deadlines and intermediate goals used for the
purpose of this project.
Date an project week number Tasks
03.01.2012 06.01.2012 Week 1: Introduction, Defining research topics. Homework: Create Initial Map Kibera project in QGIS
07.02.2012 09.02.2012 Week 2: Research activity beginning using provided tutorials
17.02.2012 Week 3: Produce individual research activity results (maps + commentary)
28.02.2012 02.03.2012 Week 4: Rectify individual maps based on feedback and start creating group posters
06.03.2012 09.03.2012 Week 5: Finalise group posters
Table 31: 4M6 Maps Kibera project timetable and tasks Author: Klapp, 2012
In total, the project required 9 regular school lessons. Since this accounts for an important
part in the total amount of geography lessons available within one term, the author decided
to evaluate the project on 60 marks, individual and group work accounting for 30 marks
each. Please refer to page 181 for the marking grid.
4.5 Issues encountered
The project was prone to issues in spite of the fact that it was completed successfully.
Some issues arose from the fact, that many students presented considerable shortcomings
in general IT skills. Some found it hard to navigate around the file system and completing
tasks such as copying files and creating directories (or folders).
The author had anticipated this to some extent, as students were provided with three
specific instruction sheets. The first explained how to organise the ‘Geography’ folder on
their computer containing all the necessary files for Map Kibera. The second detailed how
ZIP-files (i.e. a compressed file containing one or more files) were to be manipulated. The
third discussed the shapefile format and the extra care required when handling these files
(see Appendix E – Supplemental tutorials).
Despite these precautionary measures, some students kept lagging behind to the extent
where it became necessary to offer extra lessons during lunch break for these students to
get back on schedule. Three extra support lessons were held, welcoming not only students
in need but also many students progressing at the set rate for the benefit of extra time with
the teacher to discuss their results.

The Use of GIS and ICT to Enhance School Geography 4. Long-term classroom activities: Building a GIS project
- 185 -
Also, some netbooks failed over the project weeks, so that the affected students could only
carry out GIS work at home. Hence, describing their research and issues during geography
lessons only slowed down their progression considerably as no instant feedback or help
could be given in class.
Furthermore, the version of QGIS used for the project was unable to export mapping results
as SVG files, which could have been easily imported into LibreOffice Draw. Hence, final
assembly (i.e. copying the maps onto the poster) had to be done by the teacher on a
different platform. The developers should have remedied this matter by the time this work
will have been submitted.
Aside from issues based on IT matters, the author observed that many students had
difficulties in expressing themselves clearly in writing. Ample feedback was necessary on
the individual pieces of work, little in relation to the GIS tasks but much more in relation to
spelling and grammar. The author recognises the need for more elaborate training in terms
of written productions throughout the year, a scheme that will be implemented in future
courses.
4.6 Outcomes and further iterations of the project
Upon closing off the project, a total of six posters had been created, discussing sanitary
equipment, health institutions, main commercial services, education and public safety. The
posters were put on display in the Athénée de Luxembourg in a prominent place during the
course of the third term 2011-2012 (Fig. 58).
Fig. 58: Finished posters on display
Source: Klapp, 2012

The Use of GIS and ICT to Enhance School Geography 4. Long-term classroom activities: Building a GIS project
- 186 -
Fig. 59 shows a sample poster in greater detail. The Resource DVD contains all six posters
in PDF format. Designed for printouts no smaller than DIN A2, they are best viewed on a
large, high-resolution display.
Fig. 59: Sample 4M6 Maps Kibera poster discussing the availability and distribution of educational institutions
Source: mapkibera,org, 2012, 4M6, 2012, AL, 2012, Klapp, 2012

The Use of GIS and ICT to Enhance School Geography 4. Long-term classroom activities: Building a GIS project
- 187 -
Student evaluation of the project
At the end of the project, students were asked to provide anonymous feedback on the
project idea, the GIS work involved, the perception of geography and the overall experience
during class. Out of twenty-two students, twenty handed in feedback forms and provided a
predominantly positive evaluation of the project. 18
Summarily, students praised the project idea in itself as being a novel way of teaching
geography. Every student felt motivated or strongly motivated by the fact that it was based
on real-world issues and tied to the voluntary work of a small community. Also, they felt to a
great extent that they have had their share in contributing to world development.
In relation to the perception of geography, feedback was more divided. A third of the
students stated that the project was unable to build a bridge between the facts covered in
the course on urban geography and the issues seen in context with Kibera. Also, the same
students stated that the project did not contribute to raising their interest in the discipline or
awareness about their immediate urban environment. However, the vast majority students
agreed again on the fact that the project brought them knew knowledge and interesting
approaches in doing geography.
Likewise, 75% stated that geography in the secondary school should found more on
research activity and personal effort. In this context, the students also expressed their
desire of GIS to be introduced in school curricula on a broader scale and that each student
should have the possibility to test the tool.
Considering the GIS work, students confirmed the tutorials to give clear instructions and that
they respected their research goals. Subsequently, students unanimously preferred QGIS to
C&D, despite the former’s steeper learning curve. This may hint at students being pleased
with the fact that they had produced elaborate and professional-looking results using a fully-
fledged piece of software.
The majority liked working in groups and feeling at ease with their peers and satisfied of
their work. Many students also accredited a sense of doing purposeful research and feeling
part of a scientific community. Finally, students confirmed that the teacher met their
expectations in counselling in an out of classroom hours and in devising tutorials.
Based on this feedback, it may be concluded, that the project was led successfully and met
both student and teacher aspirations. This feedback may be particularly valuable in
supporting the assumption that students are interested in the use of GIS as a new approach
to geography. Also, doing guided research work on their own, seems to align with students’
expectations. Acknowledging these items be an important step in future developments of
geography curricula.
18 Appendix H – Student feedback on ‘4M6 Maps Kibera’ provides full reference on feedback.

The Use of GIS and ICT to Enhance School Geography 4. Long-term classroom activities: Building a GIS project
- 188 -
Summative evaluation of students’ work
Nine students achieved good and ten very good marks out of a total of 22 students, with a
class average of 47 out of 60. Marks on individual and group work averaged 24/30 and
22/30 respectively. Most marks were lost not because of achieving the research task in an
unsatisfactory way, but because of carelessness, omitting items or rectifications to be
included in the final product.
Reception by Map Kibera team and student reaction
The final posters were transmitted to Mikel Maron who presented them to his team and was
so kind as to put up a blog post on the Map Kibera website, describing the project and
posting the results19 (Fig. 60, see Appendix G – Weblog post of mapping results for full
reference).
This blog post had a beneficial effect on the Map Kibera and the students. The former were
happy about the interest they got from people living abroad and the latter were proud of the
fact that their work gained recognition and that they got involved in meaningful learning and
making a difference (Fig. 61).
19 See the mapkibera.org blog at: http://www.mapkibera.org/blog/2012/07/01/luxembourg-students-make-maps-for-kibera/, accessed 6th September 2012
Fig. 60: Snapshot of the Map Kibera homepage on 1st July 2012, featuring the blog
post and the students’ research products Source: mapkibera.org, 2012

The Use of GIS and ICT to Enhance School Geography 4. Long-term classroom activities: Building a GIS project
- 189 -
Set aside the fact that students were marked on the project, the author believes that it is the
social valuation of their work (Fig. 58, Fig. 61 and Maron (2012)) that fostered personal
interest in the matter, as some students joined the Map Kibera Facebook group to follow the
development of the area and even connected with some people. Also one student
specifically asked if it were possible to get in touch with some children of the area curious to
making new transcontinental acquaintances and maybe finding a way of supporting them.
Further iterations
Meanwhile, the Map Kibera initiative has spawned into new areas and completed mapping
the Mukuru area in early 2012. As this district will not have been researched in great detail,
the upcoming iterations of the project will be conducted in an even closer cooperation with
the mapping teams in Kenya. The author looks forward to these inspiring new opportunities
and expects to be able to cooperate in the way that the mapping teams provide the primary
data, while students can do first-hand research on exciting new sets of real and raw data,
thus creating true new knowledge, while bringing apparently remote locations closer to each
other.
Also, the author has been approached by Mikel Maron, who asked if the tutorials used in
Luxembourg could find their way to Kenyan schools and support the mapping movement
even more. After concluding this travail de candidature the author will happily translate the
curriculum and forward it to the Map Kibera team (see Appendix I – Mail exchange with
Mikel Maron from Map Kibera). Based on the information contained in the email exchange
the project has found a mention during 2012’s Data.gov and Wikimania conference. The
author will be in contact with people requesting information to develop the project idea
further.
Fig. 61: AL’s 4M6 class of 2011-2012 presenting their work
Source: Klapp, 2012

The Use of GIS and ICT to Enhance School Geography 4. Long-term classroom activities: Building a GIS project
- 190 -

The Use of GIS and ICT to Enhance School Geography 5. Conclusion
- 191 -
5 Conclusion
This study has made an attempt at assessing the use of GIS and ICT to enhance school
geography experience. In a first stage, the study discussed the theoretical background
leading to creating the working environment for subsequent classroom activities.
It retained that a GIS is any system capable of manipulating and analysing geographical
data. For the purpose of this study, GIS was understood as a computer-supported concept.
The study continued to elaborate on the types of datasets available to use within GIS, in
most instances, raster and vector data. It made a point in stressing the need for quality
datasets to assure accurate and conclusive analyses. In conjunction with those
requirements, the discussion focused on essential capacities GIS software packages should
feature, such as analysis functions, overlay techniques and attribute data manipulation.
The study then turned to addressing the challenges for successful GIS implementation in an
educational environment. Whether the latter goal is met, depends to great extent upon the
design of the classroom activities, available datasets, the software used and the teachers’
motivation to engage with novel tools and methods. The study argues, that GIS/ICT
activities need to provide real added value to a meaningful research purpose. In that case,
students become actively engaged in knowledge construction and do not merely work off a
series of manipulations to satisfy the sole goal of methodological competence development.
The reflection continued by making a case of GIS and ICT’s suitability and rightful place
within the contemporary educational environment, where learners are mostly ICT aware and
competent, thus easing technique take-up. Also, the types of research questions GIS
activities are able to raise are often designed to be student-centred and student-led,
allowing the learners to specify their personal analysis and evaluation goals, encouraging
development of intrinsic motivation. Furthermore, the study highlighted that GIS is able to
link theoretical concepts to practical applications, since GIS uses real-world data in a
‘hands-on’ approach, often bearing an interdisciplinary approach.
With the aim to provide such meaningful activities, the study reviewed a selection of ready-
made software packages. The range included online GIS such as Diercke Globus Online
and web-based services by westermann and Klett, but also the offline GIS Cartes et
Données and QGIS. Each of these solutions presents specific advantages, where online
GIS’ main benefit is their choice in ready-to-use datasets, while offline GIS take the lead in
data visualisation an analysis functions.

The Use of GIS and ICT to Enhance School Geography 5. Conclusion
- 192 -
The subsequent parts of the study presented tested classroom activities, featuring a brief
introduction, the actual and worksheets used and concluding by a short review of the activity
where appropriate.
Short-term activities conducted in 5e ES mainly made use of online GIS services due to the
limited time available within the one weekly geography lesson. Activities focused on
consulting the datasets included in Diercke and Klett online GIS resources and executing
some analysis functions. These framed activities guided students towards a set goal,
requiring basic data operations, since the learners needed to get acquainted with the
working principles of GIS, before engaging in more elaborate research operations. Activity
outcomes could be directly integrated into the geography course and served as valuable
support documents for the further course of the respective lesson sequence. Hence, despite
the lower-register research approaches required by these activities, they allowed for a
motivating student-centred approach, while constructing knowledge.
Short-term activities in 4e ES took students further up the GIS ladder. The learners made
use of Cartes et Données, to produce statistical mapping, based, at first, on provided
datasets. Subsequent activities built on the competence and autonomy the learners had
gained in manipulating the software, since the instructions were less framed and asked the
learners to provide and prepare datasets. The tasks required personal reflection on the data
needed and on the ways it needed to be encoded to reach the activity’s goal successfully.
Hence, these activities made use of more elaborate analysis and data display methods than
those conducted in 5e ES, fostering a deeper understanding about GIS and digital mapping,
while constructing knowledge through the use of GIS.
The long-term project hosted in 4e ES shows best that GIS and ICT may be implemented
successfully in school geography. Methodologically, the Map Kibera project could not have
been conducted without using the functionality offered by GIS and ICT. With regard to the
teaching and learning experience, it built upon the students’ personal interest in a real-world
issue, thus linking real-world data and theoretical concepts seen in class. While anchored
within the 4e National Curriculum, it gave the students the freedom to specify their own
research aims and mapping goals. The latter were aware of the fact that their work was
meaningful to a distant community, keeping their intrinsic motivation high. Additionally, the
project showed that students are able to formulate complex research questions and lead
their work, guided by sample tutorials, to a successful end. Furthermore, the project trained
the students in communicating their findings to uninitiated audiences, which required the
learners to think about the ways in which they map their results and comment on them. On
the one hand, the project created a valuable product used by the remote community. On the
other hand, students are able to build upon this first elaborate GIS work in their upcoming
academic career. Finally, the students’ feedback confirmed that a GIS project at 4eES level

The Use of GIS and ICT to Enhance School Geography 5. Conclusion
- 193 -
meets their expectations for new approaches to geography while proving to be a motivating
experience.
In view of the upcoming evolution of Luxembourg’s secondary school system, tighter and
meaningful integration of the techniques and methods studied in this discussion may serve
as a counterbalance to the ever so slightly decreasing number of geography lessons taught.
Indeed, incorporating GIS and ICT into the curriculum may be one of geography’s essential
assets in the future and further ascertain its rightful position within the secondary school’s
National Curriculum.
With respect to competence development, the projects detailed throughout the study helped
constructing transferable geographical competences, such as orientation and understanding
of spatial relationships, but also transversal competences, like developing research
questions, main ICT and communication skills. Hence, well-integrated GIS projects should
be able to provide the students with more than what is needed for the immediate tasks,
allowing them to adapt quickly to new challenges and to develop capabilities they may
derive advantage from in future life.
The study showed that GIS and ICT can enhance school geography in a meaningful way
indeed. To do so, requirements need to be met in terms of classrooms, IT hardware and
software. Also, since students’ GIS experiences proved to be most invigorating as they
worked on genuine real-world data, quality datasets remain essential to any GIS project.
However, the most important aspect of successful GIS integration is the availability of
meaningful projects and teaching purposes.
This study considered itself as an initial assessment of the feasibility to enhance school
geography by means of GIS and ICT. Further developing their use within Luxembourg’s
school geography might raise future projects which centre on researching new key teaching
purposes or making comprehensive datasets available to the national school community –
all in order to maintain or, ideally, strengthen geography’s position as an essential subject to
a contemporary citizen’s education.